Embed Size (px)
Citation preview
www.statssa.gov.za [email protected] T +27 12 310 8911 F +27 12 310 8500
Private Bag X44, Pretoria, 0001, South Africa
ISIbalo House, Koch Street, Salvokop, Pretoria, 0002
STATISTICAL RELEASE P0307
Marriages and divorces
2016
Embargoed until:30 May 2018
09:00
ENQUIRIES: FORTHCOMING ISSUE: EXPECTED RELEASE DATE:
User Information Services Marriages and divorces, 2017 February 2019 Tel: (012) 310 8600 / 4892 / 8390
STATISTICS SOUTH AFRICA i P0307
Marriages and divorces, 2016
PREFACE This statistical release presents information on civil marriages, customary marriages and civil unions that were
registered in 2016 in the South African national marriage registration systems maintained by the Department of
Home Affairs (DHA). It highlights trends in the number of marriages and unions as well as demographic and
other dynamics amongst married partners. The release also reports on divorces that were granted in 2016 by
the Department of Justice and Constitutional Development (DOJ&CD). It focuses on trends in divorces;
demographic and occupational characteristics of the plaintiffs; age at the time of divorce; duration of marriage at
the time of divorce and divorces involving couples with minor children.
Risenga Maluleke Statistician-General
STATISTICS SOUTH AFRICA ii P0307
Marriages and divorces, 2016
CONTENTS
PREFACE ................................................................................................................................................................. i
LIST OF FIGURES ................................................................................................................................................. iii
LIST OF TABLES ................................................................................................................................................... iv
KEY FINDINGS ....................................................................................................................................................... 1
1. Introduction .................................................................................................................................................... 1
2. Marriages ....................................................................................................................................................... 2
2.1 Civil marriages ..................................................................................................................................... 2
2.1.1 Trends in the registration of civil marriages (2003–2016) ...................................................... 2
2.1.2 Solemnisation of civil marriages ............................................................................................. 2
2.1.3 Marital status at the time of civil marriage .............................................................................. 3
2.1.4 Age at the time of civil marriage ............................................................................................. 3
2.2 Customary marriages .......................................................................................................................... 4
2.2.1 Trends in the registration of customary marriages (2003–2016) ........................................... 4
2.2.2 Marital status at the time of customary marriage ................................................................... 4
2.2.3 Age at the time of customary marriage .................................................................................. 4
2.3 Civil unions .......................................................................................................................................... 5
2.3.1 Trends in the registration of civil unions (2012–2016) ........................................................... 5
2.3.2 Marital status at the time of civil union ................................................................................... 5
2.3.3 Age at the time of civil union .................................................................................................. 5
3. Divorces ......................................................................................................................................................... 6
3.1 Trends in divorces (2003–2016) ......................................................................................................... 6
3.2 Characteristics of plaintiffs .................................................................................................................. 6
3.3 Number of divorces by way of solemnisation of marriage .................................................................. 6
3.4 Number of times married ..................................................................................................................... 7
3.5 Age at the time of divorce ................................................................................................................... 7
3.6 Duration of marriage of divorcing couples........................................................................................... 7
3.7 Divorces involving couples with minor children ................................................................................... 7
4. Summary and concluding remarks ................................................................................................................ 8
EXPLANATORY NOTES ...................................................................................................................................... 44
1. Purpose of the statistical release ................................................................................................................ 44
2. Scope and coverage .................................................................................................................................... 44
3. Data ............................................................................................................................................................. 44
4. Limitations.................................................................................................................................................... 44
5. Definitions of terms ...................................................................................................................................... 44
6. Symbols ....................................................................................................................................................... 45
7. Reference .................................................................................................................................................... 45
GENERAL INFORMATION ................................................................................................................................... 46
STATISTICS SOUTH AFRICA iii P0307
Marriages and divorces, 2016
LIST OF FIGURES
Figure 1 – Number of civil marriages by month of solemnisation, 2012–2016 ....................................................... 9
Figure 2 – Number of civil marriages for bachelors and spinsters by age group, 2016 ........................................10
Figure 3a – Median ages of bridegrooms and brides at the time of civil marriage, 2012–2016 .............................11
Figure 3b – Median ages of bachelors and spinsters at the time of civil marriage, 2012–2016 .............................11
Figure 3c – Median ages of widowers and widows at the time of civil marriage, 2012–2016 ................................12
Figure 3d – Median ages of male and female divorcees at the time of civil marriage, 2012–2016 ........................12
Figure 4a – Percentage distribution of civil marriages by age differences between spouses and marital status at the time of marriage (bachelors), 2016 .................................................................................13
Figure 4b – Percentage distribution of civil marriages by age differences between spouses and marital status at the time of marriage (widowers), 2016 ..................................................................................13
Figure 4c – Percentage distribution of civil marriages by age differences between spouses and marital status at the time of marriage (male divorcees), 2016 .........................................................................14
Figure 5 – Percentage distribution of customary marriages by year of marriage and time it took to register the marriage, 2012–2016 .....................................................................................................................14
Figure 6 – Median ages of bridegrooms and brides at the time of customary marriage, 2012–2016 ...................15
Figure 7 – Percentage distribution of customary marriages by age differences between spouses at the time of marriage, 2012–2016 ...............................................................................................................15
Figure 8 – Median ages of spouses in civil unions, 2012–2016 ............................................................................16
Figure 9 – Percentage distribution of civil unions by age differences between spouses at the time of union, 2012–2016 .................................................................................................................................16
Figure 10 – Median ages of divorcees by sex and population group, 2016 ............................................................17
Figure 11 – The proportions of divorces by age and population group (males), 2016 ............................................17
Figure 12 – The proportions of divorces by age group and population group (females), 2016 ..............................18
Figure 13 – The proportions of divorces by duration of marriage and population group, 2016 ..............................18
STATISTICS SOUTH AFRICA iv P0307
Marriages and divorces, 2016
LIST OF TABLES
Table 1 – Number of registered civil marriages in South Africa, 2003–2016 .......................................................19
Table 2 – Number and percentage distribution of civil marriages by province of marriage registration and way of solemnisation, 2016 ..................................................................................................................20
Table 3 – Number of civil marriages by province of registration and marital status of bridegrooms and brides at the time of marriage, 2016 ....................................................................................................21
Table 4 – Number of civil marriages by age differences between spouses at the time of marriage and marital status of husband, 2016 ...........................................................................................................22
Table 5 – Number of marriages by ages of bridegrooms and brides and marital status at the time of marriage, 2016 .....................................................................................................................................23
Table 6 – Number of registered customary marriages in South Africa, 2003–2016 ............................................26
Table 7 – Number and percentage distribution of customary marriages by province of marriage registration and age difference, 2016 ...................................................................................................27
Table 8 – Number of customary marriages by ages of bridegrooms and brides at the time of marriage, 2016......................................................................................................................................................28
Table 9 – Number and percentage distribution of civil unions registered by province of registration, 2012–2016 ...........................................................................................................................................31
Table 10 – Number of civil unions by ages of spouses-1 and spouses-2 at the time of civil union, 2016 .............32
Table 11 – Number and percentage distribution of published divorces in South Africa by population group, 2003 – 2016 .........................................................................................................................................35
Table 12 – Number and percentage distribution of divorces by type of occupation at the time of divorce, 2016......................................................................................................................................................36
Table 13 – Number and percentage distribution of divorces by population group and plaintiff, 2016 ...................37
Table 14 – Number and percentage distribution of divorces by province of divorce registration and plaintiff, 2016 ........................................................................................................................................37
Table 15 – Number and percentage distribution of divorces by population group and way of solemnisation of the marriage, 2016 ...........................................................................................................................38
Table 16 – Number and percentage distribution of divorces by number of times married at the time of divorce, 2016 ........................................................................................................................................38
Table 17 – Number of divorces by age and population group (male divorcees), 2016 .........................................39
Table 18 – Number of divorces by age group and population group (female divorcees), 2016 ............................40
Table 19 – Number of divorces by age group and duration of marriage (male divorcees), 2016 ..........................41
Table 20 – Number of divorces by age group and duration of marriage (female divorcees), 2016 .......................42
Table 21 – Number and percentage distribution of divorces by population group and divorces with and without children (aged below 18 years), 2016 .....................................................................................43
Table 22 – Number and percentage distribution of population group by children (aged below 18 years) affected by divorces, 2016 ...................................................................................................................43
STATISTICS SOUTH AFRICA 1 P0307
Marriages and divorces, 2016
KEY FINDINGS
1. Introduction
There are three main sources of marriage and divorce statistics in South Africa; namely, those compiled from
population censuses; household sample surveys and administrative data (i.e. those compiled from civil
registration systems and other administrative records). The data from these sources provides information on
different aspects on marriages and divorces in the country. Census and survey data are by nature subjective
individual information that provides cross-sectional data on individuals’ marital status (never married, married,
divorced, widowed, etc). However, not all types of marriages and divorces are registered. Therefore, marriages
and divorces in this context cover different types of marriages and associated divorces that took place at
different periods in people’s lives.
Unlike in census and survey data, registered marriages and divorces data are based on the continuous
recording of these events as they take place. Not all marriages are registered marriages in South Africa, as
some are not recognised by law. The three types of marriages that are recognised by law are civil marriages,
customary marriages and civil unions. The Department of Home Affairs (DHA) is responsible to manage
registered marriages and unions under the following legislations:
Civil marriages are administered through the Marriages Act, 1961 (Act No. 25 of 1961) as amended,
and its associated regulations.
Customary marriages are governed by the Recognition of Customary Marriages Act, 1998 (Act No. 120
of 1998) that came into effect on 15 November 2000.
The Civil Union Act, 2006 (Act No. 17 of 2006) governs civil unions (relationships between same-sex
couples that are legally recognised by a state authority), and it came into operation on 30 November
2006. The act accommodates persons who cannot or wish not to enter into a marriage under the
Marriage Act, 1961.
Statistics South Africa (Stats SA) publishes data on marriages for South African citizens and permanent
residents that are collected through the civil registration systems of DHA. Before 2008, the data in the annual
release of Marriages and divorces (P0307) covered only civil marriages. However in 2009, Stats SA started
publishing available data on customary marriages and civil unions. The registration of customary marriages and
civil unions began in 2003 and 2007 respectively.
The Department of Justice and Constitutional Development (DOJ&CD) is responsible for handling matters
relating to the dissolution of registered marriages (civil and customary) and civil unions. This responsibility of the
department is mandated through:
The Divorce Act, 1979 (Act No.70 of 1979), as amended; and
The Jurisdiction of Regional Courts Amendment Act, 2008 (Act No. 31 of 2008), which came into effect
on 9 August 2010.
Data on divorces are obtained from various regional courts that deal with divorce matters. The data are based
on successful divorce cases that have been issued with a decree of divorce. Divorce cases came from
marriages that were registered in different years as well as divorce cases that were filed in different years but
whose divorce decrees were granted in the same year. It should be noted that although both the data on the
marriages and divorces are collected in the same year, the data sets are not linked to each other.
STATISTICS SOUTH AFRICA 2 P0307
Marriages and divorces, 2016
2. Marriages
2.1 Civil marriages
2.1.1 Trends in the registration of civil marriages (2003 – 2016)
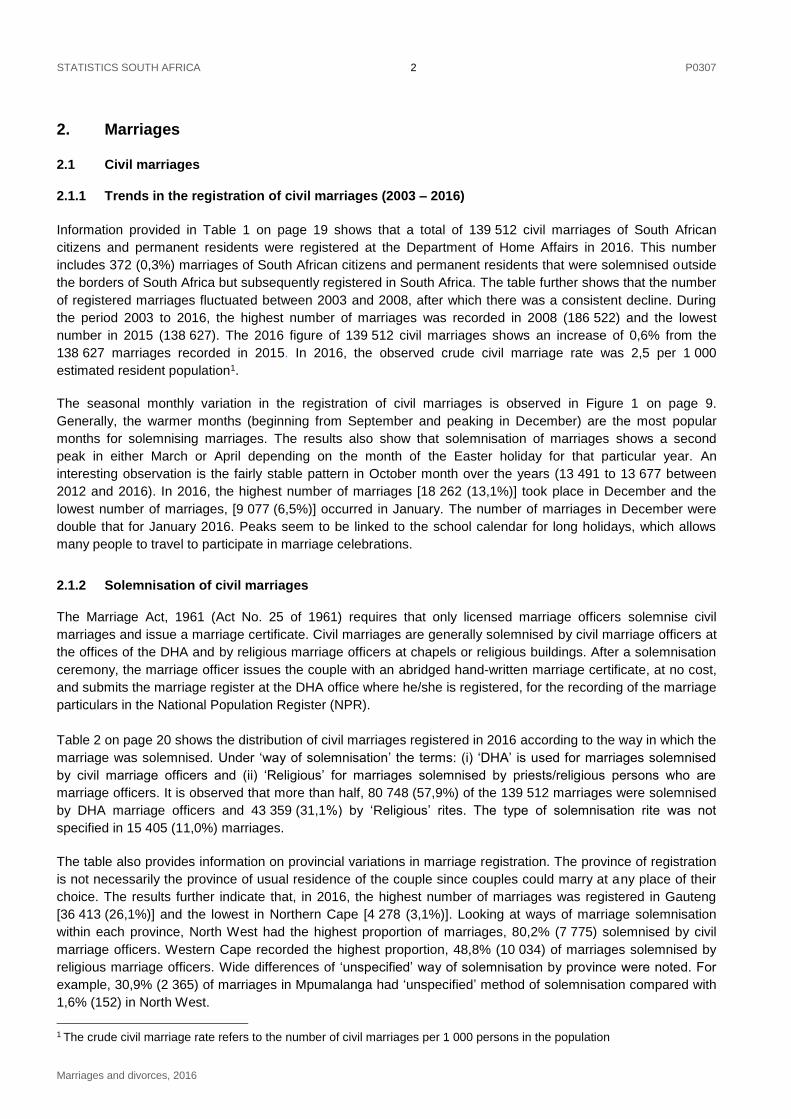
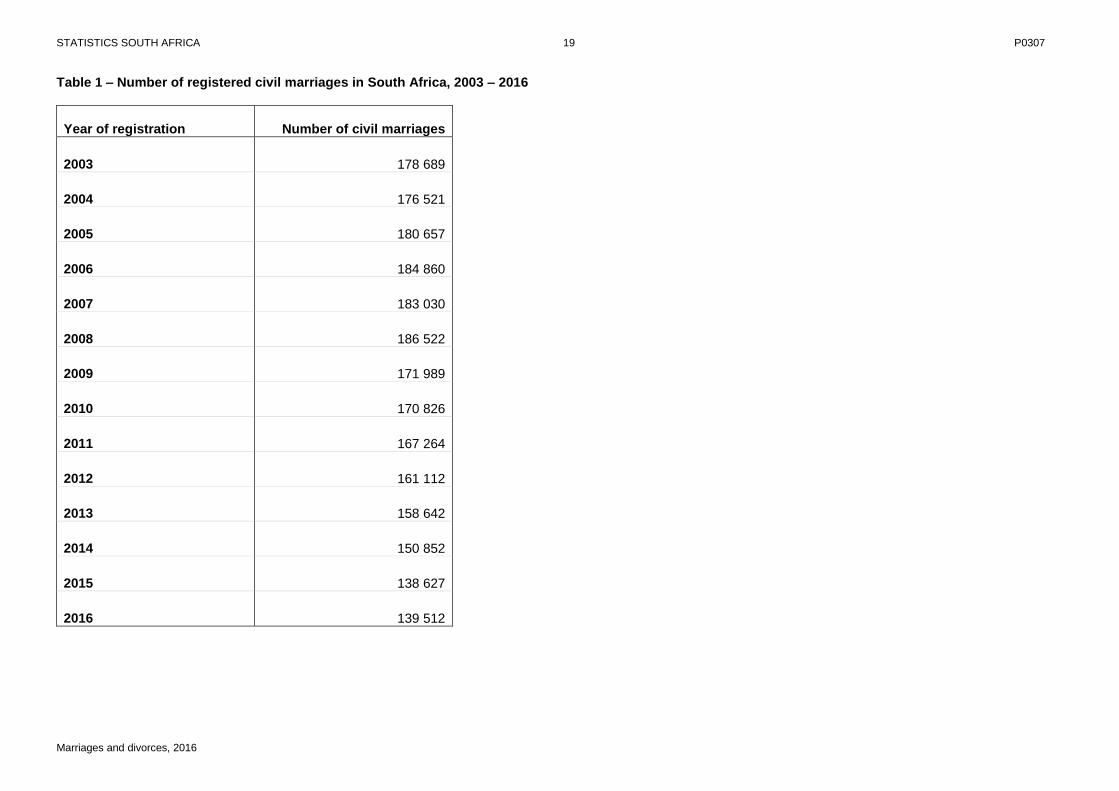
Information provided in Table 1 on page 19 shows that a total of 139 512 civil marriages of South African
citizens and permanent residents were registered at the Department of Home Affairs in 2016. This number
includes 372 (0,3%) marriages of South African citizens and permanent residents that were solemnised outside
the borders of South Africa but subsequently registered in South Africa. The table further shows that the number
of registered marriages fluctuated between 2003 and 2008, after which there was a consistent decline. During
the period 2003 to 2016, the highest number of marriages was recorded in 2008 (186 522) and the lowest
number in 2015 (138 627). The 2016 figure of 139 512 civil marriages shows an increase of 0,6% from the
138 627 marriages recorded in 2015. In 2016, the observed crude civil marriage rate was 2,5 per 1 000
estimated resident population1.
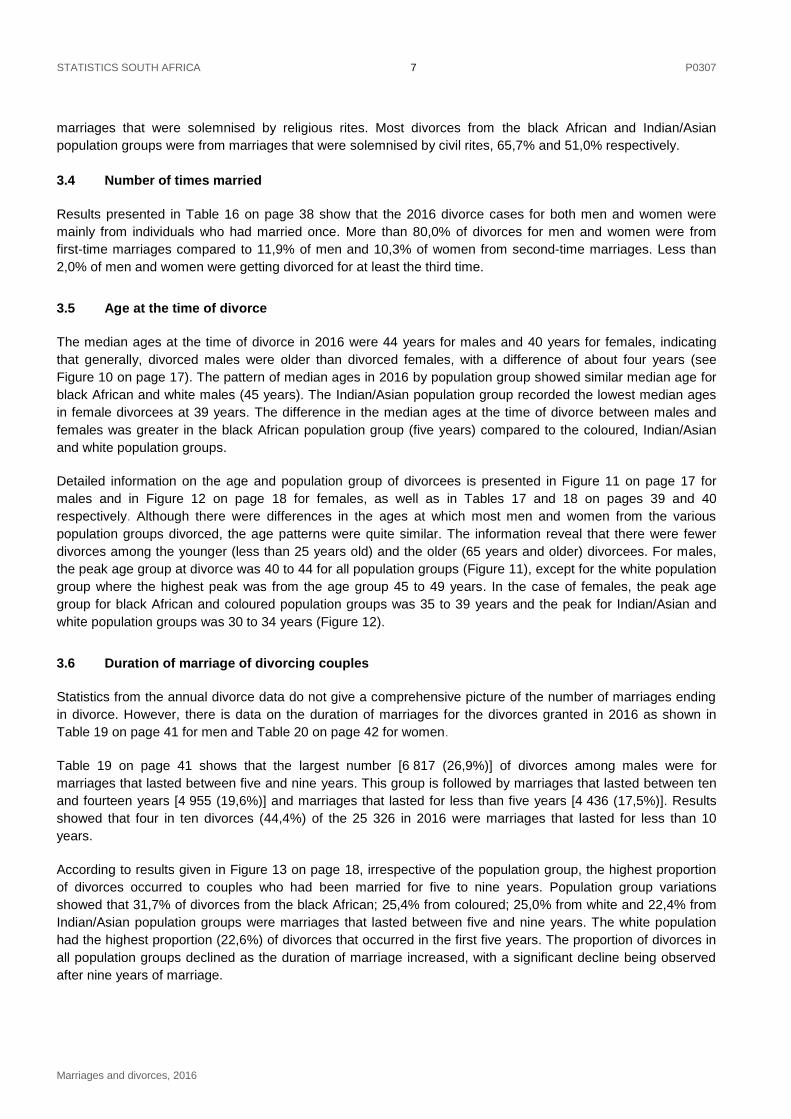
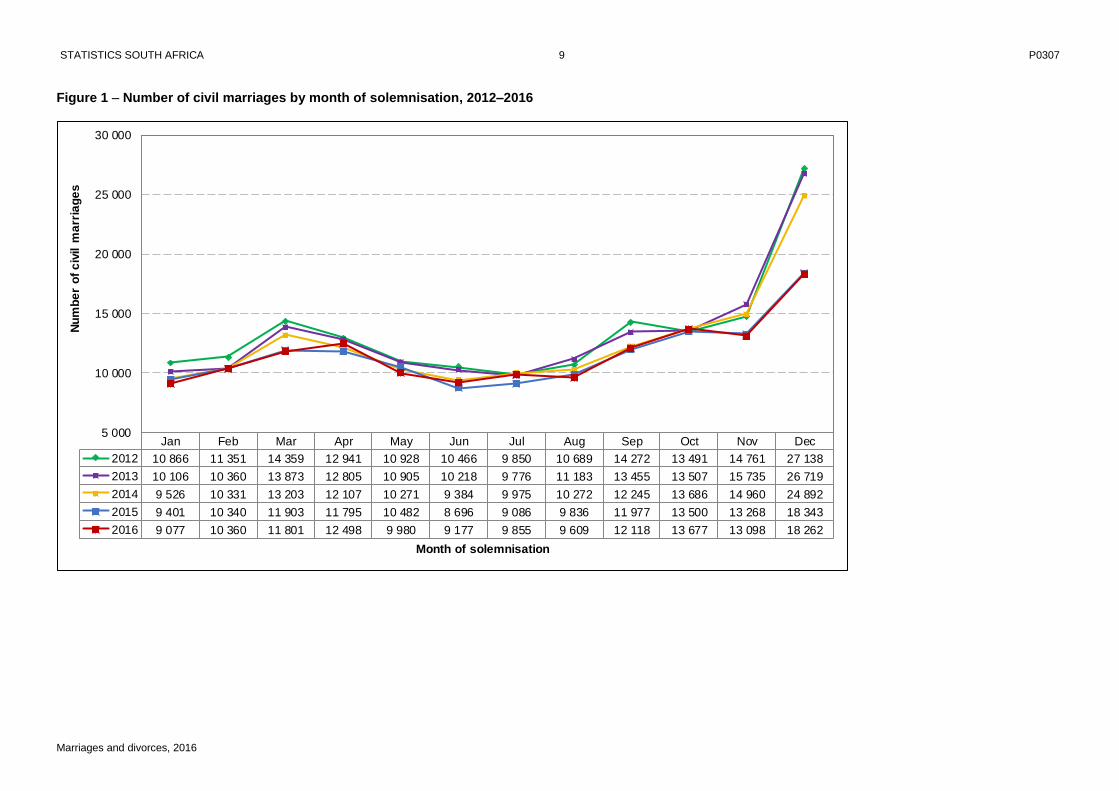
The seasonal monthly variation in the registration of civil marriages is observed in Figure 1 on page 9.
Generally, the warmer months (beginning from September and peaking in December) are the most popular
months for solemnising marriages. The results also show that solemnisation of marriages shows a second
peak in either March or April depending on the month of the Easter holiday for that particular year. An
interesting observation is the fairly stable pattern in October month over the years (13 491 to 13 677 between
2012 and 2016). In 2016, the highest number of marriages [18 262 (13,1%)] took place in December and the
lowest number of marriages, [9 077 (6,5%)] occurred in January. The number of marriages in December were
double that for January 2016. Peaks seem to be linked to the school calendar for long holidays, which allows
many people to travel to participate in marriage celebrations.
2.1.2 Solemnisation of civil marriages
The Marriage Act, 1961 (Act No. 25 of 1961) requires that only licensed marriage officers solemnise civil
marriages and issue a marriage certificate. Civil marriages are generally solemnised by civil marriage officers at
the offices of the DHA and by religious marriage officers at chapels or religious buildings. After a solemnisation
ceremony, the marriage officer issues the couple with an abridged hand-written marriage certificate, at no cost,
and submits the marriage register at the DHA office where he/she is registered, for the recording of the marriage
particulars in the National Population Register (NPR).
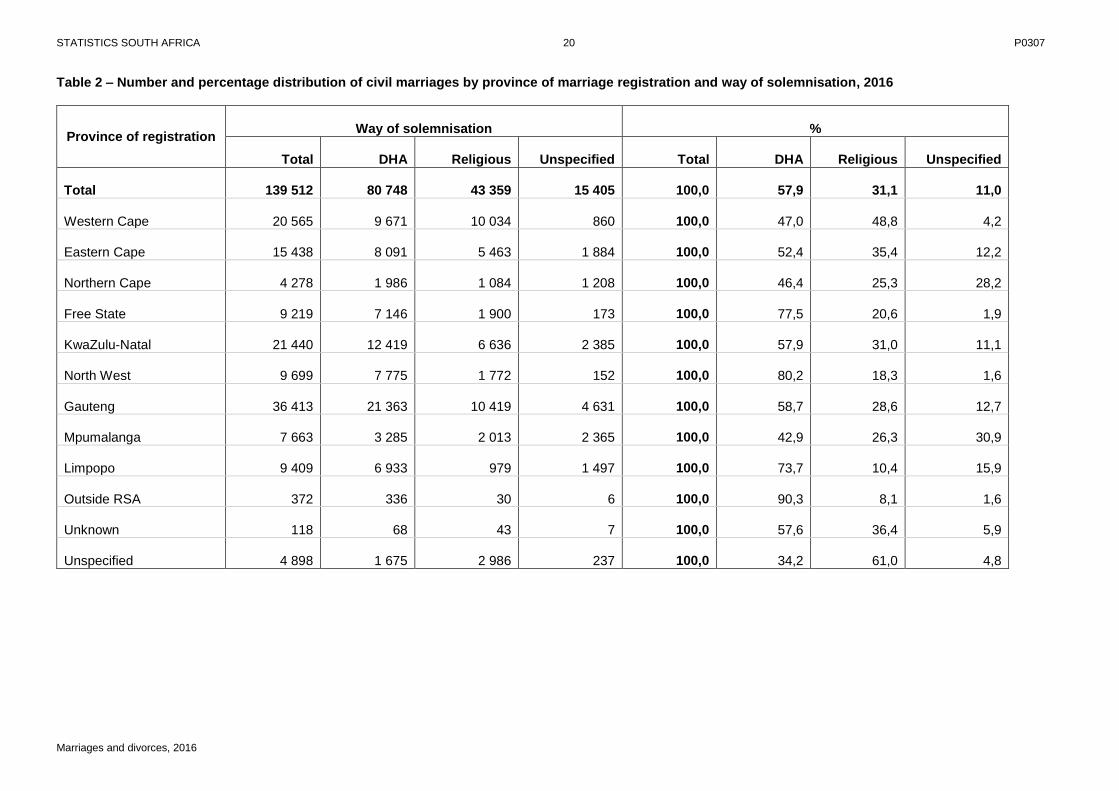
Table 2 on page 20 shows the distribution of civil marriages registered in 2016 according to the way in which the
marriage was solemnised. Under ‘way of solemnisation’ the terms: (i) ‘DHA’ is used for marriages solemnised
by civil marriage officers and (ii) ‘Religious’ for marriages solemnised by priests/religious persons who are
marriage officers. It is observed that more than half, 80 748 (57,9%) of the 139 512 marriages were solemnised
by DHA marriage officers and 43 359 (31,1%) by ‘Religious’ rites. The type of solemnisation rite was not
specified in 15 405 (11,0%) marriages.
The table also provides information on provincial variations in marriage registration. The province of registration
is not necessarily the province of usual residence of the couple since couples could marry at any place of their
choice. The results further indicate that, in 2016, the highest number of marriages was registered in Gauteng
[36 413 (26,1%)] and the lowest in Northern Cape [4 278 (3,1%)]. Looking at ways of marriage solemnisation
within each province, North West had the highest proportion of marriages, 80,2% (7 775) solemnised by civil
marriage officers. Western Cape recorded the highest proportion, 48,8% (10 034) of marriages solemnised by
religious marriage officers. Wide differences of ‘unspecified’ way of solemnisation by province were noted. For
example, 30,9% (2 365) of marriages in Mpumalanga had ‘unspecified’ method of solemnisation compared with
1,6% (152) in North West.
1 The crude civil marriage rate refers to the number of civil marriages per 1 000 persons in the population
STATISTICS SOUTH AFRICA 3 P0307
Marriages and divorces, 2016
2.1.3 Marital status at the time of civil marriage
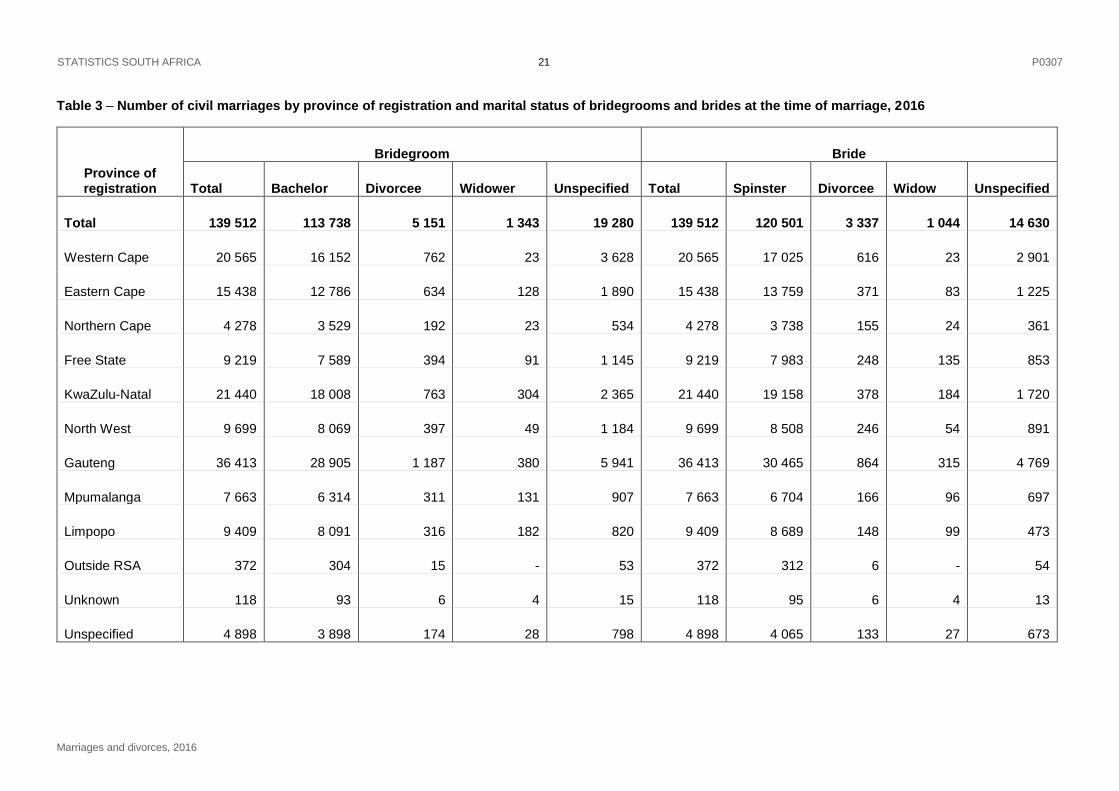
Table 3 on page 21 shows the number of civil marriages for bridegrooms and brides by marital status at the time
of marriages and province of registration. The table indicates that the majority of the marriages in 2016 for both
bridegrooms and brides were first-time marriages in all provinces. For bridegrooms, there were 113 738 (81,5%)
bachelors, 5 151 (3,7%) divorcees and 1 343 (1,0%) widowers. For the brides, 120 501 (86,4%) were spinsters
whilst 3 337 (2,4%) were divorcees and 1 044 (0,7%) were widows. The marital status of 19 280 (13,8%)
bridegrooms and 14 630 (10,5%) brides were unspecified. A high proportion of marriages between bridegrooms
and brides marrying for the first time was observed in Limpopo where 86,0% and 92,3% were bachelors and
spinsters respectively. The profile of those that were remarrying showed that remarriages were more prevalent
in divorcees as compared to the widowed.
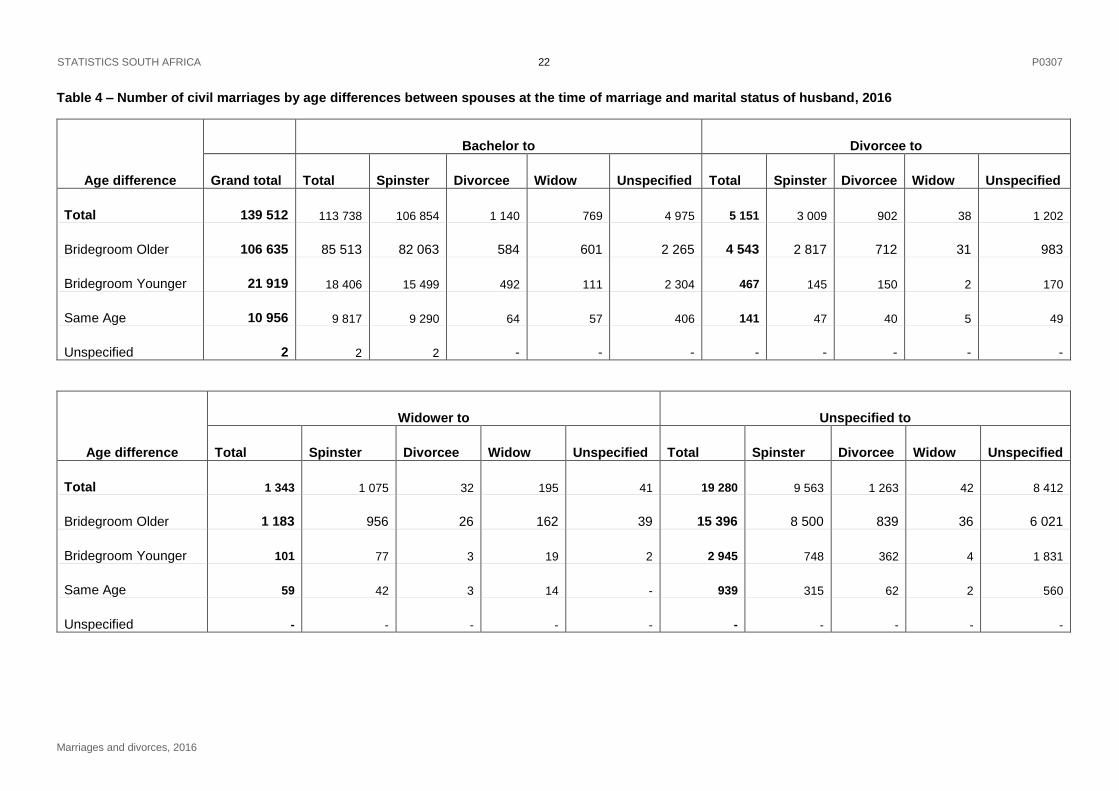
The number of marriages by marital status of husband and age differences between spouses are shown on
Table 4 on page 22. It is observed that irrespective of their marital status, men generally married women who
had never been married (spinsters). Thus 106 854 (93,9%) of bachelors married spinsters, 1 140 (1,0%)
married divorcees and 769 (0,7%) married widows. In addition, irrespective of the fact that more divorcees and
widowers married spinsters, the proportion of male divorcees who married female divorcees 902 (17,5%) was
higher than the proportion that married widows 38 (0,7%). Similarly, the proportion of widowers who married
widows 195 (14,5%) was higher than the proportion that married female divorcees 32 (3,0%).
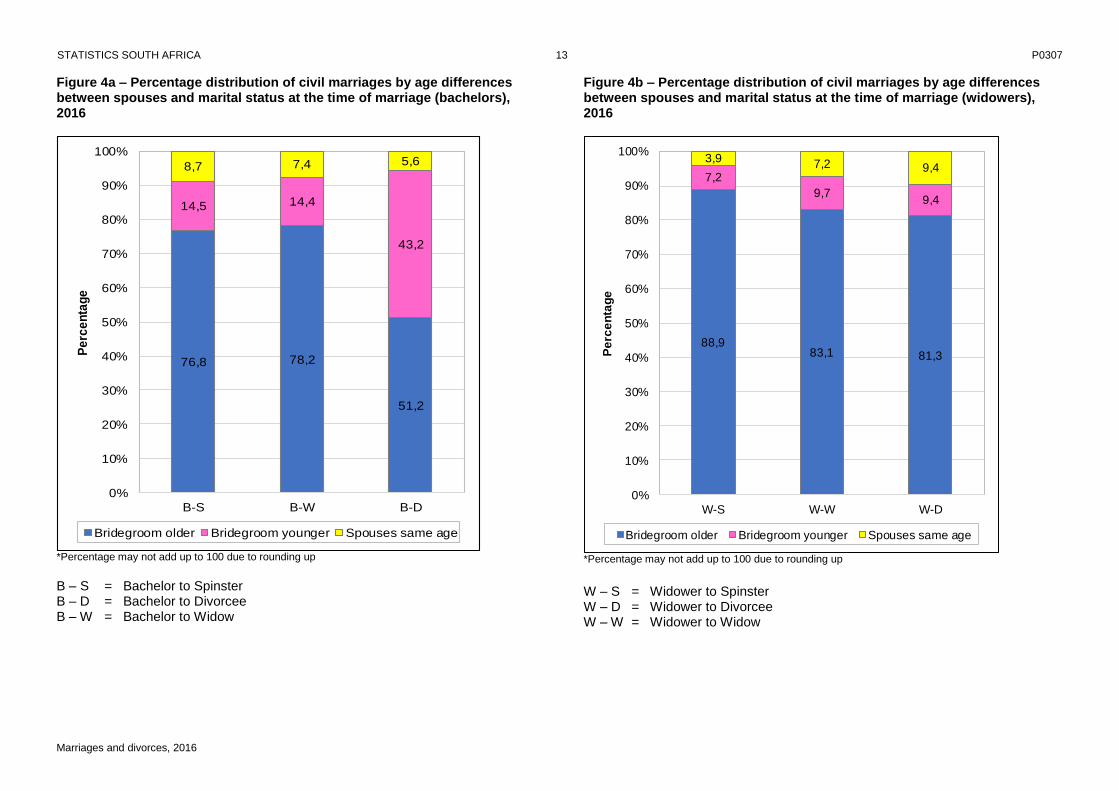
Table 4 suggests that men tend to marry younger women, thus 106 635 (76,4%) of the 139 512 bridegrooms
were older than their brides. Nevertheless, 21 919 (15,7%) bridegrooms were younger than their brides and
10 956 (7,9%) were of the same age as their brides. This observed age pattern is the same irrespective of the
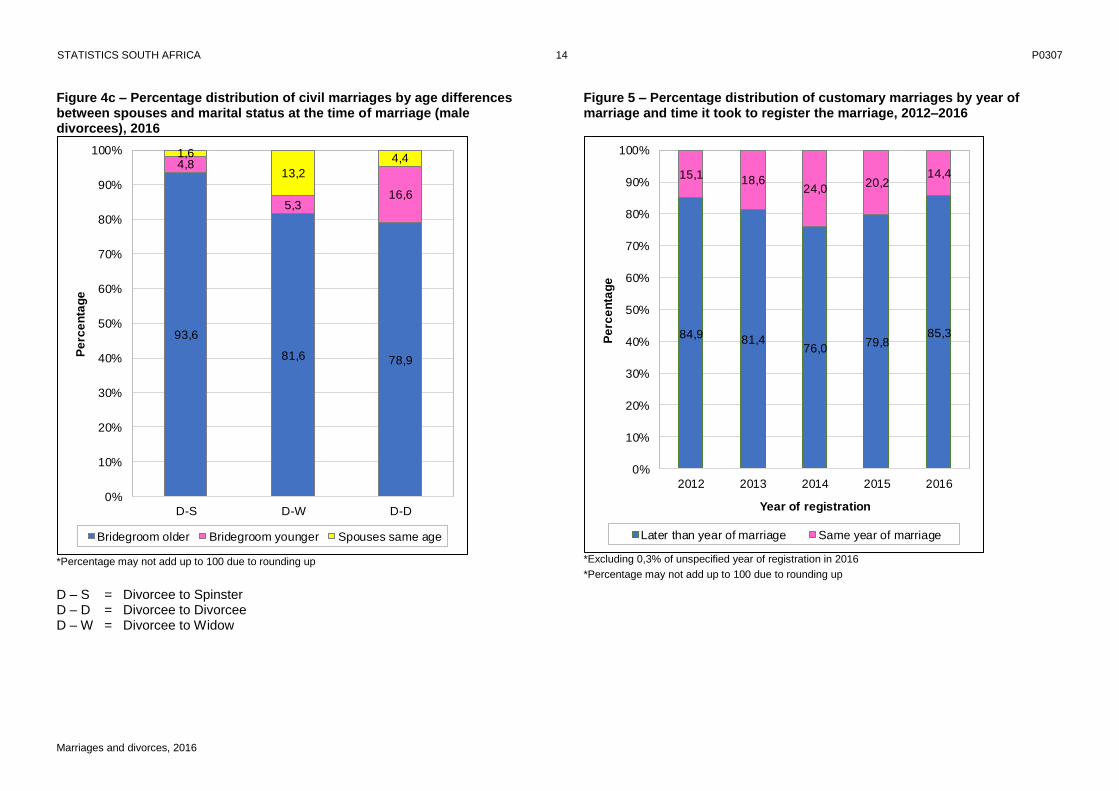
marital status of the bridegroom at the time of marriage (see Figures 4a to 4c on pages 13–14). However, the
magnitude differs by the marital status of the spouses at the time of marriage. For example, 43,2% of bachelors
who married divorcees were younger than their brides (see Figure 4a) and 5,3% of male divorcees who married
widowed women were also younger than their brides (see Figure 4c). A relatively smaller percentage (4,8%)
was observed for male divorcees marrying spinsters who were older than them (see Figure 4c).
2.1.4 Age at the time of civil marriage
Population scientists are interested in the age at first marriage or union because of its theoretical link to
exposure to the possibility of pregnancy, childbearing and ultimately to fertility (Bongaarts, 1978). This link tends
to be weakened in populations where pre-marital fertility is widespread. Nevertheless, age at first marriage or
union continues to be a good proxy for measuring not only fertility but other health and socio-economic
indicators relating particularly to the role and status of women in society. The importance of this indicator is, to
some extent, underscored in South Africa through the marriage legislations that put restrictions on marriages
involving minors (persons under 18 years old). These minors require the consent of a parent, a guardian or a
commissioner of child welfare before entering into a marriage. In addition to the above consent, boys under 18
years and girls under 16 years of age require the consent of the Minister of Home Affairs before they can marry.
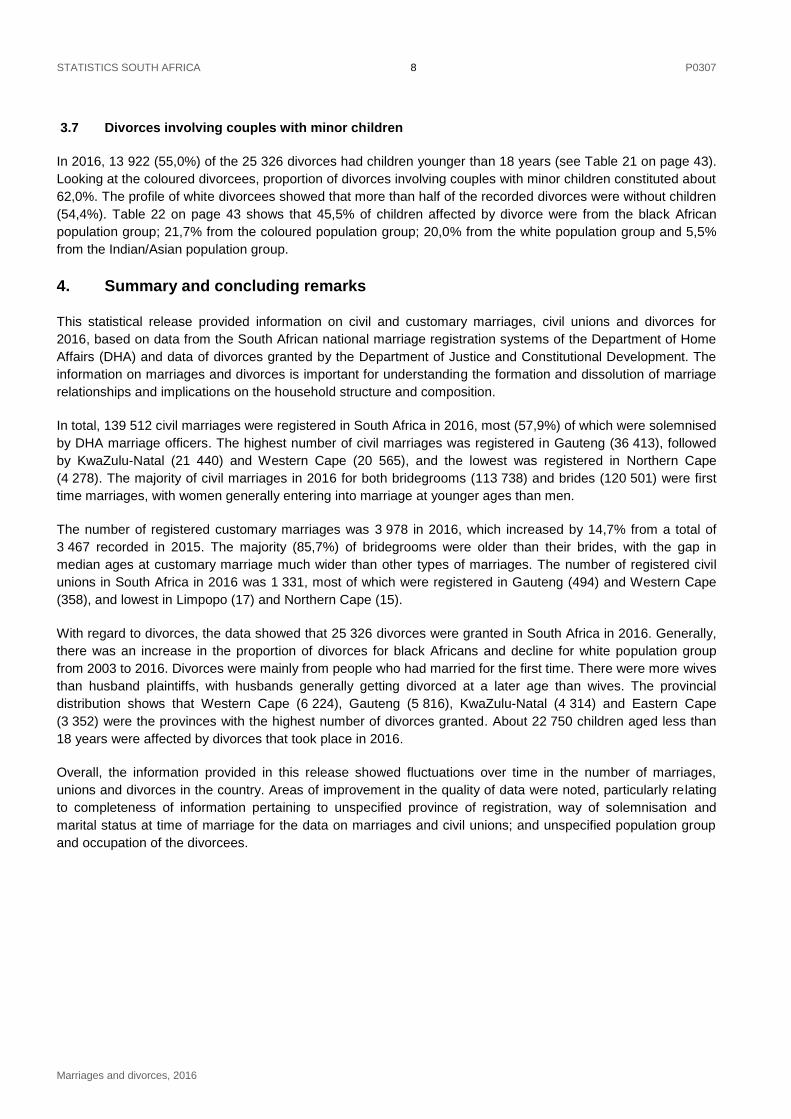
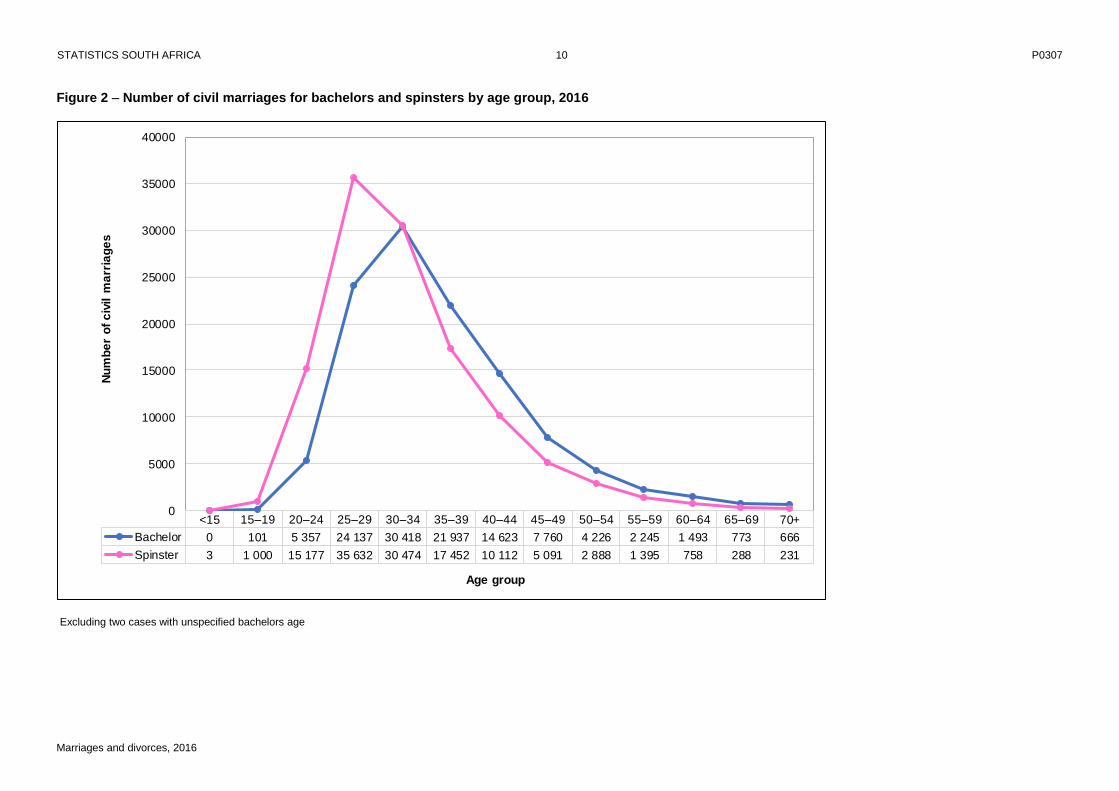
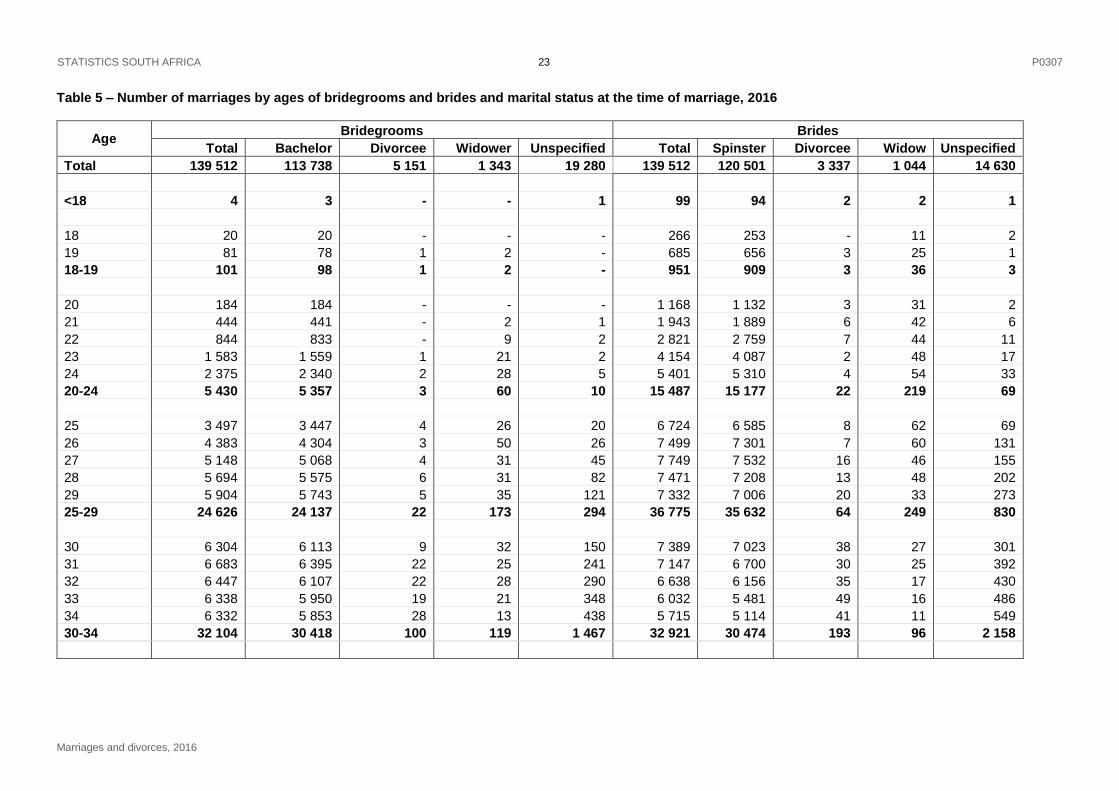
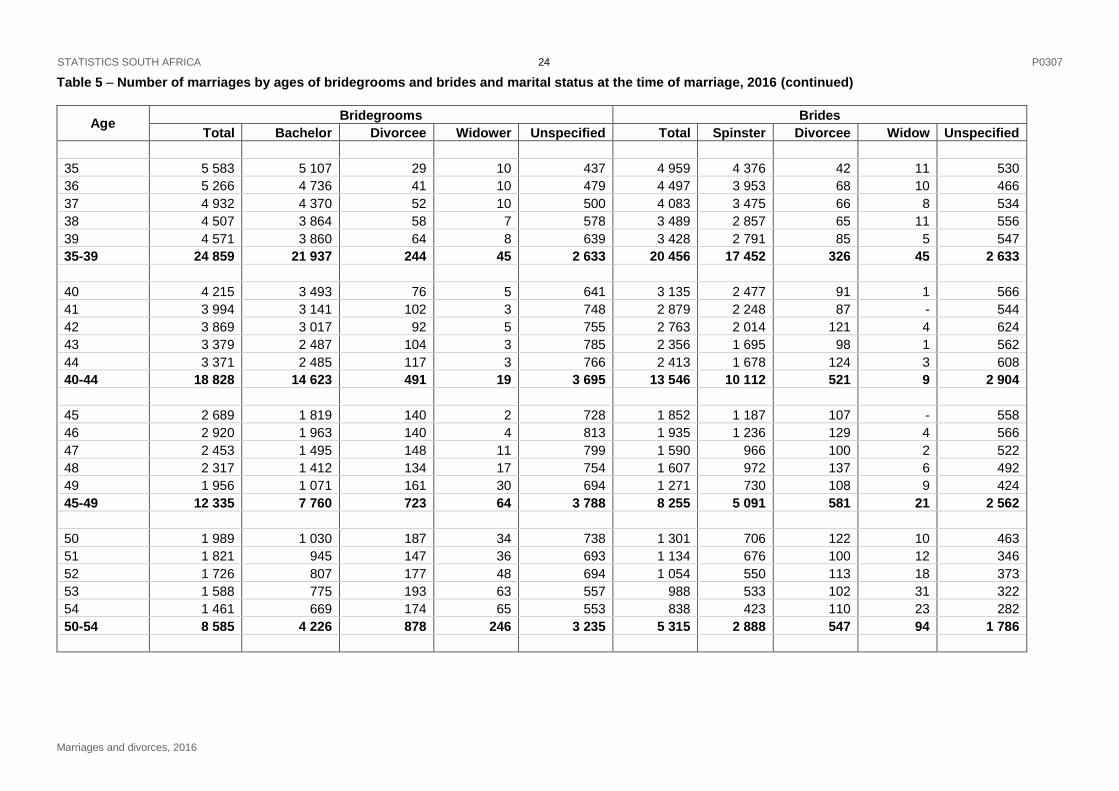
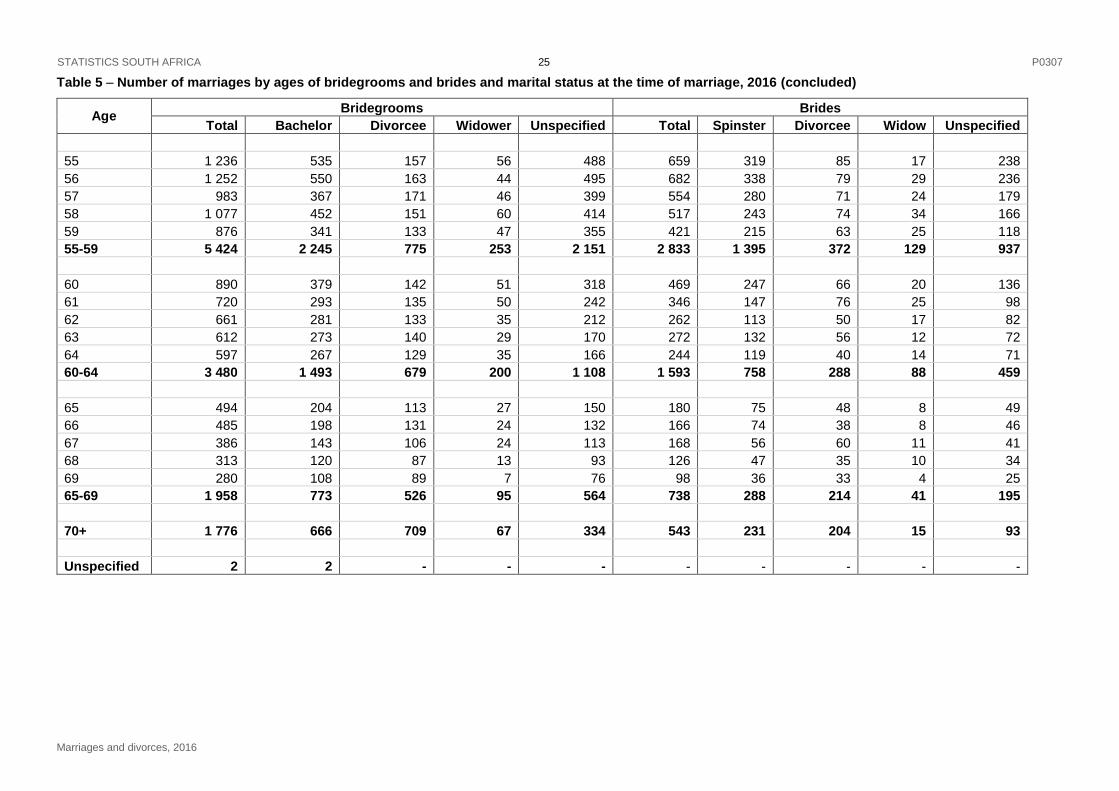
In 2016, marriages of 4 bridegrooms and 99 brides aged less than 18 years were registered, with 3 bachelors
and 94 spinsters (see Table 5 on page 23). Figure 2 on page 10 indicates that the highest number of bachelors
[30 418 (26,7%)] were aged 30–34 years whereas the highest number of spinsters [35 632 (29,6%)] were aged
25–29 years. There were more spinsters compared to bachelors at younger ages (less than 30 years) and vice
versa at older ages (35 years and older).
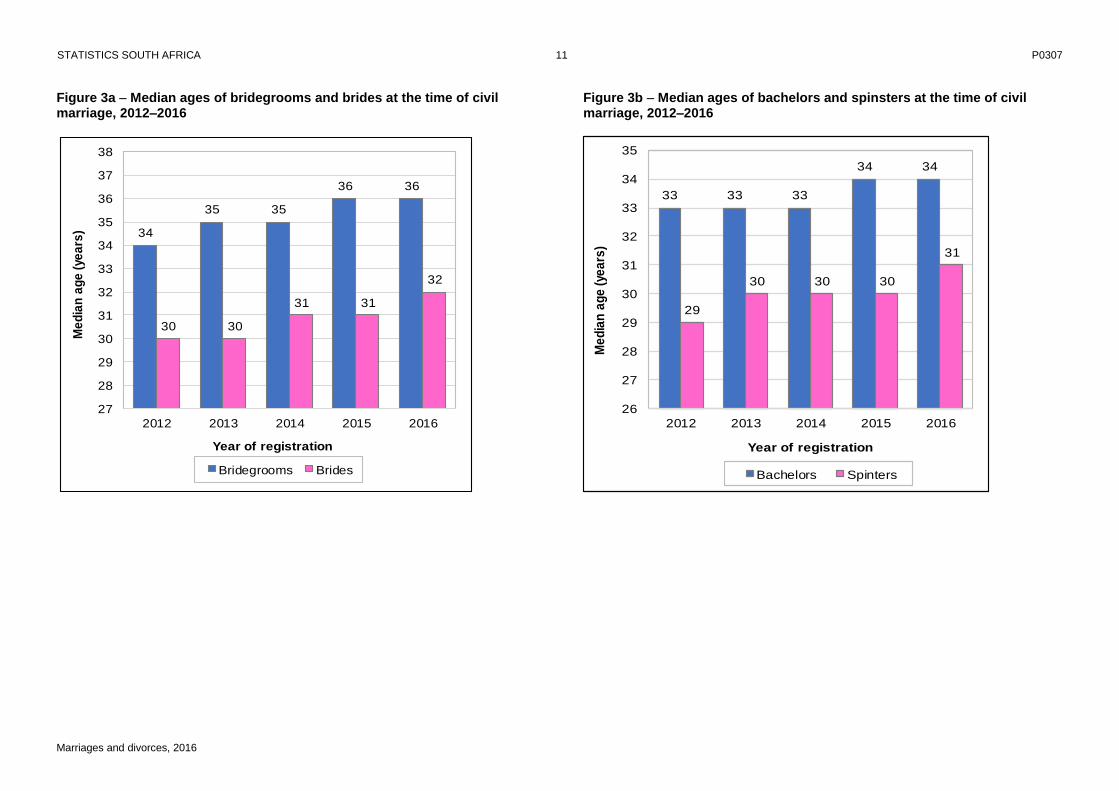
Figure 3a on page 11 shows the median ages of bridegrooms and brides at the time of marriage. Median ages
of bridegrooms increased from 34 years in 2012 to 36 years in 2016 and those for brides increased from 30
years to 32 years during the same period. Figure 3a to Figure 3d on pages 11 and 12 further show that women
STATISTICS SOUTH AFRICA 4 P0307
Marriages and divorces, 2016
generally entered marriage at younger ages than men. In addition, the median ages at current marriage was
lowest for those marrying for the first time, followed by those widowed and highest for divorcees.
For the first time marriages, the median ages for bachelors and spinsters were 34 years and 31 years
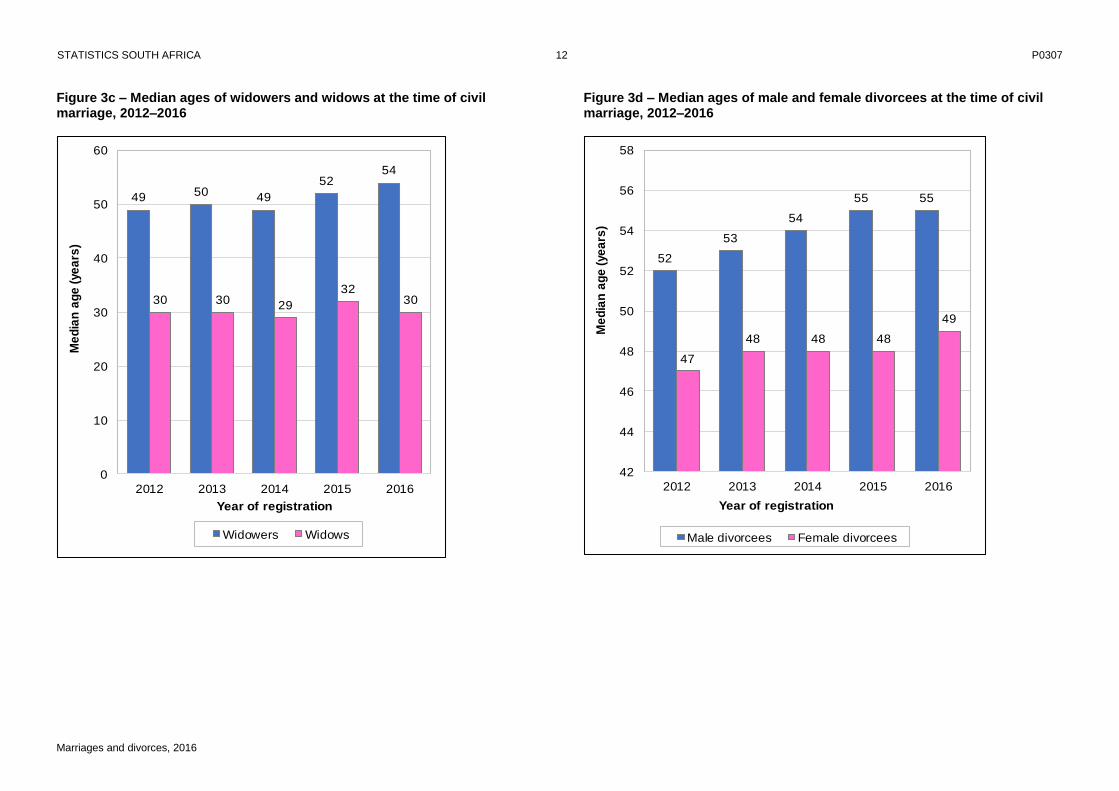
respectively in 2016, giving an age difference of three years (see Figure 3b). For remarriages, the median ages
for widowers and widows in 2016 (see Figure 3c) were 54 years and 30 years respectively, resulting in a 24-
year age gap. The median ages for widowers consistently increased every year from 49 years in 2012 to 54
years in 2016, with the exception of 2014 where it decreased by a year from the 2013 median age, to 49. The
median ages of widows decreased by two years from 32 years in 2015 to 30 years in 2016.
The median ages at marriage for divorcees are shown in Figure 3d. It is observed that the median ages for male
divorcees increased gradually over time. The median ages of male divorcees increased from 52 years in 2012
to 55 years in 2016. In comparison, the median age of female divorcee showed two years increase from 47
years in 2012 to 49 years in 2016. There was a six-year age difference in the median ages between male and
female divorcees in 2016.
2.2 Customary marriages
2.2.1 Trends in the registration of customary marriages (2003–2016)
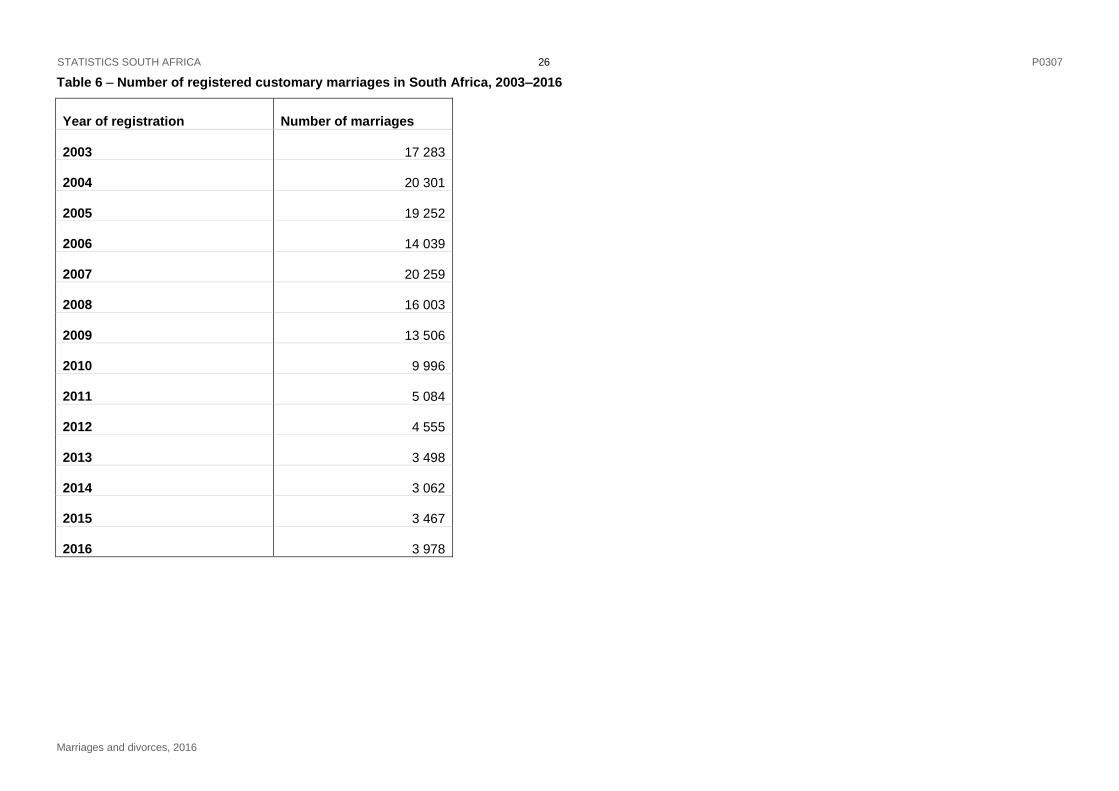
In 2016, 3 978 customary marriages were registered at the Department of Home Affairs, indicating an increase
of 14,7% from 3 467 customary marriages registered in 2015. It is observed from Table 6 on page 26 that the
number of registered customary marriages fluctuated between 2003 and 2007 after which there was a
consistent decline from 2008 to 2014 then an increase in 2015 and 2016. The highest number of registered
customary marriages was recorded in 2004 (20 301) whilst the lowest number was recorded in 2014 (3 062).
The observed crude customary marriage rate was 0,1 per 1 000 estimated resident population in 20162.
The Recognition of Customary Marriages Act, 1998 (Act No. 120 of 1998) prescribes that customary marriages
that were entered into after the commencement of this Act must be registered within a period of three months
after the conclusion of the marriage and those entered before the Act to be registered within 12 months of the
commencement of the Act. Figure 5 on page 14 shows that the majority of customary marriages were registered
later than the year of marriage. During the period from 2012 to 2016, the proportion of marriages that were
registered in the same year they took place, ranged from 15,1% in 2012; 24,0% in 2014 to 14,4% in 2016.
2.2.2 Marital status at the time of customary marriage
Since the Customary Marriages Act of 1998 recognises polygyny, a husband who has registered his marriage
under the Act is permitted to register additional marriages under the Act provided he adheres to the regulations
under the Act regarding his property. That is, at his own cost, the husband has to get an order from a competent
court that will regulate his future matrimonial property system. It would be of interest to distinguish between first-
time spouses and those who have married before (i.e. those in polygynous marriages, divorcees, widows and
widowers). However, the information is not available at the DHA.
2.2.3 Age at the time of customary marriage
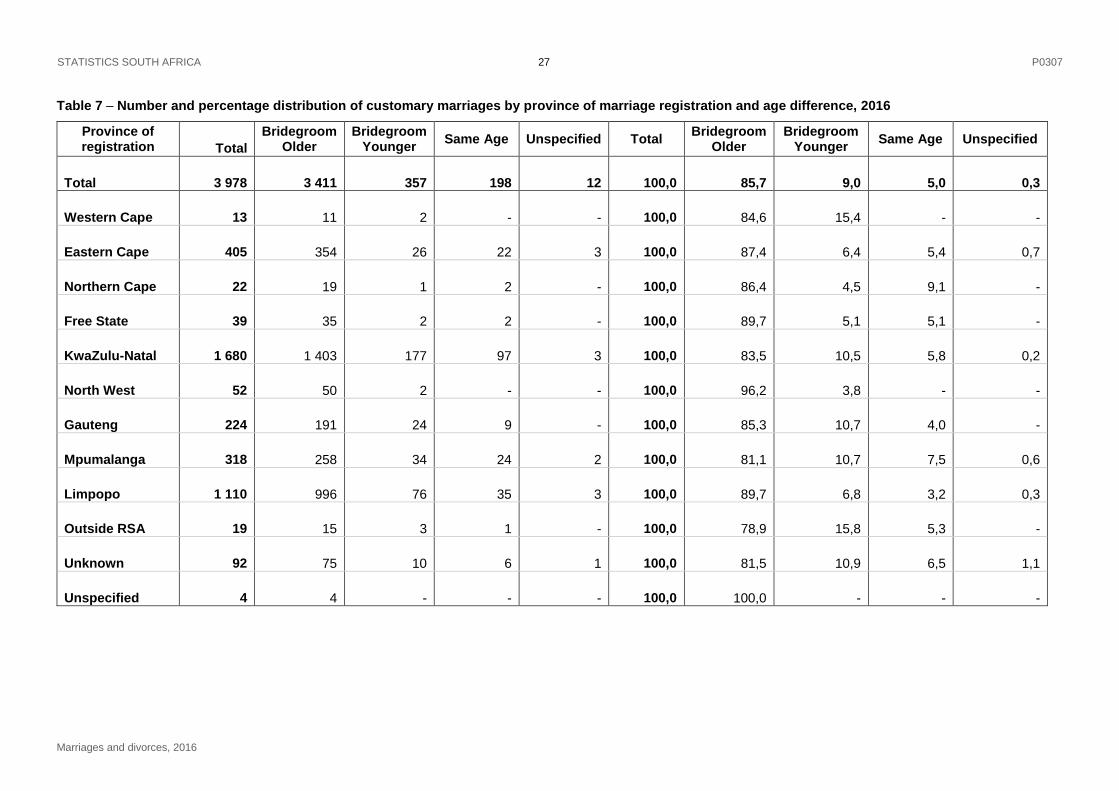
The results presented in Table 7 on page 27 show that in 2016, the highest number of customary marriages
were registered in KwaZulu-Natal [1 680 (42,2%)], followed by Limpopo [1 110 (27,9%)] and Eastern Cape
[405 (10,2%)]. The lowest number of customary marriages was recorded in Western Cape [13 (0,3%)]. The age
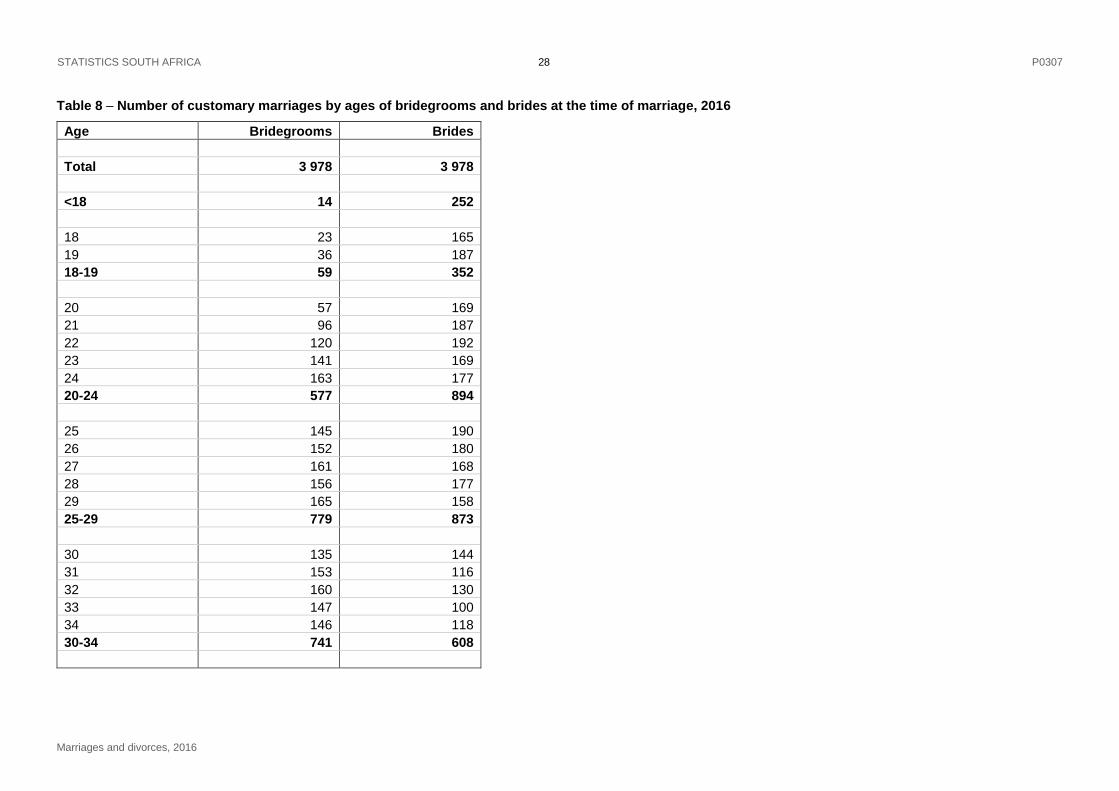
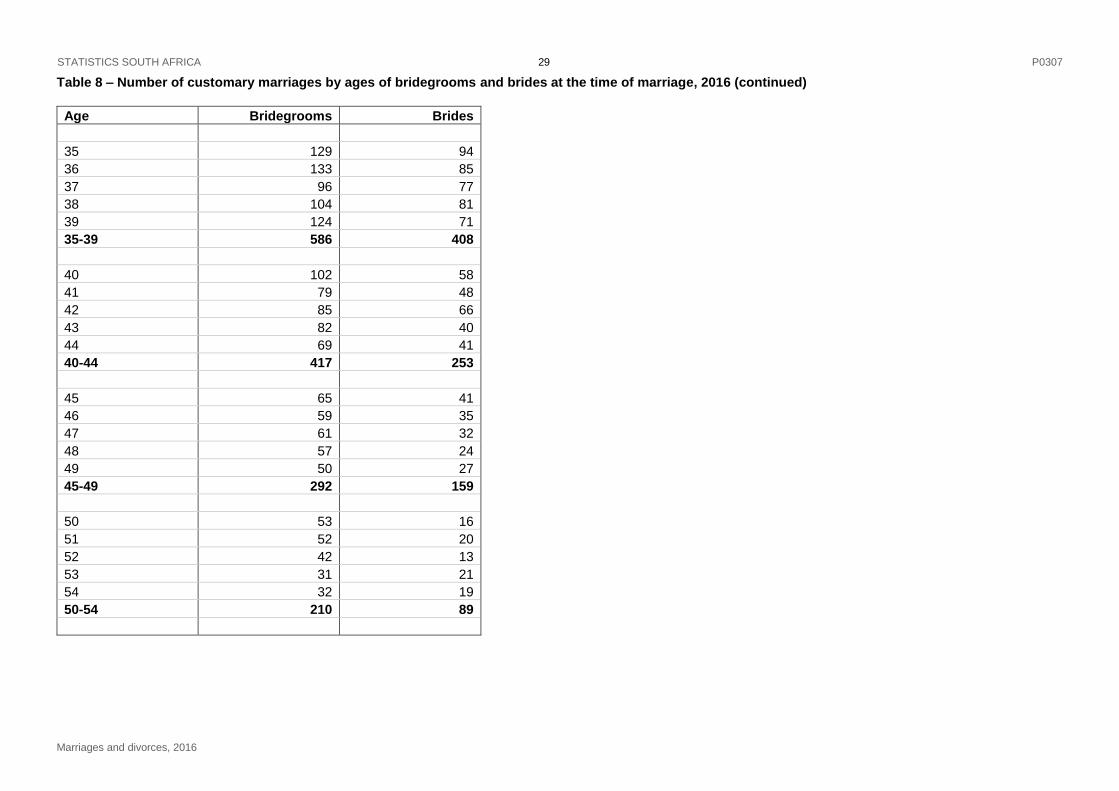
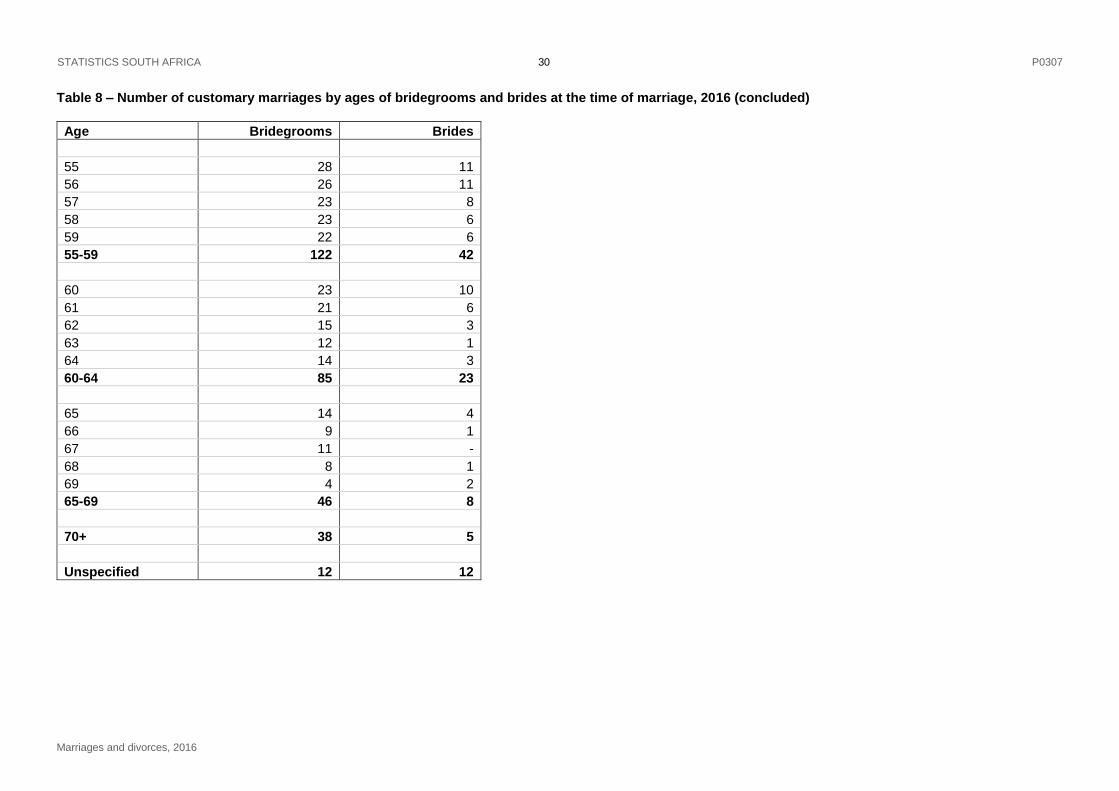
distribution of bridegrooms and brides at the time of customary marriage is presented in Table 8 on page 28. In
2016, there were 14 (0,4%) bridegrooms and 252 (6,3%) brides who were younger than 18 years.
2 The crude customary marriage rate refers to the number of customary marriages per 1 000 persons in the population
STATISTICS SOUTH AFRICA 5 P0307
Marriages and divorces, 2016
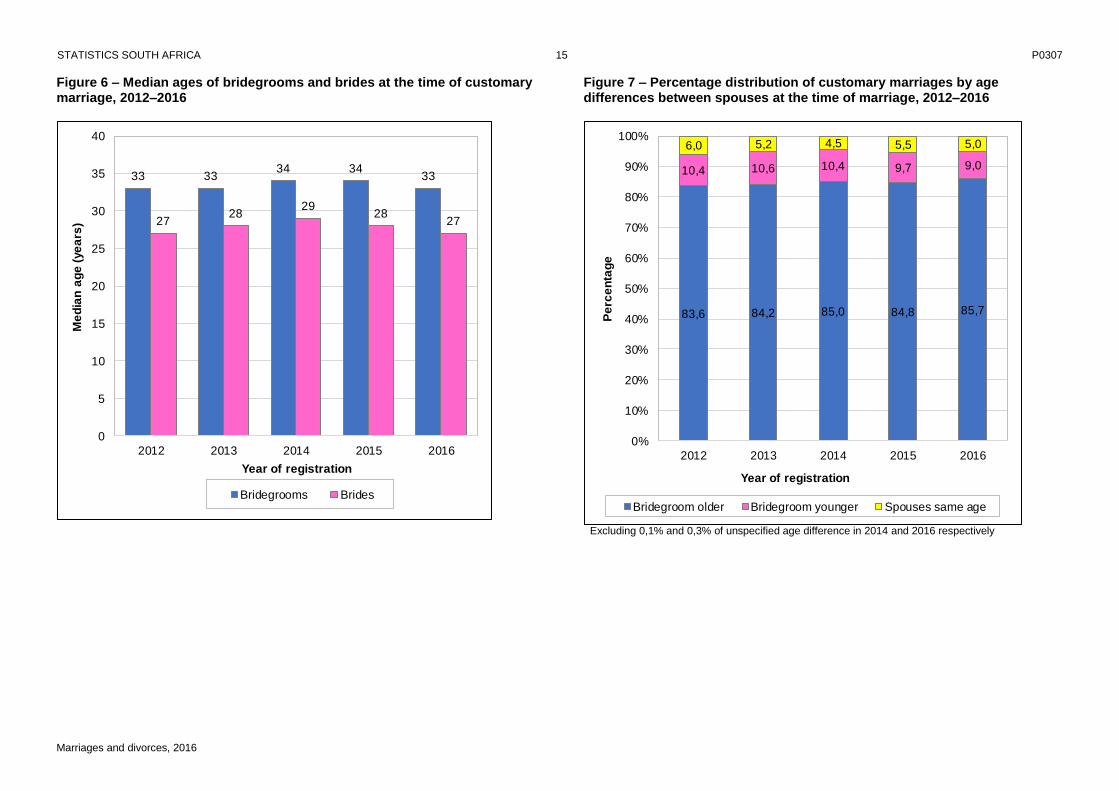
The median ages at the time of customary marriage are presented in Figure 6 on page 15. Similar to civil
marriages, bridegrooms were generally older than brides, with an age difference of about five to six years for
customary marriages registered between 2012 and 2016. The median ages for bridegrooms and brides
remained fairly stable over the period 2012 to 2016. A further comparison of the ages of bridegrooms and brides
(see Figure 7 on page 15) shows that in 2016, 85,7% of bridegrooms were older than their brides whilst 9,0%
were younger than their brides, and 5,0% were of the same age as their brides.
2.3 Civil unions
2.3.1 Trends in the registration of civil unions (2012–2016)
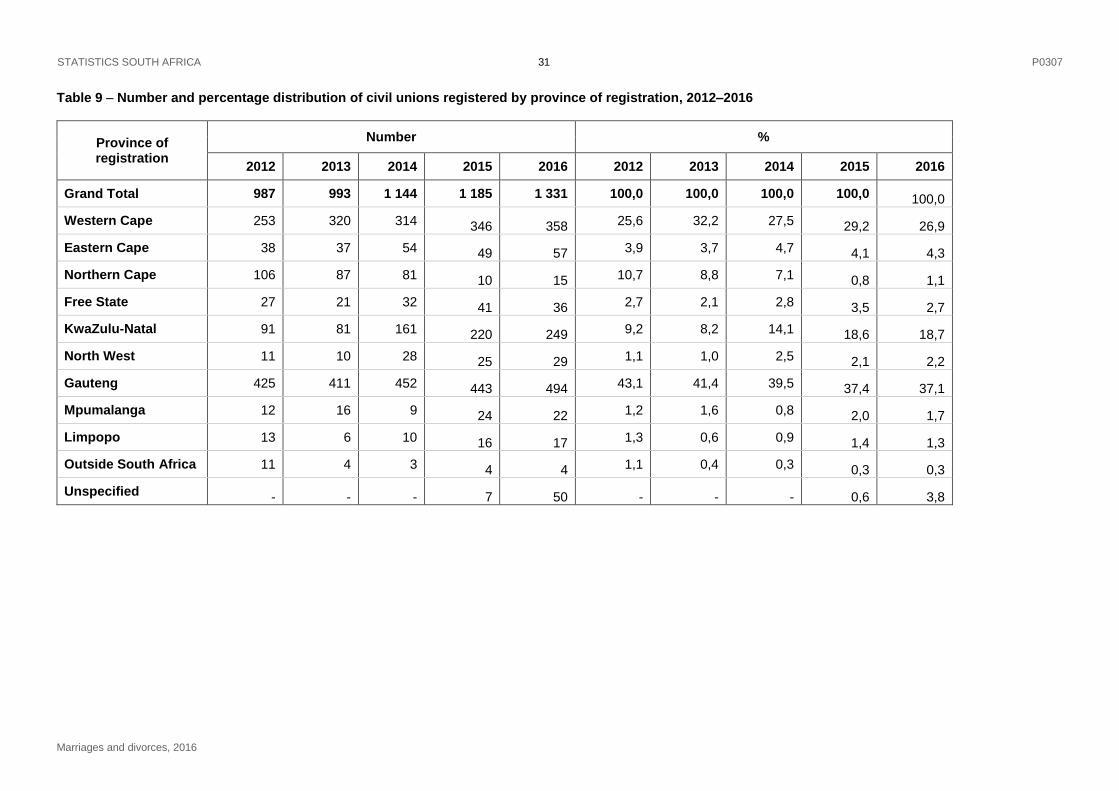
Table 9 on page 31 show that in 2016, 1 331 civil unions were registered (including the registration of four civil
unions of South African citizens and permanent residents living outside South Africa). In 2016, the crude civil
union rate was 0,02 per 1 000 estimated resident population3. In general, the number of civil unions registered
in South Africa increased over the five-year period. Civil unions registered increased by 12,3% from 1 185 in
2015 to 1 331 in 2016. The provincial distribution of civil unions registered in 2016 indicates that Gauteng (494)
and Western Cape (358) were the provinces with the highest number of registrations of civil unions. In total,
64,0% of civil unions in 2016 were registered in these two provinces. The lowest number of registered civil
unions was recorded in Limpopo (17) and Northern Cape (15).
2.3.2 Marital status at the time of civil union
It would be of interest to distinguish between first time spouses and those who had married before (i.e.
divorcees, widows and widowers) and the type of marriage relationship in which they were in. However, this
information is not available at the DHA.
2.3.3 Age at the time of civil union
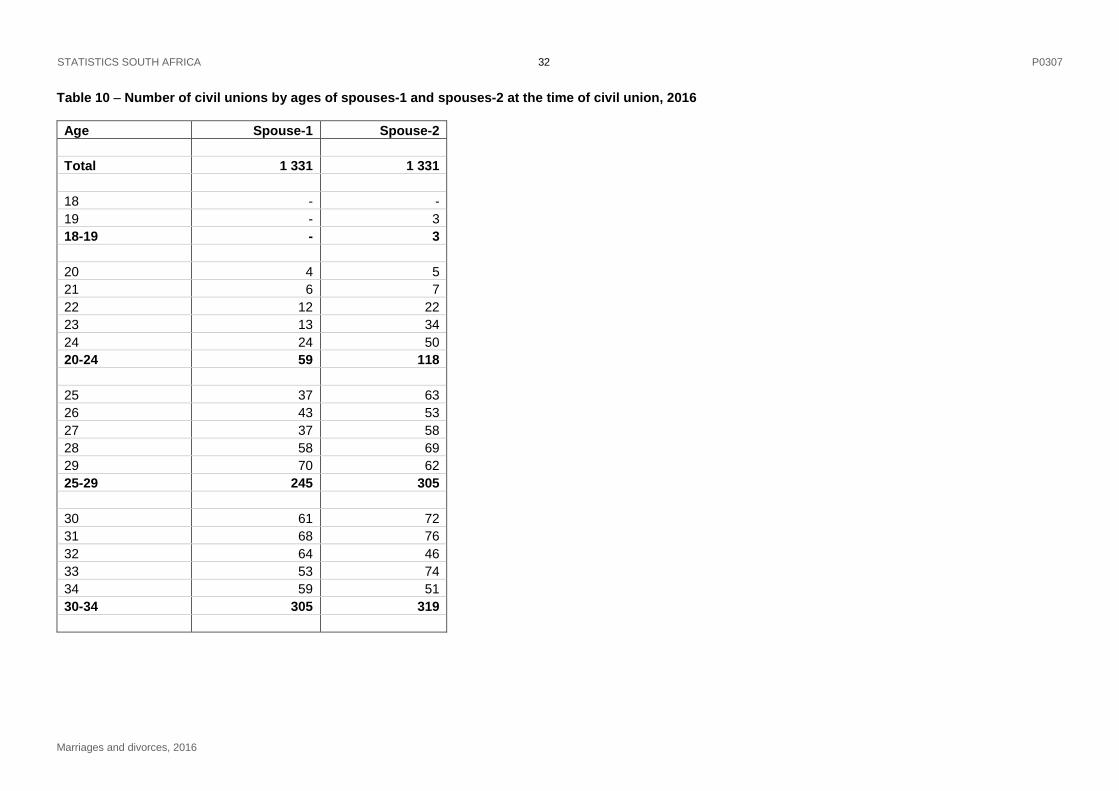
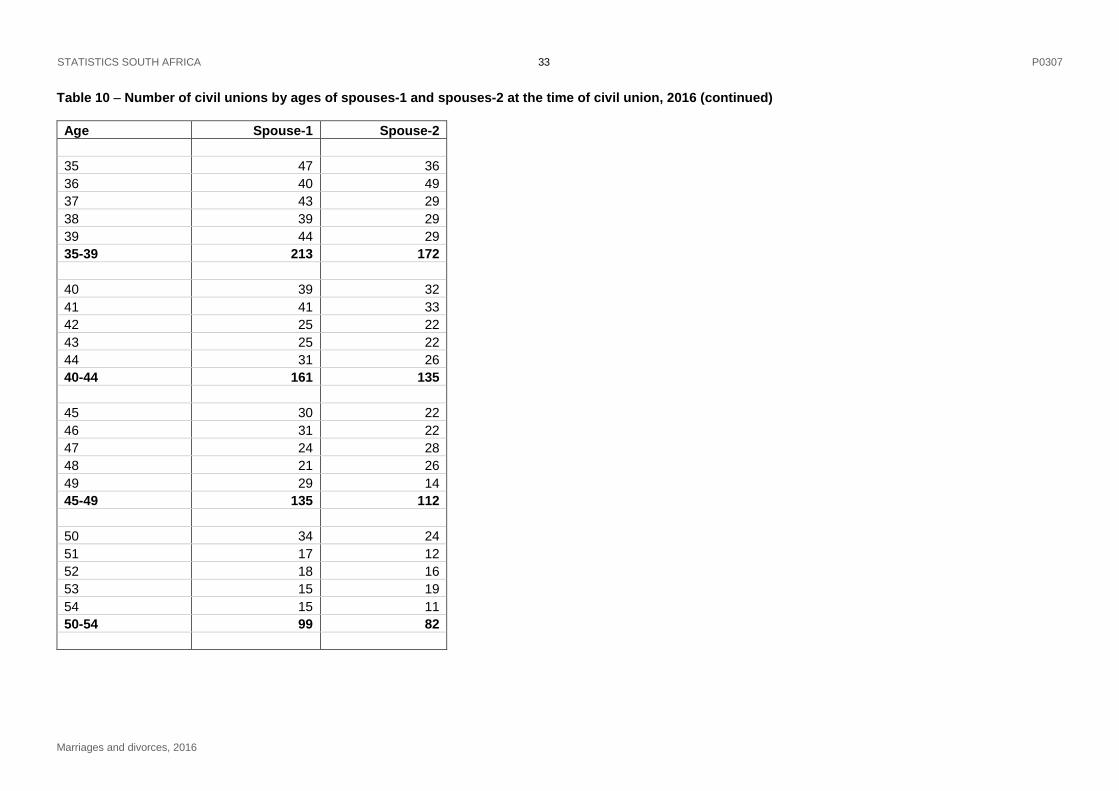
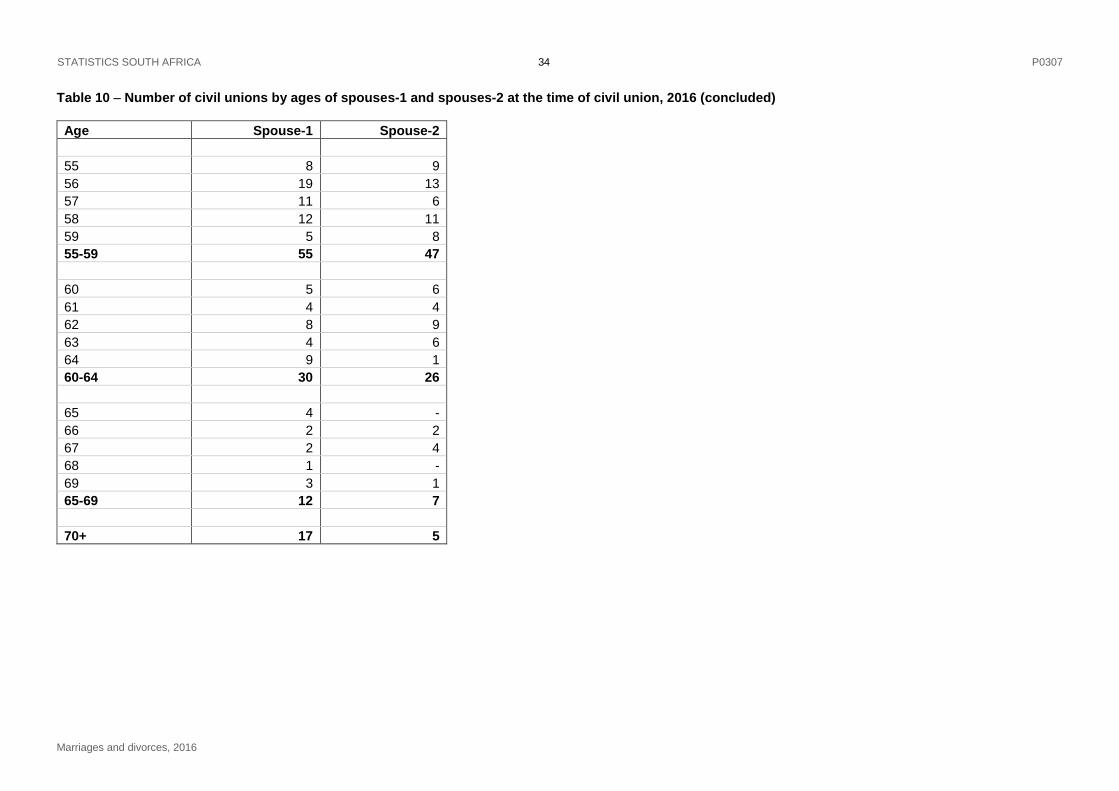
The number of civil unions classified by the ages of spouse-1 and spouse-2 at the time of the solemnisation of
civil union is presented in Table 10 on page 32. Spouses are distinguished as spouse-1 and spouse-2, based
on the information completed by the spouses at the time of civil union registration. It is observed that there were
three spouses-2 that were teenagers aged 19 years.
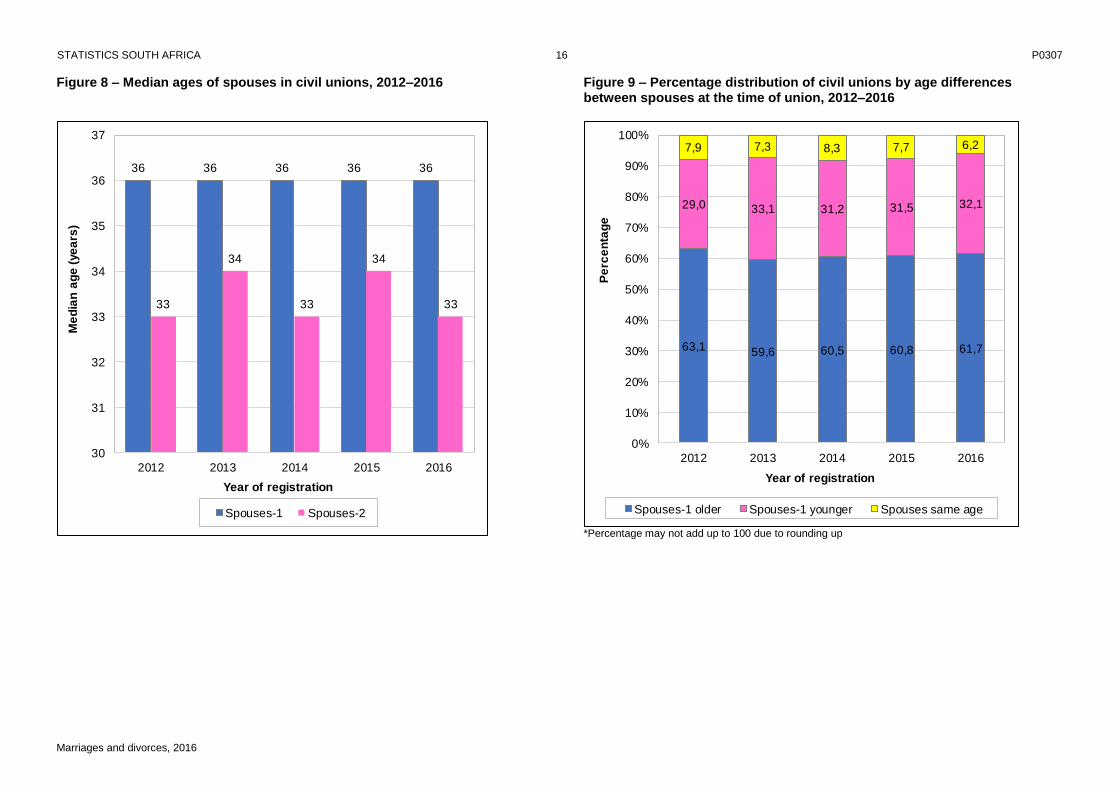
As observed in Figure 8 on page 16, the median ages of spouses-1 remained at 36 years throughout the five-
year period whilst the median ages of spouses-2 were fluctuating between 33 years and 34 years. Furthermore,
the median ages of spouses-1 were higher than those of spouses-2. Over the five-year period, the yearly
differences in the median ages of spouses-1 and spouses-2 ranged between two and three years. Figure 9 on
page 16 further shows that spouses-1 were generally older than spouses-2. In 2016, 61,7% of spouses-1 were
older than their spouses, whilst 32,1% were younger than their spouses and 6,2% were of the same age as their
spouses.
3 The crude civil union rate refers to the number of civil unions per 1 000 persons in the population
STATISTICS SOUTH AFRICA 6 P0307
Marriages and divorces, 2016
3. Divorces
3.1 Trends in divorces (2003 – 2016)
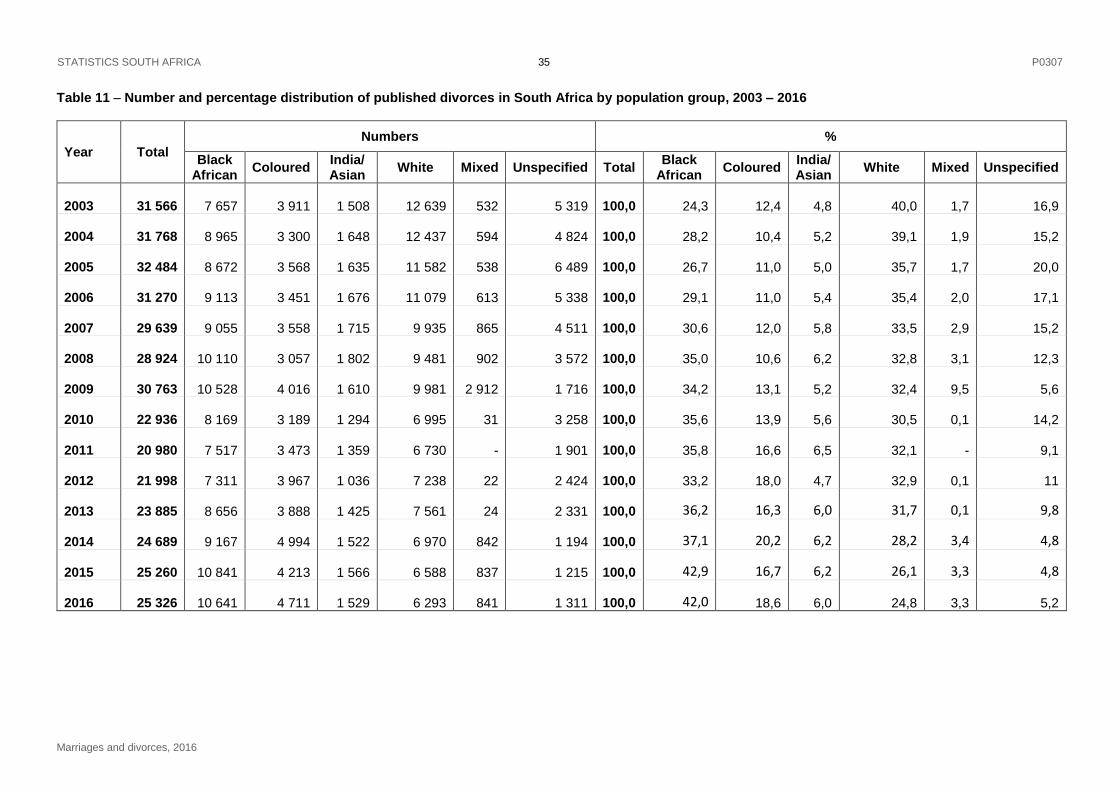
The 2016 divorce data reported in this statistical release are based on 25 326 completed divorce forms that
Stats SA received and processed by the end of December 2017. The observed crude divorce rate was 0,5
divorces per 1 000 estimated resident population in 20164. The number (25 326) indicates an increase of 66
(0,3%) divorces from the 25 260 cases processed in 2015 (see Table 11 on page 35). The table shows that the
total number of divorces generally fluctuated over the period 2003 to 2010 then increased from 2011 to 2016,
with the highest number observed in 2005 (32 484) and the lowest in 2011 (20 980). In 2016, about 48 divorces
were granted for same-sex couples of which 38 were female couples and 10 were male couples.
Table 11 also provides data on divorces classified by population group and the year in which the divorce was
granted. In 2016, the population group of 1 311 couples was not specified. Couples from the white population
group dominated the number of divorces from 2003 to 2007; thereafter, black African couples had the highest
number of divorces up until 2016. In 2003, 40,0% of the divorcees were from the white population group
whereas 24,3% came from the black African population group. By 2016, 42,0% of the divorcees were from the
black African population group and 24,8% from the white population group. The proportions of the divorcees
from the coloured and the Indian/Asian population groups were quite invariable during the thirteen-year period.
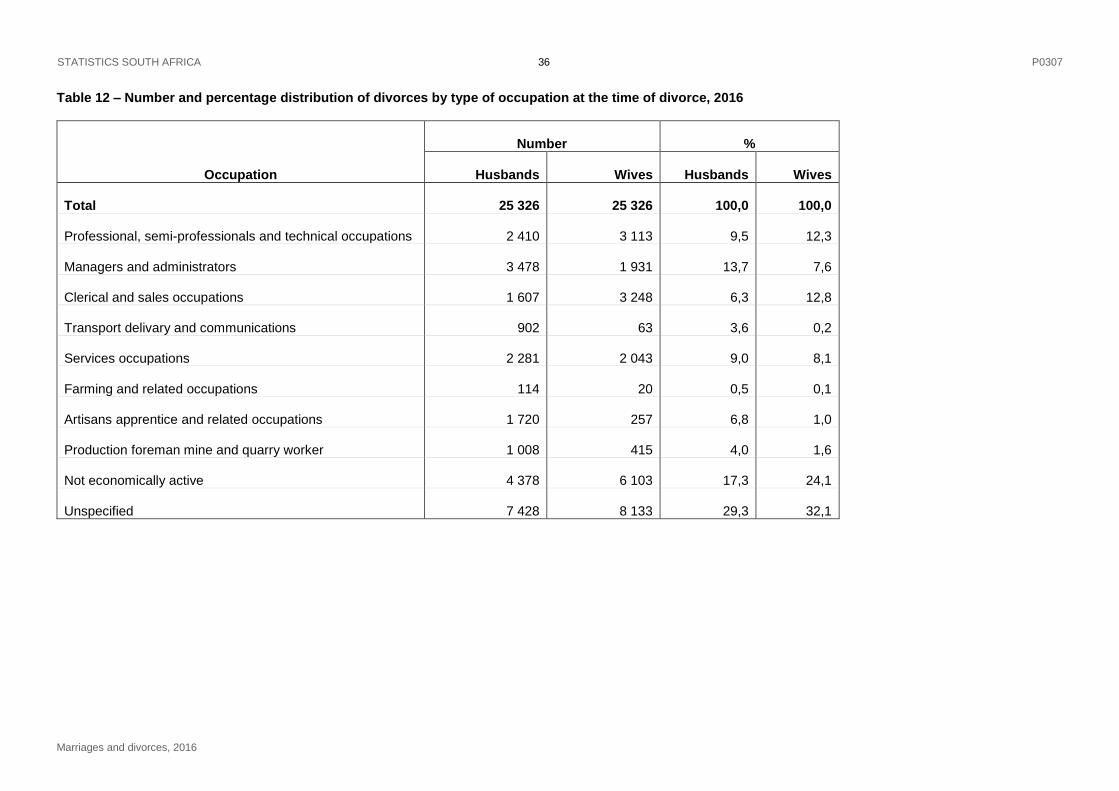
Table 12 on page 36 indicates information on the occupation of husbands and wives at the time of divorce. It is
noted that a high proportion of husbands (29,3%) and wives (32,1%) did not specify the type of occupation they
were engaged in at the time of divorce. In addition, 17,3% and 24,1% of husbands and wives respectively were
not economically active at the time of divorce. Most male divorcees were managers and administrators 3 478
(13,7%) and 2 410 (9,5%) were employed in professional, semi-professional and technical occupations while
female divorcees were largely in clerical and sales occupations 3 248 (12,8%) and professionals, semi-
professionals and technical occupations 3 113 (12,3%).
3.2 Characteristics of plaintiffs
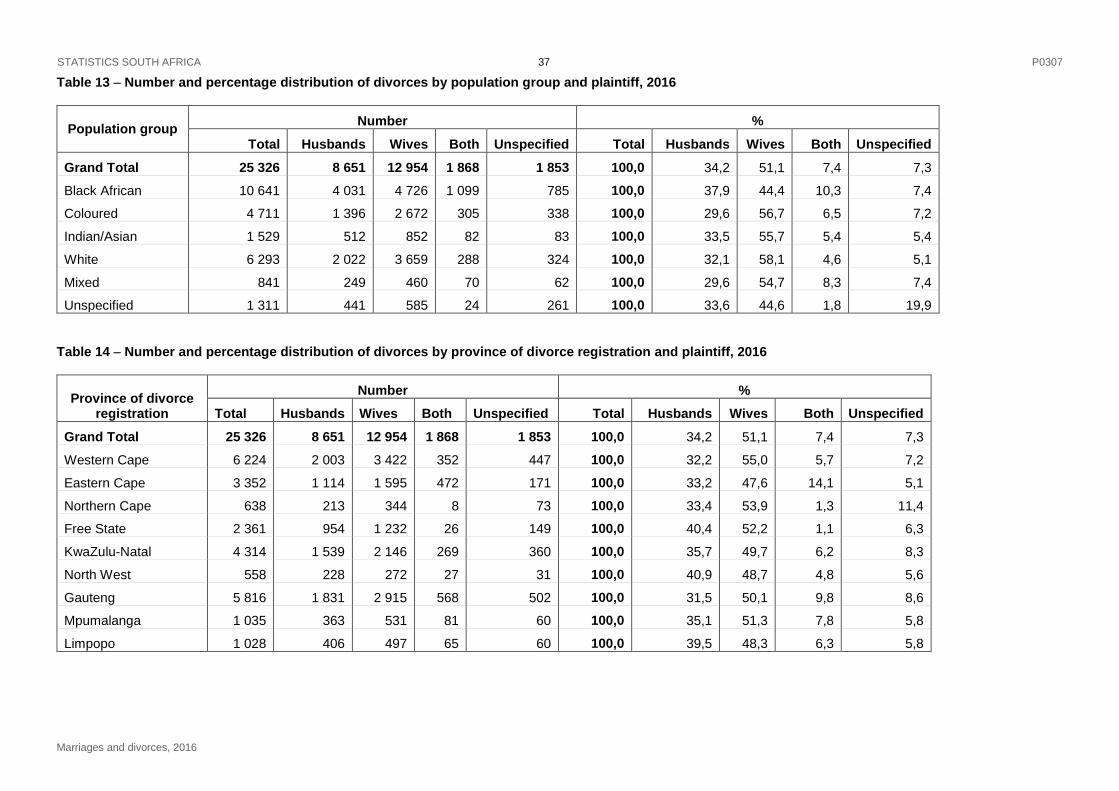
The 2016 data presented in Table 13 on page 37 show that more wives than husbands, 12 954 (51,1%) women
compared to 8 651 (34,2%) men initiated divorce and 1 868 (7,4%) divorces were initiated by both husband and
wife. The sex of the plaintiff was not specified in 1 853 (7,3%) cases. With the exception of women from the
black African population who had a lower proportion of plaintiffs (44,4%), the proportion of women plaintiffs from
the other population groups was above 50,0%. The proportion of women plaintiffs for the white population
group, coloured population group and Indian/Asian population group were 58,1%, 56,7% and 55,7%
respectively. Among black African divorcees, divorce initiated by both partners constituted about 10%.
Table 14 on page 37 provides information on the province and sex of the plaintiff. The provincial distribution
indicates that Western Cape (6 224), Gauteng (5 816), KwaZulu-Natal (4 314) and Eastern Cape (3 352) were
the provinces with the highest number of divorces granted. However this could also be due to the fact that these
provinces have the highest populations. In total, 77,8% of divorces granted in 2016 were from these four
provinces. Eastern Cape (14,1%) and Gauteng (9,8%) show higher proportions of both male and female
divorcees as plaintiffs.
3.3 Number of divorces by way of solemnisation of marriage
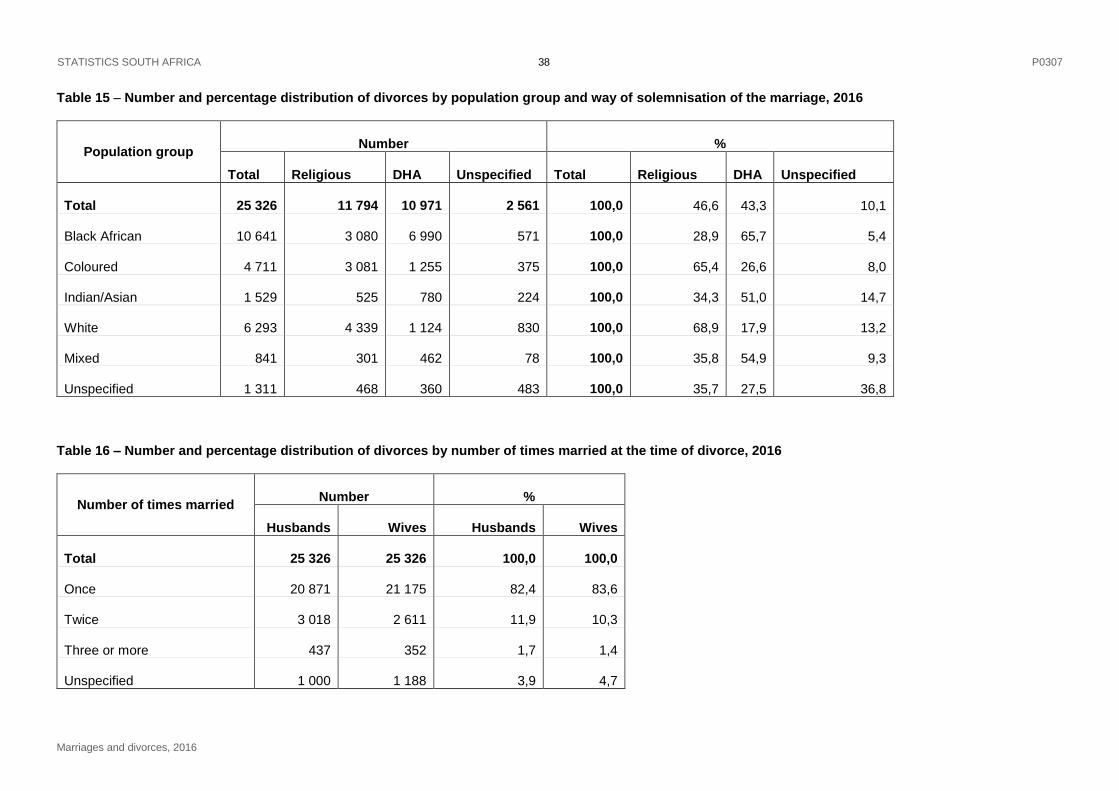
Information presented in Table 15 on page 38 show that 11 794 (46,6%) of the 2016 divorce cases were from
marriages that were solemnised by religious rites and 10 971 (43,3%) by civil rites. Over two-third (68,9%) of
divorces from the white population group and 65,4% of divorces from the coloured population group were from
4 The crude divorce rate refers to the number of divorces per 1 000 persons in the population
STATISTICS SOUTH AFRICA 7 P0307
Marriages and divorces, 2016
marriages that were solemnised by religious rites. Most divorces from the black African and Indian/Asian
population groups were from marriages that were solemnised by civil rites, 65,7% and 51,0% respectively.
3.4 Number of times married
Results presented in Table 16 on page 38 show that the 2016 divorce cases for both men and women were
mainly from individuals who had married once. More than 80,0% of divorces for men and women were from
first-time marriages compared to 11,9% of men and 10,3% of women from second-time marriages. Less than
2,0% of men and women were getting divorced for at least the third time.
3.5 Age at the time of divorce
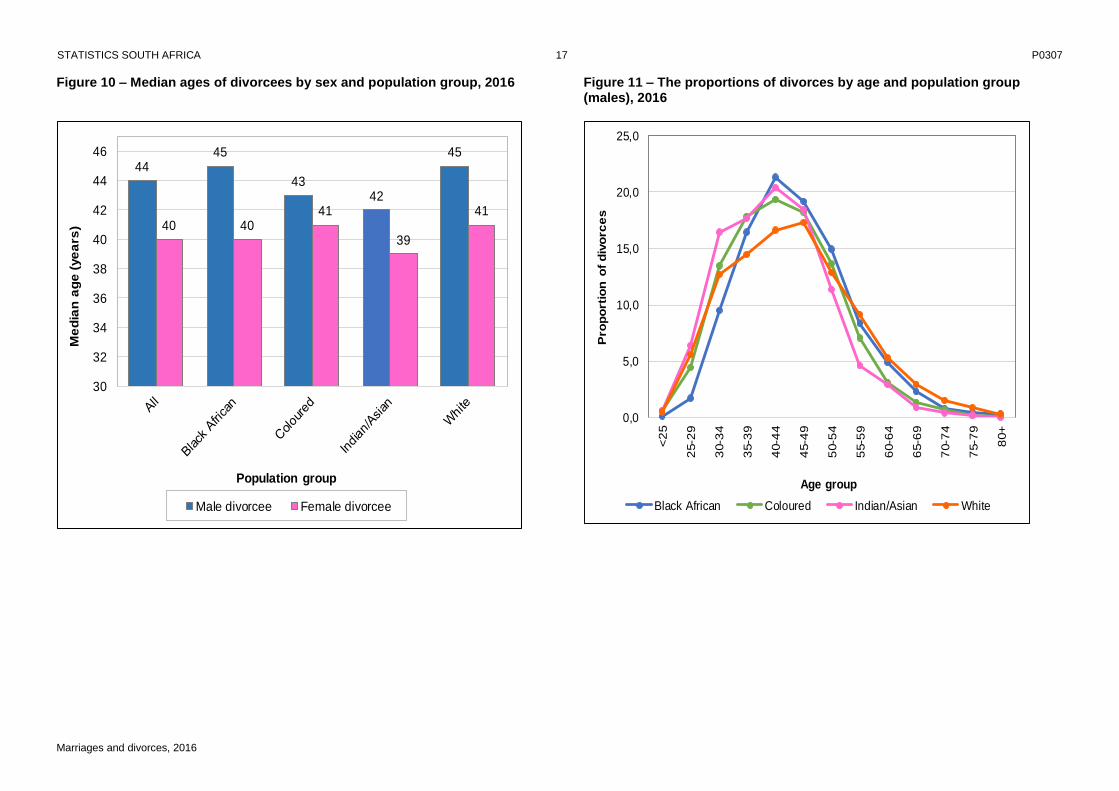
The median ages at the time of divorce in 2016 were 44 years for males and 40 years for females, indicating
that generally, divorced males were older than divorced females, with a difference of about four years (see
Figure 10 on page 17). The pattern of median ages in 2016 by population group showed similar median age for
black African and white males (45 years). The Indian/Asian population group recorded the lowest median ages
in female divorcees at 39 years. The difference in the median ages at the time of divorce between males and
females was greater in the black African population group (five years) compared to the coloured, Indian/Asian
and white population groups.
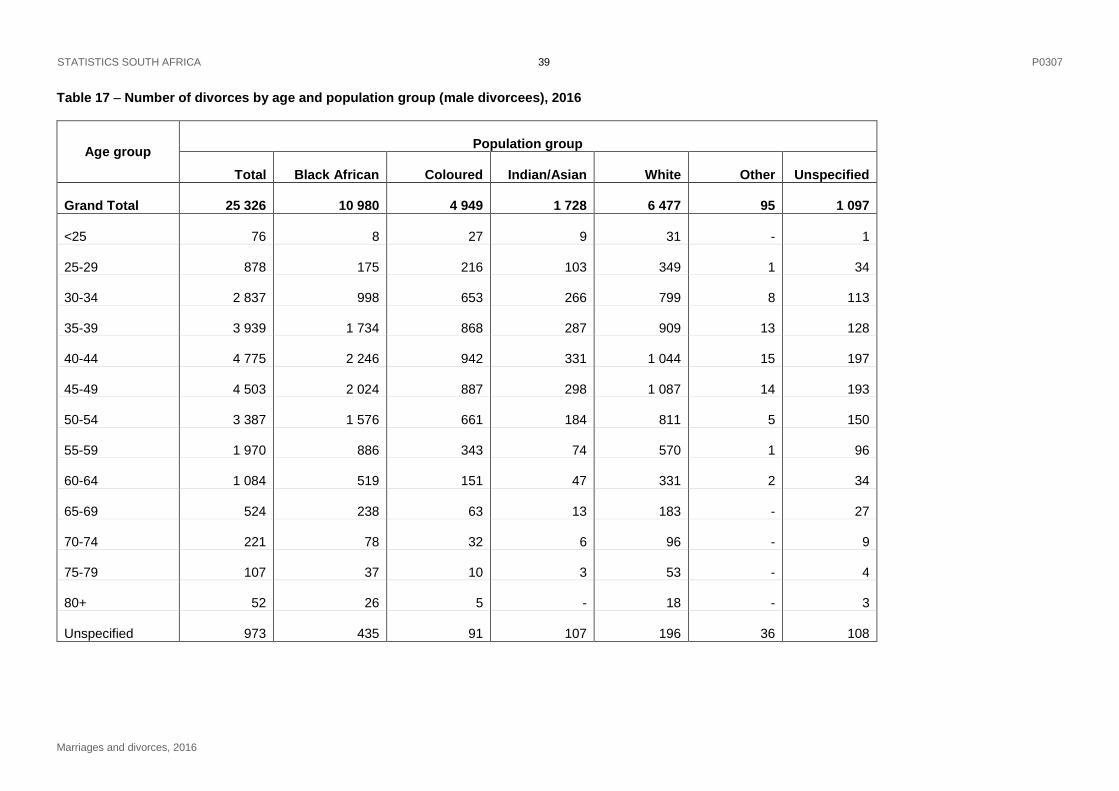
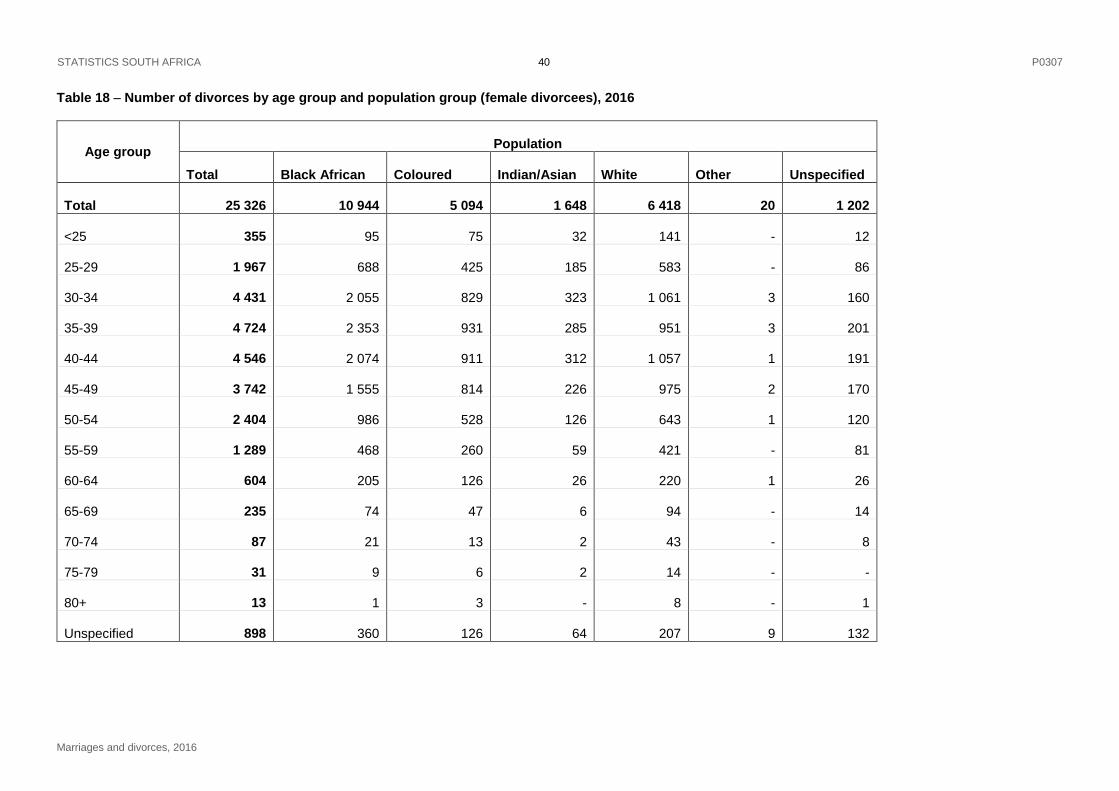
Detailed information on the age and population group of divorcees is presented in Figure 11 on page 17 for
males and in Figure 12 on page 18 for females, as well as in Tables 17 and 18 on pages 39 and 40
respectively. Although there were differences in the ages at which most men and women from the various
population groups divorced, the age patterns were quite similar. The information reveal that there were fewer
divorces among the younger (less than 25 years old) and the older (65 years and older) divorcees. For males,
the peak age group at divorce was 40 to 44 for all population groups (Figure 11), except for the white population
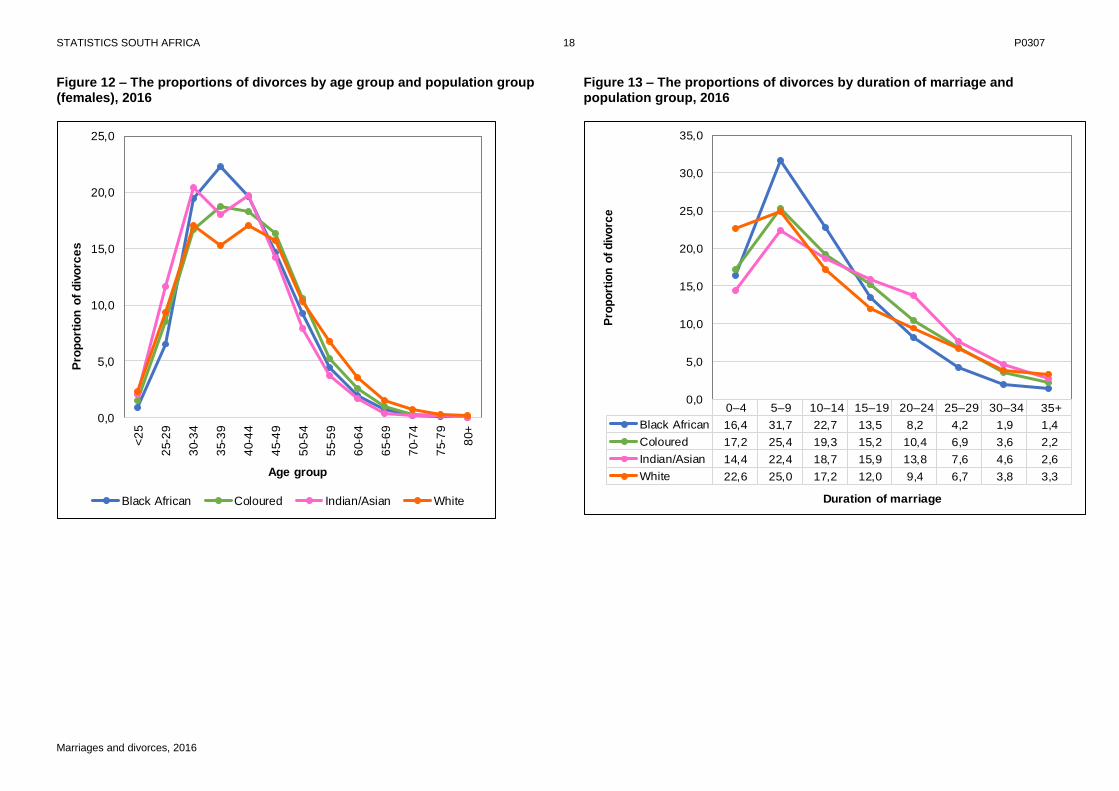
group where the highest peak was from the age group 45 to 49 years. In the case of females, the peak age
group for black African and coloured population groups was 35 to 39 years and the peak for Indian/Asian and
white population groups was 30 to 34 years (Figure 12).
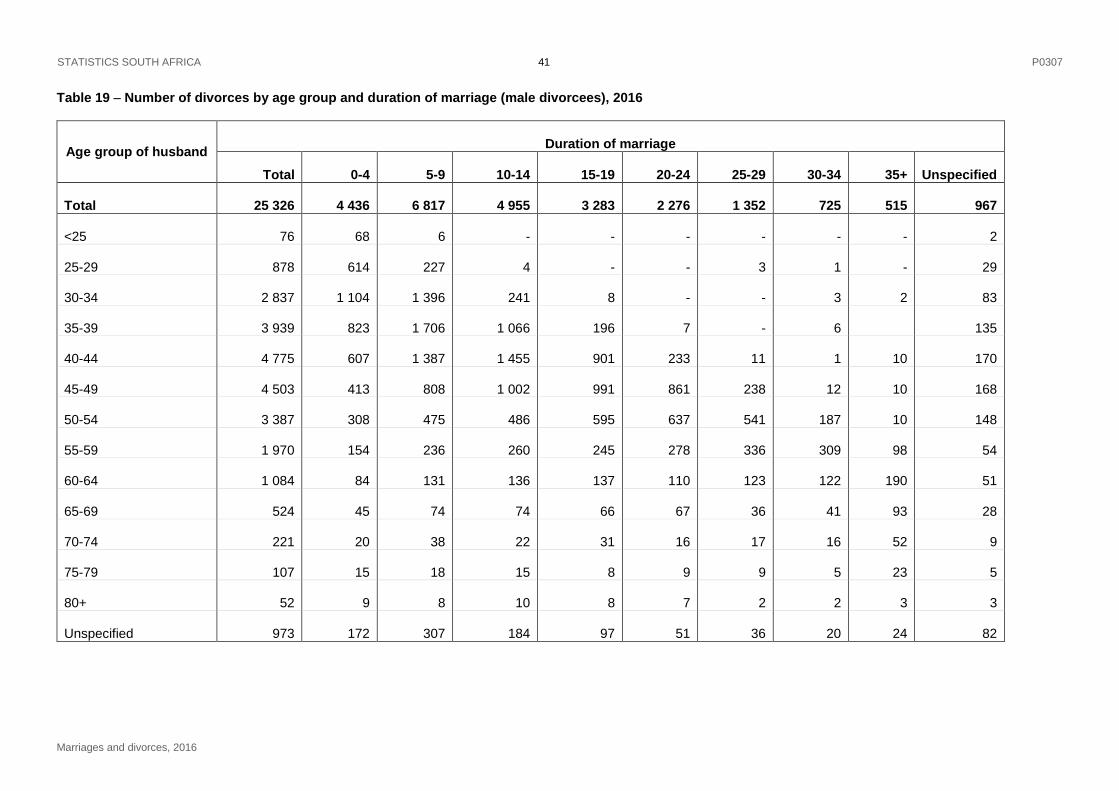
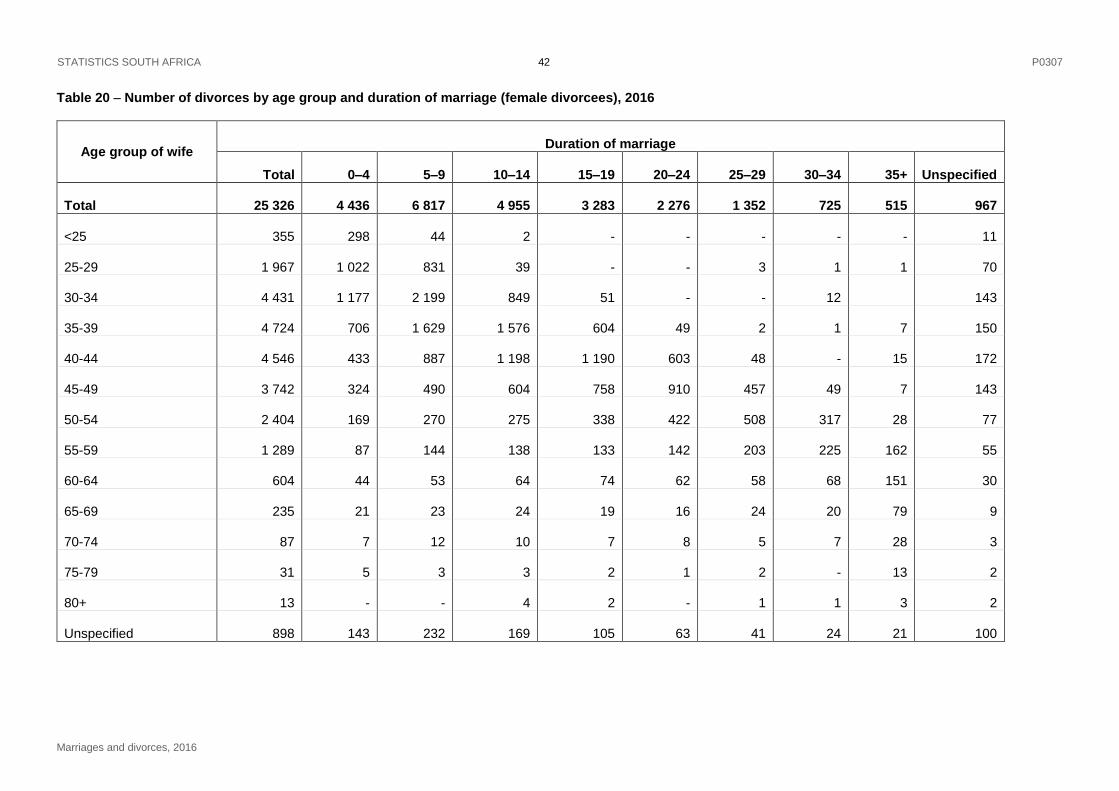
3.6 Duration of marriage of divorcing couples
Statistics from the annual divorce data do not give a comprehensive picture of the number of marriages ending
in divorce. However, there is data on the duration of marriages for the divorces granted in 2016 as shown in
Table 19 on page 41 for men and Table 20 on page 42 for women.
Table 19 on page 41 shows that the largest number [6 817 (26,9%)] of divorces among males were for
marriages that lasted between five and nine years. This group is followed by marriages that lasted between ten
and fourteen years [4 955 (19,6%)] and marriages that lasted for less than five years [4 436 (17,5%)]. Results
showed that four in ten divorces (44,4%) of the 25 326 in 2016 were marriages that lasted for less than 10
years.
According to results given in Figure 13 on page 18, irrespective of the population group, the highest proportion
of divorces occurred to couples who had been married for five to nine years. Population group variations
showed that 31,7% of divorces from the black African; 25,4% from coloured; 25,0% from white and 22,4% from
Indian/Asian population groups were marriages that lasted between five and nine years. The white population
had the highest proportion (22,6%) of divorces that occurred in the first five years. The proportion of divorces in
all population groups declined as the duration of marriage increased, with a significant decline being observed
after nine years of marriage.
STATISTICS SOUTH AFRICA 8 P0307
Marriages and divorces, 2016
3.7 Divorces involving couples with minor children
In 2016, 13 922 (55,0%) of the 25 326 divorces had children younger than 18 years (see Table 21 on page 43).
Looking at the coloured divorcees, proportion of divorces involving couples with minor children constituted about
62,0%. The profile of white divorcees showed that more than half of the recorded divorces were without children
(54,4%). Table 22 on page 43 shows that 45,5% of children affected by divorce were from the black African
population group; 21,7% from the coloured population group; 20,0% from the white population group and 5,5%
from the Indian/Asian population group.
4. Summary and concluding remarks
This statistical release provided information on civil and customary marriages, civil unions and divorces for
2016, based on data from the South African national marriage registration systems of the Department of Home
Affairs (DHA) and data of divorces granted by the Department of Justice and Constitutional Development. The
information on marriages and divorces is important for understanding the formation and dissolution of marriage
relationships and implications on the household structure and composition.
In total, 139 512 civil marriages were registered in South Africa in 2016, most (57,9%) of which were solemnised
by DHA marriage officers. The highest number of civil marriages was registered in Gauteng (36 413), followed
by KwaZulu-Natal (21 440) and Western Cape (20 565), and the lowest was registered in Northern Cape
(4 278). The majority of civil marriages in 2016 for both bridegrooms (113 738) and brides (120 501) were first
time marriages, with women generally entering into marriage at younger ages than men.
The number of registered customary marriages was 3 978 in 2016, which increased by 14,7% from a total of
3 467 recorded in 2015. The majority (85,7%) of bridegrooms were older than their brides, with the gap in
median ages at customary marriage much wider than other types of marriages. The number of registered civil
unions in South Africa in 2016 was 1 331, most of which were registered in Gauteng (494) and Western Cape
(358), and lowest in Limpopo (17) and Northern Cape (15).
With regard to divorces, the data showed that 25 326 divorces were granted in South Africa in 2016. Generally,
there was an increase in the proportion of divorces for black Africans and decline for white population group
from 2003 to 2016. Divorces were mainly from people who had married for the first time. There were more wives
than husband plaintiffs, with husbands generally getting divorced at a later age than wives. The provincial
distribution shows that Western Cape (6 224), Gauteng (5 816), KwaZulu-Natal (4 314) and Eastern Cape
(3 352) were the provinces with the highest number of divorces granted. About 22 750 children aged less than
18 years were affected by divorces that took place in 2016.
Overall, the information provided in this release showed fluctuations over time in the number of marriages,
unions and divorces in the country. Areas of improvement in the quality of data were noted, particularly relating
to completeness of information pertaining to unspecified province of registration, way of solemnisation and
marital status at time of marriage for the data on marriages and civil unions; and unspecified population group
and occupation of the divorcees.
STATISTICS SOUTH AFRICA 9 P0307
Marriages and divorces, 2016
Figure 1 – Number of civil marriages by month of solemnisation, 2012–2016
Jan Feb Mar Apr May Jun Jul Aug Sep Oct Nov Dec
2012 10 866 11 351 14 359 12 941 10 928 10 466 9 850 10 689 14 272 13 491 14 761 27 138
2013 10 106 10 360 13 873 12 805 10 905 10 218 9 776 11 183 13 455 13 507 15 735 26 719
2014 9 526 10 331 13 203 12 107 10 271 9 384 9 975 10 272 12 245 13 686 14 960 24 892
2015 9 401 10 340 11 903 11 795 10 482 8 696 9 086 9 836 11 977 13 500 13 268 18 343
2016 9 077 10 360 11 801 12 498 9 980 9 177 9 855 9 609 12 118 13 677 13 098 18 262
5 000
10 000
15 000
20 000
25 000
30 000
Nu
mb
er
of
civ
il m
arr
iag
es
Month of solemnisation
STATISTICS SOUTH AFRICA 10 P0307
Marriages and divorces, 2016
Figure 2 – Number of civil marriages for bachelors and spinsters by age group, 2016
<15 15–19 20–24 25–29 30–34 35–39 40–44 45–49 50–54 55–59 60–64 65–69 70+
Bachelor 0 101 5 357 24 137 30 418 21 937 14 623 7 760 4 226 2 245 1 493 773 666
Spinster 3 1 000 15 177 35 632 30 474 17 452 10 112 5 091 2 888 1 395 758 288 231
0
5000
10000
15000
20000
25000
30000
35000
40000
Nu
mb
er
of
civ
il m
arr
iag
es
Age group
Excluding two cases with unspecified bachelors age
STATISTICS SOUTH AFRICA 11 P0307
Marriages and divorces, 2016
Figure 3a – Median ages of bridegrooms and brides at the time of civil Figure 3b – Median ages of bachelors and spinsters at the time of civil marriage, 2012–2016 marriage, 2012–2016
34
35 35
36 36
30 30
31 31
32
27
28
29
30
31
32
33
34
35
36
37
38
2012 2013 2014 2015 2016
Me
dia
n a
ge
(ye
ars
)
Year of registration
Bridegrooms Brides
33 33 33
34 34
29
30 30 30
31
26
27
28
29
30
31
32
33
34
35
2012 2013 2014 2015 2016
Me
dia
n a
ge
(ye
ars
)
Year of registration
Bachelors Spinters
STATISTICS SOUTH AFRICA 12 P0307
Marriages and divorces, 2016
Figure 3c – Median ages of widowers and widows at the time of civil marriage, 2012–2016
49 50 49
5254
30 30 29
3230
0
10
20
30
40
50
60
2012 2013 2014 2015 2016
Me
dia
n a
ge
(ye
ars
)
Year of registration
Widowers Widows
Figure 3d – Median ages of male and female divorcees at the time of civil marriage, 2012–2016
52
53
54
55 55
47
48 48 48
49
42
44
46
48
50
52
54
56
58
2012 2013 2014 2015 2016
Me
dia
n a
ge
(ye
ars
)
Year of registration
Male divorcees Female divorcees
STATISTICS SOUTH AFRICA 13 P0307
Marriages and divorces, 2016
Figure 4a – Percentage distribution of civil marriages by age differences between spouses and marital status at the time of marriage (bachelors), 2016
76,8 78,2
51,2
14,5 14,4
43,2
8,7 7,4 5,6
0%
10%
20%
30%
40%
50%
60%
70%
80%
90%
100%
B-S B-W B-D
Pe
rce
nta
ge
Bridegroom older Bridegroom younger Spouses same age
*Percentage may not add up to 100 due to rounding up B – S = Bachelor to Spinster B – D = Bachelor to Divorcee B – W = Bachelor to Widow
Figure 4b – Percentage distribution of civil marriages by age differences between spouses and marital status at the time of marriage (widowers), 2016
88,983,1 81,3
7,2
9,79,4
3,97,2 9,4
0%
10%
20%
30%
40%
50%
60%
70%
80%
90%
100%
W-S W-W W-D
Pe
rce
nta
ge
Bridegroom older Bridegroom younger Spouses same age
*Percentage may not add up to 100 due to rounding up
W – S = Widower to Spinster W – D = Widower to Divorcee W – W = Widower to Widow
STATISTICS SOUTH AFRICA 14 P0307
Marriages and divorces, 2016
Figure 4c – Percentage distribution of civil marriages by age differences between spouses and marital status at the time of marriage (male divorcees), 2016
93,6
81,6 78,9
4,8
5,316,6
1,6
13,2
4,4
0%
10%
20%
30%
40%
50%
60%
70%
80%
90%
100%
D-S D-W D-D
Pe
rce
nta
ge
Bridegroom older Bridegroom younger Spouses same age
*Percentage may not add up to 100 due to rounding up
D – S = Divorcee to Spinster D – D = Divorcee to Divorcee D – W = Divorcee to Widow
Figure 5 – Percentage distribution of customary marriages by year of marriage and time it took to register the marriage, 2012–2016
84,9 81,476,0
79,885,3
15,1 18,624,0
20,214,4
0%
10%
20%
30%
40%
50%
60%
70%
80%
90%
100%
2012 2013 2014 2015 2016
Pe
rce
nta
ge
Year of registration
Later than year of marriage Same year of marriage
*Excluding 0,3% of unspecified year of registration in 2016
*Percentage may not add up to 100 due to rounding up
STATISTICS SOUTH AFRICA 15 P0307
Marriages and divorces, 2016
Figure 6 – Median ages of bridegrooms and brides at the time of customary marriage, 2012–2016
33 3334 34
33
2728
2928
27
0
5
10
15
20
25
30
35
40
2012 2013 2014 2015 2016
Me
dia
n a
ge
(ye
ars
)
Year of registration
Bridegrooms Brides
Figure 7 – Percentage distribution of customary marriages by age differences between spouses at the time of marriage, 2012–2016
83,6 84,2 85,0 84,8 85,7
10,4 10,6 10,4 9,7 9,0
6,0 5,2 4,5 5,5 5,0
0%
10%
20%
30%
40%
50%
60%
70%
80%
90%
100%
2012 2013 2014 2015 2016
Pe
rce
nta
ge
Year of registration
Bridegroom older Bridegroom younger Spouses same age
Excluding 0,1% and 0,3% of unspecified age difference in 2014 and 2016 respectively
STATISTICS SOUTH AFRICA 16 P0307
Marriages and divorces, 2016
Figure 8 – Median ages of spouses in civil unions, 2012–2016
36 36 36 36 36
33
34
33
34
33
30
31
32
33
34
35
36
37
2012 2013 2014 2015 2016
Me
dia
n a
ge
(ye
ars
)
Year of registration
Spouses-1 Spouses-2
Figure 9 – Percentage distribution of civil unions by age differences between spouses at the time of union, 2012–2016
63,1 59,6 60,5 60,8 61,7
29,0 33,1 31,2 31,5 32,1
7,9 7,3 8,3 7,7 6,2
0%
10%
20%
30%
40%
50%
60%
70%
80%
90%
100%
2012 2013 2014 2015 2016
Pe
rce
nta
ge
Year of registration
Spouses-1 older Spouses-1 younger Spouses same age
*Percentage may not add up to 100 due to rounding up
STATISTICS SOUTH AFRICA 17 P0307
Marriages and divorces, 2016
Figure 10 – Median ages of divorcees by sex and population group, 2016
4445
4342
45
40 4041
39
41
30
32
34
36
38
40
42
44
46
Me
dia
n a
ge
(ye
ars
)
Population group
Male divorcee Female divorcee
Figure 11 – The proportions of divorces by age and population group (males), 2016
0,0
5,0
10,0
15,0
20,0
25,0
<2
5
25-2
9
30-3
4
35-3
9
40-4
4
45-4
9
50-5
4
55-5
9
60-6
4
65-6
9
70-7
4
75-7
9
80+
Pro
po
rtio
n o
f d
ivo
rce
s
Age group
Black African Coloured Indian/Asian White
STATISTICS SOUTH AFRICA 18 P0307
Marriages and divorces, 2016
Figure 12 – The proportions of divorces by age group and population group (females), 2016
0,0
5,0
10,0
15,0
20,0
25,0<
25
25-2
9
30-3
4
35-3
9
40-4
4
45-4
9
50-5
4
55-5
9
60-6
4
65-6
9
70-7
4
75-7
9
80+
Pro
po
rtio
n o
f d
ivo
rce
s
Age group
Black African Coloured Indian/Asian White
Figure 13 – The proportions of divorces by duration of marriage and population group, 2016
0–4 5–9 10–14 15–19 20–24 25–29 30–34 35+
Black African 16,4 31,7 22,7 13,5 8,2 4,2 1,9 1,4
Coloured 17,2 25,4 19,3 15,2 10,4 6,9 3,6 2,2
Indian/Asian 14,4 22,4 18,7 15,9 13,8 7,6 4,6 2,6
White 22,6 25,0 17,2 12,0 9,4 6,7 3,8 3,3
0,0
5,0
10,0
15,0
20,0
25,0
30,0
35,0
Pro
po
rtio
n o
f d
ivo
rce
Duration of marriage
STATISTICS SOUTH AFRICA 19 P0307
Marriages and divorces, 2016
Table 1 – Number of registered civil marriages in South Africa, 2003 – 2016
Year of registration Number of civil marriages
2003
178 689
2004
176 521
2005
180 657
2006
184 860
2007
183 030
2008
186 522
2009
171 989
2010
170 826
2011
167 264
2012
161 112
2013
158 642
2014
150 852
2015 138 627
2016 139 512
STATISTICS SOUTH AFRICA 20 P0307
Marriages and divorces, 2016
Table 2 – Number and percentage distribution of civil marriages by province of marriage registration and way of solemnisation, 2016
Province of registration Way of solemnisation %
Total DHA Religious Unspecified Total DHA Religious Unspecified
Total 139 512 80 748 43 359 15 405 100,0 57,9 31,1 11,0
Western Cape 20 565 9 671 10 034 860 100,0 47,0 48,8 4,2
Eastern Cape 15 438 8 091 5 463 1 884 100,0 52,4 35,4 12,2
Northern Cape 4 278 1 986 1 084 1 208 100,0 46,4 25,3 28,2
Free State 9 219 7 146 1 900 173 100,0 77,5 20,6 1,9
KwaZulu-Natal 21 440 12 419 6 636 2 385 100,0 57,9 31,0 11,1
North West 9 699 7 775 1 772 152 100,0 80,2 18,3 1,6
Gauteng 36 413 21 363 10 419 4 631 100,0 58,7 28,6 12,7
Mpumalanga 7 663 3 285 2 013 2 365 100,0 42,9 26,3 30,9
Limpopo 9 409 6 933 979 1 497 100,0 73,7 10,4 15,9
Outside RSA 372 336 30 6 100,0 90,3 8,1 1,6
Unknown 118 68 43 7 100,0 57,6 36,4 5,9
Unspecified 4 898 1 675 2 986 237 100,0 34,2 61,0 4,8
STATISTICS SOUTH AFRICA 21 P0307
Marriages and divorces, 2016
Table 3 – Number of civil marriages by province of registration and marital status of bridegrooms and brides at the time of marriage, 2016
Province of registration
Bridegroom Bride
Total Bachelor Divorcee Widower Unspecified Total Spinster Divorcee Widow Unspecified
Total 139 512 113 738 5 151 1 343 19 280 139 512 120 501 3 337 1 044 14 630
Western Cape 20 565 16 152 762 23 3 628 20 565 17 025 616 23 2 901
Eastern Cape 15 438 12 786 634 128 1 890 15 438 13 759 371 83 1 225
Northern Cape 4 278 3 529 192 23 534 4 278 3 738 155 24 361
Free State 9 219 7 589 394 91 1 145 9 219 7 983 248 135 853
KwaZulu-Natal 21 440 18 008 763 304 2 365 21 440 19 158 378 184 1 720
North West 9 699 8 069 397 49 1 184 9 699 8 508 246 54 891
Gauteng 36 413 28 905 1 187 380 5 941 36 413 30 465 864 315 4 769
Mpumalanga 7 663 6 314 311 131 907 7 663 6 704 166 96 697
Limpopo 9 409 8 091 316 182 820 9 409 8 689 148 99 473
Outside RSA 372 304 15 - 53 372 312 6 - 54
Unknown 118 93 6 4 15 118 95 6 4 13
Unspecified 4 898 3 898 174 28 798 4 898 4 065 133 27 673
STATISTICS SOUTH AFRICA 22 P0307
Marriages and divorces, 2016
Table 4 – Number of civil marriages by age differences between spouses at the time of marriage and marital status of husband, 2016
Age difference
Bachelor to Divorcee to
Grand total Total Spinster Divorcee Widow Unspecified Total Spinster Divorcee Widow Unspecified
Total 139 512 113 738 106 854 1 140 769 4 975 5 151 3 009 902 38 1 202
Bridegroom Older 106 635 85 513 82 063 584 601 2 265 4 543 2 817 712 31 983
Bridegroom Younger 21 919 18 406 15 499 492 111 2 304 467 145 150 2 170
Same Age 10 956 9 817 9 290 64 57 406 141 47 40 5 49
Unspecified 2 2 2 - - - - - - - -
Age difference
Widower to Unspecified to
Total Spinster Divorcee Widow Unspecified Total Spinster Divorcee Widow Unspecified
Total 1 343 1 075 32 195 41 19 280 9 563 1 263 42 8 412
Bridegroom Older 1 183 956 26 162 39 15 396 8 500 839 36 6 021
Bridegroom Younger 101 77 3 19 2 2 945 748 362 4 1 831
Same Age 59 42 3 14 - 939 315 62 2 560
Unspecified - - - - - - - - - -
STATISTICS SOUTH AFRICA 23 P0307
Marriages and divorces, 2016
Table 5 – Number of marriages by ages of bridegrooms and brides and marital status at the time of marriage, 2016
Age Bridegrooms Brides
Total Bachelor Divorcee Widower Unspecified Total Spinster Divorcee Widow Unspecified
Total 139 512 113 738 5 151 1 343 19 280 139 512 120 501 3 337 1 044 14 630
<18 4 3 - - 1 99 94 2 2 1
18 20 20 - - - 266 253 - 11 2
19 81 78 1 2 - 685 656 3 25 1
18-19 101 98 1 2 - 951 909 3 36 3
20 184 184 - - - 1 168 1 132 3 31 2
21 444 441 - 2 1 1 943 1 889 6 42 6
22 844 833 - 9 2 2 821 2 759 7 44 11
23 1 583 1 559 1 21 2 4 154 4 087 2 48 17
24 2 375 2 340 2 28 5 5 401 5 310 4 54 33
20-24 5 430 5 357 3 60 10 15 487 15 177 22 219 69
25 3 497 3 447 4 26 20 6 724 6 585 8 62 69
26 4 383 4 304 3 50 26 7 499 7 301 7 60 131
27 5 148 5 068 4 31 45 7 749 7 532 16 46 155
28 5 694 5 575 6 31 82 7 471 7 208 13 48 202
29 5 904 5 743 5 35 121 7 332 7 006 20 33 273
25-29 24 626 24 137 22 173 294 36 775 35 632 64 249 830
30 6 304 6 113 9 32 150 7 389 7 023 38 27 301
31 6 683 6 395 22 25 241 7 147 6 700 30 25 392
32 6 447 6 107 22 28 290 6 638 6 156 35 17 430
33 6 338 5 950 19 21 348 6 032 5 481 49 16 486
34 6 332 5 853 28 13 438 5 715 5 114 41 11 549
30-34 32 104 30 418 100 119 1 467 32 921 30 474 193 96 2 158
STATISTICS SOUTH AFRICA 24 P0307
Marriages and divorces, 2016
Table 5 – Number of marriages by ages of bridegrooms and brides and marital status at the time of marriage, 2016 (continued)
Age Bridegrooms Brides
Total Bachelor Divorcee Widower Unspecified Total Spinster Divorcee Widow Unspecified
35 5 583 5 107 29 10 437 4 959 4 376 42 11 530
36 5 266 4 736 41 10 479 4 497 3 953 68 10 466
37 4 932 4 370 52 10 500 4 083 3 475 66 8 534
38 4 507 3 864 58 7 578 3 489 2 857 65 11 556
39 4 571 3 860 64 8 639 3 428 2 791 85 5 547
35-39 24 859 21 937 244 45 2 633 20 456 17 452 326 45 2 633
40 4 215 3 493 76 5 641 3 135 2 477 91 1 566
41 3 994 3 141 102 3 748 2 879 2 248 87 - 544
42 3 869 3 017 92 5 755 2 763 2 014 121 4 624
43 3 379 2 487 104 3 785 2 356 1 695 98 1 562
44 3 371 2 485 117 3 766 2 413 1 678 124 3 608
40-44 18 828 14 623 491 19 3 695 13 546 10 112 521 9 2 904
45 2 689 1 819 140 2 728 1 852 1 187 107 - 558
46 2 920 1 963 140 4 813 1 935 1 236 129 4 566
47 2 453 1 495 148 11 799 1 590 966 100 2 522
48 2 317 1 412 134 17 754 1 607 972 137 6 492
49 1 956 1 071 161 30 694 1 271 730 108 9 424
45-49 12 335 7 760 723 64 3 788 8 255 5 091 581 21 2 562
50 1 989 1 030 187 34 738 1 301 706 122 10 463
51 1 821 945 147 36 693 1 134 676 100 12 346
52 1 726 807 177 48 694 1 054 550 113 18 373
53 1 588 775 193 63 557 988 533 102 31 322
54 1 461 669 174 65 553 838 423 110 23 282
50-54 8 585 4 226 878 246 3 235 5 315 2 888 547 94 1 786
STATISTICS SOUTH AFRICA 25 P0307
Marriages and divorces, 2016
Table 5 – Number of marriages by ages of bridegrooms and brides and marital status at the time of marriage, 2016 (concluded)
Age Bridegrooms Brides
Total Bachelor Divorcee Widower Unspecified Total Spinster Divorcee Widow Unspecified
55 1 236 535 157 56 488 659 319 85 17 238
56 1 252 550 163 44 495 682 338 79 29 236
57 983 367 171 46 399 554 280 71 24 179
58 1 077 452 151 60 414 517 243 74 34 166
59 876 341 133 47 355 421 215 63 25 118
55-59 5 424 2 245 775 253 2 151 2 833 1 395 372 129 937
60 890 379 142 51 318 469 247 66 20 136
61 720 293 135 50 242 346 147 76 25 98
62 661 281 133 35 212 262 113 50 17 82
63 612 273 140 29 170 272 132 56 12 72
64 597 267 129 35 166 244 119 40 14 71
60-64 3 480 1 493 679 200 1 108 1 593 758 288 88 459
65 494 204 113 27 150 180 75 48 8 49
66 485 198 131 24 132 166 74 38 8 46
67 386 143 106 24 113 168 56 60 11 41
68 313 120 87 13 93 126 47 35 10 34
69 280 108 89 7 76 98 36 33 4 25
65-69 1 958 773 526 95 564 738 288 214 41 195
70+ 1 776 666 709 67 334 543 231 204 15 93
Unspecified 2 2 - - - - - - - -
STATISTICS SOUTH AFRICA 26 P0307
Marriages and divorces, 2016
Table 6 – Number of registered customary marriages in South Africa, 2003–2016
Year of registration Number of marriages
2003 17 283
2004 20 301
2005 19 252
2006 14 039
2007 20 259
2008 16 003
2009 13 506
2010 9 996
2011 5 084
2012 4 555
2013 3 498
2014 3 062
2015 3 467
2016 3 978
STATISTICS SOUTH AFRICA 27 P0307
Marriages and divorces, 2016
Table 7 – Number and percentage distribution of customary marriages by province of marriage registration and age difference, 2016
Province of registration Total
Bridegroom Older
Bridegroom Younger
Same Age Unspecified Total Bridegroom
Older Bridegroom
Younger Same Age Unspecified
Total 3 978 3 411 357 198 12 100,0 85,7 9,0 5,0 0,3
Western Cape 13 11 2 - - 100,0 84,6 15,4 - -
Eastern Cape 405 354 26 22 3 100,0 87,4 6,4 5,4 0,7
Northern Cape 22 19 1 2 - 100,0 86,4 4,5 9,1 -
Free State 39 35 2 2 - 100,0 89,7 5,1 5,1 -
KwaZulu-Natal 1 680 1 403 177 97 3 100,0 83,5 10,5 5,8 0,2
North West 52 50 2 - - 100,0 96,2 3,8 - -
Gauteng 224 191 24 9 - 100,0 85,3 10,7 4,0 -
Mpumalanga 318 258 34 24 2 100,0 81,1 10,7 7,5 0,6
Limpopo 1 110 996 76 35 3 100,0 89,7 6,8 3,2 0,3
Outside RSA 19 15 3 1 - 100,0 78,9 15,8 5,3 -
Unknown 92 75 10 6 1 100,0 81,5 10,9 6,5 1,1
Unspecified 4 4 - - - 100,0 100,0 - - -
STATISTICS SOUTH AFRICA 28 P0307
Marriages and divorces, 2016
Table 8 – Number of customary marriages by ages of bridegrooms and brides at the time of marriage, 2016
Age Bridegrooms Brides
Total 3 978 3 978
<18 14 252
18 23 165
19 36 187
18-19 59 352
20 57 169
21 96 187
22 120 192
23 141 169
24 163 177
20-24 577 894
25 145 190
26 152 180
27 161 168
28 156 177
29 165 158
25-29 779 873
30 135 144
31 153 116
32 160 130
33 147 100
34 146 118
30-34 741 608
STATISTICS SOUTH AFRICA 29 P0307
Marriages and divorces, 2016
Table 8 – Number of customary marriages by ages of bridegrooms and brides at the time of marriage, 2016 (continued)
Age Bridegrooms Brides
35 129 94
36 133 85
37 96 77
38 104 81
39 124 71
35-39 586 408
40 102 58
41 79 48
42 85 66
43 82 40
44 69 41
40-44 417 253
45 65 41
46 59 35
47 61 32
48 57 24
49 50 27
45-49 292 159
50 53 16
51 52 20
52 42 13
53 31 21
54 32 19
50-54 210 89
STATISTICS SOUTH AFRICA 30 P0307
Marriages and divorces, 2016
Table 8 – Number of customary marriages by ages of bridegrooms and brides at the time of marriage, 2016 (concluded)
Age Bridegrooms Brides
55 28 11
56 26 11
57 23 8
58 23 6
59 22 6
55-59 122 42
60 23 10
61 21 6
62 15 3
63 12 1
64 14 3
60-64 85 23
65 14 4
66 9 1
67 11 -
68 8 1
69 4 2
65-69 46 8
70+ 38 5
Unspecified 12 12
STATISTICS SOUTH AFRICA 31 P0307
Marriages and divorces, 2016
Table 9 – Number and percentage distribution of civil unions registered by province of registration, 2012–2016
Province of registration
Number %
2012 2013 2014 2015 2016 2012 2013 2014 2015 2016
Grand Total 987 993 1 144 1 185 1 331 100,0 100,0 100,0 100,0 100,0
Western Cape 253 320 314 346 358 25,6 32,2 27,5 29,2 26,9
Eastern Cape 38 37 54 49 57 3,9 3,7 4,7 4,1 4,3
Northern Cape 106 87 81 10 15 10,7 8,8 7,1 0,8 1,1
Free State 27 21 32 41 36 2,7 2,1 2,8 3,5 2,7
KwaZulu-Natal 91 81 161 220 249 9,2 8,2 14,1 18,6 18,7
North West 11 10 28 25 29 1,1 1,0 2,5 2,1 2,2
Gauteng 425 411 452 443 494 43,1 41,4 39,5 37,4 37,1
Mpumalanga 12 16 9 24 22 1,2 1,6 0,8 2,0 1,7
Limpopo 13 6 10 16 17 1,3 0,6 0,9 1,4 1,3
Outside South Africa 11 4 3 4 4 1,1 0,4 0,3 0,3 0,3
Unspecified - - - 7 50 - - - 0,6 3,8
STATISTICS SOUTH AFRICA 32 P0307
Marriages and divorces, 2016
Table 10 – Number of civil unions by ages of spouses-1 and spouses-2 at the time of civil union, 2016
Age Spouse-1 Spouse-2
Total 1 331 1 331
18 - -
19 - 3
18-19 - 3
20 4 5
21 6 7
22 12 22
23 13 34
24 24 50
20-24 59 118
25 37 63
26 43 53
27 37 58
28 58 69
29 70 62
25-29 245 305
30 61 72
31 68 76
32 64 46
33 53 74
34 59 51
30-34 305 319
STATISTICS SOUTH AFRICA 33 P0307
Marriages and divorces, 2016
Table 10 – Number of civil unions by ages of spouses-1 and spouses-2 at the time of civil union, 2016 (continued)
Age Spouse-1 Spouse-2
35 47 36
36 40 49
37 43 29
38 39 29
39 44 29
35-39 213 172
40 39 32
41 41 33
42 25 22
43 25 22
44 31 26
40-44 161 135
45 30 22
46 31 22
47 24 28
48 21 26
49 29 14
45-49 135 112
50 34 24
51 17 12
52 18 16
53 15 19
54 15 11
50-54 99 82
STATISTICS SOUTH AFRICA 34 P0307
Marriages and divorces, 2016
Table 10 – Number of civil unions by ages of spouses-1 and spouses-2 at the time of civil union, 2016 (concluded)
Age Spouse-1 Spouse-2
55 8 9
56 19 13
57 11 6
58 12 11
59 5 8
55-59 55 47
60 5 6
61 4 4
62 8 9
63 4 6
64 9 1
60-64 30 26
65 4 -
66 2 2
67 2 4
68 1 -
69 3 1
65-69 12 7
70+ 17 5
STATISTICS SOUTH AFRICA 35 P0307
Marriages and divorces, 2016
Table 11 – Number and percentage distribution of published divorces in South Africa by population group, 2003 – 2016
Year Total
Numbers %
Black African
Coloured India/ Asian
White Mixed Unspecified Total Black
African Coloured
India/Asian
White Mixed Unspecified
2003 31 566 7 657 3 911 1 508 12 639 532 5 319 100,0 24,3 12,4 4,8 40,0 1,7 16,9
2004 31 768 8 965 3 300 1 648 12 437 594 4 824 100,0 28,2 10,4 5,2 39,1 1,9 15,2
2005 32 484 8 672 3 568 1 635 11 582 538 6 489 100,0 26,7 11,0 5,0 35,7 1,7 20,0
2006 31 270 9 113 3 451 1 676 11 079 613 5 338 100,0 29,1 11,0 5,4 35,4 2,0 17,1
2007 29 639 9 055 3 558 1 715 9 935 865 4 511 100,0 30,6 12,0 5,8 33,5 2,9 15,2
2008 28 924 10 110 3 057 1 802 9 481 902 3 572 100,0 35,0 10,6 6,2 32,8 3,1 12,3
2009 30 763 10 528 4 016 1 610 9 981 2 912 1 716 100,0 34,2 13,1 5,2 32,4 9,5 5,6
2010 22 936 8 169 3 189 1 294 6 995 31 3 258 100,0 35,6 13,9 5,6 30,5 0,1 14,2
2011 20 980 7 517 3 473 1 359 6 730 - 1 901 100,0 35,8 16,6 6,5 32,1 - 9,1
2012 21 998 7 311 3 967 1 036 7 238 22 2 424 100,0 33,2 18,0 4,7 32,9 0,1 11
2013 23 885 8 656 3 888 1 425 7 561 24 2 331 100,0 36,2 16,3 6,0 31,7 0,1 9,8
2014 24 689 9 167 4 994 1 522 6 970 842 1 194 100,0 37,1 20,2 6,2 28,2 3,4 4,8
2015 25 260 10 841 4 213 1 566 6 588 837 1 215 100,0 42,9 16,7 6,2 26,1 3,3 4,8
2016 25 326 10 641 4 711 1 529 6 293 841 1 311 100,0 42,0 18,6 6,0 24,8 3,3 5,2
STATISTICS SOUTH AFRICA 36 P0307
Marriages and divorces, 2016
Table 12 – Number and percentage distribution of divorces by type of occupation at the time of divorce, 2016
Occupation
Number %
Husbands Wives Husbands Wives
Total 25 326 25 326 100,0 100,0
Professional, semi-professionals and technical occupations 2 410 3 113 9,5 12,3
Managers and administrators 3 478 1 931 13,7 7,6
Clerical and sales occupations 1 607 3 248 6,3 12,8
Transport delivary and communications 902 63 3,6 0,2
Services occupations 2 281 2 043 9,0 8,1
Farming and related occupations 114 20 0,5 0,1
Artisans apprentice and related occupations 1 720 257 6,8 1,0
Production foreman mine and quarry worker 1 008 415 4,0 1,6
Not economically active 4 378 6 103 17,3 24,1
Unspecified 7 428 8 133 29,3 32,1
STATISTICS SOUTH AFRICA 37 P0307
Marriages and divorces, 2016
Table 13 – Number and percentage distribution of divorces by population group and plaintiff, 2016
Population group Number %
Total Husbands Wives Both Unspecified Total Husbands Wives Both Unspecified
Grand Total 25 326 8 651 12 954 1 868 1 853 100,0 34,2 51,1 7,4 7,3
Black African 10 641 4 031 4 726 1 099 785 100,0 37,9 44,4 10,3 7,4
Coloured 4 711 1 396 2 672 305 338 100,0 29,6 56,7 6,5 7,2
Indian/Asian 1 529 512 852 82 83 100,0 33,5 55,7 5,4 5,4
White 6 293 2 022 3 659 288 324 100,0 32,1 58,1 4,6 5,1
Mixed 841 249 460 70 62 100,0 29,6 54,7 8,3 7,4
Unspecified 1 311 441 585 24 261 100,0 33,6 44,6 1,8 19,9
Table 14 – Number and percentage distribution of divorces by province of divorce registration and plaintiff, 2016
Province of divorce registration
Number %
Total Husbands Wives Both Unspecified Total Husbands Wives Both Unspecified
Grand Total 25 326 8 651 12 954 1 868 1 853 100,0 34,2 51,1 7,4 7,3
Western Cape 6 224 2 003 3 422 352 447 100,0 32,2 55,0 5,7 7,2
Eastern Cape 3 352 1 114 1 595 472 171 100,0 33,2 47,6 14,1 5,1
Northern Cape 638 213 344 8 73 100,0 33,4 53,9 1,3 11,4
Free State 2 361 954 1 232 26 149 100,0 40,4 52,2 1,1 6,3
KwaZulu-Natal 4 314 1 539 2 146 269 360 100,0 35,7 49,7 6,2 8,3
North West 558 228 272 27 31 100,0 40,9 48,7 4,8 5,6
Gauteng 5 816 1 831 2 915 568 502 100,0 31,5 50,1 9,8 8,6
Mpumalanga 1 035 363 531 81 60 100,0 35,1 51,3 7,8 5,8
Limpopo 1 028 406 497 65 60 100,0 39,5 48,3 6,3 5,8
STATISTICS SOUTH AFRICA 38 P0307
Marriages and divorces, 2016
Table 15 – Number and percentage distribution of divorces by population group and way of solemnisation of the marriage, 2016
Population group Number %
Total Religious DHA Unspecified Total Religious DHA Unspecified
Total 25 326 11 794 10 971 2 561 100,0 46,6 43,3 10,1
Black African 10 641 3 080 6 990 571 100,0 28,9 65,7 5,4
Coloured 4 711 3 081 1 255 375 100,0 65,4 26,6 8,0
Indian/Asian 1 529 525 780 224 100,0 34,3 51,0 14,7
White 6 293 4 339 1 124 830 100,0 68,9 17,9 13,2
Mixed 841 301 462 78 100,0 35,8 54,9 9,3
Unspecified 1 311 468 360 483 100,0 35,7 27,5 36,8
Table 16 – Number and percentage distribution of divorces by number of times married at the time of divorce, 2016
Number of times married Number %
Husbands Wives Husbands Wives
Total 25 326 25 326 100,0 100,0
Once 20 871 21 175 82,4 83,6
Twice 3 018 2 611 11,9 10,3
Three or more 437 352 1,7 1,4
Unspecified 1 000 1 188 3,9 4,7
STATISTICS SOUTH AFRICA 39 P0307
Marriages and divorces, 2016
Table 17 – Number of divorces by age and population group (male divorcees), 2016
Age group Population group
Total Black African Coloured Indian/Asian White Other Unspecified
Grand Total 25 326 10 980 4 949 1 728 6 477 95 1 097
<25 76 8 27 9 31 - 1
25-29 878 175 216 103 349 1 34
30-34 2 837 998 653 266 799 8 113
35-39 3 939 1 734 868 287 909 13 128
40-44 4 775 2 246 942 331 1 044 15 197
45-49 4 503 2 024 887 298 1 087 14 193
50-54 3 387 1 576 661 184 811 5 150
55-59 1 970 886 343 74 570 1 96
60-64 1 084 519 151 47 331 2 34
65-69 524 238 63 13 183 - 27
70-74 221 78 32 6 96 - 9
75-79 107 37 10 3 53 - 4
80+ 52 26 5 - 18 - 3
Unspecified 973 435 91 107 196 36 108
STATISTICS SOUTH AFRICA 40 P0307
Marriages and divorces, 2016
Table 18 – Number of divorces by age group and population group (female divorcees), 2016
Age group Population
Total Black African Coloured Indian/Asian White Other Unspecified
Total 25 326 10 944 5 094 1 648 6 418 20 1 202
<25 355 95 75 32 141 - 12
25-29 1 967 688 425 185 583 - 86
30-34 4 431 2 055 829 323 1 061 3 160
35-39 4 724 2 353 931 285 951 3 201
40-44 4 546 2 074 911 312 1 057 1 191
45-49 3 742 1 555 814 226 975 2 170
50-54 2 404 986 528 126 643 1 120
55-59 1 289 468 260 59 421 - 81
60-64 604 205 126 26 220 1 26
65-69 235 74 47 6 94 - 14
70-74 87 21 13 2 43 - 8
75-79 31 9 6 2 14 - -
80+ 13 1 3 - 8 - 1
Unspecified 898 360 126 64 207 9 132
STATISTICS SOUTH AFRICA 41 P0307
Marriages and divorces, 2016
Table 19 – Number of divorces by age group and duration of marriage (male divorcees), 2016
Age group of husband Duration of marriage
Total 0-4 5-9 10-14 15-19 20-24 25-29 30-34 35+ Unspecified
Total 25 326 4 436 6 817 4 955 3 283 2 276 1 352 725 515 967
<25 76 68 6 - - - - - - 2
25-29 878 614 227 4 - - 3 1 - 29
30-34 2 837 1 104 1 396 241 8 - - 3 2 83
35-39 3 939 823 1 706 1 066 196 7 - 6 135
40-44 4 775 607 1 387 1 455 901 233 11 1 10 170
45-49 4 503 413 808 1 002 991 861 238 12 10 168
50-54 3 387 308 475 486 595 637 541 187 10 148
55-59 1 970 154 236 260 245 278 336 309 98 54
60-64 1 084 84 131 136 137 110 123 122 190 51
65-69 524 45 74 74 66 67 36 41 93 28
70-74 221 20 38 22 31 16 17 16 52 9
75-79 107 15 18 15 8 9 9 5 23 5
80+ 52 9 8 10 8 7 2 2 3 3
Unspecified 973 172 307 184 97 51 36 20 24 82
STATISTICS SOUTH AFRICA 42 P0307
Marriages and divorces, 2016
Table 20 – Number of divorces by age group and duration of marriage (female divorcees), 2016
Age group of wife Duration of marriage
Total 0–4 5–9 10–14 15–19 20–24 25–29 30–34 35+ Unspecified
Total 25 326 4 436 6 817 4 955 3 283 2 276 1 352 725 515 967
<25 355 298 44 2 - - - - - 11
25-29 1 967 1 022 831 39 - - 3 1 1 70
30-34 4 431 1 177 2 199 849 51 - - 12 143
35-39 4 724 706 1 629 1 576 604 49 2 1 7 150
40-44 4 546 433 887 1 198 1 190 603 48 - 15 172
45-49 3 742 324 490 604 758 910 457 49 7 143
50-54 2 404 169 270 275 338 422 508 317 28 77
55-59 1 289 87 144 138 133 142 203 225 162 55
60-64 604 44 53 64 74 62 58 68 151 30
65-69 235 21 23 24 19 16 24 20 79 9
70-74 87 7 12 10 7 8 5 7 28 3
75-79 31 5 3 3 2 1 2 - 13 2
80+ 13 - - 4 2 - 1 1 3 2
Unspecified 898 143 232 169 105 63 41 24 21 100
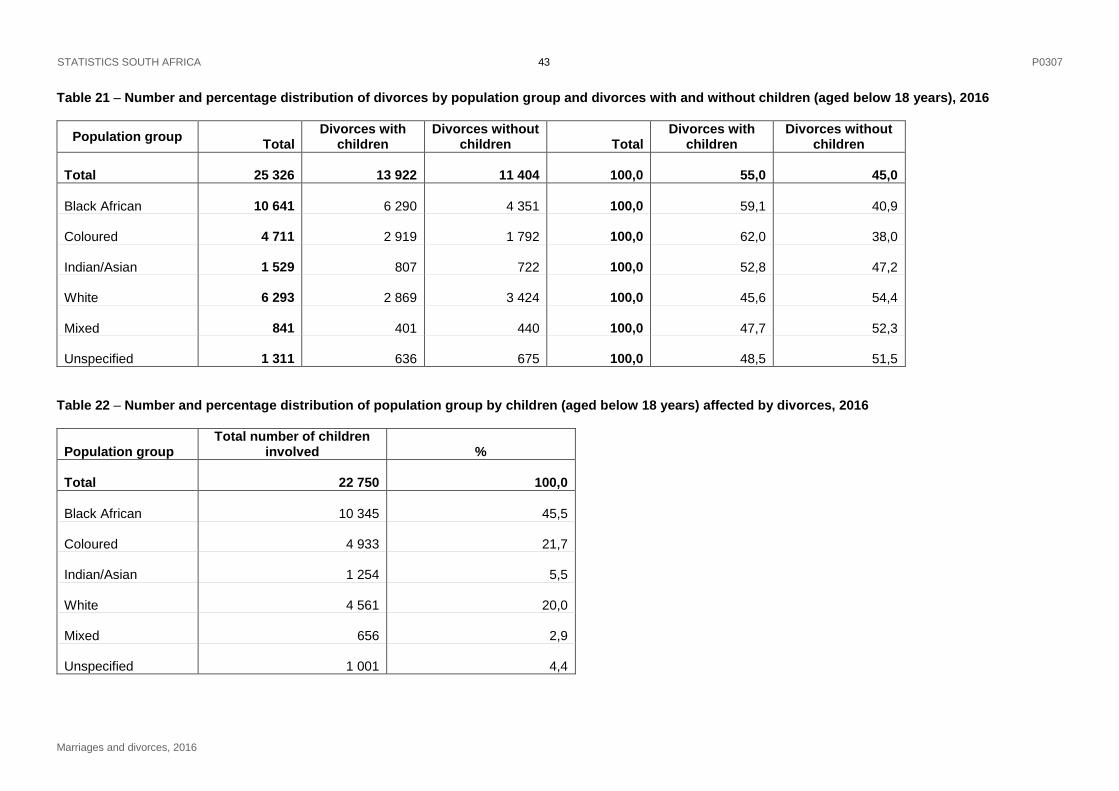
STATISTICS SOUTH AFRICA 43 P0307
Marriages and divorces, 2016
Table 21 – Number and percentage distribution of divorces by population group and divorces with and without children (aged below 18 years), 2016
Population group Total
Divorces with children
Divorces without children Total
Divorces with children
Divorces without children
Total 25 326 13 922 11 404 100,0 55,0 45,0
Black African 10 641 6 290 4 351 100,0 59,1 40,9
Coloured 4 711 2 919 1 792 100,0 62,0 38,0
Indian/Asian 1 529 807 722 100,0 52,8 47,2
White 6 293 2 869 3 424 100,0 45,6 54,4
Mixed 841 401 440 100,0 47,7 52,3
Unspecified 1 311 636 675 100,0 48,5 51,5
Table 22 – Number and percentage distribution of population group by children (aged below 18 years) affected by divorces, 2016
Population group Total number of children
involved %
Total 22 750 100,0
Black African 10 345 45,5
Coloured 4 933 21,7
Indian/Asian 1 254 5,5
White 4 561 20,0
Mixed 656 2,9
Unspecified 1 001 4,4
STATISTICS SOUTH AFRICA 44 P0307
Marriages and divorces, 2016
EXPLANATORY NOTES
1. Purpose of the statistical release
The purpose of the statistical release is to provide information on marriages, unions and divorces recorded in
South Africa in 2016. The data on marriages and unions was gathered from the Department of Home Affairs
while information for divorces came from the Department of Justice and Constitutional Development through
divorce courts, based on the number of divorce forms that had reached Stats SA by end of December, 2017.
2. Scope and coverage
The data on marriages currently cover registered civil marriages, customary marriages and civil unions in South
Africa. The divorce data cover cases for filed divorces from registered marriages and unions that had been
granted; and forms on them received by Stats SA. Undocumented cases of abandonment or divorces that had
been granted by religious or traditional authorities are not reported in the release.
3. Data
Stats SA obtains data on civil marriages, customary marriages and civil unions directly from the Department of
Home Affairs (DHA) head office. Data on divorces are collected from divorce courts using a standard structured
questionnaire (Divorce Forms) prepared by Stats SA. The 2016 data came from both the old and the revised
Divorce Forms since some of the courts have not switched to the revised form. The questionnaires are regularly
completed by the courts as divorce decrees are granted. In 2016, 27 439 divorces were granted by DOJ&CD
from 85 regional courts. Out of these 27 439 divorce cases, Stats SA received and processed 25 326 Divorce
forms.
4. Limitations
Due to the few variables collected on married couples and divorcees, background information on couples and
divorcees is limited. Therefore the release focuses on presenting the demographic characteristics of the married
and divorced persons.
5. Definitions of terms
Bachelor: man who have never being married.
Civil marriages: these are marriages registered according to the Marriage Act, 1961 (Act No. 25 of 1961). In
the release the term ‘civil’ is used to differentiate marriages that were solemnised by licensed DHA marriage
officers from marriages that were solemnised by religious marriage officers.
Customary marriages: these are marriages that are negotiated, celebrated or concluded according to any of
the systems of indigenous African customary law which exist in South Africa as prescribed in the Recognition of
Customary Marriages Act,1998 (Act No. 120 of 1998).
Civil unions: refers to the voluntary union of two persons who are both 18 years of age or older, which is
solemnised and registered by way of either a marriage or a civil partnership, in accordance with the procedures
prescribed in the Civil Union Act, 2006 (Act No. 17 of 2006). Spouse-1 and Spouse-2 are used because the
data do not specify the sex of the spouse.
Mixed population group: refers to couples with different population groups.
Occupation: occupation is coded using the Standard Classification of Occupations, Report No 09-90-01, First
Edition, 1986 published by Stats SA.
Plaintiff: spouse(s) who filed the divorce case.
STATISTICS SOUTH AFRICA 45 P0307
Marriages and divorces, 2016
Spinster: woman who have never being married.
Unknown province of registration: the information about the name of placename is not known, as the
province is derived from the provided placename.
Unspecified province of registration: the information about the name of the placename is not specified
(missing), as the province is derived from the provided placename.
6. Symbols
- = Nil
‹ = Less than
≥ = Equal to and greater than
7. Reference
Bongaarts, J. 1978. A Framework for Analyzing the Proximate Determinants of Fertility. Population and Development Review. Vol 4(1): 105-132.
STATISTICS SOUTH AFRICA 46 P0307
Marriages and divorces, 2016
GENERAL INFORMATION
Marriages and divorces, 2016
Published by Statistics South Africa, Private Bag X44, Pretoria 0001
© Statistics South Africa, 2018
Users may apply or process this data, provided Statistics South Africa (Stats SA) is acknowledged as the
original source of the data; that it is specified that the application and/or analysis is the result of the user’s
independent processing of the data; and that neither the basic data nor any reprocessed version or application
thereof may be sold or offered for sale in any form whatsoever without prior permission from Stats SA.
Stats SA publishes approximately 300 different statistical releases each year. It is not economically viable to
produce them in more than one of South Africa's eleven official languages. Since the releases are used
extensively, not only locally but also by international economic and social-scientific communities, Stats SA
releases are published in English only.
This publication is available on the Internet at www.statssa.gov.za
Stats SA products
A complete set of Stats SA publications is available at the Stats SA Library and the following libraries:
National Library of South Africa, Pretoria Division
National Library of South Africa, Cape Town Division
Natal Society Library, Pietermaritzburg
Library of Parliament, Cape Town
Bloemfontein Public Library
Johannesburg Public Library
Eastern Cape Library Services, King William’s Town
Central Regional Library, Polokwane
Central Reference Library, Mbombela
Central Reference Collection, Kimberley
Central Reference Library, Mmabatho
Stats SA also provides a subscription service.
Enquiries:
Telephone: (012) 310 8600 (user information services)
(012) 406 3301 (technical enquiries)
(012) 310 8251 (orders)
Email: [email protected] (technical enquiries)
[email protected] (user information services)
Postal address: Private Bag X44, Pretoria, 0001
Produced by Stats SA