Embed Size (px)
Citation preview
123
ORIGINAL ARTICLE
Statistical optimization for tannase production from Aspergillusniger under submerged fermentationr
S. Sharma . L. Agarwal . R. K. Saxena
Received: 29 December 2006 / Final revision: 23 February 2007 / Accepted: 7 May 2007
Indian J. Microbiol. (June 2007) 47:132–138
Abstract Statistically based experimental design was employed for the optimization of fermentation conditions for maximum production of enzyme tannase from Asper-gillus niger. Central composite rotatable design (CCRD)falling under response surface methodology (RSM) wasused. Based on the results of ‘one-at-a-time’ approach in submerged fermentation, the most infl uencing factors for fltannase production from A. niger were concentrations of rtannic acid and sodium nitrate, agitation rate and incubationperiod. Hence, to achieve the maximum yield of tannase,interaction of these factors was studied at optimum produc-tion pH of 5.0 by RSM. The optimum values of parametersobtained through RSM were 5% tannic acid, 0.8% sodiumnitrate, 5.0 pH, 5 x I07 spores/50mL inoculum density, 150 rpm agitation and incubation period of 48 h which resulted in production of 19.7 UmL–1 of the enzyme. This activitywas almost double as compared to the amount obtained by ‘one- at- a- time’ approach (9.8 UmL–1).
Keywords Tannase . Response surface methodology .
Aspergillus niger . Fermentation . Statistical analysis
Introduction
Tannase (tannin acyl hydrolase, E.C.3.1.1.20) is an induc-ible enzyme that catalyses the breakdown of ester linkagesin hydrolysable tannins resulting in the production of gallic acid and glucose1. The major applications of this enzyme are in the production of gallic acid, which is used in themanufacture of antimalarial drug, trimethoprim2 and in the synthesis of propyl gallate used as antioxidants in the food industry3. The enzyme also has applications as a clarifi er infithe production of beer and fruit juices, in the manufacture of instant tea and in the treatment of wastewater contaminated with polyphenolic compounds2,4. Conesa et al.5 reported the hydrolysis of diethyldiferulates by tannase from Aspergillusoryzae for animal feed improvement.
Realizing the importance of the enzyme tannase, ef-forts were made to find a suitable micro-organism/s, whichfimay produce higher amounts of tannase. Also, processesare to be developed for their economically viable produc-tion. Though, generally, ‘one-at-a-time’ procedure on low cost substrate and media components results in a processoptimization to a certain extent, however, the limitations of this process lies when a large number of factors have to be investigated, as the statistical interactions between fac-tors could not be examined by this approach6,7. Optimiza-tion through response surface methodology (RSM) is nowwidely used to evaluate and understand the interactions be-tween different physiological and nutritional parameters8–11. This technique is an empirical modeling technique devoted to the evaluation of relations existing within a group of con-trolled experimental factors and observed results of one or more selected criteria12. This includes factorial design and regression analysis which helps in evaluating the effective
S. Sharma . L. Agarwal . R. K. Saxena (�)Department of MicrobiologyUniversity of Delhi South CampusBenito Juarez RoadNew Delhi - 110 021e-mail: [email protected], [email protected]: +91-11- 24116559
Indian J. Microbiol. (June 2007) 47:132–138 133
123
factors and building blocks to study interactions and select optimum conditions of variables for a desired response 13,14. In the present investigation, an attempt was made to opti-mize the culture conditions for maximizing the productionof tannase from A. niger using RSM.r
Materials and Methods
Micro-organism and its maintenance: A natural isolate of A. niger isolated from soil was found to be a potent tan-rnase producer after the extensive screening carried out in our laboratory. This fungus was grown on potato dextroseagar (PDA) slants supplemented with 0.01% tannic acid at 37 ± 1°C for 72 h. The purity of the sporulated culture waschecked microscopically and sub-cultured every week.Enzyme Production: Conidia were harvested from 72 h old culture in 10 mL of sterilized normal saline containing0.01% sterile Tween-80. Modifi ed Czapek’s Dox mediumfiwith the composition (g/l): tannic acid (x g); NaNO3 (y g); KCI (0.52 g); MgS04.7H20 (0.52 g); KH2PO4 (1.52 g); glucose (2.0 g) was used. Cu(NO3)2.3H2O; FeSO4.7H2Oand ZnSO4.7H2O (1.0 mg each) were added as traces. The pH of the medium was adjusted to 5.0 by 1 N HCl. Stock solution of fi lter-sterilized tannic acid (25% w/v) was pre-fipared and used at the desired concentration. Approximately,5 × 107 conidia (in 0.5 mL of sterilized normal saline) wereinoculated in each 250 mL fl ask containing 50 mL of the flCzapek’s Dox medium. These fl asks were incubated atfl37 ± 1°C in a New Brunswick Incubator shaker (Model G-26 R) at different agitation rates for different time intervals. After the desired incubation period, biomass was harvested using Whatman fi lter paper no. 1 and the culture fifi ltrates fiwere analyzed for tannase activity.Enzyme assay: Tannase activity was estimated by the pro-cedure of Deschamps et al.15 The reaction mixture (4 mL) contained 1 mL of 1% tannic acid (in citrate-phosphatebuffer pH 5.0), 2 mL of 0.5 M citrate-phosphate buffer (pH 5.0) and 1 mL of the culture fi ltrate. The mixture was fiincubated at 50°C for 30 min in a water bath. The enzymereaction was terminated by adding 4 mL of 2 % bovine se-rum-albumin (BSA) solution prepared in citrate-phosphatebuffer (pH 5.0). For control preparation, BSA was added in the reaction mixture prior to incubation. All the tubes were kept for 20 min at room temperature to precipitate the re-sidual tannins and subsequently centrifuged at 3000 x g for 20 min. Tannase activity was estimated by diluting 20 μl of the supernatant, 500 fold using double distilled water. Theabsorbance was read at 260 nm in a UV spectrophotometer (Shimadzu, Model no. 1601) against double distilled water, which was used as blank.
Tannase unit: One unit of tannase is defi ned as the amount fiof enzyme required to release one μmol of gallic acid per milliliter of culture fi ltrate per minute under the standard fiassay conditions.Experimental design and Data analysis: The most influen-fltial factors for tannase production found by ‘one-at-a-time’approach were tannic acid and sodium nitrate concentra-tions, agitation rate and incubation period. Hence, Central Composite Rotatable Design (CCRD), which falls under RSM, was used to study the interaction of these factors at the optimum production pH of 5.0. The statistical softwarepackage ‘Design Expert 6.0’, Stat- Ease, Inc., Minnaepolis, USA was used to analyze the experimental design. Eachfactor in the design was studied at fi ve different levelsfi(–α, –1, 0, +1, +α) (Table 1). A set of 30 experiments wasperformed. All the variables were taken at a central coded value considered as zero. The minimum and maximumranges of variables investigated and the full experimentalplan with respect to their values in actual and coded form is listed in Table 2. Upon completion of experiment, the tannase production was taken as dependent variable or response (Y).
Experimentally, as per the combinations presented inTable 2, different concentrations of sodium nitrate weretaken in separate set of fl asks containing minimal me-fldium (pH 5.0). Glucose concentration of 0.2 % w/v in themedium was kept constant throughout. These flasks wereflautoclaved at 10 psi. Now, fi lter-sterilized tannic acid was fiadded in different permutations and combinations. All the experiments were performed in triplicates to estimate theexperimental error and to check the linearity of the experi-mental set up.Statistical analysis and modelling: The data of tannaseproduction thus obtained was subjected to analysis of vari-ance (ANOVA), appropriate to the design of experiments.The mathematical relationship of the independent variablesand the responses (tannase activity) were calculated by thesecond order polynomial equation i.e.
Y = β0 + β1A+β2B +β3C +β4D +β11A2 + β22B
2 + β33 C2 +
β44D2 + β12AB +β13AC + β14AD +β23BC + β24BD +
β34CD (1)
where Y = predicted response; β0 = intercept; β1, β2, β3, β4 =linear coeffi cients; fi β11, β22, β33, β44 = squared coefficients; fi β12, β13, β14, β23, β24, β34 = interaction coeffi cients.fiValidation of the model: The model was validated by con-sidering different permutation and combination of mediumcomponents, selected within the model range so as to fit fithe second order polynomial equation. Eight sets of experi-ments were generated and carried out.
134 Indian J. Microbiol. (June 2007) 47:132–138
123
Results and Discussion
On the basis of ‘one-at-a-time’ approach, four factors (8% tannic acid, 0.6% sodium nitrate, agitation rate of 200 rpm and incubation period of 48 h) showed maximum influencefl
on tannase production resulting in the production of 9.8 UmL–1 of tannase. Based on these results, the central point and the range of level for each of the factors were selected in CCRD. The concentrations of non-significant factors fiwere set at their corresponding optima as obtained. The
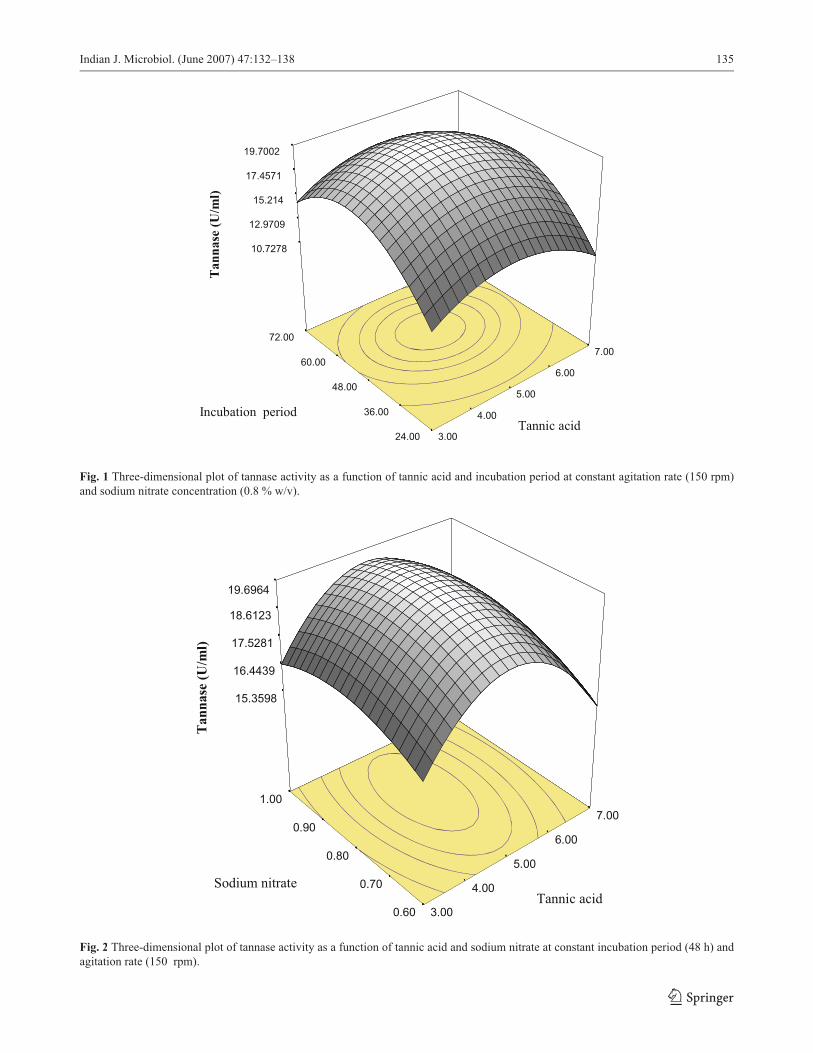
Table 1 Levels of the four independent variables (factors) used in RSM. Variables Units Coded value Range of levels
–α –1 0 +1 +αTannic acid % A 1.0 3.0 5.0 7.0 9.0Sodium nitrate % B 0.4 0.6 0.8 1.0 1.2Agitation rate rpm C 50 100 150 200 250Incubation Period h D 0 24 48 72 96
Table 2 Central Composite Rotatable Design of the variables with Tannase activity as response.Run Tannic acid (%) Sodium nitrate
(%)Agitation (rpm) Incubation (h) Tannase activity (U/mL)
Actual Predicted1 0 0 0 0 19.43 19.512 0 0 0 0 19.70 19.513 +1 +1 +1 +1 13.40 13.594 –1 +1 –1 –1 08.54 08.575 0 0 0 –α 00.00 00.006 0 –α 0 0 15.60 15.777 +1 –1 +1 –1 08.20 08.268 –1 +1 +1 –1 08.80 08.969 +α 0 0 0 07.70 07.7310 0 0 0 +α 06.50 06.3811 +1 +1 –1 +1 11.40 11.3212 +1 –1 –1 +1 11.20 11.2213 0 0 0 0 19.50 19.5114 0 0 –α 0 14.20 14.1615 +1 –1 +1 +1 11.20 11.1516 –1 +1 +1 +1 13.80 13.7217 0 0 0 0 19.40 19.5118 –1 –1 –1 +1 12.20 12.0119 –1 –1 +1 –1 08.20 08.2620 –α 0 0 0 08.70 08.5121 0 0 +α 0 14.61 14.4922 0 0 0 0 19.60 19.5123 –1 –1 –1 –1 10.21 10.2024 +1 +1 –1 –1 08.20 08.2125 +1 +1 +1 –1 08.80 08.9726 –1 –1 +1 +1 11.40 11.5727 0 0 0 0 19.41 19.5128 0 +α 0 0 16.90 16.5729 +1 +1 –1 –1 09.50 09.5630 –1 –1 –1 –1 11.40 11.81
Indian J. Microbiol. (June 2007) 47:132–138 135
123
10.7278
12.9709
15.214
17.4571
19.7002
Tan
nase
(U/m
l)
3.00
4.00
5.00
6.00
7.00
24.00
36.00
48.00
60.00
72.00
Tannic acid Incubation period
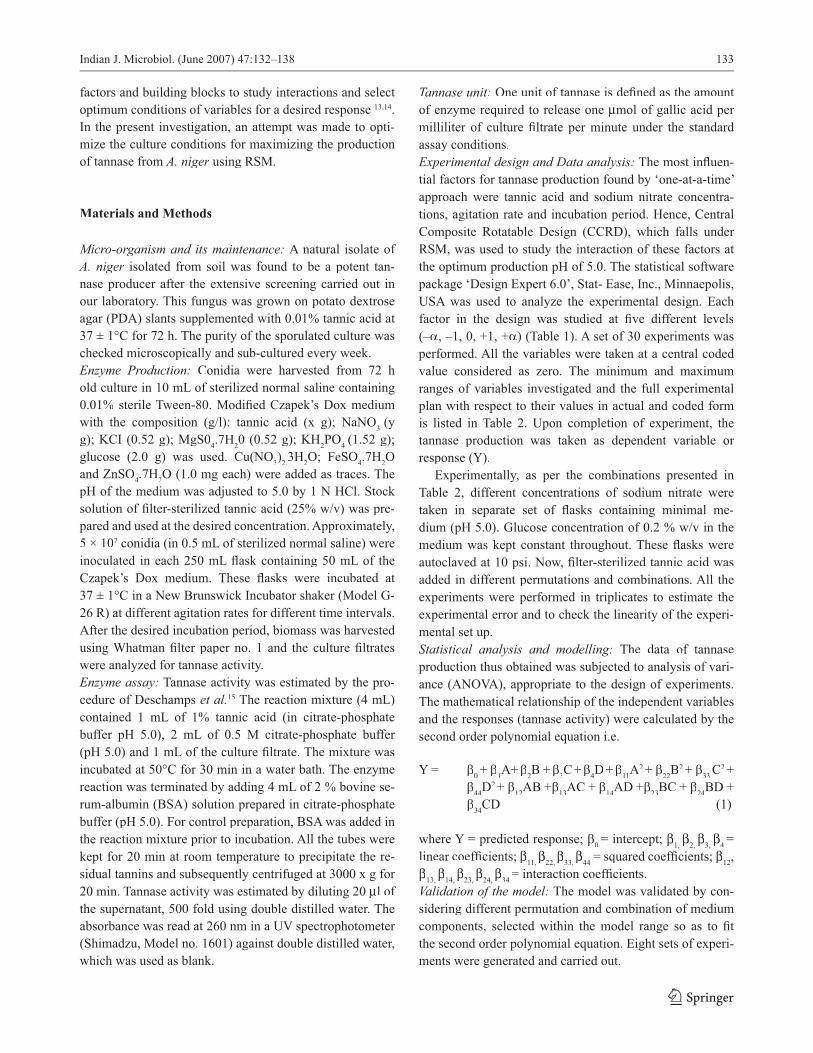
Fig. 1 Three-dimensional plot of tannase activity as a function of tannic acid and incubation period at constant agitation rate (150 rpm)and sodium nitrate concentration (0.8 % w/v).
15.3598
16.4439
17.5281
18.6123
19.6964
Tan
nase
(U/m
l)
3.00
4.00
5.00
6.00
7.00
0.60
0.70
0.80
0.90
1.00
Tannic acid Sodium nitrate
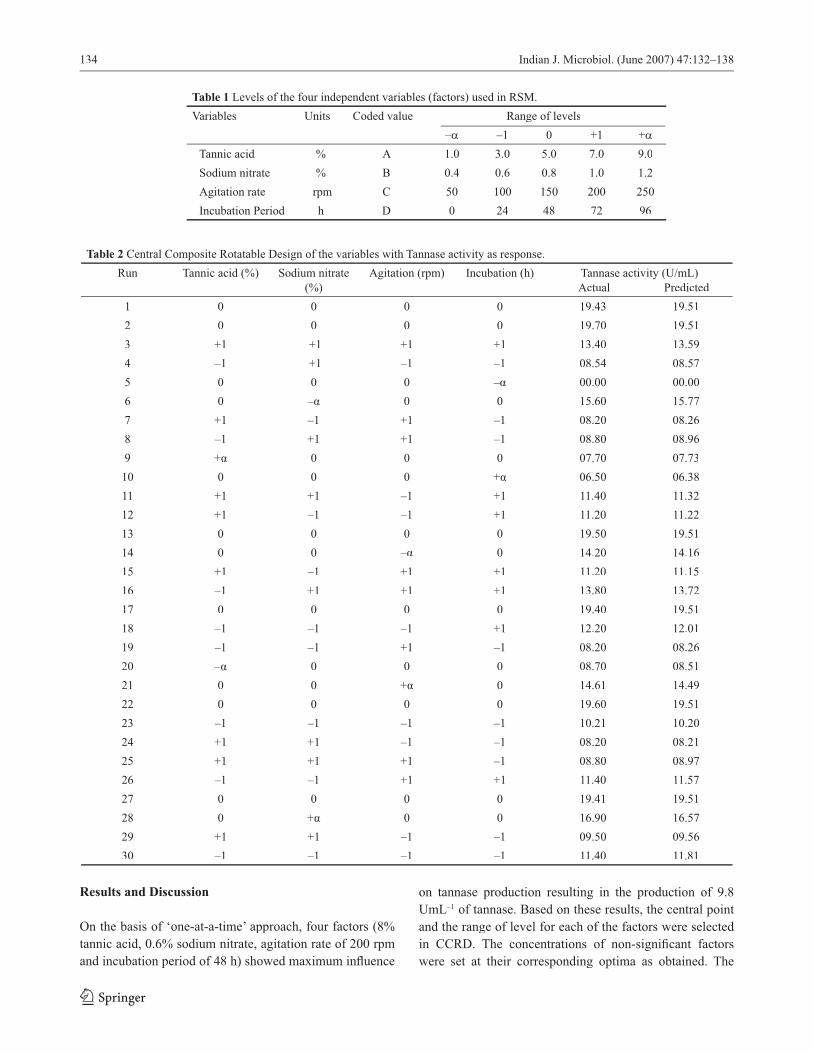
Fig. 2 Three-dimensional plot of tannase activity as a function of tannic acid and sodium nitrate at constant incubation period (48 h) and agitation rate (150 rpm).
136 Indian J. Microbiol. (June 2007) 47:132–138
123
results of tannase production from these experiments along with the mean predicted and observed response as obtained by CCRD are presented in Table 2. The regression analysis of the experimental data obtained after ANOVA resulted in the following second order polynomial equation-
Tannase activity (Y) = + 19.51 – 0.19 *A + 0.20 *B + 0.082 *C + 1.61 *D – 2.85 *A2 – 0.83 *B2 – 1.30 *C2 – 4.08 *D2
+ 0.073 *A*B + 0.091 *A*C – 0.034 *A*D + 0.59 *B*C +0.36 *B*D + 0.38 *C*D (2)
where Y is the tannase produced as a function of the coded levels of tannic acid (substrate) conc. (A), sodium nitrate concentration (B), agitation rate (C) and incubation period (D).
The coeffi cient of determination (Rfi 2) was calculated as 0.99 for tannase activity (Table 3). This explains 99 %R squared of the total variation for tannase activity. Thisclearly shows that this model is an adequate predictor of the experimental conditions and confirms that the selected fiprocess parameters signifi cantly inflfi uence tannase activity.fl
The Model F-value of 1063.09 for tannase productionand values of Prob > F (<0.05) demonstrated a high sig-nificance for the regression model. For tannase productionfiA, B, D, A2, B2, C2, D2, BC, BD and CD were significant fimodel terms. The ‘Lack of Fit F-value’ of 4.22 implied that Lack of Fit was insignifi cant relative to pure error, which fiindicated that the model was suitable to represent the exper-imental data. The predicted sum of squares (PRESS), which is a measure of how particular model fi ts each point in thefidesign, was 3.64. The model was found to be significant for fiproduction within the range of variables employed.
The three-dimensional surface plots for tannase activ-ity were constructed to determine the optimal levels of the parameters (variables) according to equation 1. Here, eachresponse was plotted as the function of substrate (tannicacid) concentration, sodium nitrate concentration, agitation rate and incubation period.
Relative effect of two variables (tannic acid and incuba-tion period) on tannase production when sodium nitrate and agitation rate were kept at their central levels (0.8% sodiumnitrate and 150 rpm agitation rate) has been depicted in the response surface plot of Fig. 1. Maximum tannase produc-tion was 19.7 UmL–1 in 48h when the level of tannic acid was at their central value of 5% (v/v). Increasing the tannic acid concentration beyond 5% (v/v) led to decline in tan-nase production. Also, increase in incubation period beyond 48 h resulted in decline in the enzyme production.
The optimum concentration of 5% tannic acid obtained in the present investigation was in agreement with previousreports of Akoi et al.16 and Lekha and Lonsane1. Aguilaret al.2 also reported that in submerged fermentation, tannasesecretion was favored by an initial tannic acid concentration of 50 gL–1 from A. niger Aa-20. However, Bradoor et al.17
reported 2% tannic acid as optimum for tannase production
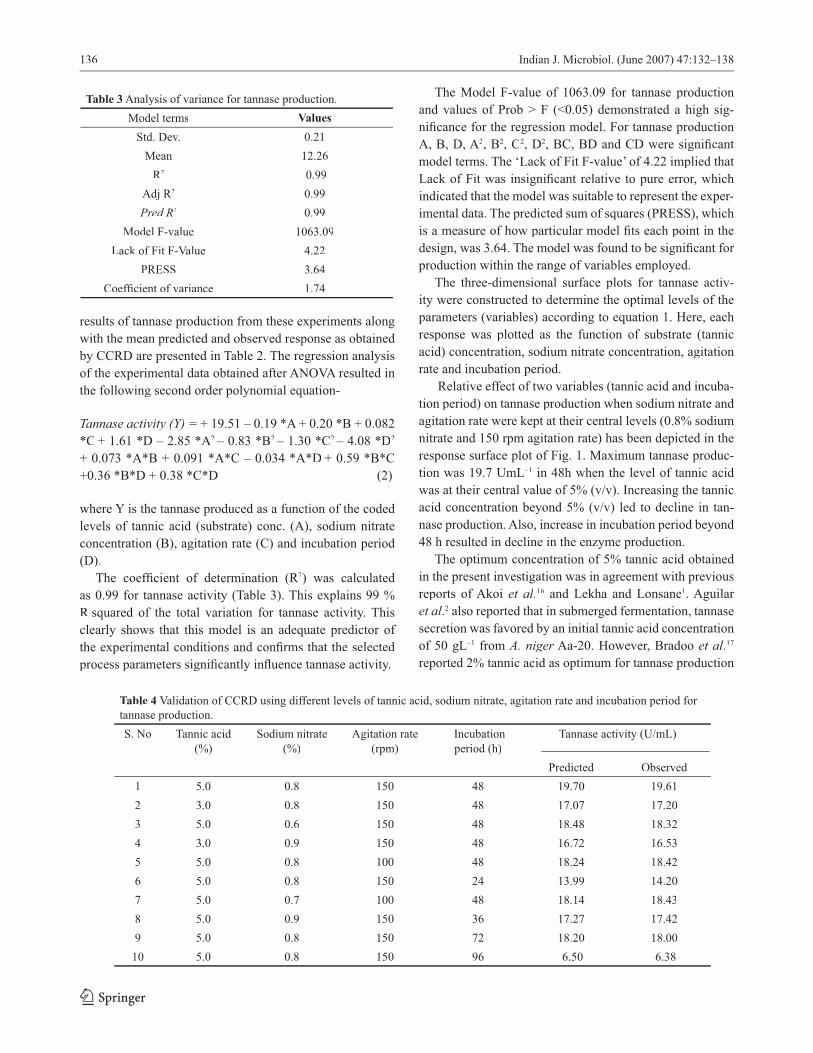
Table 3 Analysis of variance for tannase production.Model terms Values
Std. Dev. 0.21Mean 12.26
R2 0.99Adj R2 0.99Pred R2 0.99
Model F-value 1063.09Lack of Fit F-Value 4.22
PRESS 3.64Coeffi cient of variance 1.74fi
Table 4 Validation of CCRD using different levels of tannic acid, sodium nitrate, agitation rate and incubation period for tannase production.S. No Tannic acid
(%)Sodium nitrate
(%)Agitation rate
(rpm) Incubationperiod (h)
Tannase activity (U/mL)
Predicted Observed1 5.0 0.8 150 48 19.70 19.612 3.0 0.8 150 48 17.07 17.203 5.0 0.6 150 48 18.48 18.324 3.0 0.9 150 48 16.72 16.535 5.0 0.8 100 48 18.24 18.426 5.0 0.8 150 24 13.99 14.207 5.0 0.7 100 48 18.14 18.438 5.0 0.9 150 36 17.27 17.429 5.0 0.8 150 72 18.20 18.00
10 5.0 0.8 150 96 6.50 6.38
Indian J. Microbiol. (June 2007) 47:132–138 137
123
from A. japonicus. Hadi et al.18 also reported maximumenzyme production of 6.12 UmL–1 at 2 % tannic acid from R. oryzae.
For maximum tannase production (19.7 UmL–1), an in-cubation period of 48 h was found to be the optimum in the present investigation, which declines on further incubation.It has also been reported that tannase is produced during the primary phase of growth and thereafter declines19. Kar and Banerjee20 also found 48 h as optimum incubation period for the maximum tannase production (23.86 UmL–1) for R. oryzae. However, Hadi et al.18 and Lekha and Lonsane4
reported maximum tannase production in 120 h and 144 hfrom R. oryzae and Aspergillus PKL 104 respectively.
Further, sodium nitrate concentration was also effective for tannase production. An increase in sodium nitrate con-centration from 0.6 to 0.8% w/v resulted in an increase in the tannase activity from 9.75 UmL–1 to 19.7 UmL–1 when incubation period and agitation rate were at their central val-ues of 48h and 150 rpm (Fig. 2). Contrary to our findings, fiBradoo et al.17 reported 0.2 % w/v sodium nitrate as optimal for growth and tannase production from A. japonicus. How-ever, Hadi et al.18 reported sodium nitrate concentration as low as 0.05% w/v optimal for tannase production from Rhizopus oryzae. An interaction between agitation rate and tannic acid at constant sodium nitrate concentration (0.8%)
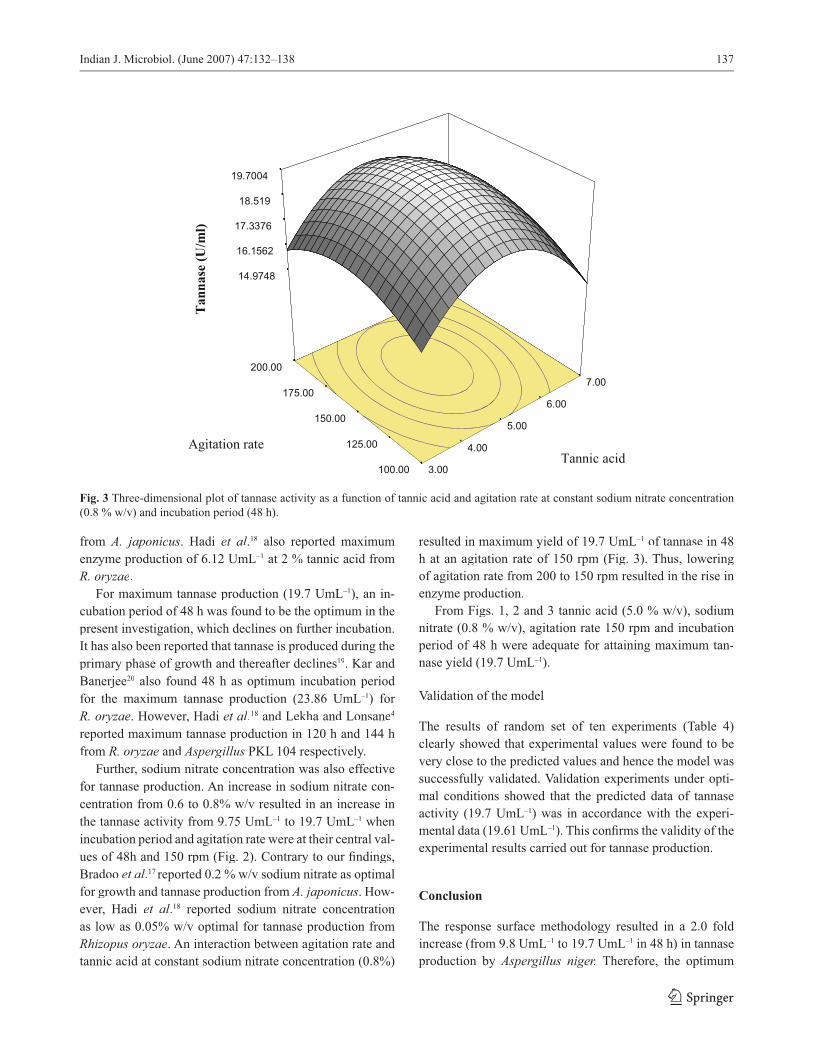
resulted in maximum yield of 19.7 UmL–1 of tannase in 48 h at an agitation rate of 150 rpm (Fig. 3). Thus, loweringof agitation rate from 200 to 150 rpm resulted in the rise inenzyme production.
From Figs. 1, 2 and 3 tannic acid (5.0 % w/v), sodium nitrate (0.8 % w/v), agitation rate 150 rpm and incubationperiod of 48 h were adequate for attaining maximum tan-nase yield (19.7 UmL–1).
Validation of the model
The results of random set of ten experiments (Table 4)clearly showed that experimental values were found to bevery close to the predicted values and hence the model was successfully validated. Validation experiments under opti-mal conditions showed that the predicted data of tannase activity (19.7 UmL–1) was in accordance with the experi-mental data (19.61 UmL–1). This confirms the validity of the fiexperimental results carried out for tannase production.
Conclusion
The response surface methodology resulted in a 2.0 fold increase (from 9.8 UmL–1 to 19.7 UmL–1 in 48 h) in tannase production by Aspergillus niger. Therefore, the optimum
14.9748
16.1562
17.3376
18.519
19.7004
Tan
nase
(U/m
l)
3.00
4.00
5.00
6.00
7.00
100.00
125.00
150.00
175.00
200.00
Tannic acidAgitation rate
Fig. 3 Three-dimensional plot of tannase activity as a function of tannic acid and agitation rate at constant sodium nitrate concentration (0.8 % w/v) and incubation period (48 h).
138 Indian J. Microbiol. (June 2007) 47:132–138
123
composition for tannase production from A. niger using rRSM was 5% tannic acid, 0.8% sodium nitrate, 5.0 pH, 5 x I07 spores/50mL inoculum density, 150 rpm agitation and incubation period of 48 h.
Acknowledgements R.K. Saxena acknowledges withthanks to Department of Science and Technology, Government of India for the fi nancial support of this project. ShashifiSharma gratefully acknowledges the Council of Scientific and fiIndustrial research (CSIR) New Delhi, Govt. of India for theaward of Senior Research Fellowship.
References
1. Lekha PK & Lonsane BK (1997) Production and application of tannin acyl hydrolase; state of the art. Adv Appl Microbiol 44:215–260
2. Aguilar CN, Augur C, Favela-Torres E & Viniegra-GonzalezG (2001) Production of tannase by Aspergillus niger Aa-20rin submerged and solid state fermentation: influence offlglucose and tannic acid. J Ind Microbiol Biotechnol 26:295–302
3. Gaathon A, Gross Z & Rozhanski M (1989) Propyl gallate:enzymatic synthesis in a reverse micelle system. EnzymeMicrob Technol 11:604–609
4. Lekha PK & Lonsane BK (1994) Comparative titres, loca-tion and properties of tannin acyl hydrolase produced byAspergillus niger PKL 104 in solid state, liquid surface and rsubmerged fermentations. Process Biochem 29:497–503
5. Conesa MT, Ostergaard P, Kauppineu S & Williamson G(2001) Hydrolysis of diethyl diferulates by a tannase fromAspergillus oryzae. Carbohydrate Polymers 44:319–324.
6. Hounsa CG, Aubry JM, Dubourguier HC & Hornez JP (1996) Application of factorial and doehlert designs for optimization of pectate lyase production by a recombinant Escherichia coli. Appl Microbiol Biotechnol 45:764–770
7. Ooijkaas LP, Wilkinson EC, Tramper J & Buitelaar RM(1999) Medium optimization for spore production of Co-niothyrium minitans using statistically based experimental designs. Biotechnol Bioeng 64:92–100
8. Hounjg JY, Chen KC & Hsu, WH (1989) Optimization of cultivation medium composition for isoamylase production. Appl Microbiol Biotechnol 39:61–64
9. Puri S, Beg QK & Gupta R (2002) Optimization of alkaline protease production from Bacillus sp. by response surface methodology. Curr Microbiol 44:286–290
10. Sunitha I, Subba Rao MV & Ayyanna C (1998) Optimization of medium constituents and fermentation condition for the production of L-glutamic acid by the coimmobilized wholecells of Micrococcus glutamicus and Pseudomonas reptili-vora. Bioprocess Eng 18:353–359
11. Yalimaki G, Hawrysh ZJ, Hardin RT & Thomson ABR (1991) Response surface methodology in the development of rice flour yeast breads: Sensory evaluation. J Food Sci 56:fl751–755
12. Ambati P & Ayyanna C (2001) Optimization of medium con-stituents and fermentation conditions for citric acid produc-tion from palmyra jaggery using response surface method. World J Microbiol Biotechnol 17:331–335
13. De Coninck J, Bouquelet S, Dumortier V, Duyme F & De-nantes VI (2000) Industrial media and fermentation process for improved growth and protease production by Tetrahyme-na thermophila BH1. J Ind Microbiol Biotech 24:285–290
14. Haaland PD (1989) Statistical problem solving. In: Experi-mental design in biotechnology (Haaland PD ed). MarcelDecker, New York, pp 1–18
15. Deschamps AM, Otuk G & Lebeault JM (1983) Production of tannase and degradation of chestnut tannin by bacteria. J Ferment Technol 61:55–59
16. Akoi K, Shinke R & Nishira H (1976) Purifi cation and somefiproperties of yeast tannases. Agric Biol Chem 40:79–85
17. Bradoo S, Gupta R & Saxena RK (1997) Parametric opti-mization and biochemical regulation of extracellular tannase from Aspergillus japonicus. Process Biochem 32:135–139
18. Hadi TA, Banerjee R & Bhattacharya BC (1994) Optimi-zation of tannase biosynthesis by newly isolated Rhizopusoryzae. Bioprocess Eng 11:239–243
19. Rajakumar GS & Nandy SC (1983) Isolation, purification fiand some properties of Penicillium chrysogenum tannase. Appl Environ Microbiol 46:525–527
20. Kar B & Banerjee R (2000) Biosynthesis of tannin acyl hy-drolase from tannin – rich forest residue under different fer-mentation conditions. J Ind Microbiol Biotechnol l25:29–38


![[Micro] aspergillus](https://img.pdfslide.us/doc/110x75/55d6fc36bb61eb0d2b8b47a8/micro-aspergillus.jpg)