Embed Size (px)
Citation preview

Statistical opportunities and challenges of electronic health records
Dr Alex DreganLecturer in Epidemiology and Public Health
email: [email protected]

Electronic health records (EHRs)• Capture and integrate data on all aspects of care over time
– various data types, from structured information such as condition diagnosis, lab tests, referrals, drug prescription data, to unstructured data such as clinical narratives
• Growing volume of data – Prescribing, blood pressure, morbidity data is accurate and complete– Data can be related to individual patients' characteristics (sex, age, social class) and practice
aspects (ie practice size, region, number of GPs, auxiliary staff)
• Widespread use in UK primary care– For effective communication, clinical care, service organisation, quality and audit,
professional development and self-directed learning – Potential to supporting undergraduate learning and teaching as it reflects the context in
which the students will be ultimately working– Graduates must be able to use different techniques to record, organise, analyse, and
present information
Guy’s and St Thomas’ NHS Foundation Trust and King’s College London’scomprehensive Biomedical Research Centre

Antibiotic prescribing for acute RTIs
CPRD practices
Control Intervention
Electronic reminder to GP, no or delayed AB prescribing
NICE guidelinesQualitative research
Proportion of consultations for RTI with AB prescribed
Subjects aged 18-59 years consulting for RTI, 60% prescribed AB in 2006
Using EHRs for research – example
Guy’s and St Thomas’ NHS Foundation Trust and King’s College London’scomprehensive Biomedical Research Centre

Using EHRs for research – example Analysis
• Sample size (Hayes and Bennett (1999)): 47 practice per arm for an 0.8 power to detect 5% difference (ICC=0.23; Ashworth et al., 2005)
• Statistical analysis:
- Intention to treat (ITT) principle - difference in outcome between intervention and control practices
- Cluster-level (practice as a unit) analysis – analysis of covariance framework
- Minimum variance weights (Kerry and Bland, 2001) used to allow for varying number of participants and consultations per practice
Guy’s and St Thomas’ NHS Foundation Trust and King’s College London’scomprehensive Biomedical Research Centre

5
Prompt Utilisation
Guy’s and St Thomas’ NHS Foundation Trust and King’s College London’scomprehensive Biomedical Research Centre

RTI consultation and AB prescribing per 1,000 registered participants and proportion (%) of RTI consultations with AB prescribed. Figures are mean (interquartile range) of
practice-specific values for 12 months before- and after- intervention.
Intervention Trial Arm Control Trial Arm Adjusted mean differenced
(95% confidence interval)
P
value Before
After Before After
RTI Consultation rate 219(181; 254)
209 (176;247)
216 (186; 246)
218(184;244)
-9.10 (-21.51;3.30)
0.148
Antibiotic Prescription rate 116 (91; 131)
108 (87;129)
111 (86; 135)
114 (85 ; 128)
-9.69 (-18.63; -0.75)
0.034
AB Prescriptions Per RTI Consultation (%)
53 (46 ;60)
52 (45; 58)
52 (45;60)
52 (45;59)
-1.85 (-3.59;-0.10)
0.038
Guy’s and St Thomas’ NHS Foundation Trust and King’s College London’scomprehensive Biomedical Research Centre

Intervention utilisation and AB prescribing by quartile of intervention utilisation.
Control practices
Lowest Quartile of Utilisation
(13)
SecondQuartile (13)
ThirdQuartile (13)
Highest Quartile of Utilisation
(13)
Intervention Utilisation (per 1,000 consultations for RTI)
Prompt Views Not applicable 0 (0 ; 0) 16 (0 ; 22) 77 (0 ; 117) 174 (68 ; 248)
Leaflets Printed Not applicable 0 (0 ; 0) 6 (0 ; 0) 18 (0 ; 21) 15 (0 ; 0)
Proportion (%) of RTI consultations with antibiotics prescribed
Before Intervention 52 (45 ; 59) 55 (49 ; 61) 53 (46 ; 59) 55 (51; 63) 50 (41 ; 57)
After Intervention 52 (45 ; 59) 54 (46 ; 63) 54 (51 ; 60) 53 (52;61) 48 (42 ; 54)
Unadjusted mean difference
(95% confidence interval)
0.7 (-0.6 ; 2.0) -1.2 (-5.1 ; 2.8)
-1.0 (-2.9; 0.9) -1.4 (-3.9;1.0) -1.6 (-5.0; 1.7)
Adjusted test for trend across categories (95% confidence interval) -0.64 (-1.23 ; -0.05) P=0.034
Guy’s and St Thomas’ NHS Foundation Trust and King’s College London’scomprehensive Biomedical Research Centre

Using EHRs for research - example (cont.)
Inflammatory disorders and risk of cardiovascular diseases
• Outcomes– New diagnoses of stroke, CHD, and T2DM. – Multiple morbidity was defined as the occurrence of ≥2 outcomes in a participant.– Mean of CRP values (biomarker)
• Exposure– Chronic inflammatory disorders including psoriasis, Crohn’s disease, Bullous skin
disease, ulcerative colitis, systemic lupus, inflammatory arthritis, and vasculitis
• Statistical analysis– Cox proportional hazards model – Sensitivity analyses using competing risk analysis– Missing indicator variables to deal with missing data– Random-effects meta-analysis
Guy’s and St Thomas’ NHS Foundation Trust and King’s College London’scomprehensive Biomedical Research Centre

Forest plot displaying random effect meta-analysis of the influence of diverse chronic inflammatory conditions on multiple cardiovascular. HR=Hazard ratios; CI=Confidence
intervals.
Overall (I-squared = 48.7%, p = 0.058)
Inflammatory Arthritis
Crohn's Disease
Ulcerative Colitis
Systemic Vasculitis
Chronic Inflammatory Disease
Bullous Skin Diseases
Psoriasis, Mild
Systemic Autoimmune Disorders
Psoriasis, Severe
1.20 (1.15, 1.26)
1.12 (1.05, 1.18)
1.06 (0.90, 1.24)
1.26 (1.14, 1.40)
1.29 (1.16, 1.44)
HR (95% CI)
1.17 (1.03, 1.33)
1.32 (1.16, 1.50)
100.00
19.94
6.47
11.95
11.24
9.03
23.47
8.96
8.96
1.20 (1.15, 1.26)
1.12 (1.05, 1.18)
1.06 (0.90, 1.24)
1.26 (1.14, 1.40)
1.29 (1.16, 1.44)
HR (95% CI)
1.17 (1.03, 1.33)
1.18 (1.13, 1.23)
1.32 (1.16, 1.50)
1.29 (1.16, 1.50)
100.00
19.94
6.47
11.95
11.24
% Weight
9.03
23.47
8.96
8.96
1 1.25 1.5 1.75
Guy’s and St Thomas’ NHS Foundation Trust and King’s College London’s comprehensive Biomedical Research Centre

Using EHRs for research - example (cont.)Sodium Valproate and risk of stroke - A nested case-control study
A nested case control study was implemented using data from the Clinical Practice Research Datalink (CPRD) (www.cprd.com).
The study population consisted of a cohort of epilepsy (N=15,001) patients treated with at least one AED who were registered with 653 CPRD practices between 1 January 1992 and 31 January 2013.
Exposure: Sodium valproate treatment represented the primary exposure of interest for the present study.
Outcomes: Ischemic stroke
Analysis: Conditional logistic regression analysis
Guy’s and St Thomas’ NHS Foundation Trust and King’s College London’scomprehensive Biomedical Research Centre

Using EHRs for research - example (cont.)
Case(N=2,002)
Control(N=13,098)
Unadjusted modelOR† (95%CI) p
Fully adjusted modelOR† (95%CI) p
Ever prescribed 681(34) 4,407(34) 1.03(0.93,1.14) 0.555 1.01(0.91,1.12) 0.875
Pre-stroke year 555(28) 3,106(24) 1.27(1.14,1.41) 0.001 1.22(1.09,1.38) 0.001
Number of SV prescriptions
None 1,321(66) 8691(66) Reference Reference
Lowest quarter 227(11) 1,075(8) 1.47(1.26,1.72) 0.001 1.22(1.02,1.45) 0.025
Second quarter 198(10) 1,062(8) 1.28(1.09,1.59) 0.003 1.21(1.02,1.45) 0.033
Third quarter 166(8) 1,100(9) 0.99(0.83,1.18) 0.924 1.00(0.83,1.21) 0.972
Highest quarter 90(5) 1,170(9) 0.49(0.39,0.61) <0.001 0.59(0.46,0.74) <0.001
Time on SV prescriptions
None 1,321(66) 8,915(68) Reference Reference
Lowest quarter 256(13) 962(7) 1.97(1.68,2.29) <0.001 1.62(1.37,1.92) <0.001
Second quarter 194(10) 1,023(8) 1.35(1.14,1.60) 0.001 1.28(1.07,1.54) 0.007
Third quarter 146(7) 1,068(8) 0.92(0.76,1.11) 0.373 0.95(0.78,1.15) 0.584
Highest quarter 85(4) 1,130(9) 0.48(0.38,0.60) 0.001 0.57(0.44,0.72) <0.001
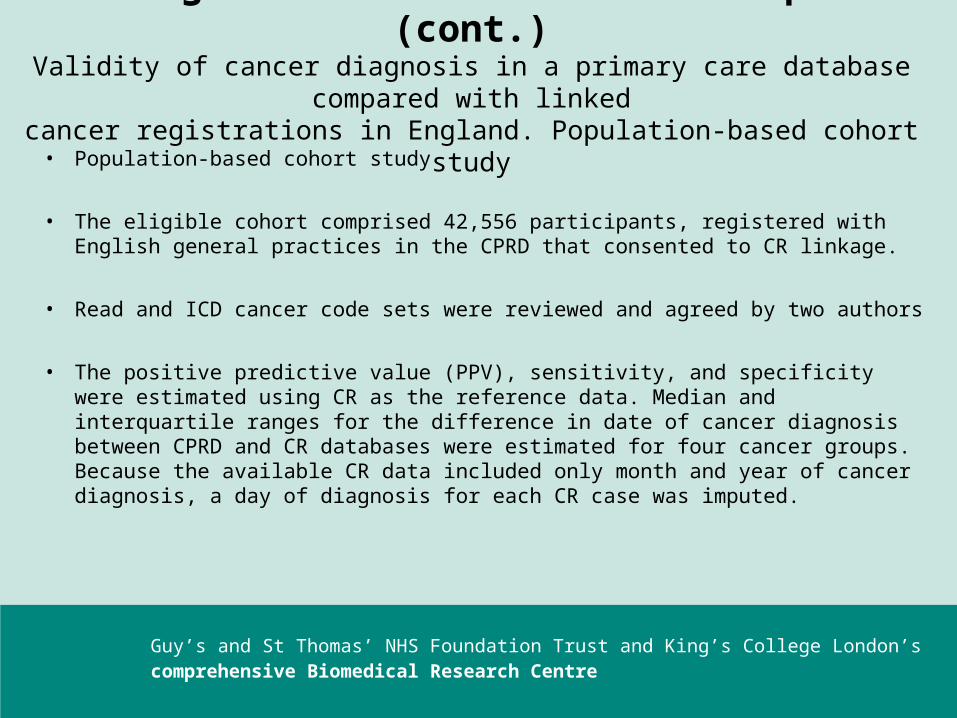
Using EHRs for research - example (cont.)Validity of cancer diagnosis in a primary care database compared with linked
cancer registrations in England. Population-based cohort study
• Population-based cohort study
• The eligible cohort comprised 42,556 participants, registered with English general practices in the CPRD that consented to CR linkage.
• Read and ICD cancer code sets were reviewed and agreed by two authors
• The positive predictive value (PPV), sensitivity, and specificity were estimated using CR as the reference data. Median and interquartile ranges for the difference in date of cancer diagnosis between CPRD and CR databases were estimated for four cancer groups. Because the available CR data included only month and year of cancer diagnosis, a day of diagnosis for each CR case was imputed.
Guy’s and St Thomas’ NHS Foundation Trust and King’s College London’scomprehensive Biomedical Research Centre

Using EHRs for research - example (cont.) CPRD Cancer registry CPRD total Grand total PPV Sensitivity Specificity
Recorded Not recorded
Colorectal Recorded 1732 43 1775 0.98 0.92 0.99
Not recorded 150 40631
CR total 1882 42556
Lung Recorded 1659 65 1724 0.96 0.94 0.99
Not recorded 104 40626
CR total 1763 42556
Oesophageal Recorded 872 27 899 0.97 0.92 0.99
Not recorded 74 41583
CR total 946 42556
Urological Recorded 953 78 1031 0.92 0.85 0.99
Not recorded 166 41359
CR total 1119 42556
Guy’s and St Thomas’ NHS Foundation Trust and King’s College London’scomprehensive Biomedical Research Centre

Using EHRs for research - opportunities
• Mining of electronic health records (EHRs) - establishing new patient-stratification principles and for revealing unknown disease correlations
– Identify persons at very high (e.g. >99th percentile, risk scores) risk for a given condition
– Identify novel risk/protective factors for disease onset and progression
• Integrating EHR data with registry data – Link primary care data with genetic data (UK Biobank and CPRD linkage)– Link primary care with registry data (CPRD with National Cancer Registry linkage)
• Developing predictive models for– Therapeutic interventions effectiveness and safety (pharmacovigilance) – use of
propensity score matching to adjust for confounding
• Decision support systems – Synthesize large amounts of information to provide alerts related to adverse events,
patient safety, treatment course
Guy’s and St Thomas’ NHS Foundation Trust and King’s College London’scomprehensive Biomedical Research Centre

Using EHRs for research Challenges - data
• Concepts– Probability, randomness, variability, statistical errors, central limit theorem
• Data – Reporting – ie CONSORT, TREND, STROBE– Accessing and visualizing - ie manipulation, graphical representation– Interpretation - clinical vs statistical significance, effect size
• Sources of bias– Incomplete data - EHR data are captured at the point of care by GPs, patients who
do not regularly interact with the health system may have incomplete data– Sampling bias, protopathic bias, measurement error, residual bias, confounding by
indication
• Prediction models– Uncovering patterns in patient trajectories through disease and intervention nodes (ie
medication) in a clinical context is statistically and computationally challenging – Inferential methods for clustered, matched, paired, or longitudinal studies– Multiple testing – common in EHRs research
Guy’s and St Thomas’ NHS Foundation Trust and King’s College London’scomprehensive Biomedical Research Centre

Using EHRs for research Challenges – students & teachers
• Motivation and interests– Most students will be clinicians not researchers - focus on design, choice of analytical
methods, and interpretation of findings?– Statistics is not seen as a ‘core’ subject for medical training – use real-world examples,
uses and abuses of statistics
• Aptitudes – Differences in prior exposure to statistics – group work – Learning disabilities – greater use of technology– Differences in teaching abilites
• Assessment– Formative vs summative assessment– Use of quizzes at the end of each lecture/tutorial? Peer assessment?
• Teaching methods– Online modules/ youtube type learning– Lab-based teaching/use of personal computers during tutorial– Staff shortage – training the teacher?
Guy’s and St Thomas’ NHS Foundation Trust and King’s College London’scomprehensive Biomedical Research Centre

Using EHRs for research Challenges
• EHRs are becoming common and viewed as a potential tool for healthcare quality assessment, clinical trials and health outcomes research
• Visualizing the data in clinical settings is a challenge, much less applying standard statistical methodology (standard errors and p-values) that may have little or no meaning in very large sample sizes
• Where biostatistics will fit in future education? – Biostatistics is often viewed as a separate entity, and much of it is not directly statistical in
nature, as the issue of how to process such large datasets is a dominating consideration– Public health also requires the analysis of large databases, both specifically and in
relation to issues affecting the ongoing restructuring of the NHS and is also a key area of potential research for biostatistics
– Integrate statistics teaching within the context of epidemiological analysis, medical-decision making, computing, and policy development
Guy’s and St Thomas’ NHS Foundation Trust and King’s College London’scomprehensive Biomedical Research Centre

Thank you
Questions?
Guy’s and St Thomas’ NHS Foundation Trust and King’s College London’scomprehensive Biomedical Research Centre


![Peter Sollich peter.sollich@kcl.ac.uk arXiv:1906.09526v1 [stat.ML] … · 2019-06-25 · dino.oglic@kcl.ac.uk Zoran Cvetkovic Department of Informatics King’s College London zoran.cvetkovic@kcl.ac.uk](https://img.pdfslide.us/doc/110x75/5e378a6daa00873cf714d3ad/peter-sollich-petersollichkclacuk-arxiv190609526v1-statml-2019-06-25.jpg)