Embed Size (px)
Citation preview

ÉCOLE POLYTECHNIQUEFÉDÉRALE DE LAUSANNE
Statistical Models forKnock-out Soccer Tournaments
Diego KuonenDepartment of MathematicsChair of Applied StatisticsProf. S. Morgenthaler, DMA, EPF LausanneAssistant: E. Chavez, DMA, EPF LausanneWinter 1996/97

Table of Contents1 Introduction 11.1 Preliminary . . . . . . . . . . . . . . . . . . . . . . . . . . . . . . . . . . . 11.2 European Cups . . . . . . . . . . . . . . . . . . . . . . . . . . . . . . . . . 11.2.1 Champions Cup . . . . . . . . . . . . . . . . . . . . . . . . . . . . . 11.2.2 Cup Winners Cup . . . . . . . . . . . . . . . . . . . . . . . . . . . . 21.2.3 UEFA Cup . . . . . . . . . . . . . . . . . . . . . . . . . . . . . . . 21.2.4 UEFA Intertoto Cup . . . . . . . . . . . . . . . . . . . . . . . . . . 42 Descriptive Data Analysis 52.1 Data Structure . . . . . . . . . . . . . . . . . . . . . . . . . . . . . . . . . 52.2 Tree Structure . . . . . . . . . . . . . . . . . . . . . . . . . . . . . . . . . . 62.3 Seeding Coe�cients . . . . . . . . . . . . . . . . . . . . . . . . . . . . . . . 82.3.1 First Approach . . . . . . . . . . . . . . . . . . . . . . . . . . . . . 92.3.2 Improvement . . . . . . . . . . . . . . . . . . . . . . . . . . . . . . 112.4 Tournament Analysis . . . . . . . . . . . . . . . . . . . . . . . . . . . . . . 132.4.1 Possible Sets of Winners . . . . . . . . . . . . . . . . . . . . . . . . 132.4.2 Probability of Winning . . . . . . . . . . . . . . . . . . . . . . . . . 142.4.3 Potential Opponents . . . . . . . . . . . . . . . . . . . . . . . . . . 163 Statistical Modelisation 173.1 Logistic Regression Model . . . . . . . . . . . . . . . . . . . . . . . . . . . 173.2 Constancy of Team Strength . . . . . . . . . . . . . . . . . . . . . . . . . . 173.2.1 Model Chosen . . . . . . . . . . . . . . . . . . . . . . . . . . . . . . 183.2.2 The Program . . . . . . . . . . . . . . . . . . . . . . . . . . . . . . 203.2.3 Number of Correct Predictions . . . . . . . . . . . . . . . . . . . . 233.3 Variation of Team Strength . . . . . . . . . . . . . . . . . . . . . . . . . . 253.3.1 Model Chosen . . . . . . . . . . . . . . . . . . . . . . . . . . . . . . 253.3.2 Using Probable Opponents . . . . . . . . . . . . . . . . . . . . . . . 26i

Table of Contents3.3.3 Using All Potential Opponents . . . . . . . . . . . . . . . . . . . . . 293.3.4 Number of Correct Predictions . . . . . . . . . . . . . . . . . . . . 323.3.5 Evaluation of the Coe�cients . . . . . . . . . . . . . . . . . . . . . 344 Comparison of the Methods 365 Conclusion 39A Appendix 40A.1 The Bradley-Terry Model . . . . . . . . . . . . . . . . . . . . . . . . . . . 40A.2 Tournament Trees . . . . . . . . . . . . . . . . . . . . . . . . . . . . . . . . 41A.2.1 Cup Winners Cup . . . . . . . . . . . . . . . . . . . . . . . . . . . . 41A.2.2 UEFA Cup . . . . . . . . . . . . . . . . . . . . . . . . . . . . . . . 48A.3 Evaluation of the Coe�cients . . . . . . . . . . . . . . . . . . . . . . . . . 55A.3.1 Using Probable Opponents . . . . . . . . . . . . . . . . . . . . . . . 55A.3.2 Using All Potential Opponents . . . . . . . . . . . . . . . . . . . . . 59B References 63
ii
Introduction1 Introduction1.1 PreliminarySports events and tournament competitions provide excellent opportunities for modelbuilding and using basic statistical methodology in an interesting way. In this paper, alogistic regression model using seed positions (conceived through a seeding coe�cient)is applied to European soccer Cups tournament data in order to predict the probabilityof winning the tournament for each one of the participating teams, and the predictedprobabilities of each team reaching a certain leg such as the quarter �nal.1.2 European CupsThis section was coined by M. Protzen (1996).There are four di�erent European Cups� the Champions Cup (CC),� the Cup Winners Cup (CWC),� the UEFA Cup (UC), originally intended for League runners up,� and the UEFA Intertoto Cup (UIC).The quali�cation for these competitions depends on the performance in National LeaguesCup competitions respective. The Champion usually enters the CC, the Cup Winner(losing �nalist in case of a double respective) enters the CWC, while a variable numberof League runners up enter the UC (in some countries winners of a League Cup enter theUC as well). Teams �nishing below those qualifying for the UC may enter the UIC.1.2.1 Champions CupOriginally this Cup was intended for the league winners of the member FAs of UEFA. Awhile ago the quali�cation process for the CC has been modi�ed such that only the CCdefender together with the top 23 champions enters the CC while all other champions willenter the UC. The CC defender and the 7 best champions advance directly to the leaguestage while the champions ranked 8th to 15th have to play a preliminary tie against oneof the champions ranked 16th to 23rd. To determine the top champions (and the numberof UC berths allocated to a country) UEFA maintains a ranking list.1

IntroductionNew format for 1997/98For the upcoming season UEFA has once again changed the format to allow the vicechampions of the 8 top ranked countries as well as the champions of up to 48 countriesinto the competition.The league stage will be played in six groups of four teams. From there the six groupwinners together with two best runners-up will advance to the quarter �nals. The twobest runners-up will be determined by points achieved, goal di�erence, goals scored andgoals scored away.To cut down the number of teams the champions of countries ranked 17 to 48 in themost recent ranking table play a preliminary round in late July. For the losers of thistie their European campaign is over. Winners play in the quali�cation round togetherwith champions of countries ranked 9 to 16 and vice champions of countries ranked 1 to8. Winners of this round advance to the league stage where they will be joined by thechampions of the top ranked countries. Losers will play in the �rst round of the UEFACup.The defending Cup Winner gets an automatic place in the league stage regardlesswhere he �nishes in his national competition. This may mean that the champions of thecountries ranked 8th, 16th (and 48th) are 'downgraded'.1.2.2 Cup Winners CupThe Cup Winners of the FA Cups of the member FAs of UEFA get to play in this Cupunless they also win the domestic championship (in which case they will be replaced bythe losing cup �nalists). The CWC defender is also eligible to play (unless he becomesnational champion).UEFA is also considering to allow a second team from the eight top ranked countriesto play the CWC. How the second team will be determined has not yet been �xed. Thismodi�cation will not e�ect for 96/97 and 97/98 competitions.1.2.3 UEFA CupThe UEFA Cup started (under the name "Fairs Cup") as a competition between cityteams from cities which host a trade fair. Later it was a competition for the runners upof the various leagues, some countries enter also their League Cup winner. The numberof participants from each country is determined by the UEFA ranking list. Since theChampions League was introduced the champions not eligible for the Champions Leagueare entered into the UEFA Cup as well, another three berths are reserved for the Inter-toto Cup semi �nalists and three are given to countries who top the UEFA Fair Playcompetition. 2

Introduction� 79 participants are determined by the UEFA coe�cient table:{ 3 countries with four berths{ 5 countries with three berths{ 13 countries with two berths{ 26 countries with one berth� 24 champions not entering the CC� 3 Intertoto Cup participants� 3 Fair Play competition winnersThe three countries which top the UEFA Fair Play competition each get one addi-tional UEFA cup berth in the next competition. The 1995/96 berths were allocatedto Norway, England and Luxembourg, the 1996/97 berths have been awarded toSweden, Russia and Finland (one berth originally awarded to England has been re-voked because of �elding youth and reserve teams in the 1995 UIC) and in 1997/98Norway, England and Sweden will get the berths.� 1 defending UEFA Cup Holder (only if they do not qualify for any European com-petition otherwise)� 8 preliminary round losers from the Champions Cup (since 1996/97)Altogether, there are 118 participants.For the 96/97 competition the following format will be used:� Preliminary round in July, involving 54 teams from countries with the lowest countrycoe�cient in the 95/96 ranking� Qualifying round in August, involving 50 teams (27 winners from the qualifyinground, 23 teams from the countries with low coe�cients which did not play in thepreliminary round) + 6 Intertoto teams.� First round in September, involving 64 teams (25 winners from the preliminaryround, 8 teams eliminated from the Champions Cup, 28 teams from countries withhigh rankings and 3 teams qualifying through the UIC).Barring participation of teams from San Marino, Andorra and Bosnia the 97/98 com-petition will have 16 participants fewer: 24 champions of low ranked countries will notenter the UC but 16 instead of 8 CC quali�cation round losers will play in the �rst round.From 1997/98 on the �nal will be decided in a single game on neutral ground.3

Introduction1.2.4 UEFA Intertoto CupThe Intertoto Cup started as a way to guarantee income to the Toto-industry in the earlysixties (in fact, this generated a signi�cant sum of money for clubs in several countries,one of them the Netherlands). The �rst one or two seasons the group winners played outa �nal stage to determine an overall winner (the �rst being Ajax). After a few years thecompetition degenerated into summer practice for mid table teams of North, Central andEast European countries. Teams from the British Islands, Spain or Italy rarely partici-pated. No �nal stage was played after the initial (one or two) season(s) and nobody reallycared for it. This new directive by UEFA seems like a �nal attempt of attracting someattention to it.The 'new' UEFA Intertoto-Cup has started in the summer of 1995. The cup will beplayed during the summer, and the teams allowed to participate should have been thebest �nishing teams in the respective leagues the previous season not already quali�edfor any of the other three European Cups. The number of teams from each country isdetermined by the UEFA ranking of countries just as in the UC (with the exception thatalso the bottom clubs are entitled to one berth).60 teams are divided into 12 groups with the winners of each group qualifying for aknock-out round, from where the best 3 teams qualify for the �rst round proper of theUEFA Cup the following autumn.From the 1995 UIC two French teams, Racing Strasbourg and Girondins de Bordeaux,emerged successful and participated in the UC, Bordeaux even reached the UC �nal.A number of changes have been announced for the 1996 UIC: The number of UCberths available through this competition has been raised to 3, Italian teams will join thecompetition and teams are urged to take the competition serious, i.e. play with their �rstteam.Some countries do not take part in the competition: England, Portugal, Scotland andLuxembourg. Italy sends only three teams, Spain and Greece only one. Italy and Spainlater renounced their remaining berths for the UIC, they were heavily �ned for that. AlsoGreece and Albania did not take their berths. Those six berths went to Estonia, Lithuania,Austria, Turkey, Denmark and Sweden.Also the format of the cup has changed slightly: Again there will be 12 groups with5 teams each. But fortunately the concept of "best seconds" has been cancelled: The 12winner will play one elimination round with the 6 winners playing another round as partof the UC preliminary round.In 1996 Silkeborg IF, Karlsruher SC and EA Guingamp quali�ed for the UC.4

Descriptive Data Analysis2 Descriptive Data Analysis2.1 Data StructureAs said in the introduction European soccer Cups tournament data is used. We onlyconsidered the data from the Champions Cup (CC), from the Cup Winners Cup (CWC)and from the UEFA Cup (UC). The typical tournament structure does not begin untilafter the preliminary round(s), so we did not consider them. In this context the structureof an ordinary data looks like this:leg team.a country.a team.b country.b s.a.1 s.b.1 s.a.2 s.b.2Round1 FKAustria(Wien) Aut DinamoMinsk Bls 1 2 0 1Round1 Milan Ita ZaglebieLubin Pol 4 0 4 1...Round1 SpartakVladikavkaz Rus Liverpool Eng 1 2 0 0Round1 ZimbruChisinau Mol RAFYelgava Lat 1 0 2 1Round1 RodaJC(Kerkrade) Ned SCTOlimpija(Ljubljana) Slo 5 0 0 2Round2 BrondbyIF Den Liverpool Eng 0 0 1 0...Round2 SpartaPraha Tch ZimbruChisinau Mol 4 3 2 0Round2 GirondinsBordeaux Fra RotorVolgograd Rus 2 1 1 0Round3 PSV(Eindhoven) Ned WerderBremen Ger 2 1 0 0Round3 BayernMuenchen Ger SLBenfica Por 4 1 3 1...Round3 Sevilla Esp FCBarcelona Esp 1 1 1 3Round3 SlaviaPraha Tch RCLens Fra 0 0 1 0Quarter FCBarcelona Esp PSV(Eindhoven) Ned 2 2 3 2Quarter SlaviaPraha Tch Roma Ita 2 0 1 3Quarter Milan Ita GirondinsBordeaux Fra 2 0 0 3Quarter BayernMuenchen Ger NottinghamForest Eng 2 1 5 1Semi BayernMuenchen Ger FCBarcelona Esp 2 2 2 1Semi SlaviaPraha Tch GirondinsBordeaux Fra 0 1 0 1Final BayernMuenchen Ger GirondinsBordeaux Fra 2 0 3 1where s.a.1:s.b.1 is for example the score of the 1st leg. This list represents the datafrom the UEFA Cup 1995/96.
5

Descriptive Data Analysis2.2 Tree StructureAn example of a typical tournament structure is represented by �gure 1. The tree structureis cognizable. In this section we want to describe how we obtained the tournament treethrough the data. So let us have a look at �gure 1. We always start with the winner of thetournament, in this case it is A. Then we will look for the team A played in the previousround, that would be in this case C. In the future C is marked. Now we are looking forthe team A played against before playing against C, that would be B. We realize that thegame A against B had be played in the �rst round of the tournament, so we are goingback to the last marked team, that would be C, and so on.A
B
A
C
A
D
C
Figure 1 Example of a typical tournament structure.For this reason we have programmed a Splus routine titled pairings.tree. In applyingthis routine to the Cup Winners Cup of the year 1989/90 we obtain �gure 2.
6

Descriptive Data Analysis
Sampdoria
RSCAnderlecht
Sampdoria
ASMonaco
Sampdoria
GrasshopperClubZuerich
Sampdoria
BorussiaDortmund
SampdoriaSKBrann
Sampdoria
Besiktas
BorussiaDortmund
TorpedoMoscow
GrasshopperClubZuerichSlovanBratislava
GrasshopperClubZuerich
CorkCity
TorpedoMoscow
RealValladolid
ASMonaco
BerlinerFCDynamo
ASMonacoCFOsBelenenses
ASMonaco
Valur(Reykjavik)
BerlinerFCDynamo
DjurgardensIF
RealValladolidHamrunSpartans
RealValladolid
USLuxembourg
DjurgardensIF
DinamoBucharest
RSCAnderlecht
AdmiraWacker
RSCAnderlecht
FCBarcelona
RSCAnderlechtBallymenaUnited
RSCAnderlecht
LegiaWarsaw
FCBarcelona
Ferencvarosi
AdmiraWackerAEL(Limassol)
AdmiraWacker
ValkeakoskenHaka
Ferencvarosi
FKPartizan(Belgrade)
DinamoBucharest
Panathinaikos
DinamoBucharestKSTirane
DinamoBucharest
SwanseaCity
Panathinaikos
FCGroningen
FKPartizan(Belgrade)Celtic
FKPartizan(Belgrade)
IkastFS
FCGroningen
cwc.8990
Figure 2 The Cup Winners Cup 1989/90.In the appendix you will �nd the tournament trees of all European Cups considered.7
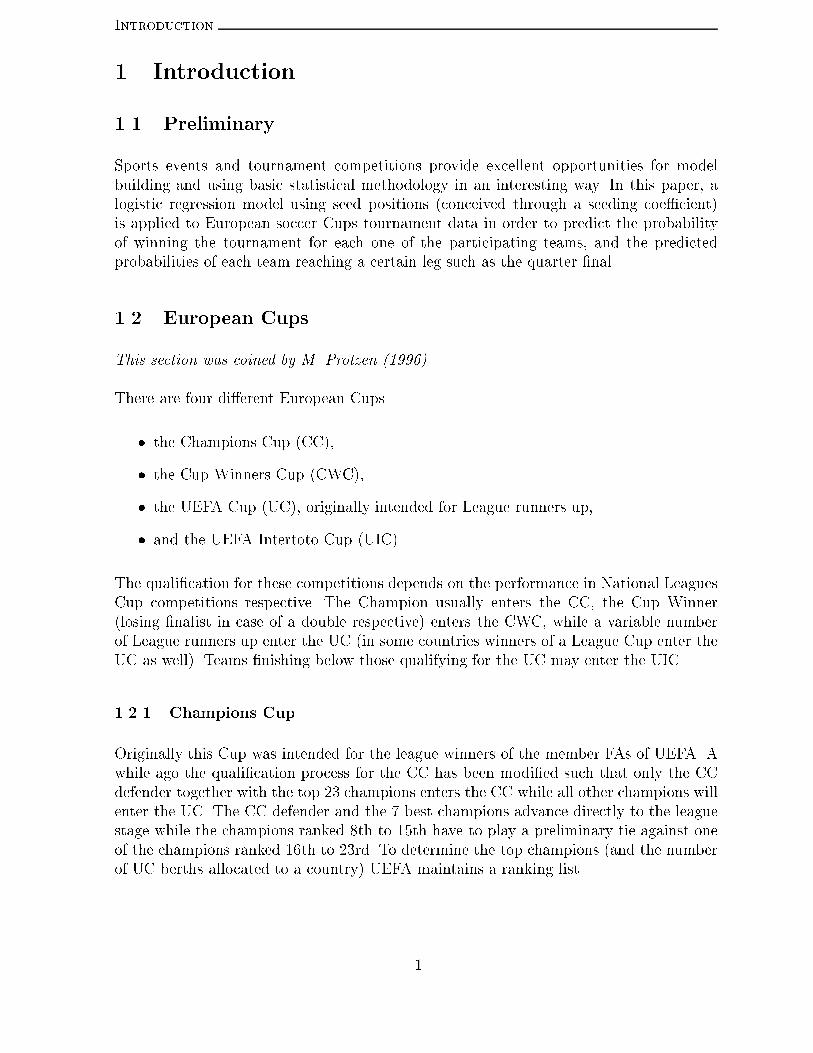
Descriptive Data Analysis2.3 Seeding Coe�cientsTo obtain the seed positions we calculated the seeding coe�cients with the help of aranking list. The basis for this ranking is the performance of teams in the three majorEuropean Cups during a three year period. Each team gets two points for a win and onepoint for a draw. One bonus point is allocated for reaching the quarter �nal, the semi�nal and the �nal. This procedure is similar to the one the UEFA uses for their rankinglist. In the �rst time we calculated a coe�cient which will be replaced later on, by amore appropriated coe�cient: A weighted coe�cient. Both coe�cients are based on a listcontaining the performances during an European Cup. An example is the following listwhich shows the points achieved for the participants during the Champions Cup of theyear 1995/96:THE TABLE FOR cc.9596----------------------------------team country win draw lost scored against points1 Ajax Ned 8 3 1 22 3 222 Juventus Ita 6 3 3 22 9 183 Panathinaikos Gre 5 3 2 11 6 154 SpartakMoscow Rus 6 1 1 17 8 145 FCNantes Fra 4 4 2 14 12 146 RealMadrid Esp 4 1 3 12 7 107 BorussiaDortmund Ger 2 3 3 8 11 88 LegiaWarsaw Pol 2 2 4 5 11 79 FCPorto Por 1 4 1 6 5 610 SteauaBucharest Rom 1 2 3 1 5 411 RosenborgBK Nor 2 0 4 11 16 412 Rangers Sco 1 2 3 6 13 413 Ferencvarosi Hun 1 2 3 9 19 414 BlackburnRovers Eng 1 1 4 5 8 315 AaB(Aalborg) Den 1 1 4 5 11 316 GrasshopperClubZuerich Sui 0 2 4 3 13 2
8

Descriptive Data Analysis2.3.1 First ApproachIn this approach we calculated the performances of the teams over a three year period andsummarized them into a list. The following list shows the points achieved for all teamswho participated in an European Cup from 1992 to 1995.team country win draw lost scored against points1 Milan Ita 23 8 4 55 10 602 Juventus Ita 22 5 5 68 22 563 Parma Ita 18 8 6 37 15 534 Ajax Ned 17 6 3 47 14 455 ParisSaintGermain Fra 15 6 7 39 19 426 BorussiaDortmund Ger 16 4 10 43 30 427 SLBenfica Por 13 7 3 43 23 378 FCPorto Por 14 5 8 43 20 359 Arsenal Eng 11 7 2 35 15 3510 FCBarcelona Esp 11 7 6 42 27 3211 SpartakMoscow Rus 12 6 5 46 31 3212 RealMadrid Esp 11 4 5 40 23 2813 EintrachtFrankfurt Ger 10 4 6 35 14 2614 BayerLeverkusen Ger 9 4 3 41 19 2515 IFKGothenburg Swe 10 3 5 26 18 2416 AJAuxerre Fra 8 5 5 37 21 2417 OlympiqueMarseille Fra 10 3 2 26 9 2418 Internazionale Ita 10 1 3 23 11 2419 RSCAnderlecht Bel 7 9 5 31 24 2320 RealZaragoza Esp 9 1 6 31 17 2221 ClubBruggeKV Bel 9 2 5 19 15 2122 Boavista Por 7 5 4 22 11 2023 Galatasaray Tur 6 7 9 17 29 1924 Lazio Ita 8 2 2 15 7 19...211 KSVWaregem Bel 0 0 2 1 6 0212 DACDunajskaStreda Tch 0 0 2 0 4 0213 Motherwell Sco 0 0 2 0 3 0This ranking list over a three year period is now used to calculate the seeding coe�cients.We de�ned the coe�cient in the following way:Coe�cient = Points achieved during the three year periodGames played during the three year periodThis is di�erent from the UEFA coe�cients, because the UEFA uses the sum of the ratiopoints achieved over games played for each of the �ve past years. An example of ourcalculations is the following list which shows the seeding coe�cients for the UEFA Cupof the year 1993/4. 9

Descriptive Data Analysisteam country coeff1 Juventus Ita 2.40000002 AtleticoMadrid Esp 2.06250003 BayernMuenchen Ger 1.91666674 AJAuxerre Fra 1.85714295 BorussiaDortmund Ger 1.72222226 SportingCP(Lisbon) Por 1.64285717 Internazionale Ita 1.64285718 BrondbyIF Den 1.50000009 AstonVilla Eng 1.500000010 RoyalAntwerp Bel 1.416666711 Olympiakos(Pireus) Gre 1.400000012 AdmiraWacker Aut 1.400000013 Vitesse(Arnhem) Ned 1.250000014 Trabzonspor Tur 1.166666715 GirondinsBordeaux Fra 1.166666716 EintrachtFrankfurt Ger 1.100000017 SlaviaPraha Tch 1.000000018 DinamoMoscow Rus 1.0000000...63 BSCYoungBoys Sui 0.000000064 AaB(Aalborg) Den 0.0000000This approach was not satis�able because there is a problem with teams which wereplaying in the Champions Cup. In the Champions Cup less games are played and so theteams will achieve less points. That is why their seeding coe�cient would be smaller, evenif they played in the most important European Cup. By calculating the probability for ateam of winning the tournament for example (in using the program prob.cte (cf. section3.2)) for the UEFA Cup 1995/96 we noticed that Girondins Bordeaux (Fra) had morechances to win the tournament than Barcelona (Esp). For every soccer fan this seems tobe impossible, so for us. For this reason we did not use this approach to calculate theseeding coe�cients.
10

Descriptive Data Analysis2.3.2 ImprovementThe improvement consists in calculating a weighted mean of the ratio points achievedover games played for each of the three past years, let be Cx this ratio for the year x.Hence we de�ned the coe�cient for the year x asCoe�cient = 36Cx�1 + 26Cx�2 + 16Cx�3.With this choice of the weights we give most importance on the ratio of the previousyear. If for example a team plays in a given year's UEFA Cup, but it did not play anyEuropean Cup for the last two years, the team will get a seeding coe�cient (in using theprevious method (see 2.3.1)) which seems to be too high because they played for the lasttime in the European Cup three years before - that is nonsense. This problem is absorbedby the improved coe�cient because there will be the weight 1/6. That is why from nowon this weighted seeding coe�cient (brie y coe�cient) is used. The following list showsthe coe�cient for the Cup Winners Cup of the year 1992/93:team country coeff1 ASMonaco Fra 1.447222222 AtleticoMadrid Esp 1.333333333 SpartakMoscow Rus 1.250000004 WerderBremen Ger 1.216666675 Trabzonspor Tur 1.000000006 SteauaBucharest Rom 1.000000007 Feyenoord Ned 0.916666678 AdmiraWacker Aut 0.722222229 SpartaPraha Tch 0.7083333310 Glenavon Nir 0.6666666711 Boavista Por 0.5833333312 Liverpool Eng 0.5625000013 Parma Ita 0.5000000014 Olympiakos(Pireus) Gre 0.5000000015 RoyalAntwerp Bel 0.3750000016 FCLucerne Sui 0.3333333317 AvenirBeggen Lux 0.3333333318 Apollon(Limassol) Cyp 0.3333333319 Valur(Reykjavik) Isl 0.2500000020 ChernomoretsOdessa Ukr 0.2500000021 FCLevski(Sofia) Bul 0.0833333322 UjpestiTE Hun 0.0000000023 TPS(Turku) Fin 0.0000000024 MiedzLegnica Pol 0.0000000025 MariborBranik Slo 0.0000000026 HapoelPetachTikva Isr 0.0000000027 Hannover96 Ger 0.0000000011

Descriptive Data Analysis28 CardiffCity Wal 0.0000000029 Bohemians Irl 0.0000000030 Airdrieonians Sco 0.0000000031 AIK(Stockholm) Swe 0.0000000032 AGF(Arhus) Den 0.00000000Figure 3 shows the coe�cient for di�erent three year periods for some chosen teams.Let us have a look at the evolution of the coe�cient of Juventus (Ita): Between the pe-riods 1989/92 and 1990/93 the coe�cient increased because they won the UEFA Cup in1992/93 (yes, Juventus also wins the UEFA Cup not only the Champions Cup) in achiev-ing 24 points. Between the periods 1990/93 and 1991/94 the coe�cient decreased becausein the 1993/94 edition of the UEFA Cup Juventus reached the quarter �nal in achievingin 8 games only 10 points (4 wins, 1 draw and 3 lost). And between the periods 1991/94and 1992/95 he increased again because they won the UEFA Cup in 1994/95 again beforebecoming Italian champion. We also remark the constancy of the coe�cient of Barcelona(Esp) who was the dominating team in European Cups during this periods.
•
••
•
0.8
1.0
1.2
1.4
1.6
•
•
•
•
0.8
1.0
1.2
1.4
1.6
•
•
•
•
0.8
1.0
1.2
1.4
1.6
•
•
•
•
0.8
1.0
1.2
1.4
1.6
89-92 90-93 91-94 92-95
JuventusMilanFCBarcelonaBorussiaDortmund
Coefficients for different periods for chosen teams:
Figure 3 The coe�cient for di�erent periods for some chosen teams.12

Descriptive Data Analysis2.4 Tournament Analysis2.4.1 Possible Sets of WinnersPredicting the probability of each seed winning the tournament requires the considerationof all possible paths and opponents. An example of a tournament is shown by �gure 4.Round 1 Round 2
4
3
1
2
Figure 4 Example of a tournament.Let us determine the teams that must be played for a team to become the champion.In Round 1 there are 22 possible sets of winners and in Round 2 there are 2 possibleoutcomes. Hence there are 222 = 23 possible outcomes for the 3 games.By generalizing, we obtain the following table:Round number Games per round Possible sets of winners1 n=2 2n=22 n=4 2n=4... ... ...m n=(2m) 2n=(2m)where n is the number of teams participating in the tournament. From this it follows thatin a tournament with n teams (and so n� 1 games) there aremYk=1 2n=(2k)possible sets of winners for the tournament, where m is the number of legs to play forreaching the �nal game.Remark: In fact m = log2 n, because of the following relationship: n = 2m.13

Descriptive Data Analysis2.4.2 Probability of WinningLet Pk(i; j) be the probability that team i wins against team j in the kth leg (8i 6= j).As in a tournament there is always a winner (i.e. there are any draws), it follows thatPk(j; i) = 1� Pk(i; j).In the �rst round each team has only one possible opponent, but in the second roundthere are two possible opponents as shown in the previous section. That is why the proba-bility analysis must include not only the probability of defeating each potential opponent,but also the probability of each potential opponent advancing to a particular game. Toillustrate, let us have a look at �gure 5.Game 1
Game 3
Game 2
A
B
C
DFigure 5 Example of a tournament.Suppose that team A wins the tournament by defeating team B in game 1 and the winnerof game 2 (C or D) in game 3, then the probability that team A wins the tournamentwould be :P (A wins the tournament) = P (A wins in game 3)= P1(A;B)P2(A;winner of game 2)= P1(A;B)fP1(C;D)P2(A;C) + P1(D;C)P2(A;D)g= P (A wins in leg 1)fP (C wins in leg 1)P2(A;C) +P (D wins in leg 1)P2(A;D)g= P (A wins in leg 1) Xj2fC;DgP (j wins in leg 1)P2(A; j)This probability is the probability of A winning the tournament and as well the proba-bility of A winning in game 3, i.e. in leg m = log2 n = log2 4 = log 4log 2 = 2.14

Descriptive Data AnalysisBy generalizing, we obtain:P (i wins in leg k) = P (i wins in leg k � 1) Pj2J P (j wins in leg k � 1)Pk(i; j) (1)
for k = 2; : : : ; log2 n. J is the set of all potential opponents of i for leg k.Hence: P (i wins the tournament ) = P (i wins in leg k = log2 n) (2)We now must �nd probability models for determining Pk(i; j).
15

Descriptive Data Analysis2.4.3 Potential OpponentsBy equation (1) we are forced to determinate the set of all potential opponents for a cho-sen team. For this reason we have programmed a function titled potential.opponents.The work of this function is illustrated by �gure 6.1
2
3
FinalQuarter
Upper half
Lower half
Semi
4
5
7
8
6
Figure 6 Illustration of potential.opponents.In �gure 6 there are eight teams participating in the tournament. If we want to determineall potential opponents for the �nal game of a team we only have to look if the team chosenis in the upper or in the lower half of the tournament tree. If the team is in the upper halfthe potential opponents will be all teams playing in the lower half, i.e. the following fourteams: 5, 6, 7 and 8. In the same way it is possible to determine all potential opponentsfor the semi �nal: If the team is among the teams 3 and 4 the potential opponents arethe teams playing in the upper quarter of the tournament tree, i.e. 1 and 2, and so on.
16

Statistical Modelisation3 Statistical Modelisation3.1 Logistic Regression ModelSchwertman et al. (1996) suggested in their work on probability models for the NCAARegional Basketball Tournaments 11 di�erent models for assigning probabilities of win-ning for each team in each individual game. These models were compared in three ways byusing a chi-square statistic as a measure of the relative �t of the models. The chi-squarevalues provided a measure of the relative accuracy of the various models. Hence the logis-tic model seemed to be the most satisfactory if the objective is to predict the winner ofthe tournament. That is the reason why we choose a logistic regression model. The modelwe assume is closely related to the Bradley-Terry model for paired comparisons (Bradleyand Terry 1952). This relationship is shown in the appendix of this paper. Therefore theformula relating the seeding coe�cients to winning probabilities is:Pk(i; j) = e� + �(Sk(i)� Sk(j))1 + e� + �(Sk(i)� Sk(j)) (3)where Sk(i) is the seeding coe�cient of team i depending on leg k. Clearly we have0 � Pk(i; j) � 1 and Pk(j; i) = 1� Pk(i; j), 8k and 8i 6= j.These seeding coe�cients represent the team strength.3.2 Constancy of Team StrengthIn the �rst time, we assume that the games are independent and that the seeding coef-�cients remain constant throughout the tournament. Hence Sk(i) = S(i) and thereforePk(i; j) = P (i; j).As each game has only two outcomes: A win or a loss, we are opposed to an independentBernoulli trial. Let be Yij one Bernoulli trial, therefore:Yij = ( 1 if i defeats j0 else.It follows that P (Yij = 1) = P (i; j). Hence the model (3) becomes:E[Yij] = e�+�(S(i)�S(j))1 + e�+�(S(i)�S(j))where � and � are the parameters to estimate.17

Statistical Modelisation3.2.1 Model ChosenThe model is �t to a data set consisting of the game outcomes from season 1992/93 to1995/6 in all three European Cups, i.e. the UEFA Cup, the Cup Winners Cup and theChampions Cup. It is important to notice that in the Champions Cup we took only thegames of type knock-out, i.e. we did not take into consideration the league stage of theChampions Cup. In all we considered 442 game outcomes. In this regard it is importantto say that even if two teams played twice against each other in a leg, we considered onlythe outcome of the leg, and not the outcomes of each game of the leg.As response variable for the regression we took the following variable, let it be y:y = 2666666666664
yuc:9596yuc:9495yuc:9394yuc:9293ycwc:9596: : :ycc:92933777777777775where for example yuc:9596 is a vector containing 1's and 0's. Let us have a look at twogames of the UEFA Cup 1995/96:leg team.a country.a team.b country.b s.a.1 s.b.1 s.a.2 s.b.220 Round1 Glenavon Nil WerderBremen Ger 0 2 0 521 Round1 BayernMuenchen Ger LokomotivMoscow Rus 0 1 5 0The 20th element of yuc:9596 would be 0 because WerderBremen (i.e. team.b) won thegame, and the 21th element of yuc:9596 would be 1 because BayernMuenchen (i.e. team.a)won the game.By �tting the model (3) we obtained the following estimations:Estimations Value Std. Error t value�̂ -0.1305 0.1039 -1.2559�̂ 1.2610 0.1608 7.8420It is a good �t. This statement is validated by �gure 7. One notices that this regressionrejects the necessity of the intercept �. Therefore (3) becomes:P (i; j) = e�̂(S(i)� S(j))1+ e�̂(S(i)� S(j)) (4)
18

Statistical Modelisation
•
-1 0 1
0.0
0.2
0.4
0.6
0.8
1.0
•
-1 0 1
0.0
0.2
0.4
0.6
0.8
1.0
•
-1 0 1
0.0
0.2
0.4
0.6
0.8
1.0
•
-1 0 1
0.0
0.2
0.4
0.6
0.8
1.0
•
-1 0 1
0.0
0.2
0.4
0.6
0.8
1.0
•
-1 0 1
0.0
0.2
0.4
0.6
0.8
1.0
•
-1 0 1
0.0
0.2
0.4
0.6
0.8
1.0
•
-1 0 1
0.0
0.2
0.4
0.6
0.8
1.0
-1 0 1
0.0
0.2
0.4
0.6
0.8
1.0
Mean of the seeding coefficient difference on each interval
Mea
n of
the
resp
onse
var
iabl
e on
eac
h in
terv
al
-1 0 1
0.0
0.2
0.4
0.6
0.8
1.0
With interceptWithout intercept
Fitting of the logistic regression model
Figure 7 Fitting of the logistic regression model. We noticed thatthe seeding coe�cient di�erences lied between -1.8 and 1.8, thereforewe divided this interval in 8 subintervals. In each of this subintervalswe calculated the mean of the response variable and the mean of theseeding coe�cient di�erences. One remarks that the curve withoutthe intercept �ts the observations best.
19

Statistical Modelisation3.2.2 The ProgramWith the help of equation (4) it is now possible to calculate the probability of eachteam winning against any other team (i.e. P (i; j)). In introducing these probabilities intoequation (1) we are able to know the probability of each team winning any chosen leg andso, using equation (2), the tournament. For this reason we have programmed a functiontitled prob.cte. An issue of this function is shown by the following table who shows theprobabilities for the Cup Winners Cup 1995/96:Round1 Round2 Quarter Semi FinalParisSaintGermain 87.60 71.81 39.57 27.36 18.98MoldeFK 12.40 4.97 0.95 0.24 0.06Celtic 65.26 17.30 4.93 1.88 0.73DinamoBatumi 34.74 5.93 1.13 0.28 0.07Parma 89.01 79.22 49.19 35.38 25.51KSTeuta(Durres) 10.99 5.50 1.12 0.28 0.07HalmstadsBK 50.00 7.64 1.56 0.39 0.10LokomotivSofia 50.00 7.64 1.56 0.39 0.10RCDeportivoLaCoruna 68.37 32.21 15.36 4.69 2.21Apoel(Lefkosia) 31.63 9.49 2.88 0.51 0.15Trabzonspor 74.09 47.98 27.31 10.53 5.93ZalgirisVilnius 25.91 10.33 3.36 0.65 0.21RealZaragoza 76.19 40.65 21.63 7.39 3.81InterZTSBratislava 23.81 6.63 1.80 0.27 0.07ClubBruggeKV 78.28 46.19 25.88 9.50 5.16ShakhtarDonetsk 21.72 6.53 1.77 0.27 0.07SKRapid(Wien) 55.24 16.78 6.17 1.98 0.39PetrolulPloiesti 44.76 11.76 3.79 1.06 0.18SportingCP(Lisbon) 71.32 54.96 34.67 19.76 8.18MaccabiHaifa 28.68 16.50 6.86 2.50 0.58DinamoMoscow 75.09 48.26 27.06 14.01 5.09AraratErevan 24.91 9.49 2.98 0.83 0.14SKHradecKralove 32.40 10.09 3.17 0.89 0.15FCKobenhavn 67.60 32.15 15.29 6.63 1.90Feyenoord 82.37 66.36 47.22 30.42 14.08DAGLiepaya 17.63 8.31 2.99 0.88 0.15Everton 44.76 10.45 3.76 1.10 0.18KR(Reykjavik) 55.24 14.89 6.06 2.04 0.40BorussiaMonchengladbach 50.00 15.06 4.18 1.23 0.21SileksKratovo 50.00 15.06 4.18 1.23 0.21AEK(Athens) 40.91 26.70 10.75 4.64 1.24FCSion 59.09 43.18 20.87 10.82 3.69Let us take for example Paris Saint Germain (Fra): Their chance to win in round 1 againstMolde FK (Nor) is 87.6%, to win in round 2 against Celtic (Sco) or Dinamo Batumi (Geo)their chance is 71.8%, and to win the �nal, i.e. the tournament, their chance is about 19%.The real outcomes are shown by �gure 8. 20

Statistical Modelisation
ParisSaintGermain
SKRapid(Wien)
ParisSaintGermain
RCDeportivoLaCoruna
ParisSaintGermain
Parma
ParisSaintGermain
Celtic
ParisSaintGermainMoldeFK
ParisSaintGermain
DinamoBatumi
Celtic
HalmstadsBK
ParmaKSTeuta(Durres)
Parma
LokomotivSofia
HalmstadsBK
RealZaragoza
RCDeportivoLaCoruna
Trabzonspor
RCDeportivoLaCorunaApoel(Lefkosia)
RCDeportivoLaCoruna
ZalgirisVilnius
Trabzonspor
ClubBruggeKV
RealZaragozaInterZTSBratislava
RealZaragoza
ShakhtarDonetsk
ClubBruggeKV
Feyenoord
SKRapid(Wien)
DinamoMoscow
SKRapid(Wien)
SportingCP(Lisbon)
SKRapid(Wien)PetrolulPloiesti
SKRapid(Wien)
MaccabiHaifa
SportingCP(Lisbon)
SKHradecKralove
DinamoMoscowAraratErevan
DinamoMoscow
FCKobenhavn
SKHradecKralove
BorussiaMonchengladbach
Feyenoord
Everton
FeyenoordDAGLiepaya
Feyenoord
KR(Reykjavik)
Everton
AEK(Athens)
BorussiaMonchengladbachSileksKratovo
BorussiaMonchengladbach
FCSion
AEK(Athens)
cwc.9596
Figure 8 Tournament tree of the Cup Winners Cup 1995/96.One remarks the surprising performance of SK Rapid (Wien) (Aut): Their chance toreach the quarter �nal was 16.7%, but they even reached the semi �nal where theirchance was only 6.17%. Knowing this surprising fact the probabilities of the other teamsremaining in the tournament will change. Therefore it is not only interesting to know theprobability of each team winning in a chosen leg at the beginning of the tournament,but also predicting the probability of each team winning knowing the remaining teams.That is why we re�ned the program prob.cte. For example in the Cup Winners Cup1995/96 the following teams remain after the quarter �nals : Paris Saint Germain (Fra),RC Deportivo La Coruna (Esp) , SK Rapid (Wien) (Aut) and Feyenoord (Ned). We areable to calculate the new probabilities knowing this fact. It is important to notice thatthese new probabilities are calculated without care of the outcomes of the previous rounds.21

Statistical ModelisationA more advanced method will be discussed in section 3.3. The result of the function isshown by the following table:Semi FinalParisSaintGermain 72.59 47.47RCDeportivoLaCoruna 27.41 11.80SKRapid(Wien) 20.90 4.07Feyenoord 79.10 36.66We notice that this time the chance of Paris Saint Germain to win the tournament isabout 50% - and they won it. And the chance of SK Rapid (Wien) (Aut) to defeat theiropponent, Feyenoord (Ned), in the semi �nal is about 21%. At the beginning of the tour-nament the chance of SK Rapid (Wien) (Aut) to win the semi �nal was only about 2%.So this approach seems to be more realistic.
22

Statistical Modelisation3.2.3 Number of Correct Predictions
Let us consider the following table:Team Probability of winningA XB 1 - Xwhere X = P (A;B). If X > 12 the probable winner will be A and if the real winner is alsoA we will mark a point, if X < 12 (1 � X > 12) and the real winner is B we will mark apoint as well and if X = 1�X = 12 we will mark half a point (this semi point is justi�edby the fact that the expectation of a point is 0 � 12 + 1 � 12 = 12).The following example issues from the Cup Winners Cup 1992/93 and shows the proba-bilities of winning the quarter �nal for the teams remaining in the tournament.QuarterParma 43.47SpartaPraha 56.53AtleticoMadrid 74.09Olympiakos(Pireus) 25.91RoyalAntwerp 31.26SteauaBucharest 68.74SpartakMoscow 60.36Feyenoord 39.64As we know that the real winners were Parma, Atletico Madrid, Royal Antwerp andSpartak Moscow, it is possible to calculate the number of correct predictions. That wouldbe 2 because Atletico Madrid and Spartak Moscow are probable winners as well.23

Statistical ModelisationIn applying this procedure to the entire tournament we will get a list of points whosesum represents the number of correct predictions. For this reason we have programmeda function titled nb.pronos.ok. In using this function for various data sets we obtainedthe following table:YEAR OK GAMES %OK--------------------------cwc.9293 21.5 31 69.35cwc.9394 20 31 64.52cwc.9495 20.5 31 66.13cwc.9596 19 31 61.29uc.9293 45 63 71.43uc.9394 33.5 63 53.17uc.9495 45.5 63 72.22uc.9596 37.5 63 59.52OK stands for the number of correct predictions, GAMES represents the number of gamesper tournament and %OK the percentage of games predicted correctly.
24
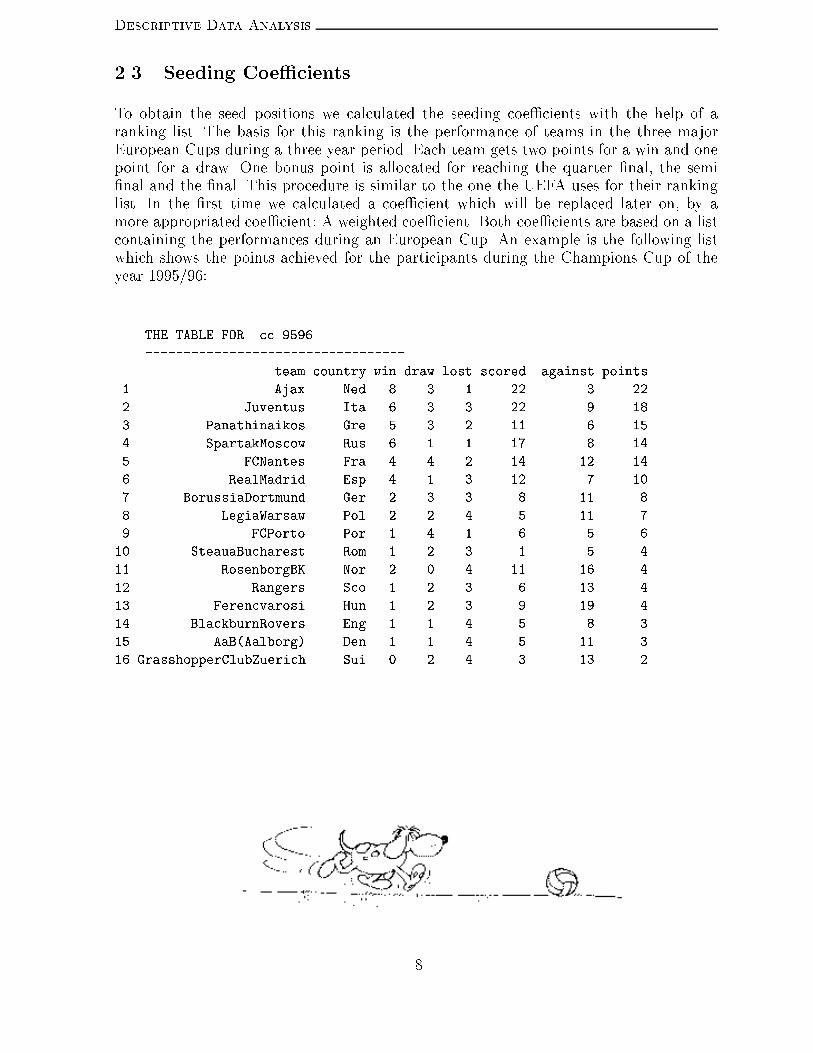
Statistical Modelisation3.3 Variation of Team StrengthThis time we assume that the team strength (the seeding coe�cients) do not remainconstant throughout the tournament - they are depending on the leg.3.3.1 Model ChosenThe principal idea is to calculate for each leg a new coe�cient for each team. The initialcoe�cients that are used to predict the issues of the �rst leg are the coe�cients calculatedin section 2.3.2. For the second round we have to calculate new coe�cients. To do so weintroduce two di�erent methods (see sections 3.3.2 and 3.3.3). Once we have calculatedthese new coe�cients we center and reduce them in order to obtain coe�cients of equalmean and equal standard deviation as the initial ones.Justi�cation: Let x1; : : : ; xn be the initial coe�cients of mean �x and standard devia-tion sx and let y1; : : : ; yn be the new coe�cients of mean �y and standard deviation sy.We de�ne the new coe�cients asy�t = �x+ sx yt � �ysy ! ; t = 1; : : : ; n.Hence �y� = �x and sy� = sx. An example of this calculation is given by the following table:Team xt yt y�tA 1.4 2.1 1.382B 1.2 1.9 1.241C 1 1.5 0.958D 0.8 1.3 0.817Mean 1.1 1.7 1.1Standard Deviation 0.258 0.365 0.258Therefore we are allowed to use the estimations made in section 3.2.1. Thus our model isgiven by equation (3): Pk(i; j) = e�̂(Sk(i)� Sk(j))1+ e�̂(Sk(i)� Sk(j)) (5)where k = 1; : : : ; log2 n and �̂ = 1:2610.Remark on the e�ect of the centering and the reduction of the coe�cients: If a strongteam wins against a weak team their coe�cient will decrease, but if a weak team defeatsa strong team their coe�cient will increase. That seems to be logical.25

Statistical Modelisation3.3.2 Using Probable OpponentsTo illustrate this �rst method, let us have a look at �gure 9.B
A
3rd2nd1st
D
C
Figure 9 Example of the upper part of the tournament tree.The initial coe�cients are used to calculate the probability of each team winning againsttheir potential opponent in the �rst round (for the �rst round only one potential opponentis possible). The new coe�cients for the second round who will be used to calculate theprobabilities of winning in the second round are de�ned in the following way, for examplethe new coe�cient for a chosen team i would be:Cnew;i = Cold;i 1 + Cold;O(i) + Cold;i + ! (6)where is a constant � 0 and Cold;O(i) is the coe�cient of the probable opponent O(i)of team i in the previous round (if i = A it would be B). Later on (see section 3.3.4) wewill choose in order to maximize the number of correct predictions. It is important tonotice that Cnew;i is Sk(i) and Cold;i is Sk�1(i), k = 1; : : : ; log2 n.In realizing that some initial coe�cients are equal to 0 (see section 2.3.2) we allow usto add 0.1 to all initial coe�cients. Let us consider equation (6): If we will not do this thecoe�cients would remain 0 throughout the tournament. In adding 0.1 the expectation ofthe new initial coe�cients increases and the variance remains the same. But as our model(5) is depending on a di�erence of coe�cients this will not change our estimations.In reusing equation (6) we are able to calculate the coe�cients for the third round. Theonly problem consists in the knowledge of the probable opponent O(i): Let i be A, so forthe third round there are two potential opponents for A: C and D. But we have calculatedP2(C;D) yet, so if this probability is > 12 the probable opponent for A would be C, if notthe probable opponent would be D (if this probability is equal to 12 it does not matterwhich team we will take for further considerations because both teams have the samestrength).In generalizing this example we only have to keep in mind that if a team was not a26

Statistical Modelisationprobable opponent for a previous round it will not be one for the next round. Thereforewe have programmed a function titled prob.non.cte. An outcome of this function isshown by the following table where the Cup Winners Cup of the year 1993/94 has beenconsidered. Round1 Round2 Quarter Semi FinalArsenal 57.82 22.70 8.95 2.95 0.89OB(Odense) 42.18 13.21 3.89 0.84 0.14StandardCL(Liege) 62.84 42.79 21.46 9.19 3.61CardiffCity 37.16 21.30 8.69 2.98 0.94Torino 75.09 50.36 32.17 15.04 6.40LillestromSK 24.91 10.71 4.54 1.29 0.33Aberdeen 43.47 15.51 7.46 2.50 0.77Valur(Reykjavik) 56.53 23.42 12.85 5.05 1.83ParisSaintGermain 69.42 41.50 14.14 7.92 3.11Apoel(Nicosia) 30.58 12.21 2.25 0.69 0.12UniversitateaCraiova 65.26 33.72 10.62 5.63 2.09HB(Torshavn) 34.74 12.57 2.29 0.70 0.12RealMadrid 87.37 58.21 43.54 29.06 13.78FCLugano 12.63 3.40 1.30 0.44 0.09FCTirolInnsbruck 46.50 17.26 11.42 6.83 2.88Ferencvarosi 53.50 21.13 14.43 8.88 3.86Parma 81.64 49.27 23.79 14.19 8.69DegerforsIF 18.36 5.42 1.07 0.27 0.08MaccabiHaifa 22.08 5.63 1.10 0.28 0.08TorpedoMoscow 77.92 39.67 18.19 10.50 6.28Ajax 82.74 64.41 40.11 25.35 16.15HajdukSplit 17.26 9.28 3.84 1.79 0.92Besiktas 72.03 22.03 10.90 5.84 3.32Kosice.1.FC 27.97 4.28 1.00 0.25 0.07SLBenfica 70.52 52.49 38.36 18.76 11.50GKSKatowice 29.48 18.25 11.62 4.75 2.62CSKA(Sofia) 72.03 24.48 15.60 6.38 3.52FCBalzers 27.97 4.77 1.73 0.31 0.08BayerLeverkusen 56.96 20.65 5.62 1.50 0.61FCBobyBrno 43.04 12.76 2.52 0.41 0.09Panathinaikos 76.25 55.45 22.27 9.01 4.94Shelbourne 23.75 11.13 2.28 0.40 0.10The real outcomes are shown by �gure 10.27

Statistical Modelisation
Arsenal
Parma
Arsenal
ParisSaintGermain
Arsenal
Torino
Arsenal
StandardCL(Liege)
ArsenalOB(Odense)
Arsenal
CardiffCity
StandardCL(Liege)
Aberdeen
TorinoLillestromSK
Torino
Valur(Reykjavik)
Aberdeen
RealMadrid
ParisSaintGermain
UniversitateaCraiova
ParisSaintGermainApoel(Nicosia)
ParisSaintGermain
HB(Torshavn)
UniversitateaCraiova
FCTirolInnsbruck
RealMadridFCLugano
RealMadrid
Ferencvarosi
FCTirolInnsbruck
SLBenfica
Parma
Ajax
Parma
MaccabiHaifa
ParmaDegerforsIF
Parma
TorpedoMoscow
MaccabiHaifa
Besiktas
AjaxHajdukSplit
Ajax
Kosice.1.FC
Besiktas
BayerLeverkusen
SLBenfica
CSKA(Sofia)
SLBenficaGKSKatowice
SLBenfica
FCBalzers
CSKA(Sofia)
Panathinaikos
BayerLeverkusenFCBobyBrno
BayerLeverkusen
Shelbourne
Panathinaikos
cwc.9394
Figure 10 Tournament tree of the Cup Winners Cup 1993/94.
28

Statistical Modelisation3.3.3 Using All Potential OpponentsThe second method takes all potential opponents into consideration to calculate the newcoe�cients. This method seems to be more natural than the �rst one where we consideredonly the probable opponents. The new coe�cient for a chosen team i is de�ned as:Cnew;i = Cold;i Xj2O(1 + rj)P (j wins in the previous round) (7)where is a constant � 0, rj = Cold;j+ Cold;i+ and O the set of all potential opponents for theprevious round for the team i. One remarks that this new coe�cient is a sort of weightedsum of old coe�cients.To illustrate this method let us have a look at the example shown by �gure (9). Forthe second round the new coe�cient is exactly the same as the one calculated for thesecond round in the previous section because there is only one potential opponent for the�rst round for each team. And for the third round the new coe�cient of A would beCnew;A = Cold;A Xj2fC;Dg(1 + rj)P (j wins in the �rst round)We have to notice that the procedure of calculating these new coe�cients is the same asin the previous section. Hence we have reprogrammed the function prob.non.cte. Anissue of this function is shown by the following table where the UEFA Cup of the year1994/95 has been considered.Round1 Round2 Round3 Quarter Semi FinalParma 73.00 47.03 34.40 19.37 12.02 6.50Vitesse(Arnhem) 27.00 12.06 7.22 3.17 1.69 0.80AIK(Stockholm) 57.82 25.47 16.84 8.37 4.82 2.45SlaviaPraha 42.18 15.45 9.34 4.15 2.23 1.07AthleticBilbao 50.00 17.92 3.66 0.75 0.21 0.05AnorthosisofAmmochostos 50.00 17.92 3.66 0.75 0.21 0.05NewcastleUnited 27.34 13.41 2.59 0.49 0.12 0.02RoyalAntwerp 72.66 50.75 22.29 10.39 5.75 2.82OB(Odense) 42.18 17.53 4.95 1.87 0.85 0.35Linfield 57.82 28.68 10.59 4.89 2.59 1.22Kaiserslautern 53.06 29.23 11.30 5.39 2.91 1.40IA(Akranes) 46.94 24.56 8.79 3.97 2.07 0.96RealMadrid 63.33 40.23 27.80 16.57 10.39 5.66SportingCP(Lisbon) 36.67 19.79 12.19 6.58 3.86 1.99DinamoMoscow 77.92 36.41 23.36 13.05 7.84 4.13RFCSeraing 22.08 3.58 1.02 0.25 0.07 0.02BayerLeverkusen 53.15 34.87 18.71 10.21 4.60 2.17PSV(Eindhoven) 46.85 29.65 15.20 8.01 3.47 1.59KispestHonved 56.53 21.99 9.02 3.95 1.37 0.52FCTwente(Enschede) 43.47 13.49 4.17 1.34 0.28 0.0629

Statistical ModelisationRound1 Round2 Round3 Quarter Semi FinalGKSKatowice 65.26 30.80 16.44 8.55 3.65 1.65Aris(Thessaloniki) 34.74 10.37 3.46 1.11 0.23 0.05GirondinsBordeaux 60.36 37.54 22.15 12.50 5.84 2.83LillestromSK 39.64 21.29 10.85 5.42 2.21 0.97FCNantes 57.82 33.38 11.83 4.94 1.68 0.63RotorVolgograd 42.18 20.99 5.32 1.54 0.29 0.05TekstilschikKamyshin 50.00 22.82 5.85 1.72 0.33 0.06BekescsabaiElore 50.00 22.82 5.85 1.72 0.33 0.06FCSion 55.24 23.84 16.49 8.70 3.86 1.80Apollon(Limassol) 44.76 16.96 11.06 5.42 2.22 0.97OlympiqueMarseille 41.18 22.70 16.11 8.77 4.02 1.92Olympiakos(Pireus) 58.82 36.51 27.49 16.10 7.95 4.01Juventus 61.61 44.04 30.39 16.95 8.86 4.72CSKA(Sofia) 38.39 24.48 15.33 7.72 3.69 1.85CSMaritimo 50.00 15.74 7.90 3.11 1.18 0.50FCAarau 50.00 15.74 7.90 3.11 1.18 0.50AdmiraWacker 60.36 32.52 13.86 6.01 2.50 1.13GornikZabrze 39.64 17.08 5.14 1.54 0.42 0.13ASCannes 40.91 18.38 5.86 1.89 0.56 0.19Fenerbahce 59.09 32.02 13.62 5.89 2.45 1.11EintrachtFrankfurt 82.49 63.83 36.47 21.52 11.13 5.89SCTOlimpija(Ljubljana) 17.51 8.46 2.08 0.55 0.10 0.02RapidBucharest 50.00 13.86 3.68 1.08 0.25 0.06RSCCharleroi 50.00 13.86 3.68 1.08 0.25 0.06Napoli 57.82 22.87 11.14 5.43 2.34 1.09SkontoRiga 42.18 13.21 5.20 2.06 0.71 0.28Boavista 82.87 57.78 35.94 21.56 11.32 6.05MyPa(Anjalankoski) 17.13 6.15 1.82 0.49 0.10 0.02BorussiaDortmund 79.10 50.16 30.32 17.40 9.95 5.44Motherwell 20.90 7.04 2.25 0.74 0.26 0.10SlovanBratislava 50.00 21.40 10.45 5.07 2.56 1.27FCKobenhavn 50.00 21.40 10.45 5.07 2.56 1.27RCDeportivoLaCoruna 37.16 16.69 6.47 2.78 1.27 0.59RosenborgBK 62.84 35.43 17.91 9.43 5.06 2.64FCTirolInnsbruck 73.76 40.35 20.50 10.83 5.83 3.04DinamoTblisi 26.24 7.52 1.66 0.39 0.09 0.02Lazio 65.26 45.23 19.68 9.32 4.74 2.38DinamoMinsk 34.74 19.81 5.71 1.89 0.72 0.29TrelleborgsFF 50.00 17.48 3.60 0.79 0.19 0.05BlackburnRovers 50.00 17.48 3.60 0.79 0.19 0.05Trabzonspor 63.25 37.75 26.93 15.07 8.63 4.73DinamoBucharest 36.75 17.96 11.51 5.68 2.98 1.53AstonVilla 34.74 12.05 6.90 2.98 1.42 0.67Internazionale 65.26 32.25 22.08 11.77 6.52 3.48The real outcomes are shown by �gure 11. 30

Statistical Modelisation
Parma
Juventus
Parma
BayerLeverkusen
Parma
OB(Odense)
Parma
AthleticBilbao
ParmaAIK(Stockholm)
ParmaVitesse(Arnhem)Parma
SlaviaPrahaAIK(Stockholm)
NewcastleUnited
AthleticBilbaoAnorthosisofAmmochostosAthleticBilbao
RoyalAntwerpNewcastleUnited
RealMadrid
OB(Odense)Kaiserslautern
OB(Odense)LinfieldOB(Odense)
IA(Akranes)Kaiserslautern
DinamoMoscow
RealMadridSportingCP(Lisbon)RealMadrid
RFCSeraingDinamoMoscow
FCNantes
BayerLeverkusen
GKSKatowice
BayerLeverkusenKispestHonved
BayerLeverkusenPSV(Eindhoven)BayerLeverkusen
FCTwente(Enschede)KispestHonved
GirondinsBordeaux
GKSKatowiceAris(Thessaloniki)GKSKatowice
LillestromSKGirondinsBordeaux
FCSion
FCNantesTekstilschikKamyshin
FCNantesRotorVolgogradFCNantes
BekescsabaiEloreTekstilschikKamyshin
OlympiqueMarseille
FCSionApollon(Limassol)FCSion
Olympiakos(Pireus)OlympiqueMarseille
BorussiaDortmund
Juventus
EintrachtFrankfurt
Juventus
AdmiraWacker
JuventusCSMaritimo
JuventusCSKA(Sofia)Juventus
FCAarauCSMaritimo
ASCannes
AdmiraWackerGornikZabrzeAdmiraWacker
FenerbahceASCannes
Napoli
EintrachtFrankfurtRapidBucharest
EintrachtFrankfurtSCTOlimpija(Ljubljana)EintrachtFrankfurt
RSCCharleroiRapidBucharest
Boavista
NapoliSkontoRigaNapoli
MyPa(Anjalankoski)Boavista
Lazio
BorussiaDortmund
RCDeportivoLaCoruna
BorussiaDortmundSlovanBratislava
BorussiaDortmundMotherwellBorussiaDortmund
FCKobenhavnSlovanBratislava
FCTirolInnsbruck
RCDeportivoLaCorunaRosenborgBKRCDeportivoLaCoruna
DinamoTblisiFCTirolInnsbruck
Trabzonspor
LazioTrelleborgsFF
LazioDinamoMinskLazio
BlackburnRoversTrelleborgsFF
AstonVilla
TrabzonsporDinamoBucharestTrabzonspor
InternazionaleAstonVilla
uc.9495
Figure 11 Tournament tree of the UEFA Cup 1994/95.
31

Statistical Modelisation3.3.4 Number of Correct PredictionsIn regarding the two methods presented in the two preceding sections our goal in this sec-tion is to choose in order to maximize the number of correct predictions. The procedureof obtaining this number has been discussed in section 3.2.3. The calculation of the newcoe�cients for a certain round is based on the real outcomes of the previous round sothere is only one potential opponent (the real one). The new coe�cients will be calculatedin using the following equation:Cnew;i = Cold;i 1 + Cold;R(i) + Cold;i + !where R(i) is the real opponent of team i for the previous round. If a team is not in aparticular round, i.e. it lost in one of the previous rounds, their coe�cient has no reasonto be changed. This remark is important because we will center and reduce the new co-e�cients in using all initial coe�cients.With = 1 we have obtained the following table:YEAR OK GAMES %OK--------------------------cwc.9293 21.5 31 69.35cwc.9394 21 31 67.74cwc.9495 20.5 31 66.13cwc.9596 20 31 64.52uc.9293 45 63 71.43uc.9394 34 63 53.97uc.9495 44 63 69.84uc.9596 37 63 58.73We have executed the function nb.pronos.ok for several values of , but how to knowwhich is optimal? For this reason we have to de�ne a criterion of comparison.A general outcome of the function looks like this:YEAR OK GAMES %OK1 o1 g1 p12 o2 g2 p2... ... ... ...8 o8 g8 p8Let W be P8i=1 wipi, the weighted sum of the percentages, where wi are the weightsful�llingP8i=1 wi = 1 and wi / gi. Hence wi = gi=g where g = P8i=1 gi. By construction ofthe table pi = oi=gi therefore W = (P8i=1 oi)=g.32

Statistical ModelisationSo let us de�ne our criterion of comparison:Criterion: is optimal if W = 1g 8Pi=1 oi is maximal.
In calculating W for several values of we obtain the following table: 0 0.2 0.4 0.6 0.8 1 2 3 4 5 15W 58.51 62.5 63.29 64.36 64.36 64.62 64.62 64.62 64.36 64.09 64.09One remarks that in taking for example = 1 we obtain the biggest W , i.e. the highestweighted sum of games predicted correctly. Therefore let 1 be the optimal to choose.We also tried another model to calculate the new coe�cients. This model is given bythe following equation: Cnew;i = Cold;i 1 + �Cold;R(i)Cold;i !We obtain the following table:� 0 0.2 0.4 0.6 0.8 1 2 3 4W 64.5 64.5 64.22 63.56 63.56 58.51 58.9 59.3 60.1One remarks that this time W does not exceed 64:5% as before. That is the reason whywe do not take into further considerations this model.In this section we chose in order to maximize the number of correct predictions. Ournext goal will be to compare the methods presented in this paper (see section 4).33

Statistical Modelisation3.3.5 Evaluation of the Coe�cientsGeneral RemarkThe results of this section have been achieved in considering several years. So let us havea look for example at the UEFA Cup 1995/96 in using the method that considers allpotential opponents for a team. The other method furnishes the same results. In �gure12 the evaluation of the seeding coe�cients throughout the whole tournament for fourchosen teams is shown. Milan was the best seeded team at the beginning of the tourna-ment, Olympiakos and Spartak Vladikavkaz were medium seeded teams and FC Luganowas among the worst seeded teams.•
•• •
• •
Round
Coe
ff
0.0
0.5
1.0
1.5
Milan
11
4 34 4
R1 R2 R3 Q S F
• •• • • •
Round
Coe
ff
0.0
0.5
1.0
1.5
Olympiakos(Pireus)
16 1816 16 16 16
R1 R2 R3 Q S F
• • • • • •
Round
Coe
ff
0.0
0.5
1.0
1.5
SpartakVladikavkaz
34 32 34 34 34 34
R1 R2 R3 Q S F
• • • • • •
Round
Coe
ff
0.0
0.5
1.0
1.5
FCLugano
43 54 55 55 57 57
R1 R2 R3 Q S FFigure 12 Evaluation of the seeding coe�cients for four chosen teamsduring the UEFA Cup 1995/96. The number represents the seedingposition of the team.In general we noticed that the best teams, as Milan, will see their coe�cient decrease,but they will still remain among the strongest teams. The medium teams, as Olympiakosand Spartak Vladikavkaz, will see their coe�cients increase, and the worst teams willstay among the worst teams. The reason of this fact is that we centered and reduced thecoe�cients otherwise the better teams would always get higher coe�cients and so becomeunbeatable.In the appendix you will �nd the evaluation of the coe�cients for all teams that haveparticipated in the UEFA Cup 1995/96, in considering both methods.34

Statistical ModelisationParticular ExamplesThe two particular examples shown by �gure 13 illustrate two things: First of all we remarkthat the two methods used are di�erent, and in a second time we notice that in usingthe method considering only the probable opponent we have some strange evaluations:The coe�cient of Milan decreases too much in the quarter �nal, they are losing six seedpositions in falling from position 4 to position 10. This fact does not come up with theother method. The same can be said for Girondins Bordeaux in considering the coe�cientfor round 2. In recapitulating, the method using all potential opponents seems to be morenatural.•
••
•
••
0.8
1.0
1.2
1.4
GirondinsBordeaux
5
21
1
22
•
•
••
•
•
Round
Coe
ff
0.8
1.0
1.2
1.4
GirondinsBordeaux
5
8
22
2
2
R1 R2 R3 Q S F
Using all potential opponentsUsing probable opponent
•
•
• •• •
0.8
1.2
1.6
Milan
1
4
3
4 4
•
•
•
••
•
Round
Coe
ff
0.8
1.2
1.6
Milan
1
1
4
10 68
R1 R2 R3 Q S F
Using all potential opponentsUsing probable opponent
Figure 13 Evaluation of the seeding coe�cients for Milan andGirondins Bordeaux during the UEFA Cup 1995/96.
35

Comparison of the Methods4 Comparison of the Methods
In this section we want to compare the methods proposed in the previous sections:M1 The �rst method calculates the probabilities in using the constancy of the teamstrength.M2 The second one assumes the variation of the team strength in using only the probableopponents for a team.M3 The third one assumes the variation of the team strength in using all potentialopponents for a team.To compare the three methodsM1,M2 andM3 we will take as example the quarter �nalof the UEFA Cup 1995/96. The table 1 shows the eight quarter �nalists, the probability ofeach quarter �nalist to reach the quarter �nal in using one of the three methods and therank of this probability. This rank is de�ned as the order of the sorted probabilities of theteam and of all his potential opponents for the previous rounds. Here is an example howthis rank is calculated: Let us have a look at the following table who shows the probabilitiesto reach the quarter �nal for Bayern Muenchen and all his potential opponents for theprevious rounds: Round3BayernMuenchen 27.87LokomotivMoscow 2.10RaithRovers 2.80IA(Akranes) 9.86SLBenfica 46.03LierseSK 1.40RodaJC(Kerkrade) 2.58SCTOlimpija(Ljubljana) 7.35The rank of Bayern Muenchen would be 2 because SL Ben�ca had bigger chance to winthe third round (46.03% > 27.87%), i.e. to reach the quarter �nal.36

Comparison of the Methods M1 M2 M3Team Prob. Rank Prob. Rank Prob. RankBayern Muenchen 23.99 2 26.33 2 27.87 2Nottingham Forest 3.62 3 3.98 4 4.43 3FC Barcelona 43.70 1 39.15 1 38.13 1PSV (Eindhoven) 13.80 4 13.20 4 14.70 4Girondins Bordeaux 29.18 1 25.04 2 29.21 1Milan 67.68 1 60.62 1 56.71 1Slavia Praha 22.88 2 25.06 3 25.17 2Roma 10.19 3 10.16 4 11.40 3Table 1 This table shows the eight quarter �nalists, the probabilityof each one to reach the quarter �nal in using one of the threemethods and the rank of this probability (UEFA Cup 1995/96).For a balanced tournament all teams would have 12.5% chance to reach the quarter �nalbecause there are in all 7 potential opponents for each team in the previous rounds and inconsidering the team as well we have 8 teams sharing 100%. For the teams with probabilitysmaller than 12.5% we remark thatM3 gives more chance to reach the quarter �nal thanM2. One notices as well that Nottingham Forest, Girondins Bordeaux, Slavia Praha andRoma had more chance to reach the quarter �nal in usingM3 than in usingM2 becausetheir ranks are smaller in using M3. Hence M3 seems to be better than M2. On theother hand M1 and M3 deliver equal ranks.Moreover, in comparing the number of correct predictions made in using one of the threemethods we obtained the following table:% games predicted correctlyYear M1 M2 or M3cwc.9293 69.35 69.35cwc.9394 64.52 67.74cwc.9495 66.13 66.13cwc.9596 61.29 64.52uc.9293 71.43 71.43uc.9394 53.17 53.97uc.9495 72.22 69.84uc.9596 59.52 58.73This table is a result from sections 3.2.3 and 3.3.4 and from the fact that forM2 andM3we have the same number of correct predictions. Hence the feeling we had in the previoussections, i.e. that M3 is the best method proposed, does not seem to be con�rmed.M3 does not predict more games correctly. Let us remind that for M1 we obtained aweighted sum of games predicted correctly equal to 64:49% (see section 3.2.3) and forM3we obtained 64:62% (see section 3.3.4). At the end of section 3.3.4 we even tried anothermethod to calculate the new coe�cients where we obtained 64.5%.37

Comparison of the MethodsTherefore we are able to conclude:M1 which assumes the constancy of the team strength isthe most appropriated method among the three.This conclusion is based on the following points:1. In assuming variation of the team strength we do not obtain better results. Thisstatement has been veri�ed in using 376 game outcomes, although the model was�tted on 442 game outcomes.2. The practical application of M1 is easier, faster in time and does not involve thesearch of an optimal .
38

Conclusion5 ConclusionIn this paper, the logistic regression model (3) using seed positions (conceived througha seeding coe�cient) was applied to European soccer Cups tournament data in order topredict the probability of winning the tournament for each one of the participating teams,and the predicted probabilities of each team reaching a certain leg such as the quarter�nal. We proposed three di�erent methods to do this: The �rst one assumed the constancyof the team strength and the two others assumed the variation of the team strength. Inthe previous section we compared the three methods and the conclusion was the followingone: The best method is the one who assumes the constancy of the team strength. Forevery soccer fan this seems to be rather strange, but we obtained this fact in considering376 game outcomes (!) of the European Cups from 1992 to 1996. So let us recapitulatethis method which can be divided into two major parts:1. Calculation of the weighted coe�cients: One calculates a weighted mean of the ratiopoints achieved over games played for each of the three past years (see section 2.3.2).2. Calculation of the probability of each team reaching a certain leg to obtain �nallythe probability of winning the tournament in using equations (1) and (2) (see section2.4.2) with help of the logistic regression model (3).Besides we remarked in section 3.2.3 that in using this method we had in average 64.49%of the games predicted correctly.The attentive reader has certainly detected that we never took into consideration thescores. To calculate the new coe�cient for a team we did not consider the goals for andagainst the teams in the tournament. This would surely be an interesting starting pointto develop a new method for calculating new coe�cients in hope to get a better methodthan the one who assumes the constancy of the team strength.
39

Appendix, The Bradley-Terry ModelA AppendixA.1 The Bradley-Terry ModelThe Bradley-Terry model (Bradley and Terry 1952) is a model representing the results ofexperiments in which responses are pairwise rankings of treatments (so-called paired com-parison experiments). Let us consider t treatments T1; : : : ; Tt in an experiment involvingpaired comparisons. We consider that these treatments have true ratings (or preferences)�1; : : : ; �t. These parameters represent relative selection probabilities for the treatments,subject to the constraints �i � 0 (i = 1; : : : ; t) and Pti=1 �i = 1. Bradley and Terry (1952)de�ned the probability that treatment Ti is preferred over the treatment Tj in a singlecomparison in the following way: P (Ti Tj) = �i�i + �j (8)where i 6= j and i; j = 1; : : : ; t.But what is the relationship between this model and our logistic model?Let be �i = e�Sk(i) and �j = e�Sk(j) the ratings (or preferences) representing relativeselection for the teams. Hence our logistic model (3) becomes:Pk(i; j) = e��i�j�11 + e��i�j�1= e��i�j + e��i : (9)In section 3.2.1 we noticed that the regression rejects the necessity of the intercept �,hence equation (9) becomes: Pk(i; j) = �i�j + �iTherefore we can conclude that in rejecting the necessity of the intercept we obtain exactlythe Bradley-Terry model (8) for a single comparison. The reject of H0 : � = 0 is alsoexplicable by the following fact: � represents in a way the home advantage. But as forevery round of the tournament two games are played because each team plays once athome and once on the road, hence the home advantage can be omitted.40

Appendix, Tournament TreesA.2 Tournament TreesA.2.1 Cup Winners Cup
Sampdoria
RSCAnderlecht
Sampdoria
ASMonaco
Sampdoria
GrasshopperClubZuerich
Sampdoria
BorussiaDortmund
SampdoriaSKBrann
Sampdoria
Besiktas
BorussiaDortmund
TorpedoMoscow
GrasshopperClubZuerichSlovanBratislava
GrasshopperClubZuerich
CorkCity
TorpedoMoscow
RealValladolid
ASMonaco
BerlinerFCDynamo
ASMonacoCFOsBelenenses
ASMonaco
Valur(Reykjavik)
BerlinerFCDynamo
DjurgardensIF
RealValladolidHamrunSpartans
RealValladolid
USLuxembourg
DjurgardensIF
DinamoBucharest
RSCAnderlecht
AdmiraWacker
RSCAnderlecht
FCBarcelona
RSCAnderlechtBallymenaUnited
RSCAnderlecht
LegiaWarsaw
FCBarcelona
Ferencvarosi
AdmiraWackerAEL(Limassol)
AdmiraWacker
ValkeakoskenHaka
Ferencvarosi
FKPartizan(Belgrade)
DinamoBucharest
Panathinaikos
DinamoBucharestKSTirane
DinamoBucharest
SwanseaCity
Panathinaikos
FCGroningen
FKPartizan(Belgrade)Celtic
FKPartizan(Belgrade)
IkastFS
FCGroningen
cwc.8990
Figure 14 The Cup Winners Cup 1989/90.41

Appendix, Tournament Trees
ManchesterUnited
FCBarcelona
ManchesterUnited
LegiaWarsaw
ManchesterUnited
MontpellierHSC
ManchesterUnited
Wrexham
ManchesterUnitedPecsiMunkasSC
ManchesterUnited
LyngbyBK
Wrexham
SteauaBucharest
MontpellierHSCPSV(Eindhoven)
MontpellierHSC
Glentoran
SteauaBucharest
Sampdoria
LegiaWarsaw
Aberdeen
LegiaWarsawSwiftHesperange
LegiaWarsaw
NEASalamisofFamagusta
Aberdeen
Olympiakos(Pireus)
SampdoriaKaiserslautern
Sampdoria
KSFlamurtari(Vlore)
Olympiakos(Pireus)
Juventus
FCBarcelona
DinamoKiev
FCBarcelona
Fram(Reykjavik)
FCBarcelonaTrabzonspor
FCBarcelona
DjurgardensIF
Fram(Reykjavik)
DuklaPrague
DinamoKievKuPS(Kuopio)
DinamoKiev
SliemaWanderers
DuklaPrague
RFCLiegois
Juventus
FKAustria(Wien)
JuventusFCSliven
Juventus
PSVSchwerin
FKAustria(Wien)
EstrelaAmadora
RFCLiegoisVikingFK(Stavanger)
RFCLiegois
NeuchatelXamax
EstrelaAmadora
cwc.9091
Figure 15 The Cup Winners Cup 1990/91.
42
Appendix, Tournament Trees
WerderBremen
ASMonaco
WerderBremen
ClubBruggeKV
WerderBremen
Galatasaray
WerderBremen
Ferencvarosi
WerderBremenFCBacau
WerderBremen
FCLevski(Sofia)
Ferencvarosi
BanikOstrava
GalatasarayEisenhstadterFCStahl
Galatasaray
OB(Odense)
BanikOstrava
AtleticoMadrid
ClubBruggeKV
GKSKatowice
ClubBruggeKVOmonia(Nicosia)
ClubBruggeKV
Motherwell
GKSKatowice
ManchesterUnited
AtleticoMadridFyllingenIL
AtleticoMadrid
Athinaikos
ManchesterUnited
Feyenoord
ASMonaco
Roma
ASMonaco
IFKNorrkoping
ASMonacoSwanseaCity
ASMonaco
LaJeunesseDEsch
IFKNorrkoping
Ilves(Tampere)
RomaCSKAMoscow
Roma
Glenavon
Ilves(Tampere)
TottenhamHotspur
Feyenoord
FCSion
FeyenoordKSPartizani(Tirana)
Feyenoord
Valur(Reykjavik)
FCSion
FCPorto
TottenhamHotspurHajdukSplit
TottenhamHotspur
Valletta
FCPorto
cwc.9192
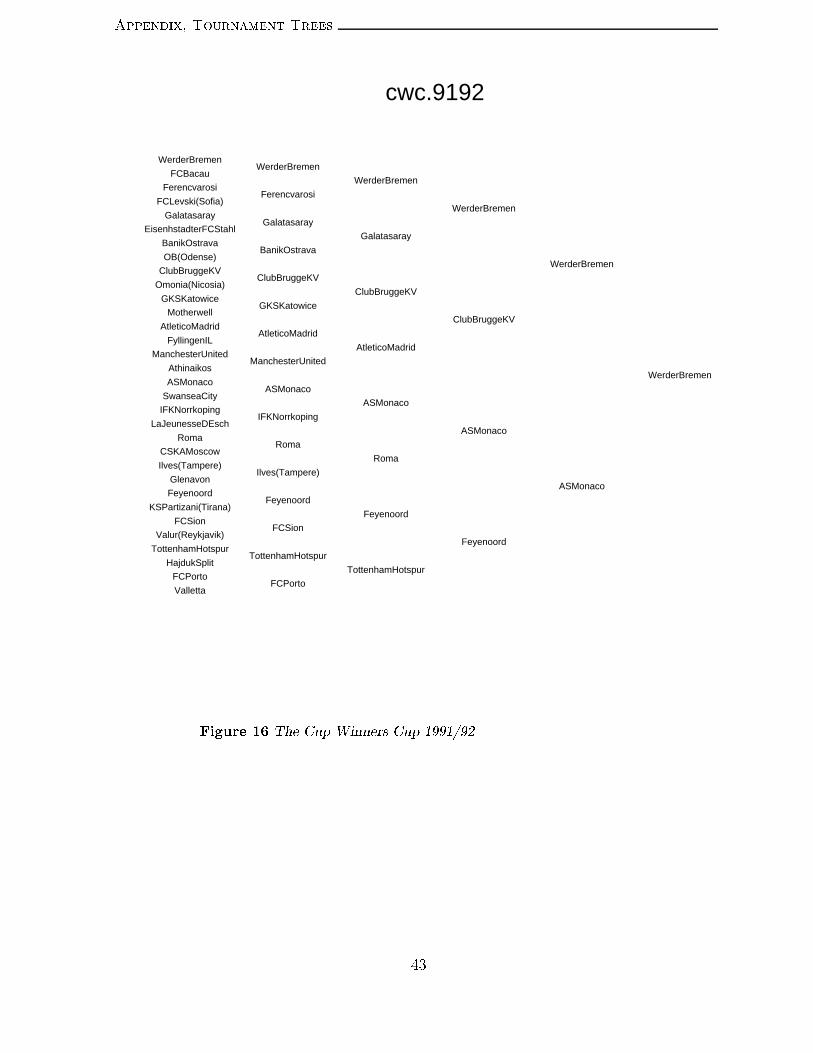
Figure 16 The Cup Winners Cup 1991/92.
43

Appendix, Tournament Trees
Parma
RoyalAntwerp
Parma
AtleticoMadrid
Parma
SpartaPraha
Parma
Boavista
ParmaUjpestiTE
Parma
Valur(Reykjavik)
Boavista
WerderBremen
SpartaPrahaAirdrieonians
SpartaPraha
Hannover96
WerderBremen
Olympiakos(Pireus)
AtleticoMadrid
Trabzonspor
AtleticoMadridMariborBranik
AtleticoMadrid
TPS(Turku)
Trabzonspor
ASMonaco
Olympiakos(Pireus)ChernomoretsOdessa
Olympiakos(Pireus)
MiedzLegnica
ASMonaco
SpartakMoscow
RoyalAntwerp
SteauaBucharest
RoyalAntwerp
AdmiraWacker
RoyalAntwerpGlenavon
RoyalAntwerp
CardiffCity
AdmiraWacker
AGF(Arhus)
SteauaBucharestBohemians
SteauaBucharest
AIK(Stockholm)
AGF(Arhus)
Feyenoord
SpartakMoscow
Liverpool
SpartakMoscowAvenirBeggen
SpartakMoscow
Apollon(Limassol)
Liverpool
FCLucerne
FeyenoordHapoelPetachTikva
Feyenoord
FCLevski(Sofia)
FCLucerne
cwc.9293
Figure 17 The Cup Winners Cup 1992/93.
44

Appendix, Tournament Trees
Arsenal
Parma
Arsenal
ParisSaintGermain
Arsenal
Torino
Arsenal
StandardCL(Liege)
ArsenalOB(Odense)
Arsenal
CardiffCity
StandardCL(Liege)
Aberdeen
TorinoLillestromSK
Torino
Valur(Reykjavik)
Aberdeen
RealMadrid
ParisSaintGermain
UniversitateaCraiova
ParisSaintGermainApoel(Nicosia)
ParisSaintGermain
HB(Torshavn)
UniversitateaCraiova
FCTirolInnsbruck
RealMadridFCLugano
RealMadrid
Ferencvarosi
FCTirolInnsbruck
SLBenfica
Parma
Ajax
Parma
MaccabiHaifa
ParmaDegerforsIF
Parma
TorpedoMoscow
MaccabiHaifa
Besiktas
AjaxHajdukSplit
Ajax
Kosice.1.FC
Besiktas
BayerLeverkusen
SLBenfica
CSKA(Sofia)
SLBenficaGKSKatowice
SLBenfica
FCBalzers
CSKA(Sofia)
Panathinaikos
BayerLeverkusenFCBobyBrno
BayerLeverkusen
Shelbourne
Panathinaikos
cwc.9394
Figure 18 The Cup Winners Cup 1993/94.
45

Appendix, Tournament Trees
RealZaragoza
Arsenal
RealZaragoza
Chelsea
RealZaragoza
Feyenoord
RealZaragoza
TatranPresov
RealZaragozaGloriaBistrita
RealZaragoza
DundeeUnited
TatranPresov
WerderBremen
FeyenoordZalgirisVilnius
Feyenoord
MaccabiTelAviv
WerderBremen
ClubBruggeKV
Chelsea
FKAustria(Wien)
ChelseaViktoriaZizkov
Chelsea
MariborBranik
FKAustria(Wien)
Panathinaikos
ClubBruggeKVSligoRovers
ClubBruggeKV
FCPirin(Blagoevgrad)
Panathinaikos
Sampdoria
Arsenal
AJAuxerre
Arsenal
BrondbyIF
ArsenalOmonia(Lefkosia)
Arsenal
KSTirane
BrondbyIF
Besiktas
AJAuxerreNKCroatia(Zagreb)
AJAuxerre
HJK(Helsinki)
Besiktas
FCPorto
Sampdoria
GrasshopperClubZuerich
SampdoriaFKBodoGlimt
Sampdoria
ChernomoretsOdessa
GrasshopperClubZuerich
Ferencvarosi
FCPortoLKSLodz
FCPorto
CSKAMoscow
Ferencvarosi
cwc.9495
Figure 19 The Cup Winners Cup 1994/95.
46

Appendix, Tournament Trees
ParisSaintGermain
SKRapid(Wien)
ParisSaintGermain
RCDeportivoLaCoruna
ParisSaintGermain
Parma
ParisSaintGermain
Celtic
ParisSaintGermainMoldeFK
ParisSaintGermain
DinamoBatumi
Celtic
HalmstadsBK
ParmaKSTeuta(Durres)
Parma
LokomotivSofia
HalmstadsBK
RealZaragoza
RCDeportivoLaCoruna
Trabzonspor
RCDeportivoLaCorunaApoel(Lefkosia)
RCDeportivoLaCoruna
ZalgirisVilnius
Trabzonspor
ClubBruggeKV
RealZaragozaInterZTSBratislava
RealZaragoza
ShakhtarDonetsk
ClubBruggeKV
Feyenoord
SKRapid(Wien)
DinamoMoscow
SKRapid(Wien)
SportingCP(Lisbon)
SKRapid(Wien)PetrolulPloiesti
SKRapid(Wien)
MaccabiHaifa
SportingCP(Lisbon)
SKHradecKralove
DinamoMoscowAraratErevan
DinamoMoscow
FCKobenhavn
SKHradecKralove
BorussiaMonchengladbach
Feyenoord
Everton
FeyenoordDAGLiepaya
Feyenoord
KR(Reykjavik)
Everton
AEK(Athens)
BorussiaMonchengladbachSileksKratovo
BorussiaMonchengladbach
FCSion
AEK(Athens)
cwc.9596
Figure 20 The Cup Winners Cup 1995/96.
47
Appendix, Tournament TreesA.2.2 UEFA Cup
Juventus
ACFiorentina
Juventus
Koeln
Juventus
HamburgerSV
Juventus
FCKarlMarxStadt
JuventusParisSaintGermain
JuventusGornikZabrzeJuventus
FCKuusysi(Lahti)ParisSaintGermain
FCSion
FCKarlMarxStadtBoavistaFCKarlMarxStadt
Iraklis(Salonica)FCSion
FCPorto
HamburgerSVRealZaragoza
HamburgerSVOrgryteISHamburgerSV
Apollon(Limassol)RealZaragoza
Valencia
FCPortoFlacaraMoreniFCPorto
VictoriaBucharestValencia
RoyalAntwerp
Koeln
RedStar(Belgrade)
KoelnSpartakMoscow
KoelnTJPlastika(Nitra)Koeln
AtalantaSpartakMoscow
ZalgirisVilnius
RedStar(Belgrade)GalatasarayRedStar(Belgrade)
IFKGothenburgZalgirisVilnius
VfBStuttgart
RoyalAntwerpDundeeUnited
RoyalAntwerpFCLevski(Sofia)RoyalAntwerp
GlentoranDundeeUnited
ZenitLeningrad
VfBStuttgartFeyenoordVfBStuttgart
NaestvedIFZenitLeningrad
WerderBremen
ACFiorentina
AJAuxerre
ACFiorentina
DinamoKiev
ACFiorentinaFCSochauxMontbeliard
ACFiorentinaAtleticoMadridACFiorentina
ASLaJeunesseDEschFCSochauxMontbeliard
BanikOstrava
DinamoKievMTK(Budapest)DinamoKiev
FCHansaRostockBanikOstrava
Olympiakos(Pireus)
AJAuxerreRoPS(Rovaniemi)
AJAuxerreKSApolonia(Fier)AJAuxerre
GKSKatowiceRoPS(Rovaniemi)
FirstViennaFC
Olympiakos(Pireus)FKRad(Belgrade)Olympiakos(Pireus)
VallettaFirstViennaFC
RFCLiegois
WerderBremen
Napoli
WerderBremenFKAustria(Wien)
WerderBremenLillestromSKWerderBremen
AjaxFKAustria(Wien)
FCWettingen
NapoliSportingCP(Lisbon)Napoli
DundalkFCWettingen
SKRapid(Wien)
RFCLiegoisHibernian
RFCLiegoisIA(Akranes)RFCLiegois
VideotonWalthamSCHibernian
ClubBruggeKV
SKRapid(Wien)AberdeenSKRapid(Wien)
FCTwente(Enschede)ClubBruggeKV
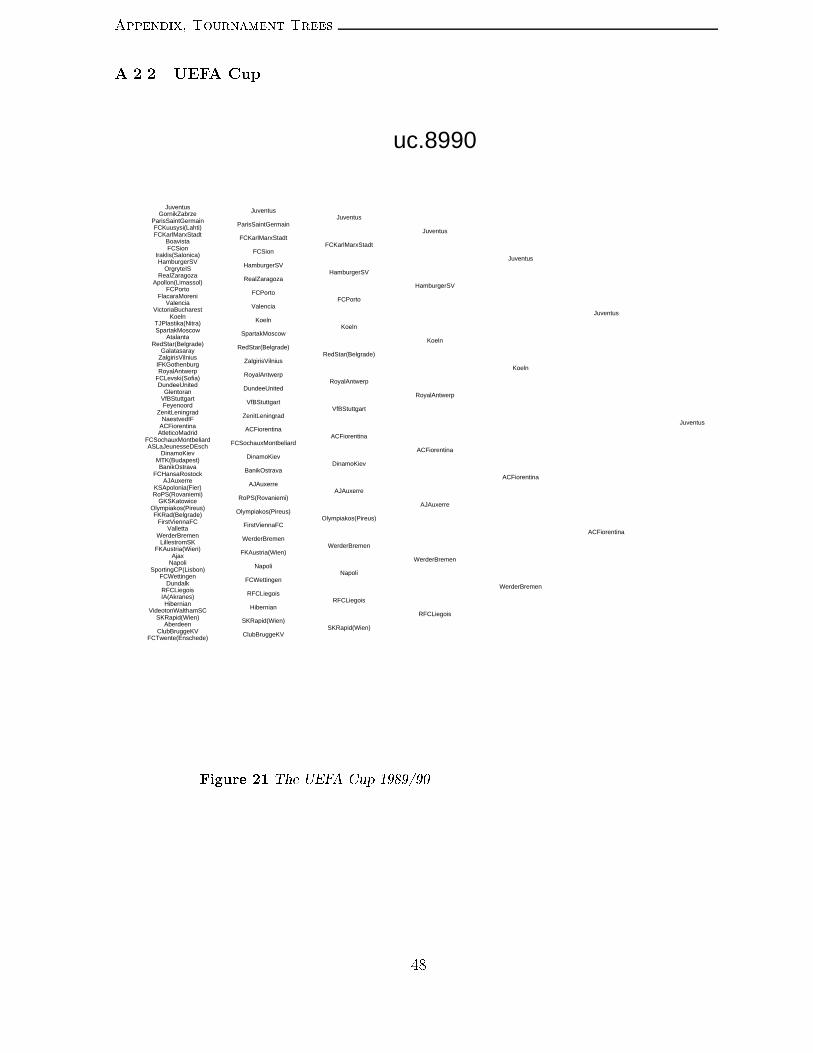
uc.8990
Figure 21 The UEFA Cup 1989/90.48

Appendix, Tournament Trees
Internazionale
Roma
Internazionale
SportingCP(Lisbon)
Internazionale
Atalanta
Internazionale
FKPartizan(Belgrade)
InternazionaleAstonVilla
InternazionaleSKRapid(Wien)Internazionale
BanikOstravaAstonVilla
RealSociedad
FKPartizan(Belgrade)HibernianFKPartizan(Belgrade)
LausanneSportsRealSociedad
Koeln
AtalantaFenerbahce
AtalantaNKDinamo(Zagreb)Atalanta
VitoriaSC(Guimaraes)Fenerbahce
InterZTSBratislava
KoelnIFKNorrkopingKoeln
AvenirBeggenInterZTSBratislava
Bologna
SportingCP(Lisbon)
Vitesse(Arnhem)
SportingCP(Lisbon)PolitehnicaTimisoara
SportingCP(Lisbon)KVMechelenSportingCP(Lisbon)
AtleticoMadridPolitehnicaTimisoara
DundeeUnited
Vitesse(Arnhem)DerryCityVitesse(Arnhem)
FH(Hafnarfjardar)DundeeUnited
AdmiraWacker
BolognaHeartOfMidlothian
BolognaZaglebieLubinBologna
DneprDnepropetrovskHeartOfMidlothian
FCLucerne
AdmiraWackerVejleBKAdmiraWacker
MTK(Budapest)FCLucerne
BrondbyIF
Roma
RSCAnderlecht
Roma
GirondinsBordeaux
RomaValencia
RomaSLBenficaRoma
Iraklis(Salonica)Valencia
Magdeburg
GirondinsBordeauxGlenavonGirondinsBordeaux
RoPS(Rovaniemi)Magdeburg
BorussiaDortmund
RSCAnderlechtOmonia(Nicosia)
RSCAnderlechtPetrolulPloiestiRSCAnderlecht
FCSlavia(Sofia)Omonia(Nicosia)
UniversitateaCraiova
BorussiaDortmundChemnitzerFCBorussiaDortmund
KSPartizani(Tirana)UniversitateaCraiova
TorpedoMoscow
BrondbyIF
BayerLeverkusen
BrondbyIFFerencvarosi
BrondbyIFEintrachtFrankfurtBrondbyIF
RoyalAntwerpFerencvarosi
GKSKatowice
BayerLeverkusenFCTwente(Enschede)BayerLeverkusen
TPS(Turku)GKSKatowice
ASMonaco
TorpedoMoscowSevilla
TorpedoMoscowGAIS(Gothenburg)TorpedoMoscow
PAOK(Salonica)Sevilla
ChernomoretsOdessa
ASMonacoRodaJC(Kerkrade)ASMonaco
RosenborgBKChernomoretsOdessa
uc.9091
Figure 22 The UEFA Cup 1990/91.49

Appendix, Tournament Trees
Ajax
Torino
Ajax
Genoa
Ajax
KAAGhent
Ajax
CAOsasuna
AjaxFCRotWeissErfurt
AjaxOrebroSKAjax
FCGroningenFCRotWeissErfurt
VfBStuttgart
CAOsasunaFCSlavia(Sofia)CAOsasuna
PecsiMunkasSCVfBStuttgart
DinamoMoscow
KAAGhentEintrachtFrankfurt
KAAGhentLausanneSportsKAAGhent
CASporaLuxembourgEintrachtFrankfurt
ASCannes
DinamoMoscowVaciIzzoMTEDinamoMoscow
SCSalgueirosASCannes
Liverpool
Genoa
SteauaBucharest
GenoaDinamoBucharest
GenoaRealOviedoGenoa
SportingCP(Lisbon)DinamoBucharest
SportingGijon
SteauaBucharestAnorthosisofFamagustaSteauaBucharest
FKPartizan(Belgrade)SportingGijon
FCTirolInnsbruck
LiverpoolAJAuxerre
LiverpoolFCKuusysi(Lahti)Liverpool
IkastFSAJAuxerre
PAOK(Salonica)
FCTirolInnsbruckTromsoILFCTirolInnsbruck
KVMechelenPAOK(Salonica)
RealMadrid
Torino
B1903(Copenhagen)
Torino
AEK(Athens)
TorinoBoavista
TorinoKR(Reykjavik)Torino
InternazionaleBoavista
SpartakMoscow
AEK(Athens)SKVllaznia(Shkoder)AEK(Athens)
MP(Mikkeli)SpartakMoscow
Trabzonspor
B1903(Copenhagen)BayernMunich
B1903(Copenhagen)AberdeenB1903(Copenhagen)
CorkCityBayernMunich
OlympiqueLyonnais
TrabzonsporHASKGradjanskiTrabzonspor
OstersIFOlympiqueLyonnais
SKOlomoucSigma
RealMadrid
NeuchatelXamax
RealMadridFCUtrecht
RealMadridSlovanBratislavaRealMadrid
SKSturmGrazFCUtrecht
Celtic
NeuchatelXamaxFlorianaNeuchatelXamax
KFCGerminal(Ekeren)Celtic
HamburgerSV
SKOlomoucSigmaTorpedoMoscow
SKOlomoucSigmaBangorSKOlomoucSigma
HallescherFCTorpedoMoscow
CSKA(Sofia)
HamburgerSVGornikZabrzeHamburgerSV
ParmaCSKA(Sofia)
uc.9192
Figure 23 The UEFA Cup 1991/92.50

Appendix, Tournament Trees
Juventus
BorussiaDortmund
Juventus
ParisSaintGermain
Juventus
SLBenfica
Juventus
SKOlomoucSigma
JuventusPanathinaikos
JuventusAnorthosisofAmmochostosJuventus
ElectroputereCraiovaPanathinaikos
Fenerbahce
SKOlomoucSigmaUniversitateaCraiovaSKOlomoucSigma
FCBotev(Plovdiv)Fenerbahce
DinamoMoscow
SLBenficaVacFCSamsung
SLBenficaBelvedurIzolaSLBenfica
FCGroningenVacFCSamsung
Torino
DinamoMoscowRosenborgBKDinamoMoscow
IFKNorrkopingTorino
RealMadrid
ParisSaintGermain
RSCAnderlecht
ParisSaintGermainNapoli
ParisSaintGermainPAOK(Thessaloniki)ParisSaintGermain
ValenciaNapoli
DinamoKiev
RSCAnderlechtHibernianRSCAnderlecht
SKRapid(Wien)DinamoKiev
Vitesse(Arnhem)
RealMadridTorpedoMoscow
RealMadridPolitehnicaTimisoaraRealMadrid
ManchesterUnitedTorpedoMoscow
KVMechelen
Vitesse(Arnhem)DerryCityVitesse(Arnhem)
OrebroSKKVMechelen
AJAuxerre
BorussiaDortmund
Roma
BorussiaDortmund
RealZaragoza
BorussiaDortmundCeltic
BorussiaDortmundFlorianaBorussiaDortmund
KoelnCeltic
BKFrem(Kobenhavn)
RealZaragozaSMCaenRealZaragoza
NeuchatelXamaxBKFrem(Kobenhavn)
Galatasaray
RomaGrasshopperClubZuerich
RomaFCWackerInnsbruckRoma
SportingCP(Lisbon)GrasshopperClubZuerich
EintrachtFrankfurt
GalatasarayGKSKatowiceGalatasaray
WidzewLodzEintrachtFrankfurt
Ajax
AJAuxerre
StandardCL(Liege)
AJAuxerreFCKobenhavn
AJAuxerreFCLokomotiv(Plovdiv)AJAuxerre
MP(Mikkeli)FCKobenhavn
HeartOfMidlothian
StandardCL(Liege)PortadownStandardCL(Liege)
SlaviaPrahaHeartOfMidlothian
Kaiserslautern
AjaxVitoriaSC(Guimaraes)
AjaxSVCasinoSalzburgAjax
RealSociedadVitoriaSC(Guimaraes)
SheffieldWednesday
KaiserslauternFram(Reykjavik)Kaiserslautern
CASporaLuxembourgSheffieldWednesday
uc.9293
Figure 24 The UEFA Cup 1992/93.51

Appendix, Tournament Trees
Internazionale
SVCasinoSalzburg
Internazionale
Cagliari
Internazionale
BorussiaDortmund
Internazionale
NorwichCity
InternazionaleApollon(Limassol)
InternazionaleRapidBucharestInternazionale
VacFCSamsungApollon(Limassol)
BayernMuenchen
NorwichCityVitesse(Arnhem)NorwichCity
FCTwente(Enschede)BayernMuenchen
BrondbyIF
BorussiaDortmundMariborBranik
BorussiaDortmundSpartakVladikavkazBorussiaDortmund
GloriaBistritaMariborBranik
FCKuusysi(Lahti)
BrondbyIFDundeeUnitedBrondbyIF
KSVWaregemFCKuusysi(Lahti)
Juventus
Cagliari
KVMechelen
CagliariTrabzonspor
CagliariDinamoBucharestCagliari
VallettaTrabzonspor
MTK(Budapest)
KVMechelenIFKNorrkopingKVMechelen
KR(Reykjavik)MTK(Budapest)
CDTenerife
JuventusKongsvingerIL
JuventusLokomotivMoscowJuventus
OstersIFKongsvingerIL
Olympiakos(Pireus)
CDTenerifeAJAuxerreCDTenerife
FCBotev(Plovdiv)Olympiakos(Pireus)
KarlsruherSC
SVCasinoSalzburg
EintrachtFrankfurt
SVCasinoSalzburg
SportingCP(Lisbon)
SVCasinoSalzburgRoyalAntwerp
SVCasinoSalzburgDACDunajskaStredaSVCasinoSalzburg
CSMaritimoRoyalAntwerp
Celtic
SportingCP(Lisbon)KocaelisporSportingCP(Lisbon)
BSCYoungBoysCeltic
RCDeportivoLaCoruna
EintrachtFrankfurtDneprDnepropetrovsk
EintrachtFrankfurtDinamoMoscowEintrachtFrankfurt
AdmiraWackerDneprDnepropetrovsk
AstonVilla
RCDeportivoLaCorunaAaB(Aalborg)RCDeportivoLaCoruna
SlovanBratislavaAstonVilla
Boavista
KarlsruherSC
GirondinsBordeaux
KarlsruherSCValencia
KarlsruherSCPSV(Eindhoven)KarlsruherSC
FCNantesValencia
ServetteFCGeneva
GirondinsBordeauxBohemiansGirondinsBordeaux
CrusadersServetteFCGeneva
OFI(Crete)
BoavistaLazio
BoavistaUSLuxembourgBoavista
FCLokomotiv(Plovdiv)Lazio
AtleticoMadrid
OFI(Crete)SlaviaPrahaOFI(Crete)
HeartOfMidlothianAtleticoMadrid
uc.9394
Figure 25 The UEFA Cup 1993/94.52

Appendix, Tournament Trees
Parma
Juventus
Parma
BayerLeverkusen
Parma
OB(Odense)
Parma
AthleticBilbao
ParmaAIK(Stockholm)
ParmaVitesse(Arnhem)Parma
SlaviaPrahaAIK(Stockholm)
NewcastleUnited
AthleticBilbaoAnorthosisofAmmochostosAthleticBilbao
RoyalAntwerpNewcastleUnited
RealMadrid
OB(Odense)Kaiserslautern
OB(Odense)LinfieldOB(Odense)
IA(Akranes)Kaiserslautern
DinamoMoscow
RealMadridSportingCP(Lisbon)RealMadrid
RFCSeraingDinamoMoscow
FCNantes
BayerLeverkusen
GKSKatowice
BayerLeverkusenKispestHonved
BayerLeverkusenPSV(Eindhoven)BayerLeverkusen
FCTwente(Enschede)KispestHonved
GirondinsBordeaux
GKSKatowiceAris(Thessaloniki)GKSKatowice
LillestromSKGirondinsBordeaux
FCSion
FCNantesTekstilschikKamyshin
FCNantesRotorVolgogradFCNantes
BekescsabaiEloreTekstilschikKamyshin
OlympiqueMarseille
FCSionApollon(Limassol)FCSion
Olympiakos(Pireus)OlympiqueMarseille
BorussiaDortmund
Juventus
EintrachtFrankfurt
Juventus
AdmiraWacker
JuventusCSMaritimo
JuventusCSKA(Sofia)Juventus
FCAarauCSMaritimo
ASCannes
AdmiraWackerGornikZabrzeAdmiraWacker
FenerbahceASCannes
Napoli
EintrachtFrankfurtRapidBucharest
EintrachtFrankfurtSCTOlimpija(Ljubljana)EintrachtFrankfurt
RSCCharleroiRapidBucharest
Boavista
NapoliSkontoRigaNapoli
MyPa(Anjalankoski)Boavista
Lazio
BorussiaDortmund
RCDeportivoLaCoruna
BorussiaDortmundSlovanBratislava
BorussiaDortmundMotherwellBorussiaDortmund
FCKobenhavnSlovanBratislava
FCTirolInnsbruck
RCDeportivoLaCorunaRosenborgBKRCDeportivoLaCoruna
DinamoTblisiFCTirolInnsbruck
Trabzonspor
LazioTrelleborgsFF
LazioDinamoMinskLazio
BlackburnRoversTrelleborgsFF
AstonVilla
TrabzonsporDinamoBucharestTrabzonspor
InternazionaleAstonVilla
uc.9495
Figure 26 The UEFA Cup 1994/95.53

Appendix, Tournament Trees
BayernMuenchen
GirondinsBordeaux
BayernMuenchen
FCBarcelona
BayernMuenchen
NottinghamForest
BayernMuenchen
SLBenfica
BayernMuenchenRaithRovers
BayernMuenchenLokomotivMoscowBayernMuenchen
IA(Akranes)RaithRovers
RodaJC(Kerkrade)
SLBenficaLierseSKSLBenfica
SCTOlimpija(Ljubljana)RodaJC(Kerkrade)
OlympiqueLyonnais
NottinghamForestAJAuxerre
NottinghamForestMalmoFFNottinghamForest
VikingFK(Stavanger)AJAuxerre
Lazio
OlympiqueLyonnaisSCFarenseOlympiqueLyonnais
Omonia(Lefkosia)Lazio
PSV(Eindhoven)
FCBarcelona
Sevilla
FCBarcelonaVitoriaSC(Guimaraes)
FCBarcelonaHapoelBeerShevaFCBarcelona
StandardCL(Liege)VitoriaSC(Guimaraes)
Olympiakos(Pireus)
SevillaFCBotev(Plovdiv)Sevilla
MariborBranikOlympiakos(Pireus)
WerderBremen
PSV(Eindhoven)LeedsUnited
PSV(Eindhoven)MyPa(Anjalankoski)PSV(Eindhoven)
ASMonacoLeedsUnited
DinamoMinsk
WerderBremenGlenavonWerderBremen
FKAustria(Wien)DinamoMinsk
SlaviaPraha
GirondinsBordeaux
Milan
GirondinsBordeaux
RealBetisBalompie
GirondinsBordeauxRotorVolgograd
GirondinsBordeauxVardarSkopjeGirondinsBordeaux
ManchesterUnitedRotorVolgograd
Kaiserslautern
RealBetisBalompieFenerbahceRealBetisBalompie
SlovanBratislavaKaiserslautern
SpartaPraha
MilanRCStrasbourg
MilanZaglebieLubinMilan
UjpestiTERCStrasbourg
ZimbruChisinau
SpartaPrahaSilkeborgIFSpartaPraha
RAFYelgavaZimbruChisinau
Roma
SlaviaPraha
RCLens
SlaviaPrahaFCLugano
SlaviaPrahaSCFreiburgSlaviaPraha
InternazionaleFCLugano
ChernomoretsOdessa
RCLensAvenirBeggenRCLens
WidzewLodzChernomoretsOdessa
BrondbyIF
RomaSCEendrachtAalst
RomaNeuchatelXamaxRoma
FCLevski(Sofia)SCEendrachtAalst
Liverpool
BrondbyIFLillestromSKBrondbyIF
SpartakVladikavkazLiverpool
uc.9596
Figure 27 The UEFA Cup 1995/96.54
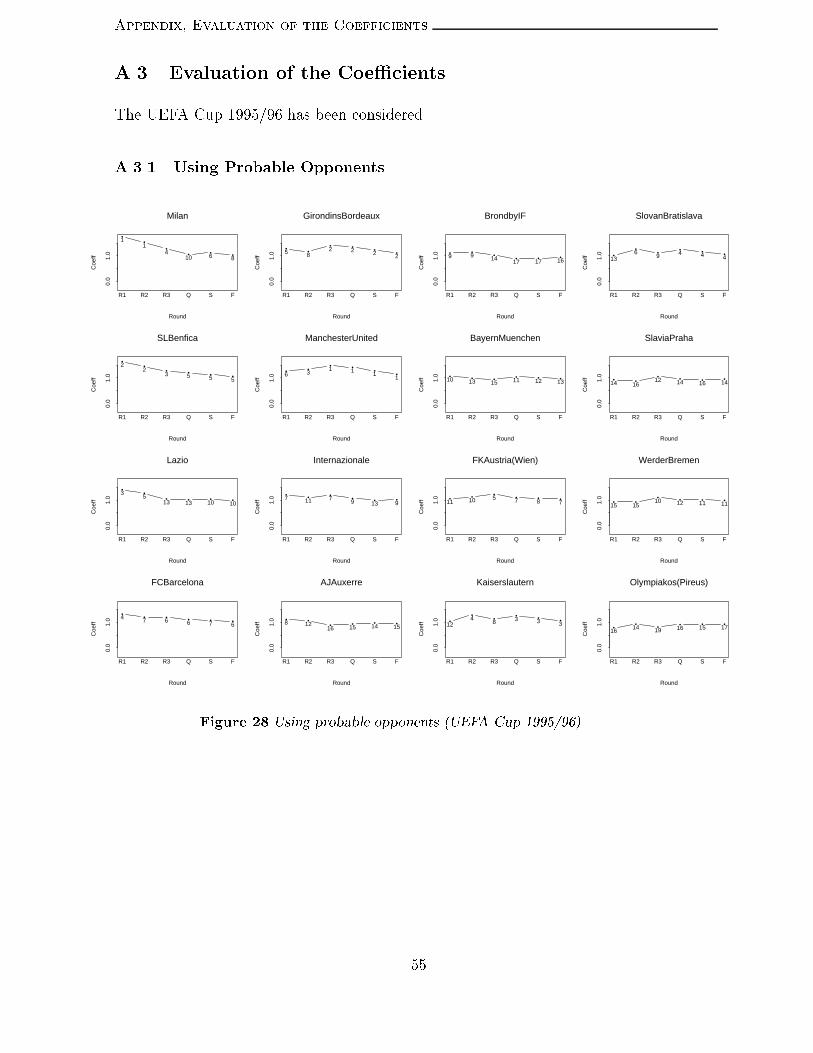
Appendix, Evaluation of the CoefficientsA.3 Evaluation of the Coe�cientsThe UEFA Cup 1995/96 has been considered.A.3.1 Using Probable Opponents•
••
• • •
Round
Coe
ff
0.0
1.0
Milan
11
410 6 8
R1 R2 R3 Q S F
••
• • • •
Round
Coe
ff
0.0
1.0
SLBenfica
22
3 5 5 5
R1 R2 R3 Q S F
••
• • • •
Round
Coe
ff
0.0
1.0
Lazio
35
13 13 10 10
R1 R2 R3 Q S F
• • • • • •
Round
Coe
ff
0.0
1.0
FCBarcelona
4 7 6 6 7 6
R1 R2 R3 Q S F
• •• • • •
Round
Coe
ff
0.0
1.0
GirondinsBordeaux
5 82 2 2 2
R1 R2 R3 Q S F
• •• •
••
Round
Coe
ff
0.0
1.0
ManchesterUnited
6 31 1 1
1
R1 R2 R3 Q S F
• • • • • •
Round
Coe
ff
0.0
1.0
Internazionale
7 11 7 9 13 9
R1 R2 R3 Q S F
• •• • • •
Round
Coe
ff
0.0
1.0
AJAuxerre
8 1216 15 14 15
R1 R2 R3 Q S F
• • • • • •
Round
Coe
ff
0.0
1.0
BrondbyIF
9 9 1417 17 16
R1 R2 R3 Q S F
• • • • • •
Round
Coe
ff
0.0
1.0
BayernMuenchen
10 13 15 11 12 13
R1 R2 R3 Q S F
• • • • • •
Round
Coe
ff
0.0
1.0
FKAustria(Wien)
11 10 5 7 8 7
R1 R2 R3 Q S F
••
• • • •
Round
Coe
ff
0.0
1.0
Kaiserslautern
124
8 3 3 3
R1 R2 R3 Q S F
••
• • • •
Round
Coe
ff
0.0
1.0
SlovanBratislava
136
9 4 4 4
R1 R2 R3 Q S F
• •• • • •
Round
Coe
ff
0.0
1.0
SlaviaPraha
14 1612 14 16 14
R1 R2 R3 Q S F
• •• • • •
Round
Coe
ff
0.0
1.0
WerderBremen
15 1510 12 11 11
R1 R2 R3 Q S F
•• • • • •
Round
Coe
ff
0.0
1.0
Olympiakos(Pireus)
1614 19 16 15 17
R1 R2 R3 Q S FFigure 28 Using probable opponents (UEFA Cup 1995/96).
55

Appendix, Evaluation of the Coefficients• • • • • •
Round
Coe
ff
0.0
1.0
ChernomoretsOdessa
17 19 23 23 23 23
R1 R2 R3 Q S F
•• • • • •
Round
Coe
ff
0.0
1.0
MariborBranik
1818 20 18 18 18
R1 R2 R3 Q S F
• • • • • •
Round
Coe
ff
0.0
1.0
ASMonaco
19 22 22 21 21 21
R1 R2 R3 Q S F
• •• • • •
Round
Coe
ff
0.0
1.0
StandardCL(Liege)
20 2317 20 20 20
R1 R2 R3 Q S F
• • • • • •
Round
Coe
ff
0.0
1.0
PSV(Eindhoven)
21 21 21 19 19 19
R1 R2 R3 Q S F
••
• • • •
Round
Coe
ff
0.0
1.0
RotorVolgograd
2217
11 8 9 12
R1 R2 R3 Q S F
• • • • • •
Round
Coe
ff
0.0
1.0
SpartaPraha
23 25 30 26 24 25
R1 R2 R3 Q S F
• • • • • •
Round
Coe
ff
0.0
1.0
FCLevski(Sofia)
25 26 26 27 27 26
R1 R2 R3 Q S F
•• • • • •
Round
Coe
ff
0.0
1.0
DinamoMinsk
2420 18 22 22 22
R1 R2 R3 Q S F
•• • • • •
Round
Coe
ff
0.0
1.0
LillestromSK
2724 24 28 28 27
R1 R2 R3 Q S F
• • • • • •
RoundC
oeff
0.0
1.0
IA(Akranes)
26 28 25 24 25 24
R1 R2 R3 Q S F
• •• • • •
Round
Coe
ff
0.0
1.0
SCTOlimpija(Ljubljana)
29 3027 29 29 29
R1 R2 R3 Q S F
• • • • • •
Round
Coe
ff
0.0
1.0
MyPa(Anjalankoski)
28 27 28 25 26 28
R1 R2 R3 Q S F
• • • • • •
Round
Coe
ff
0.0
1.0
Roma
30 31 34 32 32 32
R1 R2 R3 Q S F
• • •• • •
Round
Coe
ff
0.0
1.0
Fenerbahce
31 32 3130 30 30
R1 R2 R3 Q S F
• • • • • •
Round
Coe
ff
0.0
1.0
SpartakVladikavkaz
34 34 33 34 34 34
R1 R2 R3 Q S FFigure 29 Using probable opponents (UEFA Cup 1995/96).
56

Appendix, Evaluation of the Coefficients• • • • • •
Round
Coe
ff
0.0
1.0
Liverpool
33 33 32 33 33 33
R1 R2 R3 Q S F
• • • • • •
Round
Coe
ff
0.0
1.0
Glenavon
32 29 29 31 31 31
R1 R2 R3 Q S F
• • • • • •
Round
Coe
ff
0.0
1.0
WidzewLodz
42 36 39 38 39 38
R1 R2 R3 Q S F
• • • • • •
Round
Coe
ff
0.0
1.0
VitoriaSC(Guimaraes)
41 38 35 35 35 35
R1 R2 R3 Q S F
• • • • • •
Round
Coe
ff
0.0
1.0
VikingFK(Stavanger)
40 35 38 37 37 37
R1 R2 R3 Q S F
• • • • • •
Round
Coe
ff
0.0
1.0
UjpestiTE
39 42 37 40 38 39
R1 R2 R3 Q S F
• • • • • •
Round
Coe
ff
0.0
1.0
NeuchatelXamax
38 39 41 41 41 41
R1 R2 R3 Q S F
• • • • • •
Round
Coe
ff
0.0
1.0
LeedsUnited
37 37 36 36 36 36
R1 R2 R3 Q S F
• • • • • •
Round
Coe
ff
0.0
1.0
FCBotev(Plovdiv)
36 41 40 39 40 40
R1 R2 R3 Q S F
• • • • • •
Round
Coe
ff
0.0
1.0
AvenirBeggen
35 40 42 42 42 42
R1 R2 R3 Q S F
• • • • • •
RoundC
oeff
0.0
1.0
ZimbruChisinau
64 64 64 64 64 64R1 R2 R3 Q S F
• • • • • •
Round
Coe
ff
0.0
1.0
ZaglebieLubin
63 43 47 47 47 47
R1 R2 R3 Q S F
• • • • • •
Round
Coe
ff
0.0
1.0
VardarSkopje
62 47 43 43 43 43
R1 R2 R3 Q S F
• • • • • •
Round
Coe
ff
0.0
1.0
SilkeborgIF
61 51 56 56 56 56R1 R2 R3 Q S F
• • • • • •
Round
Coe
ff
0.0
1.0
Sevilla
60 58 57 57 57 57R1 R2 R3 Q S F
• • • • • •
Round
Coe
ff
0.0
1.0
SCFreiburg
59 50 48 48 48 48
R1 R2 R3 Q S FFigure 30 Using probable opponents (UEFA Cup 1995/96).
57

Appendix, Evaluation of the Coefficients• • • • • •
Round
Coe
ff
0.0
1.0
SCFarense
58 63 59 59 59 59R1 R2 R3 Q S F
• • • • • •
Round
Coe
ff
0.0
1.0
SCEendrachtAalst
57 52 55 55 54 55R1 R2 R3 Q S F
• • • • • •
Round
Coe
ff
0.0
1.0
RodaJC(Kerkrade)
56 54 51 51 51 51
R1 R2 R3 Q S F
• • • • • •
Round
Coe
ff
0.0
1.0
RealBetisBalompie
55 55 53 53 53 53
R1 R2 R3 Q S F
• • • • • •
Round
Coe
ff
0.0
1.0
RaithRovers
54 53 52 52 52 52
R1 R2 R3 Q S F
• • • • • •
Round
Coe
ff
0.0
1.0
RCStrasbourg
53 57 54 54 55 54R1 R2 R3 Q S F
• • • • • •
Round
Coe
ff
0.0
1.0
RCLens
52 56 60 60 60 60R1 R2 R3 Q S F
• • • • • •
Round
Coe
ff
0.0
1.0
RAFYelgava
51 62 63 63 63 63R1 R2 R3 Q S F
• • • • • •
Round
Coe
ff
0.0
1.0
Omonia(Lefkosia)
50 45 49 50 50 50
R1 R2 R3 Q S F
• • • • • •
Round
Coe
ff
0.0
1.0
OlympiqueLyonnais
49 61 58 58 58 58R1 R2 R3 Q S F
• • • • • •
RoundC
oeff
0.0
1.0
NottinghamForest
48 60 62 62 62 62R1 R2 R3 Q S F
• • • • • •
Round
Coe
ff
0.0
1.0
MalmoFF
47 59 61 61 61 61R1 R2 R3 Q S F
• • • • • •
Round
Coe
ff
0.0
1.0
LokomotivMoscow
46 49 50 49 49 49
R1 R2 R3 Q S F
• • • • • •
Round
Coe
ff
0.0
1.0
LierseSK
45 44 44 44 44 44
R1 R2 R3 Q S F
• • • • • •
Round
Coe
ff
0.0
1.0
HapoelBeerSheva
44 46 46 45 45 45
R1 R2 R3 Q S F
• • • • • •
Round
Coe
ff
0.0
1.0
FCLugano
43 48 45 46 46 46
R1 R2 R3 Q S FFigure 31 Using probable opponents (UEFA Cup 1995/96).
58

Appendix, Evaluation of the CoefficientsA.3.2 Using All Potential Opponents•
•• •
• •
Round
Coe
ff
0.0
1.0
Milan
11
4 3 4 4
R1 R2 R3 Q S F
•• • • • •
Round
Coe
ff
0.0
1.0
SLBenfica
23 3 4 1 1
R1 R2 R3 Q S F
•• • • • •
Round
Coe
ff
0.0
1.0
Lazio
37 7 5 6 6
R1 R2 R3 Q S F
• • • • • •
Round
Coe
ff
0.0
1.0
FCBarcelona
4 5 5 6 5 5
R1 R2 R3 Q S F
•• • •
• •
Round
Coe
ff
0.0
1.0
GirondinsBordeaux
52 1 1
2 2
R1 R2 R3 Q S F
•• • •
• •
Round
Coe
ff
0.0
1.0
ManchesterUnited
64 2 2 3 3
R1 R2 R3 Q S F
• •• • • •
Round
Coe
ff
0.0
1.0
Internazionale
7 610 13 10 9
R1 R2 R3 Q S F
• • • • • •
Round
Coe
ff
0.0
1.0
AJAuxerre
8 13 12 10 9 10
R1 R2 R3 Q S F
• • • • • •
Round
Coe
ff
0.0
1.0
BrondbyIF
9 11 15 14 14 14
R1 R2 R3 Q S F
• • • • • •
Round
Coe
ff
0.0
1.0
BayernMuenchen
10 12 9 8 8 8
R1 R2 R3 Q S F
• • • • • •
Round
Coe
ff
0.0
1.0
FKAustria(Wien)
11 8 11 11 7 7
R1 R2 R3 Q S F
• •• • • •
Round
Coe
ff
0.0
1.0
Kaiserslautern
12 146 7 12 11
R1 R2 R3 Q S F
• •• • • •
Round
Coe
ff
0.0
1.0
SlovanBratislava
13 158 9 13 13
R1 R2 R3 Q S F
•• • • • •
Round
Coe
ff
0.0
1.0
SlaviaPraha
149 14 15 15 15
R1 R2 R3 Q S F
•• • • • •
Round
Coe
ff
0.0
1.0
WerderBremen
1510 13 12 11 12
R1 R2 R3 Q S F
• • • • • •
RoundC
oeff
0.0
1.0
Olympiakos(Pireus)
16 18 16 16 16 16
R1 R2 R3 Q S FFigure 32 Using all potential opponents (UEFA Cup 1995/96).
59

Appendix, Evaluation of the Coefficients• • • • • •
Round
Coe
ff
0.0
1.0
ChernomoretsOdessa
17 2017 21 20 19
R1 R2 R3 Q S F
• • • • • •
Round
Coe
ff
0.0
1.0
MariborBranik
18 22 22 22 21 21
R1 R2 R3 Q S F
• • • • • •
Round
Coe
ff
0.0
1.0
ASMonaco
19 19 20 19 18 18
R1 R2 R3 Q S F
•• • • • •
Round
Coe
ff
0.0
1.0
StandardCL(Liege)
2016 19 17 17 17
R1 R2 R3 Q S F
• • • • • •
Round
Coe
ff
0.0
1.0
PSV(Eindhoven)
21 21 21 20 19 20
R1 R2 R3 Q S F
•• • • • •
Round
Coe
ff
0.0
1.0
RotorVolgograd
2217 18 18 22 22
R1 R2 R3 Q S F
• •• • • •
Round
Coe
ff
0.0
1.0
SpartaPraha
23 2724 23 24 23
R1 R2 R3 Q S F
• • • • • •
Round
Coe
ff
0.0
1.0
FCLevski(Sofia)
25 26 27 27 26 26
R1 R2 R3 Q S F
• • • • • •
Round
Coe
ff
0.0
1.0
DinamoMinsk
24 23 25 25 25 25
R1 R2 R3 Q S F
• • • • • •
Round
Coe
ff
0.0
1.0
LillestromSK
27 28 30 30 30 30
R1 R2 R3 Q S F
• •• • • •
RoundC
oeff
0.0
1.0
IA(Akranes)
26 2423 24 23 24
R1 R2 R3 Q S F
•• • • • •
Round
Coe
ff
0.0
1.0
SCTOlimpija(Ljubljana)
2925 26 26 27 27
R1 R2 R3 Q S F
• • • • • •
Round
Coe
ff
0.0
1.0
MyPa(Anjalankoski)
28 30 29 29 29 29
R1 R2 R3 Q S F
• • • • • •
Round
Coe
ff
0.0
1.0
Roma
30 33 31 31 31 31
R1 R2 R3 Q S F
• •• • • •
Round
Coe
ff
0.0
1.0
Fenerbahce
31 2928 28 28 28
R1 R2 R3 Q S F
• • • • • •
Round
Coe
ff
0.0
1.0
SpartakVladikavkaz
34 32 34 34 34 34
R1 R2 R3 Q S FFigure 33 Using all potential opponents (UEFA Cup 1995/96).
60
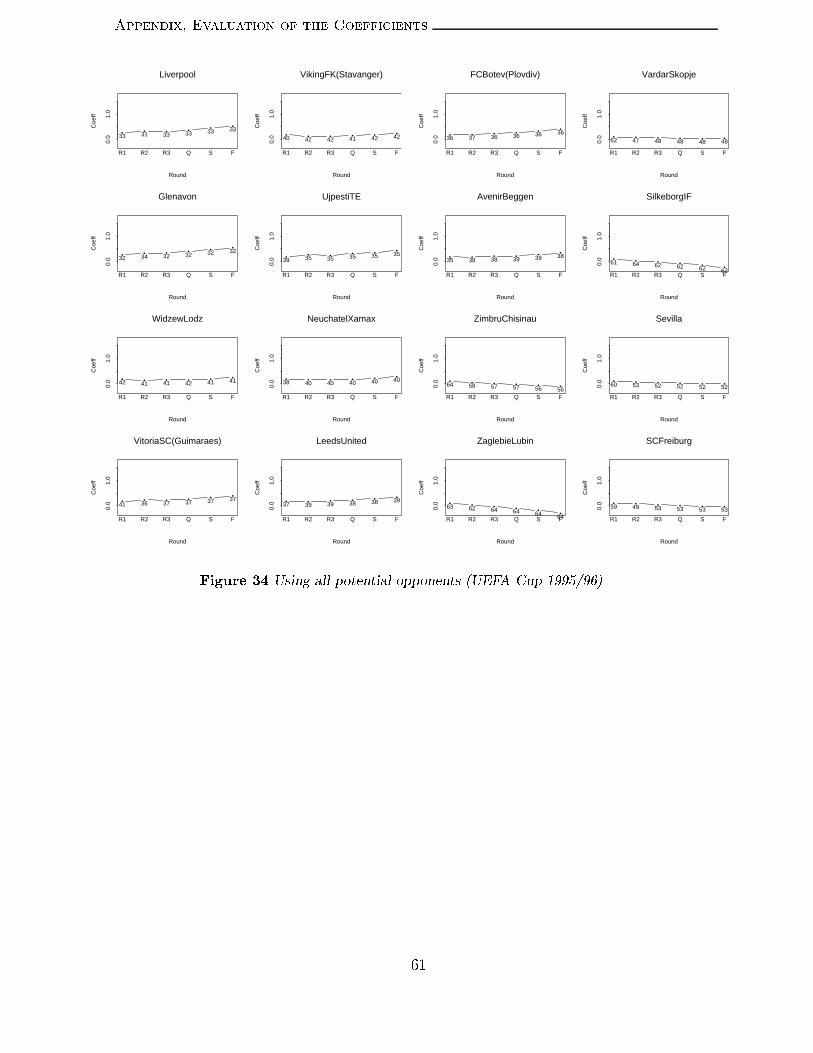
Appendix, Evaluation of the Coefficients• • • • • •
Round
Coe
ff
0.0
1.0
Liverpool
33 31 33 33 33 33
R1 R2 R3 Q S F
• • • • • •
Round
Coe
ff
0.0
1.0
Glenavon
32 34 32 32 32 32
R1 R2 R3 Q S F
• • • • • •
Round
Coe
ff
0.0
1.0
WidzewLodz
42 41 41 42 41 41
R1 R2 R3 Q S F
• • • • • •
Round
Coe
ff
0.0
1.0
VitoriaSC(Guimaraes)
41 36 37 37 37 37
R1 R2 R3 Q S F
• • • • • •
Round
Coe
ff
0.0
1.0
VikingFK(Stavanger)
40 42 42 41 42 42
R1 R2 R3 Q S F
• • • • • •
Round
Coe
ff
0.0
1.0
UjpestiTE
39 35 35 35 35 35
R1 R2 R3 Q S F
• • • • • •
Round
Coe
ff
0.0
1.0
NeuchatelXamax
38 40 40 40 40 40
R1 R2 R3 Q S F
• • • • • •
Round
Coe
ff
0.0
1.0
LeedsUnited
37 39 39 38 38 39
R1 R2 R3 Q S F
• • • • • •
Round
Coe
ff
0.0
1.0
FCBotev(Plovdiv)
36 37 36 36 36 36
R1 R2 R3 Q S F
• • • • • •
Round
Coe
ff
0.0
1.0
AvenirBeggen
35 38 38 39 39 38
R1 R2 R3 Q S F
• • • • • •
RoundC
oeff
0.0
1.0
ZimbruChisinau
64 58 57 57 56 56R1 R2 R3 Q S F
• • • • • •
Round
Coe
ff
0.0
1.0
ZaglebieLubin
63 62 64 64 64 64R1 R2 R3 Q S F
• • • • • •
Round
Coe
ff
0.0
1.0
VardarSkopje
62 47 48 48 48 48
R1 R2 R3 Q S F
• • • • • •
Round
Coe
ff
0.0
1.0
SilkeborgIF
61 64 62 62 62 62R1 R2 R3 Q S F
• • • • • •
Round
Coe
ff
0.0
1.0
Sevilla
60 53 52 52 52 52
R1 R2 R3 Q S F
• • • • • •
Round
Coe
ff
0.0
1.0
SCFreiburg
59 49 53 53 53 53
R1 R2 R3 Q S FFigure 34 Using all potential opponents (UEFA Cup 1995/96).
61
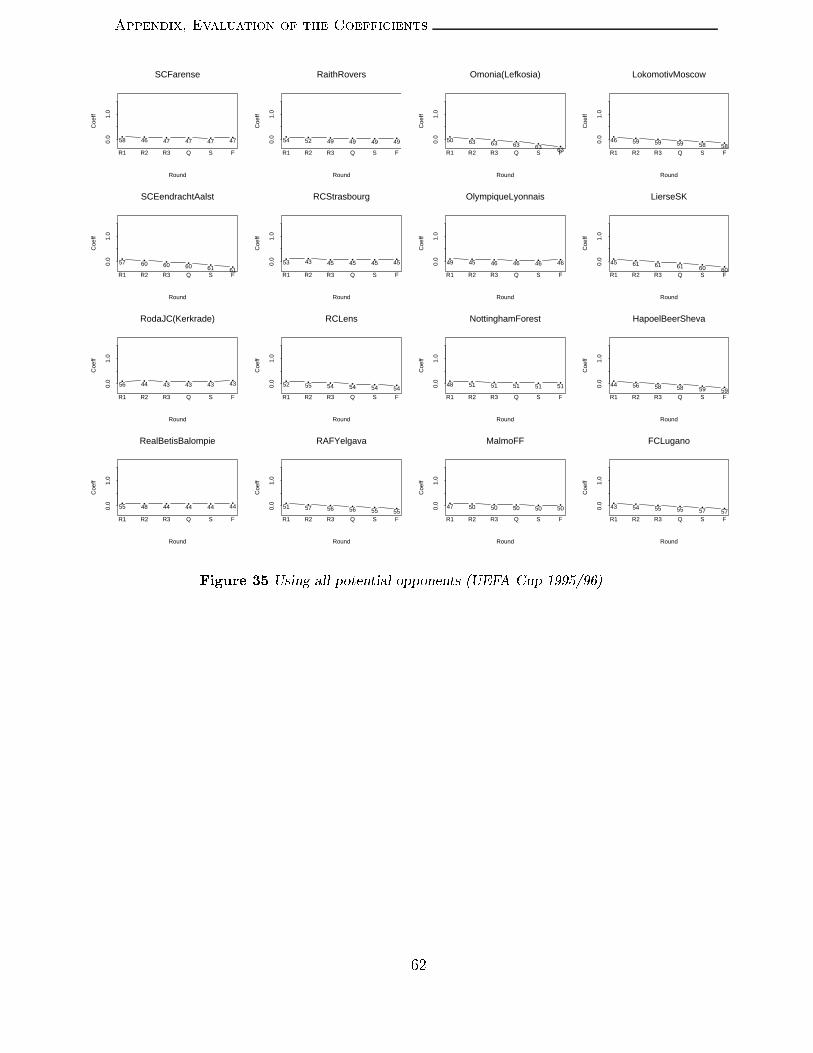
Appendix, Evaluation of the Coefficients• • • • • •
Round
Coe
ff
0.0
1.0
SCFarense
58 46 47 47 47 47
R1 R2 R3 Q S F
• • • • • •
Round
Coe
ff
0.0
1.0
SCEendrachtAalst
57 60 60 60 61 61R1 R2 R3 Q S F
• • • • • •
Round
Coe
ff
0.0
1.0
RodaJC(Kerkrade)
56 44 43 43 43 43
R1 R2 R3 Q S F
• • • • • •
Round
Coe
ff
0.0
1.0
RealBetisBalompie
55 48 44 44 44 44
R1 R2 R3 Q S F
• • • • • •
Round
Coe
ff
0.0
1.0
RaithRovers
54 52 49 49 49 49
R1 R2 R3 Q S F
• • • • • •
Round
Coe
ff
0.0
1.0
RCStrasbourg
53 43 45 45 45 45
R1 R2 R3 Q S F
• • • • • •
Round
Coe
ff
0.0
1.0
RCLens
52 55 54 54 54 54R1 R2 R3 Q S F
• • • • • •
Round
Coe
ff
0.0
1.0
RAFYelgava
51 57 56 56 55 55R1 R2 R3 Q S F
• • • • • •
Round
Coe
ff
0.0
1.0
Omonia(Lefkosia)
50 63 63 63 63 63R1 R2 R3 Q S F
• • • • • •
Round
Coe
ff
0.0
1.0
OlympiqueLyonnais
49 45 46 46 46 46
R1 R2 R3 Q S F
• • • • • •
RoundC
oeff
0.0
1.0
NottinghamForest
48 51 51 51 51 51
R1 R2 R3 Q S F
• • • • • •
Round
Coe
ff
0.0
1.0
MalmoFF
47 50 50 50 50 50
R1 R2 R3 Q S F
• • • • • •
Round
Coe
ff
0.0
1.0
LokomotivMoscow
46 59 59 59 58 58R1 R2 R3 Q S F
• • • • • •
Round
Coe
ff
0.0
1.0
LierseSK
45 61 61 61 60 60R1 R2 R3 Q S F
• • • • • •
Round
Coe
ff
0.0
1.0
HapoelBeerSheva
44 56 58 58 59 59R1 R2 R3 Q S F
• • • • • •
Round
Coe
ff
0.0
1.0
FCLugano
43 54 55 55 57 57R1 R2 R3 Q S FFigure 35 Using all potential opponents (UEFA Cup 1995/96).
62

ReferencesB ReferencesBradley R.A. and Terry M.E. (1952).Rank Analysis of Incomplete Block Designs - I. The Method of Paired Comparisons.Biometrika, 39, 324-345.Protzen Martin and RSSSF (Rec.Sport.Soccer Statistics Foundation) (1996).Quali�cation and Seeding for the European Cups (FAQ)[email protected] B.P. (1996).Improved NCAA Basketball Tournament Modeling via Point Spread and TeamStrength Information.The American Statistician, 50, 39-43.Schwertman N. C., McCready T.A. and Howard L. (1991).Probability Models for the NCAA Regional Basketball Tournaments.The American Statistician, 45, 35-38.Schwertman N. C., Schenk L. and Holbrook B.C. (1996).More Probability Models for the NCAA Regional Basketball Tournaments.The American Statistician, 50, 34-38.
63