Embed Size (px)
Citation preview
Statistical Model of Laser Surface Finishing Using Design of Experiments
J. Murphy, K. Lappo, K. Wood, J.J. Beaman
Mechanical Engineering Department Laboratory for Freeform Fabrication
The University of Texas at Austin, Austin, TX 78712
Abstract In previous work, laser polishing indirect-SLS metal parts was achieved using a Nd:YAG laser raster scanned at high speed. This work showed surface roughness could effectively be reduced by means of shallow surface melting. Surface area roughness data, Ra, was obtained by line profilometry measurements of the polished samples according to a modified procedure based on the ASME standard for surface texture measurements. A Design of Experiments (DOE) was conducted to better understand the effects of processing parameters such as laser beam power, scan time, and scan line density on the surface roughness. The DOE consisted of a multi-level test for each variable and included one replicate. ANOVA was used to determine the significance of each variable and the interactions between variables. Three reduced order models were derived, but large variations in absorptivity in the experiment resulted in large errors and inaccurate models. The data did show the average reduction in roughness over all the trails was about 20%, however several trials resulted in roughness reductions of over 50%. Future work will concentrate on reducing the absorptivity noise to produce more accurate models.
Introduction
For more than a decade the SFF community has acknowledged that the transition from Rapid Prototyping (RP) towards Rapid Manufacturing of functional parts requires the production of parts with adequate surface roughness [1-3]. A survey carried out by the Laboratory for Freeform Fabrication (LFF) at University of the Texas at Austin during Fall 2000 found that surface finish is a critical issue in SFF when parts are needed to serve functional purposes. Surface finishing is a major barrier preventing the use of SLS to produce functional parts.
SLS parts, regardless of the material system used, present a grainy surface finish due to the powder particle size, the layer-wise building sequence and to the vibration of the roller mechanisms during powder delivery [4]. The RP survey carried out by the LFF also indicated that among the finishing techniques used today the most commonly used were hand polishing and abrasive flow grinding. These techniques are tedious and time consuming, although effective in reducing surface roughness. Laser Polishing
585
The motivation for attempting to polish metallic surfaces with lasers began with the fact that for over 30 years lasers have been used for material surface modification [5]. The project was further motivated by previous work done in the LFF that showed the surface of silica rods could be polished from 2.0 µm to 0.05 µm (i.e. peak-to-valley distance) by means of a 25 W CO2 focused c.w. laser [6].
The positive results obtained with silica surfaces encourage pursuing laser polishing of metallic surfaces of SFF parts made by indirect-SLS technology. Both Nd:YAG and CO2 lasers (c.w. mode) were used in polishing 420 stainless steel-40 wt.% bronze indirect-SLS parts and the feasibility of laser surface polishing of metals was proven [7]. The mechanism of laser polishing metal surfaces is based on the assumption that a rough SLS surface consists of peaks and valleys. When the laser beam impinges on the surface, the surface peak melts and then flows into the valley driven by capillary pressure, marangoni forces, and gravity [7]. This mechanism effectively reduces the peak-to-valley height, thus reducing the surface roughness. The next step was developing a Design of Experiments with the objective of systematically identifying the significant processing parameters and associated trends. A modified method of line profilometry was use to characterize the roughness of the two-dimensional surfaces and is discussed below. Surface Characterization A normal surface finish typically consists of three elements: primary texture (roughness), secondary texture (waviness) and form errors (flatness). Most commonly the Center Line Average (Ra) measurement is used to represent the cross-section of a surface. The Ra of a profile is the sum of the areas above and below a mean line divided by the evaluation length [8].
Ra = areas above mean line + areas below mean line (1) evaluation length
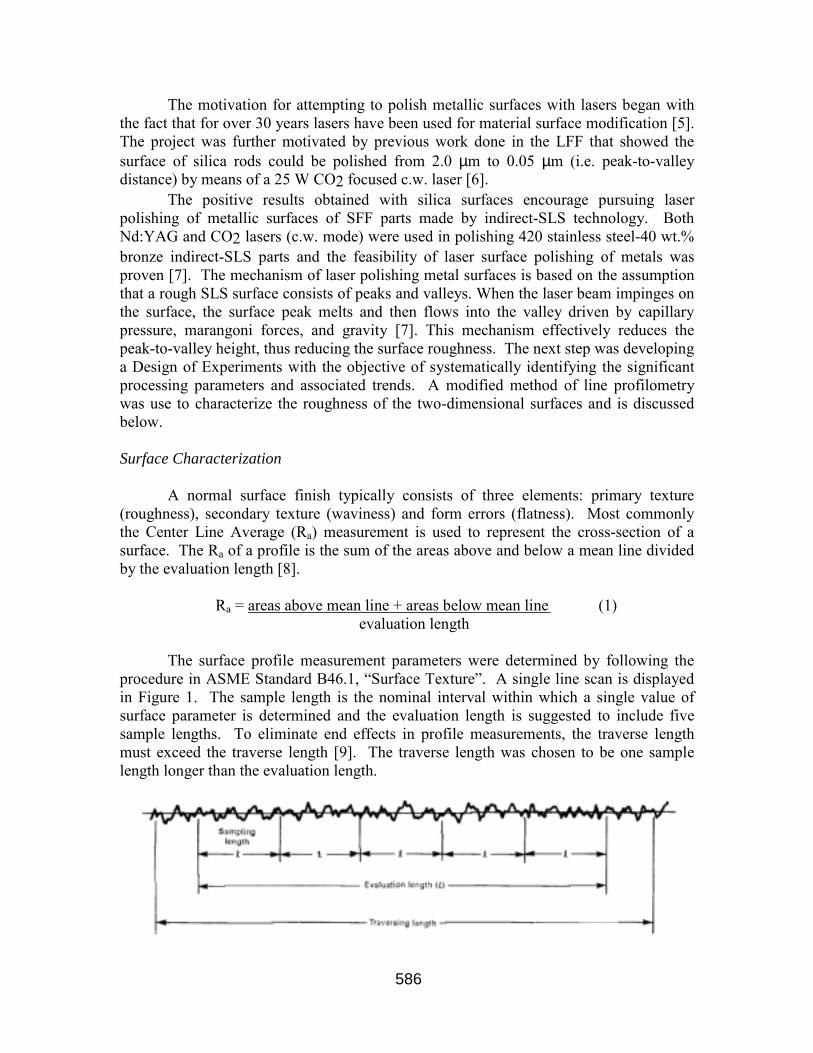
The surface profile measurement parameters were determined by following the procedure in ASME Standard B46.1, �Surface Texture�. A single line scan is displayed in Figure 1. The sample length is the nominal interval within which a single value of surface parameter is determined and the evaluation length is suggested to include five sample lengths. To eliminate end effects in profile measurements, the traverse length must exceed the traverse length [9]. The traverse length was chosen to be one sample length longer than the evaluation length.
586
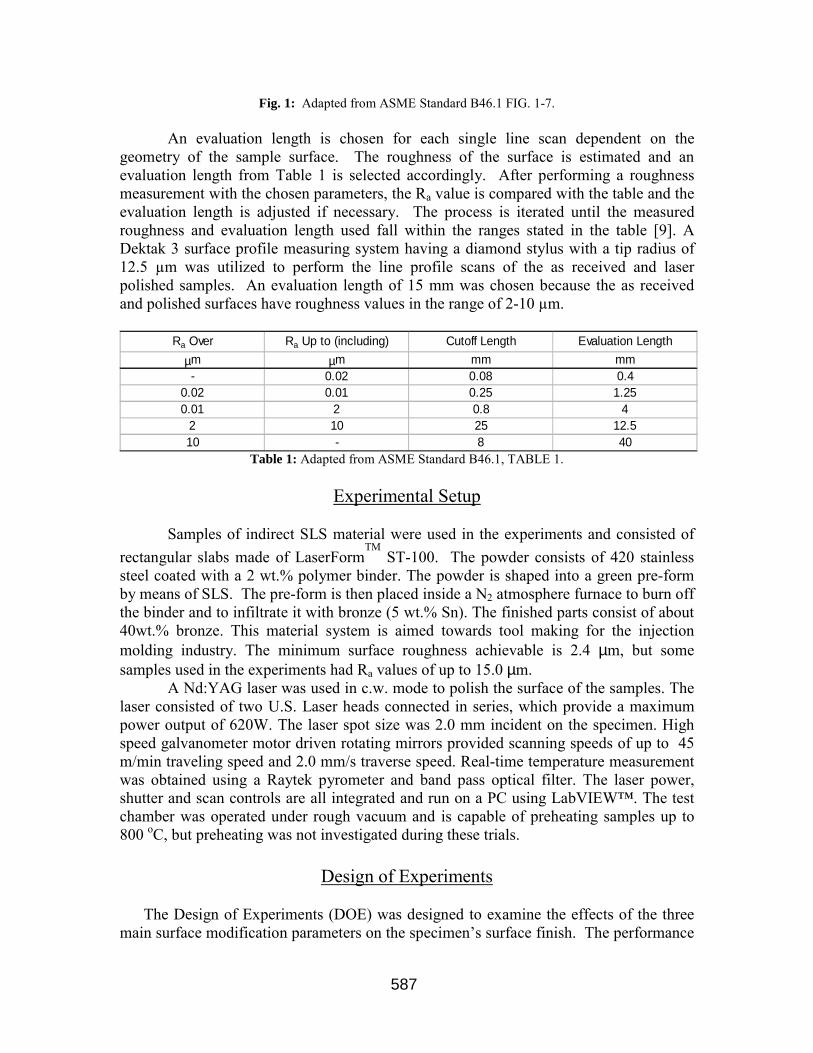
Fig. 1: Adapted from ASME Standard B46.1 FIG. 1-7. An evaluation length is chosen for each single line scan dependent on the geometry of the sample surface. The roughness of the surface is estimated and an evaluation length from Table 1 is selected accordingly. After performing a roughness measurement with the chosen parameters, the Ra value is compared with the table and the evaluation length is adjusted if necessary. The process is iterated until the measured roughness and evaluation length used fall within the ranges stated in the table [9]. A Dektak 3 surface profile measuring system having a diamond stylus with a tip radius of 12.5 µm was utilized to perform the line profile scans of the as received and laser polished samples. An evaluation length of 15 mm was chosen because the as received and polished surfaces have roughness values in the range of 2-10 µm.
Ra Over Ra Up to (including) Cutoff Length Evaluation Lengthµm µm mm mm- 0.02 0.08 0.4
0.02 0.01 0.25 1.250.01 2 0.8 4
2 10 25 12.510 - 8 40
Table 1: Adapted from ASME Standard B46.1, TABLE 1.
Experimental Setup
Samples of indirect SLS material were used in the experiments and consisted of rectangular slabs made of LaserForm
TM ST-100. The powder consists of 420 stainless
steel coated with a 2 wt.% polymer binder. The powder is shaped into a green pre-form by means of SLS. The pre-form is then placed inside a N2 atmosphere furnace to burn off the binder and to infiltrate it with bronze (5 wt.% Sn). The finished parts consist of about 40wt.% bronze. This material system is aimed towards tool making for the injection molding industry. The minimum surface roughness achievable is 2.4 µm, but some samples used in the experiments had Ra values of up to 15.0 µm.
A Nd:YAG laser was used in c.w. mode to polish the surface of the samples. The laser consisted of two U.S. Laser heads connected in series, which provide a maximum power output of 620W. The laser spot size was 2.0 mm incident on the specimen. High speed galvanometer motor driven rotating mirrors provided scanning speeds of up to 45 m/min traveling speed and 2.0 mm/s traverse speed. Real-time temperature measurement was obtained using a Raytek pyrometer and band pass optical filter. The laser power, shutter and scan controls are all integrated and run on a PC using LabVIEW�. The test chamber was operated under rough vacuum and is capable of preheating samples up to 800 oC, but preheating was not investigated during these trials.
Design of Experiments
The Design of Experiments (DOE) was designed to examine the effects of the three main surface modification parameters on the specimen�s surface finish. The performance
587
metric chosen was percent reduction in surface roughness. This metric allows the polished surface to be compared to the unpolished surface locally, therefore reducing the noise introduced by variation in roughness over the specimen. The three process parameters or design variables investigated were laser power, raster scan density, and scan velocity measured by total scan time. The design variables and levels used are listed below. Also listed are the control variables, which were kept constant throughout the experiments, and the significant noise variables. Attempts were made to minimize the noise, but the results show additional measures need to be taken to reduce the variation in absorptivity in subsequent experiments.
� Performance Metric � P: Percent reduction in roughness
� Design Variables and levels � Power (d1): 330, 470, 620[W] � Scan Density (d2): 5000, 7500 [lines/inch] � Scan Time (d3): 60, 120 [seconds]
� Noise Variables � Original surface condition � Absorptivity
� Control Variables � Scan length = 1 inch � Scan width = .25 inches � Material: Indirect SLS � Sample size: 2� x 1� � Time between runs: <20 min. � Atmosphere: rough vacuum (50~90 mTorr) � Ambient temp.: ~25 C
Table 2 shown below illustrates the DOE matrix used for the experiments. The
trials were randomized to eliminate any bias that could be introduced due to the order in which the experiments were conducted. The performance index was calculated using the equation Pi = (1-Ra,i/Ro)*100 where Ra,i/Ro is the polished roughness divided by the original roughness and it is the percent reduction from the original roughness. The numbers ��1�, �0�, �1� indicate the normalized value of the design variable used for that trial, which represent the low, middle, and high values respectively.
588
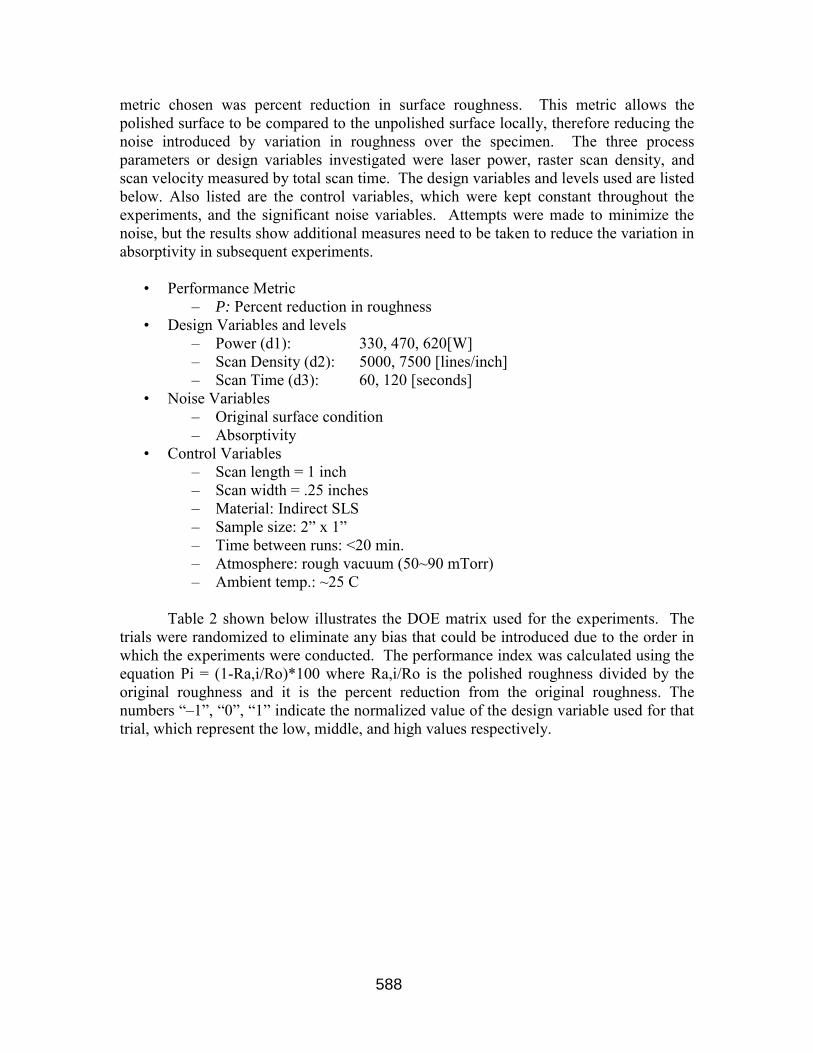
Trial d1 d2 d3 Pi1 Pi2 Pi,ave Original Replicate
1 -1 -1 -1 37.79 14.80 26.30 1 6
2 0 -1 -1 22.74 52.04 37.39 7 11
3 1 -1 -1 50.80 37.04 43.92 5 2
4 -1 1 -1 9.79 32.36 21.07 4 12
5 0 1 -1 16.94 43.97 30.45 10 3
6 1 1 -1 -14.29 55.00 20.36 9 9
7 -1 -1 1 -19.71 48.02 14.15 12 4
8 0 -1 1 16.09 -8.24 3.93 6 8
9 1 -1 1 -22.41 -4.17 -13.29 3 1
10 -1 1 1 54.77 16.07 35.42 8 7
11 0 1 1 5.13 11.13 8.13 11 5
12 1 1 1 -2.73 18.38 7.82 2 10 Table 2: Design of Experiments Matrix with One Replicate
Table 2 includes the measured values of reduction in roughness obtained from the experiment. Negative values indicate an increase in roughness from the original surface. An initial inspection of the data shows large variations between replicates indicating a high level of noise in the experiment. The results will be discussed in more detail below.
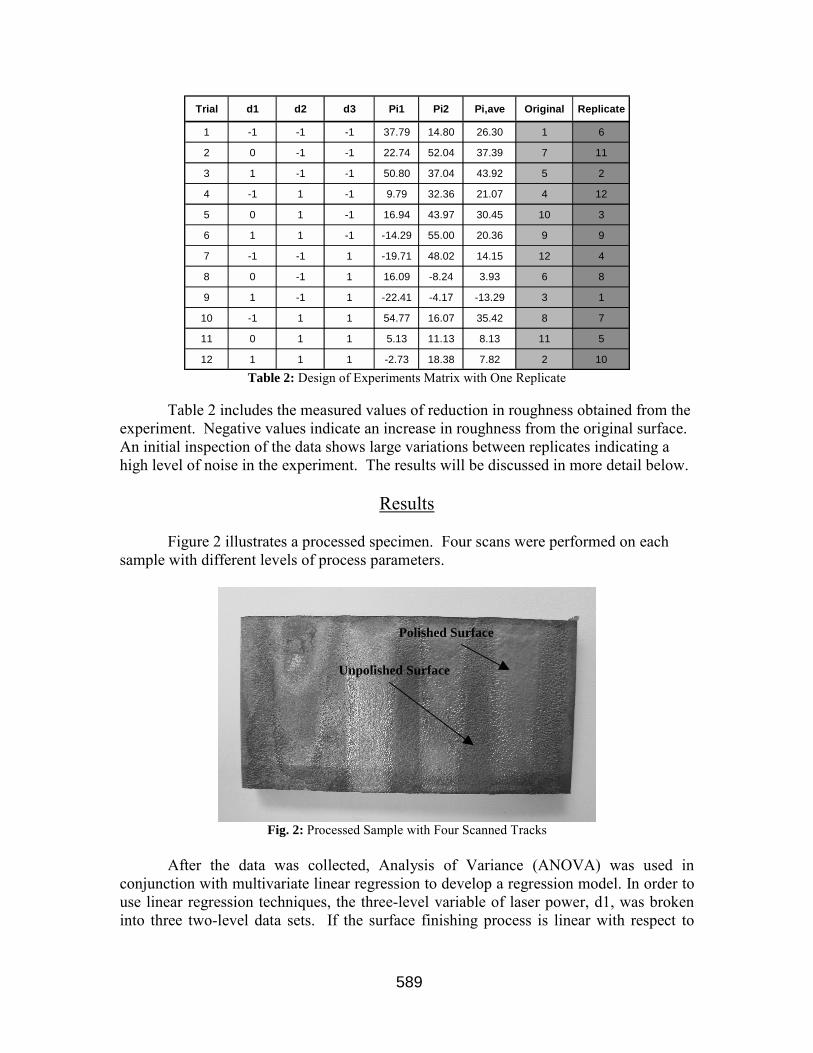
Results Figure 2 illustrates a processed specimen. Four scans were performed on each sample with different levels of process parameters.
Fig. 2: Processed Sample with Four Scanned Tracks
After the data was collected, Analysis of Variance (ANOVA) was used in
conjunction with multivariate linear regression to develop a regression model. In order to use linear regression techniques, the three-level variable of laser power, d1, was broken into three two-level data sets. If the surface finishing process is linear with respect to
Unpolished Surface
Polished Surface
589
laser power, the three sub models will have close to the same model coefficients for d1. The general form of the full three-factor linear regression model is:
0 1 1 2 2 3 3 12 1 2 13 1 3 23 2 3 123 1 2 3P d d d d d d d d d d d d errorµ β β β β β β β= + + + + + + + + (1)
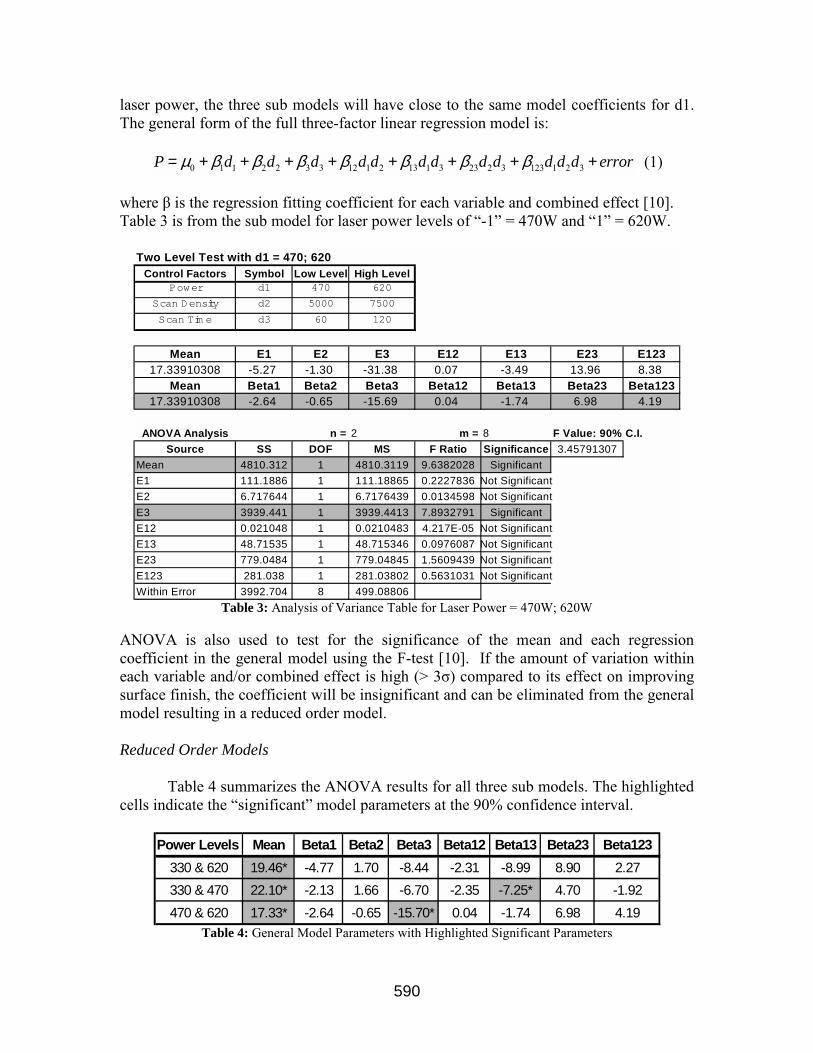
where β is the regression fitting coefficient for each variable and combined effect [10]. Table 3 is from the sub model for laser power levels of �-1� = 470W and �1� = 620W.
Two Level Test with d1 = 470; 620Control Factors Symbol Low Level High Level
Power d1 470 620
Scan Density d2 5000 7500
Scan Tim e d3 60 120
Mean E1 E2 E3 E12 E13 E23 E12317.33910308 -5.27 -1.30 -31.38 0.07 -3.49 13.96 8.38
Mean Beta1 Beta2 Beta3 Beta12 Beta13 Beta23 Beta12317.33910308 -2.64 -0.65 -15.69 0.04 -1.74 6.98 4.19
ANOVA Analysis n = 2 m = 8 F Value: 90% C.I.Source SS DOF MS F Ratio Significance 3.45791307
Mean 4810.312 1 4810.3119 9.6382028 SignificantE1 111.1886 1 111.18865 0.2227836 Not SignificantE2 6.717644 1 6.7176439 0.0134598 Not SignificantE3 3939.441 1 3939.4413 7.8932791 SignificantE12 0.021048 1 0.0210483 4.217E-05 Not SignificantE13 48.71535 1 48.715346 0.0976087 Not SignificantE23 779.0484 1 779.04845 1.5609439 Not SignificantE123 281.038 1 281.03802 0.5631031 Not SignificantWithin Error 3992.704 8 499.08806
Table 3: Analysis of Variance Table for Laser Power = 470W; 620W
ANOVA is also used to test for the significance of the mean and each regression coefficient in the general model using the F-test [10]. If the amount of variation within each variable and/or combined effect is high (> 3σ) compared to its effect on improving surface finish, the coefficient will be insignificant and can be eliminated from the general model resulting in a reduced order model. Reduced Order Models
Table 4 summarizes the ANOVA results for all three sub models. The highlighted cells indicate the �significant� model parameters at the 90% confidence interval.
Power Levels Mean Beta1 Beta2 Beta3 Beta12 Beta13 Beta23 Beta123
330 & 620 19.46* -4.77 1.70 -8.44 -2.31 -8.99 8.90 2.27330 & 470 22.10* -2.13 1.66 -6.70 -2.35 -7.25* 4.70 -1.92470 & 620 17.33* -2.64 -0.65 -15.70* 0.04 -1.74 6.98 4.19
Table 4: General Model Parameters with Highlighted Significant Parameters
590
Due to the high level of noise in the experiment, most of the model coefficients were determined to be insignificant by the ANOVA F-test. The only parameter significant in all three is the overall mean reduction in surface roughness. The reduced order models are shown below:
� Power levels of -1=330 W and +1 = 620
19.46P error= + (2a)
� Power levels of -1=330 W and +1 = 470
1 322.10 7.25P d d error= − + (2b)
� Power levels of -1=470 W and +1 = 620
317.33 15.70P d error= − + (2c)
In experiments with low noise, the error term could be considered insignificant and eliminated, but for this analysis the error term has a significant effect on the validity of the model. Future experiments will be designed to minimize the noise even further, resulting in a valid reduced order model without a significant error term.
Discussion
The result of the DOE produced several important insights into the surface polishing process. Some of the positive results were that all three sub models have a �significant� positive mean and on average, laser polishing reduces the roughness of the specimen by about 20%. This value is lower than we had expected, but reinforced the feasibility of laser surface finishing. Several trials resulted in above 50% reduction in roughness, leading to the conclusion that better control of the process can result in large improvements in roughness. Another benefit was sources of noise were more clearly identified and ideas were developed to better control them. Variation in absorptivity to the laser wavelength introduced the greatest noise. Pre-coating the specimens with graphite was one solution suggested to minimize surface absorptivity�s effect.
Some of the negative results were noise levels in the experiment were so large most trends were indistinguishable. The majority of model coefficients were found to be insignificant. As a result, the error terms in the reduced order models are very large. Because the errors are large, the model fails to accurately predict the reduction in surface roughness from the input of the design variables, and it cannot be determined whether or not the process is linear with respect to laser power. Reducing noise levels for future experiments will greatly improve the accuracy of the models. Absorptivity Variation and Surface Delamination
Variation in absorptivity was the single largest source of error in the experiment. The surface condition changes from scan-to-scan due to oxidation and other forms of surface contamination causing the absorptivity to change. In addition to changes within a specimen, significant variations occurred between specimens. Figure 3a illustrates the
591
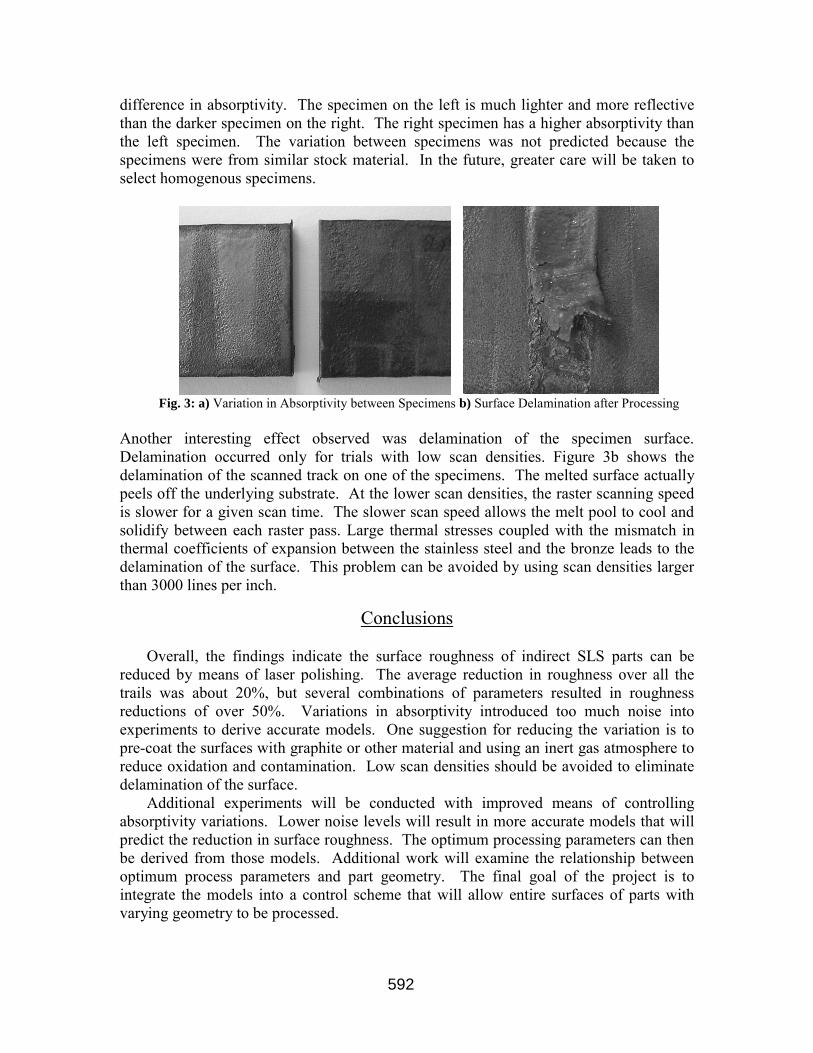
difference in absorptivity. The specimen on the left is much lighter and more reflective than the darker specimen on the right. The right specimen has a higher absorptivity than the left specimen. The variation between specimens was not predicted because the specimens were from similar stock material. In the future, greater care will be taken to select homogenous specimens.
Fig. 3: a) Variation in Absorptivity between Specimens b) Surface Delamination after Processing
Another interesting effect observed was delamination of the specimen surface. Delamination occurred only for trials with low scan densities. Figure 3b shows the delamination of the scanned track on one of the specimens. The melted surface actually peels off the underlying substrate. At the lower scan densities, the raster scanning speed is slower for a given scan time. The slower scan speed allows the melt pool to cool and solidify between each raster pass. Large thermal stresses coupled with the mismatch in thermal coefficients of expansion between the stainless steel and the bronze leads to the delamination of the surface. This problem can be avoided by using scan densities larger than 3000 lines per inch.
Conclusions
Overall, the findings indicate the surface roughness of indirect SLS parts can be reduced by means of laser polishing. The average reduction in roughness over all the trails was about 20%, but several combinations of parameters resulted in roughness reductions of over 50%. Variations in absorptivity introduced too much noise into experiments to derive accurate models. One suggestion for reducing the variation is to pre-coat the surfaces with graphite or other material and using an inert gas atmosphere to reduce oxidation and contamination. Low scan densities should be avoided to eliminate delamination of the surface.
Additional experiments will be conducted with improved means of controlling absorptivity variations. Lower noise levels will result in more accurate models that will predict the reduction in surface roughness. The optimum processing parameters can then be derived from those models. Additional work will examine the relationship between optimum process parameters and part geometry. The final goal of the project is to integrate the models into a control scheme that will allow entire surfaces of parts with varying geometry to be processed.
592
References
1. J.J.Beaman, J.W.Barlow, D.L.Bourell, R.H.Crawford (1997): Solid Freeform Fabrication: A New Direction in Manufacturing. Kluwer Academic.
2. M. Burns (1993): Automated Fabrication: Improving Productivity in Manufacturing. Prentice-Hall.
3. J.A. McDonald, C.J. Ryall and D.I. Wimpenny (2001): Rapid Prototyping Casebook, Professional Engineering Publishing.
4. I.Y. Tumer; D.C.Thompson, K.L.Wood and R.H. Crawford, �Characterization of Surface Fault Patterns with Application to a Layered Manufacturing Process�, Journal of Manufacturing Systems, Vol. 17, No.1, 1998.
5. W.M. Steen (1994): Laser Material Processing, 2nd edition, Springer Verlag. 6. H.Wang, D.L.Bourell and J.J.Beaman, �Laser Polishing of Silica Rods�, Proceedings
of the 9th Solid Freeform Fabrication Symposium, pp. 37-45, Austin, Texas, 1998. 7. J.A. Ramos, J. Murphy, K. Wood, D.L. Bourell and J.J. Beaman, �Surface
Roughness Enhancement of Indirect-SLS Metal Parts by Laser Surface Polishing�, Proceedings of the 12th Solid Freeform Fabrication Symposium, pp. 28-38, Austin, Texas, 2001.
8. D. M. Anthony (1986): Engineering Metrology, Pergamon Press. 9. �Surface Texture: Surface Roughness, Waviness, and Lay�, American Society of
Mechanical Engineers Standard B46.1, 1995. 10. R.E. Walpole (1998): Probability and Statistics for Engineers and Scientists, 6th
Edition, Prentice-Hall
Acknowledgments
The Laboratory of Freeform Fabrication gratefully acknowledges the support of the Office of Naval Research for funding the project �Surface Engineering for SFF Processes�, Grant Nº: N00014-00-1-0334.
593