Embed Size (px)
Citation preview
Methods for Model Selection & Checking Sensitivity Analysis for Bayes Factors A Radical Suggestion The Bottom Line Statistical Issues in Astronomical Searches: A Statistician’s Perspective David A. van Dyk*
Statistics Section, Imperial College London Progress on Statistical Issues in Searches, June 2012
*I thought it would be safest to use an assumed iden4ty uci
David A. van Dyk Statistical Issues in Searches
uci
Methods for Model Selection & Checking Sensitivity Analysis for Bayes Factors A Radical Suggestion The Bottom Line
Frequency Based Methods Bayesian Methods P-values Other Methods
The Model Selection & Checking Problems
1 2
3
Typically begin with baseline, default, or presumed model: Null Hypothesis: There is no source. Model Checking: Is the model consistent with the data? If not, characterize inconsistency, improve model, recheck.
May have another model that we suspect or hope is better: Alternative Hypothesis: There is a source. Model Selection / Comparison: Decide between or weigh the evidence for the two (or more?) models.
These are surprisingly subtle problems: No consensus exists on how to proceed. Disagreement between Bayesian and Frequentist methods.
David A. van Dyk Statistical Issues in Searches
uci
Methods for Model Selection & Checking Sensitivity Analysis for Bayes Factors A Radical Suggestion The Bottom Line
Frequency Based Methods Bayesian Methods P-values Other Methods
Neyman-Pearson Model Selection: H0 There is no source. HA There is a source.
Need test statistic, T, with known distribution under H0. Threshold T* is the smallest value such that Pr(T > T* |no source) ≤ α, If T > T* sufficient evidence to declare a detection.
Assessment? Pro: Frequency properties: Bounded Pr(false positive). Con: No characterization of the strength of evidence.
How to find T?? David A. van Dyk Statistical Issues in Searches
0.8
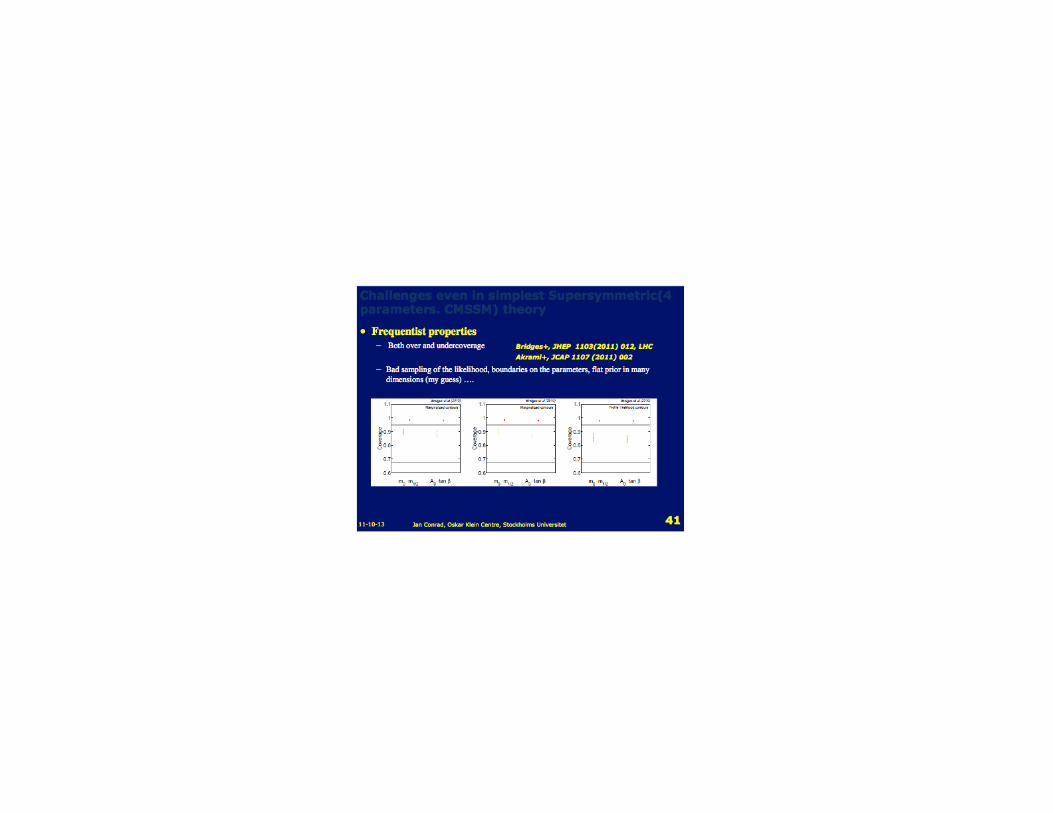
Cov
erag
e Pr
obab
ility
0
0.2
0.4
0.6
0.95
uci
Frequency Based Methods Bayesian Methods P-values Other Methods
Methods for Model Selection & Checking Sensitivity Analysis for Bayes Factors A Radical Suggestion The Bottom Line
What should be Reported?
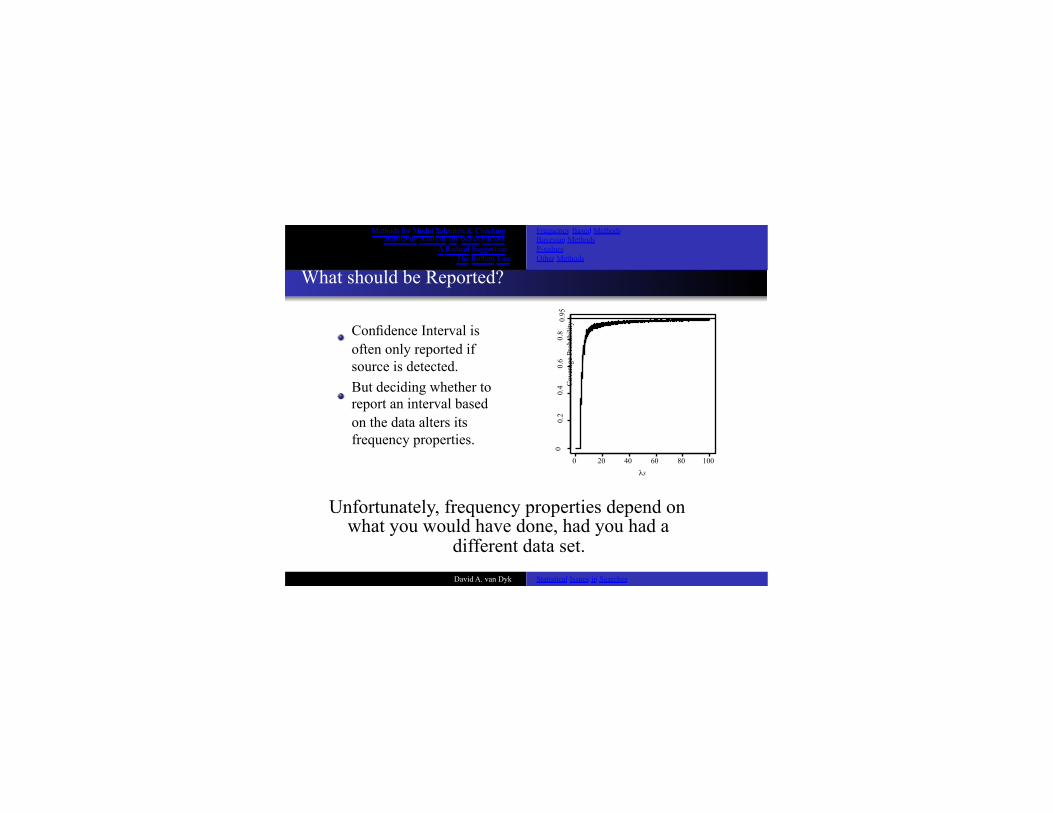
Confidence Interval is often only reported if source is detected. But deciding whether to report an interval based on the data alters its frequency properties.
0 20 40 60 80 100 λS Unfortunately, frequency properties depend on what you would have done, had you had a
different data set. David A. van Dyk Statistical Issues in Searches
uci
Methods for Model Selection & Checking Sensitivity Analysis for Bayes Factors A Radical Suggestion The Bottom Line
Frequency Based Methods Bayesian Methods P-values Other Methods
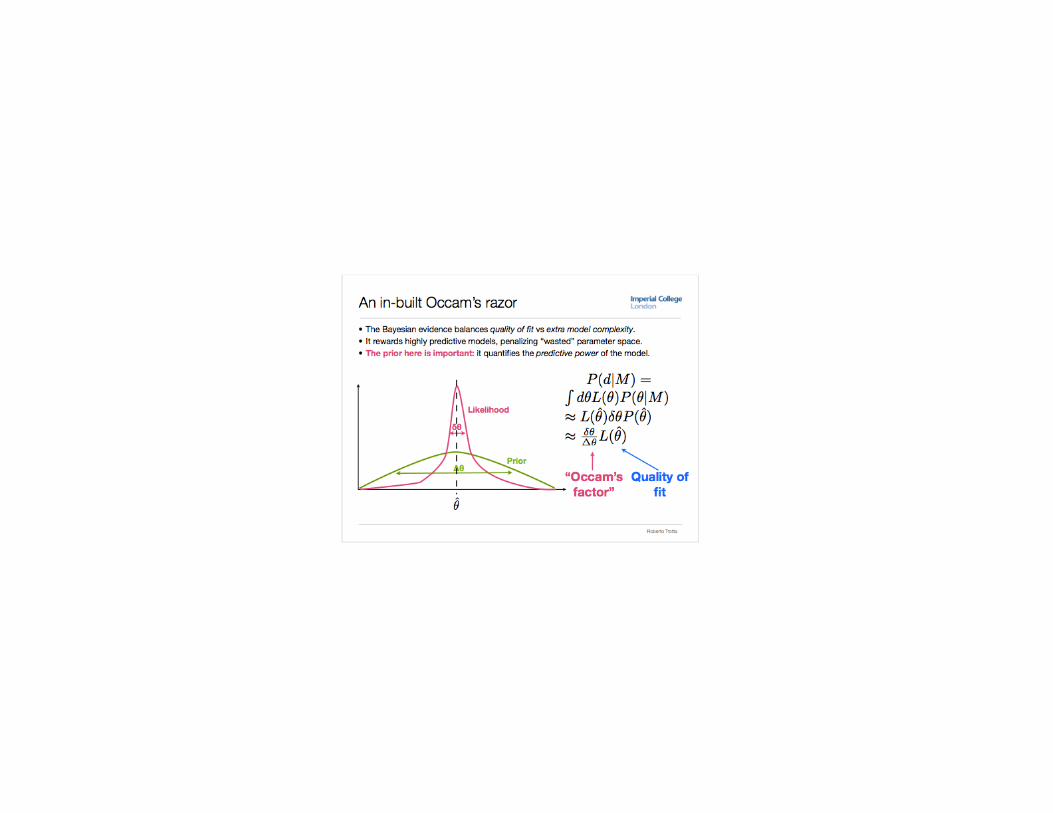
Bayes Factors and Posterior Probabilites Bayesian methods have no trouble with unknowns parameters The prior predictive distribution:
pi(x) = pi(x|θ)pi(θ)dθ
How likely is X under model i (likelihood + prior dist’n). Compare two models with the Bayes Factor:
p0(x) pA(x)
. Bayes Factor = or the posterior probability of H0:
Pr(H0|x) = p0(x)π0
p0(x)π0 + pA(x)(1 − π0) .
add: what if neither model is acceptable? David A. van Dyk Statistical Issues in Searches
!
"
0.4
0.0
0.1
0.2
prio
r pre
dict
ive
0.3
Methods for Model Selection & Checking Sensitivity Analysis for Bayes Factors A Radical Suggestion The Bottom Line
Frequency Based Methods Bayesian Methods P-values Other Methods
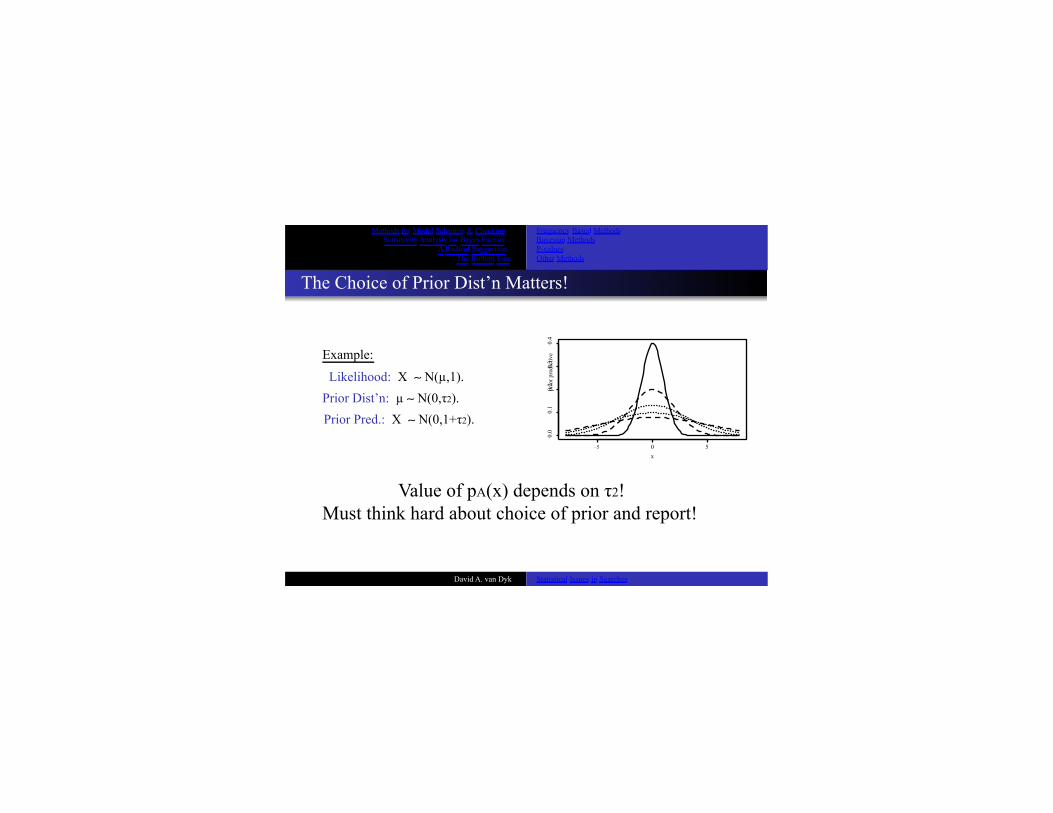
The Choice of Prior Dist’n Matters! Example:
Likelihood: X ∼ N(µ,1). Prior Dist’n: µ ∼ N(0,τ2). Prior Pred.: X ∼ N(0,1+τ2).
−5 0 5 x Value of pA(x) depends on τ2!
Must think hard about choice of prior and report! uci
David A. van Dyk Statistical Issues in Searches
3 lo
g(B
ayes
Fac
tor)
−3
−2
−1
0
1 2
uci
Methods for Model Selection & Checking Sensitivity Analysis for Bayes Factors A Radical Suggestion The Bottom Line
Frequency Based Methods Bayesian Methods P-values Other Methods
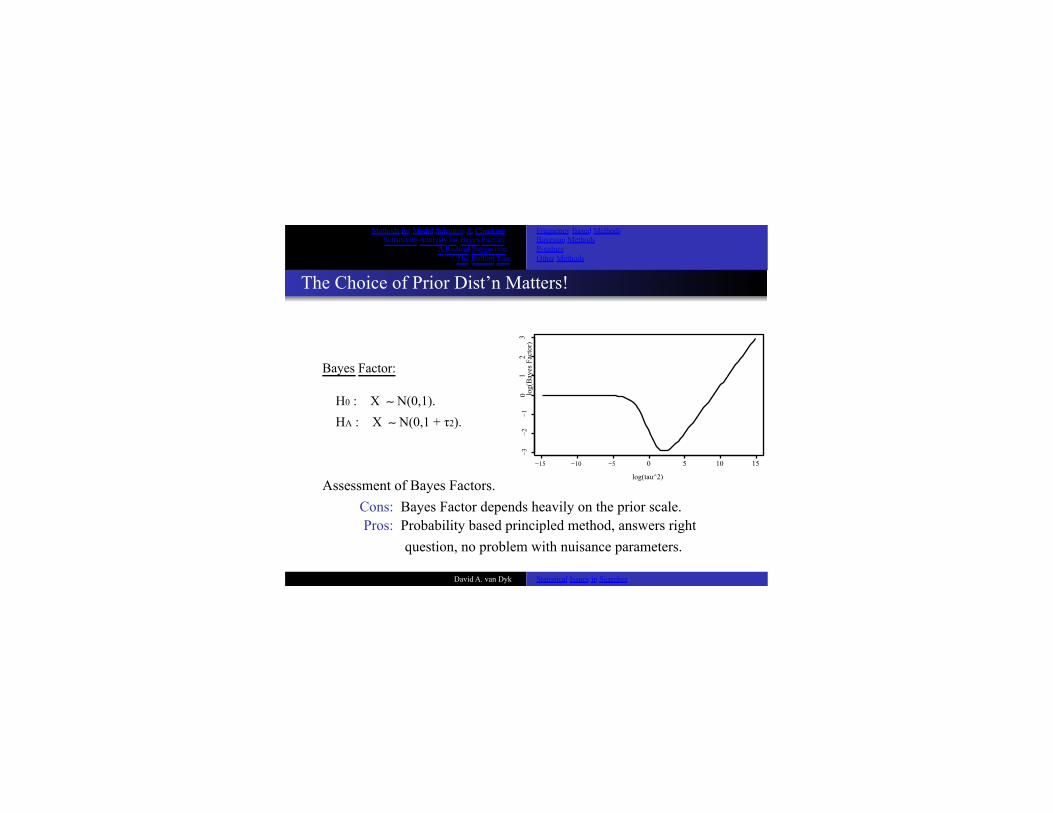
The Choice of Prior Dist’n Matters! Bayes Factor: H0 : X ∼ N(0,1). HA : X ∼ N(0,1 + τ2).
−15 −10 −5 0 5 10 15
log(tau^2) Assessment of Bayes Factors.
Cons: Bayes Factor depends heavily on the prior scale. Pros: Probability based principled method, answers right
question, no problem with nuisance parameters.
David A. van Dyk Statistical Issues in Searches

Methods for Model Selection & Checking Sensitivity Analysis for Bayes Factors A Radical Suggestion The Bottom Line
Frequency Based Methods Bayesian Methods P-values Other Methods
How to Choose the Prior Dist’n. Unlike with parameter inference, prior must be proper. Prior Predictive Distribution is improper with improper prior! There is no default prior distribution. Possible Solutions
1
2 Minimize Bayes Factor over a class of priors (see below). Use a subjective prior distribution.
Subjective prior distributions are especially illusive: What are likely values a parameters in a possible model? Problem is even more complicated when: Parameter space is large. H0 and HA have different (non-nested) parameters. uci
David A. van Dyk Statistical Issues in Searches
uci
Methods for Model Selection & Checking Sensitivity Analysis for Bayes Factors A Radical Suggestion The Bottom Line
Frequency Based Methods Bayesian Methods P-values Other Methods
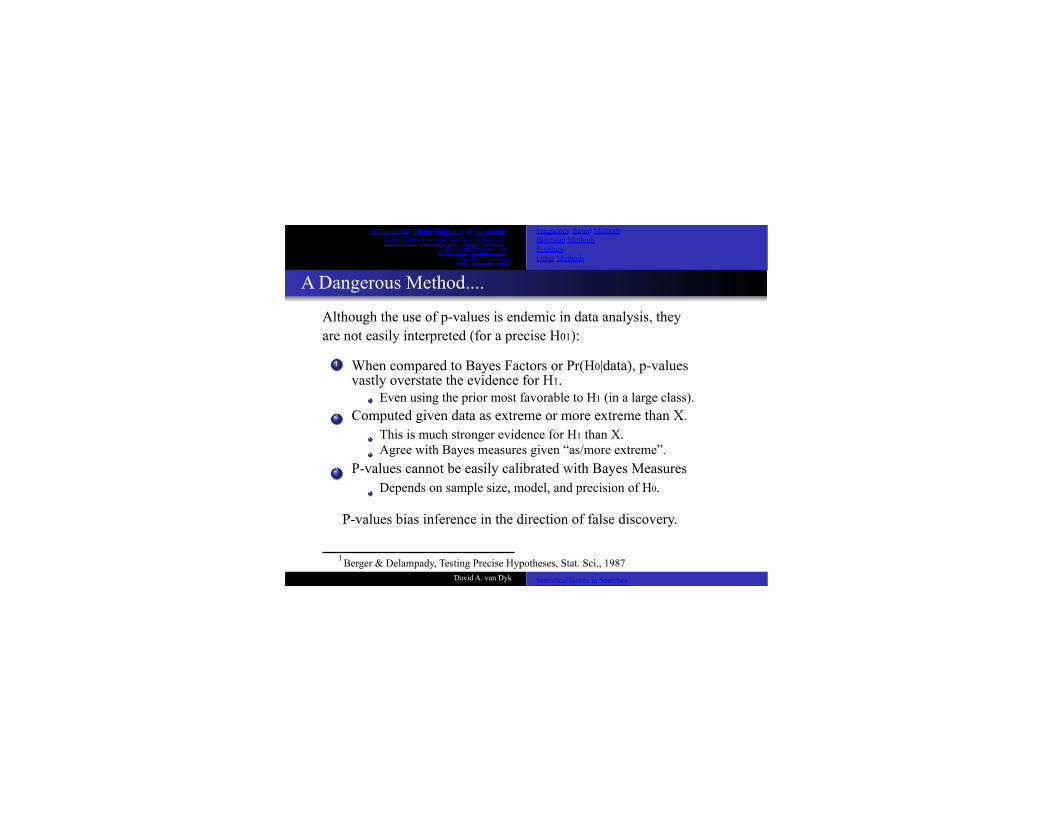
A Dangerous Method.... Although the use of p-values is endemic in data analysis, they are not easily interpreted (for a precise H01):
1 2 3
When compared to Bayes Factors or Pr(H0|data), p-values vastly overstate the evidence for H1. Even using the prior most favorable to H1 (in a large class). Computed given data as extreme or more extreme than X. This is much stronger evidence for H1 than X. Agree with Bayes measures given “as/more extreme”. P-values cannot be easily calibrated with Bayes Measures Depends on sample size, model, and precision of H0.
P-values bias inference in the direction of false discovery.
1 Berger & Delampady, Testing Precise Hypotheses, Stat. Sci., 1987 David A. van Dyk Statistical Issues in Searches

uci
Methods for Model Selection & Checking Sensitivity Analysis for Bayes Factors A Radical Suggestion The Bottom Line
Frequency Based Methods Bayesian Methods P-values Other Methods
Not a Frequentist Method... “... a rough rule known to astronomers, i.e., that differ- ences up to twice standard error usually disappear when more or better observations become available, and that thoes of three or more times usually persist.” 2 Suppose over time, H0 is true about half the time. Looking back over results with 1.96 < p-value < 2.00, the astronomer might find H0 to be true 30% of the time. The absolute minimum limiting proportion is 22%. Compare with “5% significance” associated with p-value. Why are p-values so popular?
2 Jeffrey (1980) in Berger & Delampady (1987) David A. van Dyk Statistical Issues in Searches
Methods for Model Selection & Checking Sensitivity Analysis for Bayes Factors A Radical Suggestion The Bottom Line
Frequency Based Methods Bayesian Methods P-values Other Methods
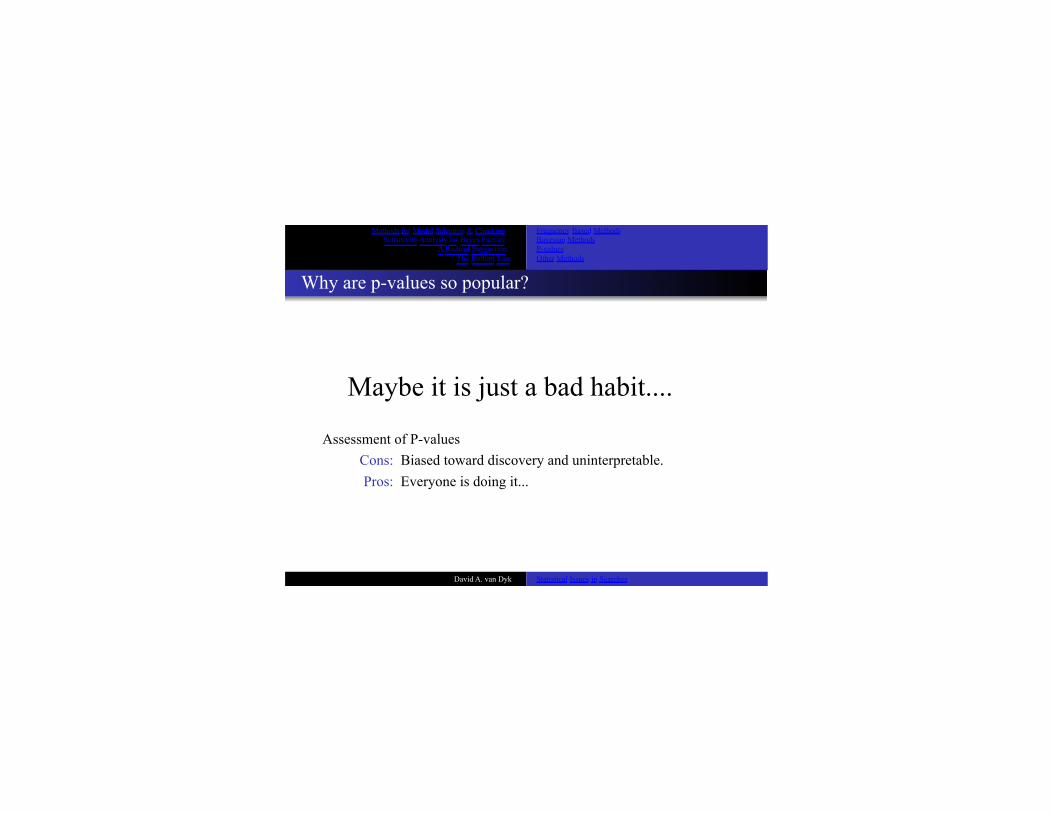
Why are p-values so popular? Maybe it is just a bad habit....
Assessment of P-values Cons: Biased toward discovery and uninterpretable. Pros: Everyone is doing it... uci
David A. van Dyk Statistical Issues in Searches
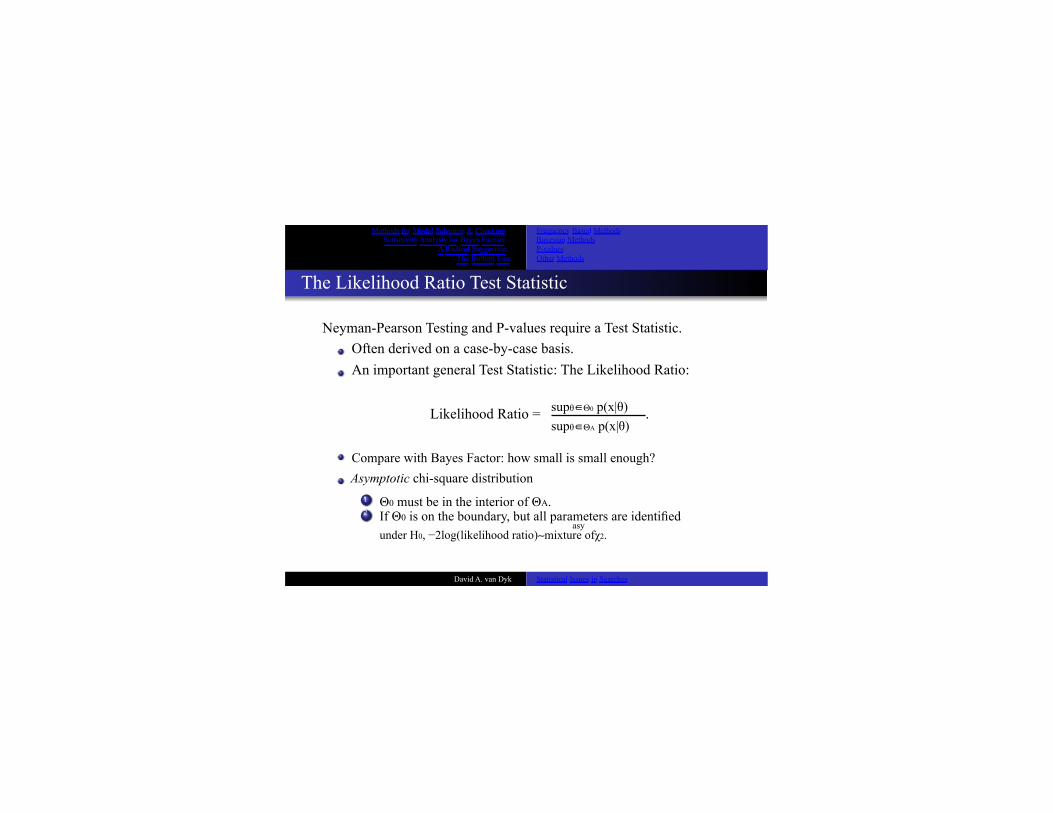
under H0, −2log(likelihood ratio)∼mixture ofχ2. uci
Methods for Model Selection & Checking Sensitivity Analysis for Bayes Factors A Radical Suggestion The Bottom Line
Frequency Based Methods Bayesian Methods P-values Other Methods
The Likelihood Ratio Test Statistic Neyman-Pearson Testing and P-values require a Test Statistic. Often derived on a case-by-case basis. An important general Test Statistic: The Likelihood Ratio:
Likelihood Ratio = supθ∈Θ0 p(x|θ) supθ∈ΘA p(x|θ)
.
Compare with Bayes Factor: how small is small enough? 1
2 Θ0 must be in the interior of ΘA. If Θ0 is on the boundary, but all parameters are identified asy
David A. van Dyk Statistical Issues in Searches
Asymptotic chi-square distribution
An alternative – the Rao score test Based on Only requires parameter estimates under the null, which can be a big computational saving Asymptotically chi-square (even in some conditions for which this is not true for LRT) Locally most powerful See also the closely related Neyman C-alpha tests Ref: Lehman and Romano, Testing Statistical Hypotheses
!! /!(!0)
Methods for Model Selection & Checking Sensitivity Analysis for Bayes Factors A Radical Suggestion The Bottom Line
Frequency Based Methods Bayesian Methods P-values Other Methods
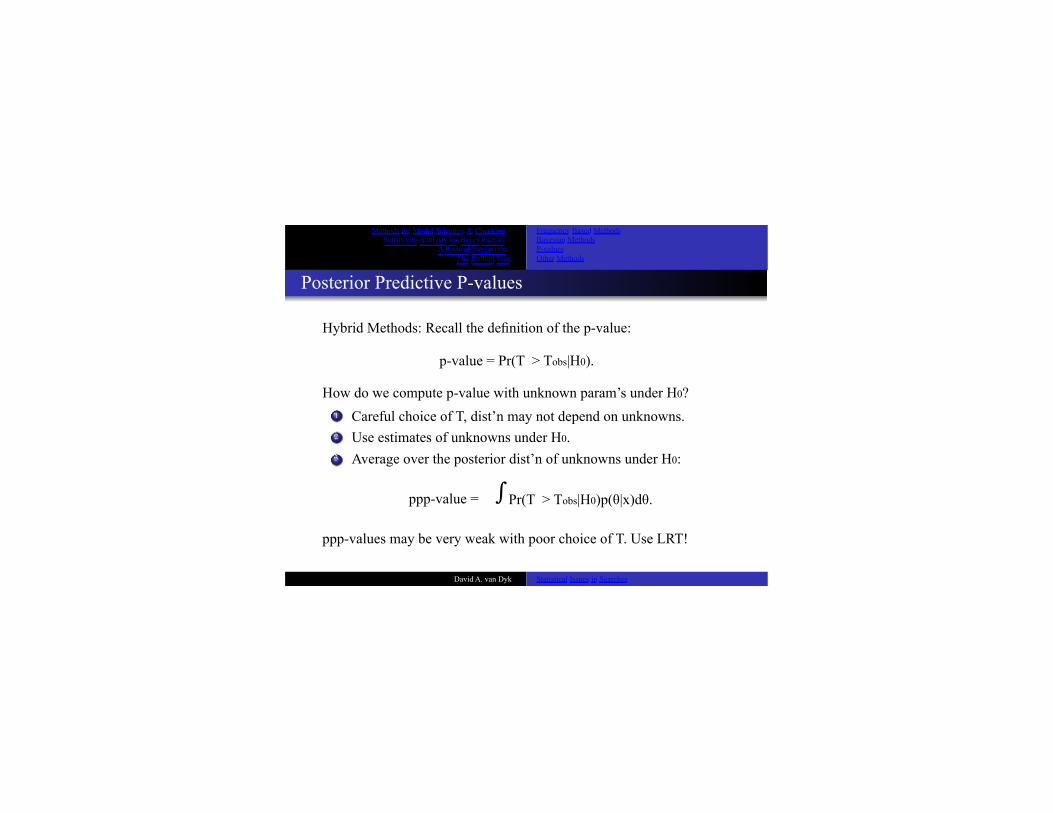
Posterior Predictive P-values Hybrid Methods: Recall the definition of the p-value: p-value = Pr(T > Tobs|H0). How do we compute p-value with unknown param’s under H0?
1 2 3
Careful choice of T, dist’n may not depend on unknowns. Use estimates of unknowns under H0. Average over the posterior dist’n of unknowns under H0:
ppp-value = Pr(T > Tobs|H0)p(θ|x)dθ.
ppp-values may be very weak with poor choice of T. Use LRT! uci
David A. van Dyk Statistical Issues in Searches !
"

uci
Methods for Model Selection & Checking Sensitivity Analysis for Bayes Factors A Radical Suggestion The Bottom Line
Frequency Based Methods Bayesian Methods P-values Other Methods
Other Methods There are Many other methods....
1 2 3 4
Bayesian Model Averaging Pros: Bayesian, but less dependent on the choice of prior. Cons: More appropriate for prediction than model selection.
Decision Theory Pros: Derives rules tailored to specific scientific goals. Cons: Sensitive to choice of Loss Function and Prior.
Information Criteria (e.g., AIC, BIC, etc.) Pros: Simple to compute with an intuitive form! Cons: Ad hoc—with questionable statistical properties.
Conditional Error Probabilities Pros: Bayesian methods with frequency interpretation! Cons: Frequency conditional prob’s make eyes glaze over.
David A. van Dyk Statistical Issues in Searches

uci
Methods for Model Selection & Checking Sensitivity Analysis for Bayes Factors A Radical Suggestion The Bottom Line
Frequency Based Methods Bayesian Methods P-values Other Methods
Other Methods There are Many other methods....
5 “Default Bayes Factors” Pros: Derive a proper prior dist’n based on training sample. Cons: Result depends on the choice of training sample.
David A. van Dyk Statistical Issues in Searches
Frequency Based Methods Bayesian Methods P-values Other Methods
Methods for Model Selection & Checking Sensitivity Analysis for Bayes Factors A Radical Suggestion The Bottom Line
Decision Theory
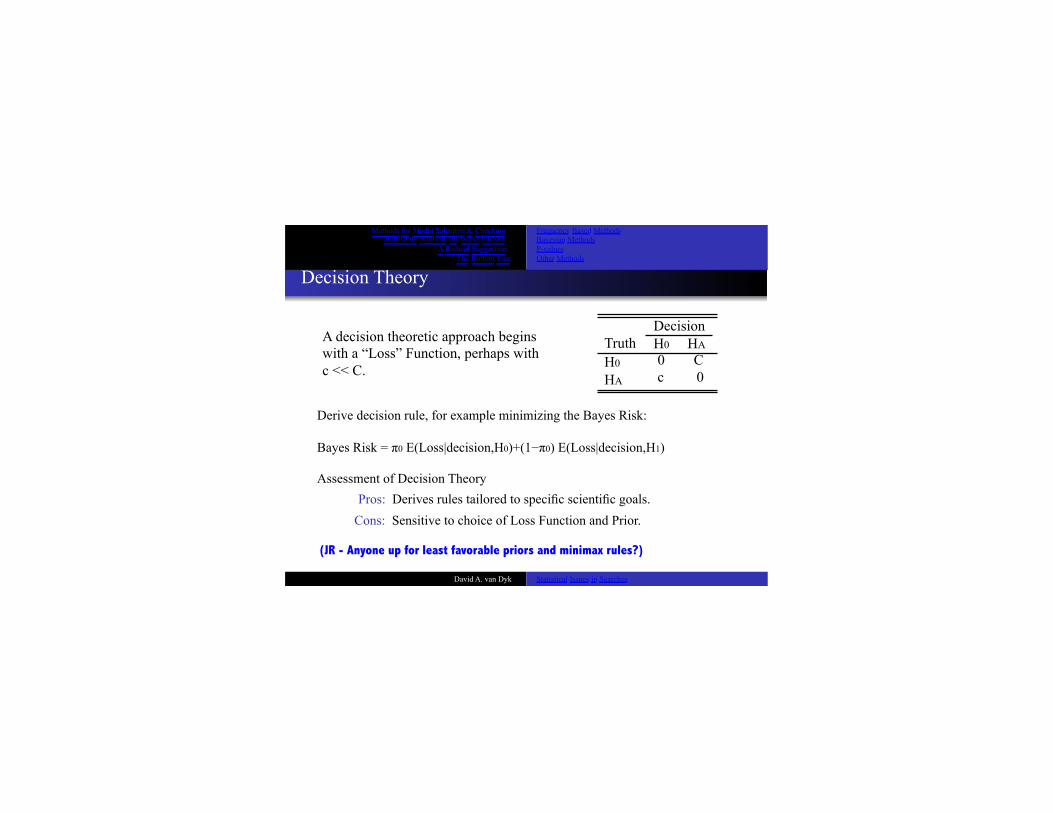
A decision theoretic approach begins with a “Loss” Function, perhaps with c << C.
Truth H0
HA
Decision H0 HA 0 C c 0
Derive decision rule, for example minimizing the Bayes Risk: Bayes Risk = π0 E(Loss|decision,H0)+(1−π0) E(Loss|decision,H1) Assessment of Decision Theory
Pros: Derives rules tailored to specific scientific goals. Cons: Sensitive to choice of Loss Function and Prior. uci
David A. van Dyk Statistical Issues in Searches
(JR - Anyone up for least favorable priors and minimax rules?)
uci
Methods for Model Selection & Checking Sensitivity Analysis for Bayes Factors A Radical Suggestion The Bottom Line
Interval Estimates Project 1 Project 2
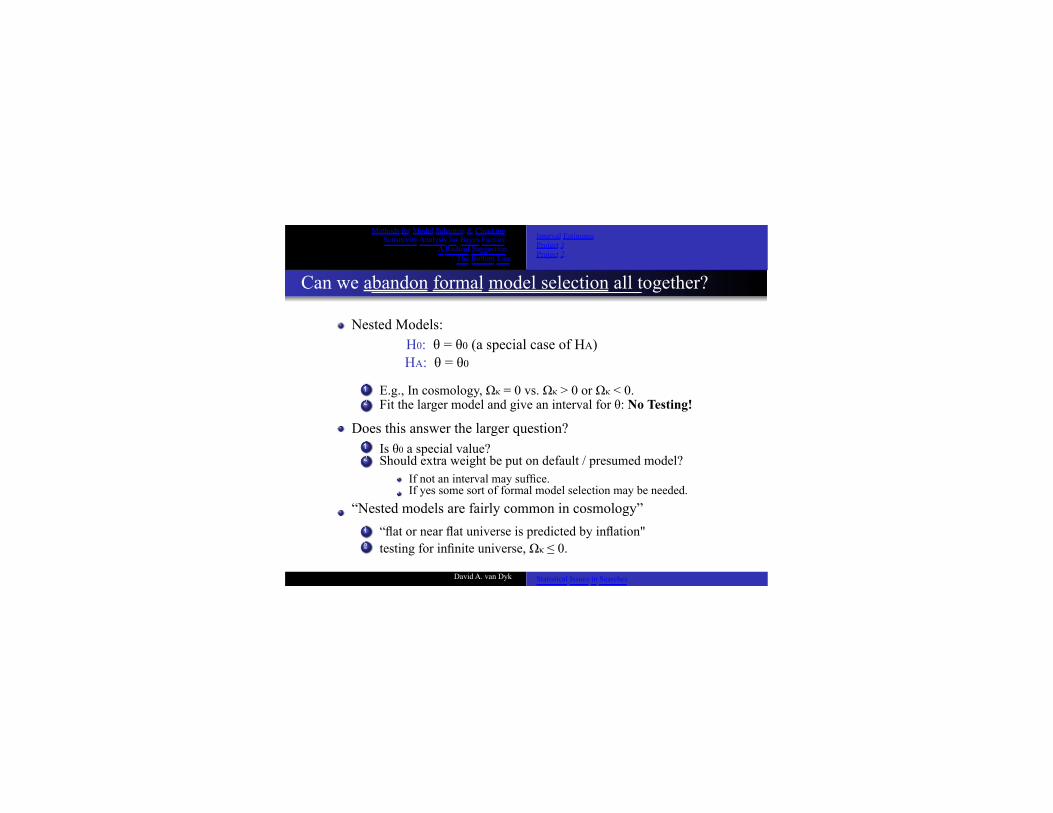
Can we abandon formal model selection all together? Nested Models: H0: θ = θ0 (a special case of HA) HA: θ = θ0
1
2 E.g., In cosmology, Ωκ = 0 vs. Ωκ > 0 or Ωκ < 0. Fit the larger model and give an interval for θ: No Testing!
Does this answer the larger question? 1 2
Is θ0 a special value? Should extra weight be put on default / presumed model? If not an interval may suffice. If yes some sort of formal model selection may be needed.
“Nested models are fairly common in cosmology” 1 “flat or near flat universe is predicted by inflation" 2 testing for infinite universe, Ωκ ≤ 0. David A. van Dyk Statistical Issues in Searches
Methods for Model Selection & Checking Sensitivity Analysis for Bayes Factors A Radical Suggestion The Bottom Line Model Selection & Model Checking are not for the faint of heart... Approach Model Selection with humility. If possible it should simply be avoided... This seems possible—at least in some cases—in cosmology. uci
David A. van Dyk Statistical Issues in Searches
uci
Methods for Model Selection & Checking Sensitivity Analysis for Bayes Factors A Radical Suggestion The Bottom Line
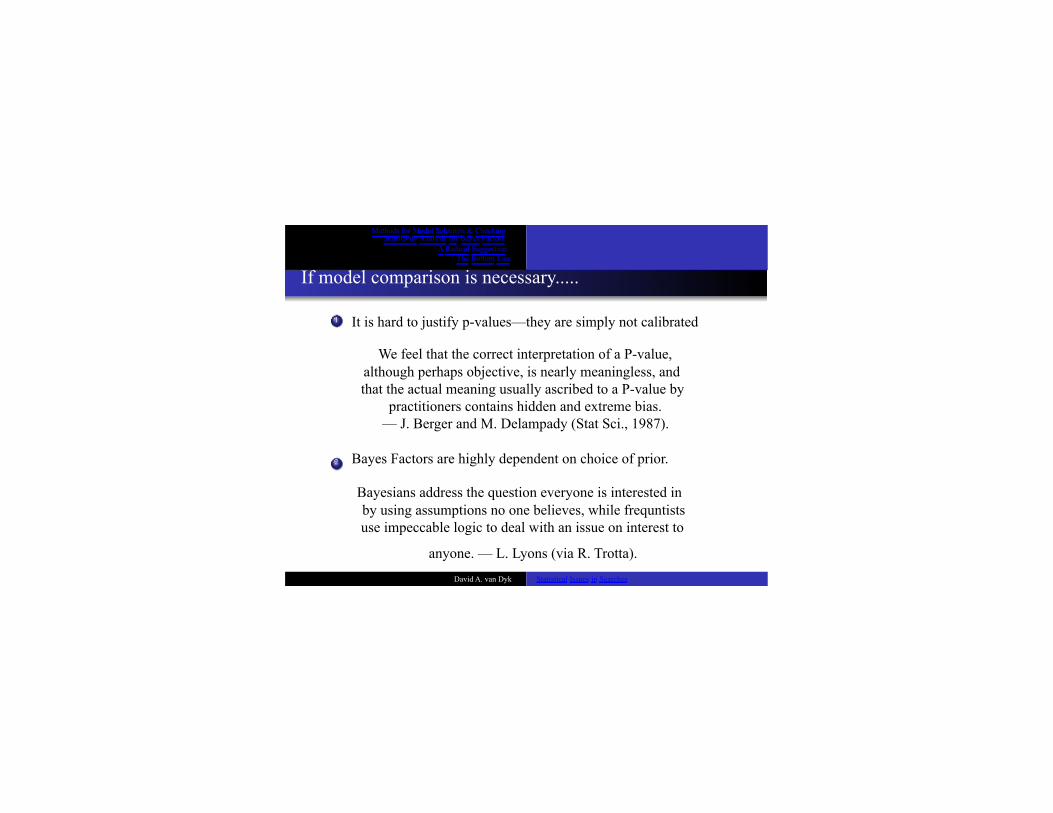
If model comparison is necessary.....
1 2
It is hard to justify p-values—they are simply not calibrated We feel that the correct interpretation of a P-value, although perhaps objective, is nearly meaningless, and that the actual meaning usually ascribed to a P-value by practitioners contains hidden and extreme bias. — J. Berger and M. Delampady (Stat Sci., 1987). Bayes Factors are highly dependent on choice of prior. Bayesians address the question everyone is interested in by using assumptions no one believes, while frequntists use impeccable logic to deal with an issue on interest to
anyone. — L. Lyons (via R. Trotta). David A. van Dyk Statistical Issues in Searches
D.A. Freedman. “Some issues in the founda4on of sta4s4cs.” Founda4ons of Science, vol. 1 (1995) pp.19–83. My own experience suggests that neither decision‐makers nor their sta4s4cians do in fact have prior probabili4es. A large part of Bayesian sta4s4cs is about what you would do if you had a prior.For the rest, sta4s4cians make up priors that are mathema4cally convenient or aOrac4ve. Once used, priors become familiar; therefore, they come to be accepted as "natural" and are liable to be used again; such priors may eventually generate their own technical literature. Similarly, a large part of objec4vist sta4s4cs is about what you do if you had a model; and all of us spend enormous amounts of energy finding out what would happen if the data kept pouring in. I wish we could learn to look at the data more directly, without the fic4onal models and priors.
uci
Methods for Model Selection & Checking Sensitivity Analysis for Bayes Factors A Radical Suggestion The Bottom Line
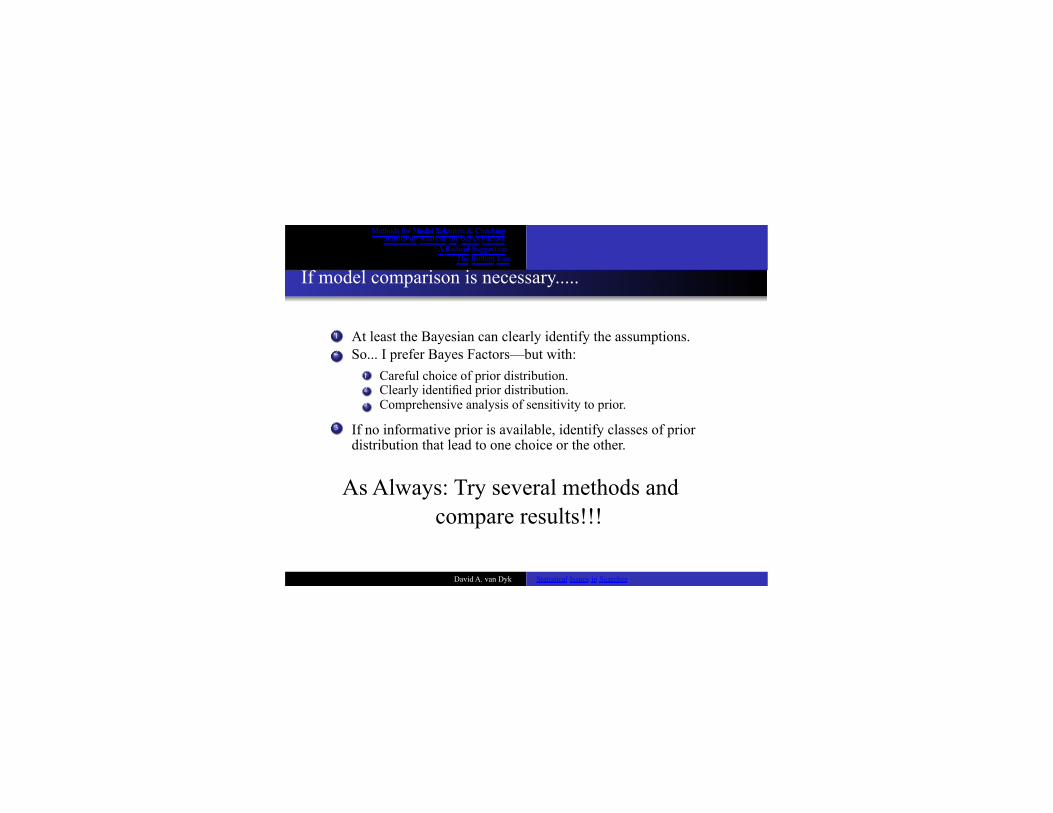
If model comparison is necessary.....
1
2
At least the Bayesian can clearly identify the assumptions. So... I prefer Bayes Factors—but with:
1
2
3
Careful choice of prior distribution. Clearly identified prior distribution. Comprehensive analysis of sensitivity to prior.
3 If no informative prior is available, identify classes of prior distribution that lead to one choice or the other. As Always: Try several methods and compare results!!!
David A. van Dyk Statistical Issues in Searches
My view of statistical models Statistics is largely a “what if” game. For example:
• What if the observations were realizations of random variables from some probability distribution F?
• What if those random variables were independent?
• What if the probability distribution depended on parameters of interest in some specific way?
• What would I do if I had to make a decision?
• What would be the behavior of parameter estimates if another draw were made from that probability distribution?
• What if I represented my state of knowledge as a probability distribution? For example, this one - G. How then would my state of knowledge change if I observed a realization from F?
Utility of these constructs depends on scientific context

From whence come these hypothetical iid random variables?
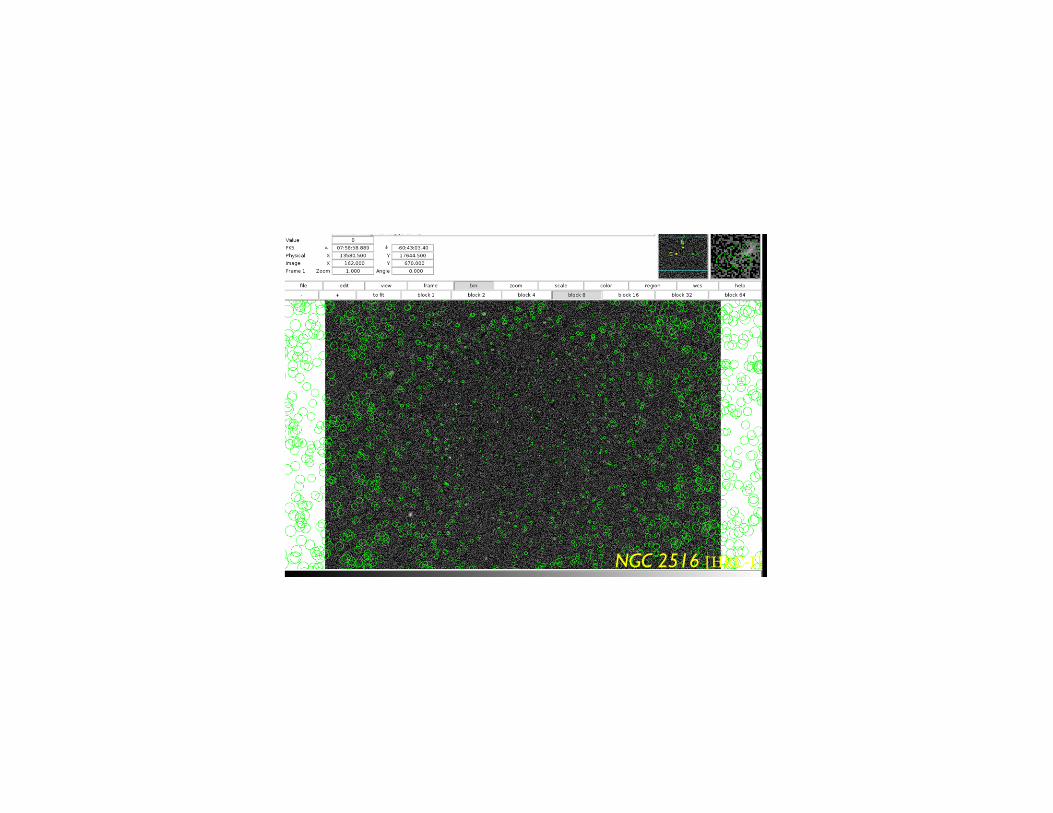
NGC 2516 [HRC-I]
In defense of p-values It’s not so hard to understand what a p-value is: P(T > t |H), or for Neyman and Pearson the smallest significance level at which the test based on T would reject (Fisher had no use for the NP paradigm)
It’s not so hard to understand what a p-value isn’t: P(H|T=t). For those who are upset by this: why are you so hung up -- get over it! Would it be such a disaster if it were impossible to find P(H|T=t)*?
Some virtues of the humble p-value:
• It is calculated without reference to the alternative, which may be impossible to formulate in a fully specified manner. Hence, for example, the utility of permutation tests (the lady tasting tea, rank tests).
• If H holds, it is uniformly distributed
*Is this aim really so important? (Juries do reach verdicts).
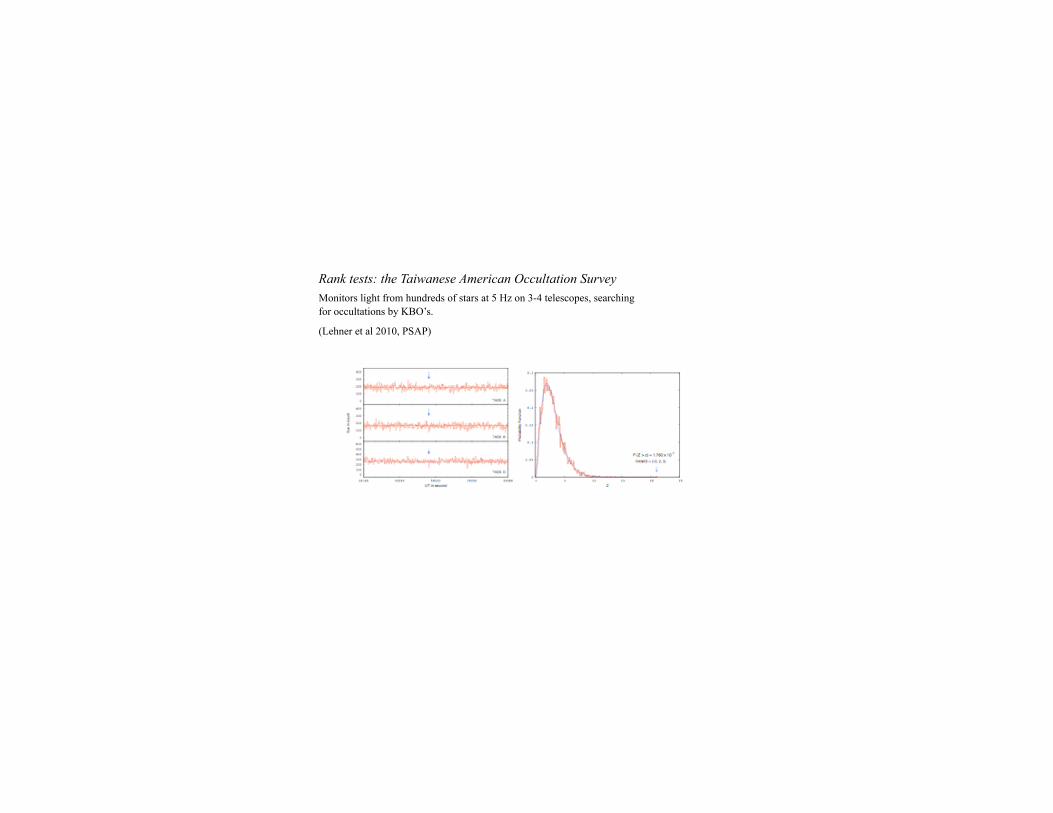
Rank tests: the Taiwanese American Occultation Survey Monitors light from hundreds of stars at 5 Hz on 3-4 telescopes, searching for occultations by KBO’s.
(Lehner et al 2010, PSAP)
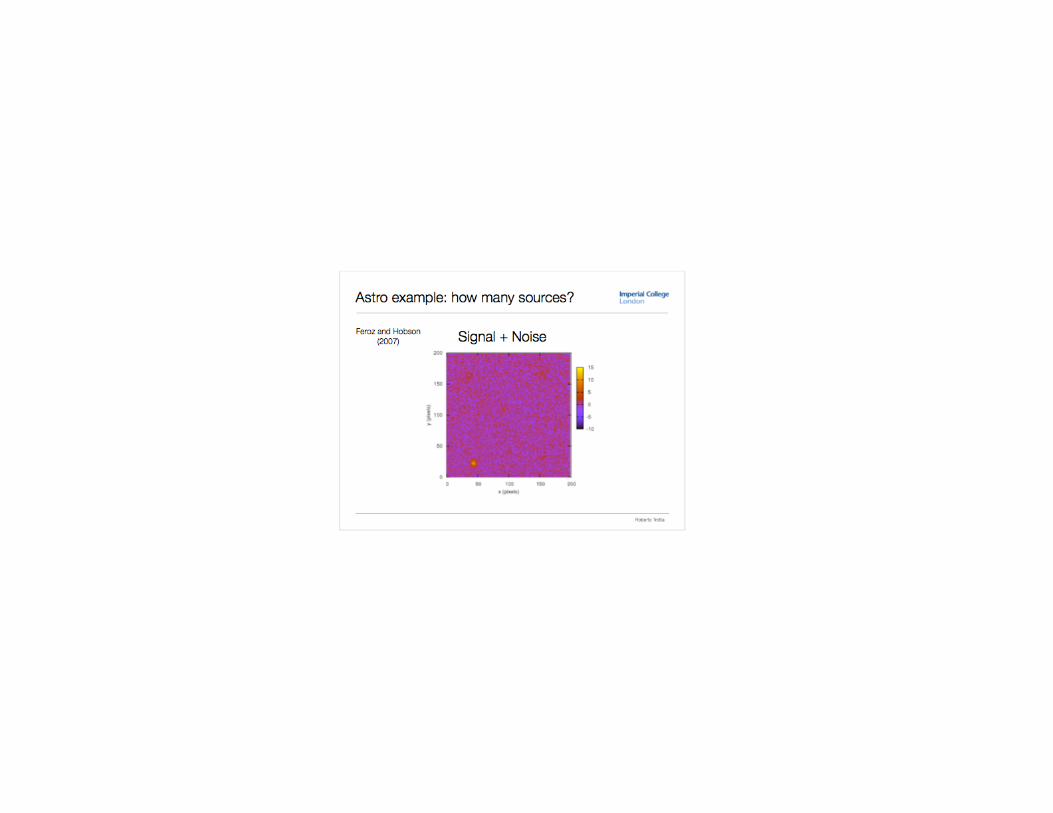
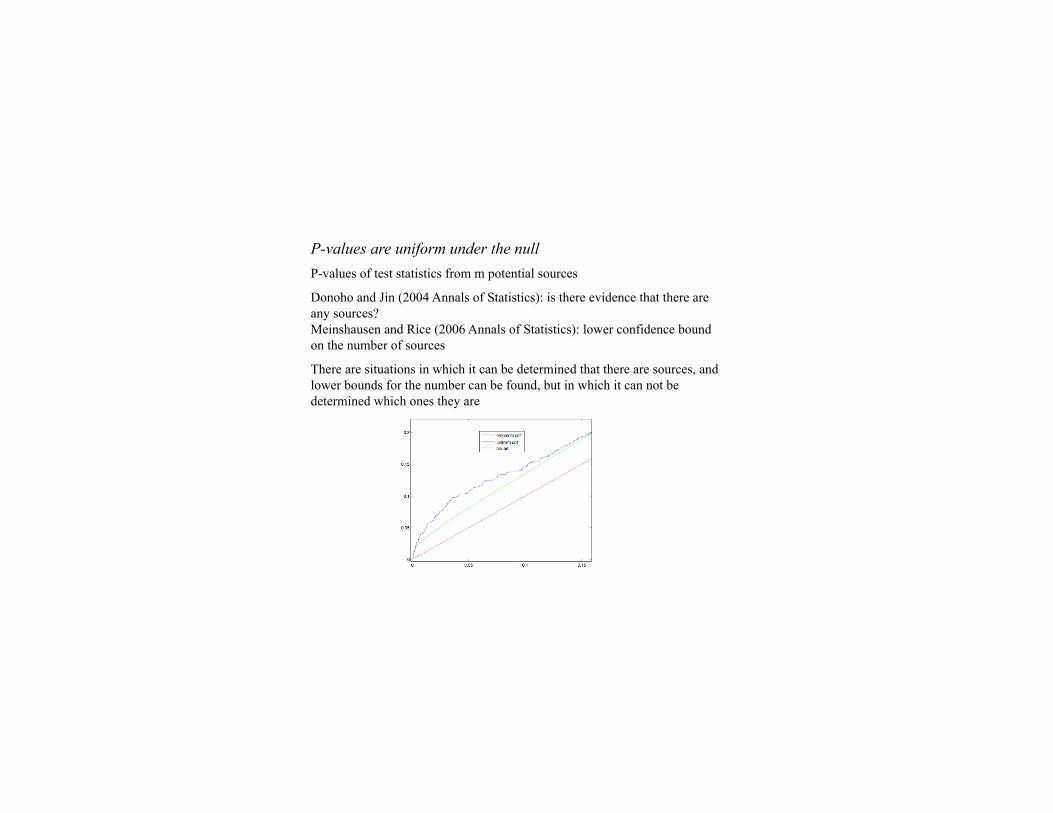
P-values are uniform under the null P-values of test statistics from m potential sources
Donoho and Jin (2004 Annals of Statistics): is there evidence that there are any sources? Meinshausen and Rice (2006 Annals of Statistics): lower confidence bound on the number of sources
There are situations in which it can be determined that there are sources, and lower bounds for the number can be found, but in which it can not be determined which ones they are
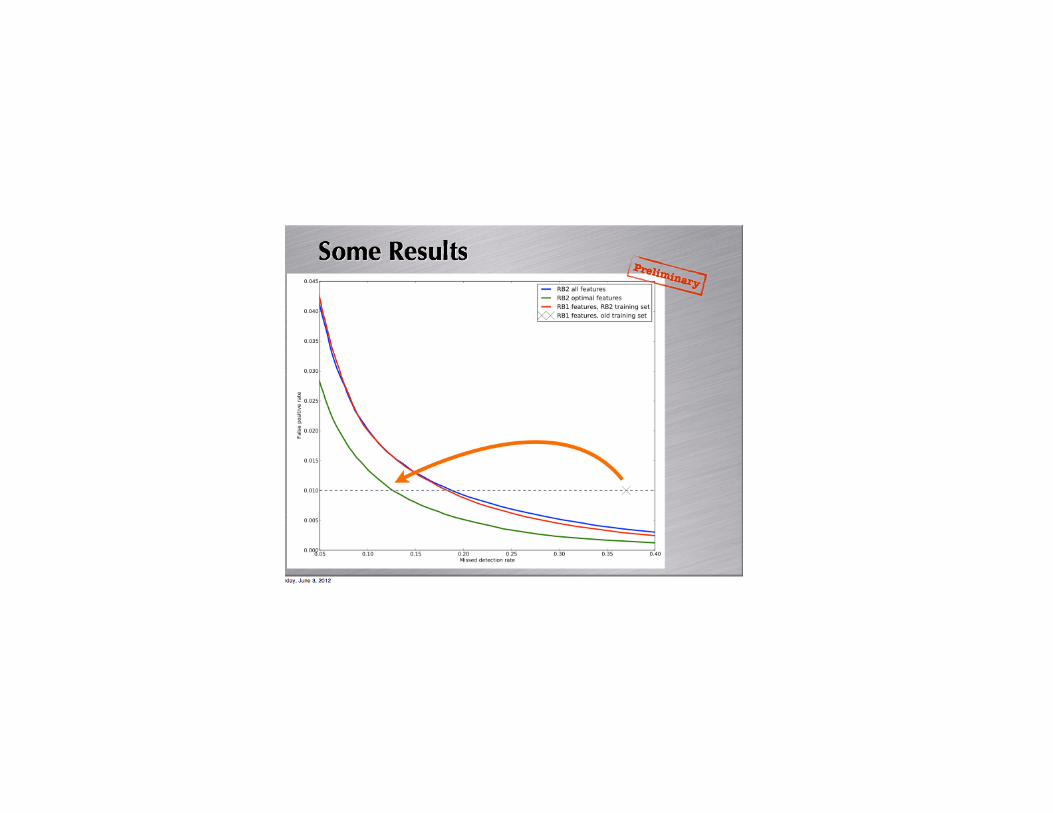
Another paradigm Models are not represented by analytic forms, but by complex algorithms (eg random forests, support vector machines), and are evaluated not by likelihood-based calculations, but by predictive accuracy, as measured by cross-validation, (Breiman, Statistical Science, 2001)
Djorgovski (clustering classification), Morgan Trotta: In fundamental physics, models and parameters (and their priors) are supposed to represent (albeit in an idealized way) the real world, i.e., they are not simply useful representation of the data (as they are in other statistical problems).
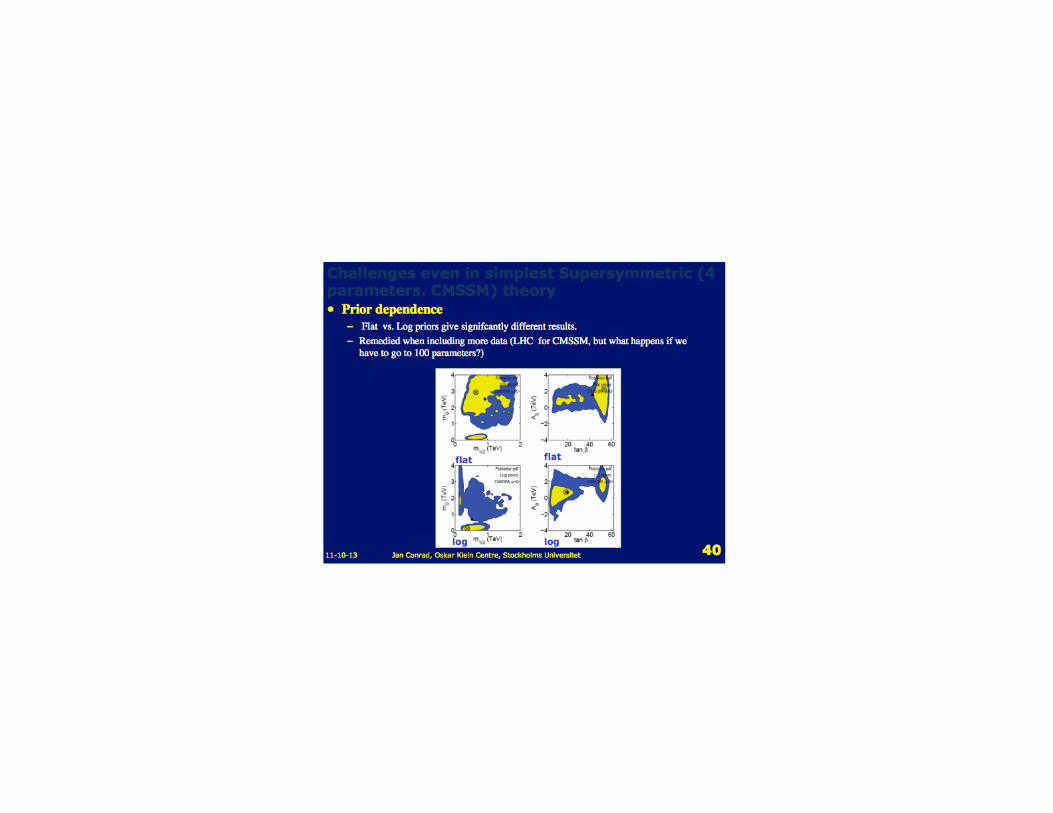
But suppose the models have hundreds of parameters (Conrad). Is there some utility for this paradigm? Can the gap between this and the traditional paradigms be bridged?
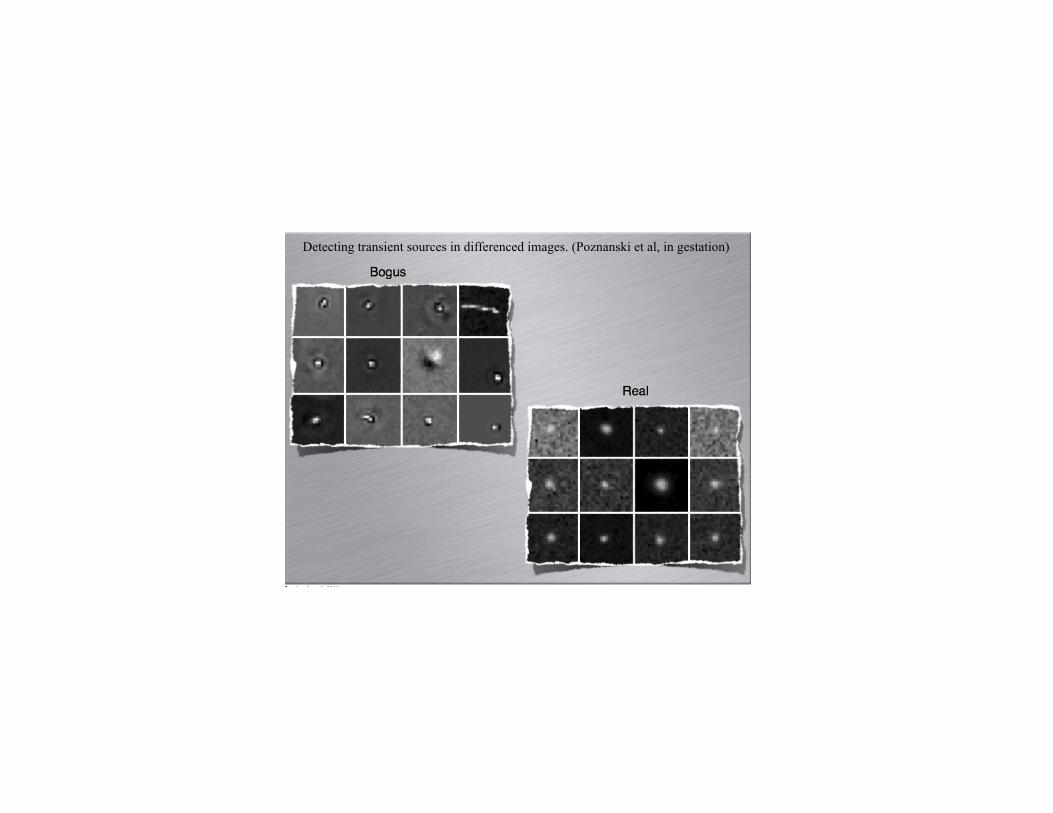
Detecting transient sources in differenced images. (Poznanski et al, in gestation)
In Conclusion
The problems are fascinating. No elegant, coherent, convincing unifying statistical methodology has emerged that is universally applicable.
The scientific achievements are substantial, as are outstanding challenges

In Conclusion
Much remains to be done. What will be the content and themes of such a conference 20 years from now? (I would love to attend)
The glass is half full -- let’s continue filling it!
Special thanks to Louis and Jeff!