Embed Size (px)
Citation preview
STATISTICAL INFORMATIONON
NEPALESE AGRICULTURE
Government of NepalMinistry of Agricultural Development
Monitoring, Evaluation and Statistics DivisionAgri Statistics SectionSingha Durbar, Kathmandu
Nepal
2072/73 (2015/16)

STATISTICAL INFORMATIONON
NEPALESE AGRICULTURE
Government of NepalMinistry of Agricultural Development
Monitoring, Evaluation and Statistics DivisionAgri Statistics SectionSingha Durbar, Kathmandu
Nepal
2072/73 (2015/16)

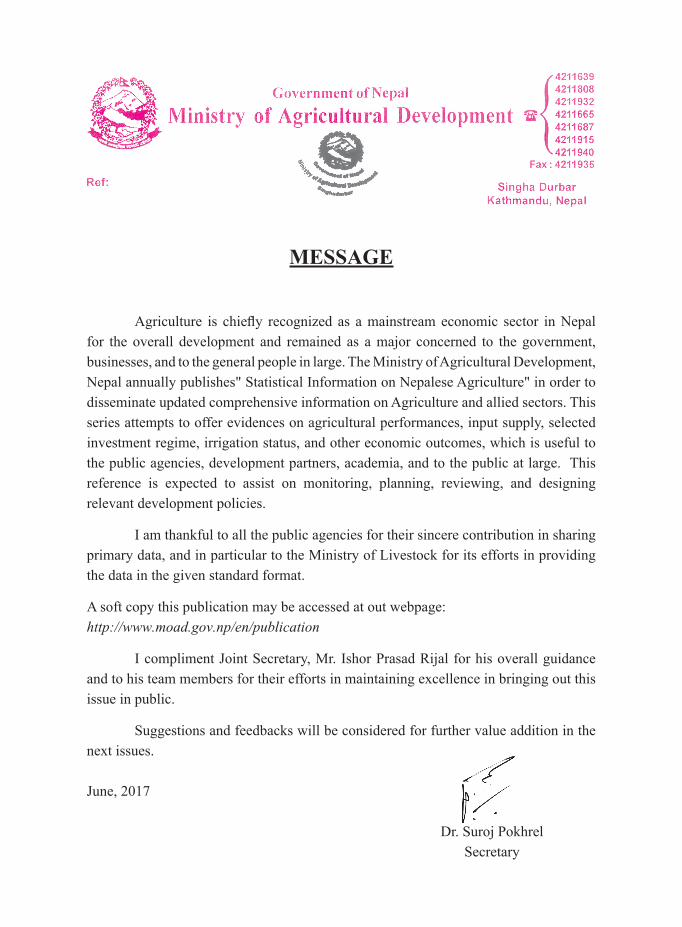
MESSAGE
Agriculture is chiefly recognized as a mainstream economic sector in Nepal for the overall development and remained as a major concerned to the government, businesses, and to the general people in large. The Ministry of Agricultural Development, Nepal annually publishes" Statistical Information on Nepalese Agriculture" in order to disseminate updated comprehensive information on Agriculture and allied sectors. This series attempts to offer evidences on agricultural performances, input supply, selected investment regime, irrigation status, and other economic outcomes, which is useful to the public agencies, development partners, academia, and to the public at large. This reference is expected to assist on monitoring, planning, reviewing, and designing relevant development policies.
I am thankful to all the public agencies for their sincere contribution in sharing primary data, and in particular to the Ministry of Livestock for its efforts in providing the data in the given standard format.
A soft copy this publication may be accessed at out webpage: http://www.moad.gov.np/en/publication
I compliment Joint Secretary, Mr. Ishor Prasad Rijal for his overall guidance and to his team members for their efforts in maintaining excellence in bringing out this issue in public.
Suggestions and feedbacks will be considered for further value addition in the next issues.
June, 2017
Dr. Suroj PokhrelSecretary

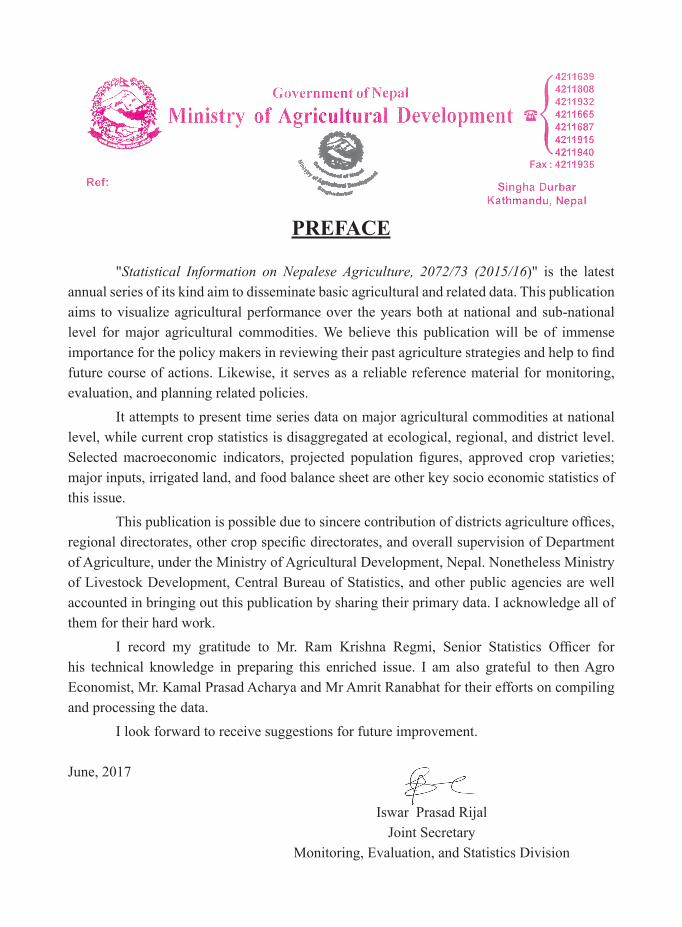
PREFACE
"Statistical Information on Nepalese Agriculture, 2072/73 (2015/16)" is the latest annual series of its kind aim to disseminate basic agricultural and related data. This publication aims to visualize agricultural performance over the years both at national and sub-national level for major agricultural commodities. We believe this publication will be of immense importance for the policy makers in reviewing their past agriculture strategies and help to find future course of actions. Likewise, it serves as a reliable reference material for monitoring, evaluation, and planning related policies.
It attempts to present time series data on major agricultural commodities at national level, while current crop statistics is disaggregated at ecological, regional, and district level. Selected macroeconomic indicators, projected population figures, approved crop varieties; major inputs, irrigated land, and food balance sheet are other key socio economic statistics of this issue.
This publication is possible due to sincere contribution of districts agriculture offices, regional directorates, other crop specific directorates, and overall supervision of Department of Agriculture, under the Ministry of Agricultural Development, Nepal. Nonetheless Ministry of Livestock Development, Central Bureau of Statistics, and other public agencies are well accounted in bringing out this publication by sharing their primary data. I acknowledge all of them for their hard work.
I record my gratitude to Mr. Ram Krishna Regmi, Senior Statistics Officer for his technical knowledge in preparing this enriched issue. I am also grateful to then Agro Economist, Mr. Kamal Prasad Acharya and Mr Amrit Ranabhat for their efforts on compiling and processing the data.
I look forward to receive suggestions for future improvement.
June, 2017
Iswar Prasad RijalJoint Secretary
Monitoring, Evaluation, and Statistics Division

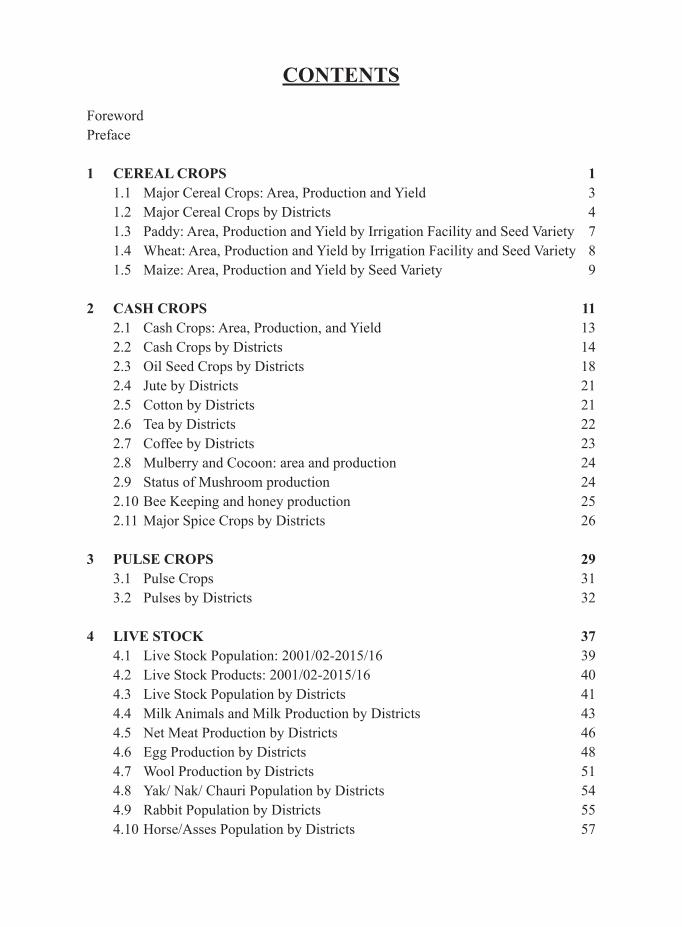
CONTENTS
ForewordPreface
1 CEREAL CROPS 1 1.1 Major Cereal Crops: Area, Production and Yield 3 1.2 Major Cereal Crops by Districts 4 1.3 Paddy: Area, Production and Yield by Irrigation Facility and Seed Variety 7 1.4 Wheat: Area, Production and Yield by Irrigation Facility and Seed Variety 8 1.5 Maize: Area, Production and Yield by Seed Variety 9
2 CASH CROPS 11 2.1 Cash Crops: Area, Production, and Yield 13 2.2 Cash Crops by Districts 14 2.3 Oil Seed Crops by Districts 18 2.4 Jute by Districts 21 2.5 Cotton by Districts 21 2.6 Tea by Districts 22 2.7 Coffee by Districts 23 2.8 Mulberry and Cocoon: area and production 24 2.9 Status of Mushroom production 24 2.10 Bee Keeping and honey production 25 2.11 Major Spice Crops by Districts 26
3 PULSE CROPS 29 3.1 Pulse Crops 31 3.2 Pulses by Districts 32
4 LIVE STOCK 37 4.1 Live Stock Population: 2001/02-2015/16 39 4.2 Live Stock Products: 2001/02-2015/16 40 4.3 Live Stock Population by Districts 41 4.4 Milk Animals and Milk Production by Districts 43 4.5 Net Meat Production by Districts 46 4.6 Egg Production by Districts 48 4.7 Wool Production by Districts 51 4.8 Yak/ Nak/ Chauri Population by Districts 54 4.9 Rabbit Population by Districts 55 4.10 Horse/Asses Population by Districts 57
5 FISHERY 59 5.1 Fish Production: Estimated Summery 61 5.2 Water Surface Area and production of fish by Districts 62 5.3 Water Surface Area and Production by Districts 65
6 HORTICULTURE 67 6.1 Fruits: Area, Production and Yield 69 6.2 Citrus Fruits: Area, Productive Area, Production, and Yield by Districts 71 6.3 Winter Fruits: Area, Productive Area, Production, and Yield 73 6.4 Summer Fruits: Area, Productive Area, Production, and Yield by Districts 77 6.5 Vegetable: Area, Production, and Yield 83 6.6 Fresh Vegetable Crops: Districtwise Area, Production and Yield 84
7 SELECTED INVESTMENT 109 7.1 Investment by ADBL/N in different Sectors 111 7.2 Investment by ADBL/N in different Agricultural sub-sectors 111 7.3 Co-Operative Statistics: F.Y. 2072/73 112 7.4 Summary Statistics of Cooperatives by Development
Regions F.Y.2072/73 112
8 INPUTS 113 8.1 Annual sales of Chemical Fertilizer and improved seeds,
1992/93-2015/16 115 8.2 Sales Statistics of Chemical Fertilizers, by Districts: F.Y.2072/73 116
9 PRICE 119 National Retail Price of Selected commodities 121
10 IRRIGATION 123 Current irrigation status up to fiscal Year 2072/73 125
11 MISCELLANEOUS 127 11.1 Edible Cereal Grain Production and Requirement: 1990/91-2015/16 129 11.2 Districtwise Food Availability and Requirement: 2015/16 131 11.3 Yield, Returns, Costs and net Profit of improved mainseason
Lentil of selected Districts 134 11.4 Yield, Returns, Costs and net Profit of Local mainseason
Lentil of selected Districts 134 11.5 Yield, Returns, Costs and net Profit of improved mainseason
Pegiopea of selected District 135 11.6 Yield, Returns, Costs and net Profit of improved mainseason
Blackgram of selected Districts 135

11.7 Yield, Returns, Costs and net Profit of improved mainseason Kidneybean of selected Districts 136
11.8 Yield, Returns, Costs and net Profit of improved mainseason Snowpea of selected Districts 136
11.9 Yield, Returns, Costs and net Profit of improved mainseason Cowpea selected Districts 137
11.10 Yield, Returns, Costs and net Profit of improved mainseason Mustard (Rape seed) of selected Districts 137
11.11 Yield, Returns, Costs and net Profit of improved mainseason Yellow Mustard of selected Districts 138
11.12 Yield, Returns, Costs and net Profit of improved mainseason Sesame of selected Districts 138
12.1 Animal Growth Rate of GDP by Economic Activities 139 12.2 Gross Output by Industrial Division 140 12.3 Gross National Disposable Income and Saving 141 12.4 Composition of Gross Domestic Product by ISIC Division 142 12.5 Summary of Macro Economic Indicators 143
13.1 Exports, Imports and Trade Balance by Chapters: F.Y.2015/16(2072/73) 144
13.2 Exports, Imports and Trade Balance by partner Countries 147 13.3 Imports of selected commodities by partner
countries:F.Y.2015/16(2072/73) 153 13.4 Exports of selected commodities by partner countries:
F.Y. 2015/16 (2073/73) 169
14.1 Key Findings of Commercial Floriculture Survey 2072/73(2015/16) 177 14.2 Number of Floriculture Farm by Type of Main Production 179 14.3 Total Area Covered by Flori-Farms 180
15.1 Population Projection by Age and Sex for Nepal, 2011/2022(Medium Variant) 181
Released and Registered Crops varieties, (1960-2016) 185
Conversion Table 207


STATISTICAL INFORMATION ON NEPALESE AGRICULTURE 2072-73 (2015-16)
1
1. CEREAL CROPS
STATISTICAL INFORMATION ON NEPALESE AGRICULTURE 2072-73 (2015-16)
2

STATISTICAL INFORMATION ON NEPALESE AGRICULTURE 2072-73 (2015-16)
3
YEA
RA
REA
PRO
D.
YIE
LDA
REA
PRO
D.
YIE
LDA
REA
PRO
D.
YIE
LDA
REA
PRO
D.
YIE
LDA
REA
PRO
D.
YIE
LDA
REA
PRO
D.
YIE
LD
1990
/91
1,45
5,17
0
3,50
2,16
0
2,40
7
757,
710
1,23
0,95
0
1,62
5
198,
570
23
1,63
0
1,16
6
592,
740
83
5,97
0
1,
410
29
,610
27
,840
94
0
1991
/92
1,41
1,81
0
3,22
2,54
0
2,28
3
754,
090
1,20
4,71
0
1,59
8
198,
240
22
8,66
0
1,15
3
571,
260
76
1,96
0
1,
334
29
,660
27
,640
93
2
1992
/93
1,26
2,11
0
2,58
4,90
0
2,04
8
775,
220
1,29
0,50
0
1,66
5
201,
770
23
6,75
0
1,17
3
613,
980
76
5,00
0
1,
246
29
,680
27
,610
93
0
1993
/94
1,45
0,44
9
3,49
5,58
9
2,41
0
754,
099
1,25
3,83
0
1,66
3
225,
207
24
5,95
7
1,09
2
611,
309
89
8,89
2
1,
470
37
,385
35
,157
94
0
1994
/95
1,36
8,42
3
2,90
6,18
4
2,12
4
771,
410
1,30
2,11
6
1,68
8
228,
061
25
2,84
3
1,10
9
624,
329
94
1,68
0
1,
508
39
,096
37
,108
94
9
1995
/96
1,49
6,79
0
3,57
8,83
0
2,39
1
791,
700
1,33
1,06
0
1,68
1
260,
090
28
2,44
0
1,08
6
653,
500
1,
012,
930
1,
550
39
,400
41
,340
1,
049
1996
/97
1,51
1,23
0
3,71
0,65
0
2,45
5
793,
720
1,31
6,84
0
1,65
9
259,
940
28
9,48
0
1,11
4
667,
120
1,
071,
970
1,
607
35
,280
36
,690
1,
040
1997
/98
1,50
6,34
0
3,64
0,86
0
2,41
7
799,
060
1,36
7,34
0
1,71
1
262,
440
28
5,12
0
1,08
6
640,
030
1,
030,
320
1,
610
35
,590
37
,150
1,
044
1998
/99
1,51
4,21
0
3,70
9,77
0
2,45
0
802,
290
1,34
5,91
0
1,67
8
263,
950
29
1,37
0
1,10
4
640,
802
1,
086,
470
1,
695
31
,843
31
,798
99
9
1999
/00
1,55
0,99
0
4,03
0,10
0
2,59
8
819,
010
1,44
5,45
0
1,76
5
263,
450
29
5,38
0
1,12
1
660,
040
1,
183,
530
1,
793
28
,196
30
,817
1,
093
2000
/01
1,56
0,04
4
4,21
6,46
5
2,70
3
824,
525
1,48
4,11
2
1,80
0
259,
888
28
2,85
2
1,08
8
641,
030
1,
157,
865
1,
806
28
,194
30
,488
1,
081
2001
/02
1,51
6,98
0
4,16
4,68
7
2,74
5
825,
980
1,51
0,77
0
1,82
9
258,
120
28
2,57
0
1,09
5
667,
077
1,
258,
045
1,
886
27
,722
30
,790
1,
111
2002
/03
1,54
4,66
0
4,13
2,50
0
2,67
5
836,
190
1,56
9,14
0
1,87
7
259,
130
28
2,86
0
1,09
2
669,
014
1,
344,
192
2,
009
27
,555
31
,711
1,
151
2003
/04
1,55
9,43
6
4,45
5,72
2
2,85
7
834,
285
1,59
0,09
7
1,90
6
258,
597
28
3,37
8
1,09
6
664,
589
1,
387,
191
2,
087
27
,467
28
,151
1,
091
2004
/05
1,54
1,72
9
4,28
9,82
7
2,78
2
849,
892
1,71
6,04
2
2,01
9
258,
839
28
9,83
8
1,12
0
675,
807
1,
442,
442
2,
134
26
,428
29
,341
1,
110
2005
/06
1,54
9,44
7
4,20
9,27
9
2,71
7
850,
947
1,73
4,41
7
2,03
8
261,
673
29
0,93
6
1,11
2
672,
040
1,
394,
126
2,
074
26
,227
27
,786
1,
059
2006
/07
1,43
9,52
5
3,68
0,83
8
2,55
7
870,
401
1,81
9,92
5
2,09
1
265,
160
28
4,81
3
1,07
4
702,
664
1,
515,
139
2,
156
26
,580
28
,293
1,
064
2007
/08
1,54
9,26
2
4,29
9,24
6
2,77
5
870,
166
1,87
8,64
8
2,15
9
265,
496
29
1,09
8
1,09
6
706,
481
1,
572,
065
2,
225
26
,106
28
,082
1,
076
2008
/09
1,55
5,94
0
4,52
3,69
3
2,90
7
875,
428
1,93
0,66
9
2,20
5
265,
889
29
2,68
3
1,10
1
694,
950
1,
343,
862
1,
934
25
,817
23
,224
90
0
2009
/10
1,48
1,28
9
4,02
3,82
3
2,71
6
875,
660
1,85
5,18
4
2,11
9
268,
473
29
9,52
3
1,11
6
731,
131
1,
556,
539
2,
129
26
,600
27
,587
1,
037
2010
/11
1,49
6,47
6
4,46
0,27
8
2,98
1
906,
253
2,06
7,52
2
2,28
1
269,
820
30
2,69
1
1,12
2
10,3
04
8,
841
858
76
7,49
9
1,74
5,81
1
2,27
5
28,4
61
30,2
40
1,06
3
2011
/12
1,53
1,49
3
5,07
2,24
8
3,31
2
871,
387
2,17
9,41
4
2,50
1
278,
030
31
5,06
7
1,13
3
10,3
39
10
,021
969
76
5,31
7
1,84
6,14
2
2,41
2
27,9
66
34,8
30
1,24
5
2012
/13
1,42
0,57
0
4,50
4,50
3
3,17
1
849,
635
1,99
9,01
0
2,35
3
274,
350
30
5,58
8
1,11
4
10,6
81
10
,056
941
75
9,84
3
1,88
2,22
0
2,47
7
28,9
89
36,9
73
1,27
5
2013
/14
1,48
6,95
1
5,04
7,04
7
3,39
4
928,
761
2,28
3,22
2
2,45
8
271,
183
30
4,10
5
1,12
1
10,5
10
10
,335
983
75
4,47
4
1,88
3,14
7
2,49
6
28,1
73
34,8
24
1,23
6
2014
/15
1,42
5,34
6
4,78
8,61
2
3,36
0
882,
395
2,14
5,29
1
2,43
1
268,
050
30
8,48
8
1,15
1
10,8
19
10
,870
1,00
5
76
2,37
3
1,97
5,62
5
2,59
1
28,0
53
37,3
54
1,33
2
2015
/16
1,36
2,90
8
4,29
9,07
9
3,15
4
891,
583
2,23
1,51
7
2,50
3
266,
799
30
2,39
7
1,13
3
10,8
42
11
,641
1,07
4
74
5,82
3
1,73
6,84
9
2,32
9
28,3
61
32,8
01
1,15
7
BA
RLE
Y
Tab
le 1
.1: M
ajor
Cer
eal C
rops
: Are
a, P
rodu
ctio
n an
d Y
ield
Are
a in
Hec
tare
, Pro
duct
ion
in M
etric
Ton
, Yie
ld in
Kg
Per H
ecta
re
PA
DD
Y M
AIZ
E M
ILLE
TB
UC
KW
HEA
TW
HEA
T

STATISTICAL INFORMATION ON NEPALESE AGRICULTURE 2072-73 (2015-16)
4
Are
aPr
od..
Yie
ld A
rea
Prod
.Y
ield
Are
aPr
od.
Yie
ld A
rea
Prod
.Y
ield
Are
a
Prod
. Y
ield
A
rea
Pr
od.
Yie
ld
TAPL
EJU
NG
4,07
5
8,
680
2,13
0
9,15
0
27,4
50
3,00
0
3,05
0
4,11
8
1,35
0
118
16
5
1,39
8
1,56
0
2,81
1
1,
802
31
2
378
1,
212
SAN
KH
UW
ASH
AV
A13
,655
29
,650
2,
171
12
,070
20,1
05
1,66
6
7,07
1
7,19
5
1,01
8
15
16
1,06
7
500
1,10
0
2,
200
14
13
93
3
SOLU
KH
UM
BU
1,52
5
3,
575
2,34
4
12,9
50
29
,499
2,
278
2,
100
2,
625
1,
250
17
0
150
88
2
1,
750
3,
672
2,09
8
182
17
9
985
E.M
OU
NT
AIN
19,2
55
41,9
05
2,17
6
34,1
70
77
,054
2,
255
12
,221
13,9
38
1,
140
30
3
331
1,
092
3,
810
7,
583
1,99
0
508
57
1
1,12
3
PAN
CH
THA
R9,
250
21,1
84
2,29
0
18,5
13
38
,435
2,
076
4,
815
9,
004
1,
870
3,
915
6,
455
1,64
9
354
41
2
1,16
5
ILLA
M12
,500
31
,750
2,
540
31
,395
111,
091
3,
538
1,
700
2,
100
1,
235
25
25
1,
000
4,
620
14
,264
3,
087
50
50
1,
000
TER
HA
THU
M7,
610
17,3
00
2,27
3
12,3
50
27
,170
2,
200
2,
702
3,
242
1,
200
35
35
1,
000
1,
500
3,
150
2,10
0
70
64
920
DH
AN
KU
TA7,
664
22,0
90
2,88
2
7,00
0
19,0
00
2,71
4
7,70
0
8,45
4
1,09
8
5
4
700
1,40
0
3,05
0
2,
179
BH
OJP
UR
16,0
93
36,9
70
2,29
7
36,3
60
83
,735
2,
303
5,
505
6,
250
1,
135
35
35
1,
000
40
0
94
0
2,35
0
15
23
1,53
3
KH
OTA
NG
12,1
50
19,4
00
1,59
7
41,0
60
75
,585
1,
841
21
,215
22,6
35
1,
067
65
0
650
1,
000
5,
530
15
,208
2,
750
41
2
494
1,
200
OK
HA
LDH
UN
GA
4,35
0
9,
580
2,20
2
12,4
00
29
,760
2,
400
7,
751
10
,177
1,31
3
105
11
0
1,04
8
2,36
5
4,49
4
1,
900
10
1
94
93
3
UD
AY
APU
R11
,500
40
,958
3,
562
10
,388
35,1
23
3,38
1
2,76
0
3,50
0
1,26
8
19
17
895
5,10
0
12,2
40
2,40
0
40
40
1,00
0
E.H
ILL
S81
,117
19
9,23
2
2,45
6
169,
466
41
9,89
9
2,47
8
54,1
48
65
,362
1,20
7
874
87
6
1,00
2
24,8
30
59
,800
2,
408
1,
042
1,17
8
1,
131
JHA
PA83
,000
31
5,17
5
3,79
7
35,5
00
95
,000
2,
676
1,
785
2,
142
1,
200
1,
600
1,50
0
93
8
9,
000
29
,700
3,
300
10
9
90
0
MO
RA
NG
78,0
00
275,
925
3,
538
14
,000
46,0
00
3,28
6
1,34
8
1,61
7
1,20
0
70
70
1,00
0
16,1
00
34
,615
2,
150
SUN
SAR
I44
,900
15
5,11
0
3,45
5
8,35
0
25,1
00
3,00
6
680
714
1,05
0
400
40
0
1,00
0
14,5
00
44
,800
3,
090
20
41
2,
050
SAPT
AR
I31
,900
82
,250
2,
578
2,
500
6,
500
2,60
0
200
260
1,30
0
17,0
00
41
,000
2,
412
SIR
AH
A33
,500
85
,000
2,
537
1,
700
5,
400
3,17
6
640
640
1,00
0
15,2
10
30
,420
2,
000
E.T
ER
AI
271,
300
91
3,46
0
3,36
7
62,0
50
17
8,00
0
2,86
9
4,65
3
5,37
3
1,15
5
2,07
0
1,
970
952
71,8
10
18
0,53
5
2,51
4
30
50
1,66
7
E.R
EG
ION
371,
672
1,
154,
597
3,10
6
265,
686
67
4,95
3
2,54
0
71,0
22
84
,673
1,19
2
3,24
7
3,
177
978
100,
450
24
7,91
8
2,46
8
1,58
0
1,
799
1,13
9
DO
LAK
HA
3,09
0
6,
500
2,10
4
5,50
0
12,6
50
2,30
0
3,60
0
4,25
0
1,18
1
400
41
0
1,02
5
4,23
0
6,97
9
1,
650
17
2
165
96
0
SIN
DH
UPA
LCH
OK
8,75
0
20
,125
2,
300
18
,590
40,8
90
2,20
0
18,4
45
20
,270
1,09
9
6,81
5
7,07
4
1,
038
20
7
193
93
3
RA
SUW
A1,
050
2,52
0
2,
400
2,
430
3,
850
1,58
4
895
902
1,00
8
715
1,36
3
1,
907
28
8
336
1,
165
C.M
OU
NT
AIN
12,8
90
29,1
45
2,26
1
26,5
20
57
,390
2,
164
22
,940
25,4
22
1,
108
40
0
410
1,
025
11
,760
15,4
16
1,31
1
667
69
4
1,04
0
RA
MEC
HA
P9,
020
21,6
54
2,40
1
19,3
45
48
,462
2,
505
5,
060
5,
100
1,
008
19
19
1,
000
3,
852
8,
089
2,10
0
80
68
850
SIN
DH
ULI
13,2
65
35,9
00
2,70
6
23,6
20
58
,500
2,
477
11
,700
11,8
80
1,
015
53
5
270
50
5
5,
650
14
,125
2,
500
56
85
1,
526
KA
VR
E11
,308
33
,975
3,
005
25
,354
60,8
49
2,40
0
3,51
5
4,04
2
1,15
0
608
66
6
1,09
5
8,92
5
21,1
77
2,37
3
708
70
7
999
BH
AK
TAPU
R4,
250
24,4
00
5,74
1
1,85
5
7,60
5
4,
100
11
0
15
6
1,
418
3,
000
10
,500
3,
500
46
47
1,
036
LALI
TPU
R4,
650
21,1
66
4,55
2
8,58
9
27,4
85
3,20
0
560
575
1,02
7
54
53
981
3,00
0
7,80
0
2,
600
51
29
57
8
KA
THM
AN
DU
7,90
5
40
,200
5,
085
9,
923
33
,650
3,
391
85
2
86
0
1,
009
5
5
1,
000
3,
900
12
,480
3,
200
4
4
93
3
NU
WA
KO
T15
,695
62
,627
3,
990
20
,450
63,8
00
3,12
0
5,20
0
6,00
0
1,15
4
200
24
5
1,22
5
4,15
8
13,3
06
3,20
0
187
15
7
837
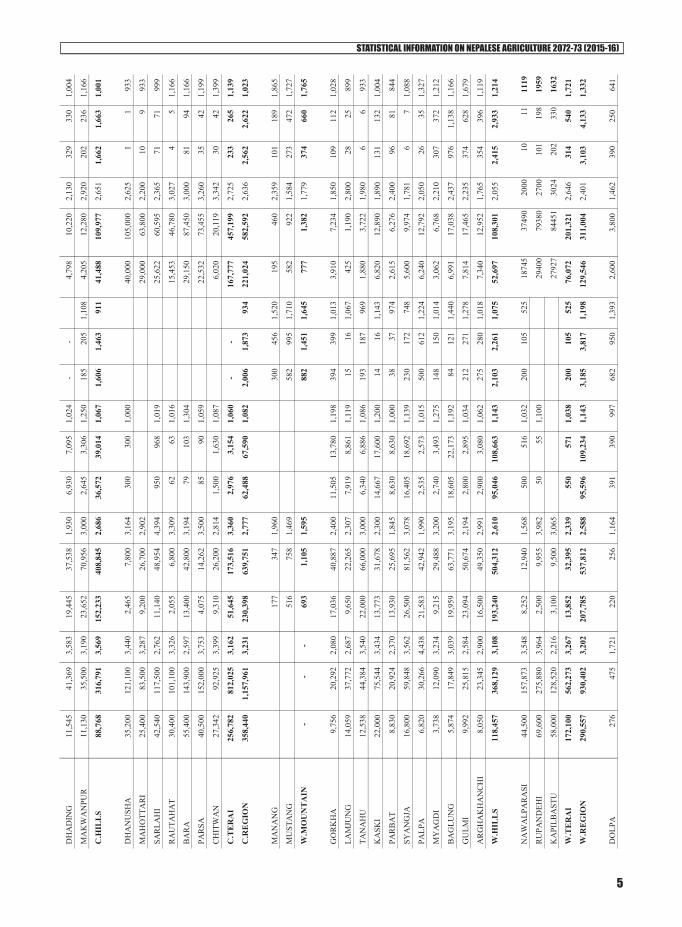
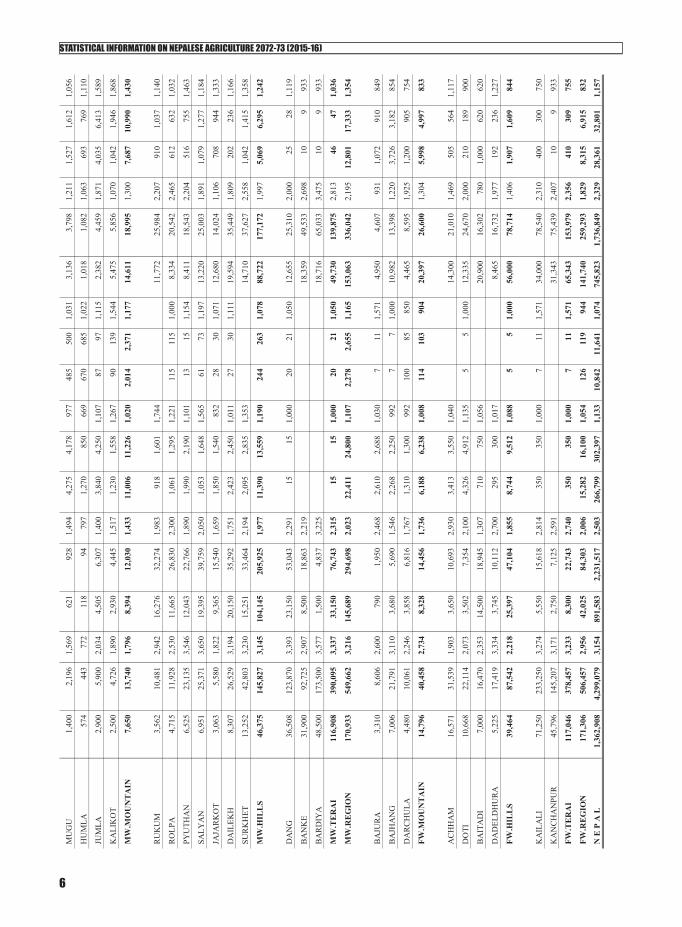
Tab
le 1
.2 :
Maj
or C
erea
l Cro
ps b
y D
istri
cts
[Are
a in
Ha.
, Pro
d. in
Mt.
and
Yie
ld in
Kg/
Ha.
]
Pad
dyM
aize
Mill
etB
uckw
heat
W
heat
Bar
ley
D
istri
ct
STATISTICAL INFORMATION ON NEPALESE AGRICULTURE 2072-73 (2015-16)
5
DH
AD
ING
11,5
45
41,3
69
3,58
3
19,4
45
37
,538
1,
930
6,
930
7,
095
1,
024
-
-
4,
798
10
,220
2,
130
32
9
330
1,
004
MA
KW
AN
PUR
11,1
30
35,5
00
3,19
0
23,6
52
70
,956
3,
000
2,
645
3,
306
1,
250
18
5
205
1,
108
4,
205
12
,280
2,
920
20
2
236
1,
166
C.H
ILL
S88
,768
31
6,79
1
3,56
9
152,
233
40
8,84
5
2,68
6
36,5
72
39
,014
1,06
7
1,60
6
1,
463
911
41,4
88
10
9,97
7
2,65
1
1,66
2
1,
663
1,00
1
DH
AN
USH
A35
,200
12
1,10
0
3,44
0
2,46
5
7,80
0
3,
164
30
0
30
0
1,
000
40
,000
105,
000
2,
625
1
1
93
3
MA
HO
TTA
RI
25,4
00
83,5
00
3,28
7
9,20
0
26,7
00
2,90
2
29,0
00
63
,800
2,
200
10
9
93
3
SAR
LAH
I42
,540
11
7,50
0
2,76
2
11,1
40
48
,954
4,
394
95
0
96
8
1,
019
25
,622
60,5
95
2,36
5
71
71
999
RA
UTA
HA
T30
,400
10
1,10
0
3,32
6
2,05
5
6,80
0
3,
309
62
63
1,
016
15
,453
46,7
80
3,02
7
4
5
1,16
6
BA
RA
55,4
00
143,
900
2,
597
13
,400
42,8
00
3,19
4
79
10
3
1,
304
29
,150
87,4
50
3,00
0
81
94
1,16
6
PAR
SA40
,500
15
2,00
0
3,75
3
4,07
5
14,2
62
3,50
0
85
90
1,05
9
22,5
32
73
,455
3,
260
35
42
1,
199
CH
ITW
AN
27,3
42
92,9
25
3,39
9
9,31
0
26,2
00
2,81
4
1,50
0
1,63
0
1,08
7
6,02
0
20,1
19
3,34
2
30
42
1,39
9
C.T
ER
AI
256,
782
81
2,02
5
3,16
2
51,6
45
17
3,51
6
3,36
0
2,97
6
3,15
4
1,06
0
-
-
167,
777
45
7,19
9
2,72
5
233
26
5
1,13
9
C.R
EG
ION
358,
440
1,
157,
961
3,23
1
230,
398
63
9,75
1
2,77
7
62,4
88
67
,590
1,08
2
2,00
6
1,
873
934
221,
024
58
2,59
2
2,63
6
2,56
2
2,
622
1,02
3
MA
NA
NG
177
347
1,
960
30
0
456
1,
520
19
5
46
0
2,35
9
101
18
9
1,86
5
MU
STA
NG
516
758
1,
469
58
2
995
1,
710
58
2
92
2
1,58
4
273
47
2
1,72
7
W.M
OU
NT
AIN
-
-
-
69
3
1,
105
1,59
5
882
1,
451
1,64
5
777
1,38
2
1,
779
37
4
660
1,
765
GO
RK
HA
9,75
6
20
,292
2,
080
17
,036
40,8
87
2,40
0
11,5
05
13
,780
1,19
8
394
39
9
1,01
3
3,91
0
7,23
4
1,
850
10
9
112
1,
028
LAM
JUN
G14
,059
37
,772
2,
687
9,
650
22
,265
2,
307
7,
919
8,
861
1,
119
15
16
1,
067
42
5
1,
190
2,80
0
28
25
899
TAN
AH
U12
,538
44
,384
3,
540
22
,000
66,0
00
3,00
0
6,34
0
6,88
6
1,08
6
193
18
7
969
1,88
0
3,72
2
1,
980
6
6
93
3
KA
SKI
22,0
00
75,5
44
3,43
4
13,7
73
31
,678
2,
300
14
,667
17,6
00
1,
200
14
16
1,
143
6,
820
12
,890
1,
890
13
1
132
1,
004
PAR
BA
T8,
830
20,9
24
2,37
0
13,9
30
25
,695
1,
845
8,
630
8,
630
1,
000
38
37
97
4
2,
615
6,
276
2,40
0
96
81
844
SYA
NG
JA16
,800
59
,848
3,
562
26
,500
81,5
62
3,07
8
16,4
05
18
,692
1,13
9
230
17
2
748
5,60
0
9,97
4
1,
781
6
7
1,
088
PALP
A6,
820
30,2
66
4,43
8
21,5
83
42
,942
1,
990
2,
535
2,
573
1,
015
50
0
612
1,
224
6,
240
12
,792
2,
050
26
35
1,
327
MY
AG
DI
3,73
8
12
,090
3,
234
9,
215
29
,488
3,
200
2,
740
3,
493
1,
275
14
8
150
1,
014
3,
062
6,
768
2,21
0
307
37
2
1,21
2
BA
GLU
NG
5,87
4
17
,849
3,
039
19
,959
63,7
71
3,19
5
18,6
05
22
,173
1,19
2
84
12
1
1,44
0
6,99
1
17,0
38
2,43
7
976
1,
138
1,16
6
GU
LMI
9,99
2
25
,815
2,
584
23
,094
50,6
74
2,19
4
2,80
0
2,89
5
1,03
4
212
27
1
1,27
8
7,81
4
17,4
65
2,23
5
374
62
8
1,67
9
AR
GH
AK
HA
NC
HI
8,05
0
23
,345
2,
900
16
,500
49,3
50
2,99
1
2,90
0
3,08
0
1,06
2
275
28
0
1,01
8
7,34
0
12,9
52
1,76
5
354
39
6
1,11
9
W.H
ILL
S11
8,45
7
368,
129
3,
108
19
3,24
0
504,
312
2,
610
95
,046
108,
663
1,
143
2,
103
2,26
1
1,
075
52
,697
108,
301
2,
055
2,
415
2,93
3
1,
214
NA
WA
LPA
RA
SI44
,500
15
7,87
3
3,54
8
8,25
2
12,9
40
1,56
8
500
516
1,03
2
200
10
5
525
1874
537
490
2000
1011
1119
RU
PAN
DEH
I69
,600
27
5,88
0
3,96
4
2,50
0
9,95
5
3,
982
50
55
1,
100
29
400
7938
027
0010
119
819
59
KA
PILB
AST
U58
,000
12
8,52
0
2,21
6
3,10
0
9,50
0
3,
065
27
927
8445
130
2420
233
016
32
W.T
ER
AI
172,
100
56
2,27
3
3,26
7
13,8
52
32
,395
2,
339
55
0
57
1
1,
038
20
0
105
52
5
76
,072
201,
321
2,
646
31
4
540
1,
721
W.R
EG
ION
290,
557
93
0,40
2
3,20
2
207,
785
53
7,81
2
2,58
8
95,5
96
10
9,23
4
1,14
3
3,18
5
3,
817
1,19
8
129,
546
31
1,00
4
2,40
1
3,10
3
4,
133
1,33
2
DO
LPA
276
47
5
1,72
1
220
256
1,
164
39
1
39
0
99
7
68
2
950
1,
393
2,
600
3,
800
1,46
2
390
25
0
641
STATISTICAL INFORMATION ON NEPALESE AGRICULTURE 2072-73 (2015-16)
6
MU
GU
1,40
0
2,
196
1,56
9
621
928
1,
494
4,
275
4,
178
97
7
48
5
500
1,
031
3,
136
3,
798
1,21
1
1,52
7
1,
612
1,05
6
HU
MLA
574
44
3
772
118
94
79
7
1,
270
85
0
66
9
67
0
685
1,
022
1,
018
1,
082
1,06
3
693
76
9
1,11
0
JUM
LA2,
900
5,90
0
2,
034
4,
505
6,
307
1,40
0
3,84
0
4,25
0
1,10
7
87
97
1,11
5
2,38
2
4,45
9
1,
871
4,
035
6,41
3
1,
589
KA
LIK
OT
2,50
0
4,
726
1,89
0
2,93
0
4,44
5
1,
517
1,
230
1,
558
1,
267
90
139
1,
544
5,
475
5,
856
1,07
0
1,04
2
1,
946
1,86
8
MW
.MO
UN
TA
IN7,
650
13,7
40
1,79
6
8,39
4
12,0
30
1,43
3
11,0
06
11
,226
1,02
0
2,01
4
2,
371
1,17
7
14,6
11
18
,995
1,
300
7,
687
10,9
90
1,43
0
RU
KU
M3,
562
10,4
81
2,94
2
16,2
76
32
,274
1,
983
91
8
1,
601
1,
744
11
,772
25,9
84
2,20
7
910
1,
037
1,14
0
RO
LPA
4,71
5
11
,928
2,
530
11
,665
26,8
30
2,30
0
1,06
1
1,29
5
1,22
1
115
11
5
1,00
0
8,33
4
20,5
42
2,46
5
612
63
2
1,03
2
PYU
THA
N6,
525
23,1
35
3,54
6
12,0
43
22
,766
1,
890
1,
990
2,
190
1,
101
13
15
1,
154
8,
411
18
,543
2,
204
51
6
755
1,
463
SALY
AN
6,95
1
25
,371
3,
650
19
,395
39,7
59
2,05
0
1,05
3
1,64
8
1,56
5
61
73
1,19
7
13,2
20
25
,003
1,
891
1,
079
1,27
7
1,
184
JAJA
RK
OT
3,06
3
5,
580
1,82
2
9,36
5
15,5
40
1,65
9
1,85
0
1,54
0
832
28
30
1,07
1
12,6
80
14
,024
1,
106
70
8
944
1,
333
DA
ILEK
H8,
307
26,5
29
3,19
4
20,1
50
35
,292
1,
751
2,
423
2,
450
1,
011
27
30
1,
111
19
,594
35,4
49
1,80
9
202
23
6
1,16
6
SUR
KH
ET13
,252
42
,803
3,
230
15
,251
33,4
64
2,19
4
2,09
5
2,83
5
1,35
3
14,7
10
37
,627
2,
558
1,
042
1,41
5
1,
358
MW
.HIL
LS
46,3
75
145,
827
3,
145
10
4,14
5
205,
925
1,
977
11
,390
13,5
59
1,
190
24
4
263
1,
078
88
,722
177,
172
1,
997
5,
069
6,29
5
1,
242
DA
NG
36,5
08
123,
870
3,
393
23
,150
53,0
43
2,29
1
15
15
1,00
0
20
21
1,05
0
12,6
55
25
,310
2,
000
25
28
1,
119
BA
NK
E31
,900
92
,725
2,
907
8,
500
18
,863
2,
219
18
,359
49,5
33
2,69
8
10
9
933
BA
RD
IYA
48,5
00
173,
500
3,
577
1,
500
4,
837
3,22
5
18,7
16
65
,033
3,
475
10
9
93
3
MW
.TE
RA
I11
6,90
8
390,
095
3,
337
33
,150
76,7
43
2,31
5
15
15
1,00
0
20
21
1,05
0
49,7
30
13
9,87
5
2,81
3
46
47
1,03
6
MW
.RE
GIO
N17
0,93
3
549,
662
3,
216
14
5,68
9
294,
698
2,
023
22
,411
24,8
00
1,
107
2,
278
2,65
5
1,
165
15
3,06
3
336,
042
2,
195
12
,801
17
,333
1,
354
BA
JUR
A3,
310
8,60
6
2,
600
79
0
1,
950
2,46
8
2,61
0
2,68
8
1,03
0
7
11
1,57
1
4,95
0
4,60
7
93
1
1,
072
910
84
9
BA
JHA
NG
7,00
6
21
,791
3,
110
3,
680
5,
690
1,54
6
2,26
8
2,25
0
992
7
7
1,00
0
10,9
82
13
,398
1,
220
3,
726
3,18
2
85
4
DA
RC
HU
LA4,
480
10,0
61
2,24
6
3,85
8
6,81
6
1,
767
1,
310
1,
300
99
2
10
0
85
85
0
4,
465
8,
595
1,92
5
1,20
0
90
5
754
FW.M
OU
NT
AIN
14,7
96
40,4
58
2,73
4
8,32
8
14,4
56
1,73
6
6,18
8
6,23
8
1,00
8
114
10
3
904
20,3
97
26
,600
1,
304
5,
998
4,99
7
83
3
AC
HH
AM
16,5
71
31,5
39
1,90
3
3,65
0
10,6
93
2,93
0
3,41
3
3,55
0
1,04
0
14,3
00
21
,010
1,
469
50
5
564
1,
117
DO
TI10
,668
22
,114
2,
073
3,
502
7,
354
2,10
0
4,32
6
4,91
2
1,13
5
5
5
1,00
0
12,3
35
24
,670
2,
000
21
0
189
90
0
BA
ITA
DI
7,00
0
16
,470
2,
353
14
,500
18,9
45
1,30
7
710
750
1,05
6
20,9
00
16
,302
78
0
1,
000
620
62
0
DA
DEL
DH
UR
A5,
225
17,4
19
3,33
4
3,74
5
10,1
12
2,70
0
295
300
1,01
7
8,46
5
16,7
32
1,97
7
192
23
6
1,22
7
FW.H
ILL
S39
,464
87
,542
2,
218
25
,397
47,1
04
1,85
5
8,74
4
9,51
2
1,08
8
5
5
1,00
0
56,0
00
78
,714
1,
406
1,
907
1,60
9
84
4
KA
ILA
LI71
,250
23
3,25
0
3,27
4
5,55
0
15,6
18
2,81
4
350
350
1,00
0
7
11
1,57
1
34,0
00
78
,540
2,
310
40
0
300
75
0
KA
NC
HA
NPU
R45
,796
14
5,20
7
3,17
1
2,75
0
7,12
5
2,
591
31
,343
75,4
39
2,40
7
10
9
933
FW.T
ER
AI
117,
046
37
8,45
7
3,23
3
8,30
0
22,7
43
2,74
0
350
350
1,00
0
7
11
1,57
1
65,3
43
15
3,97
9
2,35
6
410
30
9
755
FW.R
EG
ION
171,
306
50
6,45
7
2,95
6
42,0
25
84
,303
2,
006
15
,282
16,1
00
1,
054
12
6
119
94
4
14
1,74
0
259,
293
1,
829
8,
315
6,91
5
83
2
N E
P A
L
1,36
2,90
8
4,
299,
079
3,15
4
891,
583
2,
231,
517
2,50
3
266,
799
30
2,39
7
1,13
3
10,8
42
11,6
41
1,07
4
745,
823
1,
736,
849
2,32
9
28,3
61
32,8
01
1,15
7
STATISTICAL INFORMATION ON NEPALESE AGRICULTURE 2072-73 (2015-16)
7
MO
UN
TAIN
Irrig
ated
% A
rea
Rai
nfed
% A
rea
Tota
lIm
prov
ed
% A
rea
Loca
l %
Are
aTo
tal
Are
a 27
,841
51
.00
26,7
50
49
.00
54,5
91
50,7
70
93.0
0
3,
821
7.
00
54
,591
Prod
.68
,886
56
,362
125,
248
11
8,75
2
6,49
6
125,
248
Yie
ld2,
474
2,
107
2,
294
2,33
9
1,
700
2,
294
HIL
LS`
Are
a 22
4,50
9
60
.00
149,
672
40.0
0
37
4,18
1
347,
989
93
.00
26,1
93
7.
00
37
4,18
1
Prod
.72
6,38
9
39
1,13
2
1,
117,
521
1,05
9,79
2
57
,729
1,11
7,52
1
Yie
ld3,
235
2,
613
2,
987
3,04
5
2,
204
2,
987
TER
AI
Are
a 70
0,60
2
75
.00
233,
534
25.0
0
93
4,13
6
906,
112
97
.00
28,0
24
3.
00
93
4,13
6
Prod
.2,
536,
737
51
9,57
3
3,
056,
310
2,99
3,25
6
63
,054
3,05
6,31
0
Yie
ld3,
621
2,
225
3,
272
3,30
3
2,
250
3,
272
NEP
AL
Are
a 95
2,95
2
69
.92
409,
956
30.0
8
1,
362,
908
1,30
4,87
0
95
.74
58,0
38
4.
26
1,
362,
908
Prod
.3,
332,
012
96
7,06
7
4,
299,
079
4,17
1,80
0
12
7,27
9
4,
299,
079
Yie
ld3,
497
2,
359
3,
154
3,19
7
2,
193
3,
154
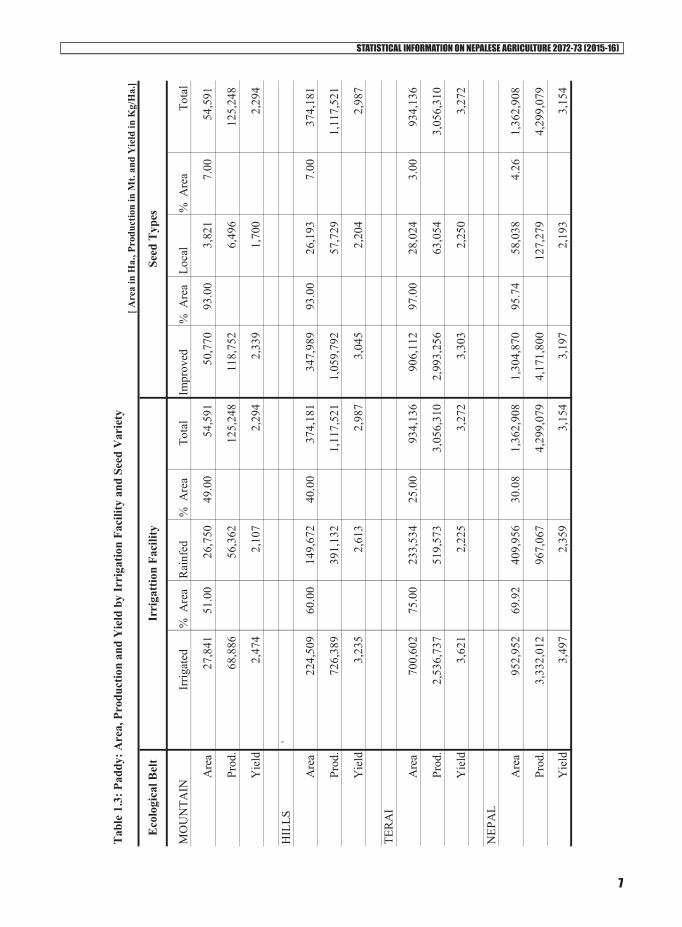
Tab
le 1
.3: P
addy
: Are
a, P
rodu
ctio
n an
d Y
ield
by
Irri
gatio
n Fa
cilit
y an
d Se
ed V
arie
ty
[ A
rea
in H
a., P
rodu
ctio
n in
Mt.
and
Yie
ld in
Kg/
Ha.
]
Irri
gatt
ion
Faci
lity
Seed
Typ
esE
colo
gica
l Bel
t
STATISTICAL INFORMATION ON NEPALESE AGRICULTURE 2072-73 (2015-16)
8
Ecol
ogic
al B
elt
Irrig
ated
% A
rea
Rai
nfed
% A
rea
Tota
lIm
prov
ed%
Are
aLo
cal
% A
rea
Tota
l
MO
UN
TAIN
Are
a 23
,623
46
.00
27
,732
54.0
0
51,3
55
49,2
03
95.8
1
2,15
2
4.
19
51
,355
Pr
od.
47,2
46
22,7
29
69
,976
67
,796
2,
180
69,9
76
Yie
ld2,
000
82
0
1,36
3
1,37
8
1,01
3
1,36
3
HIL
LSA
rea
121,
319
46.0
0
142,
418
54
.00
26
3,73
7
25
3,71
5
10
,022
26
3,73
7
Pr
od.
266,
902
267,
062
53
3,96
4
52
3,65
6
10
,308
53
3,96
4
Y
ield
2,20
0
1,87
5
2,
025
2,
064
1,
028
2,02
5
TER
AI
Are
a 34
8,89
2
81
.00
81
,839
19.0
0
430,
731
426,
424
4,30
7
43
0,73
1
Pr
od.
1,03
1,32
6
101,
583
1,
132,
909
1,
126,
809
6,
100
1,13
2,90
9
Yie
ld2,
956
1,
241
2,63
0
2,64
2
1,41
6
2,
630
NEP
AL
Are
a 49
3,83
5
66
.21
25
1,98
9
33.7
9
745,
823
729,
342
95.8
1
16,4
81
4.19
745,
823
Prod
.1,
345,
474
39
1,37
4
1,73
6,84
9
1,71
8,26
1
-
18
,588
-
1,
736,
849
Y
ield
2,72
5
1,55
3
2,
329
2,
356
-
1,12
8
-
2,
329
Irri
gatt
ion
Faci
lity
Seed
Typ
es
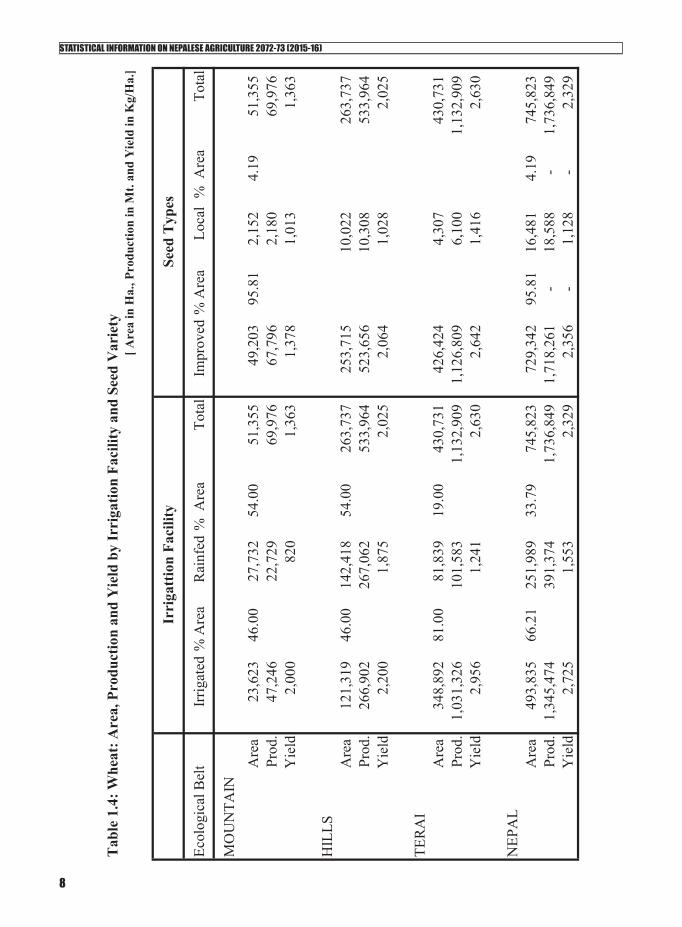
Tab
le 1
.4: W
heat
: Are
a, P
rodu
ctio
n an
d Y
ield
by
Irri
gatio
n Fa
cilit
y an
d Se
ed V
arie
ty
[ A
rea
in H
a., P
rodu
ctio
n in
Mt.
and
Yie
ld in
Kg/
Ha.
]

STATISTICAL INFORMATION ON NEPALESE AGRICULTURE 2072-73 (2015-16)
9
Ecol
ogic
al B
elt
Impr
oved
% A
rea
Loca
l%
Are
aTo
tal
MO
UN
TAIN
Are
a 71
,857
92.0
0
6,
248
78
,105
Pr
od.
151,
617
10
,418
16
2,03
5
Y
ield
2,11
0
1,66
7
2,
075
HIL
LSA
rea
605,
812
38
,669
64
4,48
1
Pr
od.
1,52
0,58
8
65
,497
1,
586,
085
Y
ield
2,51
0
1,69
4
2,46
1
TER
AI
Are
a 16
3,92
7
5,07
0
168,
997
Prod
.47
1,61
8
11,7
79
483,
397
Yie
ld2,
791
2,
323
NEP
AL
Are
a 84
1,59
6
92.0
0
49
,987
-
89
1,58
3
Pr
od.
2,14
3,82
4
-
87,6
93
-
2,23
1,51
7
Yie
ld2,
547
-
1,75
4
2,50
3
Tab
le 1
.5: M
aize
: Are
a, P
rodu
ctio
n an
d Y
ield
by
Seed
Var
iety
[
Are
a in
Ha.
, Pro
duct
ion
in M
t. an
d Y
ield
in K
g/H
a.]
Seed
Typ
es
STATISTICAL INFORMATION ON NEPALESE AGRICULTURE 2072-73 (2015-16)
10

STATISTICAL INFORMATION ON NEPALESE AGRICULTURE 2072-73 (2015-16)
11
2. CASH CROPS

STATISTICAL INFORMATION ON NEPALESE AGRICULTURE 2072-73 (2015-16)
12

STATISTICAL INFORMATION ON NEPALESE AGRICULTURE 2072-73 (2015-16)
13
YEA
R
A
REA
PRO
D.
YIE
LDA
REA
PRO
D.
YIE
LDA
REA
PRO
D.
YIE
LDA
REA
PRO
D.
YIE
LDA
REA
PRO
D.
YIE
LDA
REA
PRO
D.
YIE
LD
1990
/91
156,
310
92
,140
589
84,2
80
73
8,03
0
8,
757
7,29
0
6,98
0
957
32,9
60
1,10
5,96
0
33,5
55
14,0
00
16,0
00
1,14
3
1,64
6
1,23
2
748
1991
/92
154,
570
87
,840
568
85,3
00
73
2,86
0
8,
592
6,52
0
6,00
5
921
37,4
10
1,29
1,34
0
34,5
19
15,0
00
19,0
00
1,26
7
1,99
8
2,31
2
1,15
7
1992
/93
165,
240
93
,690
567
87,0
20
73
3,30
0
8,
427
6,66
0
6,02
0
904
38,3
30
1,36
5,87
0
35,6
34
9,00
0
10
,000
1,
111
1,
648
1,
579
95
8
1993
/94
177,
486
10
7,53
5
606
89,6
64
74
8,91
3
8,
352
6,74
2
6,22
3
923
37,7
85
1,29
3,09
2
34,2
22
9,00
0
11
,000
1,
222
3,
000
2,
935
97
8
1994
/95
184,
460
11
6,30
0
630
97,6
34
83
8,93
2
8,
593
6,02
8
5,44
7
904
43,5
83
1,46
9,21
4
33,7
11
10,1
50
11,6
95
1,15
2
3,43
9
2,49
7
726
1995
/96
185,
000
11
5,99
0
627
106,
000
89
8,35
0
8,
475
6,13
0
5,51
0
899
44,8
20
1,56
8,70
0
35,0
00
11,1
50
14,9
50
1,34
1
3,68
0
2,65
0
720
1996
/97
182,
110
11
9,25
0
655
110,
850
99
7,40
0
8,
998
5,67
0
4,48
0
790
46,3
60
1,62
9,30
0
35,1
45
11,0
00
14,0
00
1,27
3
2,34
3
1,60
4
685
1997
/98
179,
216
11
0,22
6
615
116,
290
97
1,68
0
8,
356
4,87
1
3,84
5
789
48,8
00
1,76
2,58
0
36,1
18
12,2
65
15,5
45
1,26
7
2,06
2
704
341
1998
/99
190,
429
11
9,73
1
629
118,
043
1,
091,
218
9,
244
4,42
2
3,91
1
884
53,8
94
1,97
1,64
6
36,5
84
11,6
75
15,1
95
1,30
1
1,26
4
678
536
1999
/00
189,
629
12
2,75
1
647
122,
620
1,
182,
500
9,
644
4,28
3
3,80
9
889
58,1
26
2,10
3,42
6
36,1
87
14,5
35
15,1
75
1,04
4
1,22
9
744
605
2000
/01
188,
455
13
2,33
1
702
129,
019
1,
313,
717
10
,182
4,
226
3,
973
94
0
59
,422
2,
211,
781
37
,222
11
,289
16
,392
1,
452
1,
136
45
9
40
4
2001
/02
187,
820
13
4,95
0
719
135,
093
1,
472,
757
10
,902
3,
813
3,
763
98
7
59
,477
2,
247,
990
37
,796
11
,000
16
,000
1,
455
10
2
15
0
1,
475
2002
/03
186,
720
12
4,93
1
669
140,
171
1,
531,
315
10
,925
3,
597
3,
460
96
2
60
,425
2,
343,
054
38
,776
11
,851
17
,035
1,
437
11
8
61
52
0
2003
/04
186,
741
13
2,86
5
711
143,
027
1,
643,
357
11
,490
3,
398
3,
310
97
4
59
,425
2,
305,
326
38
,794
11
,790
16
,890
1,
433
16
13
80
6
2004
/05
187,
823
14
1,98
9
756
146,
789
1,
738,
840
11
,846
3,
003
3,
016
1,
004
59
,082
2,
376,
103
40
,217
11
,159
16
,207
1,
452
20
12
60
0
2005
/06
188,
062
13
9,32
2
741
150,
864
1,
974,
755
13
,090
2,
733
2,
718
99
5
62
,058
2,
462,
574
39
,682
11
,975
17
,100
1,
428
59
57
96
6
2006
/07
184,
218
13
5,66
0
736
153,
534
1,
943,
246
12
,657
2,
729
2,
648
97
0
64
,019
2,
599,
789
40
,610
11
,726
16
,815
1,
434
50
45
90
0
2007
/08
180,
328
13
4,28
6
745
156,
737
2,
054,
817
13
,110
2,
687
2,
614
97
3
62
,962
2,
485,
437
39
,475
11
,590
16
,988
1,
466
75
69
91
3
2008
/09
181,
361
13
5,49
4
747
181,
900
2,
424,
048
13
,326
2,
542
2,
497
98
2
58
,101
2,
354,
412
40
,523
11
,678
17
,658
1,
512
10
0
59
59
0
2009
/10
198,
540
15
5,05
0
781
185,
342
2,
517,
696
13
,584
2,
534
2,
491
98
9
58
,310
2,
495,
098
42
,790
10
,513
12
,959
1,
233
12
1
10
9
90
1
2010
/11
213,
706
17
6,18
6
824
182,
600
2,
508,
044
13
,735
1,
135
1,
238
1,
091
62
,998
2,
718,
226
43
,148
10
,559
14
,418
1,
365
13
5
13
5
1,
000
2011
/12
214,
835
17
9,14
5
834
190,
250
2,
584,
301
13
,584
1,
893
2,
557
1,
351
64
,472
2,
930,
047
45
,447
10
,540
14
,424
1,
369
13
5
13
3
98
5
2012
/13
215,
600
17
9,00
0
830
197,
234
2,
690,
421
13
,641
1,
800
2,
430
1,
350
64
,483
2,
930,
000
45
,438
11
,300
15
,500
1,
371
17
5
15
0
85
7
2013
/14
207,
457
18
1,53
5
875
205,
725
2,
817,
512
13
,696
77
3
1,
004
1,
299
76
,863
3,
315,
939
43
,141
8,
787
12,6
59
1,44
1
130
132
1,01
5
2014
/15
233,
041
20
9,61
2
899
197,
037
2,
586,
287
13
,126
1,
724
2,
227
1,
292
66
,600
3,
063,
000
45
,991
11
,400
16
,530
1,
450
12
3
13
7
1,
114
2015
/16
217,
867
20
8,29
1
956
199,
971
2,
805,
582
14
,030
63
9
61
8
96
7
80
,931
4,
346,
754
53
,709
8,
011
11,6
33
1,45
2
125
129
1,03
2
Tab
le 2
.1: C
ash
Cro
ps: A
rea,
Pro
duct
ion,
and
Yie
ld
Are
a in
Hec
tare
, Pro
duct
ion
in T
ons,
and
Yie
ld in
Kg.
Per
Hec
tare CO
TTO
N O
ILSE
ED P
OTA
TOTO
BAC
CO
SUG
AR
CA
NE
JUTE

STATISTICAL INFORMATION ON NEPALESE AGRICULTURE 2072-73 (2015-16)
14
OIL
SEED
POTA
TOSU
GA
RC
AN
ETO
BA
CC
OD
ISTR
ICT
Are
a Pr
od.
Yie
ld
Are
a Pr
od.
Yie
ld
Are
a Pr
od.
Yie
ld
Are
a Pr
od.
Yie
ld
TAPL
EJU
NG
694
96
1
1,
385
3,
925
48
,345
12,3
17
3
4515
,000
SAN
KH
UW
ASA
BH
A55
3
276
499
1,31
0
16,8
86
12
,890
8290
211
,000
499
SOLU
KH
UM
BU
178
10
9
61
2
10
,150
153,
890
15,1
62
61
2
E. M
OU
NT
AIN
1,42
5
1,
346
94
5
15
,385
219,
121
14,2
43
85
947
11,1
41
PA
NC
HTH
AR
576
44
6
77
4
2,
087
25
,451
12,1
95
22
238
10,8
12
IL
LAM
785
78
5
1,
000
7,
815
13
3,72
2
17
,111
1312
59,
615
TER
HA
THU
M45
0
327
727
2,90
9
33,8
10
11
,623
875
9,37
5
D
HA
NK
UTA
1,06
2
61
1
57
5
2,
070
37
,170
17,9
57
50
990
19,8
00
B
HO
JPU
R28
1
250
890
3,54
0
47,6
41
13
,458
685
14,1
67
K
HO
TAN
G2,
317
2,11
5
913
4,90
9
58,9
08
12
,000
1322
317
,154
159
600
OK
HA
LDH
UN
GA
637
39
6
62
2
1,
494
16
,819
11,2
58
5
438,
600
128
667
UD
AY
APU
R5,
209
4,20
4
807
1,05
0
15,8
66
15
,110
1458
741
,929
89
1125
E. H
ILL
S11
,317
9,13
4
807
25,8
74
36
9,38
8
14
,276
131
2366
18,0
60
35
2674
3JH
APA
3,51
8
4,
176
1,
187
14
,760
221,
843
15,0
30
18
090
4050
,222
MO
RA
NG
12,3
98
12
,979
1,04
7
5,90
0
67,8
50
11
,500
2204
1512
8068
,639
SUN
SAR
I9,
390
15,4
34
1,
644
2,
900
49
,200
16,9
66
40
0024
0000
60,0
00
SA
PTA
RI
4,27
7
3,
303
77
2
5,
570
69
,380
12,4
56
20
080
0040
,000
SIR
AH
A6,
545
2,31
2
353
1,95
0
23,7
90
12
,200
2200
1201
0054
,591
6552
800
E. T
ER
AI
36,1
28
38
,204
1,05
7
31,0
80
43
2,06
3
13
,902
8784
5284
2060
,157
6552
800
E. R
EG
ION
48,8
70
48
,684
996
72,3
39
1,
020,
571
14
,108
9000
5317
3359
,081
100
7878
0D
OLA
KH
A33
2
267
804
4,50
0
59,0
00
13
,111
560
12,0
00
SI
ND
HU
PALC
HO
K83
0
766
923
6,03
5
91,2
91
15
,127
1035
035
,000
RA
SUW
A56
40
71
4
2,
509
35
,898
14,3
08
5
5511
,000
C. M
OU
NT
AIN
1,21
8
1,
073
88
1
13
,044
186,
189
14,2
74
20
465
23,2
50
R
AM
ECH
HA
P82
3
770
936
3,34
1
38,4
75
11
,516
880
10,0
00
SI
ND
HU
LI5,
274
4,66
4
884
2,20
1
33,5
56
15
,246
1262
552
,083
KA
VR
E4,
316
4,26
8
989
9,78
5
184,
622
18,8
68
28
950
33,9
29
B
HA
KTA
PUR
200
35
0
1,
750
1,
336
28
,839
21,5
86
TA
BL
E 2
.2: C
ASH
CR
OPS
by
DIS
TR
ICT
S
[
Are
a in
Ha.
, Pr
od. i
n M
t. a
nd Y
ield
in K
g/ H
a.]
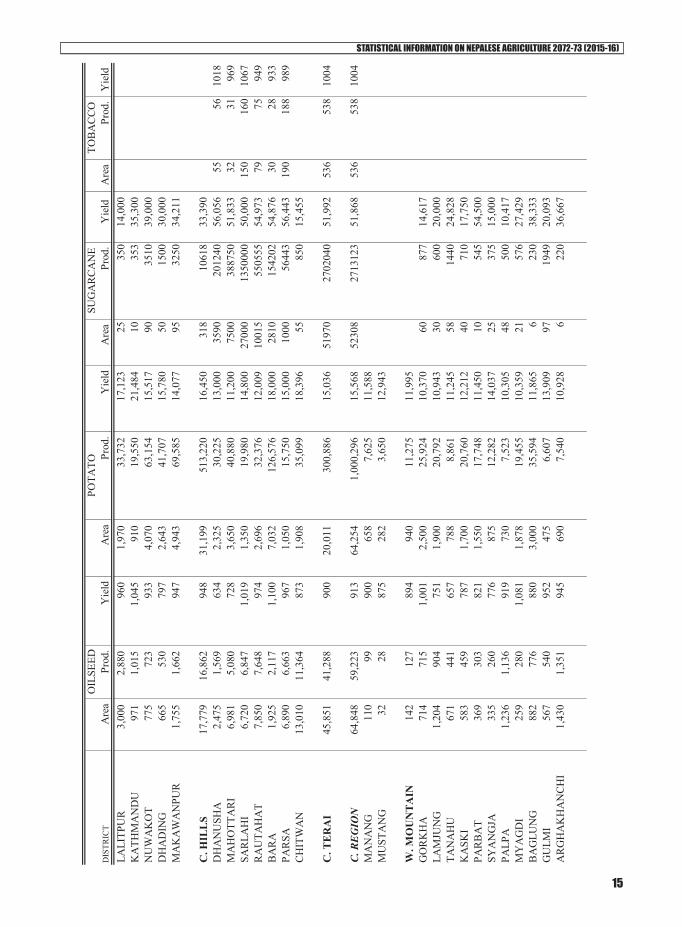
STATISTICAL INFORMATION ON NEPALESE AGRICULTURE 2072-73 (2015-16)
15
OIL
SEED
POTA
TOSU
GA
RC
AN
ETO
BA
CC
OD
ISTR
ICT
Are
a Pr
od.
Yie
ld
Are
a Pr
od.
Yie
ld
Are
a Pr
od.
Yie
ld
Are
a Pr
od.
Yie
ld
LALI
TPU
R3,
000
2,88
0
960
1,97
0
33,7
32
17
,123
2535
014
,000
KA
THM
AN
DU
971
1,
015
1,
045
91
0
19
,550
21,4
84
10
353
35,3
00
N
UW
AK
OT
775
72
3
93
3
4,
070
63
,154
15,5
17
90
3510
39,0
00
D
HA
DIN
G66
5
530
797
2,64
3
41,7
07
15
,780
5015
0030
,000
MA
KA
WA
NPU
R1,
755
1,66
2
947
4,94
3
69,5
85
14
,077
9532
5034
,211
C. H
ILL
S17
,779
16,8
62
94
8
31
,199
513,
220
16,4
50
31
810
618
33,3
90
D
HA
NU
SHA
2,47
5
1,
569
63
4
2,
325
30
,225
13,0
00
35
9020
1240
56,0
56
55
5610
18M
AH
OTT
AR
I6,
981
5,08
0
728
3,65
0
40,8
80
11
,200
7500
3887
5051
,833
3231
969
SAR
LAH
I6,
720
6,84
7
1,01
9
1,35
0
19,9
80
14
,800
2700
013
5000
050
,000
150
160
1067
RA
UTA
HA
T7,
850
7,64
8
974
2,69
6
32,3
76
12
,009
1001
555
0555
54,9
73
79
7594
9B
AR
A1,
925
2,11
7
1,10
0
7,03
2
126,
576
18,0
00
28
1015
4202
54,8
76
30
2893
3PA
RSA
6,89
0
6,
663
96
7
1,
050
15
,750
15,0
00
10
0056
443
56,4
43
19
018
898
9C
HIT
WA
N13
,010
11,3
64
87
3
1,
908
35
,099
18,3
96
55
850
15,4
55
C. T
ER
AI
45,8
51
41
,288
900
20,0
11
30
0,88
6
15
,036
5197
027
0204
051
,992
536
538
1004
C. R
EG
ION
64,8
48
59
,223
913
64,2
54
1,
000,
296
15
,568
5230
827
1312
351
,868
536
538
1004
MA
NA
NG
110
99
900
658
7,62
5
11,5
88
M
UST
AN
G32
28
87
5
28
2
3,
650
12
,943
W. M
OU
NTA
IN14
2
127
894
940
11,2
75
11
,995
GO
RK
HA
714
71
5
1,
001
2,
500
25
,924
10,3
70
60
877
14,6
17
LA
MJU
NG
1,20
4
90
4
75
1
1,
900
20
,792
10,9
43
30
600
20,0
00
TA
NA
HU
671
44
1
65
7
78
8
8,
861
11
,245
5814
4024
,828
KA
SKI
583
45
9
78
7
1,
700
20
,760
12,2
12
40
710
17,7
50
PA
RB
AT
369
30
3
82
1
1,
550
17
,748
11,4
50
10
545
54,5
00
SY
AN
GJA
335
26
0
77
6
87
5
12
,282
14,0
37
25
375
15,0
00
PA
LPA
1,23
6
1,
136
91
9
73
0
7,
523
10
,305
4850
010
,417
MY
AG
DI
259
28
0
1,
081
1,
878
19
,455
10,3
59
21
576
27,4
29
B
AG
LUN
G88
2
776
880
3,00
0
35,5
94
11
,865
623
038
,333
GU
LMI
567
54
0
95
2
47
5
6,
607
13
,909
9719
4920
,093
AR
GH
AK
HA
NC
HI
1,43
0
1,
351
94
5
69
0
7,
540
10
,928
622
036
,667
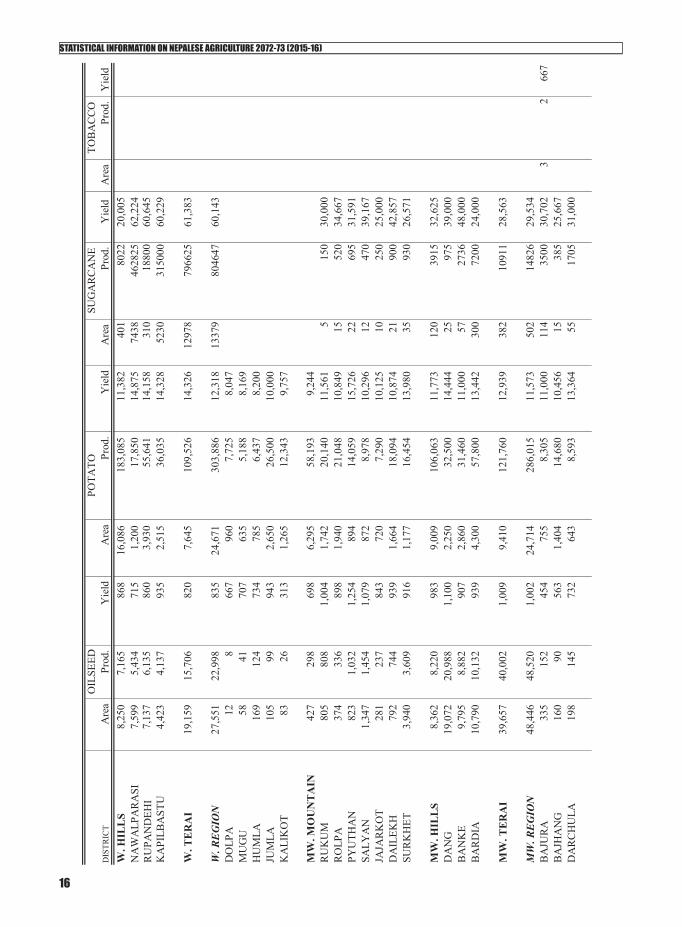
STATISTICAL INFORMATION ON NEPALESE AGRICULTURE 2072-73 (2015-16)
16
OIL
SEED
POTA
TOSU
GA
RC
AN
ETO
BA
CC
OD
ISTR
ICT
Are
a Pr
od.
Yie
ld
Are
a Pr
od.
Yie
ld
Are
a Pr
od.
Yie
ld
Are
a Pr
od.
Yie
ld
W. H
ILL
S8,
250
7,16
5
868
16,0
86
18
3,08
5
11
,382
401
8022
20,0
05
N
AW
ALP
AR
ASI
7,59
9
5,
434
71
5
1,
200
17
,850
14,8
75
74
3846
2825
62,2
24
R
UPA
ND
EHI
7,13
7
6,
135
86
0
3,
930
55
,641
14,1
58
31
018
800
60,6
45
K
API
LBA
STU
4,42
3
4,
137
93
5
2,
515
36
,035
14,3
28
52
3031
5000
60,2
29
W. T
ER
AI
19,1
59
15
,706
820
7,64
5
109,
526
14,3
26
12
978
7966
2561
,383
W. R
EG
ION
27,5
51
22
,998
835
24,6
71
30
3,88
6
12
,318
1337
980
4647
60,1
43
D
OLP
A12
8
667
960
7,72
5
8,04
7
M
UG
U58
41
70
7
63
5
5,
188
8,
169
HU
MLA
169
12
4
73
4
78
5
6,
437
8,
200
JUM
LA10
5
99
94
3
2,
650
26
,500
10,0
00
K
ALI
KO
T83
26
31
3
1,
265
12
,343
9,75
7
MW
. MO
UN
TAIN
427
29
8
69
8
6,
295
58
,193
9,24
4
R
UK
UM
805
80
8
1,
004
1,
742
20
,140
11,5
61
5
150
30,0
00
R
OLP
A37
4
336
898
1,94
0
21,0
48
10
,849
1552
034
,667
PYU
THA
N82
3
1,03
2
1,25
4
894
14,0
59
15
,726
2269
531
,591
SALY
AN
1,34
7
1,
454
1,
079
87
2
8,
978
10
,296
1247
039
,167
JAJA
RK
OT
281
23
7
84
3
72
0
7,
290
10
,125
1025
025
,000
DA
ILEK
H79
2
744
939
1,66
4
18,0
94
10
,874
2190
042
,857
SUR
KH
ET3,
940
3,60
9
916
1,17
7
16,4
54
13
,980
3593
026
,571
MW
. HIL
LS
8,36
2
8,
220
98
3
9,
009
10
6,06
3
11
,773
120
3915
32,6
25
D
AN
G19
,072
20,9
88
1,
100
2,
250
32
,500
14,4
44
25
975
39,0
00
B
AN
KE
9,79
5
8,
882
90
7
2,
860
31
,460
11,0
00
57
2736
48,0
00
B
AR
DIA
10,7
90
10
,132
939
4,30
0
57,8
00
13
,442
300
7200
24,0
00
MW
. TE
RA
I39
,657
40,0
02
1,
009
9,
410
12
1,76
0
12
,939
382
1091
128
,563
MW
. RE
GIO
N48
,446
48,5
20
1,
002
24
,714
286,
015
11,5
73
50
214
826
29,5
34
B
AJU
RA
335
15
2
45
4
75
5
8,
305
11
,000
114
3500
30,7
02
3
266
7B
AJH
AN
G16
0
90
56
3
1,
404
14
,680
10,4
56
15
385
25,6
67
D
AR
CH
ULA
198
14
5
73
2
64
3
8,
593
13
,364
5517
0531
,000
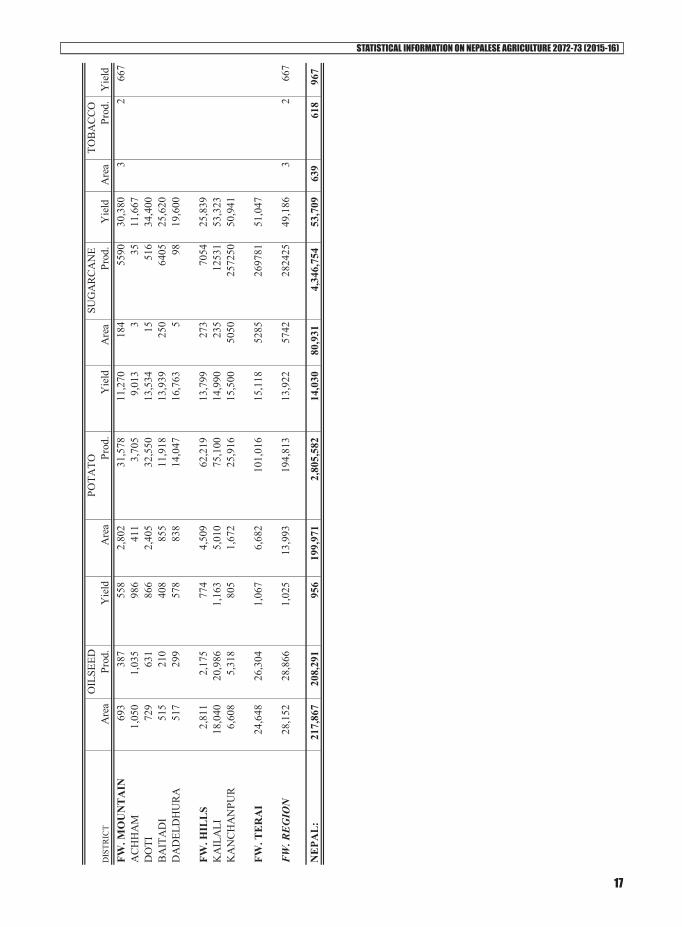
STATISTICAL INFORMATION ON NEPALESE AGRICULTURE 2072-73 (2015-16)
17
OIL
SEED
POTA
TOSU
GA
RC
AN
ETO
BA
CC
OD
ISTR
ICT
Are
a Pr
od.
Yie
ld
Are
a Pr
od.
Yie
ld
Are
a Pr
od.
Yie
ld
Are
a Pr
od.
Yie
ld
FW. M
OU
NTA
IN69
3
387
558
2,80
2
31,5
78
11
,270
184
5590
30,3
80
3
266
7A
CH
HA
M1,
050
1,03
5
986
411
3,70
5
9,01
3
3
3511
,667
DO
TI72
9
631
866
2,40
5
32,5
50
13
,534
1551
634
,400
BA
ITA
DI
515
21
0
40
8
85
5
11
,918
13,9
39
25
064
0525
,620
DA
DEL
DH
UR
A51
7
299
578
838
14,0
47
16
,763
598
19,6
00
FW. H
ILL
S2,
811
2,17
5
774
4,50
9
62,2
19
13
,799
273
7054
25,8
39
K
AIL
ALI
18,0
40
20
,986
1,16
3
5,01
0
75,1
00
14
,990
235
1253
153
,323
KA
NC
HA
NPU
R6,
608
5,31
8
805
1,67
2
25,9
16
15
,500
5050
2572
5050
,941
FW. T
ER
AI
24,6
48
26
,304
1,06
7
6,68
2
101,
016
15,1
18
52
8526
9781
51,0
47
FW
. RE
GIO
N28
,152
28,8
66
1,
025
13
,993
194,
813
13,9
22
57
4228
2425
49,1
86
3
266
7
NEP
AL
:21
7,86
7
208,
291
95
6
19
9,97
1
2,
805,
582
14
,030
80,9
31
4,34
6,75
4
53,7
09
63
9
618
96
7
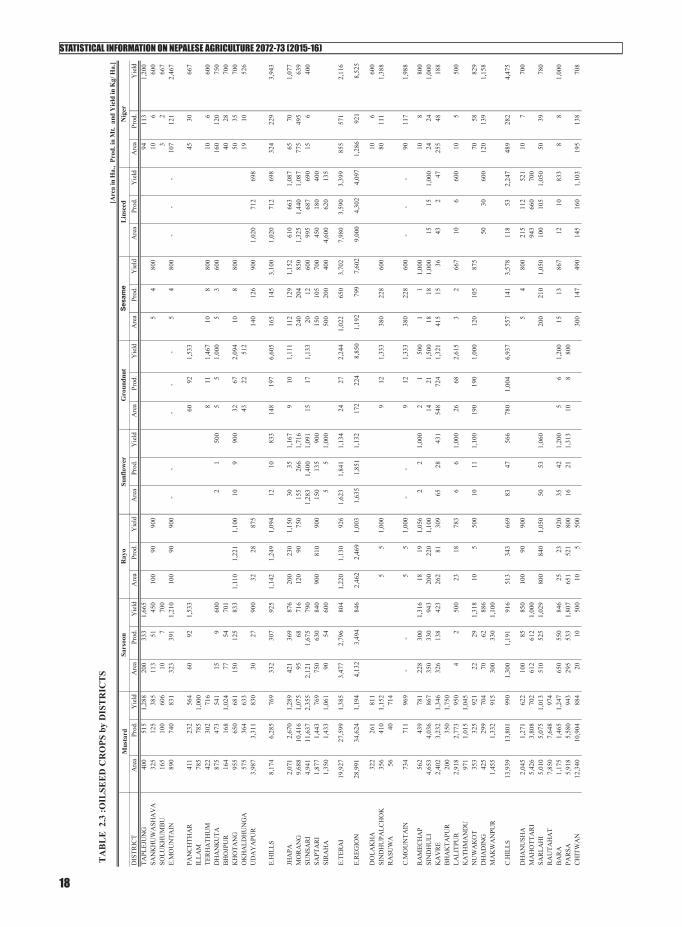
STATISTICAL INFORMATION ON NEPALESE AGRICULTURE 2072-73 (2015-16)
18
DIS
TRIC
TA
rea
Prod
. Y
ield
A
rea
Prod
. Y
ield
A
rea
Prod
. Y
ield
A
rea
Prod
. Y
ield
A
rea
Prod
. Y
ield
A
rea
Prod
. Y
ield
A
rea
Prod
. Y
ield
A
rea
Prod
. Y
ield
TA
PLEJ
UN
G40
0
51
5
1,
288
200
33
3
1,66
5
94
11
3
1,20
0
SA
NK
HU
WA
SHA
VA
325
125
385
11
3
51
45
0
100
90
90
0
5
4
800
10
6
600
SO
LUK
HU
MB
U16
5
10
0
60
6
10
7
70
0
3
2
667
E.
MO
UN
TAIN
890
740
831
32
3
391
1,
210
100
90
90
0
-
-
-
-
-
5
4
80
0
-
-
-
10
7
121
2,
467
PAN
CH
THA
R41
1
23
2
56
4
60
92
1,53
3
60
92
1,
533
45
30
667
IL
LAM
785
785
1,00
0
TE
RH
ATH
UM
422
302
716
8
11
1,46
7
10
8
800
10
6
600
D
HA
NK
UTA
875
473
541
15
9
600
2
1
50
0
5
5
1,00
0
5
3
60
0
160
12
0
750
B
HO
JPU
R16
4
16
8
1,
024
77
54
701
40
28
70
0
KH
OTA
NG
955
650
681
15
0
125
83
3
1,11
0
1,
221
1,10
0
10
9
900
32
67
2,
094
10
8
80
0
50
35
700
O
KH
ALD
HU
NG
A57
5
36
4
63
3
43
22
512
19
10
52
6
UD
AY
APU
R3,
987
3,
311
83
0
30
27
900
32
28
87
5
140
12
6
900
1,
020
712
69
8
E.H
ILLS
8,17
4
6,28
5
769
33
2
307
92
5
1,14
2
1,
249
1,09
4
12
10
83
3
148
19
7
6,60
5
16
5
145
3,
100
1,02
0
71
2
698
32
4
229
3,
943
JHA
PA2,
071
2,
670
1,
289
421
36
9
876
20
0
230
1,
150
30
35
1,16
7
9
10
1,11
1
11
2
129
1,
152
610
66
3
1,08
7
65
70
1,
077
MO
RA
NG
9,68
8
10,4
16
1,07
5
95
68
71
6
120
90
75
0
155
26
6
1,71
6
24
0
204
85
0
1,32
5
1,
440
1,08
7
77
5
495
63
9
SUN
SAR
I4,
941
11
,637
2,
355
2,12
1
1,
675
790
1,
283
1,40
0
1,
091
15
17
1,13
3
20
12
60
0
995
68
7
690
15
6
400
SA
PTA
RI
1,87
7
1,44
3
769
75
0
630
84
0
900
81
0
900
15
0
135
90
0
150
10
5
700
45
0
180
40
0
SIR
AH
A1,
350
1,
433
1,
061
90
54
600
5
5
1,
000
500
20
0
400
4,
600
620
13
5
E.TE
RA
I19
,927
27
,599
1,
385
3,47
7
2,
796
804
1,
220
1,13
0
92
6
1,62
3
1,
841
1,13
4
24
27
2,
244
1,02
2
65
0
3,70
2
7,
980
3,59
0
3,
399
855
57
1
2,11
6
E.R
EGIO
N28
,991
34
,624
1,
194
4,1
32
3,4
94
846
2,4
62
2
,469
1,
003
1
,635
1,8
51
1,13
2
1
72
224
8
,850
1,1
92
799
7,6
02
9,0
00
4
,302
4,0
97
1
,286
9
21
8,52
5
DO
LAK
HA
322
261
811
10
6
600
SI
ND
HU
PALC
HO
K35
6
41
0
1,
152
5
5
1,00
0
9
12
1,33
3
38
0
228
60
0
80
111
1,
388
RA
SUW
A56
40
71
4
C.M
OU
NTA
IN73
4
71
1
96
9
-
-
5
5
1,00
0
-
-
9
12
1,33
3
38
0
228
60
0
-
-
-
90
11
7
1,98
8
RA
MEC
HA
P56
2
43
9
78
1
228
30
0
1,31
6
18
19
1,
056
2
2
1,00
0
2
1
50
0
1
1
1,00
0
10
8
800
SI
ND
HU
LI4,
653
4,
036
86
7
350
33
0
943
20
0
220
1,
100
14
21
1,50
0
18
18
1,
000
15
15
1,
000
24
24
1,00
0
K
AV
RE
2,40
2
3,23
2
1,34
6
32
6
138
42
3
262
81
30
9
65
28
431
54
8
724
1,
321
415
15
36
43
2
47
25
5
48
188
B
HA
KTA
PUR
200
350
1,75
0
LA
LITP
UR
2,91
8
2,77
3
950
4
2
50
0
23
18
783
6
6
1,
000
26
68
2,61
5
3
2
66
7
10
6
600
10
5
500
K
ATH
MA
ND
U97
1
1,
015
1,
045
NU
WA
KO
T35
3
32
5
92
1
22
29
1,31
8
10
5
500
10
11
1,
100
190
19
0
1,00
0
12
0
105
87
5
70
58
829
D
HA
DIN
G42
5
29
9
70
4
70
62
886
50
30
600
12
0
139
1,
158
MA
KW
AN
PUR
1,45
5
1,33
2
915
30
0
330
1,
100
C.H
ILLS
13,9
39
13,8
01
990
1,
300
1,19
1
91
6
513
34
3
669
83
47
56
6
780
1,
004
6,93
7
55
7
141
3,
578
118
53
2,
247
489
28
2
4,47
5
DH
AN
USH
A2,
045
1,
271
62
2
100
85
850
10
0
90
900
5
4
80
0
215
11
2
521
10
7
700
M
AH
OTT
AR
I5,
426
3,
808
70
2
612
61
2
1,00
0
94
3
660
70
0
SAR
LAH
I5,
010
5,
075
1,
013
510
52
5
1,02
9
80
0
840
1,
050
50
53
1,06
0
20
0
210
1,
050
100
10
5
1,05
0
50
39
78
0
RA
UTA
HA
T7,
850
7,
648
97
4
BA
RA
1,17
5
1,46
5
1,24
7
65
0
550
84
6
25
23
920
35
42
1,
200
5
6
1,20
0
15
13
86
7
12
10
83
3
8
8
1,00
0
PA
RSA
5,91
8
5,58
0
943
29
5
533
1,
807
651
52
1
800
16
21
1,
313
10
8
80
0
CH
ITW
AN
12,3
40
10,9
04
884
20
10
50
0
10
5
50
0
300
14
7
490
14
5
160
1,
103
195
13
8
708
Nig
er
TA
BL
E 2
.3 :O
ILSE
ED
CR
OPS
by
DIS
TR
ICT
S
[
Are
a in
Ha.
, Pr
od. i
n M
t. a
nd Y
ield
in K
g/ H
a.]
Mus
tard
Sars
oon
Ray
oSu
nflo
wer
Gro
undn
utSe
sam
eL
inse
ed

STATISTICAL INFORMATION ON NEPALESE AGRICULTURE 2072-73 (2015-16)
19
DIS
TRIC
TA
rea
Prod
. Y
ield
A
rea
Prod
. Y
ield
A
rea
Prod
. Y
ield
A
rea
Prod
. Y
ield
A
rea
Prod
. Y
ield
A
rea
Prod
. Y
ield
A
rea
Prod
. Y
ield
A
rea
Prod
. Y
ield
N
iger
Mus
tard
Sars
oon
Ray
oSu
nflo
wer
Gro
undn
utSe
sam
eL
inse
ed
C.T
ER
AI
39,7
64
35,7
51
899
2,
187
2,31
5
1,
059
1,58
6
1,
479
933
10
1
116
1,
149
15
14
2,00
0
52
0
374
3,
207
1,41
5
1,
047
4,20
8
26
3
192
3,
188
C.R
EG
ION
54,4
37
50,2
63
923
3
,487
3
,506
1,
005
2
,104
1,8
27
868
1
84
163
88
6
804
1,0
30
1
0,27
0
1,4
57
743
7,3
84
1,5
33
1
,100
6,4
54
842
5
91
9,65
0 M
AN
AN
G11
0
99
90
0
MU
STA
NG
32
28
875
W.M
OU
NTA
IN14
2
12
7
89
4
-
-
-
-
-
-
-
-
-
-
-
-
-
-
-
-
-
-
GO
RK
HA
395
362
916
16
16
1,
000
92
78
848
2
2
1,
000
151
20
2
1,33
8
51
49
96
1
2
1
50
0
5
5
1,00
0
LA
MJU
NG
1,13
6
837
737
10
10
1,
000
28
25
893
8
8
1,
000
5
11
2,
200
10
8
80
0
7
5
714
TA
NA
HU
462
262
567
35
23
65
7
4
3
750
10
5
91
867
9
25
2,
778
56
37
661
K
ASK
I44
4
32
6
73
4
50
31
620
12
13
1,
083
40
69
1,72
5
37
20
54
1
PAR
BA
T33
0
28
0
84
8
9
8
889
1
1
1,
000
10
8
80
0
9
3
333
10
3
300
SY
AN
GJA
280
213
761
20
13
65
0
3
3
1,00
0
19
20
1,
053
13
11
84
6
PALP
A1,
082
1,
012
93
5
154
12
4
805
M
YA
GD
I13
7
17
9
1,
307
34
26
765
3
2
66
7
85
73
859
B
AG
LUN
G85
9
75
7
88
1
23
19
826
G
ULM
I42
1
36
2
86
0
144
17
7
1,22
9
2
1
500
A
RG
HA
KH
AN
CH
I1,
088
1,
038
95
4
325
29
6
911
17
17
1,
000
W.H
ILLS
6,63
4
5,62
8
848
82
0
743
90
6
149
13
3
893
14
13
92
9
298
36
9
8,67
2
23
1
191
4,
554
26
38
4,
624
78
50
2,67
5
NA
WA
LPA
RA
SI3,
204
3,
280
1,
024
2,60
0
1,
260
485
95
48
50
5
3
4
1,33
3
90
90
1,
000
90
54
600
1,
510
695
46
0
7
3
429
R
UPA
ND
EHI
5,89
9
5,10
2
865
42
5
468
1,
101
125
90
72
0
110
12
0
1,09
1
50
75
1,
500
28
30
1,07
1
50
0
250
50
0
KA
PILB
AST
U2,
818
2,
766
98
2
1,31
5
1,
056
803
85
90
1,
059
25
50
2,00
0
18
0
175
97
2
W.T
ERA
I11
,921
11
,148
93
5
4,34
0
2,
784
641
22
0
138
62
7
198
21
4
1,08
1
16
5
215
4,
500
118
84
1,
671
2,19
0
1,
120
1,93
2
7
3
42
9
W.R
EGIO
N18
,697
16
,903
90
4
5,1
60
3,5
27
684
3
69
271
73
4
212
2
27
1,07
1
4
63
584
13,
172
349
2
75
6
,225
2
,216
1,1
58
6
,556
85
5
3
3,
104
DO
LPA
12
8
66
7
MU
GU
54
38
704
4
3
75
0
HU
MLA
76
49
645
52
55
1,
058
16
8
50
0
25
12
480
JU
MLA
105
99
943
K
ALI
KO
T35
11
31
4
25
8
32
0
16
4
25
0
7
3
429
MW
.MO
UN
TAIN
282
205
727
-
-
-
-
-
-
77
63
1,
378
36
15
1,50
0
-
-
-
32
15
909
RU
KU
M61
5
64
1
1,
042
165
13
4
812
8
21
2,62
5
12
8
667
5
4
80
0
RO
LPA
347
315
908
16
14
87
5
11
7
63
6
PYU
THA
N72
4
92
1
1,
272
40
56
1,40
0
38
34
89
5
10
14
1,40
0
3
1
33
3
8
6
75
0
SALY
AN
1,00
5
1,15
0
1,14
4
15
13
86
7
212
19
5
920
55
43
78
2
50
44
88
0
10
9
90
0
JAJA
RK
OT
214
168
785
30
46
1,
533
25
15
600
12
8
667
D
AIL
EKH
707
631
893
56
94
1,
679
25
12
480
4
7
1,75
0
SU
RK
HET
3,71
6
3,43
2
924
58
92
1,
586
53
20
377
11
3
65
575
MW
.HIL
LS7,
328
7,
258
99
0
220
20
3
923
38
34
89
5
-
-
390
47
6
10,6
18
17
3
99
3,23
9
17
5
122
3,
955
38
28
3,00
3
DA
NG
18,8
99
20,8
08
1,10
1
55
60
1,
091
20
15
750
5
8
1,
600
13
25
1,92
3
7
7
1,
000
68
60
88
2
5
5
1,00
0
B
AN
KE
6,05
9
5,45
1
900
22
15
68
2
1,41
2
1,
011
716
83
11
0
1,32
5
85
0
950
1,
118
424
29
4
693
95
71
747
85
0
980
1,
153
BA
RD
IYA
9,64
5
9,11
3
945
10
9
900
50
47
94
0
360
37
0
1,02
8
85
12
8
1,50
6
20
10
50
0
620
45
5
734
MW
.TER
AI
34,6
03
35,3
72
1,02
2
87
84
96
6
1,48
2
1,
073
724
44
8
488
1,
089
948
1,
103
4,54
7
45
1
311
2,
193
783
58
6
748
85
5
985
2,
153
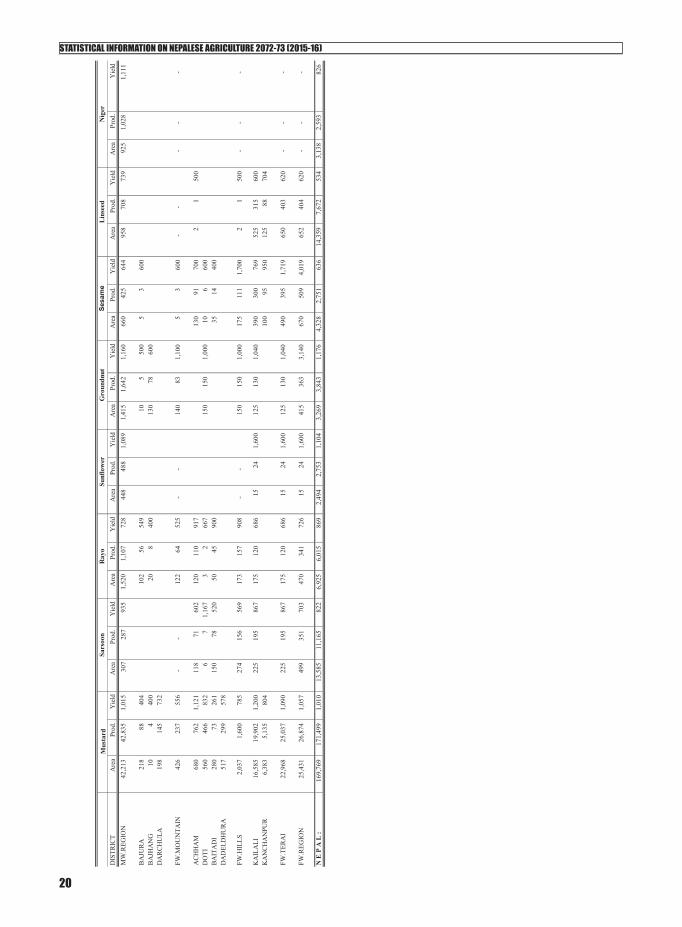
STATISTICAL INFORMATION ON NEPALESE AGRICULTURE 2072-73 (2015-16)
20
DIS
TRIC
TA
rea
Prod
. Y
ield
A
rea
Prod
. Y
ield
A
rea
Prod
. Y
ield
A
rea
Prod
. Y
ield
A
rea
Prod
. Y
ield
A
rea
Prod
. Y
ield
A
rea
Prod
. Y
ield
A
rea
Prod
. Y
ield
N
iger
Mus
tard
Sars
oon
Ray
oSu
nflo
wer
Gro
undn
utSe
sam
eL
inse
ed
MW
.REG
ION
42,2
13
42,8
35
1,01
5
307
287
93
5
1,52
0
1,
107
728
44
8
488
1,
089
1,41
5
1,
642
1,16
0
66
0
425
64
4
958
70
8
739
92
5
1,02
8
1,
111
BA
JUR
A21
8
88
40
4
102
56
54
9
10
5
50
0
5
3
600
B
AJH
AN
G10
4
400
20
8
400
13
0
78
600
D
AR
CH
ULA
198
145
732
FW.M
OU
NTA
IN42
6
23
7
55
6
-
-
122
64
52
5
-
-
140
83
1,
100
5
3
600
-
-
-
-
-
AC
HH
AM
680
762
1,12
1
11
8
71
60
2
120
11
0
917
13
0
91
700
2
1
500
D
OTI
560
466
832
6
7
1,
167
3
2
667
15
0
150
1,
000
10
6
60
0
BA
ITA
DI
280
73
261
15
0
78
52
0
50
45
900
35
14
40
0
DA
DEL
DH
UR
A51
7
29
9
57
8
FW.H
ILLS
2,03
7
1,60
0
785
27
4
156
56
9
173
15
7
908
-
-
15
0
150
1,
000
175
11
1
1,70
0
2
1
500
-
-
-
KA
ILA
LI16
,585
19
,902
1,
200
225
19
5
867
17
5
120
68
6
15
24
1,60
0
12
5
130
1,
040
390
30
0
769
52
5
315
60
0
KA
NC
HA
NPU
R6,
383
5,
135
80
4
100
95
95
0
125
88
70
4
FW.T
ERA
I22
,968
25
,037
1,
090
225
19
5
867
17
5
120
68
6
15
24
1,60
0
12
5
130
1,
040
490
39
5
1,71
9
65
0
403
62
0
-
-
-
FW.R
EGIO
N25
,431
26
,874
1,
057
499
35
1
703
47
0
341
72
6
15
24
1,60
0
41
5
363
3,
140
670
50
9
4,01
9
65
2
404
62
0
-
-
-
N E
P A
L :
169,
769
171,
499
1,01
0
13
,585
11,1
65
82
2
6,92
5
6,
015
869
2,
494
2,75
3
1,
104
3,26
9
3,
843
1,17
6
4,
328
2,75
1
63
6
14,3
59
7,
672
534
3,
138
2,59
3
82
6

STATISTICAL INFORMATION ON NEPALESE AGRICULTURE 2072-73 (2015-16)
21
Table 2.4: Jute by Districts
DISTRICT AREA PROD. YIELD(Ha.) (Mt.) Kg/Ha
ILAM 15 18 1,200
JHAPA 605 605 1,000
MORANG 5,738 8,607 1,500
SUNSARI 1,500 2,250 1,500
SIRAHA 15 15 1,000
SAPTARI 120 120 1,000
UDDYAPUR 18 18 1,000
TOTAL 8,011 11,633 1,452
Table 2.5: Cotton by Districts
DISTRICT AREA PROD. YIELD(Ha.) (Mt.) Kg/Ha
Dang 89 86 966
Banke 26 31 1,192
Bardiya 10 12 1,200
Total 125 129 1,032
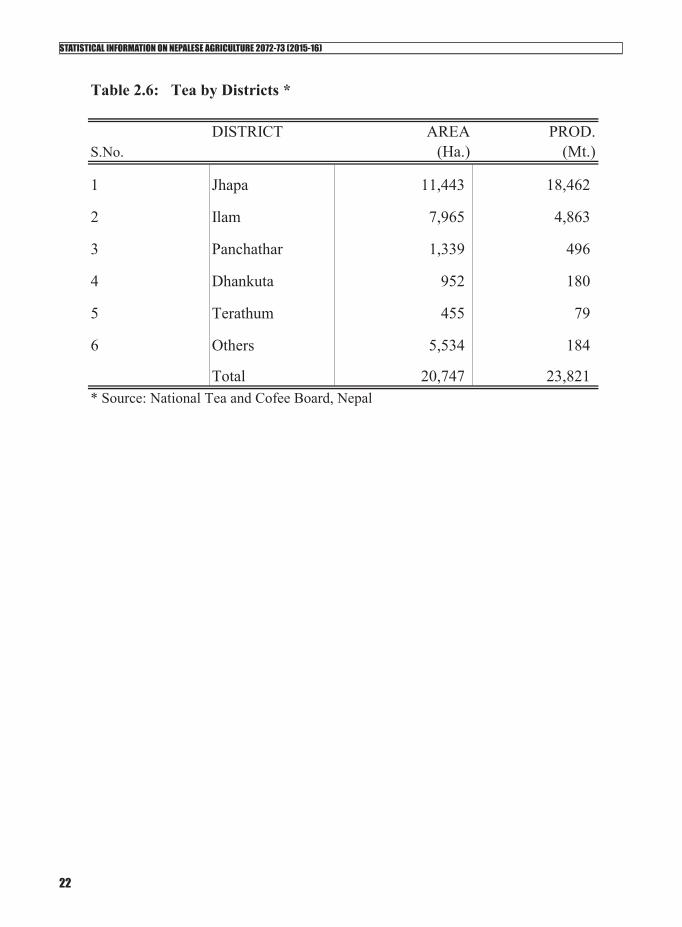
STATISTICAL INFORMATION ON NEPALESE AGRICULTURE 2072-73 (2015-16)
22
Table 2.6: Tea by Districts *
DISTRICT AREA PROD.S.No. (Ha.) (Mt.)
1 Jhapa 11,443 18,462
2 Ilam 7,965 4,863
3 Panchathar 1,339 496
4 Dhankuta 952 180
5 Terathum 455 79
6 Others 5,534 184
Total 20,747 23,821 * Source: National Tea and Cofee Board, Nepal

STATISTICAL INFORMATION ON NEPALESE AGRICULTURE 2072-73 (2015-16)
23
S.N Districts Area Green Beans Production Yield Farmers
1 Arghakhachi 131 29 221 1,656
2 Baglung 62 15 242 1,338
3 Bhojpur 15 2 133 162
4 Dhading 71 15 211 728
5 Gorkha 33 5 152 741
6 Gulmi 160 35 219 1,789
7 Ilam 60 19 317 715
8 Kaski 146 30 205 4,248
9 Kavre 193 38 197 3,261
10 Khotang 21 5 238 278
11 Lalitpur 130 28 215 980
12 Lamjung 131 25 191 1,341
13 Makawanpur 30 12 400 812
14 Myagdi 31 10 323 492
15 Nuwakot 178 29 163 1,379
16 Palpa 119 30 252 2,278
17 Panchthar 271 21 77 900
18 Parbat 92 16 174 1,916
19 Pyuthan 26 10 385 415
20 Rasuwa 44 12 273 362
21 Sankhuwashava 28 31 1,107 368
22 Sindhupalchok 128 19 148 1,578
23 Syangja 310 41 132 3,313
24 Tanahu 38 9 237 621
25 Other 17 Districts 170 46 271 910
Total 2,618 532 203 32,581
Table 2.7: Coffee by Districts [Area in Ha., Prod. in Mt. and Yield in Kg/ Ha.]
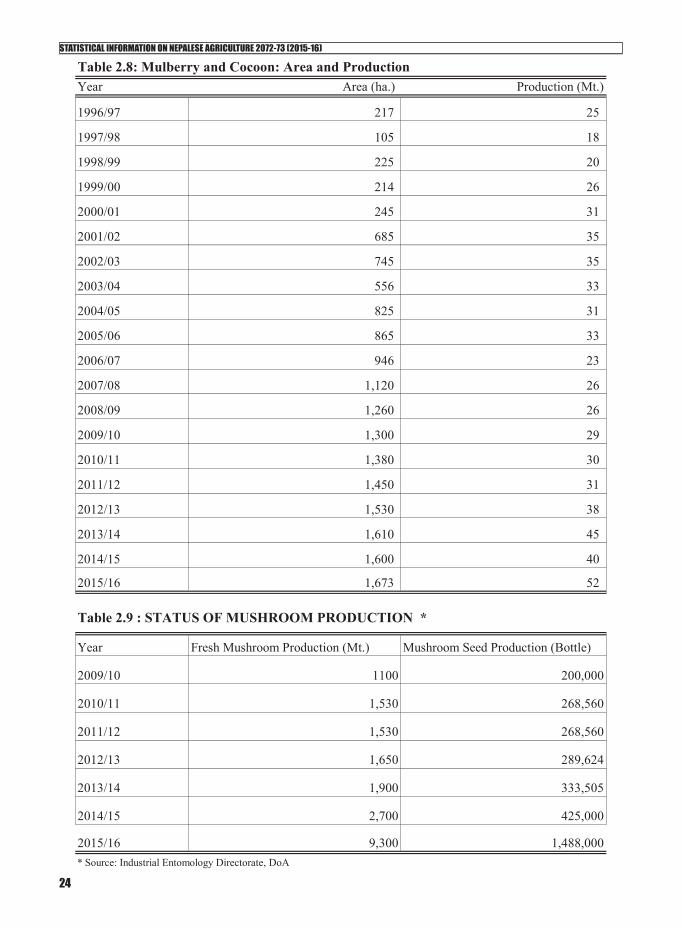
STATISTICAL INFORMATION ON NEPALESE AGRICULTURE 2072-73 (2015-16)
24
Year Area (ha.) Production (Mt.)
1996/97 217 25
1997/98 105 18
1998/99 225 20
1999/00 214 26
2000/01 245 31
2001/02 685 35
2002/03 745 35
2003/04 556 33
2004/05 825 31
2005/06 865 33
2006/07 946 23
2007/08 1,120 26
2008/09 1,260 26
2009/10 1,300 29
2010/11 1,380 30
2011/12 1,450 31
2012/13 1,530 38
2013/14 1,610 45
2014/15 1,600 40
2015/16 1,673 52
Year Fresh Mushroom Production (Mt.) Mushroom Seed Production (Bottle)
2009/10 1100 200,000
2010/11 1,530 268,560
2011/12 1,530 268,560
2012/13 1,650 289,624
2013/14 1,900 333,505
2014/15 2,700 425,000
2015/16 9,300 1,488,000* Source: Industrial Entomology Directorate, DoA
Table 2.8: Mulberry and Cocoon: Area and Production
Table 2.9 : STATUS OF MUSHROOM PRODUCTION *

STATISTICAL INFORMATION ON NEPALESE AGRICULTURE 2072-73 (2015-16)
25
Year Bee Hives (No.) Production (Mt.)
1996/97 588 60
1997/98 800 100
1998/99 1,000 129
1999/00 1,050 150
2000/01 1,100 155
2001/02 126,884 529
2002/03 127,501 530
2003/04 130,000 577
2004/05 130,000 600
2005/06 125,100 650
2006/07 124,500 650
2007/08 124,500 1,000
2008/09 124,500 650
2009/10 140,000 1,100
2010/11 140,850 1,365
2011/12 156,000 1,500
2012/13 169,000 1,625
2013/14 170,000 1,650
2014/15 225,000 3,000
2015/16 232,000 3,500 Note: In the year 2001/02, the figure included natural Bee hives and its production.
Table 2.10: BEE KEEPING AND HONEY PRODUCTION

STATISTICAL INFORMATION ON NEPALESE AGRICULTURE 2072-73 (2015-16)
26
Tot
al
Are
aPr
oduc
tive
Are
aPr
odn.
Yie
ldA
rea
Prod
n.Y
ield
Are
aPr
odn.
Yie
ldA
rea
Prod
n.Y
ield
Are
aPr
odn.
Yie
ld
Tapl
ejun
g4,
500
4,
150
2,
490
60
0
23
0
3,
600
15,6
52
56
392
7,
000
25
26
2
10,4
80
8
45
5,
625
Sank
huw
asab
ha2,
824
1,
900
1,
108
58
3
11
2
1,
008
9,00
0
32
24
0
7,50
0
40
320
8,
000
43
182
4,23
3
Solu
khum
bu15
7
68
40
588
75
395
5,
267
35
245
7,
000
10
80
8,
000
14
91
6,50
0
Panc
htha
r1,
950
1,
731
66
7
38
5
66
9
8,
843
13,2
18
37
183
4,
937
58
46
5
8,01
2
195
1,21
1
6,21
0
Ilam
1,60
0
1,16
3
558
480
3,23
3
45,9
94
14
,226
50
60
0
12,0
00
120
1,
996
16,6
33
16
2
89
7
5,
537
Terh
athu
m73
0
63
7
25
3
39
8
21
2
3,
277
15,4
58
15
150
10
,000
4
32
8,
000
17
68
4,00
0
Dha
nkut
a27
5
24
0
14
5
60
4
26
0
4,
933
18,9
73
60
376
6,
267
75
82
4
10,9
87
75
285
3,80
0
Bho
jpur
412
374
157
420
264
2,10
8
8,
000
22
159
7,
227
112
90
80
4
45
155
3,44
4
Kho
tang
1,32
0
940
564
600
240
1,92
0
8,
000
25
250
10
,000
10
100
10
,000
30
15
0
5,
000
Okh
aldh
unga
38
15
6
400
18
185
10
,278
6
36
6,54
5
6
36
6,
545
40
190
4,75
0
Uda
yapu
r33
22
14
620
122
1,85
5
15
,204
54
58
6
10,8
50
76
65
4
8,60
0
36
14
1
3,
924
Jhap
a-
-
34
3
4,
607
13,4
50
14
70
5,00
0
20
4
510
2,
500
Mor
ang
65
60
62
1,
028
1,
280
11
,520
9,00
0
510
89
3
1,75
0
35
0
1,22
5
3,
500
1,
350
6,
925
5,
130
Suns
ari
-
-
450
4,23
5
9,
411
20
0
1,06
8
5,
338
300
50
4
1,68
0
160
870
5,43
8
Sapt
ari
11
44
4,
000
11
5
805
7,
000
270
3,
240
12,0
00
20
0
89
9
4,
495
Sira
ha-
-
15
12
4
8,26
7
59
29
5
5,00
0
14
243
18
,000
61
39
7
6,
500
Dol
kha
562
100
38
38
2
50
60
0
12,0
00
35
280
8,
000
10
12
0
12,0
00
32
209
6,53
1
Sind
hupa
lcho
k13
3
49
39
800
567
5,61
3
9,
899
29
0
2,03
8
7,
028
186
1,
480
7,95
7
13
71
5,
462
Ras
uwa
5
4
2
375
203
1,32
0
6,
502
98
630
6,
429
34
19
2
5,64
7
20
95
4,
750
Ram
echa
p90
68
28
405
85
1,53
0
18
,000
69
22
1
3,20
3
39
858
22
,000
71
27
3
3,
845
Sind
huli
27
20
14
70
0
58
3
7,
971
13,6
72
#D
IV/0
!41
5
4,56
5
11
,000
Kav
re68
59
61
1,03
7
69
725
10
,507
595
5,
605
9,42
0
55
561
10
,200
603
3,13
5
5,19
9
Bha
ktap
ur10
1
1,
616
16,0
00
50
400
8,
000
29
17
4
6,00
0
45
27
5
6,
120
Lalit
pur
3
2
2
1,00
0
113
1,24
4
11
,000
10
10
1,
000
10
10
1,
000
2
12
8,
000
Kat
hman
du4
3
1
33
3
5
100
20
,000
2
32
16,0
00
3
120
40
,000
5
35
7,00
0
Tabl
e 2.
11: M
ajor
Spi
ce C
rops
by
dist
rict
s
Are
a in
Hec
tare
, Pro
duct
ion
in T
on, Y
ield
in T
on/h
a.
Dis
tric
tsC
arda
mom
Gin
ger
Gar
licT
urm
eric
Chi
lli

STATISTICAL INFORMATION ON NEPALESE AGRICULTURE 2072-73 (2015-16)
27
Nuw
akot
65
45
25
56
0
25
7
9,
370
36,4
59
72
450
6,
250
48
40
8
8,50
0
61
27
1
4,
439
Dha
ding
18
12
6
500
222
3,10
8
14
,000
65
72
1,
100
13
10
0
7,68
1
194
995
5,12
9
Mak
awan
pur
14
6
0
71
42
1
7,
578
18,0
00
84
321
3,
821
84
1,
010
12,0
24
10
46
4,60
0
Dha
nush
a-
-
56
46
7
8,34
6
77
24
2
3,16
0
15
2
307
2,
027
24
5
1,
512
6,
184
Mah
otta
ri-
-
38
24
7
6,50
0
60
24
0
4,00
0
11
0
1,04
5
9,
500
15
0
93
5
6,
233
Sarla
hi-
-
70
98
0
14,0
00
27
184
6,
800
105
1,
470
14,0
00
65
393
6,03
8
Rau
that
-
-
105
1,57
5
15
,000
95
76
0
8,00
0
27
0
8,10
0
30
,000
260
1,44
5
5,55
8
Bar
a-
-
25
19
1
7,64
0
300
1,
800
6,00
0
85
853
10
,035
201
1,65
6
8,23
9
Pars
a-
-
10
80
8,00
0
85
59
5
7,00
0
25
225
9,
000
40
220
5,50
0
Chi
twan
-
-
166
1,64
7
9,
922
10
1
509
5,
040
65
42
2
6,49
2
135
830
6,14
4
Man
ang
-
-
-
-
13
73
5,61
5
-
-
-
-
Mus
tang
-
-
-
-
12
87
7,25
0
-
-
5
22
4,40
0
Gor
kha
155
100
35
35
0
11
6
1,
219
10,5
09
45
248
5,
511
29
24
9
8,58
6
44
23
2
5,
273
Lam
jung
304
180
63
35
0
25
0
2,
375
9,50
0
60
30
0
5,00
0
85
680
8,
000
12
60
5,00
0
Tana
hun
9
2
1
690
595
7,58
7
12
,751
166
77
0
4,63
9
16
9
777
4,
598
84
490
5,83
3
Kas
ki23
11
1
57
64
3
5,
128
7,97
5
105
55
7
5,30
0
31
0
1,85
0
5,
968
11
0
68
0
6,
179
Parb
at15
4
2
529
40
450
11
,250
22
20
0
9,09
1
25
240
9,
600
11
65
5,90
9
Syan
gja
10
5
3
50
0
65
0
7,
020
10,8
00
50
355
7,
100
62
84
2
13,5
81
36
190
5,27
8
Palp
a3
2
1
26
9
1,
260
14
,853
11,7
88
74
300
4,
054
72
61
6
8,55
6
47
29
1
6,
191
Mya
gdi
18
12
5
433
35
293
8,
371
33
253
7,
667
19
12
4
6,52
6
44
13
9
3,
159
Bag
lung
92
7
3
47
1
79
1,
121
14,1
90
64
587
9,
172
57
52
3
9,17
5
16
10
1
6,
313
Gul
mi
2
1
0
400
332
3,18
1
9,
582
28
252
9,
000
91
75
6
8,30
8
16
85
5,
313
Arg
hakh
achi
5
3
3
970
396
3,93
0
9,
924
11
5
345
3,
000
144
1,
152
8,00
0
32
23
0
7,
302
Naw
alpa
rasi
-
-
1,31
0
13,3
62
10
,200
55
25
3
4,60
0
60
606
10
,100
70
48
4
6,
914
Rup
ende
hi-
-
-
66
93
7
14,2
00
45
36
6
8,14
0
19
98
5,
158
Kap
ilbas
tu-
-
-
280
1,
120
4,00
0
6
30
5,
000
45
0
2,
750
6,
111
Dol
pa-
-
5
5
1,
000
12
45
3,75
0
1
1
1,00
0
26
26
1,
000
Mug
u-
-
9
8
84
1
34
43
1,25
0
6
9
1,55
0
60
67
1,
120
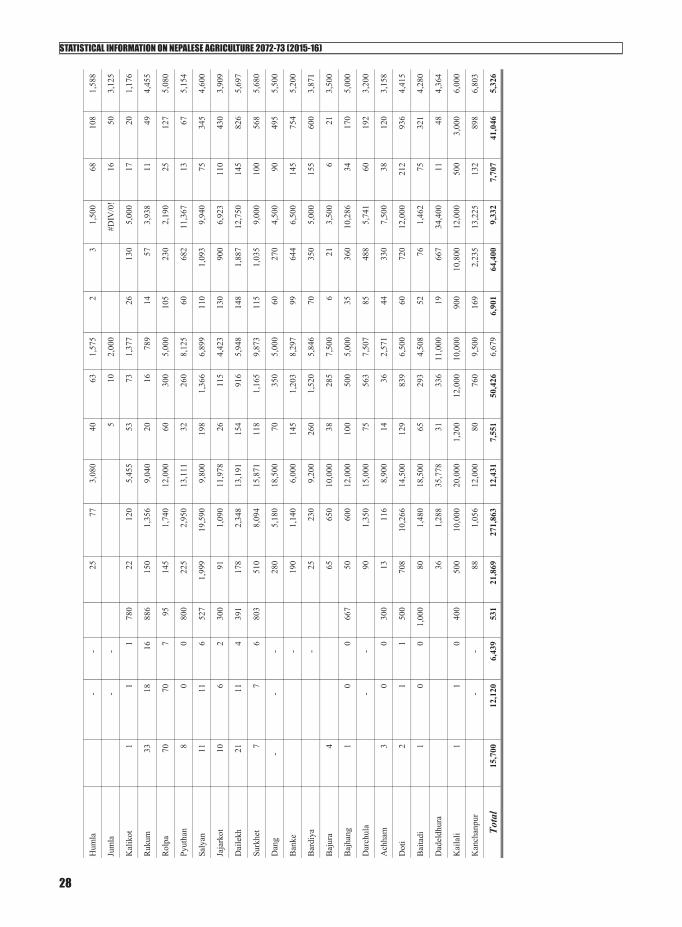
STATISTICAL INFORMATION ON NEPALESE AGRICULTURE 2072-73 (2015-16)
28
Hum
la-
-
25
77
3,08
0
40
63
1,
575
2
3
1,
500
68
108
1,58
8
Jum
la-
-
5
10
2,
000
#DIV
/0!
16
50
3,
125
Kal
ikot
1
1
1
780
22
120
5,
455
53
73
1,37
7
26
130
5,
000
17
20
1,17
6
Ruk
um33
18
16
886
150
1,35
6
9,
040
20
16
789
14
57
3,93
8
11
49
4,
455
Rol
pa70
70
7
95
14
5
1,
740
12,0
00
60
300
5,
000
105
23
0
2,19
0
25
12
7
5,
080
Pyut
han
8
0
0
800
225
2,95
0
13
,111
32
26
0
8,12
5
60
682
11
,367
13
67
5,
154
Saly
an11
11
6
52
7
1,
999
19
,590
9,80
0
198
1,
366
6,89
9
11
0
1,09
3
9,
940
75
345
4,60
0
Jaja
rkot
10
6
2
30
0
91
1,
090
11,9
78
26
115
4,
423
130
90
0
6,92
3
110
430
3,90
9
Dai
lekh
21
11
4
391
178
2,34
8
13
,191
154
91
6
5,94
8
14
8
1,88
7
12
,750
145
826
5,69
7
Surk
het
7
7
6
803
510
8,09
4
15
,871
118
1,
165
9,87
3
11
5
1,03
5
9,
000
10
0
56
8
5,
680
Dan
g-
-
-
280
5,18
0
18
,500
70
35
0
5,00
0
60
270
4,
500
90
495
5,50
0
Ban
ke-
190
1,14
0
6,
000
14
5
1,20
3
8,
297
99
64
4
6,50
0
145
754
5,20
0
Bar
diya
-
25
23
0
9,20
0
260
1,
520
5,84
6
70
350
5,
000
15
5
60
0
3,
871
Baj
ura
4
65
65
0
10,0
00
38
285
7,
500
6
21
3,50
0
6
21
3,50
0
Baj
hang
1
0
0
667
50
600
12
,000
100
50
0
5,00
0
35
360
10
,286
34
17
0
5,
000
Dar
chul
a-
-
90
1,
350
15,0
00
75
563
7,
507
85
48
8
5,74
1
60
19
2
3,
200
Ach
ham
3
0
0
300
13
116
8,
900
14
36
2,57
1
44
330
7,
500
38
120
3,15
8
Dot
i2
1
1
50
0
70
8
10
,266
14,5
00
12
9
839
6,
500
60
72
0
12,0
00
21
2
93
6
4,
415
Bai
tadi
1
0
0
1,00
0
80
1,48
0
18
,500
65
29
3
4,50
8
52
76
1,46
2
75
32
1
4,
280
Dad
eldh
ura
36
1,28
8
35
,778
31
33
6
11,0
00
19
66
7
34,4
00
11
48
4,36
4
Kai
lali
1
1
0
400
500
10,0
00
20
,000
1,20
0
12
,000
10
,000
90
0
10,8
00
12,0
00
50
0
3,
000
6,
000
Kan
chan
pur
-
-
88
1,05
6
12
,000
80
76
0
9,50
0
16
9
2,23
5
13
,225
132
898
6,80
3
Tota
l15
,700
12
,120
6,
439
53
1
21
,869
27
1,86
3
12,4
31
7,
551
50,4
26
6,67
9
6,
901
64,4
00
9,33
2
7,70
7
41,0
46
5,32
6

STATISTICAL INFORMATION ON NEPALESE AGRICULTURE 2072-73 (2015-16)
29
3. PULSE CROPS

STATISTICAL INFORMATION ON NEPALESE AGRICULTURE 2072-73 (2015-16)
30

STATISTICAL INFORMATION ON NEPALESE AGRICULTURE 2072-73 (2015-16)
31
Yea
r
Are
aPr
odn
Yie
ldA
rea
Prod
nY
ield
Are
aPr
odn
Yie
ldA
rea
Prod
nY
ield
Are
aPr
odn
Yie
ldA
rea
Prod
nY
ield
Are
aPr
odn
Yie
ldA
rea
Prod
nY
ield
Are
aPr
odn
Yie
ld
2000
/01
1787
0614
3084
801
1459
012
148
833
2403
520
936
871
3025
221
599
714
8744
6796
777
8446
5241
621
2072
317
470
843
2072
415
969
771
3062
2024
3243
794
2001
/02
180,
210
148,
384
823
13
,183
11,0
29
83
7
25,0
15
23
,494
939
31,2
12
22
,826
731
7,33
8
5,
536
754
7,
433
5,20
4
70
0
20
,968
18,0
22
86
0
21,7
52
15
,905
731
30
7,11
1
25
0,40
0
81
5
2002
/03
183,
294
149,
963
818
9,
738
7,65
4
78
6
23,8
00
23
,300
979
30,8
44
24
,063
780
6,25
5
5,
389
862
7,
860
5,58
9
71
1
21
,450
18,6
81
87
1
27,9
29
22
,261
797
31
1,17
0
25
6,90
0
82
6
2003
/04
187,
380
158,
671
847
9,
560
8,11
4
84
9
22,4
59
19
,468
867
32,1
52
25
,501
793
6,73
4
5,
001
743
7,
720
5,51
4
71
4
22
,073
19,3
63
87
7
27,9
32
23
,728
849
31
6,01
0
26
5,36
0
84
0
2004
/05
188,
895
160,
716
851
11
,770
10,4
39
88
7
19,3
37
17
,841
923
32,4
33
28
,028
864
5,86
3
4,
464
761
7,
836
5,68
0
72
5
22
,559
19,8
20
87
9
28,1
13
24
,324
865
31
6,80
6
27
1,31
2
85
6
2005
/06
183,
170
157,
963
862
10
,163
8,40
5
82
7
20,7
03
19
,085
922
32,8
49
25
,459
775
6,33
3
4,
791
757
8,
003
5,82
7
72
8
23
,100
20,5
80
89
1
29,2
40
25
,339
867
31
3,56
1
26
7,44
9
85
3
2006
/07
189,
181
164,
694
871
9,
972
8,08
5
81
1
20,9
88
19
,245
917
32,7
79
25
,379
774
6,18
3
4,
706
761
7,
970
5,89
5
74
0
23
,214
20,9
61
90
3
29,2
70
25
,410
868
31
9,55
7
27
4,37
5
85
9
2007
/08
189,
497
161,
147
850
9,
238
7,31
9
79
2
21,3
63
18
,841
882
32,8
74
25
,672
781
6,64
0
4,
927
742
7,
832
5,37
7
68
7
23
,214
21,0
03
90
5
29,7
73
25
,490
856
32
0,43
1
26
9,77
6
84
2
2008
/09
183,
798
147,
725
804
8,
479
6,87
7
81
1
20,8
83
18
,152
869
33,1
23
25
,964
784
5,87
0
4,
335
739
7,
845
5,38
5
68
6
23
,478
21,4
56
91
4
29,7
93
25
,490
856
31
3,26
9
25
5,38
4
81
5
2009
/10
187,
437
151,
758
810
8,
647
7,06
5
81
7
21,2
96
18
,648
876
33,7
79
26
,673
790
5,98
6
4,
453
744
8,
000
5,53
2
69
2
23
,943
22,0
42
92
1
30,3
83
26
,186
862
31
9,47
1
26
2,35
7
82
1
2010
/11
207,
591
206,
869
997
9,
124
8,13
0
89
1
17,4
69
14
,107
808
27,5
18
22
,530
819
9,21
3
8,
674
941
7,
901
5,80
8
73
5
29
,317
28,3
18
96
6
26,2
48
23
,924
911
33
4,38
0
31
8,36
2
95
2
2011
/12
207,
630
208,
201
1,00
3
9,
154
8,19
2
89
5
17,4
71
14
,082
806
27,4
96
22
,482
818
9,17
6
8,
671
945
7,
867
5,85
5
74
4
29
,282
28,2
70
96
5
26,2
47
24
,018
915
33
4,32
3
31
9,77
0
95
6
2012
/13
206,
512
226,
923
1,09
9
9,
761
9,68
5
99
2
17,4
54
16
,453
943
25,0
43
21
,190
846
11,5
17
13
,936
1,21
0
6,
331
5,42
4
85
7
24
,623
28,8
61
1,
172
31,2
56
33
,312
1,06
6
33
2,49
7
35
5,78
4
1,
070
2013
/14
205,
939
226,
830
1,10
1
9,
341
9,38
0
1,
004
17,0
06
16
,415
965
23,3
12
19
,383
831
11,4
95
14
,103
1,22
7
6,
233
5,66
2
90
8
23
,757
28,2
37
1,
189
30,6
44
32
,817
1,07
1
32
8,73
8
35
2,47
3
1,
072
2014
/15
204,
475
227,
492
1,11
3
9,
274
9,40
8
1,
014
16,8
85
16
,462
975
23,1
47
19
,439
840
11,4
13
14
,144
1,23
9
6,
188
5,67
8
91
8
23
,588
28,3
19
1,
201
30,4
27
32
,913
1,08
2
32
6,40
0
35
3,50
0
1,
083
2015
/16
205,
939
253,
041
1,11
3
9,
883
10,9
14
1,
104
17,0
06
16
,415
975
23,3
12
19
,402
840
8,07
5
9,
354
1,23
9
6,
319
5,66
2
91
8
23
,446
28,9
17
1,
201
30,6
44
32
,817
1,08
2
32
7,32
1
36
3,69
3
1,
083
Hor
se G
ram
Soya
bean
Oth
ers +
Tot
al
Tab
le 3
.1: P
UL
SE C
RO
PS
[A
rea
in H
ecta
re, P
rodu
ctio
n in
Met
ric
Ton
and
Yie
ld in
Kg
per
Hec
tare
]Le
ntil
Chi
ckpe
aPi
geon
Pea
Bla
ck G
ram
Gra
ss P
ea
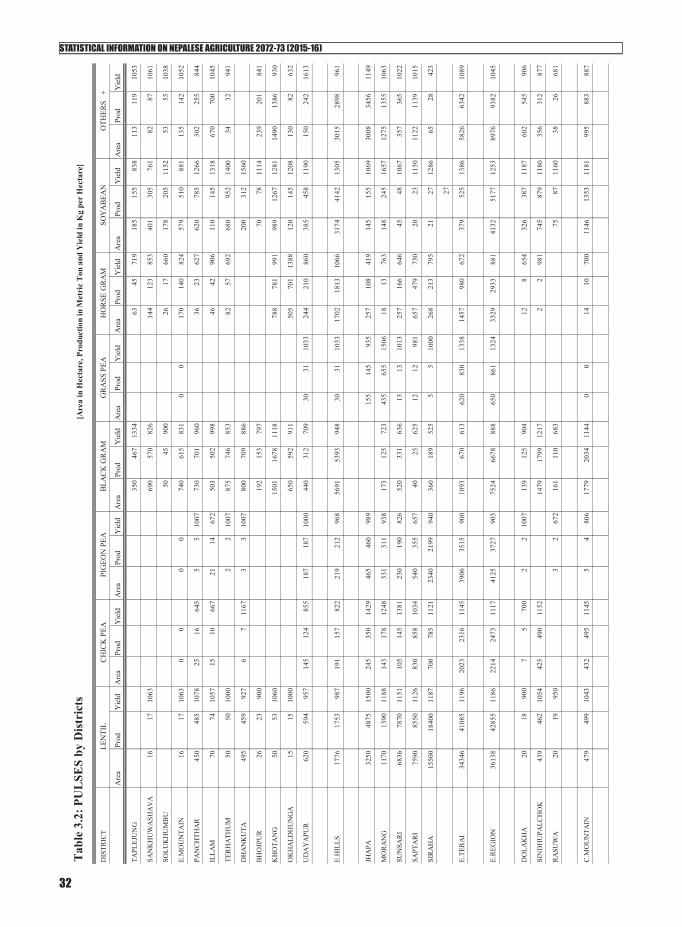
STATISTICAL INFORMATION ON NEPALESE AGRICULTURE 2072-73 (2015-16)
32
DIS
TRIC
T
Are
aPr
odY
ield
Are
aPr
odY
ield
Are
aPr
odY
ield
Are
aPr
odY
ield
Are
aPr
odY
ield
Are
aPr
odY
ield
Are
aPr
odY
ield
Are
aPr
odY
ield
TAPL
EJU
NG
350
467
1334
6345
719
185
155
838
113
119
1053
SAN
KH
UW
ASH
AV
A16
1710
6369
057
082
614
412
385
340
130
576
182
8710
61
SOLU
KH
UM
BU
5045
900
2617
660
178
205
1152
5355
1038
E.M
OU
NTA
IN16
1710
630
00
074
061
583
10
017
014
082
457
951
088
113
514
210
52
PAN
CH
THA
R45
048
510
7825
1664
55
510
0773
070
196
036
2362
762
078
512
6630
225
584
4
ILLA
M70
7410
5715
1066
721
1467
250
350
299
846
4290
611
014
513
1867
070
010
45
TER
HA
THU
M50
5010
002
210
0787
574
685
382
5769
268
095
214
0034
3294
1
DH
AN
KU
TA49
545
992
76
711
673
310
0780
070
988
620
031
215
60
BH
OJP
UR
2623
900
192
153
797
7078
1114
239
201
841
KH
OTA
NG
5053
1060
1501
1678
1118
788
781
991
989
1267
1281
1490
1386
930
OK
HA
LDH
UN
GA
1515
1000
650
592
911
505
701
1388
120
145
1208
130
8263
2
UD
AY
APU
R62
059
495
714
512
485
518
718
710
0044
031
270
930
3110
3324
421
086
038
545
811
9015
024
216
13
E.H
ILLS
1776
1753
987
191
157
822
219
212
968
5691
5393
948
3031
1033
1702
1813
1066
3174
4142
1305
3015
2898
961
JHA
PA32
5048
7515
0024
535
014
2946
546
098
915
514
593
525
710
841
914
515
510
6930
0834
5611
49
MO
RA
NG
1170
1390
1188
143
178
1248
331
311
938
173
125
723
435
655
1506
1813
763
148
245
1657
1275
1355
1063
SUN
SAR
I68
3678
7011
5110
514
513
8123
019
082
652
033
163
613
1310
1325
716
664
645
4810
6735
736
510
22
SAPT
AR
I75
9085
5011
2683
085
810
3454
035
565
740
2562
512
1298
165
747
973
020
2311
5011
2211
3910
15
SIR
AH
A15
500
1840
011
8770
078
511
2123
4021
9994
036
018
952
55
510
0026
821
379
521
2712
8665
2842
3
27
E.TE
RA
I34
346
4108
511
9620
2323
1611
4539
0635
1590
010
9367
061
362
083
013
3814
5798
067
237
952
513
8658
2663
4210
89
E.R
EGIO
N36
138
4285
511
8622
1424
7311
1741
2537
2790
375
2466
7888
865
086
113
2433
2929
3388
141
3251
7712
5389
7693
8210
45
DO
LAK
HA
2018
900
75
700
22
1007
139
125
904
128
654
326
387
1187
602
545
906
SIN
DH
UPA
LCH
OK
439
462
1054
425
490
1152
1479
1799
1217
22
981
745
879
1180
356
312
877
RA
SUW
A20
1995
03
267
216
111
068
375
8711
6038
2668
1
C.M
OU
NTA
IN47
949
910
4343
249
511
455
480
617
7920
3411
440
014
1070
011
4613
5311
8199
588
388
7
OTH
ERS
+
Tab
le 3
.2: P
UL
SES
by D
istri
cts
[Are
a in
Hec
tare
, Pro
duct
ion
in M
etri
c T
on a
nd Y
ield
in K
g pe
r H
ecta
re]
LEN
TIL
CH
ICK
PEA
PIG
EON
PEA
BLA
CK
GR
AM
GR
ASS
PEA
HO
RSE
GR
AM
SOY
ABE
AN

STATISTICAL INFORMATION ON NEPALESE AGRICULTURE 2072-73 (2015-16)
33
DIS
TRIC
T
Are
aPr
odY
ield
Are
aPr
odY
ield
Are
aPr
odY
ield
Are
aPr
odY
ield
Are
aPr
odY
ield
Are
aPr
odY
ield
Are
aPr
odY
ield
Are
aPr
odY
ield
OTH
ERS
+LE
NTI
LC
HIC
K P
EAPI
GEO
N P
EABL
AC
K G
RA
MG
RA
SS P
EAH
OR
SE G
RA
MSO
YA
BEA
N
RA
MEC
HA
P10
880
620
1050
45
510
0718
417
494
631
2270
536
534
895
337
738
010
07
SIN
DH
ULI
526
736
1399
3533
943
260
208
800
1512
800
177
165
931
457
578
1265
755
731
969
KA
VR
E50
5511
0052
4179
050
5511
0025
718
873
015
0018
0512
0314
5011
9082
1
BH
AK
TAPU
R51
6111
9615
1491
520
2512
2610
112
512
3815
513
587
1
LALI
TPU
R12
1512
2666
4568
279
6582
322
530
113
3827
524
990
4
KA
THM
AN
DU
307
315
1026
1615
938
3629
806
245
385
1571
632
578
914
NU
WA
KO
T85
106
1247
4641
900
77
1007
265
225
849
54
777
587
678
1155
345
275
798
DH
AD
ING
209
250
1196
105
504
688
544
791
96
660
458
589
1286
4126
626
MA
KW
AN
PUR
310
375
1210
2828
982
55
1007
382
378
988
6244
712
1410
1789
1269
234
250
1068
C.H
ILLS
1550
1913
1234
269
222
827
1212
1007
1781
1529
859
1512
800
511
407
797
4983
6250
1254
3887
3434
884
DH
AN
USH
A17
1921
1112
2821
524
811
5313
2612
0390
726
020
880
012
212
199
221
2411
4311
213
211
79
MA
HO
TTA
RI
3226
4103
1272
148
158
1068
1050
1010
962
229
209
909
5040
800
6275
1210
1423
1227
862
SAR
LAH
I39
2344
9511
4615
419
812
8636
7136
4299
225
525
710
0775
085
411
3936
3810
5640
241
410
30
RA
UTA
HA
T21
039
2535
312
0510
211
511
2847
559
612
5456
3460
434
545
813
2818
2111
6725
019
076
1
BA
RA
1512
418
401
1217
204
308
1511
459
514
1119
257
295
1149
2528
1120
205
205
1002
PAR
SA73
4382
8411
2814
519
813
6618
421
611
7571
6591
161
562
010
0830
3612
0032
630
894
4
CH
ITW
AN
4793
5456
1138
3545
1286
122
148
1209
357
308
863
22
1000
2423
958
355
368
1037
515
411
798
C.T
ERA
I57
166
6820
311
9310
0312
7012
6672
8873
2810
0612
2910
8087
921
4123
9011
1624
2395
854
759
010
7932
3328
8789
3
C.R
EGIO
N58
717
7011
611
9412
7214
9311
7473
0073
4010
0630
1026
1086
721
5624
0211
1453
543
080
455
3068
4012
3771
2063
2288
8
MA
NA
NG
154
138
896
MU
STA
NG
3532
914
W.M
OU
NTA
IN0
018
917
089
9
GO
RK
HA
153
144
941
100
105
1050
6758
866
2920
1489
510
9772
743
794
687
865
1054
946
898
LAM
JUN
G12
711
590
610
078
780
3025
825
318
345
1085
900
798
887
TAN
AH
U19
419
810
215
510
0018
1688
930
5525
3382
920
729
114
0531
231
210
0057
853
292
0
KA
SKI
8087
1088
33
1000
22
1000
232
242
1043
33
990
326
369
1132
264
263
996
PAR
BA
T14
213
595
128
2810
008
787
516
010
867
58
786
610
399
961
400
308
770
SYA
NG
JA90
8594
412
1191
78
810
0023
027
712
0412
116
713
7816
617
610
6012
1210
9089
9

STATISTICAL INFORMATION ON NEPALESE AGRICULTURE 2072-73 (2015-16)
34
DIS
TRIC
T
Are
aPr
odY
ield
Are
aPr
odY
ield
Are
aPr
odY
ield
Are
aPr
odY
ield
Are
aPr
odY
ield
Are
aPr
odY
ield
Are
aPr
odY
ield
Are
aPr
odY
ield
OTH
ERS
+LE
NTI
LC
HIC
K P
EAPI
GEO
N P
EABL
AC
K G
RA
MG
RA
SS P
EAH
OR
SE G
RA
MSO
YA
BEA
N
PALP
A15
216
510
8624
726
510
7350
4080
010
092
920
4522
484
302
305
1010
362
292
807
MY
AG
DI
2120
952
3142
1377
245
245
1000
4142
1014
555
555
1000
218
247
1133
BA
GLU
NG
5551
927
34
1333
108
806
338
385
1139
308
235
763
459
643
1401
249
339
1361
GU
LMI
255
433
1698
3035
1167
56
1200
128
215
1680
150
255
1694
104
123
1183
549
879
1601
AR
GH
AK
HA
NC
HI
345
345
1000
105
108
1029
3932
821
98
880
4544
978
403
425
1055
W.H
ILLS
1614
1778
1102
533
564
1058
199
187
942
7547
5696
755
00
1021
1127
1104
3484
3658
1050
6189
6119
989
NA
WA
LPA
RA
SI90
4610
564
1168
245
287
1171
445
220
494
115
7565
215
517
511
2915
580
516
169
155
917
375
266
709
RU
PAN
DEH
I54
4082
7015
2015
116
811
1342
264
915
3855
5510
0031
778
024
6171
076
510
77
KA
PILB
AST
U58
5568
1311
6438
050
013
1627
536
213
1656
047
083
928
5033
4611
7441
838
692
3
W.T
ERA
I20
341
2564
712
6177
695
512
3111
4212
3110
7873
060
082
233
2243
0112
9515
580
516
169
155
917
1503
1417
943
W.R
EGIO
N21
955
2742
512
4913
0915
1911
6013
4114
1810
5882
7762
9676
133
2243
0112
9511
7612
0710
2636
5338
1310
4478
8177
0697
8
DO
LPA
10.
550
01
0.6
600
21
500
31.
549
512
1083
333
926
879
1
MU
GU
76
841
3733
892
1913
677
125
113
904
306
289
944
HU
MLA
2217
773
6547
723
4339
898
3526
743
125
131
1048
JUM
LA22
1883
758
8013
7921
5041
0019
07
KA
LIK
OT
4724
511
3225
781
3213
441
8853
4279
219
741
521
07
MW
.MO
UN
TAIN
9966
664
11
600
00
136
106
779
00
9818
819
2028
327
195
831
1752
0316
69
RU
KU
M18
013
575
050
4080
04
270
025
021
586
03
133
325
015
060
02
140
0
RO
LPA
157
142
904
7667
882
139
120
863
4453
1205
280
334
1193
204
230
1127
PYU
THA
N13
014
010
7768
8512
5028
524
485
65
612
0086
013
9016
16
SALY
AN
985
715
726
345
347
1006
1211
917
107
8579
470
3752
914
8018
9012
7764
266
110
29
JAJA
RK
OT
510
329
644
2521
840
120
100
833
DA
ILEK
H31
127
889
423
713
858
212
781
638
240
127
529
252
472
1873
SUR
KH
ET17
2519
5511
3364
674
511
5342
6114
5224
026
511
0418
017
898
933
333
910
1841
556
613
64
MW
.HIL
LS39
9836
9492
414
4714
4399
758
7412
9511
4810
1088
018
017
898
912
297
795
3443
4230
1229
1635
2030
1241
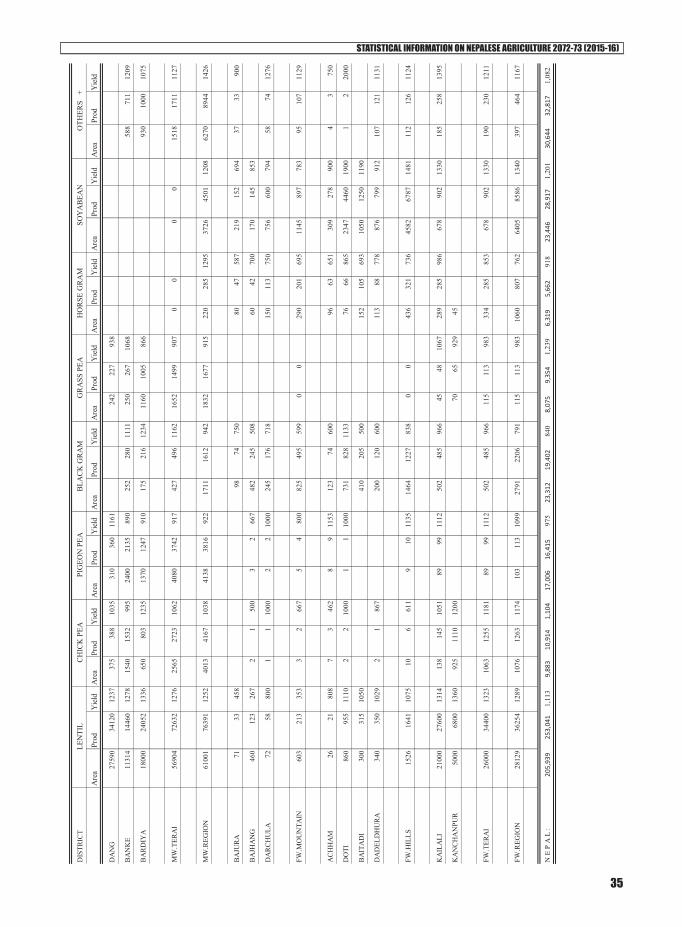
STATISTICAL INFORMATION ON NEPALESE AGRICULTURE 2072-73 (2015-16)
35
DIS
TRIC
T
Are
aPr
odY
ield
Are
aPr
odY
ield
Are
aPr
odY
ield
Are
aPr
odY
ield
Are
aPr
odY
ield
Are
aPr
odY
ield
Are
aPr
odY
ield
Are
aPr
odY
ield
OTH
ERS
+LE
NTI
LC
HIC
K P
EAPI
GEO
N P
EABL
AC
K G
RA
MG
RA
SS P
EAH
OR
SE G
RA
MSO
YA
BEA
N
DA
NG
2759
034
120
1237
375
388
1035
310
360
1161
242
227
938
BA
NK
E11
314
1446
012
7815
4015
3299
524
0021
3589
025
228
011
1125
026
710
6858
871
112
09
BA
RD
IYA
1800
024
052
1336
650
803
1235
1370
1247
910
175
216
1234
1160
1005
866
930
1000
1075
MW
.TER
AI
5690
472
632
1276
2565
2723
1062
4080
3742
917
427
496
1162
1652
1499
907
00
00
1518
1711
1127
MW
.REG
ION
6100
176
391
1252
4013
4167
1038
4138
3816
922
1711
1612
942
1832
1677
915
220
285
1295
3726
4501
1208
6270
8944
1426
BA
JUR
A71
3345
898
7475
080
4758
721
915
269
437
3390
0
BA
JHA
NG
460
123
267
21
500
32
667
482
245
508
6042
700
170
145
853
DA
RC
HU
LA72
5880
01
110
002
210
0024
517
671
815
011
375
075
660
079
458
7412
76
FW.M
OU
NTA
IN60
321
335
33
266
75
480
082
549
559
90
029
020
169
511
4589
778
395
107
1129
AC
HH
AM
2621
808
73
462
89
1153
123
7460
096
6365
130
927
890
04
375
0
DO
TI86
095
511
102
210
001
110
0073
182
811
3376
6686
523
4744
6019
001
220
00
BA
ITA
DI
300
315
1050
410
205
500
152
105
693
1050
1250
1190
DA
DEL
DH
UR
A34
035
010
292
186
720
012
060
011
388
778
876
799
912
107
121
1131
FW.H
ILLS
1526
1641
1075
106
611
910
1135
1464
1227
838
00
436
321
736
4582
6787
1481
112
126
1124
KA
ILA
LI21
000
2760
013
1413
814
510
5189
9911
1250
248
596
645
4810
6728
928
598
667
890
213
3018
525
813
95
KA
NC
HA
NPU
R50
0068
0013
6092
511
1012
0070
6592
945
FW.T
ERA
I26
000
3440
013
2310
6312
5511
8189
9911
1250
248
596
611
511
398
333
428
585
367
890
213
3019
023
012
11
FW.R
EGIO
N28
129
3625
412
8910
7612
6311
7410
311
310
9927
9122
0679
111
511
398
310
6080
776
264
0585
8613
4039
746
411
67
N E
P A
L :
205,
939
253,
041
1,11
3
9,88
3
10
,914
1,
104
17
,006
16,4
15
975
23,3
12
19
,402
840
8,07
5
9,
354
1,23
9
6,31
9
5,66
2
91
8
23
,446
28,9
17
1,
201
30
,644
32,8
17
1,
082

STATISTICAL INFORMATION ON NEPALESE AGRICULTURE 2072-73 (2015-16)
36

STATISTICAL INFORMATION ON NEPALESE AGRICULTURE 2072-73 (2015-16)
37
4. LIVESTOCK
* Source: Ministry of Livestock

STATISTICAL INFORMATION ON NEPALESE AGRICULTURE 2072-73 (2015-16)
38
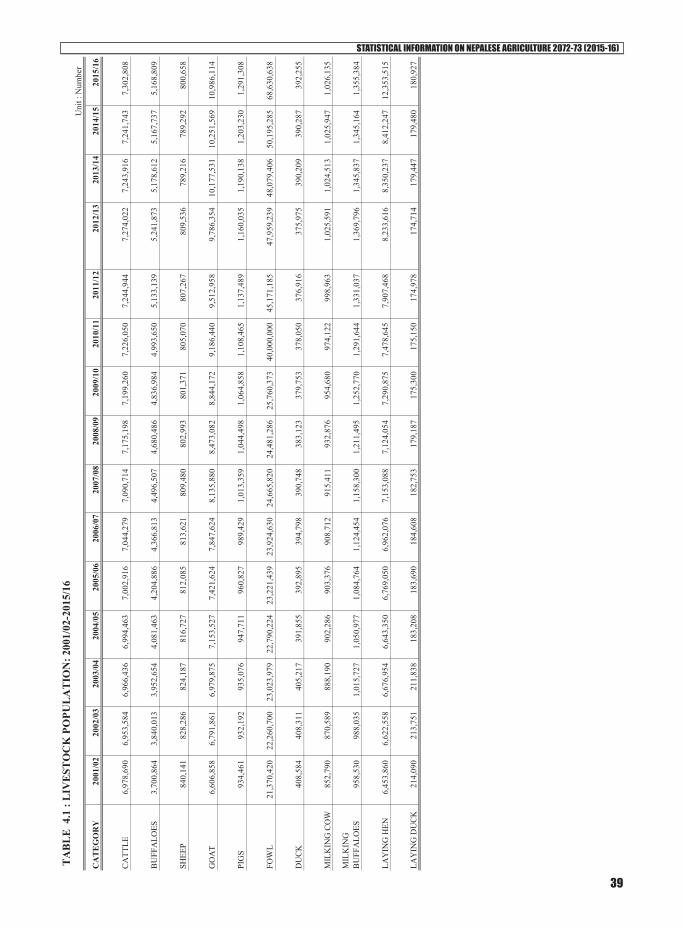
STATISTICAL INFORMATION ON NEPALESE AGRICULTURE 2072-73 (2015-16)
39
CA
TEG
OR
Y20
01/0
220
02/0
320
03/0
420
04/0
520
05/0
620
06/0
720
07/0
820
08/0
920
09/1
020
10/1
120
11/1
220
12/1
320
13/1
420
14/1
520
15/1
6
CA
TTLE
6,97
8,69
0
6,95
3,58
4
6,96
6,43
6
6,99
4,46
3
7,00
2,91
6
7,04
4,27
9
7,09
0,71
4
7,17
5,19
8
7,19
9,26
0
7,22
6,05
0
7,24
4,94
4
7,27
4,02
2
7,
243,
916
7,
241,
743
7,
302,
808
BU
FFA
LOES
3,70
0,86
4
3,84
0,01
3
3,95
2,65
4
4,08
1,46
3
4,20
4,88
6
4,36
6,81
3
4,49
6,50
7
4,68
0,48
6
4,83
6,98
4
4,99
3,65
0
5,13
3,13
9
5,24
1,87
3
5,
178,
612
5,
167,
737
5,
168,
809
SHEE
P84
0,14
1
82
8,28
6
82
4,18
7
81
6,72
7
81
2,08
5
81
3,62
1
80
9,48
0
80
2,99
3
80
1,37
1
80
5,07
0
80
7,26
7
80
9,53
6
789,
216
789,
292
800,
658
GO
AT
6,60
6,85
8
6,79
1,86
1
6,97
9,87
5
7,15
3,52
7
7,42
1,62
4
7,84
7,62
4
8,13
5,88
0
8,47
3,08
2
8,84
4,17
2
9,18
6,44
0
9,51
2,95
8
9,78
6,35
4
10
,177
,531
10
,251
,569
10
,986
,114
PIG
S93
4,46
1
93
2,19
2
93
5,07
6
94
7,71
1
96
0,82
7
98
9,42
9
1,
013,
359
1,
044,
498
1,
064,
858
1,
108,
465
1,
137,
489
1,
160,
035
1,19
0,13
8
1,20
3,23
0
1,29
1,30
8
FOW
L21
,370
,420
22
,260
,700
23
,023
,979
22
,790
,224
23
,221
,439
23
,924
,630
24
,665
,820
24
,481
,286
25
,760
,373
40
,000
,000
45
,171
,185
47
,959
,239
48,0
79,4
06
50,1
95,2
85
68,6
30,6
38
DU
CK
408,
584
408,
311
405,
217
391,
855
392,
895
394,
798
390,
748
383,
123
379,
753
378,
050
376,
916
375,
975
39
0,20
9
39
0,28
7
39
2,25
5
MIL
KIN
G C
OW
852,
790
870,
589
888,
190
902,
286
903,
376
908,
712
915,
411
932,
876
954,
680
974,
122
998,
963
1,02
5,59
1
1,
024,
513
1,
025,
947
1,
026,
135
MIL
KIN
G
BU
FFA
LOES
958,
530
988,
035
1,01
5,72
7
1,05
0,97
7
1,08
4,76
4
1,12
4,45
4
1,15
8,30
0
1,21
1,49
5
1,25
2,77
0
1,29
1,64
4
1,33
1,03
7
1,36
9,79
6
1,
345,
837
1,
345,
164
1,
355,
384
LAY
ING
HEN
6,45
3,86
0
6,62
2,55
8
6,67
6,95
4
6,64
3,35
0
6,76
9,05
0
6,96
2,07
6
7,15
3,08
8
7,12
4,05
4
7,29
0,87
5
7,47
8,64
5
7,90
7,46
8
8,23
3,61
6
8,
350,
237
8,
412,
247
12
,353
,515
LAY
ING
DU
CK
214,
090
213,
751
211,
838
183,
208
183,
690
184,
608
182,
753
179,
187
175,
300
175,
150
174,
978
174,
714
17
9,44
7
17
9,48
0
18
0,92
7
TA
BL
E 4
.1 :
LIV
EST
OC
K P
OPU
LATI
ON
: 200
1/02
-201
5/16
Uni
t : N
umbe
r
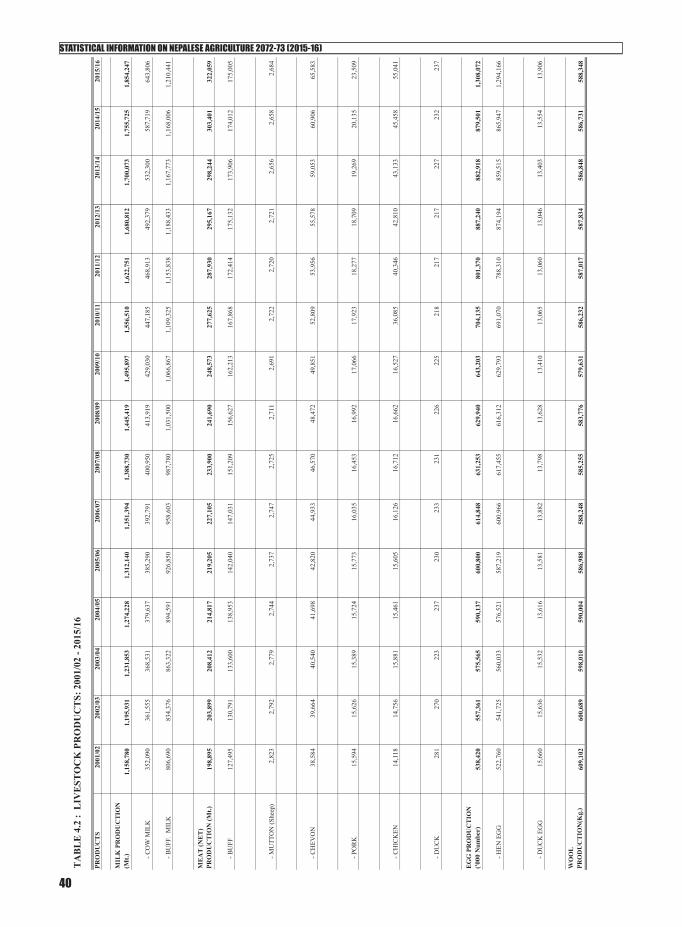
STATISTICAL INFORMATION ON NEPALESE AGRICULTURE 2072-73 (2015-16)
40
PRO
DU
CTS
2001
/02
2002
/03
2003
/04
2004
/05
2005
/06
2006
/07
2007
/08
2008
/09
2009
/10
2010
/11
2011
/12
2012
/13
2013
/14
2014
/15
2015
/16
MIL
K P
RO
DU
CTI
ON
(M
t.)1,
158,
780
1,19
5,93
1
1,
231,
853
1,27
4,22
8
1,
312,
140
1,35
1,39
4
1,
388,
730
1,44
5,41
9
1,
495,
897
1,55
6,51
0
1,
622,
751
1,68
0,81
2
1,
700,
073
1,75
5,72
5
1,
854,
247
- CO
W M
ILK
352,
090
36
1,55
5
368,
531
37
9,63
7
385,
290
39
2,79
1
400,
950
41
3,91
9
429,
030
44
7,18
5
468,
913
49
2,37
9
532,
300
58
7,71
9
643,
806
- BU
FF.
MIL
K80
6,69
0
834,
376
86
3,32
2
894,
591
92
6,85
0
958,
603
98
7,78
0
1,03
1,50
0
1,
066,
867
1,10
9,32
5
1,
153,
838
1,18
8,43
3
1,
167,
773
1,16
8,00
6
1,
210,
441
MEA
T (N
ET)
PRO
DU
CTI
ON
(Mt.)
198,
895
20
3,89
9
208,
412
21
4,81
7
219,
205
22
7,10
5
233,
900
24
1,69
0
248,
573
27
7,62
5
287,
930
29
5,16
7
298,
244
30
3,40
1
322,
059
- BU
FF12
7,49
5
130,
791
13
3,60
0
138,
953
14
2,04
0
147,
031
15
1,20
9
156,
627
16
2,21
3
167,
868
17
2,41
4
175,
132
17
3,90
6
174,
012
17
5,00
5
- MU
TTO
N (S
heep
)2,
823
2,79
2
2,
779
2,74
4
2,
737
2,74
7
2,
725
2,71
1
2,
691
2,72
2
2,
720
2,72
1
2,
656
2,65
8
2,
684
- CH
EVO
N38
,584
39
,664
40
,540
41
,698
42
,820
44
,933
46
,570
48
,472
49
,851
52
,809
53
,956
55
,578
59
,053
60
,906
65
,583
- PO
RK
15,5
94
15,6
26
15,3
89
15,7
24
15,7
73
16,0
35
16,4
53
16,9
92
17,0
66
17,9
23
18,2
77
18,7
09
19,2
69
20,1
35
23,5
09
- CH
ICK
EN14
,118
14
,756
15
,881
15
,461
15
,605
16
,126
16
,712
16
,662
16
,527
36
,085
40
,346
42
,810
43
,133
45
,458
55
,041
- DU
CK
281
27
0
223
23
7
230
23
3
231
22
6
225
21
8
217
21
7
227
23
2
237
EGG
PR
OD
UC
TIO
N
('000
Num
ber)
538,
420
55
7,36
1
575,
565
59
0,13
7
600,
800
61
4,84
8
631,
253
62
9,94
0
643,
203
70
4,13
5
801,
370
88
7,24
0
882,
918
87
9,50
1
1,30
8,07
2
- HEN
EG
G52
2,76
0
541,
725
56
0,03
3
576,
521
58
7,21
9
600,
966
61
7,45
5
616,
312
62
9,79
3
691,
070
78
8,31
0
874,
194
85
9,51
5
865,
947
1,
294,
166
- DU
CK
EG
G15
,660
15
,636
15
,532
13
,616
13
,581
13
,882
13
,798
13
,628
13
,410
13
,065
13
,060
13
,046
13
,403
13
,554
13
,906
WO
OL
PR
OD
UC
TIO
N(K
g.)
609,
102
60
0,68
9
598,
010
59
0,00
4
586,
988
58
8,24
8
585,
255
58
3,77
6
579,
631
58
6,23
2
587,
017
58
7,83
4
586,
848
58
6,73
1
588,
348
TA
BL
E 4
.2 :
LIV
EST
OC
K P
RO
DU
CT
S: 2
001/
02 -
2015
/16
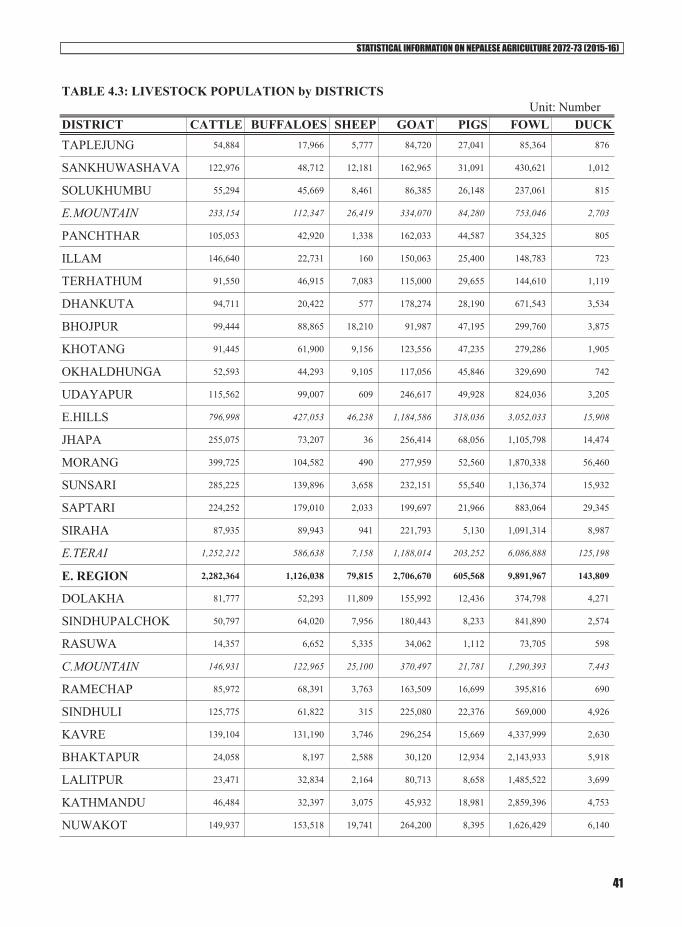
STATISTICAL INFORMATION ON NEPALESE AGRICULTURE 2072-73 (2015-16)
41
DISTRICT CATTLE BUFFALOES SHEEP GOAT PIGS FOWL DUCKTAPLEJUNG 54,884 17,966 5,777 84,720 27,041 85,364 876
SANKHUWASHAVA 122,976 48,712 12,181 162,965 31,091 430,621 1,012
SOLUKHUMBU 55,294 45,669 8,461 86,385 26,148 237,061 815
E.MOUNTAIN 233,154 112,347 26,419 334,070 84,280 753,046 2,703
PANCHTHAR 105,053 42,920 1,338 162,033 44,587 354,325 805
ILLAM 146,640 22,731 160 150,063 25,400 148,783 723
TERHATHUM 91,550 46,915 7,083 115,000 29,655 144,610 1,119
DHANKUTA 94,711 20,422 577 178,274 28,190 671,543 3,534
BHOJPUR 99,444 88,865 18,210 91,987 47,195 299,760 3,875
KHOTANG 91,445 61,900 9,156 123,556 47,235 279,286 1,905
OKHALDHUNGA 52,593 44,293 9,105 117,056 45,846 329,690 742
UDAYAPUR 115,562 99,007 609 246,617 49,928 824,036 3,205
E.HILLS 796,998 427,053 46,238 1,184,586 318,036 3,052,033 15,908
JHAPA 255,075 73,207 36 256,414 68,056 1,105,798 14,474
MORANG 399,725 104,582 490 277,959 52,560 1,870,338 56,460
SUNSARI 285,225 139,896 3,658 232,151 55,540 1,136,374 15,932
SAPTARI 224,252 179,010 2,033 199,697 21,966 883,064 29,345
SIRAHA 87,935 89,943 941 221,793 5,130 1,091,314 8,987
E.TERAI 1,252,212 586,638 7,158 1,188,014 203,252 6,086,888 125,198
E. REGION 2,282,364 1,126,038 79,815 2,706,670 605,568 9,891,967 143,809
DOLAKHA 81,777 52,293 11,809 155,992 12,436 374,798 4,271
SINDHUPALCHOK 50,797 64,020 7,956 180,443 8,233 841,890 2,574
RASUWA 14,357 6,652 5,335 34,062 1,112 73,705 598
C.MOUNTAIN 146,931 122,965 25,100 370,497 21,781 1,290,393 7,443
RAMECHAP 85,972 68,391 3,763 163,509 16,699 395,816 690
SINDHULI 125,775 61,822 315 225,080 22,376 569,000 4,926
KAVRE 139,104 131,190 3,746 296,254 15,669 4,337,999 2,630
BHAKTAPUR 24,058 8,197 2,588 30,120 12,934 2,143,933 5,918
LALITPUR 23,471 32,834 2,164 80,713 8,658 1,485,522 3,699
KATHMANDU 46,484 32,397 3,075 45,932 18,981 2,859,396 4,753
NUWAKOT 149,937 153,518 19,741 264,200 8,395 1,626,429 6,140
Unit: NumberTABLE 4.3: LIVESTOCK POPULATION by DISTRICTS
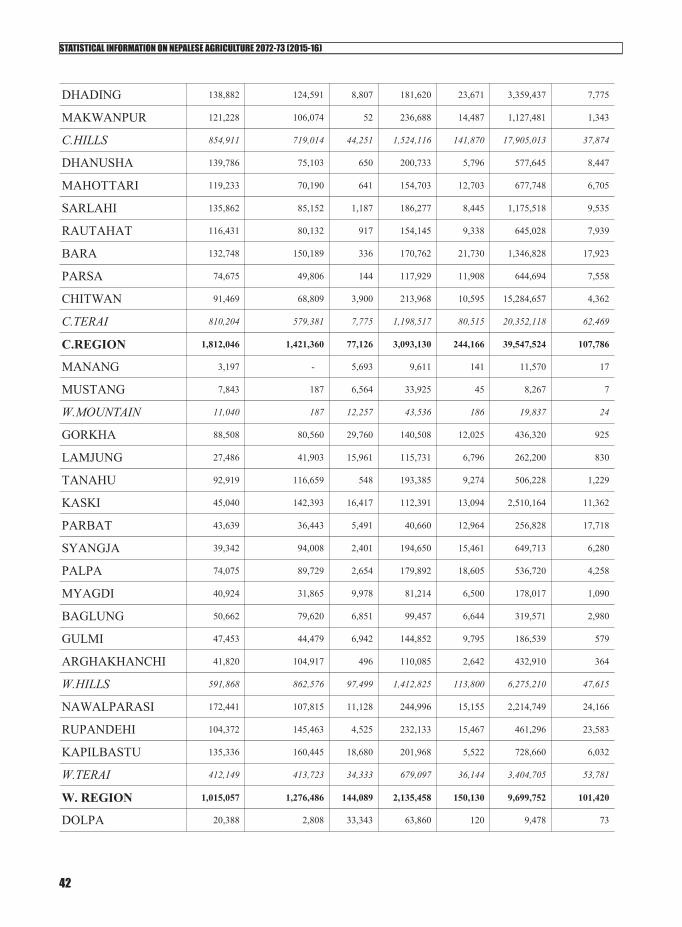
STATISTICAL INFORMATION ON NEPALESE AGRICULTURE 2072-73 (2015-16)
42
DHADING 138,882 124,591 8,807 181,620 23,671 3,359,437 7,775
MAKWANPUR 121,228 106,074 52 236,688 14,487 1,127,481 1,343
C.HILLS 854,911 719,014 44,251 1,524,116 141,870 17,905,013 37,874
DHANUSHA 139,786 75,103 650 200,733 5,796 577,645 8,447
MAHOTTARI 119,233 70,190 641 154,703 12,703 677,748 6,705
SARLAHI 135,862 85,152 1,187 186,277 8,445 1,175,518 9,535
RAUTAHAT 116,431 80,132 917 154,145 9,338 645,028 7,939
BARA 132,748 150,189 336 170,762 21,730 1,346,828 17,923
PARSA 74,675 49,806 144 117,929 11,908 644,694 7,558
CHITWAN 91,469 68,809 3,900 213,968 10,595 15,284,657 4,362
C.TERAI 810,204 579,381 7,775 1,198,517 80,515 20,352,118 62,469
C.REGION 1,812,046 1,421,360 77,126 3,093,130 244,166 39,547,524 107,786
MANANG 3,197 - 5,693 9,611 141 11,570 17
MUSTANG 7,843 187 6,564 33,925 45 8,267 7
W.MOUNTAIN 11,040 187 12,257 43,536 186 19,837 24
GORKHA 88,508 80,560 29,760 140,508 12,025 436,320 925
LAMJUNG 27,486 41,903 15,961 115,731 6,796 262,200 830
TANAHU 92,919 116,659 548 193,385 9,274 506,228 1,229
KASKI 45,040 142,393 16,417 112,391 13,094 2,510,164 11,362
PARBAT 43,639 36,443 5,491 40,660 12,964 256,828 17,718
SYANGJA 39,342 94,008 2,401 194,650 15,461 649,713 6,280
PALPA 74,075 89,729 2,654 179,892 18,605 536,720 4,258
MYAGDI 40,924 31,865 9,978 81,214 6,500 178,017 1,090
BAGLUNG 50,662 79,620 6,851 99,457 6,644 319,571 2,980
GULMI 47,453 44,479 6,942 144,852 9,795 186,539 579
ARGHAKHANCHI 41,820 104,917 496 110,085 2,642 432,910 364
W.HILLS 591,868 862,576 97,499 1,412,825 113,800 6,275,210 47,615
NAWALPARASI 172,441 107,815 11,128 244,996 15,155 2,214,749 24,166
RUPANDEHI 104,372 145,463 4,525 232,133 15,467 461,296 23,583
KAPILBASTU 135,336 160,445 18,680 201,968 5,522 728,660 6,032
W.TERAI 412,149 413,723 34,333 679,097 36,144 3,404,705 53,781
W. REGION 1,015,057 1,276,486 144,089 2,135,458 150,130 9,699,752 101,420
DOLPA 20,388 2,808 33,343 63,860 120 9,478 73

STATISTICAL INFORMATION ON NEPALESE AGRICULTURE 2072-73 (2015-16)
43
MUGU 37,500 9,712 45,027 47,868 89 29,072 73
HUMLA 14,693 1,879 28,642 58,337 144 15,749 120
JUMLA 65,509 2,596 72,530 41,591 990 14,474 659
KALIKOT 22,935 19,230 30,732 54,030 1,378 49,316 187
MW.MOUNTAIN 161,025 36,225 210,274 265,686 2,721 118,089 1,112
RUKUM 34,723 54,781 28,883 130,991 23,768 418,230 3,142
ROLPA 102,795 53,446 15,687 138,892 24,511 222,736 198
PYUTHAN 74,190 69,588 14,667 136,543 11,762 619,318 78
SALYAN 152,514 74,162 17,764 162,103 15,185 135,265 2,077
JAJARKOT 41,441 34,476 24,675 106,356 2,841 81,049 198
DAILEKH 121,661 99,797 14,774 171,633 12,352 239,000 701
SURKHET 122,274 35,290 11,608 233,737 21,521 618,099 4,750
MW.HILLS 649,598 421,540 128,058 1,080,255 111,940 2,333,697 11,144
DANG 130,177 120,767 34,091 237,444 41,445 2,285,270 8,514
BANKE 128,879 137,126 11,609 189,743 37,828 1,080,601 2,180
BARDIYA 112,817 109,668 13,025 199,438 37,222 686,310 2,672
MW.TERAI 371,873 367,561 58,725 626,625 116,495 4,052,181 13,366
MW. REGION 1,182,496 825,326 397,057 1,972,566 231,156 6,503,967 25,622
BAJURA 85,002 20,962 19,672 77,718 1,604 54,691 432
BAJHANG 139,857 32,966 26,452 98,558 2,046 49,539 409
DARCHULA 68,474 32,423 22,861 75,332 552 37,348 220
FW.MOUNTAIN 293,333 86,351 68,985 251,608 4,202 141,578 1,061
ACHHAM 40,989 39,322 3,085 122,431 394 67,201 313
DOTI 123,139 48,102 662 144,896 2,471 127,770 174
BAITADI 124,533 54,071 304 125,803 750 19,496 234
DADELDHURA 89,943 23,135 315 141,919 1,749 56,284 205
FW.HILLS 378,604 164,630 4,366 535,049 5,364 270,751 926
KAILALI 196,305 155,695 21,267 158,293 28,613 1,541,163 7,431
KANCHANPUR 142,603 112,923 7,953 133,340 22,109 1,033,936 4,200
FW.TERAI 338,908 268,618 29,220 291,633 50,722 2,575,099 11,631
FW. REGION 1,010,845 519,599 102,571 1,078,290 60,288 2,987,428 13,618
N E P A L : 7,302,808 5,168,809 800,658 10,986,114 1,291,308 68,630,638 392,255

STATISTICAL INFORMATION ON NEPALESE AGRICULTURE 2072-73 (2015-16)
44
Unit: Mt.
DISTRICT MILKING COWS NO.
MILKING BUFFALOES NO. COW MILK BUFF MILK TOTAL MILK
PRODUCED
TAPLEJUNG 8123 4987 5389 4257 9645SANKHUWASHAVA 15342 13367 6988 10589 17577SOLUKHUMBU 7819 13501 2948 5493 8441E.MOUNTAIN 31284 31855 15324 20339 35663PANCHTHAR 14854 11331 8511 9835 18346ILLAM 26821 5759 19735 15261 34996TERHATHUM 18880 13276 10089 11500 21589DHANKUTA 12523 5391 8176 4579 12755BHOJPUR 14103 16342 7324 14184 21508KHOTANG 12998 19501 7105 12275 19380OKHALDHUNGA 7930 11693 4555 5516 10071UDAYAPUR 15867 26138 9092 22687 31779E.HILLS 123976 109431 74587 95837 170424JHAPA 36068 19327 29667 32457 62124MORANG 56521 27610 37387 35820 73207SUNSARI 40311 38560 14964 27894 42858SAPTARI 31790 41650 16654 25228 41882SIRAHA 12434 23745 8125 25624 33749E.TERAI 177124 150892 106797 147023 253820E. REGION 332384 292178 196708 263199 459907DOLAKHA 12344 13805 5544 10155 15699SINDHUPALCHOK 7183 16901 6567 18456 25023RASUWA 1853 1901 1062 1650 2712C.MOUNTAIN 21380 32607 13173 30261 43434RAMECHAP 12255 18055 4780 13521 18301SINDHULI 15745 14960 8024 5955 13979KAVRE 20587 34634 17919 65590 83509BHAKTAPUR 3402 2164 3402 4494 7896LALITPUR 3319 8668 2202 12595 14797KATHMANDU 6573 8553 4166 10867 15033NUWAKOT 21350 38480 12234 18937 31171DHADING 24068 36469 13791 24416 38207MAKWANPUR 18220 25820 12440 30774 43214C.HILLS 125519 187803 78958 187149 266107DHANUSHA 19150 17700 14056 22710 36766MAHOTTARI 16860 20270 9661 18447 28108SARLAHI 19221 25019 15374 17825 33199RAUTAHAT 16493 22102 13162 15369 28531BARA 18771 39650 11952 22738 34690PARSA 11400 14424 6532 13755 20287CHITWAN 14934 18166 14947 30230 45177C.TERAI 116829 157331 85684 141074 226758C. REGION 263728 377741 177815 358483 536299MANANG 452 0 259 0 259MUSTANG 1109 49 635 35 670W.MOUNTAIN 1561 49 894 35 929GORKHA 14927 17250 7653 10468 18121LAMJUNG 4887 11062 4241 11622 15863TANAHU 14942 30798 9678 32272 41950KASKI 8879 37592 9782 31234 41016PARBAT 5655 9281 3450 10161 13611SYANGJA 5694 24818 6805 49275 56080PALPA 11434 23688 6552 21850 28402
TABLE 4.4: MILK ANIMALS AND MILK PRODUCTION by DISTRICTS
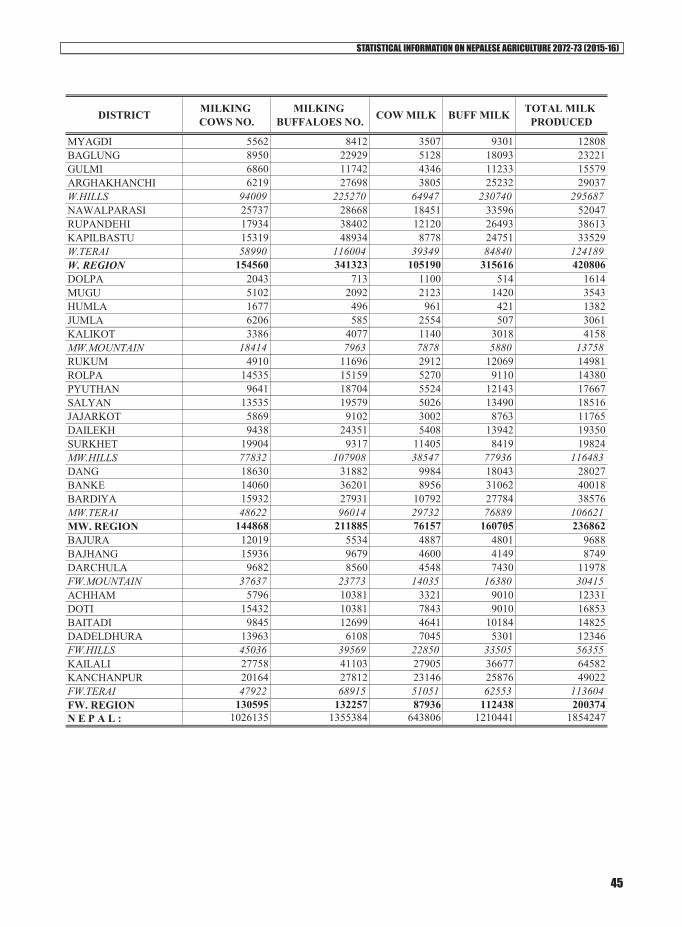
STATISTICAL INFORMATION ON NEPALESE AGRICULTURE 2072-73 (2015-16)
45
MYAGDI 5562 8412 3507 9301 12808BAGLUNG 8950 22929 5128 18093 23221GULMI 6860 11742 4346 11233 15579ARGHAKHANCHI 6219 27698 3805 25232 29037W.HILLS 94009 225270 64947 230740 295687NAWALPARASI 25737 28668 18451 33596 52047RUPANDEHI 17934 38402 12120 26493 38613KAPILBASTU 15319 48934 8778 24751 33529W.TERAI 58990 116004 39349 84840 124189W. REGION 154560 341323 105190 315616 420806DOLPA 2043 713 1100 514 1614MUGU 5102 2092 2123 1420 3543HUMLA 1677 496 961 421 1382JUMLA 6206 585 2554 507 3061KALIKOT 3386 4077 1140 3018 4158MW.MOUNTAIN 18414 7963 7878 5880 13758RUKUM 4910 11696 2912 12069 14981ROLPA 14535 15159 5270 9110 14380PYUTHAN 9641 18704 5524 12143 17667SALYAN 13535 19579 5026 13490 18516JAJARKOT 5869 9102 3002 8763 11765DAILEKH 9438 24351 5408 13942 19350SURKHET 19904 9317 11405 8419 19824MW.HILLS 77832 107908 38547 77936 116483DANG 18630 31882 9984 18043 28027BANKE 14060 36201 8956 31062 40018BARDIYA 15932 27931 10792 27784 38576MW.TERAI 48622 96014 29732 76889 106621MW. REGION 144868 211885 76157 160705 236862BAJURA 12019 5534 4887 4801 9688BAJHANG 15936 9679 4600 4149 8749DARCHULA 9682 8560 4548 7430 11978FW.MOUNTAIN 37637 23773 14035 16380 30415ACHHAM 5796 10381 3321 9010 12331DOTI 15432 10381 7843 9010 16853BAITADI 9845 12699 4641 10184 14825DADELDHURA 13963 6108 7045 5301 12346FW.HILLS 45036 39569 22850 33505 56355KAILALI 27758 41103 27905 36677 64582KANCHANPUR 20164 27812 23146 25876 49022FW.TERAI 47922 68915 51051 62553 113604FW. REGION 130595 132257 87936 112438 200374N E P A L : 1026135 1355384 643806 1210441 1854247
DISTRICT MILKING COWS NO.
MILKING BUFFALOES NO. COW MILK BUFF MILK TOTAL MILK
PRODUCED

STATISTICAL INFORMATION ON NEPALESE AGRICULTURE 2072-73 (2015-16)
46
TABLE 4.5: NET MEAT PRODUCTION by DISTRICTSUnit: Mt.
DISTRICT BUFF MUTTON CHEVON PORK CHICKEN DUCK MEAT
TOTAL MEAT
TAPLEJUNG 607 31 491 443 172 0 1744SANKHUWASABHA 1646 41 958 509 302 1 3457SOLUKHUMBU 1123 28 416 428 166 0 2161E.MOUNTAIN 3376 100 1865 1380 640 1 7362PANCHTHAR 1496 4 940 730 248 1 3419ILLAM 1974 1 870 416 104 0 3365TERHATHUM 2358 24 399 486 116 1 3384DHANKUTA 1521 2 405 462 471 2 2863BHOJPUR 1251 51 313 919 251 2 2787KHOTANG 1997 31 442 705 310 1 3486OKHALDHUNGA 1497 31 685 751 294 0 3258UDAYAPUR 3346 2 1430 818 578 2 6176E.HILLS 15440 146 5484 5287 2372 9 28738JHAPA 5241 0 1447 1115 1425 9 9237MORANG 5347 1 1678 861 1444 28 9359SUNSARI 4728 12 1769 884 820 23 8236SAPTARI 3867 7 2200 360 1301 15 7750SIRAHA 3221 3 1286 308 809 4 5631E.TERAI 22404 23 8380 3528 5799 79 40213E.REGION 41220 269 15729 10195 8811 89 76313DOLAKHA 1704 40 576 117 210 2 2649SINDHUPALCHOK 2457 27 1047 209 784 1 4525RASUWA 325 18 198 18 52 0 611C.MOUNTAIN 4486 85 1821 344 1046 3 7785RAMECHAP 2311 11 726 213 278 0 3539SINDHULI 2089 2 1003 367 792 2 4255KAVRE 4434 16 1418 257 1649 1 7775BHAKTAPUR 1013 9 175 212 647 3 2059LALITPUR 1109 7 468 142 1953 2 3681KATHMANDU 2289 10 801 292 2294 2 5688NUWAKOT 4160 66 700 285 1140 3 6354DHADING 3105 16 314 415 2965 4 6819MAKWANPUR 2795 10 1172 162 2405 1 6545C.HILLS 23305 147 6777 2345 14123 18 46715DHANUSHA 2538 2 1566 95 514 6 4721MAHOTTARI 2578 2 781 208 561 4 4134SARLAHI 2779 3 1080 138 825 5 4830RAUTAHAT 2672 3 984 153 452 4 4268BARA 4076 1 1205 356 945 10 6593PARSA 2260 0 910 195 452 4 3821CHITWAN 5550 13 1769 598 9810 13 17753C.TERAI 22453 24 8295 1743 13559 46 46120C.REGION 50244 256 16893 4432 28728 67 100620MANANG 0 12 56 2 8 0 78MUSTANG 6 22 139 1 5 0 173W.MOUNTAIN 6 34 195 3 13 0 251GORKHA 3147 100 815 197 691 1 4951LAMJUNG 1416 54 621 111 504 1 2707TANAHU 3347 2 752 152 225 1 4479KASKI 4583 117 839 659 1738 19 7955

STATISTICAL INFORMATION ON NEPALESE AGRICULTURE 2072-73 (2015-16)
47
PARBAT 1231 18 374 212 280 9 2124SYANGJA 3177 40 1129 253 456 3 5058PALPA 2514 7 1043 305 376 2 4247MYAGDI 1256 40 385 1106 405 1 3193BAGLUNG 2124 19 578 109 297 1 3128GULMI 1446 23 821 160 273 0 2723ARGHAKHANCHI 3246 2 638 42 303 0 4231W.HILLS 27487 422 7995 3306 5548 38 44796NAWALPARASI 3644 27 1455 348 1665 12 7151RUPANDEHI 4916 15 1724 355 1677 12 8699KAPILBASTU 4423 63 1171 115 511 3 6286W.TERAI 12983 105 4350 818 3853 27 22136W.REGION 40476 561 12540 4127 9414 65 67183DOLPA 74 112 270 2 7 0 465MUGU 328 151 142 1 20 0 642HUMLA 64 96 125 2 10 0 297JUMLA 106 240 202 16 29 0 593KALIKOT 649 103 277 3 24 0 1056MW.MOUNTAIN 1221 702 1016 24 90 0 3053RUKUM 1654 47 760 389 293 1 3144ROLPA 1492 50 806 401 219 0 2968PYUTHAN 1594 55 522 245 465 0 2881SALYAN 3206 60 833 245 265 1 4610JAJARKOT 975 83 617 47 203 0 1925DAILEKH 2145 50 578 142 167 0 3082SURKHET 2456 24 1634 368 789 2 5273MW.HILLS 13522 369 5750 1837 2401 4 23883DANG 3507 115 3352 679 1604 4 9261BANKE 3256 42 1652 620 785 1 6356BARDIYA 3405 35 1758 610 474 1 6283MW.TERAI 10168 192 6762 1909 2863 6 21900MW.REGION 24911 1263 13528 3770 5354 10 48836BAJURA 708 66 451 26 38 0 1289BAJHANG 1208 89 572 34 40 0 1943DARCHULA 768 68 437 9 31 0 1313FW.MOUNTAIN 2684 223 1460 69 109 0 4545ACHHAM 1329 10 710 6 47 0 2102DOTI 1625 2 840 40 106 0 2613BAITADI 1727 1 730 12 14 0 2484DADELDHURA 1011 1 823 29 70 0 1934FW.HILLS 5692 14 3103 87 237 0 9133KAILALI 5962 71 1480 469 1303 4 9289KANCHANPUR 3816 27 850 360 1085 2 6140FW.TERAI 9778 98 2330 829 2388 6 15429FW.REGION 18154 335 6893 985 2734 6 29107N E P A L : 175005 2684 65583 23509 55041 237 322059
DISTRICT BUFF MUTTON CHEVON PORK CHICKEN DUCK MEAT
TOTAL MEAT
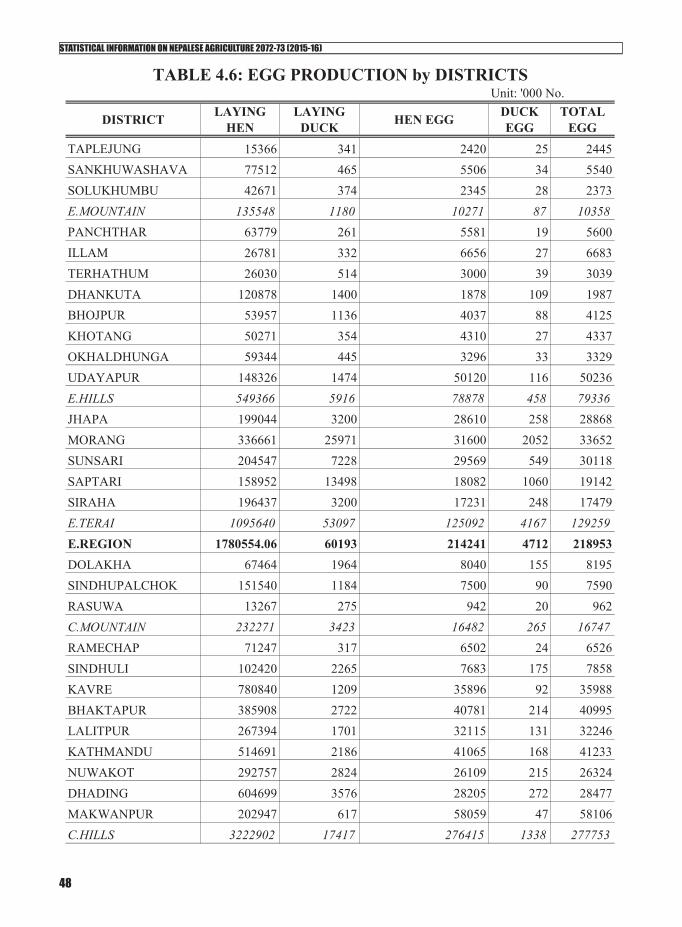
STATISTICAL INFORMATION ON NEPALESE AGRICULTURE 2072-73 (2015-16)
48
Unit: '000 No.
DISTRICT LAYING HEN
LAYING DUCK HEN EGG DUCK
EGGTOTAL
EGGTAPLEJUNG 15366 341 2420 25 2445SANKHUWASHAVA 77512 465 5506 34 5540SOLUKHUMBU 42671 374 2345 28 2373E.MOUNTAIN 135548 1180 10271 87 10358PANCHTHAR 63779 261 5581 19 5600ILLAM 26781 332 6656 27 6683TERHATHUM 26030 514 3000 39 3039DHANKUTA 120878 1400 1878 109 1987BHOJPUR 53957 1136 4037 88 4125KHOTANG 50271 354 4310 27 4337OKHALDHUNGA 59344 445 3296 33 3329UDAYAPUR 148326 1474 50120 116 50236E.HILLS 549366 5916 78878 458 79336JHAPA 199044 3200 28610 258 28868MORANG 336661 25971 31600 2052 33652SUNSARI 204547 7228 29569 549 30118SAPTARI 158952 13498 18082 1060 19142SIRAHA 196437 3200 17231 248 17479E.TERAI 1095640 53097 125092 4167 129259E.REGION 1780554.06 60193 214241 4712 218953DOLAKHA 67464 1964 8040 155 8195SINDHUPALCHOK 151540 1184 7500 90 7590RASUWA 13267 275 942 20 962C.MOUNTAIN 232271 3423 16482 265 16747RAMECHAP 71247 317 6502 24 6526SINDHULI 102420 2265 7683 175 7858KAVRE 780840 1209 35896 92 35988BHAKTAPUR 385908 2722 40781 214 40995LALITPUR 267394 1701 32115 131 32246KATHMANDU 514691 2186 41065 168 41233NUWAKOT 292757 2824 26109 215 26324DHADING 604699 3576 28205 272 28477MAKWANPUR 202947 617 58059 47 58106C.HILLS 3222902 17417 276415 1338 277753
TABLE 4.6: EGG PRODUCTION by DISTRICTS

STATISTICAL INFORMATION ON NEPALESE AGRICULTURE 2072-73 (2015-16)
49
DHANUSHA 103976 3885 8650 295 8945MAHOTTARI 121995 3084 9850 234 10084SARLAHI 211593 4386 5498 333 5831RAUTAHAT 116105 3651 7822 277 8099BARA 242429 8244 9955 627 10582PARSA 116045 3476 10210 264 10474CHITWAN 2751238 2006 411901 274 412175C.TERAI 3663381 28732 463886 2304 466190C.REGION 7118554.32 49572 756783 3907 760690MANANG 2083 10 210 1 211MUSTANG 1488 3 406 0 406W.MOUNTAIN 3571 13 616 1 617GORKHA 78538 425 4598 32 4630LAMJUNG 47196 381 7433 29 7462TANAHU 91121 318 14352 24 14376KASKI 451830 5226 42827 324 43151PARBAT 46229 8150 6252 525 6777SYANGJA 116948 2888 5846 219 6065PALPA 96610 1790 9004 136 9140MYAGDI 32043 501 3081 38 3119BAGLUNG 57523 1370 2199 104 2303GULMI 33577 266 3837 20 3857ARGHAKHANCHI 77924 118 7289 7 7296W.HILLS 1129538 21433 106718 1458 108176NAWALPARASI 398655 11550 41068 878 41946RUPANDEHI 83033 10848 9758 824 10582KAPILBASTU 131159 10412 4898 802 5700W.TERAI 612847 32810 55724 2504 58228W.REGION 1745955.36 54256 163058 3963 167021DOLPA 1706 33 269 2 271MUGU 5233 33 601 2 603HUMLA 2835 40 446 2 448JUMLA 2605 303 450 21 471KALIKOT 8877 86 602 7 609MW.MOUNTAIN 21256 495 2368 34 2402RUKUM 75281 1445 2872 110 2982ROLPA 40092 91 3315 7 3322PYUTHAN 111477 19 4025 1 4026
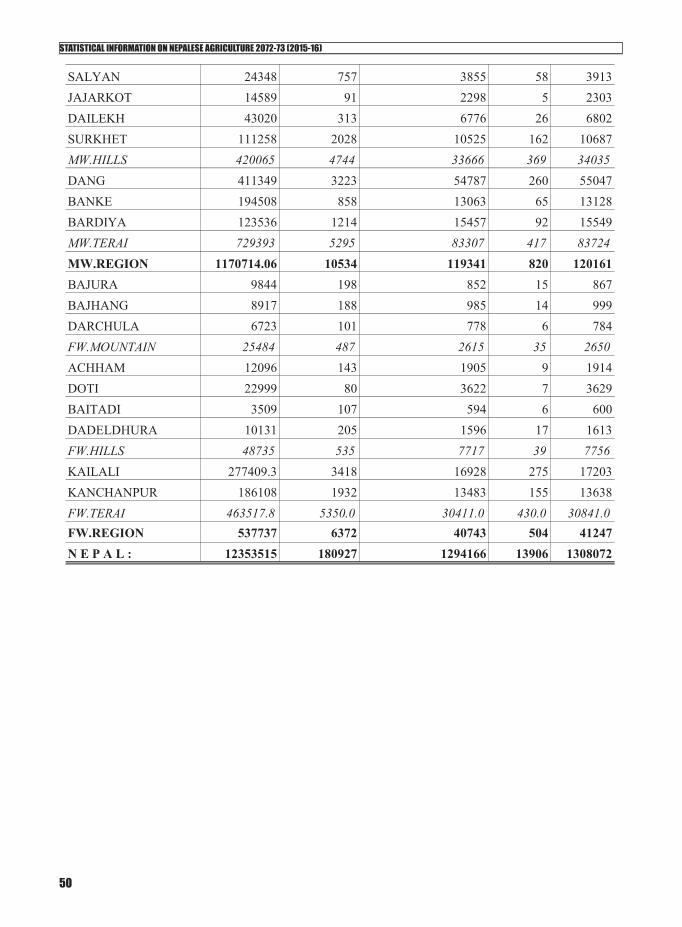
STATISTICAL INFORMATION ON NEPALESE AGRICULTURE 2072-73 (2015-16)
50
SALYAN 24348 757 3855 58 3913JAJARKOT 14589 91 2298 5 2303DAILEKH 43020 313 6776 26 6802SURKHET 111258 2028 10525 162 10687MW.HILLS 420065 4744 33666 369 34035DANG 411349 3223 54787 260 55047BANKE 194508 858 13063 65 13128BARDIYA 123536 1214 15457 92 15549MW.TERAI 729393 5295 83307 417 83724MW.REGION 1170714.06 10534 119341 820 120161BAJURA 9844 198 852 15 867BAJHANG 8917 188 985 14 999DARCHULA 6723 101 778 6 784FW.MOUNTAIN 25484 487 2615 35 2650ACHHAM 12096 143 1905 9 1914DOTI 22999 80 3622 7 3629BAITADI 3509 107 594 6 600DADELDHURA 10131 205 1596 17 1613FW.HILLS 48735 535 7717 39 7756KAILALI 277409.3 3418 16928 275 17203KANCHANPUR 186108 1932 13483 155 13638FW.TERAI 463517.8 5350.0 30411.0 430.0 30841.0FW.REGION 537737 6372 40743 504 41247N E P A L : 12353515 180927 1294166 13906 1308072

STATISTICAL INFORMATION ON NEPALESE AGRICULTURE 2072-73 (2015-16)
51
Unit: Kg
DISTRICT SHEEPS NO. SHEEP WOOL PRODUCED
TAPLEJUNG 5777 3519SANKHUWASHAVA 12181 9050SOLUKHUMBU 8461 6286E.MOUNTAIN 26419 18855PANCHTHAR 1338 994ILLAM 160 118TERHATHUM 7083 5262DHANKUTA 577 324BHOJPUR 18210 13530KHOTANG 9156 5925OKHALDHUNGA 9105 6756UDAYAPUR 609 452E.HILLS 46238 33361JHAPA 36 13MORANG 490 364SUNSARI 3658 3152SAPTARI 2033 1510SIRAHA 941 747E.TERAI 7158 5786E.REGION 79815 58002DOLAKHA 11809 8774SINDHUPALCHOK 7956 5911RASUWA 5335 3964C.MOUNTAIN 25100 18649RAMECHAP 3763 2795SINDHULI 315 234KAVRE 3746 2783BHAKTAPUR 2588 1922LALITPUR 2164 1607KATHMANDU 3075 2284NUWAKOT 19741 14667
TABLE 4.7: WOOL PRODUCTION by DISTRICTS

STATISTICAL INFORMATION ON NEPALESE AGRICULTURE 2072-73 (2015-16)
52
DHADING 8807 6543MAKWANPUR 52 39C.HILLS 44251 32874DHANUSHA 650 482MAHOTTARI 641 476SARLAHI 1187 881RAUTAHAT 917 681BARA 336 249PARSA 144 106CHITWAN 3900 2897C.TERAI 7775 5772C.REGION 77126 57295MANANG 5693 4354MUSTANG 6564 4877W.MOUNTAIN 12257 9231GORKHA 29760 22111LAMJUNG 15961 11859TANAHU 548 407KASKI 16417 12197PARBAT 5491 4079SYANGJA 2401 1580PALPA 2654 1971MYAGDI 9978 7411BAGLUNG 6851 5090GULMI 6942 5157ARGHAKHANCHI 496 369W.HILLS 97499 72231NAWALPARASI 11128 5837RUPANDEHI 4525 2512KAPILBASTU 18680 11920W.TERAI 34333 20269W.REGION 144089 101731DOLPA 33343 24773MUGU 45027 33455HUMLA 28642 21281
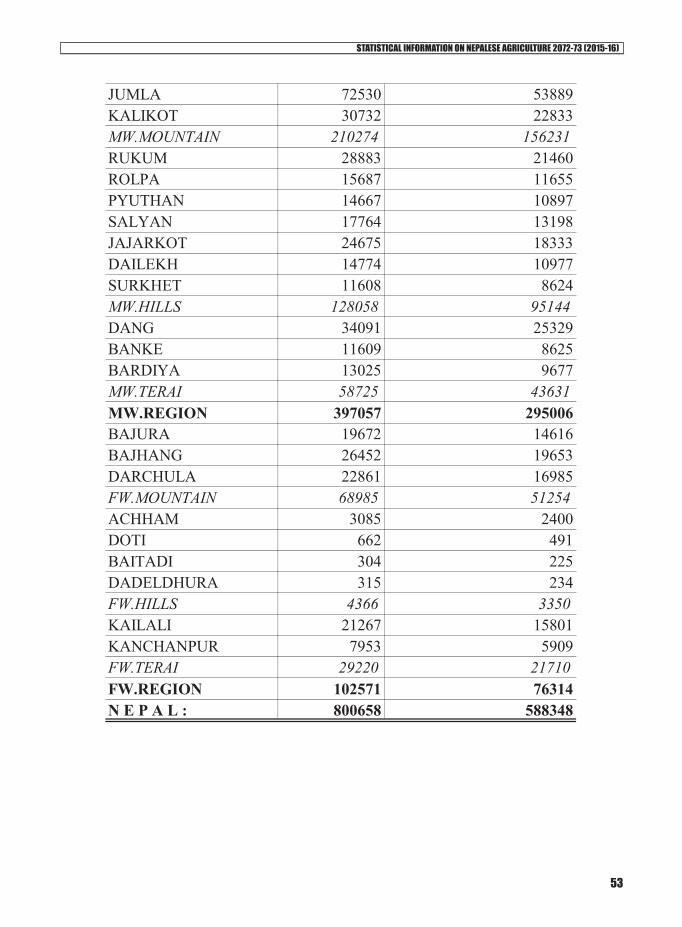
STATISTICAL INFORMATION ON NEPALESE AGRICULTURE 2072-73 (2015-16)
53
JUMLA 72530 53889KALIKOT 30732 22833MW.MOUNTAIN 210274 156231RUKUM 28883 21460ROLPA 15687 11655PYUTHAN 14667 10897SALYAN 17764 13198JAJARKOT 24675 18333DAILEKH 14774 10977SURKHET 11608 8624MW.HILLS 128058 95144DANG 34091 25329BANKE 11609 8625BARDIYA 13025 9677MW.TERAI 58725 43631MW.REGION 397057 295006BAJURA 19672 14616BAJHANG 26452 19653DARCHULA 22861 16985FW.MOUNTAIN 68985 51254ACHHAM 3085 2400DOTI 662 491BAITADI 304 225DADELDHURA 315 234FW.HILLS 4366 3350KAILALI 21267 15801KANCHANPUR 7953 5909FW.TERAI 29220 21710FW.REGION 102571 76314N E P A L : 800658 588348

STATISTICAL INFORMATION ON NEPALESE AGRICULTURE 2072-73 (2015-16)
54
TABLE 4.8 YAK/NAK/CHAURI POPULATION by DISTRICTSUnit. Number
DISTRICT YAK/NAK/CHAURITAPLEJUNG 3465SANKHUWASHAVA 3945SOLUKHUMBU 12235PANCHTHAR 1075ILLAM 165BHOJPUR 887KHOTANG 350OKHALDHUNGA 675E. REGION 22797DOLAKHA 5053SINDHUPALCHOK 4540RASUWA 128RAMECHAP 1653NUWAKOT 920DHADING 190C. REGION 12484MANANG 3272MUSTANG 6059GORKHA 4636LAMJUNG 25KASKI 439MYAGDI 392W. REGION 14823DOLPA 6850MUGU 2076HUMLA 7698JUMLA 545KALIKOT 604RUKUM 62MW. REGION 17835BAJURA 89BAJHANG 381DARCHULA 422FW. REGION 892Total 68831
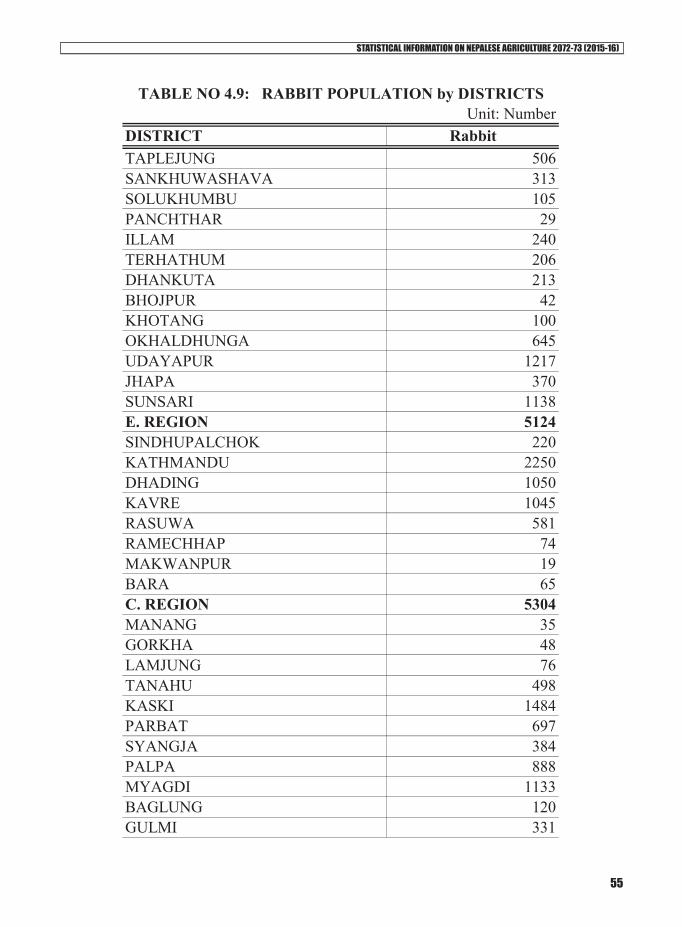
STATISTICAL INFORMATION ON NEPALESE AGRICULTURE 2072-73 (2015-16)
55
Unit: NumberDISTRICT RabbitTAPLEJUNG 506SANKHUWASHAVA 313SOLUKHUMBU 105PANCHTHAR 29ILLAM 240TERHATHUM 206DHANKUTA 213BHOJPUR 42KHOTANG 100OKHALDHUNGA 645UDAYAPUR 1217JHAPA 370SUNSARI 1138E. REGION 5124SINDHUPALCHOK 220KATHMANDU 2250DHADING 1050KAVRE 1045RASUWA 581RAMECHHAP 74MAKWANPUR 19BARA 65C. REGION 5304MANANG 35GORKHA 48LAMJUNG 76TANAHU 498KASKI 1484PARBAT 697SYANGJA 384PALPA 888MYAGDI 1133BAGLUNG 120GULMI 331
TABLE NO 4.9: RABBIT POPULATION by DISTRICTS
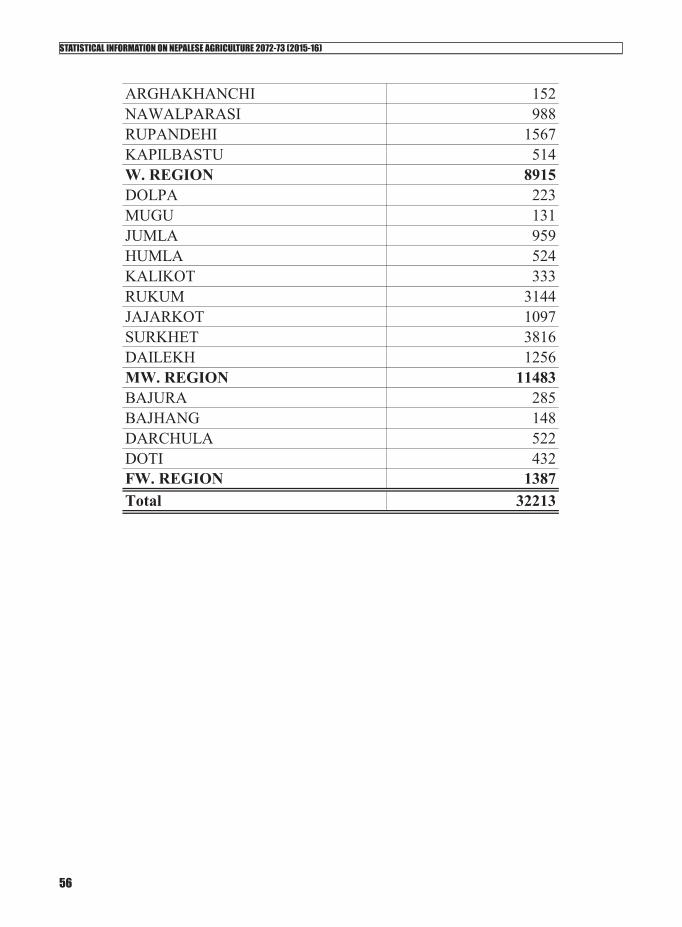
STATISTICAL INFORMATION ON NEPALESE AGRICULTURE 2072-73 (2015-16)
56
ARGHAKHANCHI 152NAWALPARASI 988RUPANDEHI 1567KAPILBASTU 514W. REGION 8915DOLPA 223MUGU 131JUMLA 959HUMLA 524KALIKOT 333RUKUM 3144JAJARKOT 1097SURKHET 3816DAILEKH 1256MW. REGION 11483BAJURA 285BAJHANG 148DARCHULA 522DOTI 432FW. REGION 1387Total 32213

STATISTICAL INFORMATION ON NEPALESE AGRICULTURE 2072-73 (2015-16)
57
Unit: NumberDISTRICT Horses/AssesTAPLEJUNG 543SANKHUWASHAVA 358SOLUKHUMBU 1775PANCHTHAR 15ILLAM 2815TERATHUM 42BHOJPUR 168KHOTANG 350OKHALDHUNGA 102UDAYAPUR 1302JHAPA 42MORANG 47SUNSARI 57E. REGION 7616NUWAKOT 950RAUTAHAT 198BARA 305CHITWAN 15C. REGION 1468MANANG 502MUSTANG 1856GORKHA 854LAMJUNG 21TANAHU 16KASKI 381PARBAT 1043SYANGJA 17MYAGDI 582BAGLUNG 1250GULMI 54ARGHAKHANCHI 17NAWALPARASI 16RUPANDEHI 142KAPILBASTU 1038
TABLE 4.10 HORSES/ASSES POPULATION by DISTRICTS
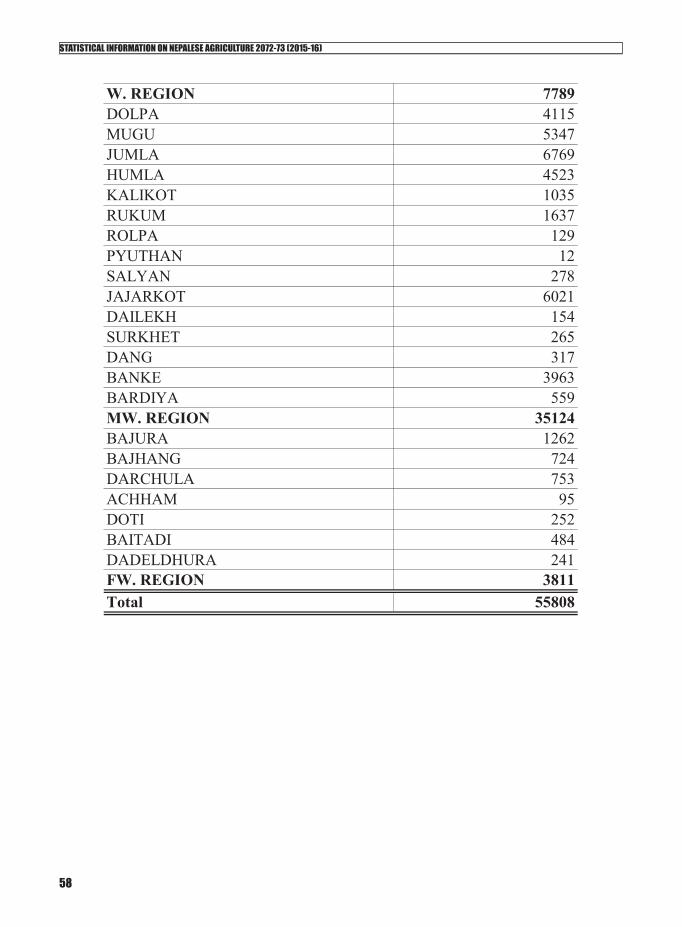
STATISTICAL INFORMATION ON NEPALESE AGRICULTURE 2072-73 (2015-16)
58
W. REGION 7789DOLPA 4115MUGU 5347JUMLA 6769HUMLA 4523KALIKOT 1035RUKUM 1637ROLPA 129PYUTHAN 12SALYAN 278JAJARKOT 6021DAILEKH 154SURKHET 265DANG 317BANKE 3963BARDIYA 559MW. REGION 35124BAJURA 1262BAJHANG 724DARCHULA 753ACHHAM 95DOTI 252BAITADI 484DADELDHURA 241FW. REGION 3811Total 55808

STATISTICAL INFORMATION ON NEPALESE AGRICULTURE 2072-73 (2015-16)
59
5. FISHERY

STATISTICAL INFORMATION ON NEPALESE AGRICULTURE 2072-73 (2015-16)
60

STATISTICAL INFORMATION ON NEPALESE AGRICULTURE 2072-73 (2015-16)
61
Area: Ha, Prod:Kg.
Particulars Pond (Nos.) Total Area(Ha.)
Fish Production (Mt.) YIELD KG/HA
A. Fish Production from Aquaculture Practices 55,500
A1 Pond Fish culture 39,308 9,934 48,543 4,887
Mountain 154 11 28 2,545
Hill 4,203 435 1,205 2,770
Terai 34,951 9,488 47,310 4,986
A2 Other area (ghols) 3,300 6,100 1,848
A3 Paddycum fish culture (Ha) 100 45 450
A4 Cage fish culture (m3) 70,000 350
A5 Enclosure fish culture (Ha) 100 140 1,400
A6 Trout Fish Culture in Raceway (m2) 3,000 300
A7 Fish Production in Public Sector (M.ton) 22
B. Fish Production from Capture Fisheries 21,500
B1 Rivers 395,000 7,110 18
B2 Lakes 5,000 850 170
B3 Reservoirs 1,500 385 257
B4 Marginal/Swamps/ghols etc. 11,100 5,990 540
B5 Low Land Irrigated Paddy Fields 398,000 7,165 18
Total Fish Production (Mt.) 77,000
C. Fish Seed Production/Distribution (No. in '000)
C1 Public Sector
a. Hatchling*
b. Fry
c. Fingerling **
C2 Private Sector
a. Fry* Hactchling of public sector is distributed for fry production in private sector
** Aquarium fish included in Fingerling and count double number for Fry fish seed
11,970
171,444
171,444
Table 5.1: FISH PRODUCTION: ESTIMATED SUMMARY
212,355
40,911
186,928
16,971

STATISTICAL INFORMATION ON NEPALESE AGRICULTURE 2072-73 (2015-16)
62
Area: Ha, Prod:Kg.
DISTRICT POND'S NO. WATER SURFACE AREA (HA)
TOTAL FISH PRODUCTION (KG) YIELD KG/HA
TAPLEJUNG 6 0.12 180 1,500
SANKHUWASHAVA 31 1.93 2,895 1,500
SULUKHUMBU 10 0.20 300 1,500
E.MOUNTAIN 47 2.25 3,375 1,500
PANCHTHAR 60 5.35 8,025 1,500
ILAM 154 13.29 23,335 1,756
TERHATHUM 10 0.20 300 1,500
DHANKUTA 10 1.50 2,250 1,500
BHOJPUR 10 0.50 750 1,500
KHOTANG 60 3.60 5,400 1,500
OKHALDHUNGA 12 1.00 1,500 1,500
UDAYAPUR 405 62.38 222,457 3,566
E.HILLS 721 87.82 264,017 3,006
JHAPA 1,774 279.32 1,372,868 4,915
MORANG 2,912 583.26 2,948,932 5,056
SUNSARI 1,422 320.87 1,591,424 4,960
SAPTARI 2,593 958.16 4,676,252 4,880
SIRAHA 1,856 695.66 3,366,646 4,839
E.TERAI 10,557 2,837.27 13,956,121 4,919
E.REGION 11,325 2,927.34 14,223,514 4,859
DOLKHA 15 1.00 1,500 1,500
SINDHUPALCHOK 46 5.00 19,000 3,800
RASUWA 27 0.50 750 1,500
C.MOUNTAIN 88 6.50 21,250 3,269
RAMECHHAP 30 2.04 5,678 2,783
SINDHULI 180 14.20 34,200 2,408
KAVREPALANCHOK 116 11.26 27,090 2,406
BHAKTAPUR 44 7.58 15,620 2,061
LALITPUR 75 11.00 21,600 1,964
KATHMANDU 112 14.00 29,200 2,086
NUWAKOT 153 16.16 37,840 2,342
DHADING 214 17.83 65,743 3,687
MAKAWANPUR 397 54.62 190,333 3,485
C.HILLS 1,321 148.69 427,304 2,874
DHANUSHA 2,107 862.40 4,243,476 4,921
Table 5.2: WATER SURFACE AREA AND PRODUCTION OF FISH by DISTRICTS
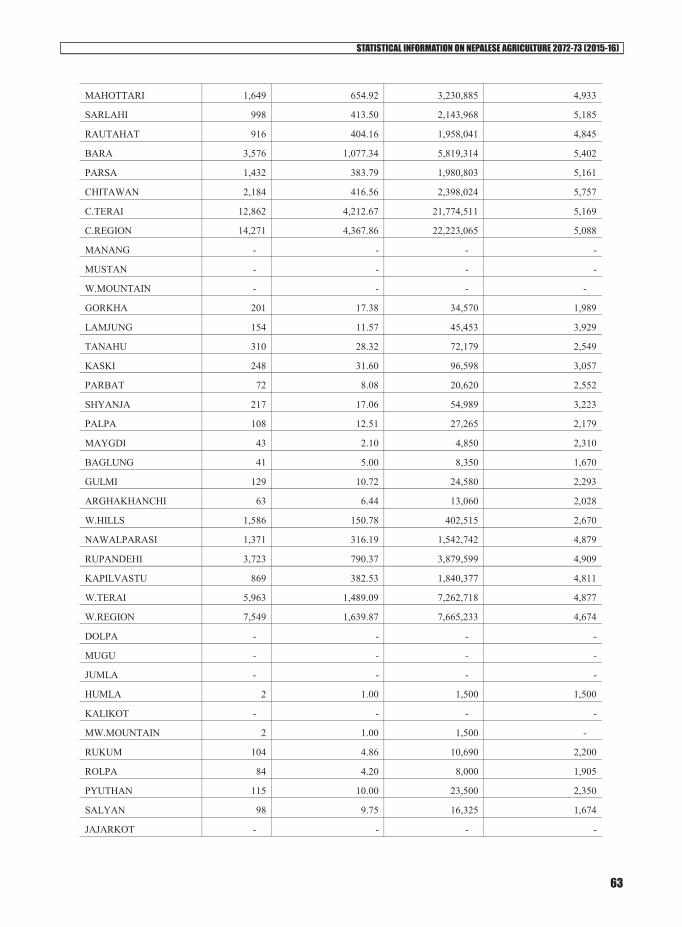
STATISTICAL INFORMATION ON NEPALESE AGRICULTURE 2072-73 (2015-16)
63
MAHOTTARI 1,649 654.92 3,230,885 4,933
SARLAHI 998 413.50 2,143,968 5,185
RAUTAHAT 916 404.16 1,958,041 4,845
BARA 3,576 1,077.34 5,819,314 5,402
PARSA 1,432 383.79 1,980,803 5,161
CHITAWAN 2,184 416.56 2,398,024 5,757
C.TERAI 12,862 4,212.67 21,774,511 5,169
C.REGION 14,271 4,367.86 22,223,065 5,088
MANANG - - - -
MUSTAN - - - -
W.MOUNTAIN - - - -
GORKHA 201 17.38 34,570 1,989
LAMJUNG 154 11.57 45,453 3,929
TANAHU 310 28.32 72,179 2,549
KASKI 248 31.60 96,598 3,057
PARBAT 72 8.08 20,620 2,552
SHYANJA 217 17.06 54,989 3,223
PALPA 108 12.51 27,265 2,179
MAYGDI 43 2.10 4,850 2,310
BAGLUNG 41 5.00 8,350 1,670
GULMI 129 10.72 24,580 2,293
ARGHAKHANCHI 63 6.44 13,060 2,028
W.HILLS 1,586 150.78 402,515 2,670
NAWALPARASI 1,371 316.19 1,542,742 4,879
RUPANDEHI 3,723 790.37 3,879,599 4,909
KAPILVASTU 869 382.53 1,840,377 4,811
W.TERAI 5,963 1,489.09 7,262,718 4,877
W.REGION 7,549 1,639.87 7,665,233 4,674
DOLPA - - - -
MUGU - - - -
JUMLA - - - -
HUMLA 2 1.00 1,500 1,500
KALIKOT - - - -
MW.MOUNTAIN 2 1.00 1,500 -
RUKUM 104 4.86 10,690 2,200
ROLPA 84 4.20 8,000 1,905
PYUTHAN 115 10.00 23,500 2,350
SALYAN 98 9.75 16,325 1,674
JAJARKOT - - - -

STATISTICAL INFORMATION ON NEPALESE AGRICULTURE 2072-73 (2015-16)
64
DAILEKH 80 4.00 6,000 1,500
SURKHET 61 13.09 43,934 3,356
MW.HILLS 542 45.90 108,449 2,363
DANG 741 139.96 633,827 4,529
BANKE 1,323 249.35 1,107,851 4,443
BARDIYA 1,432 297.32 1,414,369 4,757
MW.TERAI 3,496 686.63 3,156,047 4,596
MW.REGION 4,040 733.53 3,265,996 4,452
BAJHURA 12 1.00 1,500 1,500
BAJHANG 5 0.25 375 1,500
DARCHULA - - - -
FW.MOUNTAIN 17 1.25 1,875 1,500
ACHHAM - - - -
DOTI 6 0.56 840.0 1,500
BAITADI 11 0.25 375 1,500
DADELDHURA 16 1.00 1,500 1,500
FW.HILLS 33 1.81 2,715 1,500
KAILALI 1,237 148.94 638,503 4,287
KANCHANPUR 836 113.40 522,100 4,604
FW.TERAI 2,073 262.34 1,160,603 4,424
FW.REGION 2,123 265.40 1,165,193 4,390
NEPAL 39,308 9,934.00 48,543,000 4,887
MOUNTAIN 154 11.00 28,000 2,545
HILL 4,203 435.00 1,205,000 2,770
TERAI 34,951 9,488.00 47,310,000 4,986
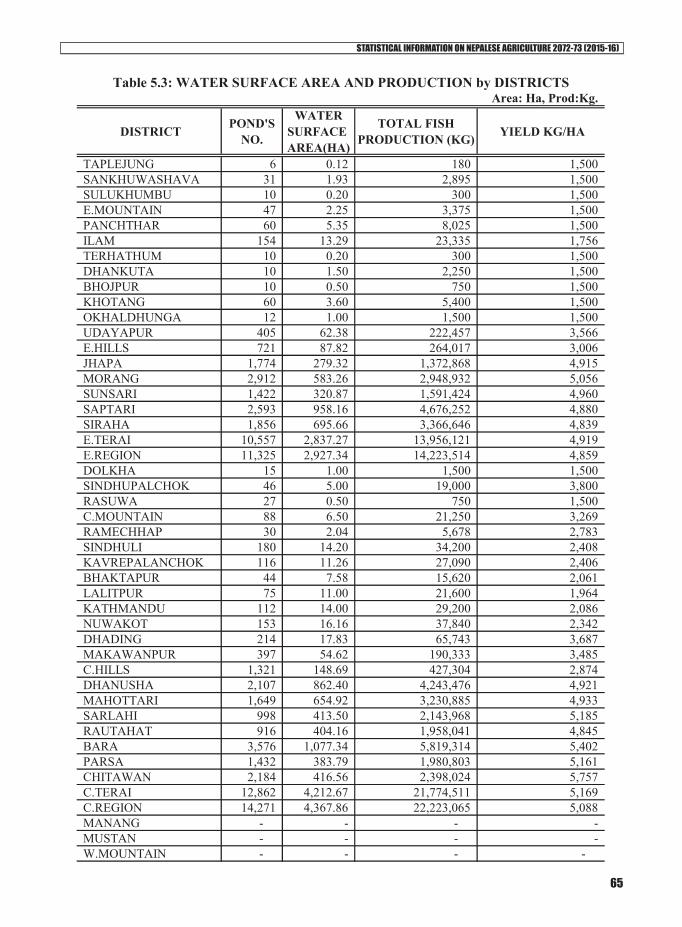
STATISTICAL INFORMATION ON NEPALESE AGRICULTURE 2072-73 (2015-16)
65
Area: Ha, Prod:Kg.
DISTRICT POND'S NO.
WATER SURFACE AREA(HA)
TOTAL FISH PRODUCTION (KG) YIELD KG/HA
TAPLEJUNG 6 0.12 180 1,500 SANKHUWASHAVA 31 1.93 2,895 1,500 SULUKHUMBU 10 0.20 300 1,500 E.MOUNTAIN 47 2.25 3,375 1,500 PANCHTHAR 60 5.35 8,025 1,500 ILAM 154 13.29 23,335 1,756 TERHATHUM 10 0.20 300 1,500 DHANKUTA 10 1.50 2,250 1,500 BHOJPUR 10 0.50 750 1,500 KHOTANG 60 3.60 5,400 1,500 OKHALDHUNGA 12 1.00 1,500 1,500 UDAYAPUR 405 62.38 222,457 3,566 E.HILLS 721 87.82 264,017 3,006 JHAPA 1,774 279.32 1,372,868 4,915 MORANG 2,912 583.26 2,948,932 5,056 SUNSARI 1,422 320.87 1,591,424 4,960 SAPTARI 2,593 958.16 4,676,252 4,880 SIRAHA 1,856 695.66 3,366,646 4,839 E.TERAI 10,557 2,837.27 13,956,121 4,919 E.REGION 11,325 2,927.34 14,223,514 4,859 DOLKHA 15 1.00 1,500 1,500 SINDHUPALCHOK 46 5.00 19,000 3,800 RASUWA 27 0.50 750 1,500 C.MOUNTAIN 88 6.50 21,250 3,269 RAMECHHAP 30 2.04 5,678 2,783 SINDHULI 180 14.20 34,200 2,408 KAVREPALANCHOK 116 11.26 27,090 2,406 BHAKTAPUR 44 7.58 15,620 2,061 LALITPUR 75 11.00 21,600 1,964 KATHMANDU 112 14.00 29,200 2,086 NUWAKOT 153 16.16 37,840 2,342 DHADING 214 17.83 65,743 3,687 MAKAWANPUR 397 54.62 190,333 3,485 C.HILLS 1,321 148.69 427,304 2,874 DHANUSHA 2,107 862.40 4,243,476 4,921 MAHOTTARI 1,649 654.92 3,230,885 4,933 SARLAHI 998 413.50 2,143,968 5,185 RAUTAHAT 916 404.16 1,958,041 4,845 BARA 3,576 1,077.34 5,819,314 5,402 PARSA 1,432 383.79 1,980,803 5,161 CHITAWAN 2,184 416.56 2,398,024 5,757 C.TERAI 12,862 4,212.67 21,774,511 5,169 C.REGION 14,271 4,367.86 22,223,065 5,088 MANANG - - - - MUSTAN - - - - W.MOUNTAIN - - - -
Table 5.3: WATER SURFACE AREA AND PRODUCTION by DISTRICTS
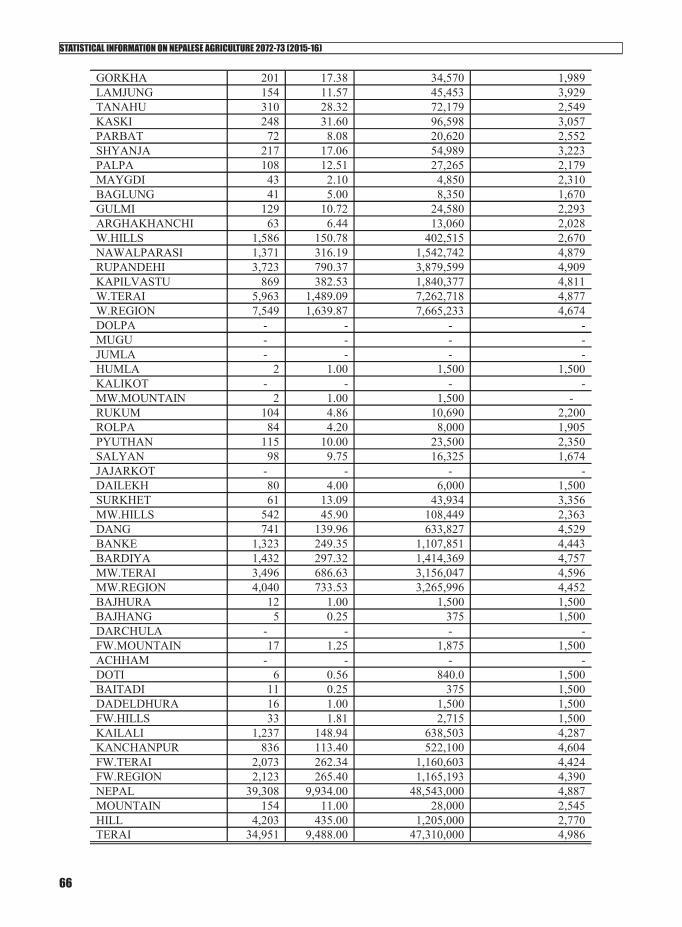
STATISTICAL INFORMATION ON NEPALESE AGRICULTURE 2072-73 (2015-16)
66
GORKHA 201 17.38 34,570 1,989 LAMJUNG 154 11.57 45,453 3,929 TANAHU 310 28.32 72,179 2,549 KASKI 248 31.60 96,598 3,057 PARBAT 72 8.08 20,620 2,552 SHYANJA 217 17.06 54,989 3,223 PALPA 108 12.51 27,265 2,179 MAYGDI 43 2.10 4,850 2,310 BAGLUNG 41 5.00 8,350 1,670 GULMI 129 10.72 24,580 2,293 ARGHAKHANCHI 63 6.44 13,060 2,028 W.HILLS 1,586 150.78 402,515 2,670 NAWALPARASI 1,371 316.19 1,542,742 4,879 RUPANDEHI 3,723 790.37 3,879,599 4,909 KAPILVASTU 869 382.53 1,840,377 4,811 W.TERAI 5,963 1,489.09 7,262,718 4,877 W.REGION 7,549 1,639.87 7,665,233 4,674 DOLPA - - - - MUGU - - - - JUMLA - - - - HUMLA 2 1.00 1,500 1,500 KALIKOT - - - - MW.MOUNTAIN 2 1.00 1,500 - RUKUM 104 4.86 10,690 2,200 ROLPA 84 4.20 8,000 1,905 PYUTHAN 115 10.00 23,500 2,350 SALYAN 98 9.75 16,325 1,674 JAJARKOT - - - - DAILEKH 80 4.00 6,000 1,500 SURKHET 61 13.09 43,934 3,356 MW.HILLS 542 45.90 108,449 2,363 DANG 741 139.96 633,827 4,529 BANKE 1,323 249.35 1,107,851 4,443 BARDIYA 1,432 297.32 1,414,369 4,757 MW.TERAI 3,496 686.63 3,156,047 4,596 MW.REGION 4,040 733.53 3,265,996 4,452 BAJHURA 12 1.00 1,500 1,500 BAJHANG 5 0.25 375 1,500 DARCHULA - - - - FW.MOUNTAIN 17 1.25 1,875 1,500 ACHHAM - - - - DOTI 6 0.56 840.0 1,500 BAITADI 11 0.25 375 1,500 DADELDHURA 16 1.00 1,500 1,500 FW.HILLS 33 1.81 2,715 1,500 KAILALI 1,237 148.94 638,503 4,287 KANCHANPUR 836 113.40 522,100 4,604 FW.TERAI 2,073 262.34 1,160,603 4,424 FW.REGION 2,123 265.40 1,165,193 4,390 NEPAL 39,308 9,934.00 48,543,000 4,887 MOUNTAIN 154 11.00 28,000 2,545 HILL 4,203 435.00 1,205,000 2,770 TERAI 34,951 9,488.00 47,310,000 4,986
STATISTICAL INFORMATION ON NEPALESE AGRICULTURE 2072-73 (2015-16)
67
6. HORTICULTURE

STATISTICAL INFORMATION ON NEPALESE AGRICULTURE 2072-73 (2015-16)
68

STATISTICAL INFORMATION ON NEPALESE AGRICULTURE 2072-73 (2015-16)
69
Types Year Total Area(ha)
Productive Area (ha)
Production (mt)
Yield (mt/ha)
2000/01 20,673 11,892 121,665 10.23
2001/02 22,423 12,615 130,928 10.38
2002/03 23,663 13,312 139,110 10.45
2003/04 24,799 13,931 148,010 10.62
2004/05 25,910 14,606 156,956 10.75
2005/06 26,681 15,206 164,075 10.79
2006/07 27,980 15,832 171,875 10.86
2007/08 30,790 19,915 226,404 11.37
2008/09 32,322 22,482 253,766 11.29
2009/10 33,898 22,903 259,191 11.32
2010/11 35,576 23,607 263,710 11.17
2011/12 37,565 24,089 240,793 10.00
2012/13 36,975 23,645 216,188 9.14
2013/14 38,988 25,497 224,357 8.80
2014/15 39,035 25,261 222,789 8.82
2015/16 40,554 24,854 218,447 8.79
2000/01 15,696 10,429 89,502 8.58
2001/02 16,511 10,653 91,585 8.60
2002/03 17,123 10,800 92,985 8.61
2003/04 17,869 10,983 94,988 8.65
2004/05 18,500 11,150 97,208 8.72
2005/06 19,345 11,336 96,240 8.49
2006/07 19,891 11,465 97,716 8.52
2007/08 20,443 11,659 99,776 8.56
2008/09 21,620 12,025 103,103 8.57
2009/10 22,535 12,573 107,582 8.56
2010/11 24,058 14,059 111,882 7.96
2011/12 26,442 16,087 130,754 8.13
2012/13 24,691 15,577 122,407 7.86
2013/14 25,182 16,318 113,657 6.97
2014/15 27,125 16,849 128,155 7.61
2015/16 27,819 17,125 126,790 7.40
B. W
inte
rA
. Citr
us
TABLE 6.1: FRUITS: AREA, PRODUCTION AND YIELD
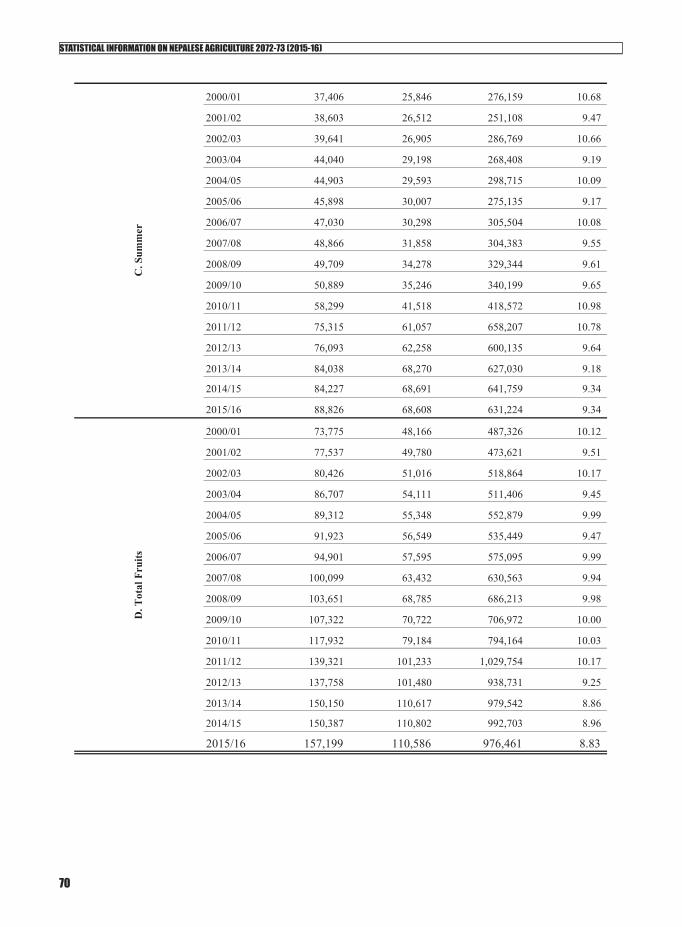
STATISTICAL INFORMATION ON NEPALESE AGRICULTURE 2072-73 (2015-16)
70
2000/01 37,406 25,846 276,159 10.68
2001/02 38,603 26,512 251,108 9.47
2002/03 39,641 26,905 286,769 10.66
2003/04 44,040 29,198 268,408 9.19
2004/05 44,903 29,593 298,715 10.09
2005/06 45,898 30,007 275,135 9.17
2006/07 47,030 30,298 305,504 10.08
2007/08 48,866 31,858 304,383 9.55
2008/09 49,709 34,278 329,344 9.61
2009/10 50,889 35,246 340,199 9.65
2010/11 58,299 41,518 418,572 10.98
2011/12 75,315 61,057 658,207 10.78
2012/13 76,093 62,258 600,135 9.64
2013/14 84,038 68,270 627,030 9.18
2014/15 84,227 68,691 641,759 9.34
2015/16 88,826 68,608 631,224 9.34
2000/01 73,775 48,166 487,326 10.12
2001/02 77,537 49,780 473,621 9.51
2002/03 80,426 51,016 518,864 10.17
2003/04 86,707 54,111 511,406 9.45
2004/05 89,312 55,348 552,879 9.99
2005/06 91,923 56,549 535,449 9.47
2006/07 94,901 57,595 575,095 9.99
2007/08 100,099 63,432 630,563 9.94
2008/09 103,651 68,785 686,213 9.98
2009/10 107,322 70,722 706,972 10.00
2010/11 117,932 79,184 794,164 10.03
2011/12 139,321 101,233 1,029,754 10.17
2012/13 137,758 101,480 938,731 9.25
2013/14 150,150 110,617 979,542 8.86
2014/15 150,387 110,802 992,703 8.96
2015/16 157,199 110,586 976,461 8.83
D. T
otal
Fru
its
C. S
umm
er
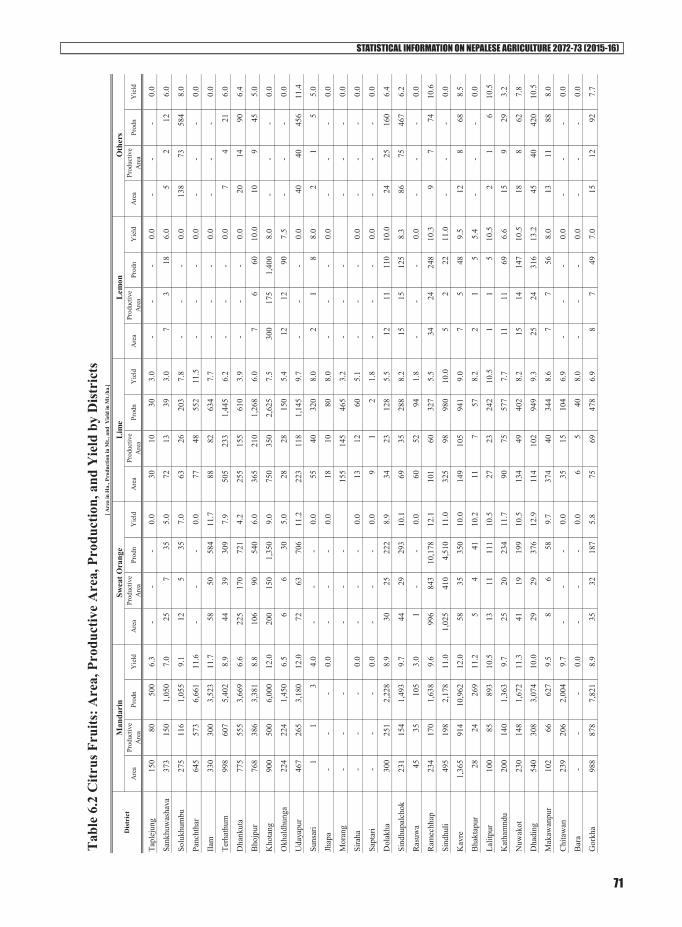
STATISTICAL INFORMATION ON NEPALESE AGRICULTURE 2072-73 (2015-16)
71
Tab
le 6
.2 C
itrus
Fru
its: A
rea,
Pro
duct
ive
Are
a, P
rodu
ctio
n, a
nd Y
ield
by
Dis
tric
ts
[ A
rea
in H
a., P
rodu
ctio
n in
Mt.,
and
Yie
ld in
Mt./
ha.]
Are
aPr
oduc
tive
Are
aPr
odn
Yie
ldA
rea
Prod
uctiv
e A
rea
Prod
nY
ield
Are
aPr
oduc
tive
Are
aPr
odn
Yie
ldA
rea
Prod
uctiv
e A
rea
Prod
nY
ield
Are
aPr
oduc
tive
Are
aPr
odn
Yie
ld
Tapl
ejun
g15
0
80
50
0
6.
3-
-
-
0.
030
10
30
3.0
-
-
-
0.0
-
-
-
0.0
Sank
huw
asha
va37
3
150
1,
050
7.
025
7
35
5.0
72
13
39
3.
07
3
18
6.0
5
2
12
6.
0
Solu
khum
bu27
5
116
1,
055
9.
112
5
35
7.0
63
26
203
7.
8-
-
-
0.
013
8
73
58
4
8.0
Panc
htha
r64
5
573
6,
661
11
.6-
-
-
0.
077
48
55
2
11.5
-
-
-
0.0
-
-
-
0.0
Ilam
330
30
0
3,52
3
11.7
58
50
584
11
.788
82
63
4
7.7
-
-
-
0.0
-
-
-
0.0
Terh
athu
m99
8
607
5,
402
8.
944
39
30
9
7.9
505
23
3
1,44
5
6.
2-
-
-
0.
07
4
21
6.0
Dha
nkut
a77
5
555
3,
669
6.
622
5
170
72
1
4.2
255
15
5
610
3.
9-
-
-
0.
020
14
90
6.4
Bho
jpur
768
38
6
3,38
1
8.8
106
90
540
6.
036
5
210
1,
268
6.0
7
6
60
10
.010
9
45
5.0
Kho
tang
900
50
0
6,00
0
12.0
200
15
0
1,35
0
9.
075
0
350
2,
625
7.5
300
17
5
1,40
0
8.
0-
-
-
0.
0
Okh
aldh
unga
224
22
4
1,45
0
6.5
6
6
30
5.
028
28
15
0
5.4
12
12
90
7.
5-
-
-
0.
0
Uda
yapu
r46
7
265
3,
180
12
.072
63
70
6
11.2
223
11
8
1,14
5
9.
7-
-
-
0.
040
40
45
6
11.4
Suns
ari
1
1
3
4.0
-
-
-
0.0
55
40
320
8.
02
1
8
8.0
2
1
5
5.
0
Jhap
a-
-
-
0.0
-
-
-
0.0
18
10
80
8.
0-
-
-
0.
0-
-
-
0.
0
Mor
ang
-
-
-
-
-
-
15
5
145
46
5
3.2
-
-
-
-
-
-
0.0
Sira
ha-
-
-
0.0
-
-
-
0.0
13
12
60
5.
1-
-
-
0.
0-
-
-
0.
0
Sapt
ari
-
-
-
0.
0-
-
-
0.
09
1
2
1.8
-
-
-
0.0
-
-
-
0.0
Dol
akha
300
25
1
2,22
8
8.9
30
25
222
8.
934
23
12
8
5.5
12
11
110
10
.024
25
16
0
6.4
Sind
hupa
lcho
k23
1
154
1,
493
9.
744
29
29
3
10.1
69
35
288
8.
215
15
12
5
8.3
86
75
467
6.
2
Ras
uwa
45
35
105
3.0
1
-
-
0.
060
52
94
1.8
-
-
-
0.0
-
-
-
0.0
Ram
echh
ap23
4
170
1,
638
9.
699
6
843
10
,178
12
.110
1
60
32
7
5.5
34
24
248
10
.39
7
74
10.6
Sind
huli
495
19
8
2,17
8
11.0
1,02
5
41
0
4,51
0
11
.032
5
98
98
0
10.0
5
2
22
11
.0-
-
-
0.
0
Kav
re1,
365
914
10
,962
12.0
58
35
350
10
.014
9
105
94
1
9.0
7
5
48
9.
512
8
68
8.5
Bha
ktap
ur28
24
26
9
11
.25
4
41
10.2
11
7
57
8.
22
1
5
5.4
-
-
-
0.0
Lalit
pur
100
85
893
10.5
13
11
111
10
.527
23
24
2
10.5
1
1
5
10
.52
1
6
10.5
Kat
ham
ndu
200
14
0
1,36
3
9.7
25
20
234
11
.790
75
57
7
7.7
11
11
69
6.
615
9
29
3.2
Nuw
akot
230
14
8
1,67
2
11.3
41
19
199
10
.513
4
49
40
2
8.2
15
14
147
10
.518
8
62
7.8
Dha
ding
540
30
8
3,07
4
10.0
29
29
376
12
.911
4
102
94
9
9.3
25
24
316
13
.245
40
42
0
10.5
Mak
awan
pur
102
66
627
9.5
8
6
58
9.
737
4
40
34
4
8.6
7
7
56
8.
013
11
88
8.0
Chi
taw
an23
9
206
2,
004
9.
7-
-
-
0.
035
15
10
4
6.9
-
-
-
0.0
-
-
-
0.0
Bar
a-
-
-
0.0
-
-
-
0.0
6
5
40
8.
0-
-
-
0.
0-
-
-
0.
0
Gor
kha
988
87
8
7,82
1
8.9
35
32
187
5.
875
69
47
8
6.9
8
7
49
7.
015
12
92
7.7
Man
dari
nSw
eat O
rang
eL
ime
Lem
onO
ther
sD
istr
ict

STATISTICAL INFORMATION ON NEPALESE AGRICULTURE 2072-73 (2015-16)
72
Lam
jung
530
49
5
4,03
4
8.1
30
28
232
8.
340
36
21
6
6.0
-
-
-
0.0
23
20
176
8.
8
Tana
hu1,
324
995
6,
566
6.
686
68
64
6
9.5
193
14
3
1,28
7
9.
0-
-
-
0.
035
9
294
2,
704
9.2
Kas
ki1,
400
803
6,
700
8.
31
1
9
9.0
20
13
111
8.
512
10
10
0
10.0
16
13
120
9.
2
Parb
at71
5
478
3,
610
7.
658
0
380
3,
002
7.9
135
98
608
6.
2
Syan
gja
1,79
2
1,
250
10,2
00
8.
221
17
15
3
9.0
98
68
245
3.
620
20
20
8
10.4
12
12
80
6.
7
Palp
a70
7
390
5,
236
13
.410
5
78
84
6
10.8
196
13
2
1,32
0
10
.0-
-
-
0.
0-
-
-
0.
0
May
gdi
458
20
1
1,56
8
7.8
102
45
342
7.
656
22
16
5
7.5
16
5
35
7.
020
7
45
6.4
Bag
lung
472
23
2
3,30
0
14.2
17
13
47
3.
664
19
55
2.9
29
15
64
4.
3-
-
-
0.
0
Gul
mi
890
29
8
2,63
2
8.8
29
2
11
5.
713
3
3
10
3.8
7
1
3
6.
78
1
3
6.7
Arg
haka
nchi
741
49
4
5,40
2
10.9
26
19
181
9.
540
0
18
15
3
8.5
-
-
-
0.0
5
5
33
6.
6
Naw
alpa
rass
hi77
57
33
1
5.
8-
-
-
0.
023
5
40
8.3
-
-
-
0.0
-
-
-
0.0
Kap
ilbas
tu-
-
-
-
-
104
60
510
8.
5-
-
-
-
-
-
Dol
pa7
7
45
6.5
-
-
-
4
4
26
6.
5-
-
-
1
1
7
6.5
Mug
u30
17
31
1.8
7
6
19
3.
1-
-
-
0.
0
Kal
ikot
274
65
396
6.1
41
15
106
7.
120
9
37
4.1
22
10
41
4.
1-
-
-
Ruk
um48
8
175
1,
785
10
.210
1
78
73
3
9.4
125
48
360
7.
547
47
34
6
7.4
10
1
5
5.
1
Rol
pa62
7
400
2,
211
5.
597
50
28
0
5.6
147
10
5
389
3.
7-
-
-
-
-
-
Pyut
han
232
99
898
9.1
89
55
690
12
.557
32
25
0
7.8
12
8
86
11
.54
3
20
6.7
Saly
an1,
300
805
4,
427
5.
510
8
50
6.3
35
11
65
5.
930
24
20
0
8.3
-
-
-
0.0
Jaja
rkot
349
15
0
1,52
0
10.1
82
10
90
9.
011
0
60
65
0
10.8
-
-
-
0.0
-
-
-
0.0
Dai
lekh
1,57
6
58
2
5,86
4
10.1
60
22
175
8.
018
1
65
50
5
7.8
-
-
-
0.0
-
-
-
0.0
Surk
het
120
11
8
853
7.2
72
72
410
5.
783
80
95
0
11.9
20
17
120
7.
0-
-
-
0.
0
Dan
g-
-
-
0.0
-
-
-
0.0
246
23
5
1,17
5
5.
0-
-
-
0.
0-
-
-
0.
0
Ban
ke-
-
-
0.0
-
-
-
0.0
29
11
72
6.
57
4
25
7.0
10
7
42
6.
5
Baj
ura
139
84
372
4.4
27
7
62
9.
524
27
13
5
5.0
-
-
-
0.0
-
-
-
0.0
Baj
hang
130
60
533
8.9
5
1
10
10
.073
21
16
8
8.0
5
3
30
10
.058
25
20
7
8.3
Dar
chul
a10
5
75
67
5
9.
048
33
33
0
10.0
38
25
200
8.
015
11
94
8.5
6
4
28
7.
0
Ach
ham
335
14
9
969
6.5
40
15
98
6.
546
12
48
4.0
6
2
8
4.
02
1
3
3.0
Dot
i24
3
232
2,
320
10
.013
3
131
1,
048
8.0
151
13
5
878
6.
554
45
33
8
7.5
-
-
-
0.0
Bai
tadi
16
13
120
9.2
25
21
200
9.
510
8
50
6.3
-
-
-
0.0
-
-
-
0.0
Dad
eldh
ura
112
10
7
1,12
3
10.5
227
21
7
2,60
4
12
.085
73
58
4
8.0
29
25
200
8.
014
10
90
9.0
Kai
lali
120
10
0
800
8.0
20
15
135
9.
030
25
15
0
6.0
30
25
250
10
.0-
-
-
0.
0
Nep
al26
,282
16
,248
14
6,69
0
9.0
5,13
1
3,
443
33,5
58
9.7
7,
296
3,85
8
27
,017
7.
0
837
59
5
4,94
1
8.
3
1,00
8
74
1
6,24
2
0.
0

STATISTICAL INFORMATION ON NEPALESE AGRICULTURE 2072-73 (2015-16)
73
Tab
le 6
.3 W
inte
r Fr
uits
: Are
a, P
rodu
ctiv
e A
rea,
Pro
duct
ion
and
Yie
ld
[Are
a in
Ha.
, Pro
duct
ion
in M
t., a
nd Y
ield
in M
t./ha
.]
Are
aPr
oduc
tive
Are
aPr
odn
Yie
ldA
rea
Prod
uctiv
e A
rea
Prod
nY
ield
Are
aPr
oduc
tive
Are
aPr
odn
Yie
ldA
rea
Prod
uctiv
e A
rea
Prod
nY
ield
Are
aPr
oduc
tive
Are
aPr
odn
Yie
ld
TAPL
EJU
NG
221
13
6
815
6.
039
4.0
30
0.0
1,
800.
0
6.
016
11
63
5.7
135
10
0
55
0
5.5
118
88
484
5.
5SA
NK
HU
WA
SHA
VA
26
4
24
6.
011
7.0
85
.0
60
0.0
7.
18
2
7
3.5
38
15
90
6.0
16
12
72
7.0
SOLU
KH
UM
BU
204
19
0
1,06
4
5.
676
.0
72.0
388.
0
5.4
30
15
64
4.
336
33
158
4.
848
41
27
6
6.7
E.M
OU
NT
AIN
451
33
0
1,90
3
5.
858
7.0
45
7.0
2,
788.
0
6.
154
28
134
5
209
14
8
79
8
5.4
182
14
1
83
2
5.9
PAN
CH
THA
R26
17
22
4
13.2
36.0
28
.0
37
2.4
13
.313
9
108
12
.728
28
358
12
.817
17
22
3
13.1
ILLA
M16
7
63
9.0
76.0
68
.0
60
8.0
8.
962
56
90
1.6
83
75
82
5
11.0
37
33
312
9.
5TE
RH
ATH
UM
106
62
474
7.
713
5.0
81
.0
1,
417.
5
17
.536
13
39
3.0
49
39
27
3
7.0
46
35
238
6.
8D
HA
NK
UTA
23
16
77
4.
816
7.0
12
8.0
1,
725.
0
13
.524
15
45
3.0
40
33
26
4
8.0
20
15
105
7.
0B
HO
JPU
R31
27
27
1.0
94.5
72
.0
84
2.0
11
.723
8
66
8.0
41
32
27
4
8.7
48
40
250
6.
3K
HO
TAN
G12
8
72
64
8
9.0
260.
0
155.
0
1,55
0.0
10.0
45
26
12
5
4.8
40
32
19
2
6.0
45
30
180
6.
0O
KH
ALD
HU
NG
A5
3
22
7.2
11.0
7.
0
68
.3
9.8
3
2
8
4.
024
16
64
4.
024
21
10
5
5.0
UD
AY
APU
R10
9
63
7.0
55.0
44
.0
58
5.0
13
.312
3
16
5.3
30
7
26
3.
730
8
27
3.6
E. H
ills
345
21
2
1,59
7
7.
583
4.5
58
3.0
7,
168.
2
12
.321
7
13
2
49
7
3.8
335
26
2
2,
277
8.7
267
19
9
1,
440
7.3
Suns
ari
-
-
-
-
-
-
-
-
-
-
-
-
-
-
-
E
.TE
RA
I-
-
-
-
-
-
-
-
-
-
-
-
-
-
-
E.R
EG
ION
796
54
2
3,50
0
6.
51,
421.
5
1,
040.
0
9,
956.
2
9.6
271
160
631
3.9
544
410
3,
075
7.5
449
34
0
2,
272
6.
7D
olak
ha3
3
15
5.0
35.0
32
.0
49
6.0
15
.53
3
3
1.0
32
30
22
5
7.5
45
40
320
8.
0Si
ndhu
palc
hok
32
30
210
7.
012
3.0
90
.0
53
1.0
5.
943
20
60
3.0
55
45
32
5
7.2
42
34
240
7.
1R
asuw
a11
2
85
75
5
8.9
98.0
8.
0
80
.0
10.0
5
4
11
3.2
4
3
17
6.0
4
3
25
9.6
C.M
OU
NT
AIN
147
11
8
980
8.
325
6.0
13
0.0
1,
107.
0
8.
551
27
74
2.8
91
78
56
7
7.3
91
77
585
7.
6R
amec
hhap
25
20
138
6.
954
.0
41.0
533.
0
13.0
13
3
5
2.1
50
39
30
6
7.9
31
25
189
7.
6Si
ndhu
li13
11
52
4.7
25.0
25
.0
30
0.0
12
.014
5
15
3.0
42
33
19
3
5.8
24
20
137
6.
9K
avre
85
40
318
8.
010
7.0
73
.5
88
2.0
12
.017
10
54
5.5
27
22
17
6
8.0
31
25
200
8.
0B
hhak
tapu
r16
.0
10.0
130.
0
13.0
10
7
45
6.
47
6
45
7.
5La
litpu
r1
1
5
9.5
150.
0
130.
0
1,36
5.0
10.5
2
2
14
7.0
50
40
42
0
10.5
70
65
682
10
.5K
athm
andu
31
15
227
15
.113
5.0
11
5.0
2,
050.
0
17
.819
16
80
5.0
50
50
53
5
10.7
71
71
602
8.
5N
uwak
ot33
15
13
4
8.9
54.0
48
.0
43
0.0
9.
015
6
17
2.8
25
21
16
9
8.0
10
9
68
8.
0D
hadi
ng10
0
60
24
0
4.0
240.
0
220.
0
1,76
0.0
8.0
Mak
awan
pur
3
3
27
8.
910
3.0
10
0.0
1,
020.
0
10
.29
8
24
3.
022
20
130
6.
53
3
28
11
.0C
.HIL
LS
291
16
5
1,14
1
6.
988
4.0
76
2.5
8,
470.
0
11
.189
49
210
4.
227
5
232
1,97
4
8.
524
7
223
1,95
1
8.
7C
hita
wan
25.0
12
.0
74
.4
6.2
C.T
ER
AI
-
-
-
-
-
-
-
-
-
-
-
-
-
-
-
C
.RE
GIO
N43
8
283
2,
121
7.5
1,14
0.0
892.
5
9,57
7.0
10.7
140
76
284
3.
736
6
310
2,54
0
8.
233
8
300
2,53
5
8.
5M
anan
g19
8
75
75
0
10.0
2.0
1.5
22.0
14
.76
5
40
8.
08
4
44
11
.06
6
63
11
.5M
usta
ng95
7
330
5,
000
15.2
13.0
5.
0
58
.0
11.6
54
35
31
0
8.9
9
5
34
6.8
13
10
85
8.5
Peac
hD
istr
ict
App
lePe
arW
alnu
tPl
um

STATISTICAL INFORMATION ON NEPALESE AGRICULTURE 2072-73 (2015-16)
74
[Are
a in
Ha.
, Pro
duct
ion
in M
t., a
nd Y
ield
in M
t./ha
.]
Are
aPr
oduc
tive
Are
aPr
odn
Yie
ldA
rea
Prod
uctiv
e A
rea
Prod
nY
ield
Are
aPr
oduc
tive
Are
aPr
odn
Yie
ldA
rea
Prod
uctiv
e A
rea
Prod
nY
ield
Are
aPr
oduc
tive
Are
aPr
odn
Yie
ld
W.M
OU
NT
AIN
1,15
5
40
5
5,75
0
14
.215
.0
6.5
80.0
12
.360
40
350
8.
817
9
78
8.7
18
16
148
9.
6G
orkh
a55
40
12
4
3.1
100.
0
75.0
1,17
7.0
15.7
3
2
4
2.
021
21
58
2.
811
11
40
3.
6La
mju
ng22
8
56
7.0
55.0
40
.0
44
0.0
11
.035
13
43
3.3
30
25
19
0
7.6
28
21
179
8.
5Ta
nahu
95.0
71
.0
74
5.0
10
.522
14
34
2.4
44
30
24
6
8.2
38
22
129
5.
9K
aski
3
3
10
3.
365
.0
55.0
451.
0
8.2
4
3
15
5.0
18
16
12
8
8.0
23
20
160
8.
0Pa
rbat
0
0
2
5.
077
.0
60.0
624.
0
10.4
33
17
77
4.
736
29
214
7.
418
14
97
7.
0Sy
angj
a11
7.0
11
6.0
1,
020.
0
8.
862
62
310
5.
023
23
13
8
6.0
Palp
a11
3.0
11
3.0
1,
887.
8
16
.713
11
27
2.5
70
47
31
3
6.7
43
29
199
6.
9M
aygd
i13
5
27
5.2
43.0
28
.0
19
6.0
7.
023
7
31
4.4
25
15
69
4.6
29
19
206
10
.8B
aglu
ng84
45
30
0
6.7
114.
0
76.0
520.
0
6.8
30
5
32
6.
464
47
230
4.
954
35
20
6
5.9
Gul
mi
7
2
8
4.
050
.0
30.0
120.
0
4.0
25
8
4
0.6
35
22
15
4
7.0
39
25
175
7.
0A
rgha
khac
hi-
73
.0
70.0
628.
5
9.0
43
16
15
1
9.4
45
44
42
8
9.7
48
48
360
7.
5W
.HIL
LS
184
10
4
527
5.
190
2.0
73
4.0
7,
809.
3
10
.623
1
95
41
8
4.4
450
35
8
2,
339
6.5
354
26
7
1,
889
7.1
W.T
ER
AI
-
-
-
-
-
-
-
-
-
-
-
-
-
-
-
W
.RE
GIO
N1,
339
509
6,
277
12.3
917.
0
740.
5
7,88
9.3
10.7
291
135
768
5.
746
7
367
2,41
7
6.
637
2
283
2,03
7
7.
2D
olpa
850
35
5
568
1.
63.
0
2.
0
2.
0
1.
035
0
20
5
39
0
1.9
8
4
6
1.5
3
2
2
1.
0M
ugu
950
36
5
2,65
1
7.
349
.0
45.0
270.
0
6.0
156
65
325
5.
045
43
219
5.
120
18
10
8
6.0
Hum
la45
0
157
1,
664
10.6
21.0
16
.0
16
9.0
10
.610
1
28
11
8
4.2
7
4
24
6.0
18
15
99
6.6
Jum
la3,
100
850
3,
150
3.7
170.
0
170.
0
105.
0
0.6
170
77
605
7.
912
0
90
36
0
4.0
85
60
240
4.
0K
alik
ot1,
613
1,45
1
11
,027
7.
661
.0
36.0
407.
0
11.3
311
271
785
2.
920
9
152
669
4.
419
15
10
2
6.8
MW
.MO
UN
TA
IN6,
963
3,17
8
19
,060
6.
030
4.0
26
9.0
95
3.0
3.
51,
088
64
6
2,
223
3.4
389
29
3
1,
278
4.4
145
11
0
55
1
5.0
Ruk
um45
1
320
3,
488
10.9
31.0
23
.0
23
4.6
10
.222
6
68
39
2
5.8
52
38
28
5
7.5
18
11
81
7.4
Rol
pa20
0
175
1,
523
8.7
100.
0
72.0
1,04
9.8
14.6
65
61
32
4
5.3
30
28
21
7
7.8
137
11
5
73
5
6.4
Pyut
han
13
3
9
3.
530
.0
25.0
190.
0
7.6
11
2
4
2.0
25
20
10
0
5.0
5
4
16
4.0
Saly
an62
61
27
2
4.5
26.0
24
.0
21
3.0
8.
910
7
12
1.8
82
78
48
2
6.2
20
20
110
5.
5Ja
jark
ot13
5
22
61
2.8
47.0
36
.0
40
8.0
11
.311
0
31
72
2.
329
23
151
6.
639
25
17
5
7.0
Dai
lekh
a73
42
35
9
8.5
64.0
38
.0
47
6.0
12
.518
8
10
0
25
0
2.5
51
32
25
1
7.8
39
33
228
7.
0Su
rkhe
t19
14
86
6.1
40.0
31
.0
26
2.0
8.
549
49
65
1.3
39
30
19
2
6.4
15
15
135
9.
0M
W.H
ILL
S95
3
637
5,
797
9.1
338.
0
249.
0
2,83
3.4
11.4
659
318
1,11
9
3.
530
8
249
1,67
8
6.
727
2
223
1,48
0
6.
7B
anke
MW
.TE
RA
IM
W.R
EG
ION
7,91
6
3,
815
24,8
57
6.5
642.
0
518.
0
3,78
6.4
7.3
1,74
7
964
3,34
2
3.
569
7
542
2,95
6
5.
541
7
333
2,03
1
6.
1B
ajur
a20
0
98
49
0
5.0
39.5
30
.0
34
2.6
11
.493
45
139
3.
136
27
176
6.
539
33
18
8
5.7
Bha
jang
360
18
0
2,14
0
11
.991
.0
55.0
575.
0
10.5
185
45
265
5.
966
45
445
9.
939
31
23
5
7.6
Dar
chul
a12
9
51
56
1
11.0
20.0
15
.0
18
0.0
12
.015
5
77
46
2
6.0
34
23
25
3
11.0
11
8
80
10
.0FW
.MO
UN
TA
IN68
9
329
3,
191
9.7
150.
5
100.
0
1,09
7.6
11.0
433
167
866
5.
213
6
95
87
4
9.2
89
72
503
7.
0A
cham
18
11
72
6.
571
.0
52.0
494.
0
9.5
183
32
144
4.
542
31
217
7.
021
15
90
6.
0D
oti
64
40
320
8.
052
.0
38.0
304.
0
8.0
198
110
275
2.
542
37
222
6.
026
20
12
0
6.0
Bai
tadi
224
92
644
7.
072
.5
55.0
660.
0
12.0
398
164
850
5.
261
53
386
7.
345
40
41
5
10.4
Dad
eldh
ura
5
5
30
6.
055
.0
50.0
400.
0
8.0
110
80
792
9.
992
85
467
5.
560
56
56
0
10.0
FW.H
ILL
S31
1
148
1,
066
7.2
250.
5
195.
0
1,85
8.0
9.5
889
386
2,06
1
5.
323
7
206
1,29
2
6.
315
2
131
1,18
5
9.
0K
aila
li80
.0
70.0
560.
0
8.0
20
18
12
6
7.0
FW.T
ER
AI
80.0
70
.0
56
0.0
8.
020
18
126
7.
0FW
.RE
GIO
N1,
000
477
4,
257
8.9
481.
0
365.
0
3,51
5.6
9.6
1,32
2
553
2,92
7
5.
339
3
319
2,29
2
7.
224
1
203
1,68
8
8.
3N
epal
11,4
87
5,62
5
41
,011
7.
34,
601.
5
3,
556.
0
34
,724
.4
9.8
3,77
0
1,88
8
7,95
2
4.
22,
466
1,94
7
13,2
80
6.8
1,81
5
1,
457
10
,563
7.
2
Dis
tric
tA
pple
Pear
Wal
nut
Peac
hPl
um
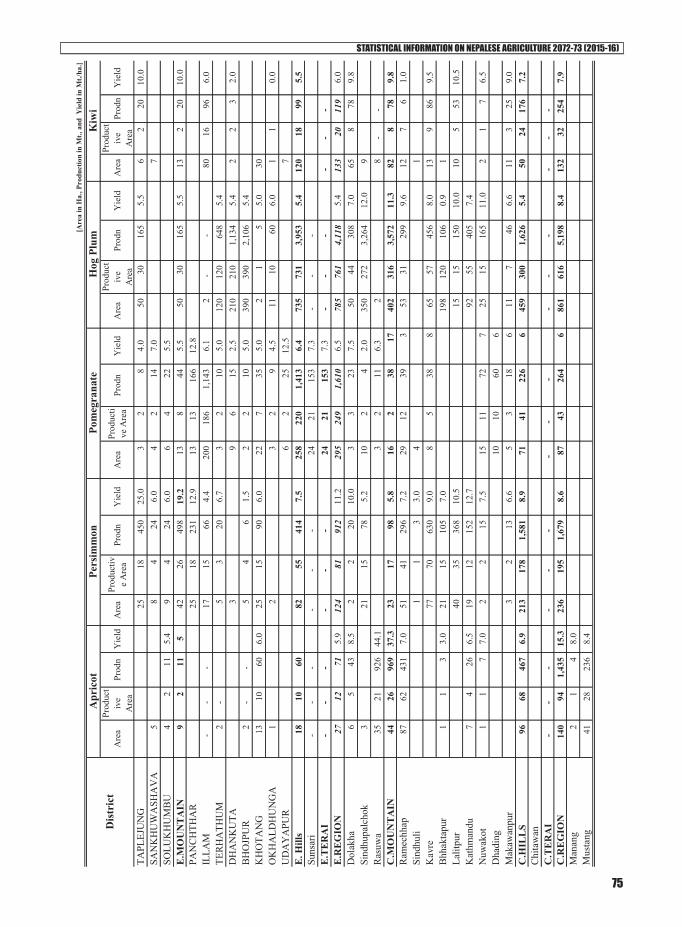
STATISTICAL INFORMATION ON NEPALESE AGRICULTURE 2072-73 (2015-16)
75
[Are
a in
Ha.
, Pro
duct
ion
in M
t., a
nd Y
ield
in M
t./ha
.]
Are
aPr
oduc
tiv
e A
rea
Prod
nY
ield
Are
aPr
oduc
tive
Are
aPr
odn
Yie
ldA
rea
Prod
ucti
ve A
rea
Prod
nY
ield
Are
aPr
oduc
tiv
e A
rea
Prod
nY
ield
Are
aPr
oduc
tiv
e A
rea
Prod
nY
ield
TAPL
EJU
NG
25
18
450
25
.03
2
8
4.
050
30
16
5
5.5
6
2
20
10.0
SAN
KH
UW
ASH
AV
A5
8
4
24
6.0
4
2
14
7.
07
SOLU
KH
UM
BU
4
2
11
5.
49
4
24
6.
06
4
22
5.5
E.M
OU
NT
AIN
9
2
11
5
42
26
498
19
.213
8
44
5.
550
30
16
5
5.5
13
2
20
10.0
PAN
CH
THA
R25
18
23
1
12.9
13
13
166
12
.8IL
LAM
-
-
-
17
15
66
4.
420
0
186
1,14
3
6.
12
-
-
80
16
96
6.0
TER
HA
THU
M2
-
5
3
20
6.
73
2
10
5.0
120
120
648
5.
4D
HA
NK
UTA
3
9
6
15
2.
521
0
21
0
1,
134
5.4
2
2
3
2.
0B
HO
JPU
R2
-
-
5
4
6
1.5
2
2
10
5.
039
0
39
0
2,
106
5.4
KH
OTA
NG
13
10
60
6.0
25
15
90
6.
022
7
35
5.
02
1
5
5.
030
OK
HA
LDH
UN
GA
1
2
3
2
9
4.
511
10
60
6.0
1
1
0.
0U
DA
YA
PUR
6
2
25
12
.57
E. H
ills
18
10
60
82
55
414
7.
525
8
220
1,41
3
6.
473
5
73
1
3,
953
5.4
120
18
99
5.
5Su
nsar
i-
-
-
-
-
-
24
21
153
7.
3-
-
-
E
.TE
RA
I-
-
-
-
-
-
24
21
153
7.
3-
-
-
-
-
-
E.R
EG
ION
27
12
71
5.
912
4
81
912
11
.229
5
24
9
1,
610
6.5
785
761
4,11
8
5.
413
3
20
11
9
6.0
Dol
akha
6
5
43
8.
52
2
20
10
.03
3
23
7.5
50
44
308
7.
065
8
78
9.
8Si
ndhu
palc
hok
3
21
15
78
5.2
10
2
4
2.
035
0
27
2
3,
264
12.0
9
R
asuw
a35
21
92
6
44
.13
2
11
6.3
2
8
-
-
C.M
OU
NT
AIN
44
26
969
37.3
23
17
98
5.
816
2
38
17
40
2
31
6
3,
572
11.3
82
8
78
9.8
Ram
echh
ap87
62
43
1
7.
051
41
29
6
7.2
29
12
39
3
53
31
299
9.
612
7
6
1.0
Sind
huli
1
1
3
3.0
4
1
Kav
re77
70
63
0
9.0
8
5
38
8
65
57
456
8.
013
9
86
9.
5B
hhak
tapu
r1
1
3
3.
021
15
10
5
7.0
198
120
106
0.
91
Lalit
pur
40
35
368
10
.515
15
15
0
10.0
10
5
53
10.5
Kat
hman
du7
4
26
6.5
19
12
152
12
.792
55
40
5
7.4
Nuw
akot
1
1
7
7.0
2
2
15
7.5
15
11
72
7
25
15
165
11
.02
1
7
6.5
Dha
ding
10
10
60
6
Mak
awan
pur
3
2
13
6.6
5
3
18
6
11
7
46
6.
611
3
25
9.
0C
.HIL
LS
96
68
467
6.9
213
178
1,
581
8.9
71
41
226
6
459
300
1,62
6
5.
450
24
17
6
7.2
Chi
taw
anC
.TE
RA
I-
-
-
-
-
-
-
-
-
-
-
-
- -
- C
.RE
GIO
N14
0
94
1,43
5
15.3
236
195
1,
679
8.6
87
43
264
6
861
616
5,19
8
8.
413
2
32
25
4
7.9
Man
ang
2
1
4
8.0
Mus
tang
41
28
236
8.4
Dis
tric
tK
iwi
Apr
icot
Pers
imm
onH
og P
lum
Pom
egra
nate
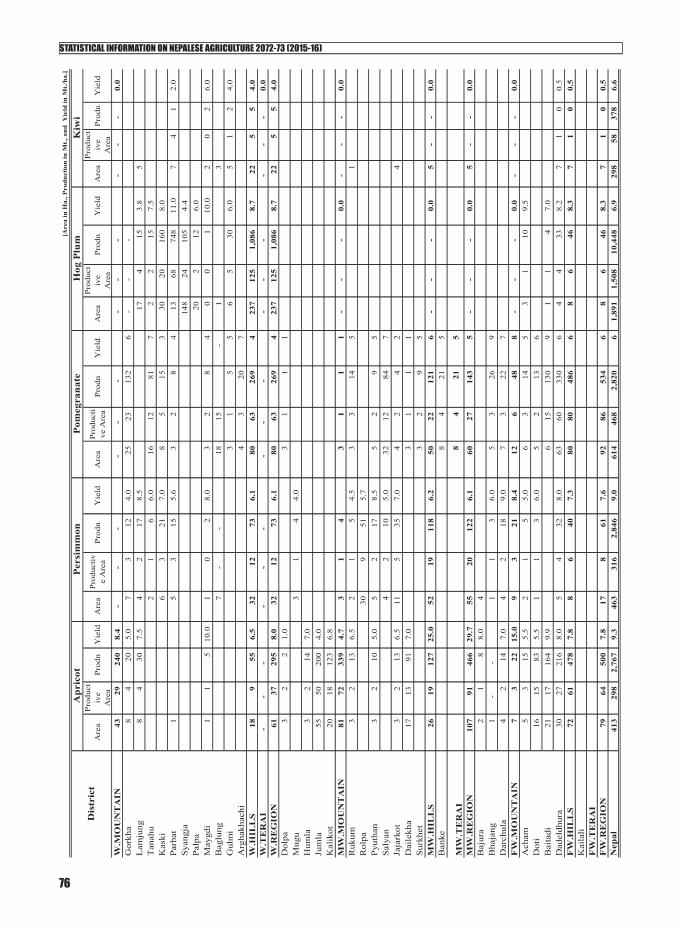
STATISTICAL INFORMATION ON NEPALESE AGRICULTURE 2072-73 (2015-16)
76
[Are
a in
Ha.
, Pro
duct
ion
in M
t., a
nd Y
ield
in M
t./h
a.]
Are
aPr
oduc
tiv
e A
rea
Prod
nY
ield
Are
aPr
oduc
tive
Are
aPr
odn
Yie
ldA
rea
Prod
ucti
ve A
rea
Prod
nY
ield
Are
aPr
oduc
tiv
e A
rea
Prod
nY
ield
Are
aPr
oduc
tiv
e A
rea
Prod
nY
ield
W.M
OU
NT
AIN
43
29
240
8.4
-
-
-
-
-
-
-
-
-
-
-
-
0.0
Gor
kha
8
4
20
5.
07
3
12
4.
025
23
13
2
6
-
-
-
L
amju
ng8
4
30
7.5
4
2
17
8.5
17
4
15
3.
85
Tan
ahu
2
1
6
6.0
16
12
81
7
2
2
15
7.5
Kas
ki6
3
21
7.
08
5
15
3
30
20
16
0
8.0
Parb
at1
5
3
15
5.6
3
2
8
4
13
68
74
8
11.0
7
4
1
2.
0Sy
angj
a14
8
24
10
5
4.4
Palp
a20
2
12
6.0
May
gdi
1
1
5
10.0
1
0
2
8.0
3
2
8
4
0
0
1
10
.02
0
2
6.0
Bag
lung
7
-
-
18
15
-
1
3
Gul
mi
3
1
5
5
6
5
30
6.
05
1
2
4.0
Arg
hakh
achi
4
3
20
7
W.H
ILL
S18
9
55
6.
532
12
73
6.1
80
63
269
4
237
125
1,08
6
8.
722
5
5
4.0
W.T
ER
AI
-
-
-
-
-
-
-
-
-
-
-
-
-
-
-
0.0
W.R
EG
ION
61
37
295
8.0
32
12
73
6.
180
63
26
9
4
23
7
12
5
1,
086
8.7
22
5
5
4.
0D
olpa
3
2
2
1.0
3
1
1
1
M
ugu
3
1
4
4.0
Hum
la3
2
14
7.0
Jum
la55
50
20
0
4.
0K
alik
ot20
18
12
3
6.
8M
W.M
OU
NT
AIN
81
72
339
4.7
3
1
4
3
1
1
1
-
-
-
0.
0-
-
-
0.0
Ruk
um3
2
13
6.5
2
1
5
4.5
3
3
14
5
1
R
olpa
30
9
51
5.
7Py
utha
n3
2
10
5.0
5
2
17
8.5
5
2
9
5
Sa
lyan
4
2
10
5.0
32
12
84
7
Jaja
rkot
3
2
13
6.
511
5
35
7.0
4
2
4
2
4
Dai
lekh
a17
13
91
7.
03
1
1
1
Surk
het
3
2
9
5
M
W.H
ILL
S26
19
12
7
25
.052
19
11
8
6.2
50
22
121
6
-
-
-
0.0
5
-
- 0.
0B
anke
8
4
21
5
MW
.TE
RA
I8
4
21
5
MW
.RE
GIO
N10
7
91
466
29.7
55
20
122
6.
160
27
14
3
5
-
-
-
0.
05
-
-
0.0
Baj
ura
2
1
8
8.0
4
Bha
jang
1
-
-
1
1
3
6.
05
3
26
9
D
arch
ula
4
2
14
7.
04
2
18
9.
07
3
22
7
F
W.M
OU
NT
AIN
7
3
22
15
.09
3
21
8.
412
6
48
8
-
-
-
0.0
- -
- 0.
0A
cham
5
3
15
5.
52
1
5
5.
06
3
14
5
3
1
10
9.
5D
oti
16
15
83
5.5
1
1
3
6.0
5
2
13
6
Bai
tadi
21
17
164
9.9
6
15
13
0
9
1
1
4
7.
0D
adel
dhur
a30
27
21
6
8.
05
4
32
8.
063
60
33
0
6
4
4
33
8.
27
1
0
0.5
FW
.HIL
LS
72
61
478
7.8
8
6
40
7.3
80
80
486
6
8
6
46
8.3
7
1
0
0.
5K
aila
liF
W.T
ER
AI
FW
.RE
GIO
N79
64
50
0
7.
817
8
61
7.6
92
86
534
6
8
6
46
8.3
7
1
0
0.
5N
epal
413
29
8
2,
767
9.
346
3
31
6
2,84
6
9.
061
4
468
2,82
0
6
1,89
1
1,50
8
10,4
48
6.9
298
58
378
6.
6
Hog
Plu
mK
iwi
Dis
tric
tA
pric
otP
ersi
mm
onP
omeg
rana
te

STATISTICAL INFORMATION ON NEPALESE AGRICULTURE 2072-73 (2015-16)
77
Tab
le 6
.4 S
umm
er F
ruits
: Are
a, P
rodu
ctiv
e A
rea,
Pro
duct
ion
and
Yie
ld b
y D
istr
icts
Dis
trict
Are
aPr
oduc
tive
Are
aPr
odn
Yie
ldA
rea
Prod
uct
ive
Are
aPr
odn
Yie
ldA
rea
Prod
ucti
ve A
rea
Prod
nY
ield
Are
aPr
oduc
tive
Are
aPr
odn
Yie
ldA
rea
Prod
uct
ive
Are
aPr
odn
Yie
ld
TAPL
EJU
NG
45
30
180
6.
0040
26
23
9
9.20
46
33
36
3
11
.00
10
8
10
0
12.5
08
4
48
12
.00
SAN
KH
UW
ASH
AV
A85
32
25
6
8.00
72
51
663
13
.00
18
11
99
9.
0010
8
128
16
.00
11
5
80
16
.00
SOLU
KH
UM
BU
32
20
128
6.
4020
17
14
4
8.47
24
17
16
2
9.
505
4
42
10.5
0
E.M
OU
NT
AIN
162
82
564
6.
8813
2
94
1,
046
11.1
388
61
624
10.2
225
20
27
0
13.5
019
9
128
14.2
2
PAN
CH
THA
R13
0
86
1,
021
11.8
78
8
98
12
.30
11
11
13
8
12
.50
5
2
25
12.4
0
ILLA
M76
68
1,
164
17.1
225
23
26
0
11.3
063
57
632
11.0
914
10
113
11.3
0
TER
HA
THU
M12
5
107
1,
091
10.2
021
1
211
3,
904
18.5
076
57
633
11.2
016
12
15
6
13.0
015
11
127
11.5
5
DH
AN
KU
TA27
5
130
1,
202
9.25
30
28
336
12
.00
47
35
29
8
8.
515
5
40
8.00
16
14
91
6.
50
BH
OJP
UR
105
50
403
8.
0551
46
48
3
10.5
045
33
383
11.6
012
10
12
1
12.1
015
11
140
12.7
3
KH
OTA
NG
310
20
5
1,71
7
8.
3812
0
90
99
0
11.0
018
0
142
165
1.16
12
10
121
12
.10
132
101
1,
313
13.0
0
OK
HA
LDH
UN
GA
43
22
176
8.
0033
30
30
0
10.0
010
9
45
5.
00
UD
AY
APU
R75
7
373
52
2
1.40
117
93
1,20
9
13
.00
55
45
11
0.
2366
25
14
13.5
030
16
25
1.56
E. H
ills
1,82
1
1,
041
7,29
6
7.
0159
5
529
7,
580
14.3
348
7
389
2,30
4
5.93
111
62
45
2
7.29
227
165
1,
834
11.1
1
Jhap
a1,
300
1,20
0
19
,176
15
.98
1,75
9
1,
758
33,7
54
19.2
022
5
225
2,00
9
8.93
62
61
610
10
.00
21
20
22
0
11
.00
Mor
ang
555
54
0
3,42
0
6.
332,
150
2,10
0
29
,400
14
.00
55
50
55
1.
1073
58
78
9
13.6
040
40
520
13.0
0
Suns
ari
1,50
0
1,
215
10,9
35
9.00
450
40
0
7,20
0
18
.00
47
37
31
5
8.
5035
30
37
5
12.5
040
30
420
14.0
0
Sapt
ari
6,53
0
5,
626
22,5
56
4.01
1,75
0
1,
550
38,7
50
25.0
013
11
55
5.00
5
5
27
6.
0035
22
550
25.0
0
Sira
ha5,
650
4,95
0
32
,214
6.
5111
7
116
4,
060
35.0
052
50
625
12.5
01
1
10
16.0
030
25
900
36.0
0
E. T
erai
15,5
35
13
,531
88,3
01
6.53
6,22
6
5,
924
113,
164
19.1
039
2
373
3,05
9
8.20
176
154
1,81
1
11
.75
166
137
2,
610
19.0
5
E.R
EGIO
N17
,518
14,6
54
96
,161
6.
566,
953
6,54
7
12
1,79
0
18
.60
967
82
3
5,
986
7.
2831
2
23
6
2,
533
10.7
341
2
31
1
4,57
2
14
.70
Dol
kha
4
3
21
7.
0040
35
42
0
12.0
08
8
44
5.50
2
2
24
12
.00
Sind
hupa
lcho
k16
5
110
66
1
6.01
130
75
1,13
5
15
.13
155
77
670
8.70
26
20
205
10
.25
35
25
25
6
10
.24
Ras
uwa
25
19
1,61
5
85
.00
102
85
1,36
0
16
.00
8
6
49
8.
004
3
52
17.4
01
0
7
17.0
0
C.M
OU
NTA
IN19
4
132
2,
297
17.4
027
2
195
2,
915
14.9
517
1
91
76
3
8.
3732
25
28
1
11.2
536
25
263
10.3
5
Ram
echh
pa14
2
97
88
5
9.12
80
73
979
13
.41
56
39
23
4
6.
0118
16
20
8
12.9
866
55
987
17.9
5
Sind
huli
152
95
1,14
0
12
.00
390
23
4
2,34
0
10
.00
155
77
670
8.70
15
15
221
14
.73
35
25
25
6
10
.24
[Are
a in
Ha.
, Pro
duct
ion
in M
t., a
nd Y
ield
in M
t./ha
.]
Man
goB
anan
aG
uava
Papa
yaJa
ckfr
uit
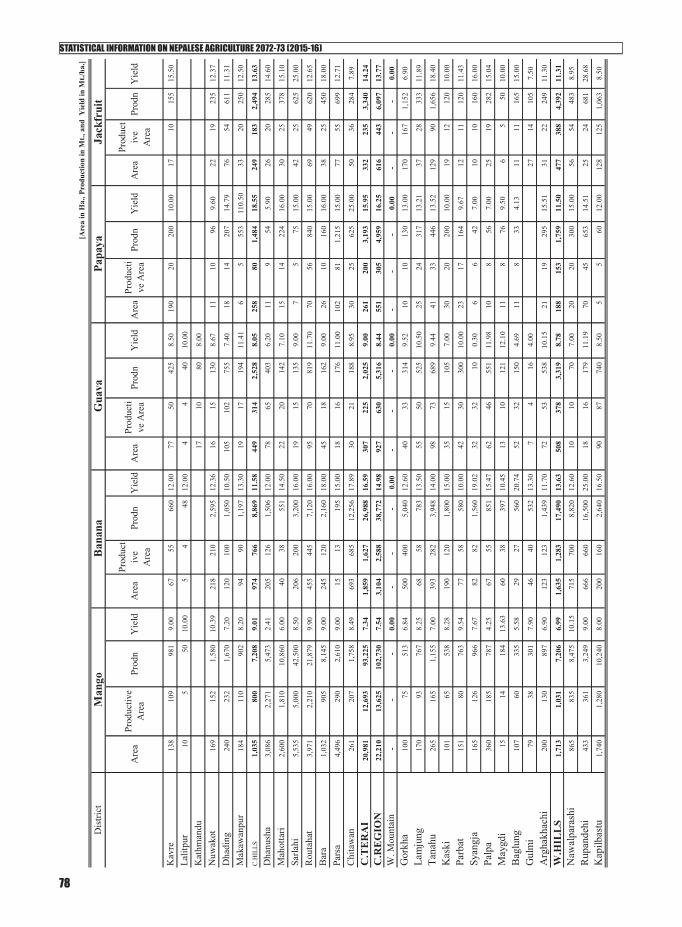
STATISTICAL INFORMATION ON NEPALESE AGRICULTURE 2072-73 (2015-16)
78
Dis
trict
Are
aPr
oduc
tive
Are
aPr
odn
Yie
ldA
rea
Prod
uct
ive
Are
aPr
odn
Yie
ldA
rea
Prod
ucti
ve A
rea
Prod
nY
ield
Are
aPr
oduc
tive
Are
aPr
odn
Yie
ldA
rea
Prod
uct
ive
Are
aPr
odn
Yie
ld
Kav
re13
8
109
98
1
9.00
67
55
660
12
.00
77
50
42
5
8.
5019
0
20
200
10
.00
17
10
15
5
15
.50
Lalit
pur
10
5
50
10.0
05
4
48
12
.00
4
4
40
10
.00
Kat
hman
du17
10
80
8.00
Nuw
akot
169
15
2
1,58
0
10
.39
218
21
0
2,59
5
12
.36
16
15
13
0
8.
6711
10
96
9.60
22
19
23
5
12
.37
Dha
ding
240
23
2
1,67
0
7.
2012
0
100
1,
050
10.5
010
5
102
755
7.40
18
14
207
14
.79
76
54
61
1
11
.31
Mak
awan
pur
184
11
0
902
8.
2094
90
1,
197
13.3
019
17
194
11.4
16
5
55
3
110.
5033
20
250
12.5
0
C.H
ILLS
1,03
5
80
0
7,20
8
9.
0197
4
766
8,
869
11.5
844
9
314
2,52
8
8.05
258
80
1,
484
18.5
524
9
18
3
2,49
4
13
.63
Dha
nush
a3,
086
2,27
1
5,
473
2.41
205
12
6
1,50
6
12
.00
78
65
40
3
6.
2011
9
54
5.
9026
20
285
14.6
0
Mah
otta
ri2,
600
1,81
0
10
,860
6.
0040
38
55
1
14.5
022
20
142
7.10
15
14
224
16
.00
30
25
37
8
15
.10
Sarla
hi5,
535
5,00
0
42
,500
8.
5020
6
200
3,
200
16.0
019
15
135
9.00
7
5
75
15
.00
42
25
62
5
25
.00
Rou
taha
t3,
971
2,21
0
21
,879
9.
9045
5
445
7,
120
16.0
095
70
819
11.7
070
56
84
0
15.0
069
49
620
12.6
5
Bar
a1,
032
905
8,
145
9.00
245
12
0
2,16
0
18
.00
45
18
16
2
9.
0026
10
16
0
16.0
038
25
450
18.0
0
Pars
a4,
496
290
2,
610
9.00
15
13
195
15
.00
18
16
17
6
11
.00
102
81
1,
215
15.0
077
55
699
12.7
1
Chi
taw
an26
1
207
1,
758
8.49
693
68
5
12,2
56
17.8
930
21
188
8.95
30
25
625
25
.00
50
36
28
4
7.
89
C.T
ER
AI
20,9
81
12
,693
93,2
25
7.34
1,85
9
1,
627
26,9
88
16.5
930
7
225
2,02
5
9.00
261
200
3,19
3
15
.95
332
235
3,
340
14.2
4
C.R
EG
ION
22,2
10
13
,625
102,
730
7.
543,
104
2,58
8
38
,772
14
.98
927
63
0
5,
316
8.
4455
1
30
5
4,
959
16.2
561
6
44
3
6,09
7
13
.77
W. M
ount
ain
-
-
-
0.00
-
-
-
0.00
-
-
-
0.00
-
-
-
0.
00-
-
-
0.
00
Gor
kha
100
75
513
6.
8450
0
400
5,
040
12.6
040
33
314
9.52
10
10
130
13
.00
170
167
1,
152
6.90
Lam
jung
170
93
767
8.
2568
58
78
3
13.5
055
50
525
10.5
025
24
31
7
13.2
137
28
333
11.8
9
Tana
hu26
5
165
1,
155
7.00
393
28
2
3,94
8
14
.00
98
73
68
9
9.
4441
33
44
6
13.5
212
9
90
1,65
6
18
.40
Kas
ki10
1
65
53
8
8.28
190
12
0
1,80
0
15
.00
35
15
10
5
7.
0030
20
20
0
10.0
019
12
120
10.0
0
Parb
at15
1
80
76
3
9.54
77
58
580
10
.00
42
30
30
0
10
.00
23
17
164
9.
6712
11
120
11.4
3
Syan
gja
165
12
6
966
7.
6782
82
1,
560
19.0
232
32
10
0.30
6
6
42
7.
0010
10
160
16.0
0
Palp
a36
0
185
78
7
4.25
67
55
851
15
.47
62
46
55
1
11
.98
10
8
56
7.00
25
19
28
2
15
.04
May
gdi
15
14
184
13
.63
60
38
397
10
.45
13
10
12
1
12
.10
11
8
76
9.50
6
5
50
10.0
0
Bag
lung
107
60
335
5.
5829
27
56
0
20.7
452
32
150
4.69
11
8
33
4.13
11
11
16
5
15
.00
Gul
mi
79
38
301
7.
9046
40
53
2
13.3
07
4
16
4.00
27
14
10
5
7.
50
Arg
hakh
achi
200
13
0
897
6.
9012
3
123
1,
439
11.7
072
53
538
10.1
521
19
29
5
15.5
131
22
249
11.3
0
W.H
ILL
S1,
713
1,03
1
7,
206
6.99
1,63
5
1,
283
17,4
90
13.6
350
8
378
3,31
9
8.78
188
153
1,75
9
11
.50
477
388
4,
392
11.3
1
Naw
alpa
rash
i86
5
835
8,
475
10.1
571
5
700
8,
820
12.6
010
10
70
7.00
20
20
300
15
.00
56
54
48
3
8.
95
Rup
ande
hi43
3
361
3,
249
9.00
666
66
0
16,5
00
25.0
018
16
179
11.1
970
45
65
3
14.5
125
24
681
28.6
8
Kap
ilbas
tu1,
740
1,28
0
10
,240
8.
0020
0
160
2,
640
16.5
090
87
740
8.50
5
5
60
12
.00
128
125
1,
063
8.50
[Are
a in
Ha.
, Pro
duct
ion
in M
t., a
nd Y
ield
in M
t./ha
.]
Man
goB
anan
aG
uava
Papa
yaJa
ckfr
uit

STATISTICAL INFORMATION ON NEPALESE AGRICULTURE 2072-73 (2015-16)
79
Dis
trict
Are
aPr
oduc
tive
Are
aPr
odn
Yie
ldA
rea
Prod
uct
ive
Are
aPr
odn
Yie
ldA
rea
Prod
ucti
ve A
rea
Prod
nY
ield
Are
aPr
oduc
tive
Are
aPr
odn
Yie
ldA
rea
Prod
uct
ive
Are
aPr
odn
Yie
ld
W. T
erai
3,03
8
2,
476
21,9
64
8.87
1,58
1
1,
520
27,9
60
18.3
911
8
113
989
8.75
95
70
1,01
3
14
.47
209
203
2,
227
10.9
8
Wes
tern
Reg
ion
4,75
1
3,
507
29,1
70
8.32
3,21
6
2,
803
45,4
50
16.2
162
6
491
4,30
7
8.77
283
223
2,77
2
12
.43
686
591
6,
618
11.2
0
Kal
kot
23
16
123
7.
6939
27
44
2
16.3
7
M.W
. Mao
unta
in23
16
12
3
7.69
39
27
442
16
.37
-
-
-
0.00
-
-
-
0.
00-
-
-
0.
00
Ruk
um20
6
95
98
7
10.3
929
18
22
0
12.2
65
2
14
7.10
22
19
240
12
.58
6
4
37
9.76
Rol
pa13
0
80
60
8
7.60
42
25
336
13
.42
67
41
27
7
6.
7625
19
34
0
17.8
920
17
200
11.7
6
Pyut
han
261
19
0
1,55
0
8.
1623
0
190
2,
660
14.0
030
20
190
9.50
25
20
120
6.
008
4
18
5.
14
Saly
an17
7
114
85
0
7.46
72
61
475
7.
7959
52
377
7.25
22
20
200
10
.00
17
16
15
9
9.
94
Jaja
rkot
100
31
95
3.
0650
25
10
0
4.00
22
16
18
3
11
.44
25
1
8
8.
006
2
16
8.
00
Dai
lekh
a49
0
148
1,
603
10.8
356
32
36
9
11.5
333
27
265
9.81
7
4
45
11.2
5
Surk
het
550
45
0
3,42
0
7.
6017
4
157
2,
189
13.9
410
3
72
71
6
9.
9420
16
16
0
10.0
070
50
537
10.7
4
M.W
. Hill
s1,
914
1,10
8
9,
113
8.22
653
50
8
6,34
8
12
.50
319
23
0
2,
022
8.
7913
9
95
1,06
8
11
.23
134
96
1,
012
10.5
1
Dan
g2,
488
2,35
0
8,
225
3.50
228
20
0
1,79
8
8.
9942
42
226
5.37
83
66
797
12
.08
151
150
1,
025
6.83
Ban
ke93
0
730
3,
869
5.30
80
61
754
12
.35
41
36
29
9
8.
3010
6
66
11
.00
31
14
14
0
10
.00
Bar
diya
870
86
0
6,10
0
7.
0980
0
600
4,
600
7.67
53
39
43
5
11
.15
47
38
452
11
.89
77
55
63
7
11
.58
M.W
. Ter
ai4,
288
3,94
0
18
,194
4.
621,
108
861
7,
152
8.31
136
11
7
95
9
8.
2014
0
11
0
1,
315
0.00
259
219
1,
802
8.23
M. W
. Reg
ion
6,22
5
5,
064
27,4
30
5.42
1,80
0
1,
396
13,9
42
9.99
455
34
7
2,
982
8.
5927
9
20
5
2,
383
11.6
239
3
31
5
2,81
4
8.
92
Baj
ura
13
10
50
5.
005
2
14
8.
0025
19
193
10.1
6
Baj
hang
3
3
30
10
.00
25
15
110
7.
333
2
10
5.00
Dar
chul
a11
2
71
59
7
8.41
45
38
628
16
.53
21
14
98
7.
0015
13
22
8
17.5
426
5
81
16.2
0
F.W
. Mou
ntai
n12
8
84
67
7
8.06
75
55
752
13
.74
49
35
30
1
8.
6015
13
22
8
17.5
426
5
81
16.2
0
Ach
ham
147
62
544
8.
7716
13
11
2
8.62
16
9
90
10.0
011
7
72
11
.08
4
4
38
9.50
Dot
i40
3
130
1,
170
9.00
37
25
338
13
.50
22
16
10
4
6.
5021
20
26
0
13.0
020
15
173
11.5
0
Bai
tadi
161
89
776
8.
7210
10
15
0
15.0
015
13
140
10.7
73
3
29
11.4
017
13
156
12.0
0
Dad
eldh
ura
263
22
0
1,76
0
8.
0035
25
39
0
15.6
054
53
318
6.00
10
6
90
15.0
011
9
54
6.00
F.W
.Hill
s97
4
501
4,
250
8.48
98
73
990
13
.55
107
91
652
7.16
45
35
451
12
.87
52
41
42
1
10
.26
Kai
lali
810
75
0
5,25
0
7.
0065
0
600
9,
000
15.0
030
5
275
2,75
0
10.0
015
10
14
0
14.0
021
0
20
0
1,60
0
8.
00
Kan
chan
pur
200
20
0
960
4.
8025
0
250
5,
500
22.0
018
18
76
4.20
70
56
672
12
.00
20
20
14
0
7.
00
F.W
. Ter
ai1,
010
950
6,
210
6.54
900
85
0
14,5
00
17.0
632
3
293
2,82
6
9.64
85
66
812
12
.30
230
220
1,
740
7.91
F.W
. Reg
ion
2,11
2
1,
535
11,1
37
7.26
1,07
3
97
8
16,2
42
16.6
147
9
419
3,77
9
9.02
145
114
1,49
1
13
.07
308
266
2,
242
8.43
Nep
al52
,815
38,3
85
26
6,62
8
6.95
16,1
46
14,3
11
236,
195
16.5
03,
453
2,71
0
22,3
70
8.
261,
569
1,
083
14
,137
13.0
52,
415
1,
926
22,3
43
11.6
0
[Are
a in
Ha.
, Pro
duct
ion
in M
t., a
nd Y
ield
in M
t./ha
.]
Man
goB
anan
aG
uava
Papa
yaJa
ckfr
uit
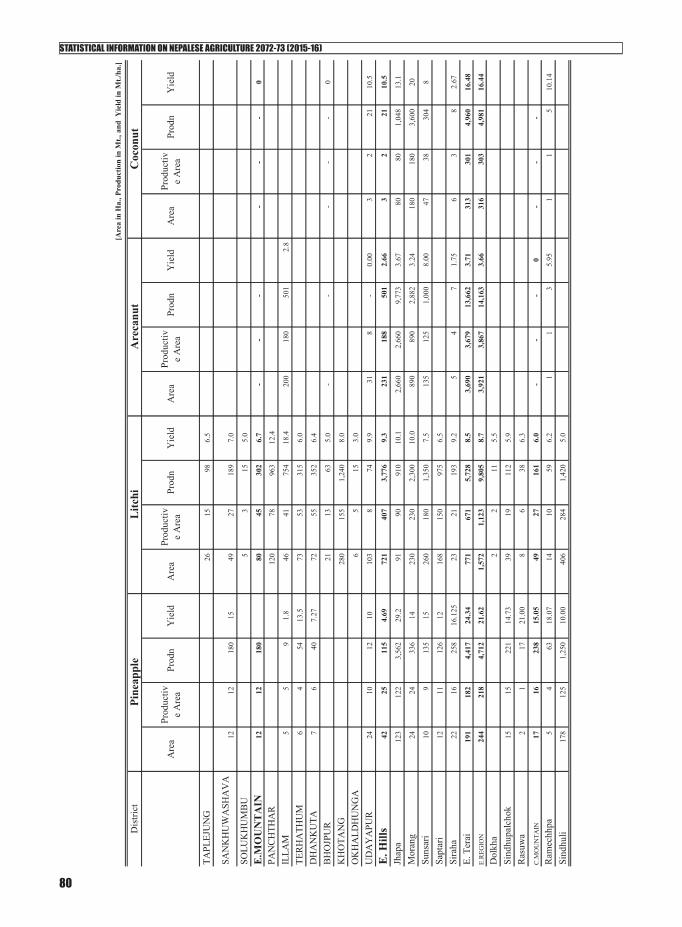
STATISTICAL INFORMATION ON NEPALESE AGRICULTURE 2072-73 (2015-16)
80
Dis
trict
Are
aPr
oduc
tive
Are
aPr
odn
Yie
ldA
rea
Prod
uctiv
e A
rea
Prod
nY
ield
Are
aPr
oduc
tive
Are
aPr
odn
Yie
ldA
rea
Prod
uctiv
e A
rea
Prod
nY
ield
TAPL
EJU
NG
26
15
98
6.5
SAN
KH
UW
ASH
AV
A12
12
18
0
1549
27
18
9
7.0
SOLU
KH
UM
BU
5
3
15
5.0
E.M
OU
NT
AIN
12
12
180
80
45
30
2
6.7
-
-
-
-
-
-
0
PAN
CH
THA
R12
0
78
963
12
.4
ILLA
M5
5
9
1.8
46
41
754
18
.420
0
180
50
1
2.8
TER
HA
THU
M6
4
54
13
.573
53
31
5
6.0
DH
AN
KU
TA7
6
40
7.
2772
55
35
2
6.4
BH
OJP
UR
21
13
63
5.0
-
-
-
-
-
0
KH
OTA
NG
280
15
5
1,24
0
8.
0
OK
HA
LDH
UN
GA
6
5
15
3.0
UD
AY
APU
R24
10
12
10
103
8
74
9.9
31
8
-
0.
003
2
21
10
.5
E. H
ills
42
25
115
4.
6972
1
407
3,
776
9.3
231
18
8
501
2.
663
2
21
10
.5
Jhap
a12
3
122
3,
562
29.2
91
90
910
10
.12,
660
2,66
0
9,
773
3.67
80
80
1,04
8
13
.1
Mor
ang
24
24
336
14
230
23
0
2,30
0
10
.089
0
890
2,
882
3.24
180
18
0
3,60
0
20
Suns
ari
10
9
13
5
1526
0
180
1,
350
7.5
135
12
5
1,00
0
8.
0047
38
30
4
8
Sapt
ari
12
11
126
12
168
15
0
975
6.
5
Sira
ha22
16
25
8
16.1
2523
21
19
3
9.2
5
4
7
1.
756
3
8
2.67
E. T
erai
191
18
2
4,41
7
24
.34
771
67
1
5,72
8
8.
53,
690
3,67
9
13
,662
3.
7131
3
301
4,
960
16.4
8
E.R
EGIO
N24
4
218
4,
712
21.6
21,
572
1,12
3
9,
805
8.7
3,92
1
3,
867
14,1
63
3.66
316
30
3
4,98
1
16
.44
Dol
kha
2
2
11
5.5
Sind
hupa
lcho
k15
15
22
1
14.7
339
19
11
2
5.9
Ras
uwa
2
1
17
21.0
08
6
38
6.
3
C.M
OU
NTA
IN17
16
23
8
15.0
549
27
16
1
6.0
-
-
-
0-
-
-
Ram
echh
pa5
4
63
18
.07
14
10
59
6.2
1
1
3
5.
951
1
5
10.1
4
Sind
huli
178
12
5
1,25
0
10
.00
406
28
4
1,42
0
5.
0
Pine
appl
eL
itchi
Are
canu
tC
ocon
ut[A
rea
in H
a., P
rodu
ctio
n in
Mt.,
and
Yie
ld in
Mt./
ha.]
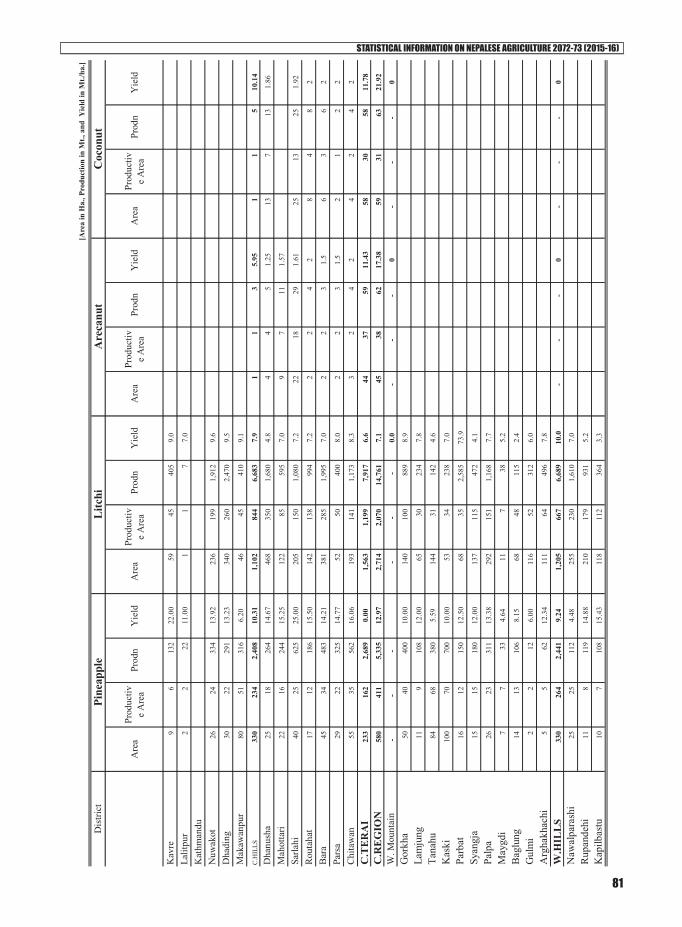
STATISTICAL INFORMATION ON NEPALESE AGRICULTURE 2072-73 (2015-16)
81
Dis
trict
Are
aPr
oduc
tive
Are
aPr
odn
Yie
ldA
rea
Prod
uctiv
e A
rea
Prod
nY
ield
Are
aPr
oduc
tive
Are
aPr
odn
Yie
ldA
rea
Prod
uctiv
e A
rea
Prod
nY
ield
Kav
re9
6
13
2
22.0
059
45
40
5
9.0
Lalit
pur
2
2
22
11.0
01
1
7
7.0
Kat
hman
duN
uwak
ot26
24
33
4
13.9
223
6
199
1,
912
9.6
Dha
ding
30
22
291
13
.23
340
26
0
2,47
0
9.
5
Mak
awan
pur
80
51
316
6.
2046
45
41
0
9.1
C.H
ILLS
330
23
4
2,40
8
10
.31
1,10
2
84
4
6,68
3
7.
91
1
3
5.95
1
1
5
10
.14
Dha
nush
a25
18
26
4
14.6
746
8
350
1,
680
4.8
4
4
5
1.
2513
7
13
1.86
Mah
otta
ri22
16
24
4
15.2
512
2
85
595
7.
09
7
11
1.
57
Sarla
hi40
25
62
5
25.0
020
5
150
1,
080
7.2
22
18
29
1.61
25
13
25
1.92
Rou
taha
t17
12
18
6
15.5
014
2
138
99
4
7.2
2
2
4
2
8
4
8
2
Bar
a45
34
48
3
14.2
138
1
285
1,
995
7.0
2
2
3
1.
56
3
6
2
Pars
a29
22
32
5
14.7
752
50
40
0
8.0
2
2
3
1.
52
1
2
2
Chi
taw
an55
35
56
2
16.0
619
3
141
1,
173
8.3
3
2
4
2
4
2
4
2
C.T
ER
AI
233
16
2
2,68
9
0.
001,
563
1,19
9
7,
917
6.6
44
37
59
11.4
358
30
58
11
.78
C.R
EG
ION
580
41
1
5,33
5
12
.97
2,71
4
2,
070
14,7
61
7.1
45
38
62
17.3
859
31
63
21
.92
W. M
ount
ain
-
-
-
-
-
-
0.0
-
-
-
0-
-
-
0
Gor
kha
50
40
400
10
.00
140
10
0
889
8.
9
Lam
jung
11
9
10
8
12.0
065
30
23
4
7.8
Tana
hu84
68
38
0
5.59
144
31
14
2
4.6
Kas
ki10
0
70
700
10
.00
53
34
238
7.
0
Parb
at16
12
15
0
12.5
068
35
2,
585
73.9
Syan
gja
15
15
180
12
.00
137
11
5
472
4.
1
Palp
a26
23
31
1
13.3
829
2
151
1,
168
7.7
May
gdi
7
7
33
4.64
11
7
38
5.
2
Bag
lung
14
13
106
8.
1568
48
11
5
2.4
Gul
mi
2
2
12
6.00
116
52
31
2
6.0
Arg
hakh
achi
5
5
62
12.3
411
1
64
496
7.
8
W.H
ILL
S33
0
264
2,
441
9.24
1,20
5
66
7
6,68
9
10
.0-
-
-
0
-
-
-
0
Naw
alpa
rash
i25
25
11
2
4.48
255
23
0
1,61
0
7.
0
Rup
ande
hi11
8
119
14
.88
210
17
9
931
5.
2
Kap
ilbas
tu10
7
108
15
.43
118
11
2
364
3.
3
[Are
a in
Ha.
, Pro
duct
ion
in M
t., a
nd Y
ield
in M
t./ha
.]
Pine
appl
eL
itchi
Are
canu
tC
ocon
ut

STATISTICAL INFORMATION ON NEPALESE AGRICULTURE 2072-73 (2015-16)
82
Dis
trict
Are
aPr
oduc
tive
Are
aPr
odn
Yie
ldA
rea
Prod
uctiv
e A
rea
Prod
nY
ield
Are
aPr
oduc
tive
Are
aPr
odn
Yie
ldA
rea
Prod
uctiv
e A
rea
Prod
nY
ield
W. T
erai
46
40
339
8.
4858
3
521
2,
905
5.6
-
-
-
0-
-
-
0
Wes
tern
Reg
ion
376
30
4
2,78
0
9.
141,
788
1,18
8
9,
593
8.1
-
-
-
0-
-
-
0
Kal
kot
M.W
. Mao
unta
in-
-
-
0.
00-
-
-
0.
0-
-
-
0
-
-
-
0
Ruk
um6
2
14
6.
2
Rol
pa5
4
51
12
.63
65
50
300
6.
0
Pyut
han
3
1
9
9.
0023
16
10
8
6.8
Saly
an5
4
27
6.
7520
14
70
5.
0
Jaja
rkot
12
1
1
1.0
Dai
lekh
a2
1
1
1.0
Surk
het
5
4
49
12.2
583
47
42
7
9.1
M.W
. Hill
s18
13
13
6
10.4
221
1
131
92
1
7.0
-
-
-
0-
-
-
0
Dan
g9
6
89
14
.83
235
22
8
798
3.
5
Ban
ke10
7
75
10.7
133
24
11
8
4.9
Bar
diya
8
6
86
14.3
312
0
110
33
0
3.0
M.W
. Ter
ai27
19
25
0
0.00
388
36
2
1,24
6
3.
4-
-
-
0
-
-
-
0
M. W
. Reg
ion
45
32
386
12
.05
599
49
3
2,16
6
4.
4-
-
-
0
-
-
-
0
Baj
ura
Baj
hang
1
1
3
6.
0
Dar
chul
a3
3
45
15
.00
17
7
56
8.
0
F.W
. Mou
ntai
n3
3
45
15
.00
18
8
59
7.
9-
-
-
0
-
-
-
0
Ach
ham
-
-
-
6
3
14
4.5
Dot
i1
1
3
6.50
25
22
150
6.
8
Bai
tadi
26
17
120
7.
1
Dad
eldh
ura
33
20
100
5.
0
F.W
.Hill
s1
1
3
6.50
90
62
383
6.
2-
-
-
0
-
-
-
0
Kai
lali
5
3
30
10.0
035
20
14
0
7.0
Kan
chan
pur
20
20
84
4.2
F.W
. Ter
ai5
3
30
10
.00
55
40
224
5.
6-
-
-
0
-
-
-
0
F.W
. Reg
ion
9
7
78
12.0
416
3
110
66
6
6.1
-
-
-
0-
-
-
0
Nep
al1,
254
972
13
,291
13
.67
6,83
5
4,
983
36,9
92
7.4
3,96
5
3,
905
14,2
25
3.64
375
33
4
5,04
4
15
.12
[Are
a in
Ha.
, Pro
duct
ion
in M
t., a
nd Y
ield
in M
t./ha
.]
Pine
appl
eL
itchi
Are
canu
tC
ocon
ut
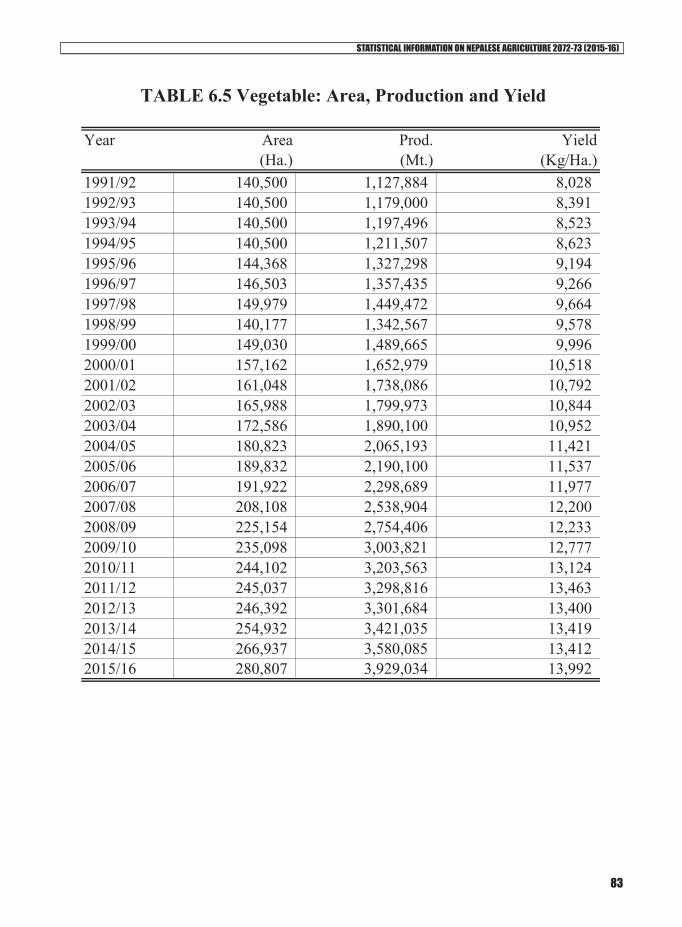
STATISTICAL INFORMATION ON NEPALESE AGRICULTURE 2072-73 (2015-16)
83
Year Area Prod. Yield(Ha.) (Mt.) (Kg/Ha.)
1991/92 140,500 1,127,884 8,028 1992/93 140,500 1,179,000 8,391 1993/94 140,500 1,197,496 8,523 1994/95 140,500 1,211,507 8,623 1995/96 144,368 1,327,298 9,194 1996/97 146,503 1,357,435 9,266 1997/98 149,979 1,449,472 9,664 1998/99 140,177 1,342,567 9,578 1999/00 149,030 1,489,665 9,996 2000/01 157,162 1,652,979 10,518 2001/02 161,048 1,738,086 10,792 2002/03 165,988 1,799,973 10,844 2003/04 172,586 1,890,100 10,952 2004/05 180,823 2,065,193 11,421 2005/06 189,832 2,190,100 11,537 2006/07 191,922 2,298,689 11,977 2007/08 208,108 2,538,904 12,200 2008/09 225,154 2,754,406 12,233 2009/10 235,098 3,003,821 12,777 2010/11 244,102 3,203,563 13,124 2011/12 245,037 3,298,816 13,463 2012/13 246,392 3,301,684 13,400 2013/14 254,932 3,421,035 13,419 2014/15 266,937 3,580,085 13,412 2015/16 280,807 3,929,034 13,992
TABLE 6.5 Vegetable: Area, Production and Yield
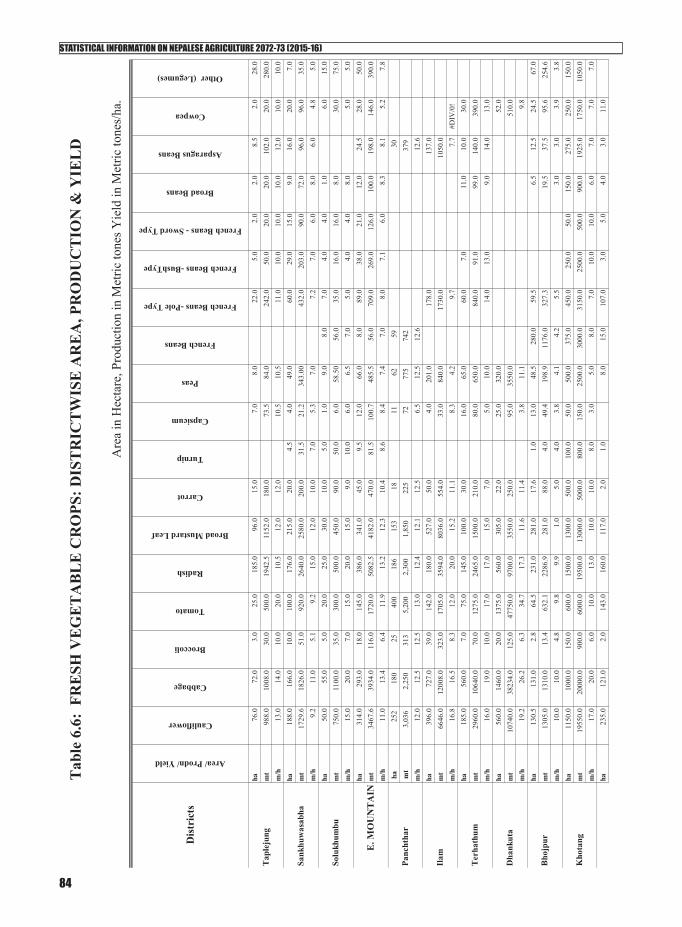
STATISTICAL INFORMATION ON NEPALESE AGRICULTURE 2072-73 (2015-16)
84
Tab
le 6
.6:
FRE
SH V
EG
ET
AB
LE
CR
OPS
: DIS
TR
ICT
WIS
E A
RE
A, P
RO
DU
CT
ION
& Y
IEL
D
Are
a in
Hec
tare
, Pro
duct
ion
in M
etric
tone
s Yie
ld in
Met
ric to
nes/
ha.
Dis
tric
ts
Area/ Prodn/ Yield
Cauliflower
Cabbage
Broccoli
Tomato
Radish
Broad Mustard Leaf
Carrot
Turnip
Capsicum
Peas
French Beans
French Beans -Pole Type
French Beans -BushType
French Beans - Sword Type
Broad Beans
Asparagus Beans
Cowpea
Other (Legumes)
ha76
.072
.03.
025
.018
5.0
96.0
15.0
7.0
8.0
22.0
5.0
2.0
2.0
8.5
2.0
28.0
mt
988.
010
08.0
30.0
500.
019
42.5
1152
.018
0.0
73.5
84.0
242.
050
.020
.020
.010
2.0
20.0
280.
0m
/h13
.014
.010
.020
.010
.512
.012
.010
.510
.511
.010
.010
.010
.012
.010
.010
.0ha
188.
016
6.0
10.0
100.
017
6.0
215.
020
.04.
54.
049
.060
.029
.015
.09.
016
.020
.07.
0m
t17
29.6
1826
.051
.092
0.0
2640
.025
80.0
200.
031
.521
.234
3.00
432.
020
3.0
90.0
72.0
96.0
96.0
35.0
m/h
9.2
11.0
5.1
9.2
15.0
12.0
10.0
7.0
5.3
7.0
7.2
7.0
6.0
8.0
6.0
4.8
5.0
ha50
.055
.05.
020
.025
.030
.010
.05.
01.
09.
08.
07.
04.
04.
01.
06.
015
.0m
t75
0.0
1100
.035
.030
0.0
500.
045
0.0
90.0
50.0
6.0
58.5
056
.035
.016
.016
.08.
030
.075
.0m
/h15
.020
.07.
015
.020
.015
.09.
010
.06.
06.
57.
05.
04.
04.
08.
05.
05.
0ha
314.
029
3.0
18.0
145.
038
6.0
341.
045
.09.
512
.066
.08.
089
.038
.021
.012
.024
.528
.050
.0m
t34
67.6
3934
.011
6.0
1720
.050
82.5
4182
.047
0.0
81.5
100.
748
5.5
56.0
709.
026
9.0
126.
010
0.0
198.
014
6.0
390.
0m
/h11
.013
.46.
411
.913
.212
.310
.48.
68.
47.
47.
08.
07.
16.
08.
38.
15.
27.
8ha
252
180
25
40
0
18
6
15
3
18
11
62
59
30
mt
3,03
6
2,25
0
313
5,20
0
2,30
0
1,85
0
225
72
77
5
74
2
37
9
m
/h12
.012
.512
.513
.012
.412
.112
.56.
512
.512
.612
.6ha
396.
072
7.0
39.0
142.
018
0.0
527.
050
.04.
020
1.0
178.
013
7.0
mt
6646
.012
008.
032
3.0
1705
.035
94.0
8036
.055
4.0
33.0
840.
017
30.0
1050
.0m
/h16
.816
.58.
312
.020
.015
.211
.18.
34.
29.
77.
7#D
IV/0
!ha
185.
056
0.0
7.0
75.0
145.
010
0.0
30.0
16.0
65.0
60.0
7.0
11.0
10.0
30.0
mt
2960
.010
640.
070
.012
75.0
2465
.015
00.0
210.
080
.065
0.0
840.
091
.099
.014
0.0
390.
0m
/h16
.019
.010
.017
.017
.015
.07.
05.
010
.014
.013
.09.
014
.013
.0ha
560.
014
60.0
20.0
1375
.056
0.0
305.
022
.025
.032
0.0
52.0
mt
1074
0.0
3823
4.0
125.
047
750.
097
00.0
3550
.025
0.0
95.0
3550
.051
0.0
m/h
19.2
26.2
6.3
34.7
17.3
11.6
11.4
3.8
11.1
9.8
ha13
0.5
131.
02.
864
.523
1.0
281.
017
.61.
013
.048
.528
0.0
59.5
6.5
12.5
24.5
67.0
mt
1305
.013
10.0
13.4
632.
122
86.9
281.
088
.04.
049
.419
8.9
1176
.032
7.3
19.5
37.5
95.6
254.
6m
/h10
.010
.04.
89.
89.
91.
05.
04.
03.
84.
14.
25.
53.
03.
03.
93.
8ha
1150
.010
00.0
150.
060
0.0
1500
.013
00.0
500.
010
0.0
50.0
500.
037
5.0
450.
025
0.0
50.0
150.
027
5.0
250.
015
0.0
mt
1955
0.0
2000
0.0
900.
060
00.0
1950
0.0
1300
0.0
5000
.080
0.0
150.
025
00.0
3000
.031
50.0
2500
.050
0.0
900.
019
25.0
1750
.010
50.0
m/h
17.0
20.0
6.0
10.0
13.0
10.0
10.0
8.0
3.0
5.0
8.0
7.0
10.0
10.0
6.0
7.0
7.0
7.0
ha23
5.0
121.
02.
014
3.0
160.
011
7.0
2.0
1.0
8.0
15.0
107.
03.
05.
04.
03.
011
.0
Panc
htha
r
Ilam
Ter
hath
um
Dha
nkut
a
Bho
jpur
Kho
tang
E. M
OU
NT
AIN
Tap
leju
ng
Sank
huw
asab
ha
Solu
khum
bu
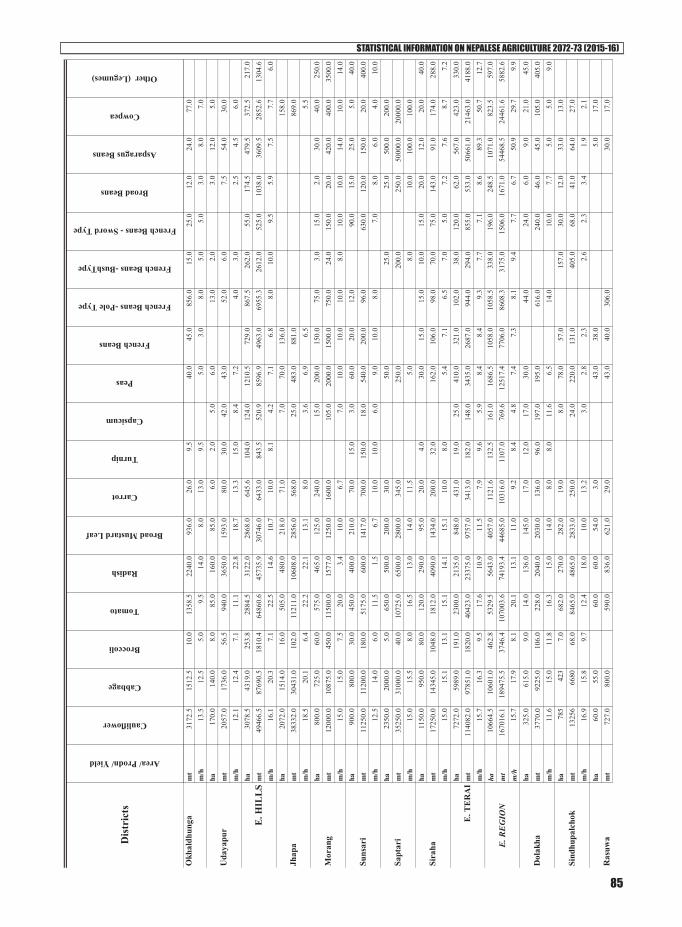
STATISTICAL INFORMATION ON NEPALESE AGRICULTURE 2072-73 (2015-16)
85
Dis
tric
ts
Area/ Prodn/ Yield
Cauliflower
Cabbage
Broccoli
Tomato
Radish
Broad Mustard Leaf
Carrot
Turnip
Capsicum
Peas
French Beans
French Beans -Pole Type
French Beans -BushType
French Beans - Sword Type
Broad Beans
Asparagus Beans
Cowpea
Other (Legumes)
mt
3172
.515
12.5
10.0
1358
.522
40.0
936.
026
.09.
540
.045
.085
6.0
15.0
25.0
12.0
24.0
77.0
m/h
13.5
12.5
5.0
9.5
14.0
8.0
13.0
9.5
5.0
3.0
8.0
5.0
5.0
3.0
8.0
7.0
ha17
0.0
140.
08.
085
.016
0.0
85.0
6.0
2.0
5.0
6.0
13.0
2.0
3.0
12.0
5.0
mt
2057
.017
36.0
56.5
940.
036
50.0
1593
.080
.030
.042
.043
.052
.06.
07.
554
.030
.0m
/h12
.112
.47.
111
.122
.818
.713
.315
.08.
47.
24.
03.
02.
54.
56.
0ha
3078
.543
19.0
253.
828
84.5
3122
.028
68.0
645.
610
4.0
124.
012
10.5
729.
086
7.5
262.
055
.017
4.5
479.
537
2.5
217.
0m
t49
466.
587
690.
518
10.4
6486
0.6
4573
5.9
3074
6.0
6433
.084
3.5
520.
985
96.9
4963
.069
55.3
2612
.052
5.0
1038
.036
09.5
2852
.613
04.6
m/h
16.1
20.3
7.1
22.5
14.6
10.7
10.0
8.1
4.2
7.1
6.8
8.0
10.0
9.5
5.9
7.5
7.7
6.0
ha20
72.0
1514
.016
.050
5.0
480.
021
8.0
71.0
7.0
70.0
136.
015
8.0
mt
3833
2.0
3043
1.0
102.
011
211.
010
608.
028
56.0
568.
025
.048
3.0
881.
086
9.0
m/h
18.5
20.1
6.4
22.2
22.1
13.1
8.0
3.6
6.9
6.5
5.5
ha80
0.0
725.
060
.057
5.0
465.
012
5.0
240.
015
.020
0.0
150.
075
.03.
015
.02.
030
.040
.025
0.0
mt
1200
0.0
1087
5.0
450.
011
500.
015
77.0
1250
.016
00.0
105.
020
00.0
1500
.075
0.0
24.0
150.
020
.042
0.0
400.
035
00.0
m/h
15.0
15.0
7.5
20.0
3.4
10.0
6.7
7.0
10.0
10.0
10.0
8.0
10.0
10.0
14.0
10.0
14.0
ha90
0.0
800.
030
.045
0.0
400.
021
0.0
70.0
15.0
3.0
60.0
20.0
12.0
90.0
15.0
25.0
5.0
40.0
mt
1125
0.0
1120
0.0
180.
051
75.0
600.
014
17.0
700.
015
0.0
18.0
540.
020
0.0
96.0
630.
012
0.0
150.
020
.040
0.0
m/h
12.5
14.0
6.0
11.5
1.5
6.7
10.0
10.0
6.0
9.0
10.0
8.0
7.0
8.0
6.0
4.0
10.0
ha23
50.0
2000
.05.
065
0.0
500.
020
0.0
30.0
50.0
25.0
25.0
500.
020
0.0
mt
3525
0.0
3100
0.0
40.0
1072
5.0
6500
.028
00.0
345.
025
0.0
200.
025
0.0
5000
0.0
2000
0.0
m/h
15.0
15.5
8.0
16.5
13.0
14.0
11.5
5.0
8.0
10.0
100.
010
0.0
ha11
50.0
950.
080
.012
0.0
290.
095
.020
.04.
030
.015
.015
.010
.015
.020
.012
.020
.040
.0m
t17
250.
014
345.
010
48.0
1812
.040
90.0
1434
.020
0.0
32.0
162.
010
6.0
98.0
70.0
75.0
143.
091
.017
4.0
288.
0m
/h15
.015
.113
.115
.114
.115
.110
.08.
05.
47.
16.
57.
05.
07.
27.
68.
77.
2ha
7272
.059
89.0
191.
023
00.0
2135
.084
8.0
431.
019
.025
.041
0.0
321.
010
2.0
38.0
120.
062
.056
7.0
423.
033
0.0
mt
1140
82.0
9785
1.0
1820
.040
423.
023
375.
097
57.0
3413
.018
2.0
148.
034
35.0
2687
.094
4.0
294.
085
5.0
533.
050
661.
021
463.
041
88.0
m/h
15.7
16.3
9.5
17.6
10.9
11.5
7.9
9.6
5.9
8.4
8.4
9.3
7.7
7.1
8.6
89.3
50.7
12.7
ha10
664.
510
601.
046
2.8
5329
.556
43.0
4057
.011
21.6
132.
516
1.0
1686
.510
58.0
1058
.533
8.0
196.
024
8.5
1071
.082
3.5
597.
0m
t16
7016
.118
9475
.537
46.4
1070
03.6
7419
3.4
4468
5.0
1031
6.0
1107
.076
9.6
1251
7.4
7706
.086
08.3
3175
.015
06.0
1671
.054
468.
524
461.
658
82.6
m/h
15.7
17.9
8.1
20.1
13.1
11.0
9.2
8.4
4.8
7.4
7.3
8.1
9.4
7.7
6.7
50.9
29.7
9.9
ha32
5.0
615.
09.
014
.013
6.0
145.
017
.012
.017
.030
.044
.024
.06.
09.
021
.045
.0m
t37
70.0
9225
.010
6.0
228.
020
40.0
2030
.013
6.0
96.0
197.
019
5.0
616.
024
0.0
46.0
45.0
105.
040
5.0
m/h
11.6
15.0
11.8
16.3
15.0
14.0
8.0
8.0
11.6
6.5
14.0
10.0
7.7
5.0
5.0
9.0
ha78
542
37.
068
2.0
270.
028
2.0
19.0
8.0
78.0
57.0
157.
030
.012
.033
.013
.0m
t13
256
6680
68.0
8465
.048
65.0
2833
.025
0.0
24.0
220.
013
1.0
405.
068
.041
.064
.027
.0m
/h16
.915
.89.
712
.418
.010
.013
.23.
02.
82.
32.
62.
33.
41.
92.
1ha
60.0
55.0
60.0
60.0
54.0
3.0
43.0
38.0
5.0
17.0
mt
727.
080
0.0
590.
083
6.0
621.
029
.043
.040
.030
6.0
30.0
17.0
Sapt
ari
Sira
ha
E. T
ER
AI
E. R
EG
ION
Dol
akha
Sind
hupa
lcho
k
Ras
uwa
Suns
ari
Okh
aldh
unga
Uda
yapu
r
E. H
ILL
S
Jhap
a
Mor
ang
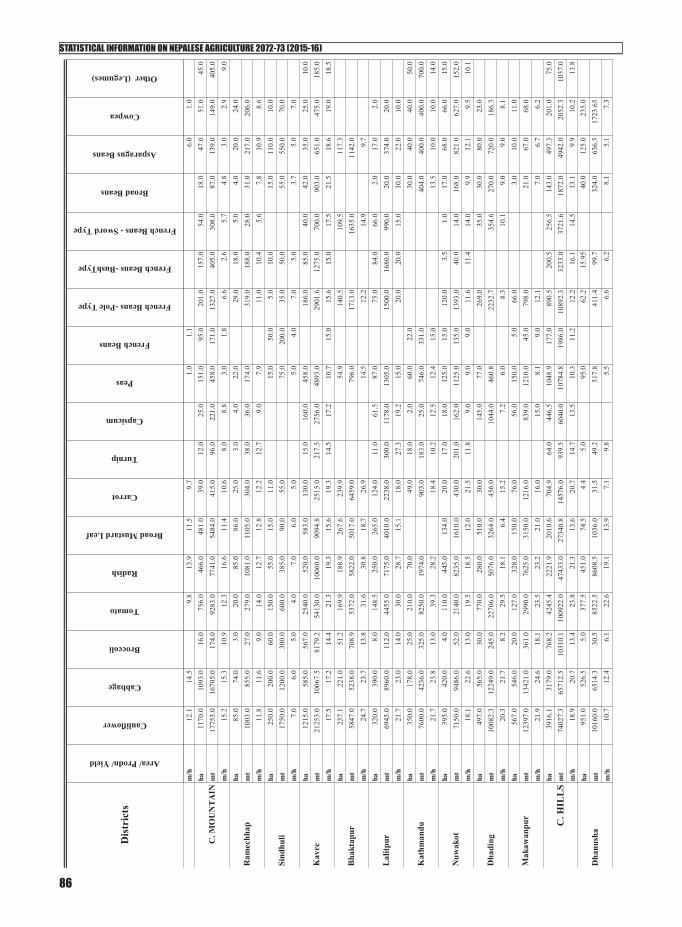
STATISTICAL INFORMATION ON NEPALESE AGRICULTURE 2072-73 (2015-16)
86
Dis
tric
ts
Area/ Prodn/ Yield
Cauliflower
Cabbage
Broccoli
Tomato
Radish
Broad Mustard Leaf
Carrot
Turnip
Capsicum
Peas
French Beans
French Beans -Pole Type
French Beans -BushType
French Beans - Sword Type
Broad Beans
Asparagus Beans
Cowpea
Other (Legumes)
m/h
12.1
14.5
9.8
13.9
11.5
9.7
1.0
1.1
6.0
1.0
ha11
70.0
1093
.016
.075
6.0
466.
048
1.0
39.0
12.0
25.0
151.
095
.020
1.0
157.
054
.018
.047
.051
.045
.0m
t17
753.
016
705.
017
4.0
9283
.077
41.0
5484
.041
5.0
96.0
221.
045
8.0
171.
013
27.0
405.
030
8.0
87.0
139.
014
9.0
405.
0m
/h15
.215
.310
.912
.316
.611
.410
.68.
08.
83.
01.
86.
62.
65.
74.
83.
02.
99.
0ha
85.0
74.0
3.0
20.0
85.0
86.0
25.0
3.0
4.0
22.0
29.0
18.0
5.0
4.0
20.0
24.0
mt
1003
.085
5.0
27.0
279.
010
81.0
1105
.030
4.0
38.0
36.0
174.
031
9.0
188.
028
.031
.021
7.0
206.
0m
/h11
.811
.69.
014
.012
.712
.812
.212
.79.
07.
911
.010
.45.
67.
810
.98.
6ha
250.
020
0.0
60.0
150.
055
.015
.011
.015
.050
.05.
010
.015
.011
0.0
10.0
mt
1750
.012
00.0
300.
060
0.0
385.
090
.055
.075
.020
0.0
35.0
50.0
55.0
550.
070
.0m
/h7.
06.
05.
04.
07.
06.
05.
05.
04.
07.
05.
03.
75.
07.
0ha
1215
.058
5.0
567.
025
40.0
520.
058
3.0
130.
015
.016
0.0
458.
018
6.0
85.0
40.0
42.0
35.0
25.0
10.0
mt
2125
3.0
1006
7.5
8179
.254
130.
010
060.
090
94.8
2515
.021
7.5
2756
.048
93.0
2901
.612
75.0
700.
090
3.0
651.
047
5.0
185.
0m
/h17
.517
.214
.421
.319
.315
.619
.314
.517
.210
.715
.015
.615
.017
.521
.518
.619
.018
.5ha
237.
122
1.0
51.2
169.
918
8.9
267.
623
9.9
54.9
140.
510
9.5
117.
3m
t58
47.0
5238
.070
8.9
5372
.058
22.0
5017
.064
59.0
796.
017
13.0
1635
.011
42.0
m/h
24.7
23.7
13.8
31.6
30.8
18.7
26.9
14.5
12.2
14.9
9.7
ha32
0.0
390.
08.
014
8.5
250.
026
5.0
124.
011
.061
.587
.075
.084
.066
.02.
017
.02.
0m
t69
45.0
8960
.011
2.0
4455
.071
75.0
4010
.022
38.0
300.
011
78.0
1305
.015
00.0
1680
.099
0.0
20.0
374.
020
.0m
/h21
.723
.014
.030
.028
.715
.118
.027
.319
.215
.020
.020
.015
.010
.022
.010
.0ha
350.
017
8.0
25.0
210.
070
.049
.018
.02.
060
.022
.030
.040
.040
.050
.0m
t76
00.0
4236
.032
5.0
8250
.019
74.0
903.
018
3.0
25.0
746.
033
1.0
404.
040
0.0
400.
070
0.0
m/h
21.7
23.8
13.0
39.3
28.2
18.4
10.2
12.5
12.4
15.0
13.5
10.0
10.0
14.0
ha39
5.0
420.
04.
011
0.0
445.
013
4.0
20.0
17.0
18.0
125.
015
.012
0.0
3.5
1.0
17.0
68.0
66.0
15.0
mt
7150
.094
86.0
52.0
2140
.082
35.0
1610
.043
0.0
201.
016
2.0
1125
.013
5.0
1393
.040
.014
.016
8.0
821.
062
7.0
152.
0m
/h18
.122
.613
.019
.518
.512
.021
.511
.89.
09.
09.
011
.611
.414
.09.
912
.19.
510
.1ha
497.
056
5.0
30.0
770.
028
0.0
510.
030
.014
5.0
77.0
269.
035
.030
.080
.023
.0m
t10
082.
312
249.
024
5.0
2270
6.0
5076
.032
64.0
456.
010
44.0
460.
822
32.7
354.
627
0.0
720.
018
6.3
m/h
20.3
21.7
8.2
29.5
18.1
6.4
15.2
7.2
6.0
8.3
10.1
9.0
9.0
8.1
ha56
7.0
546.
020
.012
7.0
328.
015
0.0
76.0
56.0
150.
05.
066
.03.
010
.011
.0m
t12
397.
013
421.
036
1.0
2990
.076
25.0
3150
.012
16.0
839.
012
10.0
45.0
798.
021
.067
.068
.0m
/h21
.924
.618
.123
.523
.221
.016
.015
.08.
19.
012
.17.
06.
76.
2ha
3916
.131
79.0
768.
242
45.4
2221
.920
10.6
704.
964
.044
6.5
1048
.917
7.0
890.
520
0.5
256.
514
3.0
497.
320
1.0
75.0
mt
7402
7.3
6571
2.5
1031
0.1
1009
22.0
4743
3.0
2734
0.8
1457
6.0
939.
560
40.0
1078
4.8
1986
.010
892.
332
33.0
3721
.618
72.0
4942
.020
52.3
1037
.0m
/h18
.920
.713
.423
.821
.313
.620
.714
.713
.510
.311
.212
.216
.114
.513
.19.
910
.213
.8ha
951.
052
6.5
5.0
377.
545
1.0
74.5
4.4
5.0
95.0
62.2
15.9
540
.012
5.0
235.
0
mt
1016
0.0
6514
.330
.585
22.5
8608
.510
36.0
31.5
49.2
517.
841
1.4
99.7
324.
063
6.5
1723
.65
m/h
10.7
12.4
6.1
22.6
19.1
13.9
7.1
9.8
5.5
6.6
6.2
8.1
5.1
7.3
Lal
itpur
Kat
hman
du
Nuw
akot
Dha
ding
Mak
awan
pur C. H
ILL
S
Dha
nush
a
Bha
ktap
ur
C. M
OU
NT
AIN
Ram
echh
ap
Sind
huli
Kav
re

STATISTICAL INFORMATION ON NEPALESE AGRICULTURE 2072-73 (2015-16)
87
Dis
tric
ts
Area/ Prodn/ Yield
Cauliflower
Cabbage
Broccoli
Tomato
Radish
Broad Mustard Leaf
Carrot
Turnip
Capsicum
Peas
French Beans
French Beans -Pole Type
French Beans -BushType
French Beans - Sword Type
Broad Beans
Asparagus Beans
Cowpea
Other (Legumes)
ha15
76.0
857.
042
5.0
90.0
250.
015
0.0
mt
1927
2.0
1148
4.0
4781
.018
35.0
3625
.015
15.0
m/h
12.2
13.4
11.2
20.4
14.5
10.1
ha25
80.0
1600
.020
.097
5.0
950.
015
5.0
25.0
20.0
5.0
225.
026
0.0
15.0
260.
020
0.0
125.
012
5.0
170.
0m
t43
602.
027
840.
020
0.0
2326
0.0
1330
0.0
2170
.027
5.0
120.
015
.014
62.0
2860
.060
.010
40.0
400.
037
5.0
400.
010
20.0
m/h
16.9
17.4
10.0
23.9
14.0
14.0
11.0
6.0
3.0
6.5
11.0
4.0
4.0
2.0
3.0
3.2
6.0
ha16
40.0
820.
030
.041
0.0
50.0
100.
010
0.0
15.0
50.0
150.
020
0.0
300.
0m
t13
120.
082
00.0
240.
049
20.0
250.
030
0.0
300.
012
0.0
175.
045
0.0
1000
.018
00.0
m/h
8.0
10.0
8.0
12.0
5.0
3.0
3.0
8.0
3.5
3.0
5.0
6.0
ha23
85.0
357.
025
.035
5.0
375.
015
6.0
21.0
15.0
25.0
1127
.045
.020
.064
5.0
125.
0m
t52
470.
012
138.
030
0.0
1597
5.0
8625
.034
32.0
378.
027
0.0
575.
010
149.
049
5.0
260.
032
25.0
1500
.0m
/h22
.034
.012
.045
.023
.022
.018
.018
.023
.09.
011
.013
.05.
012
.0ha
650.
085
.021
.020
5.0
65.0
4.0
3.0
205.
017
.030
.018
0.0
30.0
mt
1692
7.0
1785
.050
4.0
4920
.015
36.0
72.0
24.0
1230
.025
5.0
180.
021
60.0
240.
0m
/h26
.021
.0#D
IV/0
!24
.024
.023
.618
.08.
06.
015
.06.
012
.08.
0ha
431.
033
5.0
220.
062
9.0
195.
017
5.0
115.
011
5.0
278.
019
0.0
185.
05.
020
.026
1.0
103.
011
0.0
mt
5172
.046
90.0
2970
.091
20.5
2219
.222
75.0
1437
.513
80.0
3197
.017
10.0
2497
.595
.016
0.0
3393
.082
4.0
935.
0m
/h12
.014
.013
.514
.511
.413
.012
.512
.011
.59.
013
.519
.08.
013
.08.
08.
5ha
1021
3.0
4580
.530
0.0
3192
.523
16.0
975.
526
9.4
55.0
148.
019
80.0
450.
030
7.2
38.0
260.
046
0.0
1536
.010
38.0
310.
0m
t16
0723
.072
651.
337
40.5
6708
3.0
3975
7.7
1437
4.0
2494
.055
9.2
1994
.016
730.
845
70.0
3463
.944
9.7
1040
.017
74.0
1078
9.5
7762
.721
95.0
m/h
15.7
15.9
12.5
21.0
17.2
14.7
9.3
10.2
13.5
8.4
10.2
11.3
11.8
4.0
3.9
7.0
7.5
7.1
ha15
299.
188
52.5
1084
.281
93.9
5003
.934
67.1
1013
.313
1.0
619.
531
79.9
722.
013
98.7
395.
557
0.5
621.
020
80.3
1290
.043
0.0
mt
2525
03.3
1550
68.8
1422
4.6
1772
88.0
9493
1.7
4719
8.8
1748
5.0
1594
.782
55.0
2797
3.5
6727
.015
683.
240
87.7
5069
.637
33.0
1587
0.5
9964
.036
37.0
m/h
16.5
17.5
13.1
21.6
19.0
13.6
17.3
12.2
13.3
8.8
9.3
11.2
10.3
8.9
6.0
7.6
7.7
8.5
ha30
.045
.53.
53.
5019
.028
.33.
01.
52.
513
.54.
51.
0m
t37
3.0
703.
029
.030
.031
1.0
339.
036
.09.
05.
041
.012
.04.
0m
/h12
.415
.58.
38.
616
.412
.012
.06.
02.
03.
02.
74.
0ha
28.0
37.0
28.0
5.0
53.0
12.0
6.0
4.0
4.0
mt
359.
080
5.0
489.
057
.056
7.0
132.
068
.016
.042
.0m
/h12
.821
.817
.511
.410
.711
.011
.34.
010
.5ha
58.0
82.5
3.5
31.5
24.0
81.3
15.0
1.5
8.5
17.5
8.5
1.0
mt
732.
015
08.0
29.0
519.
036
8.0
906.
016
8.0
9.0
73.0
57.0
54.0
4.0
m/h
12.6
18.3
8.3
16.5
15.3
11.2
11.2
6.0
8.6
3.3
6.4
4.0
ha24
9.0
248.
015
.012
5.0
140.
031
0.0
5.0
2.0
8.0
7.0
8.0
20.0
5.0
5.0
3.0
10.0
13.0
10.0
mt
2672
.029
04.0
165.
017
92.0
1920
.030
50.0
50.0
20.0
80.0
84.0
64.0
200.
040
.050
.030
.090
.010
8.0
80.0
m/h
10.7
11.7
11.0
14.3
13.7
9.8
10.0
10.0
10.0
12.0
8.0
10.0
8.0
10.0
10.0
9.0
8.3
8.0
ha21
2.0
201.
032
.017
2.0
203.
018
1.0
26.0
8.0
6.0
35.0
127.
027
1.0
28.0
55.0
25.0
10.0
100.
070
.0
Chi
twan
C. T
ER
AI
C. R
EG
ION
Man
ang
Mus
tang W
. MO
UN
TA
IN
Gor
kha
Pars
a
Moh
atta
ri
Sarl
ahi
Rau
taha
t
Bar
a
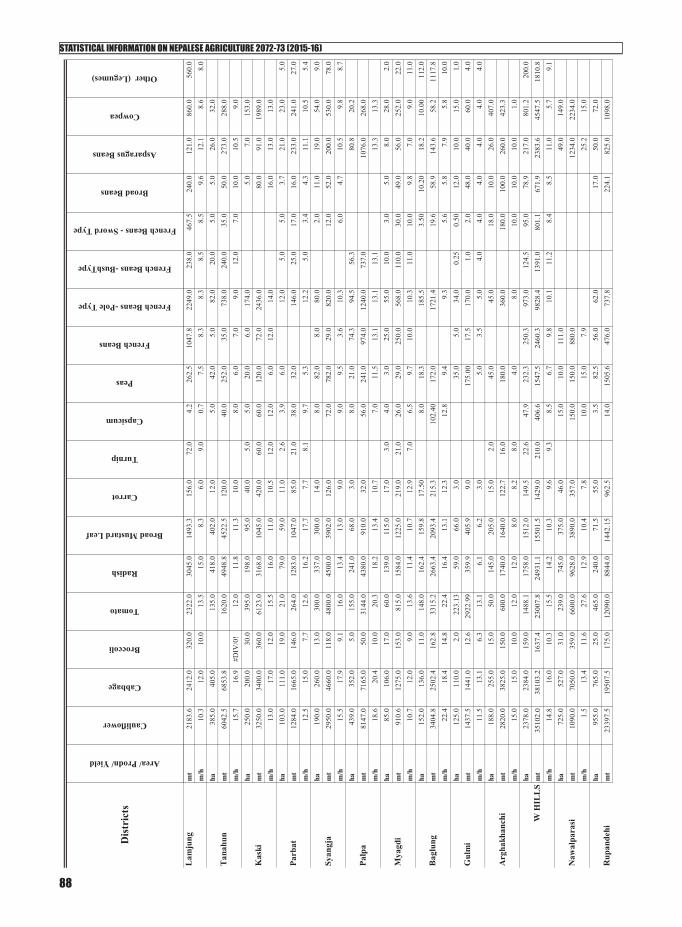
STATISTICAL INFORMATION ON NEPALESE AGRICULTURE 2072-73 (2015-16)
88
Dis
tric
ts
Area/ Prodn/ Yield
Cauliflower
Cabbage
Broccoli
Tomato
Radish
Broad Mustard Leaf
Carrot
Turnip
Capsicum
Peas
French Beans
French Beans -Pole Type
French Beans -BushType
French Beans - Sword Type
Broad Beans
Asparagus Beans
Cowpea
Other (Legumes)
mt
2183
.624
12.0
320.
023
22.0
3045
.014
93.3
156.
072
.04.
226
2.5
1047
.822
49.0
238.
046
7.5
240.
012
1.0
860.
056
0.0
m/h
10.3
12.0
10.0
13.5
15.0
8.3
6.0
9.0
0.7
7.5
8.3
8.3
8.5
8.5
9.6
12.1
8.6
8.0
ha38
5.0
405.
013
5.0
418.
040
2.0
12.0
5.0
42.0
5.0
82.0
20.0
5.0
5.0
26.0
32.0
mt
6042
.568
53.8
1620
.049
48.8
4522
.512
0.0
40.0
252.
035
.073
8.0
240.
035
.050
.027
3.0
288.
0m
/h15
.716
.9#D
IV/0
!12
.011
.811
.310
.08.
06.
07.
09.
012
.07.
010
.010
.59.
0ha
250.
020
0.0
30.0
395.
019
8.0
95.0
40.0
5.0
5.0
20.0
6.0
174.
05.
07.
015
3.0
mt
3250
.034
00.0
360.
061
23.0
3168
.010
45.0
420.
060
.060
.012
0.0
72.0
2436
.080
.091
.019
89.0
m/h
13.0
17.0
12.0
15.5
16.0
11.0
10.5
12.0
12.0
6.0
12.0
14.0
16.0
13.0
13.0
ha10
3.0
111.
019
.021
.079
.059
.011
.02.
63.
96.
012
.05.
05.
03.
721
.023
.05.
0m
t12
84.0
1665
.014
6.0
264.
012
83.0
1047
.085
.021
.038
.032
.014
6.0
25.0
17.0
16.0
233.
024
1.0
27.0
m/h
12.5
15.0
7.7
12.6
16.2
17.7
7.7
8.1
9.7
5.3
12.2
5.0
3.4
4.3
11.1
10.5
5.4
ha19
0.0
260.
013
.030
0.0
337.
030
0.0
14.0
8.0
82.0
8.0
80.0
2.0
11.0
19.0
54.0
9.0
mt
2950
.046
60.0
118.
048
00.0
4500
.039
02.0
126.
072
.078
2.0
29.0
820.
012
.052
.020
0.0
530.
078
.0m
/h15
.517
.99.
116
.013
.413
.09.
09.
09.
53.
610
.36.
04.
710
.59.
88.
7ha
439.
035
2.0
5.0
155.
024
1.0
68.0
3.0
8.0
21.0
74.3
94.5
56.3
80.8
20.2
mt
8147
.071
65.0
50.0
3144
.043
80.0
910.
032
.056
.024
1.0
974.
012
40.0
737.
010
76.0
268.
0m
/h18
.620
.410
.020
.318
.213
.410
.77.
011
.513
.113
.113
.113
.313
.3ha
85.0
106.
017
.060
.013
9.0
115.
017
.03.
04.
03.
025
.055
.010
.03.
05.
08.
028
.02.
0m
t91
0.6
1275
.015
3.0
815.
015
84.0
1225
.021
9.0
21.0
26.0
29.0
250.
056
8.0
110.
030
.049
.056
.025
2.0
22.0
m/h
10.7
12.0
9.0
13.6
11.4
10.7
12.9
7.0
6.5
9.7
10.0
10.3
11.0
10.0
9.8
7.0
9.0
11.0
ha15
2.0
136.
011
.014
8.0
162.
415
9.8
17.5
08.
018
.318
5.5
3.50
10.2
018
.210
.00
112.
0m
t34
04.8
2502
.416
2.8
3315
.226
63.4
2093
.421
5.3
102.
4017
2.0
1721
.419
.658
.914
3.6
58.2
1117
.8m
/h22
.418
.414
.822
.416
.413
.112
.312
.89.
49.
35.
65.
87.
95.
810
.0ha
125.
011
0.0
2.0
223.
1359
.066
.03.
035
.05.
034
.00.
250.
5012
.010
.015
.01.
0m
t14
37.5
1441
.012
.629
22.9
935
9.9
405.
99.
017
5.00
17.5
170.
01.
02.
048
.040
.060
.04.
0m
/h11
.513
.16.
313
.16.
16.
23.
05.
03.
55.
04.
04.
04.
04.
04.
04.
0ha
188.
025
5.0
15.0
50.0
145.
020
5.0
15.0
2.0
45.0
45.0
18.0
10.0
26.0
407.
0m
t28
20.0
3825
.015
0.0
600.
017
40.0
1640
.012
2.7
16.0
180.
036
0.0
180.
010
0.0
260.
042
3.3
m/h
15.0
15.0
10.0
12.0
12.0
8.0
8.2
8.0
4.0
8.0
10.0
10.0
10.0
1.0
ha23
78.0
2384
.015
9.0
1488
.117
58.0
1512
.014
9.5
22.6
47.9
232.
325
0.3
973.
012
4.5
95.0
78.9
217.
080
1.2
200.
0m
t35
102.
038
103.
216
37.4
2300
7.8
2493
1.1
1550
1.5
1429
.021
0.0
406.
615
47.5
2460
.398
28.4
1391
.080
1.1
671.
923
83.6
4547
.518
10.8
m/h
14.8
16.0
10.3
15.5
14.2
10.3
9.6
9.3
8.5
6.7
9.8
10.1
11.2
8.4
8.5
11.0
5.7
9.1
ha72
5.0
527.
031
.023
9.0
745.
037
5.0
46.0
15.0
10.0
111.
049
.014
9.0
mt
1090
.070
50.0
359.
066
00.0
9628
.038
90.0
357.
015
0.0
150.
088
0.0
1234
.022
34.0
m/h
1.5
13.4
11.6
27.6
12.9
10.4
7.8
10.0
15.0
7.9
25.2
15.0
ha95
5.0
765.
025
.046
5.0
240.
071
.555
.03.
582
.556
.062
.017
.050
.072
.0m
t23
397.
519
507.
517
5.0
1209
0.0
8844
.014
42.1
596
2.5
14.0
1505
.647
6.0
737.
822
4.1
825.
010
98.0
Palp
a
Mya
gdi
Bag
lung
Gul
mi
Arg
hakh
anch
i
W H
ILL
S
Naw
alpa
rasi
Rup
ande
hi
Syan
gja
Lam
jung
Tan
ahun
Kas
ki
Parb
at

STATISTICAL INFORMATION ON NEPALESE AGRICULTURE 2072-73 (2015-16)
89
Dis
tric
ts
Area/ Prodn/ Yield
Cauliflower
Cabbage
Broccoli
Tomato
Radish
Broad Mustard Leaf
Carrot
Turnip
Capsicum
Peas
French Beans
French Beans -Pole Type
French Beans -BushType
French Beans - Sword Type
Broad Beans
Asparagus Beans
Cowpea
Other (Legumes)
m/h
24.5
25.5
7.0
26.0
36.9
20.2
17.5
4.0
18.2
8.5
11.9
13.2
16.5
15.3
ha33
5.0
325.
011
.035
0.0
350.
065
.026
.016
.010
.015
0.0
16.0
17.0
16.0
48.0
200.
050
.0m
t70
00.0
7100
.044
.070
00.0
5000
.012
50.0
2288
.080
.030
.070
0.0
96.0
68.0
86.0
336.
015
00.0
300.
0m
/h20
.921
.84.
020
.014
.319
.288
.05.
03.
04.
76.
04.
05.
47.
07.
56.
0ha
2015
.016
17.0
67.0
1054
.013
35.0
511.
512
7.0
16.0
28.5
242.
516
7.0
78.0
17.0
33.0
147.
042
1.0
50.0
mt
3148
7.5
3365
7.5
578.
025
690.
023
472.
065
82.2
3607
.580
.019
4.0
2355
.613
56.0
833.
868
.031
0.1
2395
.048
32.0
300.
0m
/h15
.620
.88.
624
.417
.612
.928
.45.
06.
89.
78.
110
.74.
09.
416
.311
.56.
0ha
4451
.040
83.5
229.
525
73.6
3117
.021
04.8
291.
540
.176
.448
3.3
434.
810
59.5
141.
595
.011
2.9
364.
012
22.2
250.
0m
t67
321.
573
268.
722
44.4
4921
6.8
4877
1.1
2298
9.7
5204
.529
9.0
600.
639
76.1
3873
.310
716.
214
59.0
801.
198
6.0
4778
.693
79.5
2110
.8m
/h15
.117
.99.
819
.115
.610
.917
.97.
57.
98.
28.
910
.110
.38.
48.
713
.17.
78.
4ha
30.0
20.0
4.0
30.0
35.0
36.0
7.0
2.0
1.0
5.0
2.0
3.0
5.0
200.
0m
t36
0.0
220.
032
.029
1.0
416.
033
9.5
70.0
24.0
3.0
15.0
20.0
30.0
50.0
1600
.0m
/h12
.011
.08.
09.
711
.99.
410
.012
.03.
03.
010
.010
.010
.08.
0ha
2.0
18.0
1.0
36.0
35.0
34.0
18.0
9.5
7.0
145.
0m
t15
.114
4.0
1.2
273.
621
0.0
272.
013
6.8
72.2
11.2
362.
0m
/h7.
68.
01.
27.
66.
08.
07.
67.
61.
62.
5ha
16.0
14.0
1.0
15.0
21.0
6.0
14.0
44.0
3.0
83.0
mt
168.
015
4.0
6.0
150.
031
5.0
45.0
84.0
43.0
24.0
822.
0m
/h10
.511
.06.
010
.015
.07.
56.
01.
08.
09.
9ha
72.0
145.
045
.035
.05.
030
.03.
045
.090
.021
50.0
mt
360.
087
0.0
180.
021
0.0
20.0
120.
015
.018
0.0
360.
043
00.0
m/h
5.0
6.0
4.0
6.0
4.0
4.0
5.0
4.0
4.0
2.0
ha65
.055
.05.
025
.050
.060
.025
.05.
02.
010
.05.
01.
04.
040
.0m
t65
0.0
605.
050
.030
0.0
600.
054
0.0
245.
050
.06.
060
.044
.09.
039
.028
.0m
/h10
.011
.010
.012
.012
.09.
09.
810
.03.
06.
08.
89.
09.
80.
7ha
185.
025
2.0
11.0
151.
017
6.0
141.
094
.016
.53.
069
.014
5.0
55.0
176.
01.
04.
045
.023
50.0
mt
1553
.119
93.0
89.2
1194
.617
51.0
1216
.565
5.8
146.
29.
014
4.2
362.
026
8.0
1212
.09.
039
.078
.059
00.0
m/h
8.4
7.9
8.1
7.9
9.9
8.6
7.0
8.9
3.0
2.1
2.5
4.9
6.9
9.0
9.8
1.7
2.5
ha23
0.0
180.
011
0.0
280.
028
0.0
18.0
2.0
42.0
37.0
4.0
3.0
12.0
32.0
mt
3002
.025
03.0
1307
.042
40.0
3475
.016
5.0
5.0
472.
020
8.0
46.0
26.0
118.
037
5.0
m/h
13.1
13.9
11.9
15.1
12.4
9.2
2.5
11.2
5.6
11.5
8.7
9.8
11.7
ha14
2.0
165.
029
0.0
130.
095
.042
0.0
76.0
52.0
35.0
55.0
12.0
170.
012
.065
.020
.020
.0m
t16
48.0
1965
.024
07.0
1326
.012
74.0
3192
.047
5.0
598.
088
.052
.027
.037
4.0
34.0
060
1.9
94.0
103.
0m
/h11
.611
.98.
310
.213
.47.
66.
311
.52.
50.
92.
32.
22.
89.
34.
75.
2ha
160.
013
0.0
1.3
80.0
160.
035
.02.
53.
02.
510
.03.
035
.520
.51.
05.
512
.035
.0m
t19
20.0
1755
.012
.580
0.0
3400
.021
8.8
13.7
536
.03.
7555
.06.
039
0.5
123.
02.
033
.072
.014
0.0
m/h
12.0
13.5
10.0
10.0
21.3
6.3
5.5
12.0
1.5
5.5
2.0
11.0
6.0
2.0
6.0
6.0
4.0
Mug
u
Hum
la
Jum
la
Kal
ikot
MW
. MO
UN
TA
IN
Ruk
um
Rol
pa
Pyut
han
Dol
pa
Kap
ilbas
tu
W. T
ER
AI
W. R
EG
ION
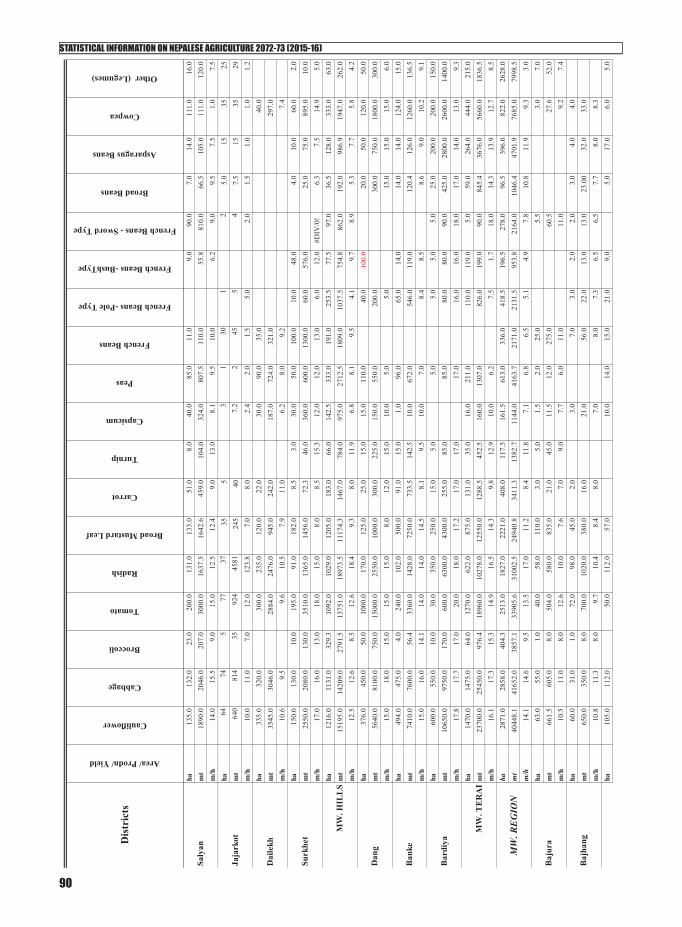
STATISTICAL INFORMATION ON NEPALESE AGRICULTURE 2072-73 (2015-16)
90
Dis
tric
ts
Area/ Prodn/ Yield
Cauliflower
Cabbage
Broccoli
Tomato
Radish
Broad Mustard Leaf
Carrot
Turnip
Capsicum
Peas
French Beans
French Beans -Pole Type
French Beans -BushType
French Beans - Sword Type
Broad Beans
Asparagus Beans
Cowpea
Other (Legumes)
ha13
5.0
132.
023
.020
0.0
131.
013
3.0
51.0
8.0
40.0
85.0
11.0
9.0
90.0
7.0
14.0
111.
016
.0m
t18
90.0
2046
.020
7.0
3000
.016
37.5
1642
.645
9.0
104.
032
4.0
807.
511
0.0
55.8
810.
066
.510
5.0
111.
012
0.0
m/h
14.0
15.5
9.0
15.0
12.5
12.4
9.0
13.0
8.1
9.5
10.0
6.2
9.0
9.5
7.5
1.0
7.5
ha64
745
7737
355
31
301
25.
015
3525
mt
640
814
3592
445
8124
540
7.2
245
54
7.5
1535
29m
/h10
.011
.07.
012
.012
3.8
7.0
8.0
2.4
2.0
1.5
5.0
2.0
1.5
1.0
1.0
1.2
ha33
5.0
320.
030
0.0
235.
012
0.0
22.0
30.0
90.0
35.0
40.0
mt
3545
.030
46.0
2884
.024
76.0
945.
024
2.0
187.
072
4.0
321.
029
7.0
m/h
10.6
9.5
9.6
10.5
7.9
11.0
6.2
8.0
9.2
7.4
ha15
0.0
130.
010
.019
5.0
91.0
182.
08.
53.
030
.050
.010
0.0
10.0
48.0
4.0
10.0
60.0
2.0
mt
2550
.020
80.0
130.
035
10.0
1365
.014
56.0
72.3
46.0
360.
060
0.0
1300
.060
.057
6.0
25.0
75.0
895.
010
.0m
/h17
.016
.013
.018
.015
.08.
08.
515
.312
.012
.013
.06.
012
.0#D
IV/0
!6.
37.
514
.95.
0ha
1216
.011
31.0
329.
310
92.0
1029
.012
05.0
183.
066
.014
2.5
333.
019
1.0
253.
577
.597
.036
.512
8.0
333.
063
.0m
t15
195.
014
209.
027
91.5
1375
1.0
1897
3.5
1117
4.3
1467
.078
4.0
975.
027
12.5
1809
.010
37.5
754.
886
2.0
192.
098
6.9
1947
.026
2.0
m/h
12.5
12.6
8.5
12.6
18.4
9.3
8.0
11.9
6.8
8.1
9.5
4.1
9.7
8.9
5.3
7.7
5.8
4.2
ha37
6.0
450.
050
.010
00.0
170.
012
5.0
25.0
15.0
15.0
110.
040
.010
0.0
20.0
50.0
120.
050
.0m
t56
40.0
8100
.075
0.0
1500
0.0
2550
.010
00.0
300.
022
5.0
150.
055
0.0
200.
030
0.0
750.
018
00.0
300.
0m
/h15
.018
.015
.015
.015
.08.
012
.015
.010
.05.
05.
015
.015
.015
.06.
0ha
494.
047
5.0
4.0
240.
010
2.0
500.
091
.015
.01.
096
.065
.014
.014
.014
.012
4.0
15.0
mt
7410
.076
00.0
56.4
3360
.014
28.0
7250
.073
3.5
142.
510
.067
2.0
546.
011
9.0
120.
412
6.0
1260
.013
6.5
m/h
15.0
16.0
14.1
14.0
14.0
14.5
8.1
9.5
10.0
7.0
8.4
8.5
8.6
9.0
10.2
9.1
ha60
0.0
550.
010
.030
.035
0.0
250.
015
.05.
05.
05.
05.
05.
025
.020
0.0
200.
015
0.0
mt
1065
0.0
9750
.017
0.0
600.
063
00.0
4300
.025
5.0
85.0
85.0
80.0
80.0
90.0
425.
028
00.0
2600
.014
00.0
m/h
17.8
17.7
17.0
20.0
18.0
17.2
17.0
17.0
17.0
16.0
16.0
18.0
17.0
14.0
13.0
9.3
ha14
70.0
1475
.064
.012
70.0
622.
087
5.0
131.
035
.016
.021
1.0
110.
011
9.0
5.0
59.0
264.
044
4.0
215.
0m
t23
700.
025
450.
097
6.4
1896
0.0
1027
8.0
1255
0.0
1288
.545
2.5
160.
013
07.0
826.
019
9.0
90.0
845.
436
76.0
5660
.018
36.5
m/h
16.1
17.3
15.3
14.9
16.5
14.3
9.8
12.9
10.0
6.2
7.5
1.7
18.0
14.3
13.9
12.7
8.5
ha28
71.0
2858
.040
4.3
2513
.018
27.0
2221
.040
8.0
117.
516
1.5
613.
033
6.0
418.
519
6.5
278.
096
.539
6.0
822.
026
28.0
mt
4044
8.1
4165
2.0
3857
.133
905.
631
002.
524
940.
834
11.3
1382
.711
44.0
4163
.721
71.0
2131
.595
3.8
2164
.010
46.4
4701
.976
85.0
7998
.5m
/h14
.114
.69.
513
.517
.011
.28.
411
.87.
16.
86.
55.
14.
97.
810
.811
.99.
33.
0ha
63.0
55.0
1.0
40.0
58.0
110.
03.
05.
01.
52.
025
.05.
53.
07.
0m
t66
1.5
605.
08.
050
4.0
580.
083
5.0
21.0
45.0
11.5
12.0
275.
060
.527
.652
.0m
/h10
.511
.08.
012
.610
.07.
67.
09.
07.
76.
011
.011
.09.
27.
4ha
60.0
31.0
1.0
72.0
98.0
45.0
2.0
3.0
7.0
3.0
2.0
2.0
3.0
4.0
4.0
mt
650.
035
0.0
8.0
700.
010
20.0
380.
016
.021
.056
.022
.013
.013
.023
.00
32.0
33.0
m/h
10.8
11.3
8.0
9.7
10.4
8.4
8.0
7.0
8.0
7.3
6.5
6.5
7.7
8.0
8.3
ha10
5.0
112.
050
.011
2.0
57.0
10.0
14.0
15.0
21.0
9.0
5.0
17.0
6.0
5.0
MW
. HIL
LS
Dan
g
Ban
ke
Bar
diya
MW
. TE
RA
I
MW
. RE
GIO
N
Baj
ura
Baj
hang
Surk
het
Saly
an
Jaja
rkot
Dai
lekh
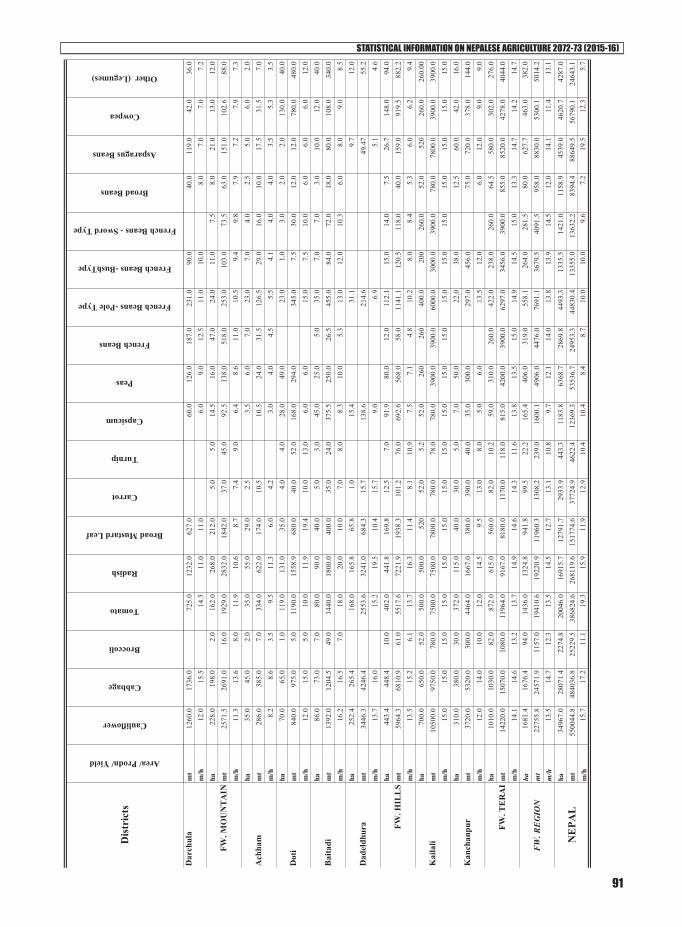
STATISTICAL INFORMATION ON NEPALESE AGRICULTURE 2072-73 (2015-16)
91
Dis
tric
ts
Area/ Prodn/ Yield
Cauliflower
Cabbage
Broccoli
Tomato
Radish
Broad Mustard Leaf
Carrot
Turnip
Capsicum
Peas
French Beans
French Beans -Pole Type
French Beans -BushType
French Beans - Sword Type
Broad Beans
Asparagus Beans
Cowpea
Other (Legumes)
mt
1260
.017
36.0
725.
012
32.0
627.
060
.012
6.0
187.
023
1.0
90.0
40.0
119.
042
.036
.0m
/h12
.015
.514
.511
.011
.06.
09.
012
.511
.010
.08.
07.
07.
07.
2ha
228.
019
8.0
2.0
162.
026
8.0
212.
05.
05.
014
.516
.047
.024
.011
.07.
58.
021
.013
.012
.0m
t25
71.5
2691
.016
.019
29.0
2832
.018
42.0
37.0
45.0
92.5
138.
051
8.0
253.
010
3.0
73.5
63.0
151.
010
2.6
88.0
m/h
11.3
13.6
8.0
11.9
10.6
8.7
7.4
9.0
6.4
8.6
11.0
10.5
9.4
9.8
7.9
7.2
7.9
7.3
ha35
.045
.02.
035
.055
.029
.02.
53.
56.
07.
023
.07.
04.
02.
55.
06.
02.
0m
t28
6.0
385.
07.
033
4.0
622.
017
4.0
10.5
10.5
24.0
31.5
126.
529
.016
.010
.017
.531
.57.
0m
/h8.
28.
63.
59.
511
.36.
04.
23.
04.
04.
55.
54.
14.
04.
03.
55.
33.
5ha
70.0
65.0
1.0
119.
013
1.0
35.0
4.0
4.0
28.0
49.0
23.0
1.0
3.0
2.0
2.0
130.
040
.0m
t84
0.0
975.
05.
011
90.0
1558
.968
0.0
40.0
52.0
168.
029
4.0
345.
07.
530
.012
.012
.078
0.0
480.
0m
/h12
.015
.05.
010
.011
.919
.410
.013
.06.
06.
015
.07.
510
.06.
06.
06.
012
.0ha
86.0
73.0
7.0
80.0
90.0
40.0
5.0
3.0
45.0
25.0
5.0
35.0
7.0
7.0
3.0
10.0
12.0
40.0
mt
1392
.012
04.5
49.0
1440
.018
00.0
400.
035
.024
.037
5.5
250.
026
.545
5.0
84.0
72.0
18.0
80.0
108.
034
0.0
m/h
16.2
16.5
7.0
18.0
20.0
10.0
7.0
8.0
8.3
10.0
5.3
13.0
12.0
10.3
6.0
8.0
9.0
8.5
ha25
2.4
265.
416
8.0
165.
865
.81.
015
.431
.19.
712
.0m
t34
46.3
4246
.425
53.6
3241
.068
4.3
15.7
138.
621
4.6
49.4
755
.2m
/h13
.716
.015
.219
.510
.415
.79.
06.
95.
14.
6ha
443.
444
8.4
10.0
402.
044
1.8
169.
812
.57.
091
.980
.012
.011
2.1
15.0
14.0
7.5
26.7
148.
094
.0m
t59
64.3
6810
.961
.055
17.6
7221
.919
38.3
101.
276
.069
2.6
568.
058
.011
41.1
120.
511
8.0
40.0
159.
091
9.5
882.
2m
/h13
.515
.26.
113
.716
.311
.48.
110
.97.
57.
14.
810
.28.
08.
45.
36.
06.
29.
4ha
700.
065
0.0
52.0
500.
050
0.0
520
52.0
5.2
52.0
260
260
400.
020
026
0.0
52.0
520
260.
026
0.00
mt
1050
0.0
9750
.078
0.0
7500
.075
00.0
7800
.078
0.0
78.0
780.
039
00.0
3900
.060
00.0
3000
.039
00.0
780.
078
00.0
3900
.039
00.0
m/h
15.0
15.0
15.0
15.0
15.0
15.0
15.0
15.0
15.0
15.0
15.0
15.0
15.0
15.0
15.0
15.0
15.0
15.0
ha31
0.0
380.
030
.037
2.0
115.
040
.030
.05.
07.
050
.022
.038
.012
.560
.042
.016
.0m
t37
20.0
5320
.030
0.0
4464
.016
67.0
380.
039
0.0
40.0
35.0
300.
029
7.0
456.
075
.072
0.0
378.
014
4.0
m/h
12.0
14.0
10.0
12.0
14.5
9.5
13.0
8.0
5.0
6.0
13.5
12.0
6.0
12.0
9.0
9.0
ha10
10.0
1030
.082
.087
2.0
615.
056
0.0
82.0
10.2
59.0
310.
026
0.0
422.
023
8.0
260.
064
.558
0.0
302.
027
6.0
mt
1422
0.0
1507
0.0
1080
.011
964.
091
67.0
8180
.011
70.0
118.
081
5.0
4200
.039
00.0
6297
.034
56.0
3900
.085
5.0
8520
.042
78.0
4044
.0m
/h14
.114
.613
.213
.714
.914
.614
.311
.613
.813
.515
.014
.914
.515
.013
.314
.714
.214
.7ha
1681
.416
76.4
94.0
1436
.013
24.8
941.
899
.522
.216
5.4
406.
031
9.0
558.
126
4.0
281.
580
.062
7.7
463.
038
2.0
mt
2275
5.8
2457
1.9
1157
.019
410.
619
220.
911
960.
313
08.2
239.
016
00.1
4906
.044
76.0
7691
.136
79.5
4091
.595
8.0
8830
.053
00.1
5014
.2m
/h13
.514
.712
.313
.514
.512
.713
.110
.89.
712
.114
.013
.813
.914
.512
.014
.111
.413
.1
ha34
967.
028
071.
422
74.8
2004
6.0
1691
5.7
1279
1.7
2933
.944
3.3
1183
.863
68.7
2869
.844
93.3
1335
.514
21.0
1158
.945
39.0
4620
.742
87.0
mt
5500
44.8
4840
36.8
2522
9.5
3868
24.6
2681
19.6
1517
74.6
3772
4.9
4622
.412
369.
353
536.
724
953.
344
830.
413
355.
013
632.
283
94.4
8864
9.5
5679
0.1
2464
3.1
m/h
15.7
17.2
11.1
19.3
15.9
11.9
12.9
10.4
10.4
8.4
8.7
10.0
10.0
9.6
7.2
19.5
12.3
5.7
FW
. RE
GIO
N
NE
PAL
Bai
tadi
Dad
eldh
ura FW
. HIL
LS
Kai
lali
Kan
chan
pur
FW. T
ER
AI
Dot
i
Dar
chul
a
FW. M
OU
NT
AIN
Ach
ham

STATISTICAL INFORMATION ON NEPALESE AGRICULTURE 2072-73 (2015-16)
92
Dis
tric
ts
Panc
htha
r
Ilam
Ter
hath
um
Dha
nkut
a
Bho
jpur
Kho
tang
E. M
OU
NT
AIN
Tap
leju
ng
Sank
huw
asab
ha
Solu
khum
bu
Asparagus
Tree tomato
Chilli Akabare
Chilli
Okra
Brinjal
Onion
Cucumber
Pumpkin
Squash
Bitter Gourd
Pointed Gourd
Sponge Gourd
Ridge Gourd
Snake Gourd
Bottle Gourd
Ash Gourd
Balsam Gourd
Kakari
2.0
8.0
33.0
16.5
15.5
15.0
33.5
48.0
5.0
14.0
7.5
2.0
1.0
6.5
2.0
23.0
92.0
264.
023
1.0
217.
019
5.0
469.
060
0.0
60.0
180.
086
.023
.011
.078
.023
.011
.511
.58.
014
.014
.013
.014
.012
.512
.012
.911
.511
.511
.012
.011
.520
.017
0.0
85.0
19.0
82.0
28.0
72.0
18.0
27.0
12.5
9.0
0.25
21.0
12.0
100.
020
40.0
935.
015
2.0
918.
421
0.0
864.
010
8.0
162.
093
.863
.01.
514
7.0
84.0
5.0
12.0
11.0
8.0
11.2
7.5
12.0
6.0
6.0
7.5
7.0
6.0
7.0
7.0
5.0
5.0
13.0
4.0
5.0
18.0
32.0
80.0
2.0
12.0
4.0
2.0
2.0
10.0
30.0
25.0
91.0
20.0
35.0
270.
048
0.0
1020
.034
.010
8.0
36.0
18.0
30.0
90.0
6.0
5.0
7.0
5.0
7.0
15.0
15.0
12.8
17.0
9.0
9.0
9.0
15.0
9.0
7.0
33.0
216.
010
5.5
39.5
115.
093
.520
0.0
25.0
53.0
24.0
11.0
3.3
29.5
2.0
22.0
53.0
217.
023
95.0
1186
.040
4.0
1383
.411
59.0
2484
.020
2.0
450.
021
5.8
86.0
30.5
255.
023
.017
4.0
7.6
6.6
11.1
11.2
10.2
12.0
12.4
12.4
8.1
8.5
9.0
7.8
9.4
8.6
11.5
7.9
167
27
35
20
45
71.0
28.0
12.0
27.0
20.0
18.0
898
146
445
261
640
855.
635
0.0
150.
034
1.0
258.
024
9.0
162.
010
1.0
79.0
67.0
41.0
11.0
11.0
610.
014
50.0
1150
.010
05.0
415.
019
8.0
198.
03.
814
.414
.615
.010
.118
.018
.05.
020
.017
.015
.022
.020
.020
.078
.011
.010
.03.
01.
075
.025
0.0
68.0
120.
022
0.0
290.
050
0.0
1621
.022
0.0
140.
072
.025
.015
.012
.54.
08.
010
.014
.525
.020
.820
.014
.024
.025
.05.
075
.070
.025
.017
.065
.070
.052
.03.
515
.017
.012
.010
.020
.055
.085
0.0
125.
017
0.0
900.
075
0.0
728.
040
.061
.010
0.0
100.
05.
04.
00.
712
.15.
010
.013
.810
.714
.011
.44.
15.
98.
30.
54.
016
.59.
09.
536
.038
.57.
756
.028
.56.
712
.53.
03.
012
.04.
512
.061
.140
.566
.528
8.0
269.
553
.933
6.0
142.
543
.687
.524
.018
.012
0.0
18.0
3.0
3.7
4.5
7.0
8.0
7.0
7.0
6.0
5.0
6.5
7.0
8.0
6.0
10.0
4.0
1.5
50.0
250.
030
0.0
270.
017
5.0
680.
025
0.0
600.
075
.045
0.0
50.0
25.0
4.0
52.0
10.0
500.
075
0.0
900.
013
50.0
1700
.074
80.0
3750
.090
00.0
900.
045
00.0
250.
035
.016
.052
0.0
25.0
10.0
3.0
3.0
5.0
9.7
11.0
15.0
15.0
12.0
10.0
5.0
1.4
4.0
10.0
2.5
19.0
15.0
4.0
17.0
35.0
15.0
20.0
7.0
4.0
5.0
2.0
5.0

STATISTICAL INFORMATION ON NEPALESE AGRICULTURE 2072-73 (2015-16)
93
Dis
tric
ts
Sapt
ari
Sira
ha
E. T
ER
AI
E. R
EG
ION
Dol
akha
Sind
hupa
lcho
k
Ras
uwa
Suns
ari
Okh
aldh
unga
Uda
yapu
r
E. H
ILL
S
Jhap
a
Mor
ang
Asparagus
Tree tomato
Chilli Akabare
Chilli
Okra
Brinjal
Onion
Cucumber
Pumpkin
Squash
Bitter Gourd
Pointed Gourd
Sponge Gourd
Ridge Gourd
Snake Gourd
Bottle Gourd
Ash Gourd
Balsam Gourd
Kakari
76.0
60.0
30.0
170.
026
2.5
225.
040
0.0
35.0
44.0
40.0
26.0
4.0
4.0
7.5
10.0
7.5
15.0
20.0
5.0
11.0
5.2
1.7
50.0
86.0
42.0
90.0
70.0
65.0
20.0
39.0
20.0
20.0
2.0
3.0
22.0
3.0
2.5
200.
086
0.0
430.
045
0.0
835.
081
2.0
200.
039
0.0
200.
019
0.0
12.0
24.0
330.
036
.01.
44.
010
.010
.25.
011
.912
.510
.010
.010
.09.
56.
08.
015
.012
.01.
564
.071
1.2
488.
044
4.5
329.
010
74.5
582.
796
6.0
150.
059
5.7
20.0
137.
530
.015
.013
0.0
7.5
25.0
607.
027
02.1
2264
.329
96.0
3238
.511
742.
081
19.5
1425
2.0
1652
.559
25.6
200.
011
99.5
111.
084
.015
42.0
54.0
30.0
9.5
3.8
4.6
6.7
9.8
10.9
13.9
14.8
11.0
9.9
10.0
8.7
3.7
5.6
11.9
7.2
1.2
258.
057
4.0
507.
018
2.0
194.
026
8.0
15.0
248.
021
.013
3.0
206.
046
44.0
8346
.066
42.0
2657
.033
95.0
4824
.017
0.0
4216
.031
5.0
1596
.041
20.0
18.0
14.5
13.1
14.6
17.5
18.0
11.3
17.0
15.0
12.0
20.0
15.0
20.0
1200
.046
0.0
575.
070
0.0
251.
012
0.0
100.
045
0.0
250.
020
0.0
2.0
2.0
150.
060
.070
.013
800.
055
20.0
1437
5.0
7350
.087
85.0
2400
.010
00.0
9900
.030
00.0
8000
.015
.030
.037
50.0
4.0
3.5
11.5
12.0
25.0
10.5
35.0
20.0
10.0
22.0
12.0
40.0
7.5
15.0
25.0
0.5
1.0
150.
070
0.0
500.
040
0.0
525.
013
5.0
20.0
460.
040
0.0
210.
020
.05.
034
5.0
10.0
25.0
2.0
8.0
1135
.084
00.0
7000
.056
00.0
6825
.020
00.0
250.
050
60.0
6000
.027
30.0
180.
035
.051
75.0
160.
030
0.0
4.0
8.0
7.6
12.0
14.0
14.0
13.0
14.8
12.5
11.0
15.0
13.0
9.0
7.0
15.0
16.0
12.0
225.
040
0.0
900.
054
00.0
250.
035
0.0
225.
012
5.0
375.
010
0.0
15.0
800.
030
0.0
10.0
1125
.052
00.0
1035
0.0
5400
0.0
5000
.043
75.0
2475
.015
00.0
4875
.080
0.0
180.
011
200.
030
00.0
100.
05.
013
.011
.510
.020
.012
.511
.012
.013
.08.
012
.014
.010
.010
.071
.016
0.0
105.
089
0.0
30.0
45.0
1050
.026
.030
.010
.060
.03.
03.
046
1.0
1760
.010
50.0
1424
0.0
366.
049
5.0
1060
5.0
208.
027
0.0
80.0
600.
030
.021
.06.
511
.010
.016
.012
.211
.010
.18.
09.
08.
010
.010
.07.
015
.00.
521
.019
04.0
2294
.025
87.0
7572
.012
50.0
918.
013
5.0
2433
.082
2.0
948.
013
2.0
22.0
1561
.031
3.0
25.0
13.0
60.0
2.0
78.0
2116
5.0
2922
6.0
3941
7.0
8384
7.0
2437
1.0
1409
4.0
1420
.032
256.
011
023.
017
471.
010
75.0
245.
024
845.
031
90.0
300.
012
1.0
4.0
4.0
3.7
11.1
12.7
15.2
11.1
19.5
15.4
10.5
13.3
13.4
18.4
8.1
11.1
15.9
10.2
12.0
9.3
16.5
71.5
765.
226
08.0
2844
.029
55.5
8761
.519
26.2
2084
.031
0.0
3081
.784
2.0
1109
.517
3.0
40.3
1720
.532
2.5
72.0
13.0
60.0
662.
029
97.1
2582
4.3
3340
8.0
4305
9.5
9697
2.4
3364
9.5
3083
0.0
3274
.538
631.
611
223.
018
886.
312
72.0
359.
526
642.
032
67.0
504.
012
1.0
3.6
9.3
3.9
9.9
11.7
14.6
11.1
17.5
14.8
10.6
12.5
13.3
17.0
7.4
8.9
15.5
10.1
7.0
9.3
2.0
12.0
32.0
6.0
10.0
22.0
58.0
54.0
3.0
23.0
5.0
3.0
1.0
14.0
24.0
12.0
204.
045
.075
.017
4.0
936.
048
6.0
54.0
345.
075
.060
.015
.063
.012
.01.
06.
47.
57.
57.
916
.19.
018
.015
.015
.020
.015
.04.
529
.057
.057
.015
6.0
173.
014
7.0
63.0
131.
013
.057
.057
.058
7.0
337.
067
5.0
1685
.080
9.0
514.
094
1.0
99.0
473.
02.
010
.35.
94.
39.
75.
58.
27.
27.
68.
35.
020
.012
.011
.031
.036
.05.
030
.012
.05.
015
.075
.082
.011
4.0
305.
035
8.0
18.0
225.
010
0.0
25.0
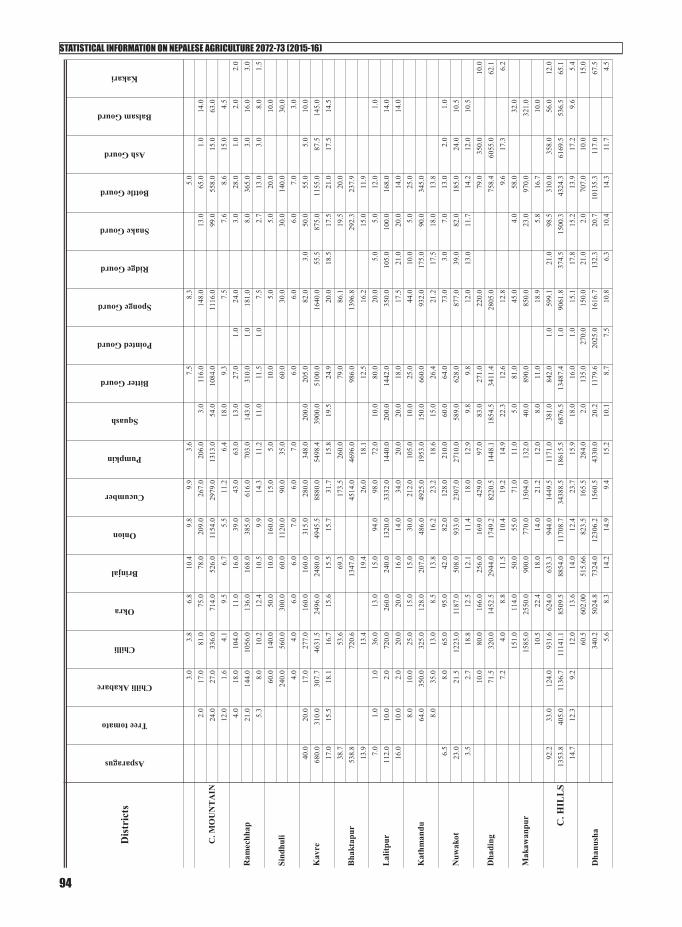
STATISTICAL INFORMATION ON NEPALESE AGRICULTURE 2072-73 (2015-16)
94
Dis
tric
ts
Lal
itpur
Kat
hman
du
Nuw
akot
Dha
ding
Mak
awan
pur C. H
ILL
S
Dha
nush
a
Bha
ktap
ur
C. M
OU
NT
AIN
Ram
echh
ap
Sind
huli
Kav
re
Asparagus
Tree tomato
Chilli Akabare
Chilli
Okra
Brinjal
Onion
Cucumber
Pumpkin
Squash
Bitter Gourd
Pointed Gourd
Sponge Gourd
Ridge Gourd
Snake Gourd
Bottle Gourd
Ash Gourd
Balsam Gourd
Kakari
3.0
3.8
6.8
10.4
9.8
9.9
3.6
7.5
8.3
5.0
2.0
17.0
81.0
75.0
78.0
209.
026
7.0
206.
03.
011
6.0
148.
013
.065
.01.
014
.024
.027
.033
6.0
714.
052
6.0
1154
.029
79.0
1313
.054
.010
84.0
1116
.099
.055
8.0
15.0
63.0
12.0
1.6
4.1
9.5
6.7
5.5
11.2
6.4
18.0
9.3
7.5
7.6
8.6
15.0
4.5
4.0
18.0
104.
011
.016
.039
.043
.063
.013
.027
.01.
024
.03.
028
.01.
02.
02.
021
.014
4.0
1056
.013
6.0
168.
038
5.0
616.
070
3.0
143.
031
0.0
1.0
181.
08.
036
5.0
3.0
16.0
3.0
5.3
8.0
10.2
12.4
10.5
9.9
14.3
11.2
11.0
11.5
1.0
7.5
2.7
13.0
3.0
8.0
1.5
60.0
140.
050
.010
.016
0.0
15.0
5.0
10.0
5.0
5.0
20.0
10.0
240.
056
0.0
300.
060
.011
20.0
90.0
35.0
60.0
30.0
30.0
140.
030
.04.
04.
06.
06.
07.
06.
07.
06.
06.
06.
07.
03.
040
.020
.017
.027
7.0
160.
016
0.0
315.
028
0.0
348.
020
0.0
205.
082
.03.
050
.055
.05.
010
.068
0.0
310.
030
7.7
4631
.524
96.0
2480
.049
45.5
8880
.054
98.4
3900
.051
00.0
1640
.055
.587
5.0
1155
.087
.514
5.0
17.0
15.5
18.1
16.7
15.6
15.5
15.7
31.7
15.8
19.5
24.9
20.0
18.5
17.5
21.0
17.5
14.5
38.7
53.6
69.3
173.
526
0.0
79.0
86.1
19.5
20.0
538.
872
0.6
1347
.045
14.0
4696
.098
6.0
1396
.829
2.3
237.
913
.913
.419
.426
.018
.112
.516
.215
.011
.97.
01.
01.
036
.013
.015
.094
.098
.072
.010
.080
.020
.05.
05.
012
.01.
011
2.0
10.0
2.0
720.
026
0.0
240.
013
20.0
3332
.014
40.0
200.
014
42.0
350.
010
5.0
100.
016
8.0
14.0
16.0
10.0
2.0
20.0
20.0
16.0
14.0
34.0
20.0
20.0
18.0
17.5
21.0
20.0
14.0
14.0
8.0
10.0
25.0
15.0
15.0
30.0
212.
010
5.0
10.0
25.0
44.0
10.0
5.0
25.0
64.0
350.
032
5.0
128.
020
7.0
486.
049
25.0
1953
.015
0.0
660.
093
2.0
175.
090
.034
5.0
8.0
35.0
13.0
8.5
13.8
16.2
23.2
18.6
15.0
26.4
21.2
17.5
18.0
13.8
6.5
8.0
65.0
95.0
42.0
82.0
128.
021
0.0
60.0
64.0
73.0
3.0
7.0
13.0
2.0
1.0
23.0
21.5
1223
.011
87.0
508.
093
3.0
2307
.027
10.0
589.
062
8.0
877.
039
.082
.018
5.0
24.0
10.5
3.5
2.7
18.8
12.5
12.1
11.4
18.0
12.9
9.8
9.8
12.0
13.0
11.7
14.2
12.0
10.5
10.0
80.0
166.
025
6.0
169.
042
9.0
97.0
83.0
271.
022
0.0
79.0
350.
010
.071
.532
0.0
1452
.529
44.0
1749
.282
20.5
1448
.118
54.5
3411
.428
05.0
758.
460
55.0
62.1
7.2
4.0
8.8
11.5
10.4
19.2
14.9
22.3
12.6
12.8
9.6
17.3
6.2
151.
011
4.0
50.0
55.0
71.0
11.0
5.0
81.0
45.0
4.0
58.0
32.0
1585
.025
50.0
900.
077
0.0
1504
.013
2.0
40.0
890.
085
0.0
23.0
970.
032
1.0
10.5
22.4
18.0
14.0
21.2
12.0
8.0
11.0
18.9
5.8
16.7
10.0
92.2
33.0
124.
093
1.6
624.
063
3.3
944.
014
49.5
1171
.038
1.0
842.
01.
059
9.1
21.0
98.5
310.
035
8.0
56.0
12.0
1353
.840
5.0
1136
.711
141.
185
09.5
8854
.011
708.
734
388.
518
615.
568
76.5
1348
7.4
1.0
9061
.837
4.5
1500
.343
24.3
6169
.553
6.5
65.1
14.7
12.3
9.2
12.0
13.6
14.0
12.4
23.7
15.9
18.0
16.0
1.0
15.1
17.8
15.2
13.9
17.2
9.6
5.4
60.5
602.
0051
5.66
823.
516
5.5
284.
02.
013
5.0
270.
015
0.0
21.0
2.0
707.
010
.015
.034
0.2
5024
.873
24.0
1230
6.2
1560
.543
30.0
20.2
1179
.620
25.0
1616
.713
2.3
20.7
1013
5.3
117.
067
.55.
68.
314
.214
.99.
415
.210
.18.
77.
510
.86.
310
.414
.311
.74.
5
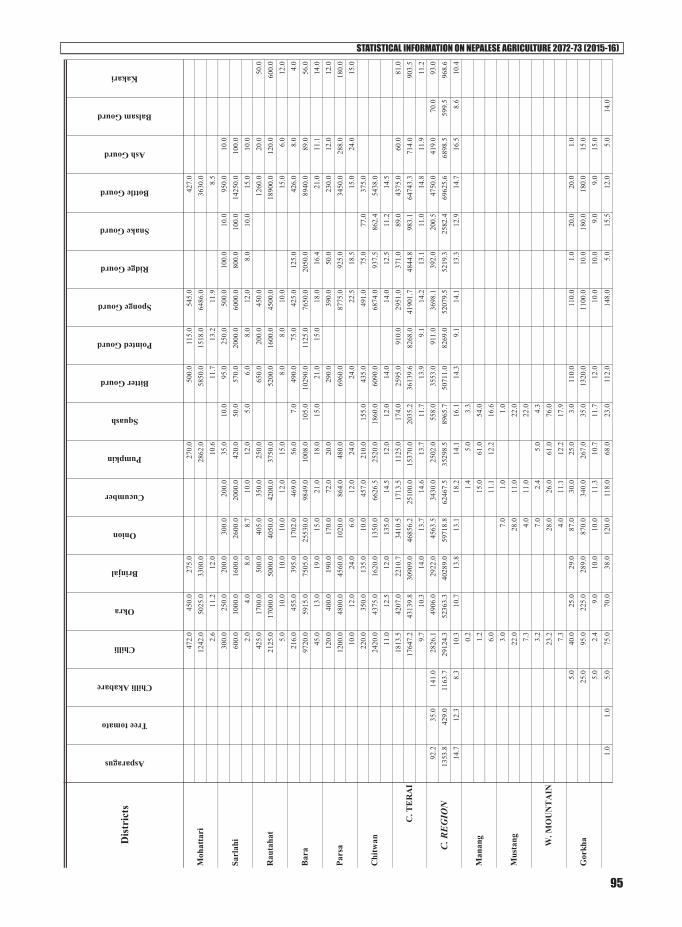
STATISTICAL INFORMATION ON NEPALESE AGRICULTURE 2072-73 (2015-16)
95
Dis
tric
ts
Chi
twan
C. T
ER
AI
C. R
EG
ION
Man
ang
Mus
tang W
. MO
UN
TA
IN
Gor
kha
Pars
a
Moh
atta
ri
Sarl
ahi
Rau
taha
t
Bar
a
Asparagus
Tree tomato
Chilli Akabare
Chilli
Okra
Brinjal
Onion
Cucumber
Pumpkin
Squash
Bitter Gourd
Pointed Gourd
Sponge Gourd
Ridge Gourd
Snake Gourd
Bottle Gourd
Ash Gourd
Balsam Gourd
Kakari
472.
045
0.0
275.
027
0.0
500.
011
5.0
545.
042
7.0
1242
.050
25.0
3300
.028
62.0
5850
.015
18.0
6486
.036
30.0
2.6
11.2
12.0
10.6
11.7
13.2
11.9
8.5
300.
025
0.0
200.
030
0.0
200.
035
.010
.095
.025
0.0
500.
010
0.0
10.0
950.
010
.060
0.0
1000
.016
00.0
2600
.020
00.0
420.
050
.057
0.0
2000
.060
00.0
800.
010
0.0
1425
0.0
100.
02.
04.
08.
08.
710
.012
.05.
06.
08.
012
.08.
010
.015
.010
.042
5.0
1700
.050
0.0
405.
035
0.0
250.
065
0.0
200.
045
0.0
1260
.020
.050
.021
25.0
1700
0.0
5000
.040
50.0
4200
.037
50.0
5200
.016
00.0
4500
.018
900.
012
0.0
600.
05.
010
.010
.010
.012
.015
.08.
08.
010
.015
.06.
012
.021
6.0
455.
039
5.0
1702
.046
9.0
56.0
7.0
490.
075
.042
5.0
125.
042
6.0
8.0
4.0
9720
.059
15.0
7505
.025
530.
098
49.0
1008
.010
5.0
1029
0.0
1125
.076
50.0
2050
.089
40.0
89.0
56.0
45.0
13.0
19.0
15.0
21.0
18.0
15.0
21.0
15.0
18.0
16.4
21.0
11.1
14.0
120.
040
0.0
190.
017
0.0
72.0
20.0
290.
039
0.0
50.0
230.
012
.012
.012
00.0
4800
.045
60.0
1020
.086
4.0
480.
069
60.0
8775
.092
5.0
3450
.028
8.0
180.
010
.012
.024
.06.
012
.024
.024
.022
.518
.515
.024
.015
.022
0.0
350.
013
5.0
10.0
457.
021
0.0
155.
043
5.0
491.
075
.077
.037
5.0
2420
.043
75.0
1620
.013
50.0
6626
.525
20.0
1860
.060
90.0
6874
.093
7.5
862.
454
38.0
11.0
12.5
12.0
135.
014
.512
.012
.014
.014
.012
.511
.214
.518
13.5
4207
.022
10.7
3410
.517
13.5
1125
.017
4.0
2595
.091
0.0
2951
.037
1.0
89.0
4375
.060
.081
.017
647.
243
139.
830
909.
046
856.
225
100.
015
370.
020
35.2
3613
9.6
8268
.041
901.
748
44.8
983.
164
743.
371
4.0
903.
59.
710
.314
.013
.714
.613
.711
.713
.99.
114
.213
.111
.014
.811
.911
.292
.235
.014
1.0
2826
.149
06.0
2922
.045
63.5
3430
.025
02.0
558.
035
53.0
911.
036
98.1
392.
020
0.5
4750
.041
9.0
70.0
93.0
1353
.842
9.0
1163
.729
124.
352
363.
340
289.
059
718.
862
467.
535
298.
589
65.7
5071
1.0
8269
.052
079.
552
19.3
2582
.469
625.
668
98.5
599.
596
8.6
14.7
12.3
8.3
10.3
10.7
13.8
13.1
18.2
14.1
16.1
14.3
9.1
14.1
13.3
12.9
14.7
16.5
8.6
10.4
0.2
1.4
5.0
3.3
1.2
15.0
61.0
54.0
6.0
11.1
12.2
16.6
3.0
7.0
1.0
1.0
22.0
28.0
11.0
22.0
7.3
4.0
11.0
22.0
3.2
7.0
2.4
5.0
4.3
23.2
28.0
26.0
61.0
76.0
7.3
4.0
11.1
12.2
17.9
5.0
40.0
25.0
29.0
87.0
30.0
25.0
3.0
110.
011
0.0
1.0
20.0
20.0
1.0
25.0
95.0
225.
028
9.0
870.
034
0.0
267.
035
.013
20.0
1100
.010
.018
0.0
180.
015
.05.
02.
49.
010
.010
.011
.310
.711
.712
.010
.010
.09.
09.
015
.0
1.0
1.0
5.0
75.0
70.0
38.0
120.
011
8.0
68.0
23.0
112.
014
8.0
5.0
15.5
12.0
5.0
14.0

STATISTICAL INFORMATION ON NEPALESE AGRICULTURE 2072-73 (2015-16)
96
Dis
tric
ts
Palp
a
Mya
gdi
Bag
lung
Gul
mi
Arg
hakh
anch
i
W H
ILL
S
Naw
alpa
rasi
Rup
ande
hi
Syan
gja
Lam
jung
Tan
ahun
Kas
ki
Parb
at
Asparagus
Tree tomato
Chilli Akabare
Chilli
Okra
Brinjal
Onion
Cucumber
Pumpkin
Squash
Bitter Gourd
Pointed Gourd
Sponge Gourd
Ridge Gourd
Snake Gourd
Bottle Gourd
Ash Gourd
Balsam Gourd
Kakari
0.5
1.8
6.4
637.
559
5.0
349.
697
2.0
1239
.084
3.2
184.
196
8.8
1324
.620
.012
7.88
108.
041
.311
9.0
0.5
1.8
1.3
8.5
8.5
9.2
8.1
10.5
12.4
8.0
8.7
9.0
4.0
8.3
9.0
8.3
8.5
2.0
1.0
2.0
92.0
62.0
41.0
115.
080
.012
3.0
17.0
93.0
144.
01.
020
.095
.05.
014
.03.
012
.064
4.0
527.
043
0.5
1380
.070
0.0
1476
.019
5.5
930.
015
84.0
9.5
176.
099
7.5
25.0
7.0
3.0
6.0
7.0
8.5
10.5
12.0
8.8
12.0
11.5
10.0
11.0
9.5
8.8
10.5
5.0
6.0
8.0
63.0
92.0
125.
060
.011
0.0
135.
030
.011
0.0
375.
011
5.0
123.
05.
024
.052
.050
4.0
1196
.021
25.0
780.
017
60.0
2700
.045
0.0
1650
.060
00.0
1380
.020
91.0
65.0
4.0
6.5
8.0
13.0
17.0
13.0
16.0
20.0
15.0
15.0
16.0
12.0
17.0
13.0
0.3
1.0
0.6
14.0
21.0
16.0
21.0
21.0
17.0
12.0
24.0
31.0
1.0
7.0
25.0
3.0
2.0
2.0
19.0
2.80
102.
022
0.0
189.
060
0.0
294.
023
0.0
130.
025
5.0
362.
07.
574
.045
0.0
26.0
23.0
6.7
19.0
4.7
7.3
10.5
11.8
28.6
14.0
13.5
10.8
10.6
11.7
7.5
10.6
18.0
8.7
11.5
4.0
34.0
75.0
75.0
60.0
50.0
45.0
7.0
50.0
58.0
15.0
24.0
21.0
220.
065
0.0
870.
082
0.0
780.
080
0.0
66.0
530.
076
5.0
140.
040
0.0
5.3
6.5
8.7
11.6
13.7
15.6
17.8
9.4
10.6
13.2
9.3
16.7
4.0
50.0
15.0
35.0
43.0
52.0
132.
09.
023
.05.
05.
07.
036
.043
2.0
157.
025
0.0
491.
078
0.0
1980
.098
.023
2.0
55.0
37.0
94.0
9.0
8.6
10.5
7.1
11.4
15.0
15.0
10.9
10.1
11.0
7.4
13.4
1.0
5.0
16.0
18.0
22.0
66.0
27.0
6.0
38.0
27.0
9.0
13.0
2.0
2.0
9.0
44.0
145.
019
8.0
330.
096
1.0
469.
072
.039
5.0
294.
082
.019
5.0
22.0
20.0
9.0
8.8
9.1
11.0
15.0
14.6
17.4
12.0
10.4
10.9
9.1
15.0
11.0
10.0
4.0
16.0
036
.426
.714
4.0
152.
062
.30
13.6
171.
213
1.50
27.3
576
.80
6.6
7.2
108.
540
8.50
368.
514
77.4
2416
.810
52.2
164.
622
94.1
1706
.932
5.5
1090
.56
73.2
1.8
6.8
11.2
13.8
10.3
15.9
16.9
12.1
13.4
13.0
11.9
14.2
11.1
0.25
0.5
2.0
13.0
4.0
14.1
10.0
21.2
519
.03.
017
.015
.02.
05.
07.
01.
01.
01.
02.
08.
052
.020
.084
.690
.012
7.50
136.
010
.50
102.
090
.010
.025
.042
.06.
06.
04.
04.
04.
04.
05.
06.
09.
06.
07.
23.
56.
06.
05.
05.
06.
06.
06.
03.
031
.545
.025
.012
5.0
22.0
86.0
4.0
22.0
6.0
3.0
3.0
8.0
3.0
12.0
330.
145
0.0
300.
046
7.5
264.
012
90.0
32.0
220.
084
.042
.039
.012
6.0
30.0
4.0
10.5
10.0
12.0
3.7
12.0
15.0
8.0
10.0
14.0
14.0
13.0
15.8
10.0
9.6
3.5
34.6
399.
538
6.4
367.
874
7.0
672.
369
4.3
120.
672
0.2
992.
513
.022
6.9
386.
822
.028
.641
.525
.817
0.4
2949
.139
43.5
4584
.274
57.9
8882
.310
443.
413
71.7
8366
.912
600.
599
.024
46.4
5374
.120
0.3
271.
24.
37.
44.
97.
410
.212
.510
.013
.215
.011
.411
.612
.77.
610
.813
.99.
19.
512
.010
.013
.018
7.0
125.
016
0.0
178.
023
9.0
170.
010
.021
1.0
132.
060
.088
.011
1.0
2200
.025
20.0
2750
.046
23.0
3500
.033
80.0
30.0
3530
.023
58.0
5.0
8.8
8.5
11.8
20.2
17.2
26.0
14.6
19.9
3.0
16.7
17.9
94.0
96.0
138.
562
0.0
147.
082
.018
0.0
28.0
120.
011
8.0
545.
213
44.0
2146
.814
260.
027
19.5
1394
.029
16.0
294.
019
32.0
1947
.0

STATISTICAL INFORMATION ON NEPALESE AGRICULTURE 2072-73 (2015-16)
97
Dis
tric
ts
Mug
u
Hum
la
Jum
la
Kal
ikot
MW
. MO
UN
TA
IN
Ruk
um
Rol
pa
Pyut
han
Dol
pa
Kap
ilbas
tu
W. T
ER
AI
W. R
EG
ION
Asparagus
Tree tomato
Chilli Akabare
Chilli
Okra
Brinjal
Onion
Cucumber
Pumpkin
Squash
Bitter Gourd
Pointed Gourd
Sponge Gourd
Ridge Gourd
Snake Gourd
Bottle Gourd
Ash Gourd
Balsam Gourd
Kakari
5.8
14.0
15.5
23.0
18.5
17.0
16.2
10.5
16.1
16.5
120.
020
0.0
200.
070
0.0
120.
048
.012
.080
.035
.053
.052
.08.
060
.020
.02.
010
.042
2.0
400.
090
00.0
8500
.030
00.0
910.
021
0.0
1400
.050
0.0
315.
032
5.0
50.0
1400
.037
5.0
5.0
150.
03.
52.
045
.012
.125
.019
.017
.517
.514
.35.
96.
36.
323
.318
.82.
515
.012
.010
.022
7.0
483.
046
3.5
1480
.044
5.0
369.
012
.043
0.0
73.0
384.
052
.08.
031
0.0
20.0
2.0
10.0
60.0
88.0
1078
.239
44.0
1366
6.8
2551
0.0
1034
2.5
5804
.021
0.0
7696
.082
4.0
5777
.032
5.0
50.0
5705
.037
5.0
5.0
150.
05.
0#D
IV/0
!8.
84.
78.
229
.517
.223
.215
.717
.517
.911
.315
.06.
36.
318
.418
.82.
515
.021
.63.
544
.662
9.7
869.
483
1.3
2234
.011
19.6
1068
.313
6.9
1150
.273
.013
76.5
65.0
234.
969
6.8
42.0
30.6
10.0
101.
525
.825
8.4
4050
.578
87.5
1825
0.9
3299
5.9
1925
0.8
1630
8.4
1657
.716
062.
982
4.0
1837
7.5
424.
024
96.4
1107
9.1
575.
327
6.2
150.
04.
77.
45.
86.
49.
122
.014
.817
.215
.312
.114
.011
.313
.46.
510
.615
.913
.79.
015
.027
.00.
15.
010
.020
.030
.05.
00.
50.
10.
230
.00.
240
.060
.012
0.0
300.
050
.015
.00.
20.
31.
12.
08.
06.
06.
010
.010
.030
.02.
01.
566
.03.
024
.033
.023
.030
.02.
018
.05.
514
.015
.02.
033
0.0
12.0
156.
516
5.0
138.
015
0.0
10.0
108.
028
.056
.097
.56.
55.
04.
06.
55.
06.
05.
05.
06.
05.
14.
06.
53.
365
.019
.033
.012
.03.
02.
010
0.0
222.
027
0.6
126.
010
.06.
01.
511
.78.
210
.53.
33.
055
.03.
045
.03.
07.
027
5.0
12.0
202.
015
.042
.05.
04.
04.
55.
06.
017
.02.
09.
018
.020
.015
.03.
08.
03.
07.
015
.020
.018
.095
.017
0.0
240.
019
5.0
33.0
80.0
27.0
77.0
165.
01.
29.
010
.69.
412
.013
.011
.010
.09.
011
.011
.023
0.0
5.1
60.0
139.
078
.085
.012
.026
.09.
021
.030
.10.
22.
075
5.0
30.2
525.
586
7.6
639.
069
7.0
99.0
188.
070
.013
3.0
262.
70.
36.
53.
35.
98.
86.
28.
28.
28.
37.
27.
86.
38.
71.
53.
328
.025
.080
.017
0.0
52.0
45.0
3.0
425.
019
.023
.010
.034
8.0
305.
010
05.0
2096
.054
5.0
420.
030
.042
2.0
240.
028
0.0
125.
012
.412
.212
.612
.310
.59.
310
.01.
012
.612
.212
.55.
017
.015
.022
.080
.025
.010
.014
.010
.08.
010
.09.
01.
030
.010
9.0
82.0
234.
032
0.0
2652
.011
5.0
125.
0090
.040
.080
.058
.00
11.0
6.0
6.4
5.5
10.6
4.0
106.
111
.58.
99.
05.
08.
06.
411
.00.
20.
20.
115
.040
.030
.055
.030
.525
.514
.025
.017
.032
.011
.01.
52.
51.
20.
41.
167
.528
0.0
135.
041
2.5
427.
028
0.5
112.
015
0.0
85.0
128.
093
.59.
012
.56.
02.
011
.04.
57.
04.
57.
514
.011
.08.
06.
05.
04.
08.
56.
05.
0
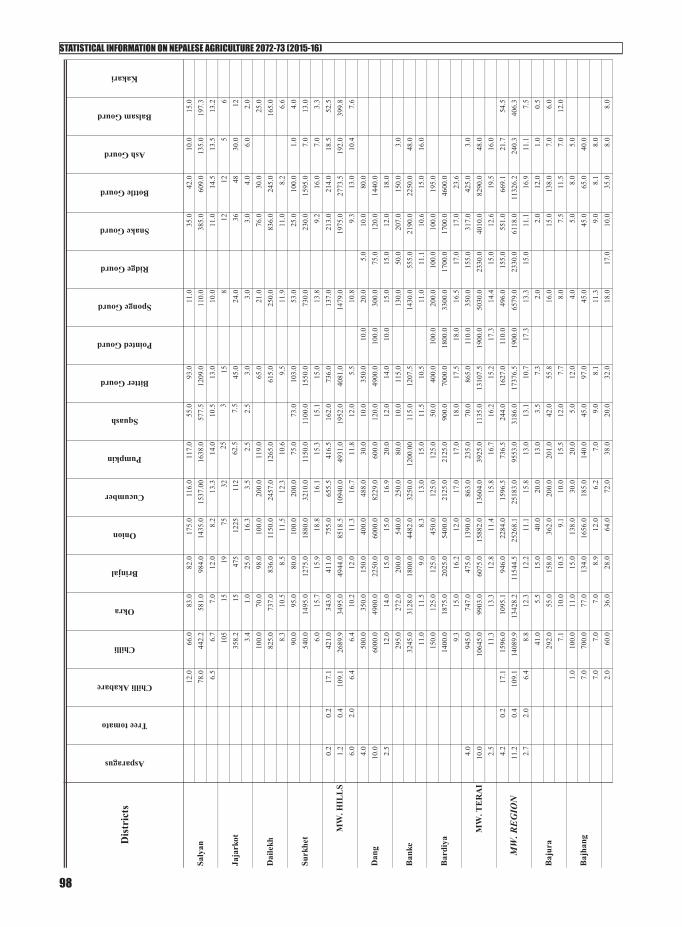
STATISTICAL INFORMATION ON NEPALESE AGRICULTURE 2072-73 (2015-16)
98
Dis
tric
ts
MW
. HIL
LS
Dan
g
Ban
ke
Bar
diya
MW
. TE
RA
I
MW
. RE
GIO
N
Baj
ura
Baj
hang
Surk
het
Saly
an
Jaja
rkot
Dai
lekh
Asparagus
Tree tomato
Chilli Akabare
Chilli
Okra
Brinjal
Onion
Cucumber
Pumpkin
Squash
Bitter Gourd
Pointed Gourd
Sponge Gourd
Ridge Gourd
Snake Gourd
Bottle Gourd
Ash Gourd
Balsam Gourd
Kakari
12.0
66.0
83.0
82.0
175.
011
6.0
117.
055
.093
.011
.035
.042
.010
.015
.078
.044
2.2
581.
098
4.0
1435
.015
37.0
016
38.0
577.
512
09.0
110.
038
5.0
609.
013
5.0
197.
36.
56.
77.
012
.08.
213
.314
.010
.513
.010
.011
.014
.513
.513
.210
515
1975
3225
315
812
125
635
8.2
1547
512
2511
262
.57.
545
.024
.036
4830
.012
3.4
1.0
25.0
16.3
3.5
2.5
2.5
3.0
3.0
3.0
4.0
6.0
2.0
100.
070
.098
.010
0.0
200.
011
9.0
65.0
21.0
76.0
30.0
25.0
825.
073
7.0
836.
011
50.0
2457
.012
65.0
615.
025
0.0
836.
024
5.0
165.
08.
310
.58.
511
.512
.310
.69.
511
.911
.08.
26.
690
.095
.080
.010
0.0
200.
075
.073
.010
3.0
53.0
25.0
100.
01.
04.
054
0.0
1495
.012
75.0
1880
.032
10.0
1150
.011
00.0
1550
.073
0.0
230.
015
95.0
7.0
13.0
6.0
15.7
15.9
18.8
16.1
15.3
15.1
15.0
13.8
9.2
16.0
7.0
3.3
0.2
0.2
17.1
421.
034
3.0
411.
075
5.0
655.
541
6.5
162.
073
6.0
137.
021
3.0
214.
018
.552
.51.
20.
410
9.1
2689
.934
95.0
4944
.085
18.5
1094
0.0
4931
.019
52.0
4081
.014
79.0
1975
.027
73.5
192.
039
9.8
6.0
2.0
6.4
6.4
10.2
12.0
11.3
16.7
11.8
12.0
5.5
10.8
9.3
13.0
10.4
7.6
4.0
500.
035
0.0
150.
040
0.0
488.
030
.010
.035
0.0
10.0
20.0
5.0
10.0
80.0
10.0
6000
.049
00.0
2250
.060
00.0
8229
.060
0.0
120.
049
00.0
100.
030
0.0
75.0
120.
014
40.0
2.5
12.0
14.0
15.0
15.0
16.9
20.0
12.0
14.0
10.0
15.0
15.0
12.0
18.0
295.
027
2.0
200.
054
0.0
250.
080
.010
.011
5.0
130.
050
.020
7.0
150.
03.
032
45.0
3128
.018
00.0
4482
.032
50.0
1200
.00
115.
012
07.5
1430
.055
5.0
2190
.022
50.0
48.0
11.0
11.5
9.0
8.3
13.0
15.0
11.5
10.5
11.0
11.1
10.6
15.0
16.0
150.
012
5.0
125.
045
0.0
125.
012
5.0
50.0
400.
010
0.0
200.
010
0.0
100.
019
5.0
1400
.018
75.0
2025
.054
00.0
2125
.021
25.0
900.
070
00.0
1800
.033
00.0
1700
.017
00.0
4600
.09.
315
.016
.212
.017
.017
.018
.017
.518
.016
.517
.017
.023
.64.
094
5.0
747.
047
5.0
1390
.086
3.0
235.
070
.086
5.0
110.
035
0.0
155.
031
7.0
425.
03.
010
.010
645.
099
03.0
6075
.015
882.
013
604.
039
25.0
1135
.013
107.
519
00.0
5030
.023
30.0
4010
.082
90.0
48.0
2.5
11.3
13.3
12.8
11.4
15.8
16.7
16.2
15.2
17.3
14.4
15.0
12.6
19.5
16.0
4.2
0.2
17.1
1596
.010
95.1
946.
022
84.0
1596
.573
6.5
244.
016
27.0
110.
049
6.0
155.
055
1.0
669.
121
.754
.511
.20.
410
9.1
1408
9.9
1342
8.2
1154
4.5
2526
8.1
2518
3.0
9553
.031
86.0
1737
6.5
1900
.065
79.0
2330
.061
18.0
1132
6.2
240.
340
6.3
2.7
2.0
6.4
8.8
12.3
12.2
11.1
15.8
13.0
13.1
10.7
17.3
13.3
15.0
11.1
16.9
11.1
7.5
41.0
5.5
15.0
40.0
20.0
13.0
3.5
7.3
2.0
2.0
12.0
1.0
0.5
292.
055
.015
8.0
362.
020
0.0
201.
042
.055
.816
.015
.013
8.0
7.0
6.0
7.1
10.0
10.5
9.1
10.0
15.5
12.0
7.7
8.0
7.5
11.5
7.0
12.0
1.0
100.
011
.015
.013
8.0
30.0
20.0
5.0
12.0
4.0
5.0
8.0
5.0
7.0
700.
077
.013
4.0
1656
.018
5.0
140.
045
.097
.045
.045
.065
.040
.07.
07.
07.
08.
912
.06.
27.
09.
08.
111
.39.
08.
18.
02.
060
.036
.028
.064
.072
.038
.020
.032
.018
.017
.010
.035
.08.
08.
0

STATISTICAL INFORMATION ON NEPALESE AGRICULTURE 2072-73 (2015-16)
99
Dis
tric
ts
FW
. RE
GIO
N
NE
PAL
Bai
tadi
Dad
eldh
ura FW
. HIL
LS
Kai
lali
Kan
chan
pur
FW. T
ER
AI
Dot
i
Dar
chul
a
FW. M
OU
NT
AIN
Ach
ham
Asparagus
Tree tomato
Chilli Akabare
Chilli
Okra
Brinjal
Onion
Cucumber
Pumpkin
Squash
Bitter Gourd
Pointed Gourd
Sponge Gourd
Ridge Gourd
Snake Gourd
Bottle Gourd
Ash Gourd
Balsam Gourd
Kakari
16.0
037
7.0
468.
039
3.0
928.
011
16.0
418.
036
0.0
395.
022
9.0
203.
011
0.0
455.
096
.010
7.0
8.0
6.3
13.0
14.0
14.5
15.5
11.0
18.0
12.3
12.7
11.9
11.0
13.0
12.0
13.4
3.0
201.
052
.558
.024
2.0
122.
071
.028
.551
.324
.017
.017
.055
.014
.08.
523
.013
69.0
600.
068
5.0
2946
.015
01.0
759.
044
7.0
547.
829
0.0
203.
017
0.0
658.
014
3.0
113.
07.
76.
811
.411
.812
.212
.310
.715
.710
.712
.111
.910
.012
.010
.213
.31.
536
.020
.013
.035
.028
.015
.06.
04.
503.
55.
04.
516
.03.
53.
03.
022
6.0
176.
084
.046
2.0
380.
020
5.0
57.0
22.0
019
.50
25.0
21.5
144.
521
.011
.02.
06.
38.
86.
513
.213
.613
.79.
54.
95.
65.
04.
89.
06.
03.
70.
50.
51.
020
1.0
46.0
40.0
305.
043
.020
.02.
030
.512
.05.
05.
04.
02.
02.
03.
02.
916
08.0
552.
060
0.0
6100
.051
6.0
200.
028
.030
5.0
120.
010
0.0
26.0
66.0
90.0
4.0
6.0
2.9
8.0
12.0
15.0
20.0
12.0
10.0
14.0
10.0
10.0
20.0
5.2
16.5
45.0
2.0
3.0
15.0
55.0
37.0
20.0
80.0
33.0
30.0
7.0
17.0
10.0
15.0
8.0
20.0
2.0
6.0
1.5
200.
070
0.0
720.
056
5.0
840.
064
0.0
540.
098
.011
4.0
100.
013
9.0
84.0
150.
020
.030
.00.
513
.312
.719
.528
.310
.519
.418
.014
.06.
710
.09.
310
.57.
510
.05.
011
.011
.434
.676
.016
.610
.013
.06.
05.
116
.140
.566
.620
7.6
874.
023
5.7
95.0
127.
430
.526
.514
6.7
3.7
5.8
6.0
11.5
14.2
9.5
9.8
5.1
5.2
9.1
0.5
3.5
17.5
303.
011
4.4
107.
642
0.0
180.
081
.625
.065
.031
.525
.022
.656
.17.
511
.04.
520
5.9
2574
.515
14.6
1456
.674
02.0
2410
.011
80.7
278.
056
8.4
270.
026
4.0
158.
050
7.2
131.
045
.01.
311
.88.
513
.213
.517
.613
.414
.511
.18.
78.
610
.67.
09.
017
.54.
110
4078
0.0
780.
010
4071
2.5
475.
026
.041
2.0
9.5
237.
547
.523
7.5
412.
019
.019
.04.
7515
600.
011
700.
011
700.
010
400.
099
75.0
6650
.036
4.0
6180
.014
2.5
3562
.571
2.5
3562
.561
80.0
285.
028
5.0
71.2
515
.015
.015
.010
.014
.014
.014
.015
.015
.015
.015
.015
.015
.015
.015
.015
.037
7.0
120.
080
.052
5.0
310.
018
5.0
12.0
142.
010
.010
0.0
132.
022
.025
2.0
8.0
225.
032
98.8
1200
.010
44.0
2887
.546
05.0
2590
.084
.022
72.0
85.0
1000
.015
84.0
330.
037
80.0
64.0
3375
.08.
810
.013
.15.
514
.914
.07.
016
.08.
510
.012
.015
.015
.08.
015
.014
17.0
900.
086
0.0
1565
.010
22.5
660.
038
.055
4.0
19.5
337.
517
9.5
259.
566
4.0
27.0
19.0
229.
818
898.
812
900.
012
744.
013
287.
514
580.
092
40.0
448.
084
52.0
227.
545
62.5
2296
.538
92.5
9960
.034
9.0
285.
034
46.3
13.3
14.3
14.8
8.5
14.3
14.0
11.8
15.3
11.7
13.5
12.8
15.0
15.0
12.9
15.0
15.0
0.5
3.5
20.5
1921
.010
66.9
1025
.622
27.0
1324
.581
2.6
91.5
670.
319
.539
3.0
221.
529
9.1
775.
148
.538
.522
9.8
4.5
228.
922
842.
215
014.
614
885.
623
635.
518
491.
011
179.
711
73.0
9568
.222
7.5
5122
.527
63.5
4220
.511
125.
262
3.0
443.
034
46.3
1.3
11.2
11.9
14.1
14.5
10.6
14.0
13.8
12.8
14.3
11.7
13.0
12.5
14.1
14.4
12.8
11.5
15.0
135.
011
3.7
988.
495
80.8
1078
1.4
8680
.420
070.
093
96.8
7203
.413
40.4
1008
2.2
1955
.570
73.1
1006
.513
25.7
8611
.585
3.7
265.
634
5.8
1526
.511
21.7
4757
.295
931.
212
2101
.612
8029
.523
8590
.715
9041
.810
3169
.618
256.
913
2350
.122
443.
510
1044
.712
008.
815
776.
812
9798
.111
604.
122
29.0
4685
.911
.39.
94.
810
.011
.314
.711
.916
.914
.313
.613
.111
.514
.311
.911
.915
.113
.68.
413
.6

STATISTICAL INFORMATION ON NEPALESE AGRICULTURE 2072-73 (2015-16)
100
Dis
tric
ts
Panc
htha
r
Ilam
Ter
hath
um
Dha
nkut
a
Bho
jpur
Kho
tang
E. M
OU
NT
AIN
Tap
leju
ng
Sank
huw
asab
ha
Solu
khum
bu
Kundru
Chayote
Watermelon
Other (Cucurbits)
Drumsticks
Lettuce
Fennel Leaf
Coriander Leaf
Spinach
Cress
Amaranthus
Fenugreek Leaf
Swisschard
Others (Leafy Veg.)
Colocasia
Yam
Elephant Foot Yam
Other (Tubers)
Other (Veg.)
19.0
60.0
1.0
3.0
3.0
2.0
2.0
1.0
5.0
4.0
5.0
4.0
5.0
237.
072
0.0
11.5
36.0
36.0
20.0
20.0
10.0
55.0
40.0
50.0
48.0
57.5
12.5
12.0
11.5
12.0
12.0
10.0
10.0
10.0
11.0
10.0
10.0
12.0
11.5
25.0
5.0
6.0
10.0
8.0
8.5
7.5
4.0
4.0
17.0
14.0
9.0
5.0
20.0
175.
025
.042
.070
.056
.085
.033
.828
.026
.010
2.0
280.
090
.030
.012
0.0
7.0
5.0
7.0
7.0
7.0
10.0
4.5
7.0
6.5
6.0
20.0
10.0
6.0
6.0
45.0
4.0
4.0
3.0
2.0
1.0
1.0
8.0
55.0
7.0
4.0
6.0
1125
.020
.024
.015
.010
.05.
07.
056
.063
2.0
91.0
32.0
42.0
25.0
#DIV
/0!
5.0
6.0
5.0
5.0
5.0
7.0
7.0
11.5
13.0
8.0
7.0
89.0
65.0
7.0
17.0
15.0
13.5
11.5
6.0
5.0
30.0
73.0
21.0
13.0
31.0
1537
.074
5.0
53.5
126.
011
6.0
120.
063
.843
.033
.021
3.0
952.
023
1.0
110.
021
9.5
17.3
11.5
7.6
7.4
7.7
8.9
5.5
7.2
6.6
7.1
13.0
11.0
8.5
7.1
70.0
17.0
18.0
13.0
1200
.011
0.0
252.
029
8.3
168.
08.
03.
05.
035
98.0
16.0
22.0
66.0
21.4
2.0
7.3
13.2
80.0
3.0
1.0
3.0
1.0
2.0
3.0
3.0
3.0
4.0
6.0
1280
.036
.012
.036
.013
.020
.030
.075
.090
.012
0.0
119.
016
.012
.012
.012
.013
.010
.010
.025
.030
.030
.019
.812
0.0
8.0
13.0
11.0
8.0
20.0
35.0
1290
.035
.018
5.0
95.0
90.0
150.
042
0.0
10.8
4.4
14.2
8.6
11.3
7.5
12.0
106.
02.
012
.07.
21.
63.
21.
02.
512
.57.
010
60.0
4.0
60.0
20.8
2.3
8.6
1.5
4.8
75.0
79.0
10.0
2.0
5.0
2.9
1.4
2.7
1.5
1.9
6.0
11.3
500.
020
0.0
5.0
5.0
50.0
175.
040
0.0
150.
020
.015
0.0
400.
050
.025
.010
0.0
1000
0.0
1000
.01.
51.
513
.070
0.0
200.
075
.010
.075
.016
00.0
900.
012
5.0
1000
.020
.05.
00.
30.
30.
34.
00.
50.
50.
50.
54.
018
.05.
010
.050
.03.
02.
02.
010
.05.
0

STATISTICAL INFORMATION ON NEPALESE AGRICULTURE 2072-73 (2015-16)
101
Dis
tric
ts
Sapt
ari
Sira
ha
E. T
ER
AI
E. R
EG
ION
Dol
akha
Sind
hupa
lcho
k
Ras
uwa
Suns
ari
Okh
aldh
unga
Uda
yapu
r
E. H
ILL
S
Jhap
a
Mor
ang
Kundru
Chayote
Watermelon
Other (Cucurbits)
Drumsticks
Lettuce
Fennel Leaf
Coriander Leaf
Spinach
Cress
Amaranthus
Fenugreek Leaf
Swisschard
Others (Leafy Veg.)
Colocasia
Yam
Elephant Foot Yam
Other (Tubers)
Other (Veg.)
3.0
2.0
2.0
100.
040
.01.
01.
01.
010
.08.
01.
012
.06.
05.
05.
01.
01.
03.
03.
02.
04.
02.
03.
06.
012
.020
.05.
03.
514
4.0
60.0
60.0
20.0
4.5
3.5
10.0
10.0
5.5
12.0
7.0
9.0
75.0
120.
030
0.0
60.0
3.5
12.0
10.0
12.0
4.0
4.5
3.5
3.3
3.3
2.8
3.0
3.5
3.0
12.5
10.0
15.0
12.0
1.0
1106
.06.
020
5.0
18.0
18.0
6.0
100.
020
4.0
417.
215
6.6
27.2
1.0
158.
543
9.5
110.
020
.064
.011
6.0
3.5
1857
2.0
60.0
1060
.056
.511
4.5
5.0
519.
087
9.0
286.
310
2.3
45.6
1.5
118.
820
15.0
1677
.330
0.0
665.
012
45.0
3.5
16.8
10.0
5.2
3.1
6.4
0.8
5.2
4.3
0.7
0.7
1.7
1.5
0.7
4.6
15.2
15.0
10.4
10.7
11.0
12.0
541.
077
.018
5.0
7574
.07.
015
.414
.05.
025
0.0
300.
010
.010
5.0
70.0
40.0
40.0
10.0
10.0
100.
020
.012
0.0
25.0
2500
.031
50.0
20.0
90.0
140.
050
.060
.015
.050
.020
00.0
500.
039
13.0
5.0
10.0
10.5
2.0
0.9
2.0
1.3
1.5
1.5
5.0
20.0
25.0
32.6
15.0
10.0
40.0
10.0
55.0
65.0
50.0
52.0
10.0
25.0
60.0
10.0
230.
050
.05.
022
5.0
150.
048
0.0
80.0
385.
052
0.0
450.
041
6.0
70.0
250.
072
0.0
100.
041
40.0
750.
040
.015
.015
.012
.08.
07.
08.
09.
08.
07.
010
.012
.010
.018
.015
.08.
02.
020
.025
.02.
020
0.0
150.
072
.070
.090
.010
.03.
01.
030
.055
.012
.020
0.0
75.0
3.0
1000
.022
50.0
864.
014
0.0
810.
050
.060
.015
.078
6.0
712.
56.
010
.03.
01.
55.
015
.012
.02.
09.
05.
020
.015
.026
.213
.042
.020
.010
.03.
05.
05.
04.
010
.05.
010
.05.
010
.020
.05.
020
.044
1.0
180.
071
.015
.055
.060
.040
.012
0.0
55.0
100.
060
.014
0.0
120.
070
.030
0.0
10.5
9.0
7.1
5.0
11.0
12.0
10.0
12.0
11.0
10.0
12.0
14.0
6.0
14.0
15.0
20.0
304.
038
0.0
45.0
13.0
2.0
365.
029
0.0
166.
018
3.0
115.
045
.090
.012
1.0
300.
011
0.0
686.
025
0.0
3103
.040
10.0
226.
035
.03.
015
30.0
2970
.014
04.0
813.
095
0.0
400.
010
75.0
2255
.055
46.0
1532
.511
827.
012
.510
.210
.65.
02.
71.
54.
210
.28.
54.
48.
38.
911
.918
.618
.513
.917
.21.
012
15.0
310.
065
0.0
63.0
31.0
15.0
482.
050
9.0
596.
735
1.1
148.
26.
023
3.5
602.
525
2.0
320.
018
7.0
833.
03.
520
359.
031
63.0
5815
.028
2.5
149.
561
.521
75.0
3965
.018
10.3
979.
110
38.6
34.5
731.
840
42.0
4163
.358
46.0
2307
.513
291.
53.
516
.810
.28.
94.
54.
84.
14.
57.
83.
02.
87.
05.
83.
16.
716
.518
.312
.316
.0
65.0
1.0
1.0
5.0
1.0
1.0
25.0
2.0
15.0
975.
012
.012
.052
.05.
015
.036
0.0
24.0
150.
015
.012
.012
.010
.45.
015
.014
.412
.010
.038
.031
.08.
023
.014
.020
4.0
18.0
301.
013
3.0
37.0
103.
068
.013
95.0
125.
07.
94.
34.
64.
54.
96.
86.
95.
06.
02.
02.
02.
02.
02.
054
.010
.015
.056
.018
.012
.014
.020
.020
.08.
047
8.0
75.0
68.0

STATISTICAL INFORMATION ON NEPALESE AGRICULTURE 2072-73 (2015-16)
102
Dis
tric
ts
Lal
itpur
Kat
hman
du
Nuw
akot
Dha
ding
Mak
awan
pur C. H
ILL
S
Dha
nush
a
Bha
ktap
ur
C. M
OU
NT
AIN
Ram
echh
ap
Sind
huli
Kav
re
Kundru
Chayote
Watermelon
Other (Cucurbits)
Drumsticks
Lettuce
Fennel Leaf
Coriander Leaf
Spinach
Cress
Amaranthus
Fenugreek Leaf
Swisschard
Others (Leafy Veg.)
Colocasia
Yam
Elephant Foot Yam
Other (Tubers)
Other (Veg.)
11.2
3.0
6.0
7.0
10.0
10.0
4.0
8.9
7.5
4.5
108.
06.
01.
03.
033
.010
.030
.017
.01.
028
3.0
30.0
30.0
1332
.018
.012
.024
.014
7.0
57.0
175.
081
.015
.022
33.0
224.
021
8.0
12.3
3.0
12.0
8.0
4.5
5.7
5.8
4.8
15.0
7.9
7.5
7.3
38.0
1.0
5.0
5.0
7.0
4.0
1.0
1.0
1.0
1.0
11.0
5.0
5.0
4.0
506.
03.
059
.067
.072
.046
.08.
012
.012
.011
.071
.041
.041
.044
.013
.33.
011
.813
.410
.311
.58.
012
.012
.011
.06.
58.
28.
211
.05.
010
.010
.015
.020
.040
.020
.040
.060
.012
0.0
8.0
2.0
4.0
4.0
6.0
36.0
10.0
15.0
10.0
70.0
35.0
30.0
3.0
25.0
18.0
45.0
25.0
4.0
12.0
828.
017
2.0
277.
515
0.0
1344
.054
9.5
453.
039
.038
7.5
273.
696
7.5
612.
574
.021
8.4
23.0
17.2
18.5
15.0
19.2
15.7
15.1
13.0
15.5
15.2
21.5
24.5
18.5
18.2
12.0
54.9
71.5
68.0
357.
478
.022
2.0
365.
194
1.0
880.
955
77.1
1092
.918
.56.
713
.213
.015
.614
.012
4.0
6.0
10.0
1.0
1.0
240
60.0
72.0
150.
010
.010
.020
.015
.012
.015
.010
.010
.025
.015
.02.
085
.02.
013
.035
.040
.010
.042
5.0
225.
025
.093
5.0
20.0
156.
077
0.0
837.
010
0.0
17.0
15.0
12.5
11.0
10.0
12.0
22.0
20.9
10.0
15.0
1.0
2.0
2.0
23.0
16.0
20.0
2.0
3.0
2.0
49.0
25.0
1.0
2.0
94.0
65.0
8.5
14.0
18.0
99.0
101.
012
4.0
14.0
22.0
17.5
884.
039
5.0
16.0
18.0
1363
.04.
38.
57.
09.
04.
36.
36.
27.
07.
38.
818
.015
.816
.09.
014
.515
.045
.080
.080
.012
0.0
34.0
142.
033
0.0
234.
045
5.5
455.
518
60.0
1020
.015
42.4
22.0
5.2
5.7
5.7
15.5
30.0
10.9
31.0
10.0
5.0
10.0
385.
076
0.0
165.
043
.017
0.0
5700
.024
.516
.58.
617
.014
.817
4.0
16.0
27.0
1.0
15.0
19.0
176.
915
0.5
217.
053
.042
.081
.050
8.4
296.
090
.01.
011
.072
5.0
3086
.033
8.5
411.
03.
027
7.5
252.
021
20.1
1818
.525
88.9
315.
057
7.5
467.
571
64.7
4919
.520
78.5
16.0
133.
010
060.
717
.721
.215
.23.
018
.513
.312
.012
.111
.95.
913
.85.
814
.116
.623
.116
.012
.113
.995
0.0
12.0
22.0
50.0
10.0
150.
08.
040
.035
.050
.016
815.
014
52.0
154.
024
7.5
50.0
1650
.024
.046
8.0
458.
580
0.0
17.7
121.
07.
05.
05.
011
.03.
011
.713
.116
.0
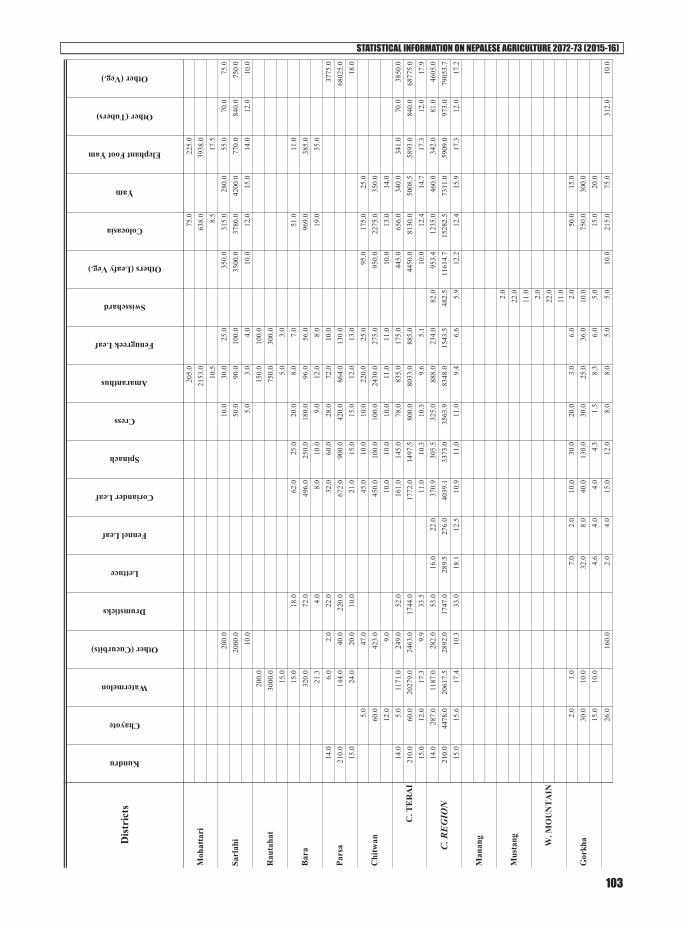
STATISTICAL INFORMATION ON NEPALESE AGRICULTURE 2072-73 (2015-16)
103
Dis
tric
ts
Chi
twan
C. T
ER
AI
C. R
EG
ION
Man
ang
Mus
tang W
. MO
UN
TA
IN
Gor
kha
Pars
a
Moh
atta
ri
Sarl
ahi
Rau
taha
t
Bar
a
Kundru
Chayote
Watermelon
Other (Cucurbits)
Drumsticks
Lettuce
Fennel Leaf
Coriander Leaf
Spinach
Cress
Amaranthus
Fenugreek Leaf
Swisschard
Others (Leafy Veg.)
Colocasia
Yam
Elephant Foot Yam
Other (Tubers)
Other (Veg.)
205.
075
.022
5.0
2153
.063
8.0
3938
.010
.58.
517
.520
0.0
10.0
30.0
25.0
350.
031
5.0
280.
055
.070
.075
.020
00.0
50.0
90.0
100.
035
00.0
3780
.042
00.0
770.
084
0.0
750.
010
.05.
03.
04.
010
.012
.015
.014
.012
.010
.020
0.0
150.
010
0.0
3000
.075
0.0
300.
015
.05.
03.
015
.018
.062
.025
.020
.08.
07.
051
.011
.032
0.0
72.0
496.
025
0.0
180.
096
.056
.096
9.0
385.
021
.34.
08.
010
.09.
012
.08.
019
.035
.014
.06.
02.
022
.032
.060
.028
.072
.010
.037
75.0
210.
014
4.0
40.0
220.
067
2.0
900.
042
0.0
864.
013
0.0
6802
5.0
15.0
24.0
20.0
10.0
21.0
15.0
15.0
12.0
13.0
18.0
5.0
47.0
45.0
10.0
10.0
220.
025
.095
.017
5.0
25.0
60.0
423.
045
0.0
100.
010
0.0
2430
.027
5.0
950.
022
75.0
350.
012
.09.
010
.010
.010
.011
.011
.010
.013
.014
.014
.05.
011
71.0
249.
052
.016
1.0
145.
078
.083
5.0
175.
044
5.0
656.
034
0.0
341.
070
.038
50.0
210.
060
.020
279.
024
63.0
1744
.017
72.0
1497
.580
0.0
8033
.088
5.0
4450
.081
30.0
5008
.558
93.0
840.
068
775.
015
.012
.017
.39.
933
.511
.010
.310
.39.
65.
110
.012
.414
.717
.312
.017
.914
.028
7.0
1187
.028
2.0
53.0
16.0
22.0
370.
930
5.5
325.
088
8.0
234.
082
.095
3.4
1235
.046
0.0
342.
081
.046
05.0
210.
044
78.0
2061
7.5
2892
.017
47.0
289.
527
6.0
4039
.133
73.0
3563
.983
48.0
1543
.548
2.5
1161
4.7
1528
2.5
7311
.059
09.0
973.
079
053.
715
.015
.617
.410
.333
.018
.112
.510
.911
.011
.09.
46.
65.
912
.212
.415
.917
.312
.017
.2
2.0
22.0
11.0 2.0
22.0
11.0
2.0
1.0
7.0
2.0
10.0
30.0
20.0
3.0
6.0
2.0
50.0
15.0
30.0
10.0
32.0
8.0
40.0
130.
030
.025
.036
.010
.075
0.0
300.
015
.010
.04.
64.
04.
04.
31.
58.
36.
05.
015
.020
.0
26.0
160.
02.
04.
015
.012
.08.
08.
05.
05.
010
.021
5.0
75.0
312.
010
.0

STATISTICAL INFORMATION ON NEPALESE AGRICULTURE 2072-73 (2015-16)
104
Dis
tric
ts
Palp
a
Mya
gdi
Bag
lung
Gul
mi
Arg
hakh
anch
i
W H
ILL
S
Naw
alpa
rasi
Rup
ande
hi
Syan
gja
Lam
jung
Tan
ahun
Kas
ki
Parb
at
Kundru
Chayote
Watermelon
Other (Cucurbits)
Drumsticks
Lettuce
Fennel Leaf
Coriander Leaf
Spinach
Cress
Amaranthus
Fenugreek Leaf
Swisschard
Others (Leafy Veg.)
Colocasia
Yam
Elephant Foot Yam
Other (Tubers)
Other (Veg.)
247.
012
40.0
18.6
56.3
97.2
44.0
88.0
35.0
37.5
80.0
2365
.086
2.5
2539
.479
.09.
57.
84.
73.
88.
15.
511
.07.
07.
58.
011
.011
.58.
17.
96.
02.
04.
03.
010
.05.
021
5.0
41.0
2.0
72.0
10.0
20.0
13.5
30.0
15.0
1827
.528
7.0
14.0
12.0
5.0
5.0
4.5
3.0
3.0
8.5
7.0
7.0
150.
010
.010
.035
.715
.325
.511
0.0
110.
011
0.0
1101
.637
2.2
160.
030
00.0
70.0
70.0
249.
912
2.4
178.
516
50.0
770.
077
0.0
1078
1.3
4705
.016
00.0
20.0
7.0
7.0
7.0
8.0
7.0
15.0
7.0
7.0
9.8
12.6
10.0
22.0
6.0
1.0
2.0
9.0
5.5
11.0
2.2
4.6
6.2
7.0
8.0
13.3
3.0
4.0
15.0
294.
056
.09.
626
.077
.041
.072
.022
.027
.044
.040
.016
2.0
203.
025
.038
2.0
154.
013
.49.
39.
613
.08.
67.
56.
510
.05.
97.
15.
720
.315
.38.
395
.510
.316
.032
5.0
12.0
9.0
304.
029
50.0
184.
079
.019
.09.
115
.38.
810
.015
.05.
030
.05.
011
5.0
158.
057
.037
5.0
70.0
11.5
10.5
11.4
12.5
14.0
3.0
3.0
4.0
5.0
2.0
1.0
3.0
31.0
30.0
27.0
30.0
44.0
45.0
22.0
11.0
30.0
279.
031
5.0
9.0
10.0
11.0
9.0
11.0
11.0
10.0
9.0
10.5
21.5
6.8
2.40
5.5
1.3
3.8
9.5
5.12
2.1
12.5
189.
2066
.613
.934
.15.
7219
.412
0.4
97.8
059
.723
1.3
8.8
9.8
5.8
6.2
4.4
5.1
12.7
19.1
28.0
18.5
17.0
0.5
0.5
0.5
1.0
9.0
8.0
0.5
1.0
153.
03.
003.
003.
06.
063
.072
.04.
04.
09.
06.
06.
06.
06.
07.
09.
08.
04.
06.
02.
02.
03.
02.
04.
051
.03.
02.
05.
010
8.0
4.0
4.0
6.0
4.0
12.0
739.
548
.028
.020
2.6
18.0
2.0
2.0
2.0
2.0
3.0
14.5
16.0
14.0
40.5
253.
51.
017
2.8
22.4
20.0
87.2
85.3
92.5
127.
213
5.9
126.
227
.817
20.1
562.
65.
032
5.6
203.
541
20.2
10.0
1362
.612
5.5
132.
659
1.2
609.
149
7.6
1811
.090
5.7
871.
518
1.4
1746
2.7
6890
.353
.032
01.7
2138
.316
.310
.07.
95.
66.
66.
87.
15.
414
.26.
76.
96.
510
.212
.210
.69.
810
.526
.074
.031
.05.
05.
010
.015
8.1
130.
926
4.0
50.0
50.0
150.
06.
11.
88.
510
.010
.015
.018
.022
.026
.546
.038
.012
.09.
529
.513
.09.
016
.023
5.8
356.
437
1.0
1058
.084
6.6
222.
019
8.5
427.
826
3.3
180.
032
0.0

STATISTICAL INFORMATION ON NEPALESE AGRICULTURE 2072-73 (2015-16)
105
Dis
tric
ts
Mug
u
Hum
la
Jum
la
Kal
ikot
MW
. MO
UN
TA
IN
Ruk
um
Rol
pa
Pyut
han
Dol
pa
Kap
ilbas
tu
W. T
ER
AI
W. R
EG
ION
Kundru
Chayote
Watermelon
Other (Cucurbits)
Drumsticks
Lettuce
Fennel Leaf
Coriander Leaf
Spinach
Cress
Amaranthus
Fenugreek Leaf
Swisschard
Others (Leafy Veg.)
Colocasia
Yam
Elephant Foot Yam
Other (Tubers)
Other (Veg.)
13.1
16.2
14.0
23.0
22.3
18.5
21.0
14.5
20.3
20.0
20.0
30.0
100.
012
.010
.015
.010
.03.
06.
090
.010
.010
.05.
012
.020
0.0
2200
.010
5.0
35.0
170.
018
.021
.048
.060
0.0
88.0
80.0
45.0
108.
06.
722
.08.
83.
511
.31.
87.
08.
06.
78.
88.
09.
09.
048
.012
2.0
12.0
62.5
135.
079
.015
.015
.511
9.5
28.0
14.0
36.0
5.0
12.0
435.
825
56.4
105.
056
4.1
1358
.911
28.6
243.
024
6.5
1027
.840
1.3
230.
055
0.0
45.0
108.
09.
121
.08.
89.
010
.114
.316
.216
.08.
614
.316
.415
.39.
09.
048
.025
3.5
123.
018
4.8
22.4
20.0
149.
722
0.3
171.
514
2.2
151.
412
8.2
147.
317
48.1
576.
641
.033
0.6
215.
543
5.8
4120
.225
66.4
1467
.612
5.5
132.
611
55.3
1968
.016
26.2
2054
.011
52.2
893.
512
09.1
1786
4.0
7120
.360
3.0
3246
.722
46.3
9.1
16.3
20.9
7.9
5.6
6.6
7.7
8.9
9.5
14.4
7.6
7.0
8.2
10.2
12.3
14.7
9.8
10.4
0.1
0.2
3.0
4.0
5.0
0.2
0.2
9.0
12.0
48.5
2.0
1.0
3.0
3.0
9.7
9.0
24.0
11.0
8.0
12.0
9.0
3.0
1.0
31.5
48.0
55.0
40.0
60.0
63.8
12.0
3.0
3.5
2.0
5.0
5.0
5.0
7.1
4.0
3.0
1.0
6.0
10.0
42.0
10.0
7.0
1.0
2.0
3.0
6.0
12.0
12.0
6.0
6.0
4.0
2.0
1.0
6.0
25.0
6.0
1.0
1.0
2.0
5.0
18.0
16.0
4.0
48.0
235.
048
.07.
07.
019
.060
.016
0.0
8.0
4.0
8.0
9.4
8.0
7.0
7.0
9.5
12.0
8.9
0.1
0.2
10.0
2.0
1.0
30.0
36.0
17.0
1.0
1.0
15.0
15.0
16.0
1.0
24.0
0.2
0.2
41.5
16.0
4.0
96.0
290.
097
.07.
07.
085
.087
.813
2.5
3.0
202.
02.
01.
04.
28.
04.
03.
28.
15.
77.
07.
05.
75.
98.
33.
08.
43.
01.
02.
06.
015
.07.
024
6.0
30.0
13.0
29.0
73.0
180.
078
.035
4.0
10.0
13.0
14.5
12.2
12.0
11.1
1.4
2.0
12.0
5.0
4.00
3.0
22.0
70.0
30.0
18.0
60.0
19.0
12.0
012
.013
0.9
721.
040
2.0
9.0
5.0
3.8
3.0
4.0
6.0
10.3
13.4
7.5
0.5
6.5
11.0
6.5
1.5
2.5
1.5
2.5
43.5
7.2
150.
00.
816
.25
46.7
519
.56
2.9
7.5
7.5
15.0
565.
582
.520
.01.
52.
54.
33.
01.
93.
05.
06.
013
.011
.5
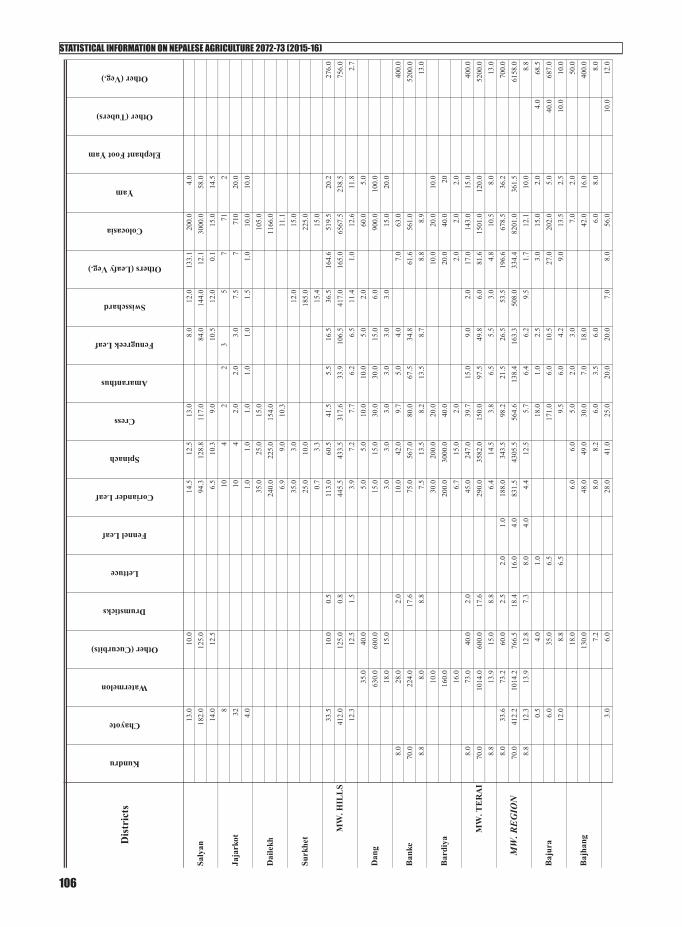
STATISTICAL INFORMATION ON NEPALESE AGRICULTURE 2072-73 (2015-16)
106
Dis
tric
ts
MW
. HIL
LS
Dan
g
Ban
ke
Bar
diya
MW
. TE
RA
I
MW
. RE
GIO
N
Baj
ura
Baj
hang
Surk
het
Saly
an
Jaja
rkot
Dai
lekh
Kundru
Chayote
Watermelon
Other (Cucurbits)
Drumsticks
Lettuce
Fennel Leaf
Coriander Leaf
Spinach
Cress
Amaranthus
Fenugreek Leaf
Swisschard
Others (Leafy Veg.)
Colocasia
Yam
Elephant Foot Yam
Other (Tubers)
Other (Veg.)
13.0
10.0
14.5
12.5
13.0
8.0
12.0
133.
120
0.0
4.0
182.
012
5.0
94.3
128.
811
7.0
84.0
144.
012
.130
00.0
58.0
14.0
12.5
6.5
10.3
9.0
10.5
12.0
0.1
15.0
14.5
810
42
23
57
712
3210
42.
02.
03.
07.
57
710
20.0
4.0
1.0
1.0
1.0
1.0
1.0
1.5
1.0
10.0
10.0
35.0
25.0
15.0
105.
024
0.0
225.
015
4.0
1166
.06.
99.
010
.311
.135
.03.
012
.015
.025
.010
.018
5.0
225.
00.
73.
315
.415
.033
.510
.00.
511
3.0
60.5
41.5
5.5
16.5
36.5
164.
651
9.5
20.2
276.
041
2.0
125.
00.
844
5.5
433.
531
7.6
33.9
106.
541
7.0
165.
065
67.5
238.
575
6.0
12.3
12.5
1.5
3.9
7.2
7.7
6.2
6.5
11.4
1.0
12.6
11.8
2.7
35.0
40.0
5.0
5.0
10.0
10.0
5.0
2.0
60.0
5.0
630.
060
0.0
15.0
15.0
30.0
30.0
15.0
6.0
900.
010
0.0
18.0
15.0
3.0
3.0
3.0
3.0
3.0
3.0
15.0
20.0
8.0
28.0
2.0
10.0
42.0
9.7
5.0
4.0
7.0
63.0
400.
070
.022
4.0
17.6
75.0
567.
080
.067
.534
.861
.656
1.0
5200
.08.
88.
08.
87.
513
.58.
213
.58.
78.
88.
913
.010
.030
.020
0.0
20.0
10.0
20.0
10.0
160.
020
0.0
3000
.040
.020
.040
.020
16.0
6.7
15.0
2.0
2.0
2.0
2.0
8.0
73.0
40.0
2.0
45.0
247.
039
.715
.09.
02.
017
.014
3.0
15.0
400.
070
.010
14.0
600.
017
.629
0.0
3582
.015
0.0
97.5
49.8
6.0
81.6
1501
.012
0.0
5200
.08.
813
.915
.08.
86.
414
.53.
86.
55.
53.
04.
810
.58.
013
.08.
033
.673
.260
.02.
52.
01.
018
8.0
343.
598
.221
.526
.553
.519
6.6
678.
536
.270
0.0
70.0
412.
210
14.2
766.
518
.416
.04.
083
1.5
4305
.556
4.6
138.
416
3.3
508.
033
4.4
8201
.036
1.5
6158
.08.
812
.313
.912
.87.
38.
04.
04.
412
.55.
76.
46.
29.
51.
712
.110
.08.
80.
54.
01.
018
.01.
02.
53.
015
.02.
04.
068
.56.
035
.06.
517
1.0
6.0
10.5
27.0
202.
05.
040
.068
7.0
12.0
8.8
6.5
9.5
6.0
4.2
9.0
13.5
2.5
10.0
10.0
18.0
6.0
6.0
5.0
2.0
3.0
7.0
2.0
50.0
130.
048
.049
.030
.07.
018
.042
.016
.040
0.0
7.2
8.0
8.2
6.0
3.5
6.0
6.0
8.0
8.0
3.0
6.0
28.0
41.0
25.0
20.0
20.0
7.0
8.0
56.0
10.0
12.0
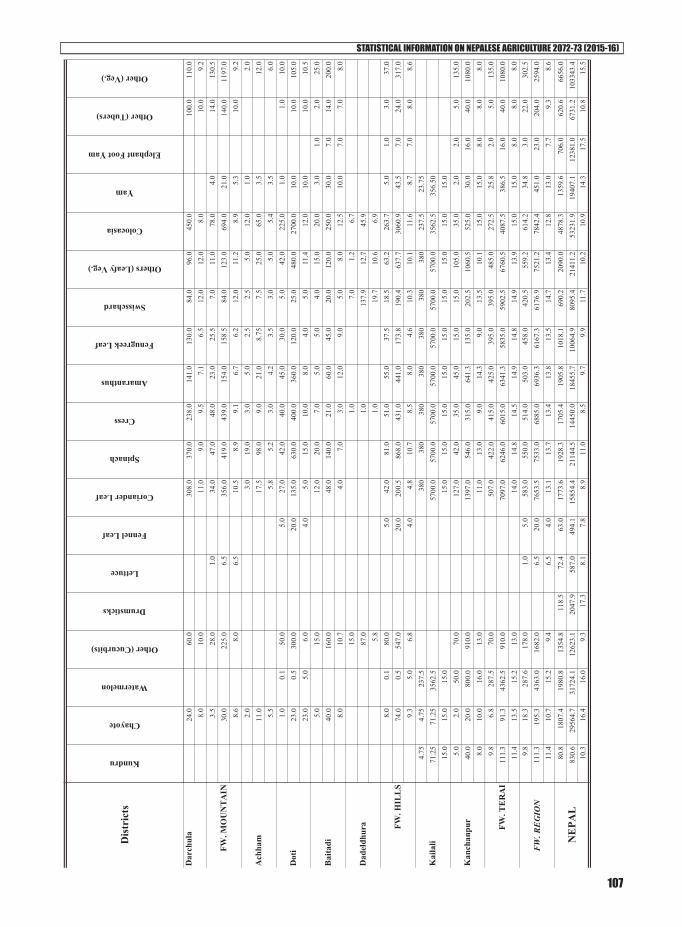
STATISTICAL INFORMATION ON NEPALESE AGRICULTURE 2072-73 (2015-16)
107
Dis
tric
ts
FW
. RE
GIO
N
NE
PAL
Bai
tadi
Dad
eldh
ura FW
. HIL
LS
Kai
lali
Kan
chan
pur
FW. T
ER
AI
Dot
i
Dar
chul
a
FW. M
OU
NT
AIN
Ach
ham
Kundru
Chayote
Watermelon
Other (Cucurbits)
Drumsticks
Lettuce
Fennel Leaf
Coriander Leaf
Spinach
Cress
Amaranthus
Fenugreek Leaf
Swisschard
Others (Leafy Veg.)
Colocasia
Yam
Elephant Foot Yam
Other (Tubers)
Other (Veg.)
24.0
60.0
308.
037
0.0
238.
014
1.0
130.
084
.096
.045
0.0
100.
011
0.0
8.0
10.0
11.0
9.0
9.5
7.1
6.5
12.0
12.0
8.0
10.0
9.2
3.5
28.0
1.0
34.0
47.0
48.0
23.0
25.5
7.0
11.0
78.0
4.0
14.0
130.
530
.022
5.0
6.5
356.
041
9.0
439.
015
4.0
158.
584
.012
3.0
694.
021
.014
0.0
1197
.08.
68.
06.
510
.58.
99.
16.
76.
212
.011
.28.
95.
310
.09.
22.
03.
019
.03.
05.
02.
52.
55.
012
.01.
02.
011
.017
.598
.09.
021
.08.
757.
525
.065
.03.
512
.05.
55.
85.
23.
04.
23.
53.
05.
05.
43.
56.
01.
00.
150
.05.
027
.042
.040
.045
.030
.05.
042
.022
5.0
1.0
1.0
10.0
23.0
0.5
300.
020
.013
5.0
630.
040
0.0
360.
012
0.0
25.0
480.
027
00.0
10.0
10.0
105.
023
.05.
06.
04.
05.
015
.010
.08.
04.
05.
011
.412
.010
.010
.010
.55.
015
.012
.020
.07.
05.
05.
04.
015
.020
.03.
01.
02.
025
.040
.016
0.0
48.0
140.
021
.060
.045
.020
.012
0.0
250.
030
.07.
014
.020
0.0
8.0
10.7
4.0
7.0
3.0
12.0
9.0
5.0
8.0
12.5
10.0
7.0
7.0
8.0
15.0
1.0
7.0
1.2
6.7
87.0
1.0
137.
912
.745
.95.
81.
019
.710
.66.
98.
00.
180
.05.
042
.081
.051
.055
.037
.518
.563
.226
3.7
5.0
1.0
3.0
37.0
74.0
0.5
547.
020
.020
0.5
868.
043
1.0
441.
017
3.8
190.
463
7.7
3060
.943
.57.
024
.031
7.0
9.3
5.0
6.8
4.0
4.8
10.7
8.5
8.0
4.6
10.3
10.1
11.6
8.7
7.0
8.0
8.6
4.75
4.75
237.
538
038
038
038
038
038
038
023
7.5
23.7
571
.25
71.2
535
62.5
5700
.057
00.0
5700
.057
00.0
5700
.057
00.0
5700
.035
62.5
356.
5015
.015
.015
.015
.015
.015
.015
.015
.015
.015
.015
.015
.05.
02.
050
.070
.012
7.0
42.0
35.0
45.0
15.0
15.0
105.
035
.02.
02.
05.
013
5.0
40.0
20.0
800.
091
0.0
1397
.054
6.0
315.
064
1.3
135.
020
2.5
1060
.552
5.0
30.0
16.0
40.0
1080
.08.
010
.016
.013
.011
.013
.09.
014
.39.
013
.510
.115
.015
.08.
08.
08.
09.
86.
828
7.5
70.0
507.
042
2.0
415.
042
5.0
395.
039
5.0
485.
027
2.5
25.8
2.0
5.0
135.
011
1.3
91.3
4362
.591
0.0
7097
.062
46.0
6015
.063
41.3
5835
.059
02.5
6760
.540
87.5
386.
516
.040
.010
80.0
11.4
13.5
15.2
13.0
14.0
14.8
14.5
14.9
14.8
14.9
13.9
15.0
15.0
8.0
8.0
8.0
9.8
18.3
287.
617
8.0
1.0
5.0
583.
055
0.0
514.
050
3.0
458.
042
0.5
559.
261
4.2
34.8
3.0
22.0
302.
511
1.3
195.
343
63.0
1682
.06.
520
.076
53.5
7533
.068
85.0
6936
.361
67.3
6176
.975
21.2
7842
.445
1.0
23.0
204.
025
94.0
11.4
10.7
15.2
9.4
6.5
4.0
13.1
13.7
13.4
13.8
13.5
14.7
13.4
12.8
13.0
7.7
9.3
8.6
80.8
1807
.419
80.8
1354
.811
8.5
72.4
63.0
1773
.619
28.3
1705
.419
05.8
1018
.169
0.2
2090
.048
78.3
1359
.670
6.0
620.
666
56.0
830.
629
564.
731
724.
112
623.
120
47.9
587.
049
4.1
1585
4.4
2114
4.5
1445
0.0
1845
5.7
1006
4.9
8095
.421
411.
253
231.
919
407.
112
381.
067
31.2
1033
43.4
10.3
16.4
16.0
9.3
17.3
8.1
7.8
8.9
11.0
8.5
9.7
9.9
11.7
10.2
10.9
14.3
17.5
10.8
15.5
STATISTICAL INFORMATION ON NEPALESE AGRICULTURE 2072-73 (2015-16)
108
STATISTICAL INFORMATION ON NEPALESE AGRICULTURE 2072-73 (2015-16)
109
7. SELECTED INVESTMENT

STATISTICAL INFORMATION ON NEPALESE AGRICULTURE 2072-73 (2015-16)
110

STATISTICAL INFORMATION ON NEPALESE AGRICULTURE 2072-73 (2015-16)
111
Loan and Advances Amount
1 Agricultural and Forest Related 23,246,1602 Fishery Related 802,7063 Mining Related 159,251
4 Agriculture, Forestry & Bevarage Production Related 4,771,616
5 Non-food Production Related 4,922,7816 Construction 4,558,6227 Electricity,Gas and Water 50,0878 Metal Products, Machinary & Electronic Equipment
& Assemblage 523,5789 Transport, Communication and Public Utilities 171,53710 Wholesaler & Retailer 17,316,79711 Finance, Insurance and Real Estate 149,90312 Hotel or Restaurant 3,290,42913 Other Services 4,561,75814 Consumption Loans 9,937,69215 Local Government 1,47616 Others 8,885,044
TOTAL 83,349,437
Loan and Advances Amount
1 Crop and Crop Services 545,4072 Tea/Coffee 99,2903 Tobacco 10,8954 Jute 50,7525 Livestock/Livestok Related 8,196,4526 Forestry 20,7807 Irrigation 24,4468 Other Agricultural and Agro Services 10,014,458
Total 18,962,479
* Source: Agricultural Development Bank, Nepal
S.No. Purpose
S.No. Purpose
Table 7.1: Investment by ADBL/N in different Sectors*
Table 7.2: Investment by ADBL/N in different Agricultural Sub-Sectors*

STATISTICAL INFORMATION ON NEPALESE AGRICULTURE 2072-73 (2015-16)
112
Number of Male Female Share capital Deposit Investment TotalFunctions Co-operative member member ('000 Rs.) ('000 Rs.) ('000 Rs.) ('000 Rs.)
Societies
Saving and Loan 13,769 1,611,956 1,761,984 53,605,814 214,226,044 189,269,138 189,543,405
Multipurpose 4,055 625,845 561,330 10,620,468 6,071,576 57,872,704 57,904,546
Agriculture 9,965 432,343 572,013 4,682,707 15,828,294 36,476,640 36,549,718
Milk 1,652 74,911 24,248 304,108 1,069,802 721,976 726,748
Consumer 1,461 39,904 22,799 276,180 494,439 689,617 690,286
Electricity 450 56,158 17,249 170,813 91,555 160,885 165,372
Fruits and Vegetables 189 10,515 10,666 53,423 158,558 142,516 142,651
Tea 106 4,818 2,156 92,689 29,229 49,822 51,474
Coffee 148 3,500 2,430 11,146 27,598 43,118 43,412
Herbs 191 6,006 4,396 37,608 41,227 101,174 101,443
Bee Keeping 107 2,055 1,946 6,660 7,241 12,753 12,785
Communication 136 10,015 3,322 273,755 84,431 100,298 106,203
Health 110 6,537 5,191 357,801 316,735 181,774 181,821
Sugarcane 48 1,684 685 6,156 17,273 24,685 24,685
Junar 44 982 577 1,147 5,801 5,900 5,900
Others 1,176 57,310 91,326 857,407 2,457,999 3,565,800 3,574,592
Total 33,599 2,944,539 3,082,318 71,357,882 240,927,802 289,418,800 289,825,041
Number of Male Female Share capital Deposit Investment Total
Co-operative member member ('000 Rs.) ('000 Rs.) ('000 Rs.) ('000 Rs.)
Societies
Eastern 6,155 545,987 624,320 6,420,188 24,107,467 39,753,287 39,795,630
Central 15,836 1,358,620 1,156,746 51,191,890 203,479,619 170,291,959 170,358,653
Western 4,510 516,377 646,180 8,111,075 47,955,163 53,321,470 53,466,577
Mid-Western 4,750 328,617 470,258 4,538,377 14,438,203 19,672,429 19,683,858
Far-Western 2,279 193,359 187,825 1,080,349 5,740,670 6,371,131 6,511,799
Total 33,530 2,942,960 3,085,329 71,341,879 295,721,122 289,410,276 289,816,517
*Source: Department of Co-operatives, Governmemnt of Nepal
Development Region
Table: 7.3: Co-operative Statistics: F.Y. 2072/73*
Table 7.4: Summary Statistics of Cooperatives by Development Regions : F.Y. 2072/73*

STATISTICAL INFORMATION ON NEPALESE AGRICULTURE 2072-73 (2015-16)
113
8. INPUTS
STATISTICAL INFORMATION ON NEPALESE AGRICULTURE 2072-73 (2015-16)
114

STATISTICAL INFORMATION ON NEPALESE AGRICULTURE 2072-73 (2015-16)
115
Fer
tiliz
erU
nit:
Mt.
Type
2001
/02
2002
/03
2003
/04
2004
/05
2005
/06
2006
/07
2007
/08
2008
/09
2009
/10
2010
/11
2011
/12
2012
/13
2013
/14
2014
/15
2015
/16
Ure
a17
,697
34,4
49
7,
428
10
,043
1,96
0
14,9
85
2,
500
5,93
5
5,
049
85
,191
97
,957
10
8,55
3
14
5,62
2
19
0,16
3
164,
952
D
AP
20,6
45
33
,331
11,3
77
19
,436
10,8
57
7,
437
1,
990
-2,
523
22
,001
43
,146
65
,722
81
,520
10
1,79
7
87,5
32
Com
plex
--
--
-2,
747
2,
156
1,19
8
2,
521
-
Pota
sh1,
016
2,
966
1,
688
2,
332
47
8
-
--
236
2,82
1
3,71
1
2,
688
5,04
6
6,
716
6,57
7
A
.Sul
phat
e-
--
--
--
--
-TS
P-
--
--
--
--
-O
ther
s-
--
--
--
--
-To
tal
AIC
L&
STC
L39
,358
-
20
,493
31
,811
13
,295
25
,169
6,
646
7,
133
10
,329
11
0,01
3
144,
813
17
6,96
3
232,
189
29
8,67
7
259,
061
Pr
ivat
e10
1,40
8
103,
636
11
8,26
5
90,8
95
78
,258
65,6
79
47
,107
5,67
7
N
AN
AN
AN
AN
AN
AN
A S
ecto
rs
Impr
oved
See
ds*
Uni
t: M
t.
Type
2001
/02
2002
/03
2003
/04
2004
/05
2005
/06
2006
/07
2007
/08
2008
/09
2009
/10
2010
/11
2011
/12
2012
/13
2013
/14
2014
/15
2015
/16
Padd
y10
4
35
3
50
4
54
6
64
4
66
1
89
7
931
95
9
1,
209
1,
200
770
2,
080
3,71
4
4,
051
Whe
at2,
601
1,
680
1,
666
1,
205
2,
859
2,
451
2,
883
2,99
0
3,
555
2,
981
2,
182
2,94
5
5,
112
5,81
9
5,
104
Mai
ze52
20
20
2
11
6
7
0
0
1
-
0
-
31
5
Veg
etab
le36
2
1
1
3
8
15
5
7
2
3
3
2
1
1
Lent
il27
17
13
12
22
26
5
6
6
13
9
27
6
5
6
Ju
te7
4
1
-
5
2
1
3
1
-
-
-
-
mus
tard
2
3
2
2
3
2
1
Se
sban
ia1
2
-
-
1
O
ther
s 1
0
2
8
4
1
2
-
-
0
0
0
Tota
l2,
827
2,
077
2,
205
1,
768
3,
551
3,
158
3,
809
3,93
6
4,
530
4,
211
3,
396
3,74
7
7,
203
9,54
0
9,
478
*Sou
rce:
Nat
iona
l See
d C
ompa
ny L
td.
Not
e: o
ther
s inc
lude
sesb
ania
als
o in
yea
r 201
1/12
TA
BL
E 8
.1: A
NN
UA
L S
AL
ES
OF
CH
EM
ICA
L F
ER
TIL
IZE
R A
ND
IMPR
OV
ED
SE
ED
S, 1
992/
93 -
2015
/201
6
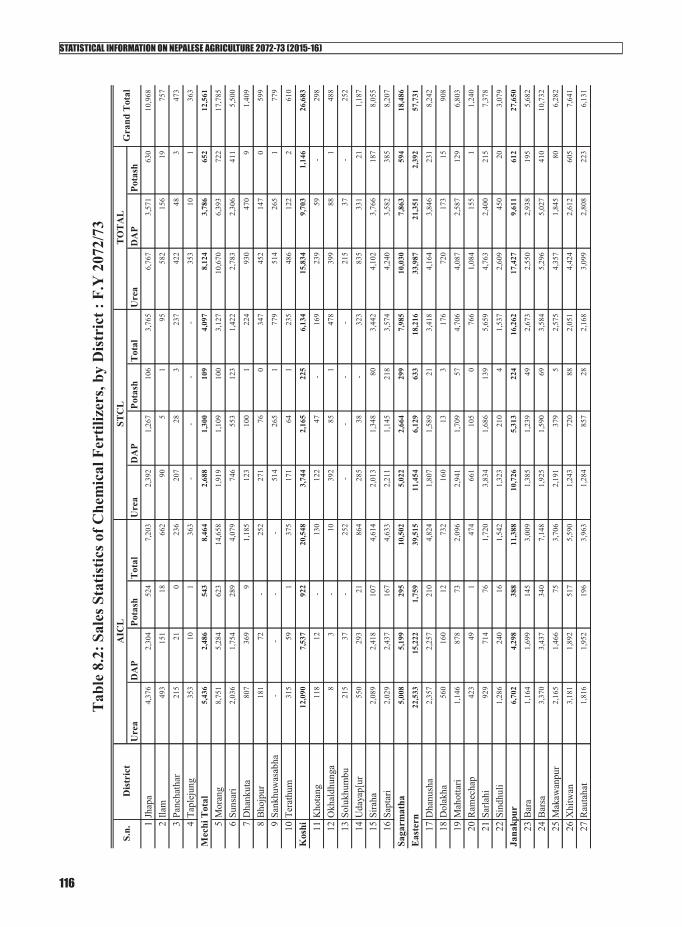
STATISTICAL INFORMATION ON NEPALESE AGRICULTURE 2072-73 (2015-16)
116
Ure
aD
AP
Pota
shT
otal
Ure
aD
AP
Pota
shT
otal
Ure
aD
AP
Pota
sh1
Jhap
a4,
376
2,
304
52
4
7,20
3
2,39
2
1,26
7
106
3,
765
6,
767
3,
571
63
0
10,9
68
2Ila
m49
3
15
1
18
662
90
5
1
95
58
2
15
6
19
757
3Pa
ncha
thar
215
21
0
236
207
28
3
237
422
48
3
473
4Ta
plej
ung
353
10
1
363
-
-
-
-
353
10
1
363
Mec
hi T
otal
5,43
6
2,48
6
543
8,
464
2,
688
1,
300
10
9
4,09
7
8,12
4
3,78
6
652
12
,561
5M
oran
g8,
751
5,
284
62
3
14,6
58
1,
919
1,
109
10
0
3,12
7
10,6
70
6,
393
72
2
17,7
85
6Su
nsar
i2,
036
1,
754
28
9
4,07
9
746
553
123
1,
422
2,
783
2,
306
41
1
5,50
0
7D
hank
uta
807
369
9
1,18
5
123
100
1
224
930
470
9
1,40
9
8Bh
ojpu
r18
1
72
-
25
2
27
1
76
0
34
7
45
2
14
7
0
59
9
9Sa
nkhu
was
abha
-
-
-
-
514
265
1
779
514
265
1
779
10Te
rath
um31
5
59
1
37
5
17
1
64
1
23
5
48
6
12
2
2
61
0
Kos
hi12
,090
7,53
7
922
20
,548
3,74
4
2,16
5
225
6,
134
15
,834
9,70
3
1,14
6
26
,683
11K
hota
ng11
8
12
-
13
0
12
2
47
-
16
9
23
9
59
-
29
8
12O
khal
dhun
ga8
3
-
10
39
2
85
1
47
8
39
9
88
1
48
8
13So
lukh
umbu
215
37
-
252
-
-
-
-
215
37
-
252
14U
daya
p[ur
550
293
21
86
4
28
5
38
-
32
3
83
5
33
1
21
1,18
7
15Si
raha
2,08
9
2,41
8
107
4,
614
2,
013
1,
348
80
3,44
2
4,10
2
3,76
6
187
8,
055
16Sa
ptar
i2,
029
2,
437
16
7
4,63
3
2,21
1
1,14
5
218
3,
574
4,
240
3,
582
38
5
8,20
7
Saga
rmat
ha5,
008
5,
199
29
5
10,5
02
5,
022
2,
664
29
9
7,98
5
10,0
30
7,
863
59
4
18,4
86
Eas
tern
22,5
33
15
,222
1,
759
39,5
15
11
,454
6,
129
63
3
18,2
16
33,9
87
21
,351
2,
392
57,7
31
17D
hanu
sha
2,35
7
2,25
7
210
4,
824
1,
807
1,
589
21
3,41
8
4,16
4
3,84
6
231
8,
242
18D
olak
ha56
0
16
0
12
732
160
13
3
176
720
173
15
90
8
19M
ahot
tari
1,14
6
878
73
2,
096
2,
941
1,
709
57
4,70
6
4,08
7
2,58
7
129
6,
803
20R
amec
hap
423
49
1
474
661
105
0
766
1,08
4
155
1
1,24
0
21Sa
rlahi
929
714
76
1,
720
3,
834
1,
686
13
9
5,65
9
4,76
3
2,40
0
215
7,
378
22Si
ndhu
li1,
286
24
0
16
1,54
2
1,32
3
210
4
1,53
7
2,60
9
450
20
3,
079
Jana
kpur
6,70
2
4,29
8
388
11
,388
10,7
26
5,31
3
224
16
,262
17
,427
9,61
1
612
27
,650
23Ba
ra1,
164
1,
699
14
5
3,00
9
1,38
5
1,23
9
49
2,
673
2,
550
2,
938
19
5
5,68
2
24Ba
rsa
3,37
0
3,43
7
340
7,
148
1,
925
1,
590
69
3,58
4
5,29
6
5,02
7
410
10
,732
25M
akaw
anpu
r2,
165
1,
466
75
3,70
6
2,19
1
379
5
2,57
5
4,35
7
1,84
5
80
6,
282
26X
hitw
an3,
181
1,
892
51
7
5,59
0
1,24
3
720
88
2,
051
4,
424
2,
612
60
5
7,64
1
27R
auta
hat
1,81
6
1,95
2
196
3,
963
1,
284
85
7
28
2,16
8
3,09
9
2,80
8
223
6,
131
Tab
le 8
.2: S
ales
Sta
tistic
s of C
hem
ical
Fer
tiliz
ers,
by D
istr
ict :
F.Y
207
2/73
S.n.
Dis
tric
tA
ICL
STC
LT
OT
AL
Gra
nd T
otal
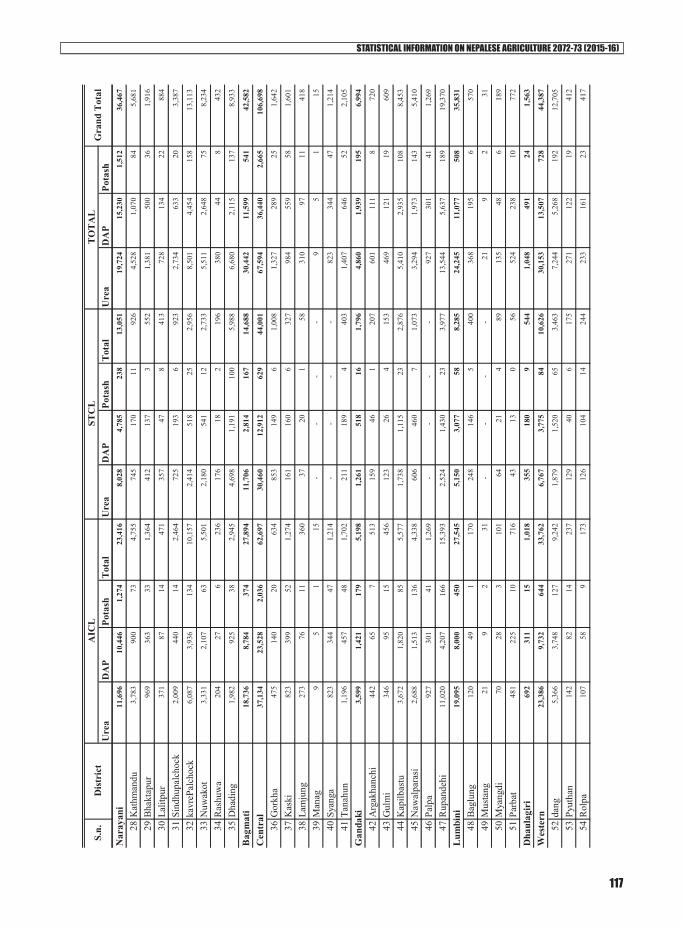
STATISTICAL INFORMATION ON NEPALESE AGRICULTURE 2072-73 (2015-16)
117
Ure
aD
AP
Pota
shT
otal
Ure
aD
AP
Pota
shT
otal
Ure
aD
AP
Pota
shS.
n.D
istr
ict
AIC
LST
CL
TO
TA
LG
rand
Tot
al
Nar
ayan
i11
,696
10,4
46
1,27
4
23
,416
8,02
8
4,78
5
238
13
,051
19
,724
15,2
30
1,51
2
36
,467
28K
athm
andu
3,78
3
900
73
4,
755
74
5
17
0
11
926
4,52
8
1,07
0
84
5,
681
29Bh
akta
pur
969
363
33
1,
364
41
2
13
7
3
55
2
1,
381
50
0
36
1,91
6
30La
litpu
r37
1
87
14
471
357
47
8
413
728
134
22
88
4
31Si
ndhu
palc
hock
2,00
9
440
14
2,
464
72
5
19
3
6
92
3
2,
734
63
3
20
3,38
7
32ka
vreP
alch
ock
6,08
7
3,93
6
134
10
,157
2,41
4
518
25
2,
956
8,
501
4,
454
15
8
13,1
13
33N
uwak
ot3,
331
2,
107
63
5,50
1
2,18
0
541
12
2,
733
5,
511
2,
648
75
8,23
4
34R
ashu
wa
204
27
6
236
176
18
2
196
380
44
8
432
35D
hadi
ng1,
982
92
5
38
2,94
5
4,69
8
1,19
1
100
5,
988
6,
680
2,
115
13
7
8,93
3
Bag
mat
i18
,736
8,78
4
374
27
,894
11,7
06
2,81
4
167
14
,688
30
,442
11,5
99
541
42
,582
Cen
tral
37,1
34
23
,528
2,
036
62,6
97
30
,460
12
,912
62
9
44,0
01
67,5
94
36
,440
2,
665
106,
698
36G
orkh
a47
5
14
0
20
634
853
149
6
1,00
8
1,32
7
289
25
1,
642
37K
aski
823
399
52
1,
274
16
1
16
0
6
32
7
98
4
55
9
58
1,60
1
38La
mju
ng27
3
76
11
360
37
20
1
58
310
97
11
41
8
39M
anag
9
5
1
15
-
-
-
-
9
5
1
15
40Sy
anga
823
344
47
1,
214
-
-
-
-
82
3
34
4
47
1,21
4
41Ta
nahu
n1,
196
45
7
48
1,70
2
211
189
4
403
1,40
7
646
52
2,
105
Gan
daki
3,59
9
1,42
1
179
5,
198
1,
261
51
8
16
1,79
6
4,86
0
1,93
9
195
6,
994
42A
rgak
hanc
hi44
2
65
7
51
3
15
9
46
1
20
7
60
1
11
1
8
72
0
43G
ulm
i34
6
95
15
456
123
26
4
153
469
121
19
60
9
44K
apilb
astu
3,67
2
1,82
0
85
5,
577
1,
738
1,
115
23
2,87
6
5,41
0
2,93
5
108
8,
453
45N
awal
para
si2,
688
1,
513
13
6
4,33
8
606
460
7
1,07
3
3,29
4
1,97
3
143
5,
410
46Pa
lpa
927
301
41
1,
269
-
-
-
-
92
7
30
1
41
1,26
9
47R
upan
dehi
11,0
20
4,
207
16
6
15,3
93
2,
524
1,
430
23
3,97
7
13,5
44
5,
637
18
9
19,3
70
Lum
bini
19,0
95
8,
000
45
0
27,5
45
5,
150
3,
077
58
8,28
5
24,2
45
11
,077
50
8
35,8
31
48Ba
glun
g12
0
49
1
17
0
24
8
14
6
5
40
0
36
8
19
5
6
57
0
49M
usta
ng21
9
2
31
-
-
-
-
21
9
2
31
50M
yang
di70
28
3
101
64
21
4
89
135
48
6
189
51Pa
rbat
481
225
10
71
6
43
13
0
56
52
4
23
8
10
772
Dha
ulag
iri
692
311
15
1,
018
35
5
18
0
9
54
4
1,
048
49
1
24
1,56
3
Wes
tern
23,3
86
9,
732
64
4
33,7
62
6,
767
3,
775
84
10,6
26
30,1
53
13
,507
72
8
44,3
87
52da
ng5,
366
3,
748
12
7
9,24
2
1,87
9
1,52
0
65
3,
463
7,
244
5,
268
19
2
12,7
05
53Py
utha
n14
2
82
14
237
129
40
6
175
271
122
19
41
2
54R
olpa
107
58
9
173
126
104
14
24
4
23
3
16
1
23
417
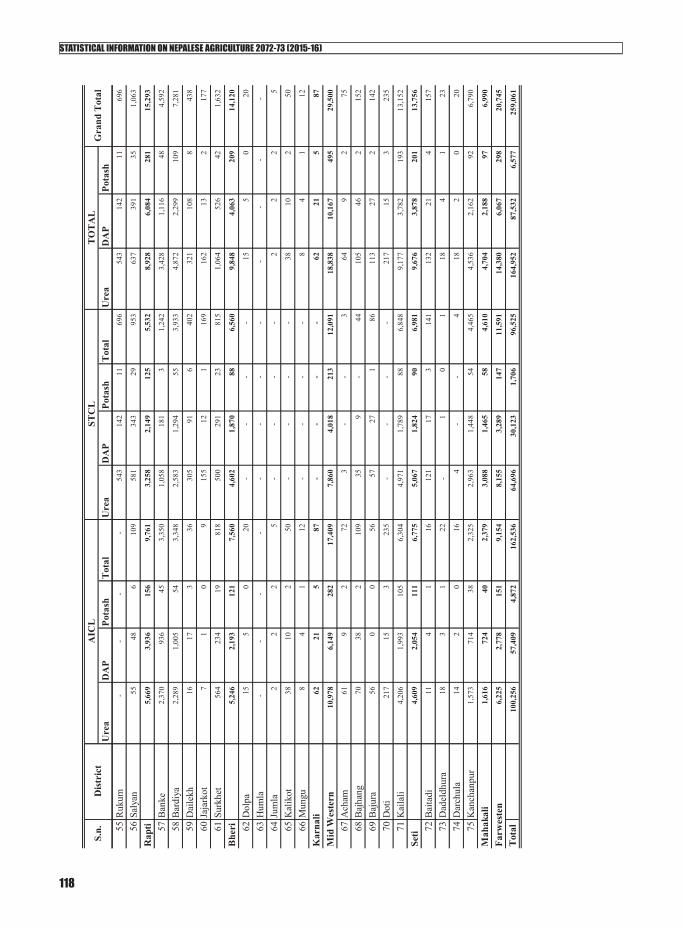
STATISTICAL INFORMATION ON NEPALESE AGRICULTURE 2072-73 (2015-16)
118
Ure
aD
AP
Pota
shT
otal
Ure
aD
AP
Pota
shT
otal
Ure
aD
AP
Pota
shS.
n.D
istr
ict
AIC
LST
CL
TO
TA
LG
rand
Tot
al
55R
ukum
-
-
-
-
543
142
11
69
6
54
3
14
2
11
696
56Sa
lyan
55
48
6
10
9
58
1
34
3
29
953
637
391
35
1,
063
Rap
ti5,
669
3,
936
15
6
9,76
1
3,25
8
2,14
9
125
5,
532
8,
928
6,
084
28
1
15,2
93
57Ba
nke
2,37
0
936
45
3,
350
1,
058
18
1
3
1,
242
3,
428
1,
116
48
4,59
2
58Ba
rdiy
a2,
289
1,
005
54
3,34
8
2,58
3
1,29
4
55
3,
933
4,
872
2,
299
10
9
7,28
1
59D
aile
kh16
17
3
36
30
5
91
6
40
2
32
1
10
8
8
43
8
60Ja
jark
ot7
1
0
9
155
12
1
169
162
13
2
177
61Su
rkhe
t56
4
23
4
19
818
500
291
23
81
5
1,
064
52
6
42
1,63
2
Bhe
ri5,
246
2,
193
12
1
7,56
0
4,60
2
1,87
0
88
6,
560
9,
848
4,
063
20
9
14,1
20
62D
olpa
15
5
0
20
-
-
-
-
15
5
0
20
63H
umla
-
-
-
-
-
-
-
-
-
-
-
-
64Ju
mla
2
2
2
5
-
-
-
-
2
2
2
5
65K
alik
ot38
10
2
50
-
-
-
-
38
10
2
50
66M
ungu
8
4
1
12
-
-
-
-
8
4
1
12
Kar
nali
62
21
5
87
-
-
-
-
62
21
5
87
Mid
Wes
tern
10,9
78
6,
149
28
2
17,4
09
7,
860
4,
018
21
3
12,0
91
18,8
38
10
,167
49
5
29,5
00
67A
cham
61
9
2
72
3
-
-
3
64
9
2
75
68Ba
jhan
g70
38
2
109
35
9
-
44
10
5
46
2
15
2
69Ba
jura
56
0
0
56
57
27
1
86
11
3
27
2
14
2
70D
oti
217
15
3
235
-
-
-
-
217
15
3
235
71K
aila
li4,
206
1,
993
10
5
6,30
4
4,97
1
1,78
9
88
6,
848
9,
177
3,
782
19
3
13,1
52
Seti
4,60
9
2,05
4
111
6,
775
5,
067
1,
824
90
6,98
1
9,67
6
3,87
8
201
13
,756
72Ba
itadi
11
4
1
16
12
1
17
3
14
1
13
2
21
4
15
7
73D
adel
dhur
a18
3
1
22
-
1
0
1
18
4
1
23
74D
arch
ula
14
2
0
16
4
-
-
4
18
2
0
20
75K
anch
anpu
r1,
573
71
4
38
2,32
5
2,96
3
1,44
8
54
4,
465
4,
536
2,
162
92
6,79
0
Mah
akal
i1,
616
72
4
40
2,37
9
3,08
8
1,46
5
58
4,
610
4,
704
2,
188
97
6,99
0
Farw
este
n6,
225
2,
778
15
1
9,15
4
8,15
5
3,28
9
147
11
,591
14
,380
6,06
7
298
20
,745
Tot
al10
0,25
6
57,4
09
4,87
2
16
2,53
6
64,6
96
30,1
23
1,70
6
96
,525
16
4,95
2
87,5
32
6,57
7
25
9,06
1

STATISTICAL INFORMATION ON NEPALESE AGRICULTURE 2072-73 (2015-16)
119
9. PRICE

STATISTICAL INFORMATION ON NEPALESE AGRICULTURE 2072-73 (2015-16)
120

STATISTICAL INFORMATION ON NEPALESE AGRICULTURE 2072-73 (2015-16)
121
Pri
ce in
Rs.
1R
ice
Coa
rse
Kg.
4847
4947
4545
4549
4747
4746
472
Ric
e M
ediu
m
Kg.
6362
6461
6060
6166
6463
6463
633
Ric
e Fi
neK
g.92
8991
8690
9189
9793
9390
9692
4Fl
atte
ned
Ric
e L
ocal
Kg.
7064
6963
6672
6671
7372
7171
695
Whe
at F
lour
K
g.49
4649
4745
4650
4950
5050
4948
6B
lack
Gra
m (B
roke
n)
Kg.
141
152
154
160
164
180
190
194
211
201
194
190
178
7Pi
geon
Pea
K
g.15
116
916
717
718
119
822
523
224
622
220
820
619
88
Moo
ng B
roke
n K
g.17
717
918
218
818
920
721
522
323
921
921
620
220
39
Len
til B
roke
n K
g.13
714
414
815
416
216
717
517
318
317
616
715
916
210
Soya
bean
K
g.89
8993
9495
9591
9897
9891
9494
11C
hick
pea
Big
K
g.10
810
411
011
211
612
513
013
613
713
212
811
912
112
Chi
ckpe
a Sm
all
Kg.
9698
104
9910
311
011
812
212
912
212
010
911
113
Pea
Big
K
g.96
9196
9490
9295
9792
9289
109
9414
Pea
Smal
l K
g.93
126
9897
101
9897
105
107
9710
093
101
15M
usta
rd O
il L
tr.
178
173
172
175
169
183
207
230
205
213
195
197
191
16So
yabe
an O
il L
tr.
152
144
140
143
141
151
176
192
182
170
157
152
158
17G
hee
Kg.
730
718
763
774
762
727
769
784
794
751
776
789
761
18V
eget
able
Ghe
e K
g.13
813
414
914
916
414
215
516
716
015
614
514
915
119
Chi
cken
K
g.36
434
536
236
333
533
132
435
135
534
934
233
834
720
Mut
ton
Kg.
573
572
584
603
711
747
616
608
618
620
625
624
625
21B
uff
Kg.
270
267
306
311
316
312
314
316
321
330
327
327
310
22Po
rk
Kg.
272
260
269
268
283
275
270
269
313
262
258
272
273
23Fi
sh F
resh
K
g.34
935
340
637
939
138
936
339
640
338
441
541
838
724
Hen
Egg
N
os.
1518
1414
2813
1414
1513
1313
1525
Milk
L
tr.
6565
6768
6565
6870
7266
6968
6726
Suga
r K
g.72
7474
7366
7377
7877
7374
7674
27R
ed P
otat
o K
g.33
3436
3642
4144
4543
3835
3539
28W
hite
Pot
ato
Kg.
3030
3333
3539
3839
3747
3050
3729
Tom
ato
Big
Kg.
5654
6368
6662
6566
6848
4249
5930
Tom
ato
Smal
l K
g.58
5162
6565
7072
7574
4947
5262
31C
abba
ge
Kg.
2726
3543
4649
4742
3729
2933
3732
Cau
liflo
wer
Hill
K
g.61
5767
7281
8364
5956
4348
4962
33C
aulif
low
er T
erai
K
g.59
5051
6979
7262
5439
4237
4155
34G
reen
Pea
s K
g.62
7768
6660
127
108
109
8770
8087
8335
Poin
ted
Gou
rd
Kg.
113
6668
6977
7668
6971
7797
9379
36C
apsi
cum
K
g.10
088
8794
101
105
111
106
9495
8786
9637
Okr
a K
g.68
5676
5960
6569
7899
7810
910
076
38M
ango
K
g.13
812
593
114
138
134
292
320
294
296
194
155
191
39O
rang
e K
g.10
910
494
104
114
109
9083
8492
9310
598
40A
pple
K
g.17
821
720
419
216
516
815
315
215
415
414
714
916
941
Ban
ana
Doz
en73
7780
8196
7871
7277
6873
7577
42D
ry O
nion
K
g.52
5055
6910
112
210
086
6450
4955
7143
Dry
Gar
lic
Kg.
146
144
134
143
149
173
179
190
219
247
223
190
178
44Fr
sh R
aw G
inge
r K
g.11
210
911
513
213
712
312
511
092
8282
9310
945
Dry
Chi
lli
Kg.
302
304
340
315
323
291
340
358
339
298
299
283
316
46G
reen
Chi
lli
Kg.
129
121
140
123
119
9613
212
711
410
210
610
411
8
Kar
tikM
angs
irPo
ush
Mag
hFa
lgun
Tab
le 9
: NA
TIO
NA
L R
ET
AIL
PR
ICE
OF
SEL
EC
TE
D C
OM
MO
DIT
IES
Fis
cal Y
ear
2072
/73
(201
5/16
)
S.N
o.C
omm
oditi
es (व
तु)U
nits
(ईकाई
)B
aish
akJe
stha
Asa
rSh
raw
anB
hadr
aC
haitr
aT
otal
A
vera
geA
soj

STATISTICAL INFORMATION ON NEPALESE AGRICULTURE 2072-73 (2015-16)
122
STATISTICAL INFORMATION ON NEPALESE AGRICULTURE 2072-73 (2015-16)
123
10. IRRIGATION

STATISTICAL INFORMATION ON NEPALESE AGRICULTURE 2072-73 (2015-16)
124

STATISTICAL INFORMATION ON NEPALESE AGRICULTURE 2072-73 (2015-16)
125
Particulars Area in ha
National Area 14,718,100
Cultivable Area 2,641,000
Irrigable Area 1,766,000
Farmer Managed Irrigation 198,140
Surface Irrigation 785,494
Underground Irrigation 408,543
Total Irrigated Area 1,392,177
Source: Ministry of Irrigation
Table 10: Current Irrigation Status upto Fiscal Year 2072/73
STATISTICAL INFORMATION ON NEPALESE AGRICULTURE 2072-73 (2015-16)
126

STATISTICAL INFORMATION ON NEPALESE AGRICULTURE 2072-73 (2015-16)
127
11. MISCELLANEOUS

STATISTICAL INFORMATION ON NEPALESE AGRICULTURE 2072-73 (2015-16)
128
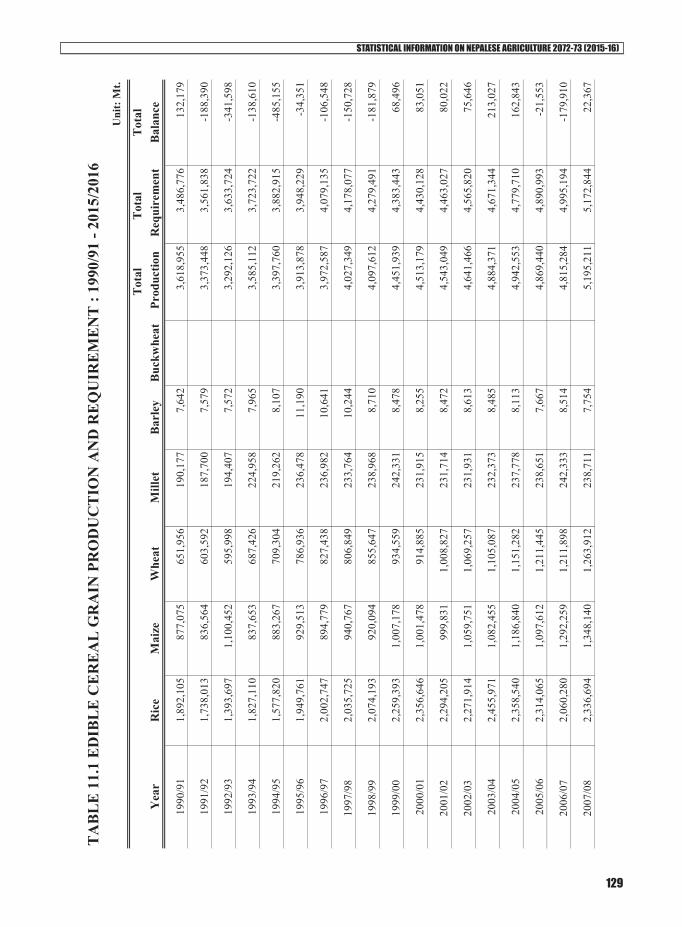
STATISTICAL INFORMATION ON NEPALESE AGRICULTURE 2072-73 (2015-16)
129
Tot
alT
otal
T
otal
Yea
rR
ice
Mai
zeW
heat
Mill
etB
arle
yB
uckw
heat
Pro
duct
ion
Req
uire
men
tB
alan
ce
1990
/91
1,89
2,10
587
7,07
565
1,95
619
0,17
77,
642
3,61
8,95
53,
486,
776
132,
179
1991
/92
1,73
8,01
383
6,56
460
3,59
218
7,70
07,
579
3,37
3,44
83,
561,
838
-188
,390
1992
/93
1,39
3,69
71,
100,
452
595,
998
194,
407
7,57
23,
292,
126
3,63
3,72
4-3
41,5
98
1993
/94
1,82
7,11
083
7,65
368
7,42
622
4,95
87,
965
3,58
5,11
23,
723,
722
-138
,610
1994
/95
1,57
7,82
088
3,26
770
9,30
421
9,26
28,
107
3,39
7,76
03,
882,
915
-485
,155
1995
/96
1,94
9,76
192
9,51
378
6,93
623
6,47
811
,190
3,91
3,87
83,
948,
229
-34,
351
1996
/97
2,00
2,74
789
4,77
982
7,43
823
6,98
210
,641
3,97
2,58
74,
079,
135
-106
,548
1997
/98
2,03
5,72
594
0,76
780
6,84
923
3,76
410
,244
4,02
7,34
94,
178,
077
-150
,728
1998
/99
2,07
4,19
392
0,09
485
5,64
723
8,96
88,
710
4,09
7,61
24,
279,
491
-181
,879
1999
/00
2,25
9,39
31,
007,
178
934,
559
242,
331
8,47
84,
451,
939
4,38
3,44
368
,496
2000
/01
2,35
6,64
61,
001,
478
914,
885
231,
915
8,25
54,
513,
179
4,43
0,12
883
,051
2001
/02
2,29
4,20
599
9,83
11,
008,
827
231,
714
8,47
24,
543,
049
4,46
3,02
780
,022
2002
/03
2,27
1,91
41,
059,
751
1,06
9,25
723
1,93
18,
613
4,64
1,46
64,
565,
820
75,6
46
2003
/04
2,45
5,97
11,
082,
455
1,10
5,08
723
2,37
38,
485
4,88
4,37
14,
671,
344
213,
027
2004
/05
2,35
8,54
01,
186,
840
1,15
1,28
223
7,77
88,
113
4,94
2,55
34,
779,
710
162,
843
2005
/06
2,31
4,06
51,
097,
612
1,21
1,44
523
8,65
17,
667
4,86
9,44
04,
890,
993
-21,
553
2006
/07
2,06
0,28
01,
292,
259
1,21
1,89
824
2,33
38,
514
4,81
5,28
44,
995,
194
-179
,910
2007
/08
2,33
6,69
41,
348,
140
1,26
3,91
223
8,71
17,
754
5,19
5,21
15,
172,
844
22,3
67
U
nit:
Mt.
TA
BL
E 1
1.1
ED
IBL
E C
ER
EA
L G
RA
IN P
RO
DU
CT
ION
AN
D R
EQ
UIR
EM
EN
T :
1990
/91
- 201
5/20
16
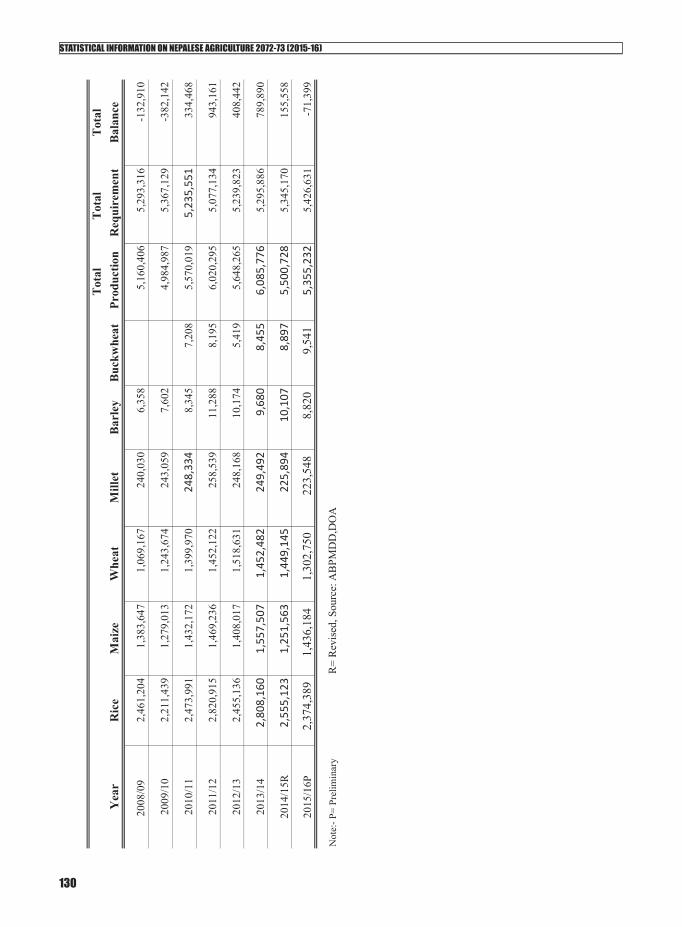
STATISTICAL INFORMATION ON NEPALESE AGRICULTURE 2072-73 (2015-16)
130
Tot
alT
otal
T
otal
Yea
rR
ice
Mai
zeW
heat
Mill
etB
arle
yB
uckw
heat
Pro
duct
ion
Req
uire
men
tB
alan
ce
2008
/09
2,46
1,20
41,
383,
647
1,06
9,16
724
0,03
06,
358
5,16
0,40
65,
293,
316
-132
,910
2009
/10
2,21
1,43
91,
279,
013
1,24
3,67
424
3,05
97,
602
4,98
4,98
75,
367,
129
-382
,142
2010
/11
2,47
3,99
11,
432,
172
1,39
9,97
024
8,33
48,
345
7,20
85,
570,
019
5,23
5,55
133
4,46
8
2011
/12
2,82
0,91
51,
469,
236
1,45
2,12
225
8,53
911
,288
8,19
56,
020,
295
5,07
7,13
494
3,16
1
2012
/13
2,45
5,13
61,
408,
017
1,51
8,63
124
8,16
810
,174
5,41
95,
648,
265
5,23
9,82
340
8,44
2
2013
/14
2,80
8,16
01,55
7,50
71,45
2,48
224
9,49
29,68
08,45
56,08
5,77
65,
295,
886
789,
890
2014
/15R
2,55
5,12
31,25
1,56
31,44
9,14
522
5,89
410
,107
8,89
75,50
0,72
85,
345,
170
155,
558
2015
/16P
2,37
4,38
9
1,
436,
184
1,30
2,75
0
22
3,54
8
8,82
0
9,54
1
5,35
5,23
25,
426,
631
-71,
399
Not
e:- P
= Pr
elim
inar
yR
= R
evis
ed, S
ourc
e: A
BPM
DD
,DO
A

STATISTICAL INFORMATION ON NEPALESE AGRICULTURE 2072-73 (2015-16)
131
1.Taplejung 124,004 4,432 20,587 3,390 136 2,256 105 30,906 23,685 7,221
2.Sankhuwashava 158,504 15,148 12,898 5,989 13 893 4 34,946 30,274 4,672
3.Solukhumbhu 104,990 1,701 21,199 1,972 122 2,554 49 27,598 20,053 7,545
E.Mountain 387,497 21,281 54,684 11,352 271 5,703 158 93,450 74,012 19,438
4.Panchthar 186,894 11,574 28,586 7,447 - 5,149 114 52,870 37,566 15,304
5.Illam 294,052 17,393 90,897 1,726 20 11,762 14 121,812 59,104 62,708
6.Terhathum 96,237 9,450 19,517 2,663 29 2,552 18 34,229 19,344 14,885
7.Dhankuta 161,867 12,137 13,336 6,805 3 2,476 1 34,757 32,535 2,222
8.Bhojpur 172,954 18,772 63,320 4,688 29 658 5 87,471 34,764 52,707
9.Khotang 194,784 9,732 55,885 17,045 532 10,717 117 94,029 39,152 54,877
10.Okhaldhunga 143,826 4,859 20,730 6,753 90 3,107 19 35,558 28,909 6,649
11.Udayapur 333,645 22,596 24,387 2,878 14 9,985 11 59,872 67,063 -7,191
E.Hills 1,584,259 106,514 316,658 50,005 717 46,405 299 520,598 318,437 202,161
12.Jhapa 882,978 176,833 61,175 1,760 1,226 24,549 2 265,544 159,819 105,725
13.Morang 1,032,782 154,625 18,589 1,328 57 28,078 - 202,679 186,934 15,745
14.Sunsari 843,362 86,885 5,037 585 327 36,942 12 129,789 152,648 -22,859
15.Saptari 676,782 45,791 - 214 - 25,681 - 71,685 122,497 -50,812
16.Siraha 672,354 47,303 - 524 - 16,990 - 64,816 121,696 -56,880
E.Terai 4,108,257 511,437 84,802 4,411 1,610 132,239 14 734,513 743,594 -9,081
E.Region 6,080,014 639,232 456,144 65,767 2,598 184,348 471 1,348,561 1,136,043 212,518
17.Dolakha 178,259 3,083 6,845 2,439 336 4,780 27 17,511 34,047 -16,536
18.Sindhupalchok 279,153 9,570 28,470 11,687 - 4,639 32 54,399 53,318 1,081
19.Rasuwa 42,591 1,200 2,080 516 - 943 56 4,794 8,135 -3,341
C.Mountain 500,003 13,853 37,396 14,643 336 10,362 115 76,704 95,500 -18,796
20.Ramechhap 197,939 11,846 36,329 3,367 16 6,288 14 57,859 39,786 18,073
21.Sindhuli 304,755 19,697 43,943 7,923 216 11,079 18 82,875 61,256 21,619
22.Kavre 380,032 18,683 40,808 2,676 546 16,568 146 79,427 76,386 3,041
23.Bhaktpur 354,131 13,551 4,957 104 - 8,345 10 26,966 71,180 -44,214
24.Lalitpur 551,009 11,722 20,699 380 43 6,129 6 38,978 110,753 -71,775
25.Kathmandu 2,215,147 22,294 25,975 568 4 9,888 1 58,730 445,245 -386,515
26.Nuwakot 272,113 34,616 47,144 3,442 201 10,542 26 95,972 54,695 41,277
27.Dhading 334,725 22,826 25,600 4,060 - 7,951 55 60,492 67,280 -6,788
28. Makwanpur 435,237 19,545 53,155 2,192 168 9,696 49 84,806 87,483 -2,677
C.Hills 5,045,088 174,779 298,610 24,711 1,195 86,485 323 586,104 1,014,064 -427,960
TABLE 11.2: DISTRICT WISE FOOD AVAILBILITY AND REQUIREMEN : 2015/16(Preliminary Estimation*) Unit:MT
Districts Population Rice Maize Millet Buckwheat
Wheat Barley Edible Food
Requirement (mt)
Balance(+,-)

STATISTICAL INFORMATION ON NEPALESE AGRICULTURE 2072-73 (2015-16)
132
29.Dhanusha 800,249 67,829 - 246 - 84,726 0 152,801 144,845 7,956
30.Mahottari 668,390 46,730 15,235 - - 51,816 3 113,783 120,979 -7,196
31.Sarlahi 846,863 65,521 20,673 793 - 49,396 19 136,401 153,282 -16,881
32.Rautahat 770,800 56,592 - 52 - 34,567 1 91,212 139,515 -48,303
33.Bara 762,700 80,127 17,509 85 - 72,031 26 169,777 138,049 31,728
34.Parsa 660,914 85,265 2,124 74 - 60,689 12 148,164 119,625 28,539
35.Chitwan 642,907 52,037 - 1,312 - (25,265) 10 28,093 116,366 -88,273
C.Terai 5,152,822 454,101 55,541 2,560 - 327,959 72 840,232 932,661 -92,429
C.Region 10,697,913 642,733 391,547 41,913 1,530 424,806 510 1,503,039 2,042,225 -539,186
36.Manang 5,399 - 140 - 376 375 53 944 1,031 -87
37.Mustang 12,745 - 375 - 822 733 132 2,062 2,434 -372
W.High Mountain 18,143 - 515 - 1,198 1,108 185 3,006 3,465 -459
38.Gorkha 262,918 10,497 29,545 7,981 327 4,994 19 53,361 52,847 514
39.Lamjung 163,174 19,674 15,636 6,644 13 839 6 42,813 32,798 10,015
40.Tanahu 327,354 23,247 48,181 5,160 153 2,580 1 79,323 65,798 13,525
41.Kaski 559,575 39,126 20,578 13,305 13 8,910 31 81,963 112,475 -30,512
42.Parbat 141,265 10,980 18,806 6,545 30 4,396 19 40,776 28,394 12,382
43.Syangja 276,010 31,684 59,510 14,111 140 6,868 2 112,314 55,478 56,836
44.Palpa 257,549 16,078 30,309 1,925 503 8,885 8 57,709 51,767 5,942
45.Myagdi 113,244 6,389 21,656 2,907 123 4,721 103 35,899 22,762 13,137
46.Baglung 268,479 9,421 48,537 18,213 100 11,942 315 88,528 53,964 34,564
47.Gulmi 272,288 13,576 38,305 2,470 223 12,189 176 66,939 54,730 12,209
48.Arghakhanchi 192,464 12,310 36,628 2,524 229 8,913 110 60,713 38,685 22,028
W.Hills 2,834,322 192,984 367,690 81,785 1,853 75,236 790 720,338 569,698 150,640
49.Bnawalparasi 688,100 88,475 - 423 84 23,152 3 112,136 124,546 -12,410
50.Rupandehi 981,071 154,892 - 45 - 59,906 56 214,900 177,574 37,326
51.Kapilbastu 622,988 71,266 - - - 67,904 92 139,263 112,761 26,502
W.Terai 2,292,159 314,633 - 468 84 150,963 151 466,299 414,881 51,418
W. Region 5,144,624 507,617 368,205 82,252 3,136 227,307 1,126 1,189,643 988,044 201,599
52.Dolpa 40,906 231 - 319 782 2,274 67 3,674 7,813 -4,139
53.Mugu 62,024 1,065 - 3,417 409 2,385 445 7,721 11,847 -4,126
54.Humla 56,914 206 - 688 561 (139) 213 1,528 10,871 -9,343
55.Jumla 120,196 2,887 3,233 3,486 80 3,587 1,795 15,068 22,957 -7,889
56.Kalikot 155,960 2,307 2,332 1,281 115 4,489 547 11,070 29,788 -18,718
MW.Mountain 436,000 6,695 5,565 9,191 1,947 12,596 3,067 39,061 83,276 -44,215
57.Rukum 219,370 5,761 24,978 1,323 - 21,107 287 53,456 44,093 9,363
58.Rolpa 232,154 6,534 19,499 1,064 94 16,779 174 44,143 46,663 -2,520
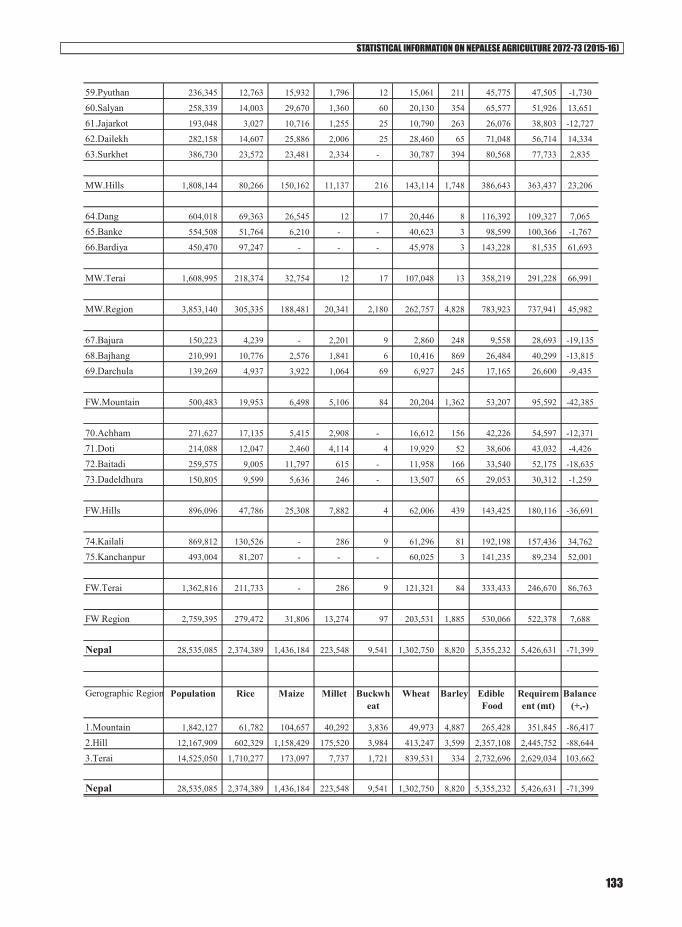
STATISTICAL INFORMATION ON NEPALESE AGRICULTURE 2072-73 (2015-16)
133
59.Pyuthan 236,345 12,763 15,932 1,796 12 15,061 211 45,775 47,505 -1,730
60.Salyan 258,339 14,003 29,670 1,360 60 20,130 354 65,577 51,926 13,651
61.Jajarkot 193,048 3,027 10,716 1,255 25 10,790 263 26,076 38,803 -12,727
62.Dailekh 282,158 14,607 25,886 2,006 25 28,460 65 71,048 56,714 14,334
63.Surkhet 386,730 23,572 23,481 2,334 - 30,787 394 80,568 77,733 2,835
MW.Hills 1,808,144 80,266 150,162 11,137 216 143,114 1,748 386,643 363,437 23,206
64.Dang 604,018 69,363 26,545 12 17 20,446 8 116,392 109,327 7,065
65.Banke 554,508 51,764 6,210 - - 40,623 3 98,599 100,366 -1,767
66.Bardiya 450,470 97,247 - - - 45,978 3 143,228 81,535 61,693
MW.Terai 1,608,995 218,374 32,754 12 17 107,048 13 358,219 291,228 66,991
MW.Region 3,853,140 305,335 188,481 20,341 2,180 262,757 4,828 783,923 737,941 45,982
67.Bajura 150,223 4,239 - 2,201 9 2,860 248 9,558 28,693 -19,135
68.Bajhang 210,991 10,776 2,576 1,841 6 10,416 869 26,484 40,299 -13,815
69.Darchula 139,269 4,937 3,922 1,064 69 6,927 245 17,165 26,600 -9,435
FW.Mountain 500,483 19,953 6,498 5,106 84 20,204 1,362 53,207 95,592 -42,385
70.Achham 271,627 17,135 5,415 2,908 - 16,612 156 42,226 54,597 -12,371
71.Doti 214,088 12,047 2,460 4,114 4 19,929 52 38,606 43,032 -4,426
72.Baitadi 259,575 9,005 11,797 615 - 11,958 166 33,540 52,175 -18,635
73.Dadeldhura 150,805 9,599 5,636 246 - 13,507 65 29,053 30,312 -1,259
FW.Hills 896,096 47,786 25,308 7,882 4 62,006 439 143,425 180,116 -36,691
74.Kailali 869,812 130,526 - 286 9 61,296 81 192,198 157,436 34,762
75.Kanchanpur 493,004 81,207 - - - 60,025 3 141,235 89,234 52,001
FW.Terai 1,362,816 211,733 - 286 9 121,321 84 333,433 246,670 86,763
FW Region 2,759,395 279,472 31,806 13,274 97 203,531 1,885 530,066 522,378 7,688
Nepal 28,535,085 2,374,389 1,436,184 223,548 9,541 1,302,750 8,820 5,355,232 5,426,631 -71,399
1.Mountain 1,842,127 61,782 104,657 40,292 3,836 49,973 4,887 265,428 351,845 -86,417
2.Hill 12,167,909 602,329 1,158,429 175,520 3,984 413,247 3,599 2,357,108 2,445,752 -88,644
3.Terai 14,525,050 1,710,277 173,097 7,737 1,721 839,531 334 2,732,696 2,629,034 103,662
Nepal 28,535,085 2,374,389 1,436,184 223,548 9,541 1,302,750 8,820 5,355,232 5,426,631 -71,399
Requirement (mt)
Balance(+,-)
Buckwheat
Wheat Barley Edible Food
Gerographic Region Population Rice Maize Millet

STATISTICAL INFORMATION ON NEPALESE AGRICULTURE 2072-73 (2015-16)
134
Farm
gate
Mar
ket
Farm
gate
Mar
ket
Kg/
Ha
Rs/
Ha
Rs/
Ha
Rs/
Ha
Rs/
Ha
Rs/
Qt
Rs/
Ha
Rs/
Ha
Rat
io/H
a
Ban
ke13
95.0
075
040.
2011
1879
.00
1146
34.1
311
1949
.00
5379
.23
3690
8.80
3949
6.53
1.49
Kap
ilvas
tu14
20.0
070
959.
8010
7565
.00
1096
06.2
510
7651
.00
4997
.17
3669
1.20
3856
2.05
1.52
Dan
g14
10.0
069
462.
4010
6807
.50
1081
64.6
310
6897
.50
4926
.41
3743
5.10
3862
3.03
1.54
Suns
ari
1445
.00
7041
2.60
1098
20.0
011
1192
.75
1099
12.0
048
72.8
439
499.
4040
698.
751.
56
Ave
rage
1417
.50
7146
8.75
1090
17.8
811
0899
.44
1091
02.3
850
43.9
137
633.
6339
345.
091.
53
Farm
gate
Mar
ket
Farm
gate
Mar
ket
Kg/
Ha
Rs/
Ha
Rs/
Ha
Rs/
Ha
Rs/
Ha
Rs/
Qt
Rs/
Ha
Rs/
Ha
Rat
io/H
a
Ras
uwa
1585
.00
8246
9.80
1347
25.0
013
7023
.25
1348
40.0
052
03.1
452
370.
2054
478.
251.
64
Sind
hupa
lcho
k14
85.0
073
518.
8812
4740
.00
1311
99.7
512
4835
.00
4950
.77
5131
6.12
5759
7.67
1.70
Sind
huli
1560
.00
7518
4.44
1258
92.0
012
7452
.00
1260
19.0
048
19.5
250
834.
5652
207.
361.
68
Ave
rage
1543
.33
7705
7.71
1284
52.3
313
1891
.67
1285
64.6
749
91.1
451
506.
9654
761.
091.
67
Tab
le 1
1.4:
Yie
ld, R
etur
ns, C
osts
and
Net
Pro
fit o
f Loc
al M
ains
easo
n L
entil
of S
elec
ted
Dis
tric
ts:
Net
Pro
fits
Ben
efit
Cos
tD
istr
icts
Yie
ldT
otal
Cos
tV
alue
of M
ain
Prod
uct
Gro
ss In
com
e Fa
rmga
teC
osts
Tab
le 1
1.3:
Yie
ld, R
etur
ns, C
osts
and
Net
Pro
fit o
f Im
prov
ed M
ains
easo
n L
entil
of S
elec
ted
Dis
tric
ts:
Dis
tric
tsY
ield
Tot
al C
ost
Val
ue o
f Mai
n Pr
oduc
t G
ross
Inco
me
Farm
gate
Cos
tsN
et P
rofit
sB
enef
it C
ost
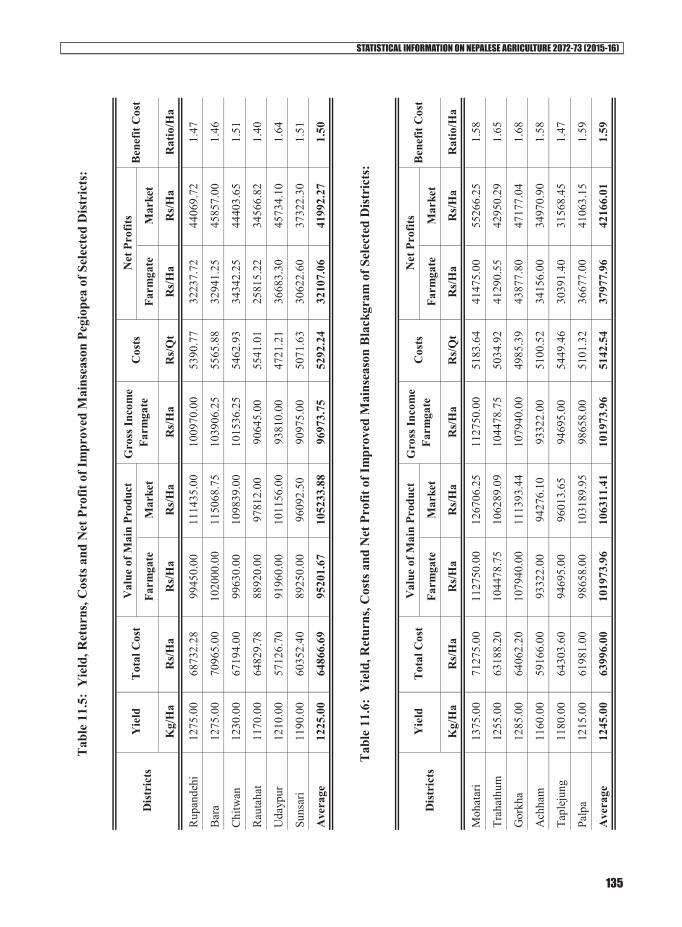
STATISTICAL INFORMATION ON NEPALESE AGRICULTURE 2072-73 (2015-16)
135
Farm
gate
Mar
ket
Farm
gate
Mar
ket
Kg/
Ha
Rs/
Ha
Rs/
Ha
Rs/
Ha
Rs/
Ha
Rs/
Qt
Rs/
Ha
Rs/
Ha
Rat
io/H
a
Rup
ande
hi12
75.0
068
732.
2899
450.
0011
1435
.00
1009
70.0
053
90.7
732
237.
7244
069.
721.
47
Bar
a12
75.0
070
965.
0010
2000
.00
1150
68.7
510
3906
.25
5565
.88
3294
1.25
4585
7.00
1.46
Chi
twan
1230
.00
6719
4.00
9963
0.00
1098
39.0
010
1536
.25
5462
.93
3434
2.25
4440
3.65
1.51
Rau
taha
t11
70.0
064
829.
7888
920.
0097
812.
0090
645.
0055
41.0
125
815.
2234
566.
821.
40
Uda
ypur
1210
.00
5712
6.70
9196
0.00
1011
56.0
093
810.
0047
21.2
136
683.
3045
734.
101.
64
Suns
ari
1190
.00
6035
2.40
8925
0.00
9609
2.50
9097
5.00
5071
.63
3062
2.60
3732
2.30
1.51
Ave
rage
1225
.00
6486
6.69
9520
1.67
1052
33.8
896
973.
7552
92.2
432
107.
0641
992.
271.
50
Farm
gate
Mar
ket
Farm
gate
Mar
ket
Kg/
Ha
Rs/
Ha
Rs/
Ha
Rs/
Ha
Rs/
Ha
Rs/
Qt
Rs/
Ha
Rs/
Ha
Rat
io/H
a
Moh
atar
i13
75.0
071
275.
0011
2750
.00
1267
06.2
511
2750
.00
5183
.64
4147
5.00
5526
6.25
1.58
Trah
athu
m12
55.0
063
188.
2010
4478
.75
1062
89.0
910
4478
.75
5034
.92
4129
0.55
4295
0.29
1.65
Gor
kha
1285
.00
6406
2.20
1079
40.0
011
1393
.44
1079
40.0
049
85.3
943
877.
8047
177.
041.
68
Ach
ham
1160
.00
5916
6.00
9332
2.00
9427
6.10
9332
2.00
5100
.52
3415
6.00
3497
0.90
1.58
Tapl
ejun
g11
80.0
064
303.
6094
695.
0096
013.
6594
695.
0054
49.4
630
391.
4031
568.
451.
47
Palp
a12
15.0
061
981.
0098
658.
0010
3189
.95
9865
8.00
5101
.32
3667
7.00
4106
3.15
1.59
Ave
rage
1245
.00
6399
6.00
1019
73.9
610
6311
.41
1019
73.9
651
42.5
437
977.
9642
166.
011.
59
Tab
le 1
1.5:
Yie
ld, R
etur
ns, C
osts
and
Net
Pro
fit o
f Im
prov
ed M
ains
easo
n Pe
giop
ea o
f Sel
ecte
d D
istr
icts
:
Tab
le 1
1.6:
Yie
ld, R
etur
ns, C
osts
and
Net
Pro
fit o
f Im
prov
ed M
ains
easo
n B
lack
gram
of S
elec
ted
Dis
tric
ts:
Net
Pro
fits
Ben
efit
Cos
tD
istr
icts
Yie
ldT
otal
Cos
tV
alue
of M
ain
Prod
uct
Gro
ss In
com
e Fa
rmga
teC
osts
Dis
tric
tsY
ield
Tot
al C
ost
Val
ue o
f Mai
n Pr
oduc
t G
ross
Inco
me
Farm
gate
Cos
tsN
et P
rofit
sB
enef
it C
ost

STATISTICAL INFORMATION ON NEPALESE AGRICULTURE 2072-73 (2015-16)
136
Farm
gate
Mar
ket
Farm
gate
Mar
ket
Kg/
Ha
Rs/
Ha
Rs/
Ha
Rs/
Ha
Rs/
Ha
Rs/
Qt
Rs/
Ha
Rs/
Ha
Rat
io/H
a
Kan
chan
pur
1665
.00
8345
4.80
1415
25.0
014
2357
.50
1415
25.0
050
12.3
058
070.
2058
702.
901.
70
Chi
twan
1685
.00
9153
2.60
1482
80.0
014
7269
.00
1482
80.0
054
32.2
056
747.
4055
534.
201.
62
Sira
ha15
90.0
083
816.
9013
5150
.00
1359
45.0
013
5150
.00
5271
.50
5133
3.10
5193
7.30
1.61
Dar
chul
la14
55.0
058
124.
9211
6400
.00
1174
91.2
511
6400
.00
3994
.84
5827
5.08
5919
1.73
2.00
Illam
1594
.00
6549
5.80
1307
08.0
013
3258
.40
1307
08.0
041
08.9
065
212.
2067
571.
322.
00
Ave
rage
1597
.80
7648
5.00
1344
12.6
013
5264
.23
1344
12.6
047
63.9
557
927.
6058
587.
491.
79
Farm
gate
Mar
ket
Farm
gate
Mar
ket
Kg/
Ha
Rs/
Ha
Rs/
Ha
Rs/
Ha
Rs/
Ha
Rs/
Qt
Rs/
Ha
Rs/
Ha
Rat
io/H
a
Mak
wan
pur
5522
.00
1312
33.2
023
3304
.50
2518
03.2
023
3304
.50
2376
.55
1020
71.3
011
9907
.36
1.78
Nuw
akot
5422
.00
1256
19.2
024
9412
.00
2575
45.0
024
9412
.00
2316
.84
1237
92.8
013
1275
.16
1.99
Bar
a53
68.0
011
8719
.20
2147
20.0
024
4780
.80
2147
20.0
022
11.6
196
000.
8012
5417
.44
1.81
Dha
nush
a54
33.0
012
5642
.80
2200
36.5
024
9035
.14
2200
36.5
023
12.5
994
393.
7012
2740
.38
1.75
Dan
g57
85.0
012
2575
.80
2325
57.0
025
8025
.46
2325
57.0
021
18.8
610
9981
.20
1347
55.4
61.
90
Rup
andh
ehi
5485
.00
1211
61.8
022
3788
.00
2498
55.4
622
3788
.00
2208
.97
1026
26.2
012
8035
.46
1.85
Ave
rage
5502
.50
1241
58.6
722
8969
.67
2518
40.8
422
8969
.67
2257
.57
1048
11.0
012
7021
.88
1.84
Tab
le 1
1.7:
Yie
ld, R
etur
ns, C
osts
and
Net
Pro
fit o
f Im
prov
ed M
ains
easo
n K
idne
ybea
n of
Sel
ecte
d D
istr
icts
:
Tab
le 1
1.8:
Yie
ld, R
etur
ns, C
osts
and
Net
Pro
fit o
f Im
prov
ed M
ains
easo
n Sn
owpe
a of
Sel
ecte
d D
istr
icts
:
Net
Pro
fits
Ben
efit
Cos
tD
istr
icts
Yie
ldT
otal
Cos
tV
alue
of M
ain
Prod
uct
Gro
ss In
com
e Fa
rmga
teC
osts
Dis
tric
tsY
ield
Tot
al C
ost
Val
ue o
f Mai
n Pr
oduc
t G
ross
Inco
me
Farm
gate
Cos
tsN
et P
rofit
sB
enef
it C
ost
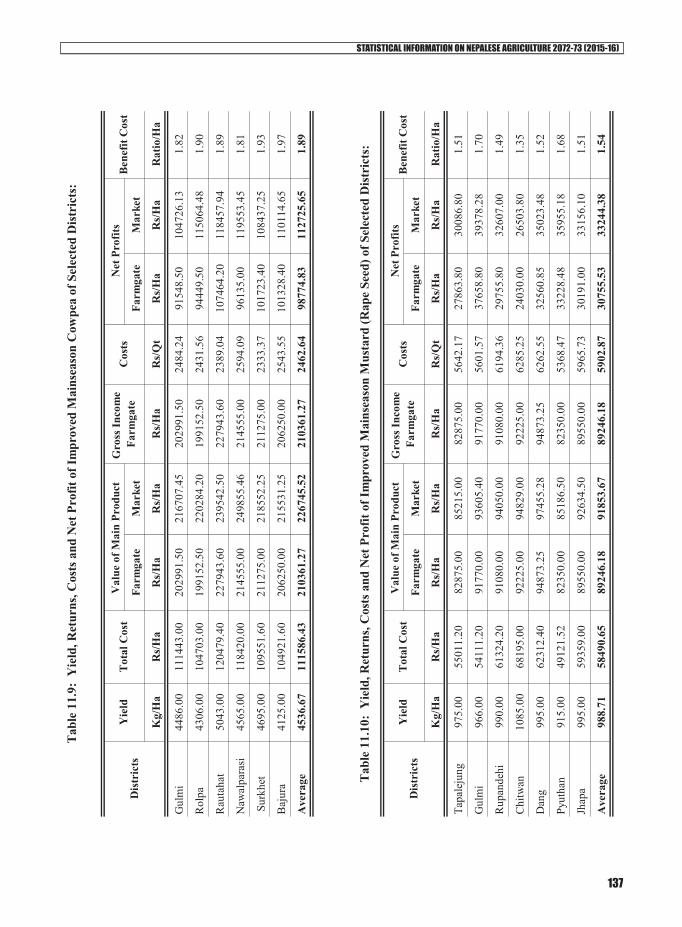
STATISTICAL INFORMATION ON NEPALESE AGRICULTURE 2072-73 (2015-16)
137
Farm
gate
Mar
ket
Farm
gate
Mar
ket
Kg/
Ha
Rs/
Ha
Rs/
Ha
Rs/
Ha
Rs/
Ha
Rs/
Qt
Rs/
Ha
Rs/
Ha
Rat
io/H
a
Gul
mi
4486
.00
1114
43.0
020
2991
.50
2167
07.4
520
2991
.50
2484
.24
9154
8.50
1047
26.1
31.
82
Rol
pa43
06.0
010
4703
.00
1991
52.5
022
0284
.20
1991
52.5
024
31.5
694
449.
5011
5064
.48
1.90
Rau
taha
t50
43.0
012
0479
.40
2279
43.6
023
9542
.50
2279
43.6
023
89.0
410
7464
.20
1184
57.9
41.
89
Naw
alpa
rasi
4565
.00
1184
20.0
021
4555
.00
2498
55.4
621
4555
.00
2594
.09
9613
5.00
1195
53.4
51.
81
Sur
khet
4695
.00
1095
51.6
021
1275
.00
2185
52.2
521
1275
.00
2333
.37
1017
23.4
010
8437
.25
1.93
Baj
ura
4125
.00
1049
21.6
020
6250
.00
2155
31.2
520
6250
.00
2543
.55
1013
28.4
011
0114
.65
1.97
Ave
rage
4536
.67
1115
86.4
321
0361
.27
2267
45.5
221
0361
.27
2462
.64
9877
4.83
1127
25.6
51.
89
Farm
gate
Mar
ket
Farm
gate
Mar
ket
Kg/
Ha
Rs/
Ha
Rs/
Ha
Rs/
Ha
Rs/
Ha
Rs/
Qt
Rs/
Ha
Rs/
Ha
Rat
io/H
a
Tapa
leju
ng97
5.00
5501
1.20
8287
5.00
8521
5.00
8287
5.00
5642
.17
2786
3.80
3008
6.80
1.51
Gul
mi
966.
0054
111.
2091
770.
0093
605.
4091
770.
0056
01.5
737
658.
8039
378.
281.
70
Rup
ande
hi99
0.00
6132
4.20
9108
0.00
9405
0.00
9108
0.00
6194
.36
2975
5.80
3260
7.00
1.49
Chi
twan
1085
.00
6819
5.00
9222
5.00
9482
9.00
9222
5.00
6285
.25
2403
0.00
2650
3.80
1.35
Dan
g99
5.00
6231
2.40
9487
3.25
9745
5.28
9487
3.25
6262
.55
3256
0.85
3502
3.48
1.52
Pyut
han
915.
0049
121.
5282
350.
0085
186.
5082
350.
0053
68.4
733
228.
4835
955.
181.
68
Jhap
a99
5.00
5935
9.00
8955
0.00
9263
4.50
8955
0.00
5965
.73
3019
1.00
3315
6.10
1.51
Ave
rage
988.
7158
490.
6589
246.
1891
853.
6789
246.
1859
02.8
730
755.
5333
244.
381.
54
Tab
le 1
1.9:
Yie
ld, R
etur
ns, C
osts
and
Net
Pro
fit o
f Im
prov
ed M
ains
easo
n C
owpe
a of
Sel
ecte
d D
istr
icts
:
Tab
le 1
1.10
: Y
ield
, Ret
urns
, Cos
ts a
nd N
et P
rofit
of I
mpr
oved
Mai
nsea
son
Mus
tard
(Rap
e Se
ed) o
f Sel
ecte
d D
istr
icts
:
Net
Pro
fits
Ben
efit
Cos
tD
istr
icts
Yie
ldT
otal
Cos
tV
alue
of M
ain
Prod
uct
Gro
ss In
com
e Fa
rmga
teC
osts
Dis
tric
tsY
ield
Tot
al C
ost
Val
ue o
f Mai
n Pr
oduc
t G
ross
Inco
me
Farm
gate
Cos
tsN
et P
rofit
sB
enef
it C
ost

STATISTICAL INFORMATION ON NEPALESE AGRICULTURE 2072-73 (2015-16)
138
Farm
gate
Mar
ket
Farm
gate
Mar
ket
Kg/
Ha
Rs/
Ha
Rs/
Ha
Rs/
Ha
Rs/
Ha
Rs/
Qt
Rs/
Ha
Rs/
Ha
Rat
io/H
a
Lam
jung
980.
0057
264.
6094
080.
0094
962.
0094
080.
0058
43.3
336
815.
4037
579.
801.
64
Chi
twan
955.
0058
373.
4085
950.
0089
318.
7685
950.
0061
12.4
027
576.
6030
830.
761.
47
Bar
a94
5.00
5582
7.80
8316
0.00
8551
0.69
8316
0.00
5907
.70
2733
2.20
2956
9.49
1.49
Surk
het
990.
0045
590.
6079
447.
5092
310.
0879
447.
5046
05.1
133
856.
9046
600.
681.
74
Kav
repl
anch
ok10
05.0
051
682.
6687
435.
0090
701.
2587
435.
0051
42.5
535
752.
3438
897.
991.
69
Jhap
a92
2.00
5776
7.00
8298
0.00
8583
8.20
8298
0.00
6265
.40
2521
3.00
2796
0.56
1.44
Kai
lali
922.
0057
767.
0082
980.
0085
838.
2082
980.
0062
65.4
025
213.
0027
960.
561.
44
Ave
rage
959.
8654
896.
1585
147.
5089
211.
3185
147.
5057
34.5
630
251.
3534
199.
981.
56
Farm
gate
Mar
ket
Farm
gate
Mar
ket
Kg/
Ha
Rs/
Ha
Rs/
Ha
Rs/
Ha
Rs/
Ha
Rs/
Qt
Rs/
Ha
Rs/
Ha
Rat
io/H
a
Lam
jung
725.
0045
919.
0010
1500
.00
1033
12.5
010
1500
.00
6333
.66
5558
1.00
5730
6.50
2.21
Bar
a73
5.00
4983
4.28
9922
5.00
1012
46.2
599
225.
0067
80.1
749
390.
7251
323.
771.
99
Kap
ilwas
tu71
0.00
4375
3.40
1029
50.0
010
4547
.50
1029
50.0
061
62.4
559
196.
6060
708.
902.
35
Dai
lekh
710.
0039
423.
2095
850.
0097
802.
5095
850.
0055
52.5
656
426.
8058
294.
102.
43
Kho
tang
715.
0037
279.
4093
665.
0095
095.
0093
665.
0052
13.9
056
385.
6057
729.
802.
51
Ave
rage
719.
0043
241.
8698
638.
0010
0400
.75
9863
8.00
6008
.55
5539
6.14
5707
2.61
2.30
Tab
le 1
1.11
: Y
ield
, Ret
urns
, Cos
ts a
nd N
et P
rofit
of I
mpr
oved
Mai
nsea
son
Yel
low
Mus
tard
of S
elec
ted
Dis
tric
ts:
Tab
le 1
1.12
: Y
ield
, Ret
urns
, Cos
ts a
nd N
et P
rofit
of I
mpr
oved
Mai
nsea
son
Sesa
me
of S
elec
ted
Dis
tric
ts:
Net
Pro
fits
Ben
efit
Cos
tD
istr
icts
Yie
ldT
otal
Cos
tV
alue
of M
ain
Prod
uct
Gro
ss In
com
e Fa
rmga
teC
osts
Dis
tric
tsY
ield
Tot
al C
ost
Val
ue o
f Mai
n Pr
oduc
t G
ross
Inco
me
Farm
gate
Cos
tsN
et P
rofit
sB
enef
it C
ost
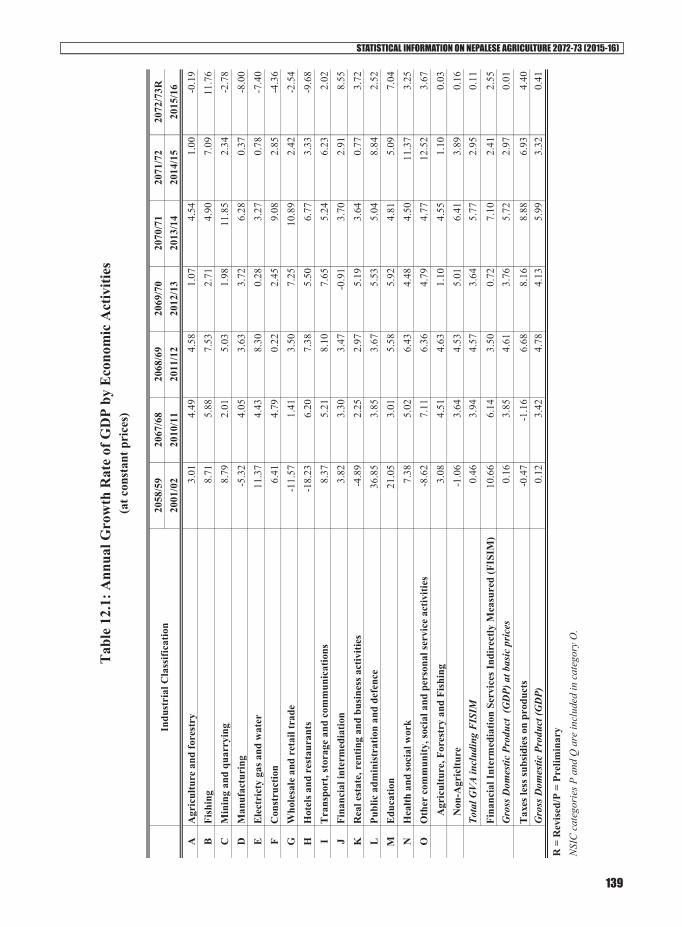
STATISTICAL INFORMATION ON NEPALESE AGRICULTURE 2072-73 (2015-16)
139
2058
/59
2067
/68
2068
/69
2069
/70
2070
/71
2071
/72
2072
/73R
2001
/02
2010
/11
2011
/12
2012
/13
2013
/14
2014
/15
2015
/16
AA
gric
ultu
re a
nd fo
rest
ry3.
014.
494.
581.
074.
541.
00-0
.19
BFi
shin
g8.
715.
887.
532.
714.
907.
0911
.76
CM
inin
g an
d qu
arry
ing
8.79
2.01
5.03
1.98
11.8
52.
34-2
.78
DM
anuf
actu
ring
-5.3
24.
053.
633.
726.
280.
37-8
.00
EE
lect
rict
y ga
s and
wat
er11
.37
4.43
8.30
0.28
3.27
0.78
-7.4
0F
Con
stru
ctio
n6.
414.
790.
222.
459.
082.
85-4
.36
GW
hole
sale
and
ret
ail t
rade
-11.
571.
413.
507.
2510
.89
2.42
-2.5
4H
Hot
els a
nd r
esta
uran
ts-1
8.23
6.20
7.38
5.50
6.77
3.33
-9.6
8I
Tra
nspo
rt, s
tora
ge a
nd c
omm
unic
atio
ns8.
375.
218.
107.
655.
246.
232.
02J
Fina
ncia
l int
erm
edia
tion
3.82
3.30
3.47
-0.9
13.
702.
918.
55K
Rea
l est
ate,
ren
ting
and
busi
ness
act
iviti
es-4
.89
2.25
2.97
5.19
3.64
0.77
3.72
LPu
blic
adm
inis
trat
ion
and
defe
nce
36.8
53.
853.
675.
535.
048.
842.
52M
Edu
catio
n21
.05
3.01
5.58
5.92
4.81
5.09
7.04
NH
ealth
and
soci
al w
ork
7.38
5.02
6.43
4.48
4.50
11.3
73.
25O
Oth
er c
omm
unity
, soc
ial a
nd p
erso
nal s
ervi
ce a
ctiv
ities
-8.6
27.
116.
364.
794.
7712
.52
3.67
Agr
icul
ture
, For
estr
y an
d Fi
shin
g3.
084.
514.
631.
104.
551.
100.
03N
on-A
gric
lture
-1.0
63.
644.
535.
016.
413.
890.
16To
tal G
VA in
clud
ing
FIS
IM0.
463.
944.
573.
645.
772.
950.
11
Fina
ncia
l Int
erm
edia
tion
Serv
ices
Indi
rect
ly M
easu
red
(FIS
IM)
10.6
66.
143.
500.
727.
102.
412.
55G
ross
Dom
estic
Pro
duct
(G
DP)
at b
asic
pri
ces
0.16
3.85
4.61
3.76
5.72
2.97
0.01
Tax
es le
ss su
bsid
ies o
n pr
oduc
ts-0
.47
-1.1
66.
688.
168.
886.
934.
40G
ross
Dom
estic
Pro
duct
(GD
P)0.
123.
424.
784.
135.
993.
320.
41
R =
Rev
ised
/P =
Pre
limin
ary
NSI
C c
ateg
orie
s P a
nd Q
are
incl
uded
in c
ateg
ory
O.
Indu
stri
al C
lass
ifica
tion
Tab
le 1
2.1:
Ann
ual G
row
th R
ate
of G
DP
by E
cono
mic
Act
iviti
es(a
t con
stan
t pri
ces)

STATISTICAL INFORMATION ON NEPALESE AGRICULTURE 2072-73 (2015-16)
140
2058
/59
2067
/68
2068
/69
2069
/70
2070
/71
2071
/72
2072
/73R
2001
/02
2010
/11
2011
/12
2012
/13
2013
/14
2014
/15
2015
/16
AA
gric
ultu
re a
nd fo
rest
ry22
0614
6233
0366
5747
7021
3278
2868
8228
1185
8600
BFi
shin
g26
4254
6665
1974
4697
0110
451
1175
0C
Min
ing
and
quar
ryin
g27
0387
5110
264
1206
913
889
1499
015
419
DM
anuf
actu
ring
1351
7028
9004
3275
0036
0081
4056
6742
6757
4231
06E
Ele
ctri
cty
gas a
nd w
ater
1548
131
492
3491
940
951
4446
547
193
4860
4F
Con
stru
ctio
n58
180
1826
1419
9349
2203
2125
5864
2806
0828
0033
GW
hole
sale
and
ret
ail t
rade
7712
021
4907
2375
0227
5462
3254
0334
6958
3501
46H
Hot
els a
nd r
esta
uran
ts22
716
6837
682
634
9508
010
8943
1204
0712
9634
IT
rans
port
, sto
rage
and
com
mun
icat
ions
6282
818
2706
2098
7023
7569
2601
3827
4677
2878
45J
Fina
ncia
l int
erm
edia
tion
1678
471
395
8668
897
114
1106
6712
6830
1454
26K
Rea
l est
ate,
ren
ting
and
busi
ness
act
iviti
es49
443
1572
0318
0501
2014
2921
9793
2425
4826
9303
LPu
blic
adm
inis
trat
ion
and
defe
nce
9309
3307
039
928
4073
251
245
6024
666
829
ME
duca
tion
2635
292
741
1095
0212
1384
1437
8715
8080
1705
85N
Hea
lth a
nd so
cial
wor
k64
0124
727
2895
531
169
3741
147
482
5305
0O
Oth
er c
omm
unity
, soc
ial a
nd p
erso
nal s
ervi
ce a
ctiv
ities
1617
966
473
7837
282
947
1068
3211
9211
1336
66G
ross
Out
put a
t bas
ic p
rice
s72
1,92
42,
052,
228
2,29
8,24
82,
525,
886
2,87
6,67
33,
099,
248
3,24
3,99
6
R =
Rev
ised
/P =
Pre
limin
ary
NSI
C c
ateg
orie
s P a
nd Q
are
incl
uded
in c
ateg
ory
O.
Indu
stri
al C
lass
ifica
tion
Tab
le 1
2.2:
Gro
ss O
utpu
t by
Indu
stri
al D
ivis
ion
(at c
urre
nt p
rice
s)
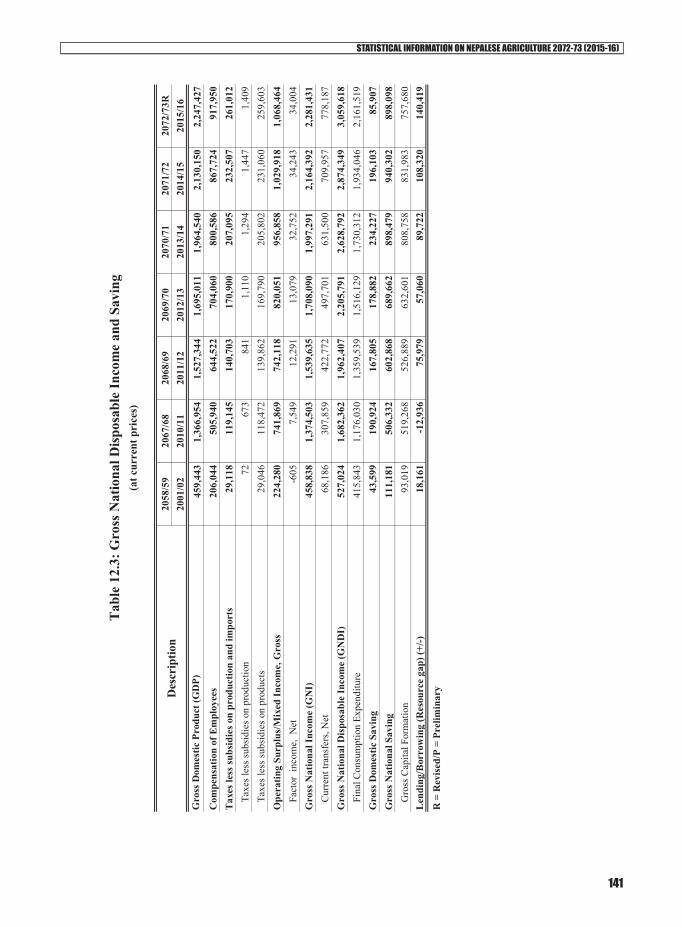
STATISTICAL INFORMATION ON NEPALESE AGRICULTURE 2072-73 (2015-16)
141
2058
/59
2067
/68
2068
/69
2069
/70
2070
/71
2071
/72
2072
/73R
2001
/02
2010
/11
2011
/12
2012
/13
2013
/14
2014
/15
2015
/16
Gro
ss D
omes
tic P
rodu
ct (G
DP)
459,
443
1,36
6,95
41,
527,
344
1,69
5,01
11,
964,
540
2,13
0,15
02,
247,
427
Com
pens
atio
n of
Em
ploy
ees
206,
044
505,
940
644,
522
704,
060
800,
586
867,
724
917,
950
Tax
es le
ss su
bsid
ies o
n pr
oduc
tion
and
impo
rts
29,1
1811
9,14
514
0,70
317
0,90
020
7,09
523
2,50
726
1,01
2Ta
xes l
ess s
ubsi
dies
on
prod
uctio
n 72
673
841
1,11
01,
294
1,44
71,
409
Taxe
s les
s sub
sidi
es o
n pr
oduc
ts29
,046
118,
472
139,
862
169,
790
205,
802
231,
060
259,
603
Ope
ratin
g Su
rplu
s/M
ixed
Inco
me,
Gro
ss22
4,28
074
1,86
974
2,11
882
0,05
195
6,85
81,
029,
918
1,06
8,46
4Fa
ctor
inc
ome,
Net
-605
7,54
912
,291
13,0
7932
,752
34,2
4334
,004
Gro
ss N
atio
nal I
ncom
e (G
NI)
458,
838
1,37
4,50
31,
539,
635
1,70
8,09
01,
997,
291
2,16
4,39
22,
281,
431
Cur
rent
tran
sfer
s, N
et
68,1
8630
7,85
942
2,77
249
7,70
163
1,50
070
9,95
777
8,18
7G
ross
Nat
iona
l Dis
posa
ble
Inco
me
(GN
DI)
527,
024
1,68
2,36
21,
962,
407
2,20
5,79
12,
628,
792
2,87
4,34
93,
059,
618
Fina
l Con
sum
ptio
n Ex
pend
iture
415,
843
1,17
6,03
01,
359,
539
1,51
6,12
91,
730,
312
1,93
4,04
62,
161,
519
Gro
ss D
omes
tic S
avin
g43
,599
190,
924
167,
805
178,
882
234,
227
196,
103
85,9
07G
ross
Nat
iona
l Sav
ing
111,
181
506,
332
602,
868
689,
662
898,
479
940,
302
898,
098
Gro
ss C
apita
l For
mat
ion
93,0
1951
9,26
852
6,88
963
2,60
180
8,75
883
1,98
375
7,68
0L
endi
ng/B
orro
win
g (R
esou
rce
gap)
(+/-)
18,1
61-1
2,93
675
,979
57,0
6089
,722
108,
320
140,
419
R =
Rev
ised
/P =
Pre
limin
aryDes
crip
tion
Tab
le 1
2.3:
Gro
ss N
atio
nal D
ispos
able
Inco
me
and
Savi
ng(a
t cur
rent
pri
ces)
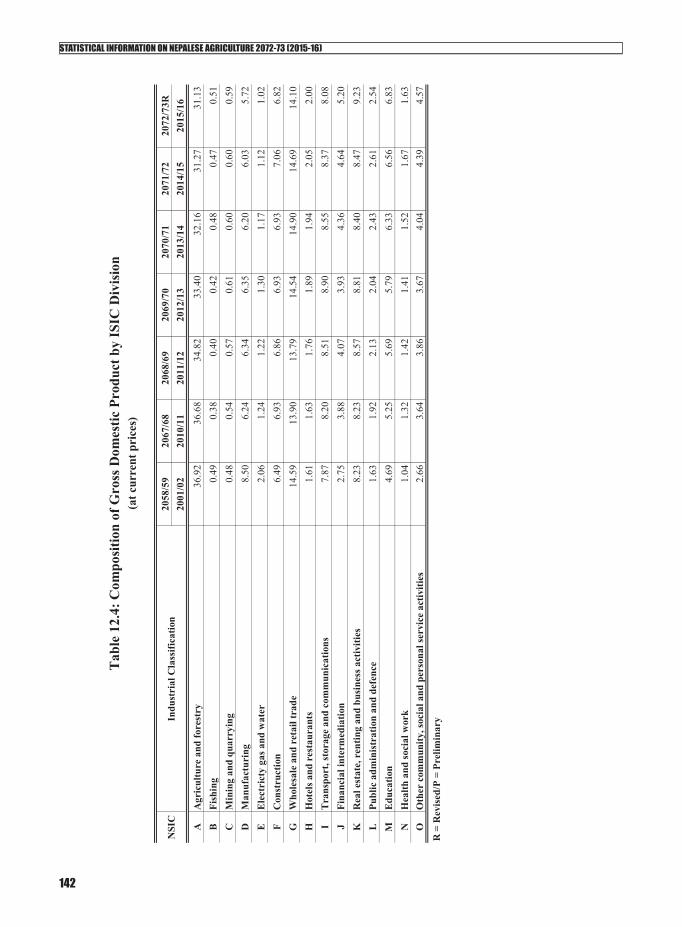
STATISTICAL INFORMATION ON NEPALESE AGRICULTURE 2072-73 (2015-16)
142
2058
/59
2067
/68
2068
/69
2069
/70
2070
/71
2071
/72
2072
/73R
2001
/02
2010
/11
2011
/12
2012
/13
2013
/14
2014
/15
2015
/16
AA
gric
ultu
re a
nd fo
rest
ry36
.92
36.6
834
.82
33.4
032
.16
31.2
731
.13
BFi
shin
g0.
490.
380.
400.
420.
480.
470.
51C
Min
ing
and
quar
ryin
g0.
480.
540.
570.
610.
600.
600.
59D
Man
ufac
turi
ng8.
506.
246.
346.
356.
206.
035.
72E
Ele
ctri
cty
gas a
nd w
ater
2.06
1.24
1.22
1.30
1.17
1.12
1.02
FC
onst
ruct
ion
6.49
6.93
6.86
6.93
6.93
7.06
6.82
GW
hole
sale
and
ret
ail t
rade
14.5
913
.90
13.7
914
.54
14.9
014
.69
14.1
0H
Hot
els a
nd r
esta
uran
ts1.
611.
631.
761.
891.
942.
052.
00I
Tra
nspo
rt, s
tora
ge a
nd c
omm
unic
atio
ns7.
878.
208.
518.
908.
558.
378.
08J
Fina
ncia
l int
erm
edia
tion
2.75
3.88
4.07
3.93
4.36
4.64
5.20
KR
eal e
stat
e, r
entin
g an
d bu
sine
ss a
ctiv
ities
8.23
8.23
8.57
8.81
8.40
8.47
9.23
LPu
blic
adm
inis
trat
ion
and
defe
nce
1.63
1.92
2.13
2.04
2.43
2.61
2.54
ME
duca
tion
4.69
5.25
5.69
5.79
6.33
6.56
6.83
NH
ealth
and
soci
al w
ork
1.04
1.32
1.42
1.41
1.52
1.67
1.63
OO
ther
com
mun
ity, s
ocia
l and
per
sona
l ser
vice
act
iviti
es2.
663.
643.
863.
674.
044.
394.
57
R =
Rev
ised
/P =
Pre
limin
ary
NSI
C
Indu
stri
al C
lass
ifica
tion
Tab
le 1
2.4:
Com
posit
ion
of G
ross
Dom
estic
Pro
duct
by
ISIC
Div
isio
n(a
t cur
rent
pri
ces)

STATISTICAL INFORMATION ON NEPALESE AGRICULTURE 2072-73 (2015-16)
143
2057
/58
2058
/59
2059
/60
2060
/61
2061
/62
2062
/63
2063
/64
2064
/65
2065
/66
2066
/67
2067
/68
2068
/69
2069
/70
2070
/71
2071
/72
2072
/73R
2000
/01
2001
/02
2002
/03
2003
/04
2004
/05
2005
/06
2006
/07
2007
/08
2008
/09
2009
/10
2010
/11
2011
/12
2012
/13
2013
/14
2014
/15
2015
/16
Perc
apita
GD
P (N
Rs.)
1907
219
410
2033
721
689
2329
225
279
2890
531
946
3817
245
435
5159
456
880
6228
371
225
7620
179
325
Ann
ual C
hang
e in
nom
inal
per
capi
ta G
DP
(%)
1.77
4.78
6.64
7.40
8.53
14.3
410
.52
19.4
919
.03
13.5
610
.25
9.50
14.3
66.
994.
10
13.0
26.
52
Perc
apita
GN
I (N
Rs.)
1914
619
384
2030
921
620
2335
725
471
2920
032
257
3862
645
782
5187
957
337
6276
472
413
7742
680
525
Ann
ual C
hang
e in
nom
inal
per
capi
ta G
NI (
%)
1.25
4.77
6.46
8.03
9.05
14.6
410
.47
19.7
418
.53
13.3
210
.52
9.46
15.3
76.
924.
00
Perc
apita
GN
DI
(NR
s.)21
979
2226
523
430
2505
127
218
3034
634
323
3941
748
262
5654
963
499
7308
281
051
9530
810
2823
1079
92
Ann
ual C
hang
e in
nom
inal
per
capi
ta G
ND
I (%
)1.
305.
236.
928.
6511
.49
13.1
014
.84
22.4
417
.17
12.2
915
.09
10.9
117
.59
7.88
5.03
Perc
apita
GD
P at
con
stan
t pri
ce (N
Rs.)
1907
218
675
1898
419
436
1967
019
884
2112
922
110
2279
323
561
2414
424
962
2564
626
820
2734
227
089
Ann
ual C
hang
e in
real
per
capi
ta G
DP
(%)
-2.0
81.
662.
381.
201.
096.
264.
643.
093.
372.
483.
392.
744.
581.
95-0
.92
Perc
apita
GN
I at c
onst
ant p
rice
(NR
s.)19
146
1865
718
962
1940
119
802
2018
621
569
2256
723
301
2415
224
664
2558
226
397
2793
928
422
2816
3
Ann
ual C
hang
e in
real
per
capi
ta G
NI (
%)
-2.5
51.
632.
322.
071.
946.
854.
633.
253.
652.
123.
723.
185.
841.
73-0
.91
Perc
apita
GN
DI a
t con
stan
t pri
ce (N
Rs.)
2197
921
430
2187
622
479
2307
624
050
2535
427
577
2911
429
831
3018
832
607
3408
836
773
3774
537
769
Ann
ual C
hang
e in
real
per
capi
ta G
ND
I (%
)-2
.50
2.08
2.76
2.65
4.22
5.42
8.77
5.57
2.46
1.20
8.01
4.54
7.88
2.64
0.06
Perc
apita
inco
mes
in U
S$
Nom
inal
Per
capi
ta G
DP
(US$
) 25
925
526
129
332
835
041
049
149
761
071
470
270
872
576
674
6
Nom
inal
Per
capi
ta G
NI (
US$
)26
025
426
129
232
935
241
449
650
261
471
870
871
473
777
875
7
Nom
inal
Per
capi
ta G
ND
I (U
S$)
298
292
301
339
383
420
487
606
628
759
879
902
921
970
1033
1015
Fina
l Con
sum
ptio
n E
xpen
ditu
re a
s per
cent
age
of G
DP
88.3
490
.51
91.4
488
.25
88.4
491
.02
90.1
890
.17
90.5
788
.55
86.0
389
.01
89.4
588
.08
90.7
996
.18
Gro
ss D
omes
tic S
avin
g as
per
cent
age
of G
DP
11.6
69.
498.
5611
.75
11.5
68.
989.
829.
839.
4311
.45
13.9
710
.99
10.5
511
.92
9.21
3.82
Gro
ss N
atio
nal S
avin
g as
per
cent
age
of G
DP
26.9
124
.20
23.7
727
.25
28.4
129
.03
28.5
633
.22
35.8
735
.91
37.0
439
.47
40.6
945
.73
44.1
439
.96
Exp
orts
of g
oods
and
serv
ices
as p
erce
ntag
e of
GD
P22
.56
17.7
415
.70
16.6
814
.58
13.4
512
.86
12.7
812
.42
9.58
8.90
10.0
710
.69
11.5
111
.62
9.49
Impo
rts
of g
oods
and
serv
ices
as p
erce
ntag
e of
GD
P33
.24
28.4
928
.55
29.4
629
.48
31.3
231
.72
33.2
634
.66
36.4
032
.92
33.5
837
.46
40.7
541
.47
39.3
8
Gro
ss F
ixed
Cap
ital F
orm
atio
n as
per
cent
age
of G
DP
19.2
019
.56
19.9
220
.34
19.9
420
.72
21.0
721
.88
21.3
522
.21
21.4
120
.77
22.5
923
.52
27.9
728
.80
Res
ourc
e G
ap a
s per
cent
age
of G
DP(
+/-)
4.56
3.95
2.36
2.72
1.96
2.17
-0.1
22.
904.
19-2
.36
-0.9
54.
973.
374.
575.
096.
25
Wor
kers
' Rem
ittan
ces a
s per
cent
age
of G
DP
11.1
214
.94
13.7
617
.49
21.2
219
.43
18.5
523
.54
25.6
427
.66
28.9
829
.59
Exch
ange
rate
(US$
: NR
s)73
.70
76.2
577
.83
73.9
771
.05
72.3
270
.49
65.0
276
.88
74.5
472
.27
81.0
287
.96
98.2
199
.49
106.
35
Popu
latio
n (m
illio
ns)
23.1
523
.67
24.2
024
.75
25.3
025
.87
25.1
825
.53
25.8
926
.25
26.4
926
.85
27.2
127
.58
27.9
528
.33
R =
Rev
ised
/P =
Pre
limin
ary
Sour
ce: T
able
12.
1-12
.5 C
entra
l Bur
eau
of S
tatis
tics,
Nep
al
Des
crip
tion
Tab
le 1
2.5:
Sum
mar
y of
Mac
ro E
cono
mic
Indi
cato
rs

STATISTICAL INFORMATION ON NEPALESE AGRICULTURE 2072-73 (2015-16)
144
Chapters Description Exports Imports Trade Balance
01 Live animals. 132,554 3,052,048 -2,919,49402 Meat and edible meat offal. 351,940 101,243 250,697
03 Fish and crustaceans, molluscs and other aquatic invertebrates. 931 822,856 -821,925
04 Dairy produce; birds' eggs; natural honey; edible products of animal origin 213,117 1,592,487 -1,379,370
05 Products of animal origin, not elsewhere specified or included 68,662 156,018 -87,356
06 Live trees and other plants; bulbs, roots and the like; cut flowerrs 12,849 58,805 -45,956
07 Edible vegetables and certain roots and tubers. 1,606,611 17,958,156 -16,351,54508 Edible fruit and nut 185,393 10,819,229 -10,633,83609 Coffee, tea, mate and spices. 8,033,250 5,275,709 2,757,54110 Cereals crops 16,303 39,025,913 -39,009,610
11 Products of the milling industry; malt; starches; inulin; wheat gluten. 42,755 989,136 -946,381
12 Oil seeds and oleaginous fruits; miscellaneous grains, seeds and fruit; industrial or medicinal plants; straw and fodder. 707,506 11,284,553 -10,577,047
13 Lac; gums, resins and other vegetable saps and extracts. 2,223 137,298 -135,075
14 Vegetable plaiting materials; vegetable products not elsewhere specified or included. 557,028 85,927 471,101
15 Animal or vegetable fats and oils and their cleavage products; prepared edible fats; animal or vegetable waxes. 104,774 21,233,555 -21,128,781
16 Preparations of meat, or fish or of crustaceans, molluscs or other aquatic invertebrates. 81,092 -81,092
17 Sugars and sugar confectionery. 60,614 4,881,574 -4,820,96018 Cocoa and cocoa preparations. 22 1,649,636 -1,649,614
19 Preparations of cereals, flour, starch or milk; pastrycooks' products. 691,482 4,732,275 -4,040,793
20 Preparations of vegetables, fruit, nuts or other parts of plants. 3,235,665 2,163,131 1,072,534
21 Miscellaneous edible preparations. 91,241 6,424,901 -6,333,66022 Beverages, spirits and vinegar. 36,853 4,074,840 -4,037,987
23 Residues and waste from the food industries; prepared animal fodder. 1,968,582 10,639,615 -8,671,033
24 Tobacco and manufactured tobacco substitutes. 436,495 3,088,126 -2,651,631
25 Salt; sulphur; earths and stone; plastering materials, lime and cement. 2,359 16,392,136 -16,389,777
26 Ores, slag and ash. 1,951 2,825,898 -2,823,94727 Pterolium products and other mineral oils and products of 2,375 85,105,854 -85,103,479
28 Inorganic chemicals; organic or inorganic compounds of precious metals, of rare-earth metals, of radioactive elements or of isotopes. 50,543 2,613,025 -2,562,482
29 Organic chemicals. 2,656 7,358,183 -7,355,52730 Pharmaceutical products. 707,422 26,587,901 -25,880,47931 Fertilisers. 2,793 15,788,638 -15,785,845
32Tanning or dyeing extracts; tannins and their derivatives; dyes, pigments and other colouring matter; paints and varnishes; putty and other mastics; inks.
21,614 3,447,385 -3,425,771
33 Essential oils and resinoids; perfumery, cosmetic or toilet preparations. 1,388,102 7,811,219 -6,423,117
Table 13.1: Exports, Imports and Trade Balance by Chapters: F.Y. 2015/16 (2072/73) Figures in '000 NPR

STATISTICAL INFORMATION ON NEPALESE AGRICULTURE 2072-73 (2015-16)
145
Chapters Description Exports Imports Trade Balance
34
Soap, organic surface-active agents, washing preparations, lubricating preparations, artificial waxes, prepared waxes, polishing or scouring preparations, candles and similar articles, modelling pastes, "dental waxes" and dental preparations wi
49,466 3,287,585 -3,238,119
35 Albuminoidal substances; modified starches; glues; enzymes. 1,103 1,028,313 -1,027,210
36 Explosives; pyrotechnic products; matches; pyrophoric alloys; certain combustible preparations. 235 181,187 -180,952
37 Photographic or cinematographic goods. 732,133 -732,13338 Miscellaneous chemical products 2,053,677 6,264,777 -4,211,10039 Plastics and articles thereof. 876,612 31,085,876 -30,209,26440 Rubber and articles thereof. 14,753 6,125,951 -6,111,19841 Raw hides and skins (other than furskins) and leather 732,038 99,952 632,086
42Articles of leather; saddlery and harness; travel goods, handbags and similar containers; articles of animal gut (other than silk-worm gut).
224,869 853,727 -628,858
43 Furskins and artificial fur; manufactures thereof. 396 -39644 Wood and articles of wood; wood charcoal. 80,207 2,574,085 -2,493,87845 Cork and articles of cork. 432 -432
46 Manufactures of straw, of esparto or of other plaiting materials; basketware and wickerwork. 2,365 695 1,670
47 Pulp of wood or of other fibrous cellulosic material; waste and scrap or paper or paperboard. 633,524 47,287 586,237
48 Paper and paperboard; articles of paper pulp, of paper or of paperboard. 651,287 10,954,397 -10,303,110
49 Printed books, newspapers, pictures and other products of the printing industry; manuscripts, typescripts and plans. 27,599 2,633,003 -2,605,404
50 Silk 136 749,572 -749,436
51 Wool, fine or coarse animal hair; horsehair yarn and woven fabric. 77,874 3,798,150 -3,720,276
52 Cotton. 10,535 4,944,888 -4,934,353
53 Other vegetable textile fibres; paper yarn and woven fabrics of paper yarn. 1,955,442 3,031,555 -1,076,113
54 Man-made filaments; strip and the like of man-made textile materials. 3,387,313 1,260,801 2,126,512
55 Man-made staple fibres. 5,358,009 7,979,960 -2,621,951
56 Wadding, felt and nonwovens; special yarns; twine, cordage, ropes and cables and articles thereof. 1,643,556 479,017 1,164,539
57 Carpets and other textile floor coverings. 8,145,403 697,713 7,447,690
58 Special woven fabrics; tufted textile fabrics; lace; tapestries; trimmings; embroidery. 893 547,606 -546,713
59 Impregnated, coated, covered or laminated textile fabrics; textile articles of a kind suitable for industrial use. 2,475 1,869,671 -1,867,196
60 Knitted or crocheted fabrics. 3,073 2,241,078 -2,238,005
61 Articles of apparel and clothing accessories, knitted or crocheted. 1,936,119 3,257,798 -1,321,679
62 Articles of apparel and clothing accessories, not knitted or crocheted. 6,664,061 9,274,041 -2,609,980
63 Other made up textile articles; sets; worn clothing and worn textile articles; rags. 3,403,352 2,228,118 1,175,234
64 Footwear, gaiters and the like; parts of such articles. 1,602,928 3,554,191 -1,951,26365 Headgear and parts thereof. 751,801 530,150 221,651
66 Umbrellas, sun umbrellas, walking-sticks, seat-sticks, whips, riding-crops and parts thereof. 351,980 -351,980

STATISTICAL INFORMATION ON NEPALESE AGRICULTURE 2072-73 (2015-16)
146
Chapters Description Exports Imports Trade Balance
67 Prepared feathers and down and articles made of feathers or of down; artificial flowers; articles of human hair. 23,229 45,967 -22,738
68 Articles of stone, plaster, cement, asbestos, mica or similar materials. 3,031 1,411,965 -1,408,934
69 Ceramic products. 55,672 4,372,975 -4,317,30370 Glass and glassware. 449,780 4,982,464 -4,532,684
71Natural or cultured pearls, precious or semi-precious stones, precious metals, metals clad with precious metal and articles thereof; imitation jewellery; coin.
225,083 24,298,281 -24,073,198
72 Iron and steel. 3,606,632 68,933,032 -65,326,40073 Articles of iron or steel. 1,060,050 9,119,362 -8,059,31274 Copper and articles thereof. 1,130,253 4,727,061 -3,596,80875 Nickel and articles thereof. 9,272 -9,27276 Aluminium and articles thereof. 230,392 7,079,150 -6,848,75878 Lead and articles thereof. 27,914 153,248 -125,33479 Zinc and articles thereof. 18,924 3,551,627 -3,532,70380 Tin and articles thereof. 308 296,744 -296,43681 Other base metals; cermets; articles thereof. 15,575 -15,575
82 Tools, implements, cutlery, spoons and forks, of base metal; parts thereof of base metal. 8,849 2,124,176 -2,115,327
83 Miscellaneous articles of base metal. 541,047 2,190,985 -1,649,938
84 Nuclear reactors, boilers, machinery and mechanical appliances; parts thereof. 207,022 56,592,597 -56,385,575
85Electrical machinery and equipment and parts thereof; sound recorders and reproducers, television image and sound recorders and reproducers, and parts and accessories of such articles.
155,776 57,960,767 -57,804,991
86
Railway or tramway locomotives, rolling-stock and parts thereof; railway or tramway track fixtures and fittings and parts thereof; mechanical (including Electro-mechanical) traffic signalling equipment of all kinds.
127,835 -127,835
87 Vehicles and its accessories 30,764 66,205,080 -66,174,31688 Aircraft, spacecraft, and parts thereof. 250,534 9,359,092 -9,108,55889 Ships, boats and floating structures. 83,068 -83,068
90Optical, photographic, cinematographic, measuring, checking, precision, medical or surgical instruments and apparatus; parts and accessories thereof.
59,178 10,652,168 -10,592,990
91 Clocks and watches and parts thereof. 136 726,968 -726,83292 Musical instruments; parts and accessories of such articles. 151,630 135,850 15,78093 Arms and ammunition; parts and accessories thereof. 6,429 333 6,096
94
Furniture; bedding, mattresses, mattress supports, cushions and similar stuffed furnishings; lamps and lighting fittings, not elsewhere specified or included; lluminated signs, illuminated name-plates and the like; prefabricated buildings.
48,450 3,857,466 -3,809,016
95 Toys, games and sports requisites; parts and accessories thereof. 65,449 1,009,645 -944,196
96 Miscellaneous manufactured articles. 152,276 3,759,249 -3,606,97397 Works of art, collectors' pieces and antiques. 717,987 5,828 712,159
Total 70,254,165 774,712,277 -704,458,112

STATISTICAL INFORMATION ON NEPALESE AGRICULTURE 2072-73 (2015-16)
147
SN Partner Exports Imports Trade Balance Total Trade
1 Afghanistan 206,033 88,610 117,423 294,643
2 American Samoa 12,625 7 12,618 12,632
3 Andorra 956 4,411 -3,455 5,367
4 Anguilla 4 -4 4
5 Antigua and Barbuda 959 -959 959
6 Argentina 1,054 8,154,222 -8,153,168 8,155,276
7 Australia 588,952 5,076,093 -4,487,141 5,665,045
8 Austria 206,264 255,622 -49,358 461,886
9 Bahamas 1,237 5 1,232 1,242
10 Bahrain 11,661 52,057 -40,396 63,718
11 Bangladesh 1,206,848 4,035,743 -2,828,895 5,242,591
12 Barbados 96 -96 96
13 Belarus 769 -769 769
14 Belgium 243,723 721,020 -477,297 964,743
15 Belize 2,744 -2,744 2,744
16 Benin 328 -328 328
17 Bhutan 152,615 464,984 -312,369 617,599
18 Bolivia 16,840 -16,840 16,840
19 Bosnia and Herzegovina 550 688 -138 1,238
20 Botswana 10 -10 10
21 Brazil 84,836 3,710,404 -3,625,568 3,795,240
22 British Indian Ocean Territory 5,388 -5,388 5,388
23 Brunei Darussalam 7,477 26,817 -19,340 34,294
24 Bulgaria 622 240,190 -239,568 240,812
25 Cambodia 12,004 -12,004 12,004
26 Cameroon 7,781 -7,781 7,781
27 Canada 906,025 6,824,626 -5,918,601 7,730,651
28 Cape Verde 804 -804 804
29 Cayman Islands 79 -79 79
30 Central African Republic 11 161 -150 172
31 Chad 3 -3 3
32 Chile 33,610 56,481 -22,871 90,091
33 China 1,719,467 116,116,215 -114,396,748 117,835,682
Table 13.2 : Exports, Imports and Trade Balance by Partner Countries: F.Y. 2015/16 (2072/73) Figures in '000 NPR
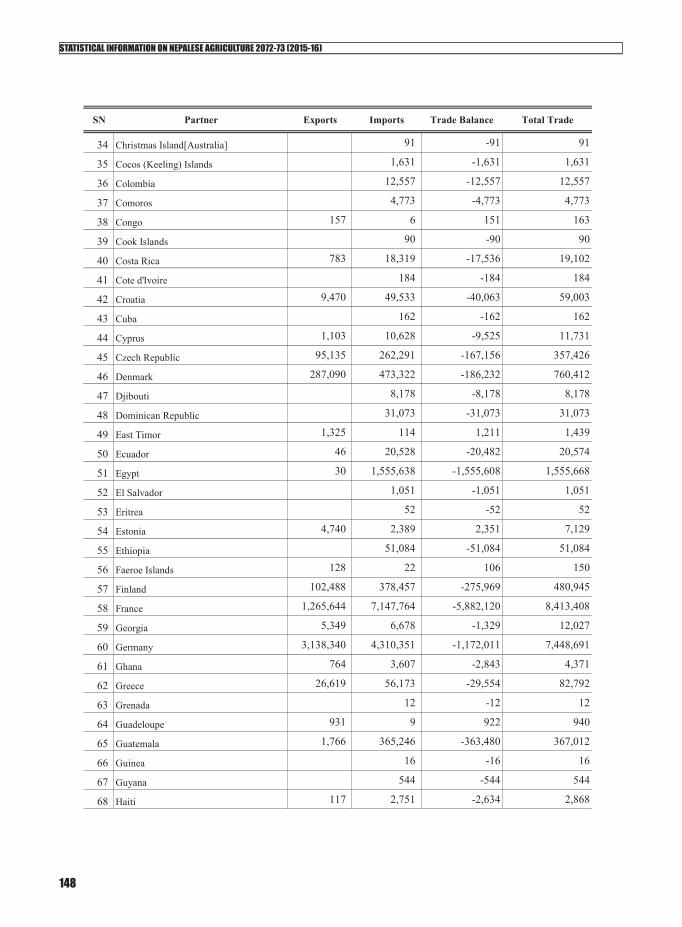
STATISTICAL INFORMATION ON NEPALESE AGRICULTURE 2072-73 (2015-16)
148
SN Partner Exports Imports Trade Balance Total Trade
34 Christmas Island[Australia] 91 -91 91
35 Cocos (Keeling) Islands 1,631 -1,631 1,631
36 Colombia 12,557 -12,557 12,557
37 Comoros 4,773 -4,773 4,773
38 Congo 157 6 151 163
39 Cook Islands 90 -90 90
40 Costa Rica 783 18,319 -17,536 19,102
41 Cote d'Ivoire 184 -184 184
42 Croatia 9,470 49,533 -40,063 59,003
43 Cuba 162 -162 162
44 Cyprus 1,103 10,628 -9,525 11,731
45 Czech Republic 95,135 262,291 -167,156 357,426
46 Denmark 287,090 473,322 -186,232 760,412
47 Djibouti 8,178 -8,178 8,178
48 Dominican Republic 31,073 -31,073 31,073
49 East Timor 1,325 114 1,211 1,439
50 Ecuador 46 20,528 -20,482 20,574
51 Egypt 30 1,555,638 -1,555,608 1,555,668
52 El Salvador 1,051 -1,051 1,051
53 Eritrea 52 -52 52
54 Estonia 4,740 2,389 2,351 7,129
55 Ethiopia 51,084 -51,084 51,084
56 Faeroe Islands 128 22 106 150
57 Finland 102,488 378,457 -275,969 480,945
58 France 1,265,644 7,147,764 -5,882,120 8,413,408
59 Georgia 5,349 6,678 -1,329 12,027
60 Germany 3,138,340 4,310,351 -1,172,011 7,448,691
61 Ghana 764 3,607 -2,843 4,371
62 Greece 26,619 56,173 -29,554 82,792
63 Grenada 12 -12 12
64 Guadeloupe 931 9 922 940
65 Guatemala 1,766 365,246 -363,480 367,012
66 Guinea 16 -16 16
67 Guyana 544 -544 544
68 Haiti 117 2,751 -2,634 2,868
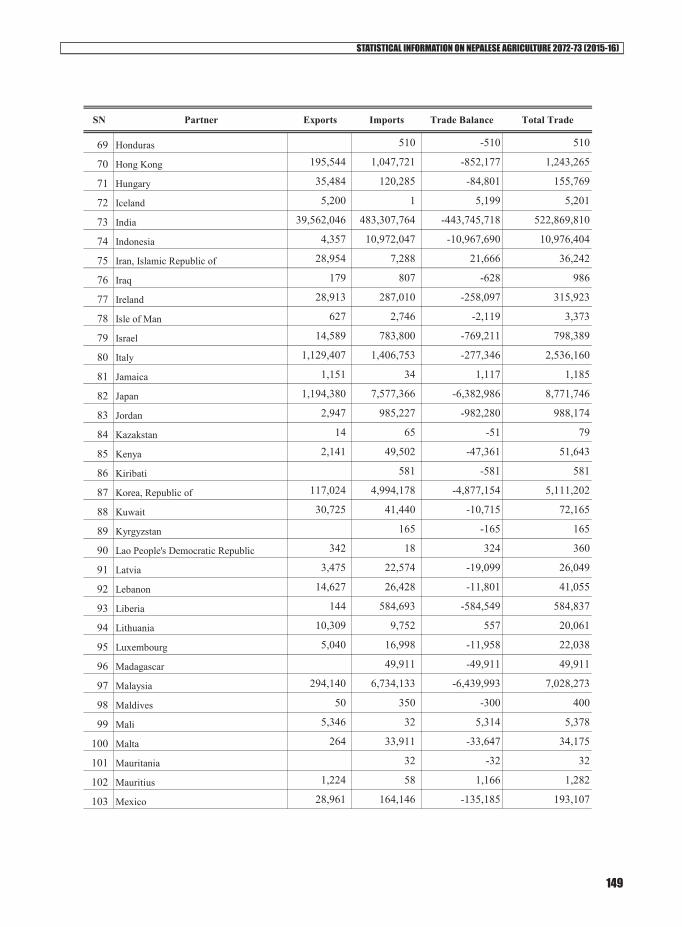
STATISTICAL INFORMATION ON NEPALESE AGRICULTURE 2072-73 (2015-16)
149
SN Partner Exports Imports Trade Balance Total Trade
69 Honduras 510 -510 510
70 Hong Kong 195,544 1,047,721 -852,177 1,243,265
71 Hungary 35,484 120,285 -84,801 155,769
72 Iceland 5,200 1 5,199 5,201
73 India 39,562,046 483,307,764 -443,745,718 522,869,810
74 Indonesia 4,357 10,972,047 -10,967,690 10,976,404
75 Iran, Islamic Republic of 28,954 7,288 21,666 36,242
76 Iraq 179 807 -628 986
77 Ireland 28,913 287,010 -258,097 315,923
78 Isle of Man 627 2,746 -2,119 3,373
79 Israel 14,589 783,800 -769,211 798,389
80 Italy 1,129,407 1,406,753 -277,346 2,536,160
81 Jamaica 1,151 34 1,117 1,185
82 Japan 1,194,380 7,577,366 -6,382,986 8,771,746
83 Jordan 2,947 985,227 -982,280 988,174
84 Kazakstan 14 65 -51 79
85 Kenya 2,141 49,502 -47,361 51,643
86 Kiribati 581 -581 581
87 Korea, Republic of 117,024 4,994,178 -4,877,154 5,111,202
88 Kuwait 30,725 41,440 -10,715 72,165
89 Kyrgyzstan 165 -165 165
90 Lao People's Democratic Republic 342 18 324 360
91 Latvia 3,475 22,574 -19,099 26,049
92 Lebanon 14,627 26,428 -11,801 41,055
93 Liberia 144 584,693 -584,549 584,837
94 Lithuania 10,309 9,752 557 20,061
95 Luxembourg 5,040 16,998 -11,958 22,038
96 Madagascar 49,911 -49,911 49,911
97 Malaysia 294,140 6,734,133 -6,439,993 7,028,273
98 Maldives 50 350 -300 400
99 Mali 5,346 32 5,314 5,378
100 Malta 264 33,911 -33,647 34,175
101 Mauritania 32 -32 32
102 Mauritius 1,224 58 1,166 1,282
103 Mexico 28,961 164,146 -135,185 193,107

STATISTICAL INFORMATION ON NEPALESE AGRICULTURE 2072-73 (2015-16)
150
SN Partner Exports Imports Trade Balance Total Trade
104 Midway Islands 108 -108 108
105 Monaco 4,976 517 4,459 5,493
106 Mongolia 3,479 2,863 616 6,342
107 Montserrat 90 -90 90
108 Morocco 5,415 12,459 -7,044 17,874
109 Mozambique 145,228 -145,228 145,228
110 Myanmar 589 1,643,866 -1,643,277 1,644,455
111 Namibia 3,334 10,529 -7,195 13,863
112 Netherlands 512,217 1,477,355 -965,138 1,989,572
113 New Caledonia 8,156 429 7,727 8,585
114 New Zealand 60,068 1,180,330 -1,120,262 1,240,398
115 Nicaragua 6,057 5,290 767 11,347
116 Niger 258 30,996 -30,738 31,254
117 Nigeria 175 3 172 178
118 Niue 85 -85 85
119 Norway 203,079 95,365 107,714 298,444
120 Oman 1,514 82,738 -81,224 84,252
121 Pakistan 43,490 269,668 -226,178 313,158
122 Panama 1,472 152 1,320 1,624
123 Paraguay 1,208 2,870,396 -2,869,188 2,871,604
124 Peru 947 104,652 -103,705 105,599
125 Philippines 16,282 329,347 -313,065 345,629
126 Pitcairn 27 -27 27
127 Poland 13,368 246,844 -233,476 260,212
128 Portugal 38,468 34,516 3,952 72,984
129 Puerto Rico 5,664 -5,664 5,664
130 Qatar 5,728 267,601 -261,873 273,329
131 Republic of Moldova 7 1 6 8
132 Romania 12,905 23,706 -10,801 36,611
133 Russian Federation 31,917 715,704 -683,787 747,621
134 Saint Helena 9,420 -9,420 9,420
135 Saint Lucia 99 -99 99
136 Saint Vincent and the Grenadines 2,524 -2,524 2,524
137 San Marino 7 -7 7
138 Sao Tome and Principe 23 -23 23

STATISTICAL INFORMATION ON NEPALESE AGRICULTURE 2072-73 (2015-16)
151
SN Partner Exports Imports Trade Balance Total Trade
139 Saudi Arabia 7,705 6,091,016 -6,083,311 6,098,721
140 Senegal 8 -8 8
141 Seychelles 42 -42 42
142 Sierra Leone 593 436 157 1,029
143 Singapore 164,084 3,823,247 -3,659,163 3,987,331
144 Slovakia 5,686 55,421 -49,735 61,107
145 Slovenia 24,555 13,508 11,047 38,063
146 Somalia 16 187 -171 203
147 South Africa 55,997 3,126,331 -3,070,334 3,182,328
148 Spain 354,883 770,009 -415,126 1,124,892
149 Sri Lanka 3,343 196,241 -192,898 199,584
150 Sudan 2,482 2,031 451 4,513
151 Suriname 4,876 -4,876 4,876
152 Sweden 107,544 1,116,189 -1,008,645 1,223,733
153 Switzerland 638,754 11,238,833 -10,600,079 11,877,587
154 Syrian Arab Republic 27 3 24 30
155 Taiwan, Province of China 91,994 2,902,974 -2,810,980 2,994,968
156 Thailand 120,610 10,120,147 -9,999,537 10,240,757
157 Togo 112 -112 112
158 Trinidad and Tobago 43 -43 43
159 Tunisia 29 1,678 -1,649 1,707
160 Turkey 2,135,396 3,616,051 -1,480,655 5,751,447
161 Uganda 1,262 1,805 -543 3,067
162 Ukraine 1,689 3,445,766 -3,444,077 3,447,455
163 United Arab Emirates 75,840 16,950,192 -16,874,352 17,026,032
164 United Kingdom 2,782,251 2,139,059 643,192 4,921,310
165 United Republic of Tanzania 587 48,138 -47,551 48,725
166 United States 9,208,090 8,590,118 617,972 17,798,208
167 Uruguay 6,795 412,954 -406,159 419,749
168 Venezuela 11,479 3 11,476 11,482
169 Viet Nam 428,138 6,125,291 -5,697,153 6,553,429
170 Yugoslavia 2,212 -2,212 2,212
171 Zambia 5 10 -5 15
172 Zimbabwe 79 -79 79
173 Algeria 11 11 11
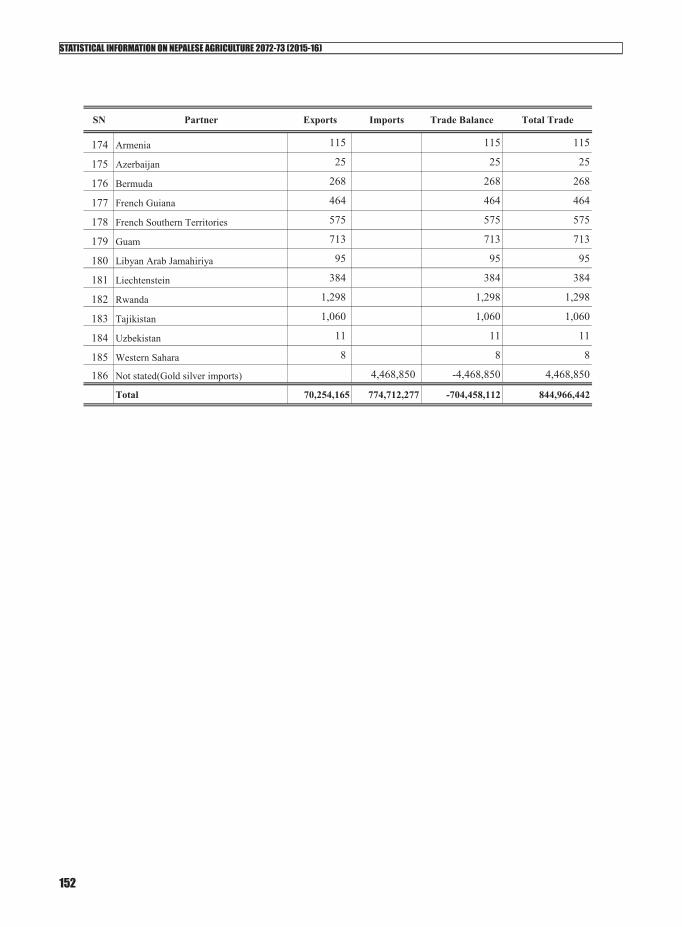
STATISTICAL INFORMATION ON NEPALESE AGRICULTURE 2072-73 (2015-16)
152
SN Partner Exports Imports Trade Balance Total Trade
174 Armenia 115 115 115
175 Azerbaijan 25 25 25
176 Bermuda 268 268 268
177 French Guiana 464 464 464
178 French Southern Territories 575 575 575
179 Guam 713 713 713
180 Libyan Arab Jamahiriya 95 95 95
181 Liechtenstein 384 384 384
182 Rwanda 1,298 1,298 1,298
183 Tajikistan 1,060 1,060 1,060
184 Uzbekistan 11 11 11
185 Western Sahara 8 8 8
186 Not stated(Gold silver imports) 4,468,850 -4,468,850 4,468,850
Total 70,254,165 774,712,277 -704,458,112 844,966,442

STATISTICAL INFORMATION ON NEPALESE AGRICULTURE 2072-73 (2015-16)
153
SN HS Code Description Partner Unit Quantity Value1 01012100 Purebred breeding animals Horse _ Andorra Pcs 20 3 2 01012100 Purebred breeding animals Horse _ India Pcs 1,403 77 3 01012900 Other horses_ India Pcs 23 206
4 01019000 Other than purebred breeding animals,Khacch_ r,hinnies India Pcs 875 7,717
5 01022900 Other cattle Live bovine animals _ India Pcs 9 154 6 01023100 Purebred breeding animals (buffalo) _ India Pcs 8 43 7 01023900 Other buffalo Live bovine animals _ India Pcs 7,198 38,767
8 01029000 Live bovine animals, other than pure-bred _ reeding India Pcs 240,010 316,693
9 01031000 Live pure-bred breeding swine _ India Pcs 313 565
10 01039100 Live swine weighing <50kg (excl pure-bred_ breeding) India Pcs 161 262
11 01039200 Live swine weighing >=50kg (excl pure-bre_ d breeding) India Pcs 1,404 1,372
12 01042000 Live goats _ Australia Pcs 163 34,889 13 01042000 Live goats _ India Pcs 479,134 2,648,541
14 01051100 Live fowls of species gallus domesticus, w_ eighing =<185g ( Malaysia Pcs 3,588 1,632
15 01051100 Live fowls of species gallus domesticus, w_ eighing =<185g ( Sri Lanka Pcs 2,142 995
16 01061900 Other; live mammals _ Thailand Pcs 5 118 17 01069000 Other live animals _ India Pcs 1 14 18 02013000 Fresh or chilled boneless bovine meat _ India Kg. 25,300 4,000 19 02023000 Frozen boneless bovine meat _ India Kg. 38,630 5,827
20 02031200 Fresh or chilled with bone hams, shoulders_ and cuts thereo Italy Kg. 26 103
21 02031900 Fresh or chilled swine meat, nes (unboned)_ China Kg. 100 35
22 02031900 Fresh or chilled swine meat, nes (unboned)_ Australia Kg. 423 908
23 02032900 Frozen swine meat, nes _ Thailand Kg. 24,543 13,289 24 02032900 Frozen swine meat, nes _ Denmark Kg. 10,102 4,243 25 02042200 Fresh or chilled unboned meat of sheep _ Australia Kg. 150 595
26 02043000 Frozen lamb carcasses and half carcasses _ Australia Kg. 4,053 4,488
27 02044200 Frozen with bone meat of sheep _ Australia Kg. 12,607 6,562 28 02044300 Frozen bonless meat of sheep _ Italy Kg. 8 10 29 02045000 Fresh, chilled or frozen goat meat _ India Kg. 275 99
30 02050000 Meat of horses, asses, mules or hinnies, f_ resh, chilled or France Kg. 135 397
31 02062200 Frozen bovine livers _ Korea, Republic of Kg. 5 3 32 02071100 Fresh or chilled whole chickens _ Germany Kg. 135 136 33 02071400 Frozen cuts and offal of chicken _ Thailand Kg. 97,596 55,333 34 02074200 Meat of Ducks Not cut in pieces, frozen _ Thailand Kg. 3,652 2,195 35 02074500 Other meat of ducks, frozen _ Malaysia Kg. 140 196 36 02074500 Other meat of ducks, frozen _ Thailand Kg. 1,714 1,645 37 02091000 Meat Of pigs _ China Kg. 408 77
38 02101100 Unboned swine hams, shoulders and cuts the_ reof, salted Italy Kg. 56 399
39 02101100 Unboned swine hams, shoulders and cuts the_ reof, salted Australia Kg. 51 55
40 02101200 Bellies and cuts thereof of swine, salted_ or smoked Italy Kg. 6 20
41 02101900 Other meat of swine, salted or smoked, _ nes France Kg. 234 499
42 02101900 Other meat of swine, salted or smoked, _ nes Italy Kg. 22 129
43 03011100 Freshwater fish _ India Kg. 1,209,188 22,892 44 03011900 Other fish _ India Kg. 590,593 61,640 45 03011900 Other fish _ Australia Kg. 8 3
Table 13.3 : Imports of Selected Commodities by Partner Countries : F.Y.2015/16 (2072/73) Figures in '000 NPR

STATISTICAL INFORMATION ON NEPALESE AGRICULTURE 2072-73 (2015-16)
154
SN HS Code Description Partner Unit Quantity Value46 03019900 Other live fish _ India Kg. 3,630,060 397,828
47 03021300 Pacific salmon (Oncorhynchus nerka, Oncor_ ynchus gorbusch Thailand Kg. 1,000 411
48 03021400 Atlantic salmon (Salmo salar) and Danube _ almon (Hucho hu Thailand Kg. 500 438
49 03021900 Fresh or chilled salmonidae (excl 030211_ and 030212) India Kg. 1,374,142 151,692
50 03022300 Fresh or chilled sole _ Thailand Kg. 10 16
51 03022900 Fresh or chilled flat fish (excl halibut,_ plaice and sole Thailand Kg. 1,008 915
52 03023900 Other fresh or chilled tunas _ Thailand Kg. 19 13
53 03025100 Cod (Gadus morhua, Gadus ogac, Gadus macroc_ phalus) Thailand Kg. 100 330
54 03025900 Other fish fresh or chilledexcluding fish f_ llets & other f India Kg. 22,508 2,467
55 03031200 Other Pacific salmon (Oncorhynchus gorbusch_ , Oncorhynchus Thailand Kg. 452 322
56 03031400 Trout (Salmo trutta, Oncorhynchus mykiss,On_ orhynchus clark Chile Kg. 98 206
57 03031400 Trout (Salmo trutta, Oncorhynchus mykiss,On_ orhynchus clark Thailand Kg. 699 1,176
58 03031900 Others Tilapias (Oreochromis spp), catfish _ Pangasius spp, Thailand Kg. 330 190
59 03032400 Catfish (Pangasius spp, Silurus spp, Claria_ spp, Ictalurus Viet Nam Kg. 2,410 464
60 03032900 Frozen salmonidae (excl pacific, atlantic_ , danube salmon Norway Kg. 2,050 2,105
61 03033900 Frozen flat fish (excl halibut, plaice an d_ sole) Thailand Kg. 100 53
62 03034900 Other frozen tunas _ Thailand Kg. 30 36 63 03043900 Other fish meat fresh & chilled or frozen _ India Kg. 3,000 368 64 03043900 Other fish meat fresh & chilled or frozen _ Thailand Kg. 1,170 441 65 03045900 Other fish meat fresh or chilled ?? _ Viet Nam Kg. 85,320 17,775 66 03045900 Other fish meat fresh or chilled ?? _ India Kg. 36,738 4,065
67 03046200 Catfish (Pangasius spp, Silurus spp, Claria_ spp, Ictalurus Viet Nam Kg. 296,890 54,989
68 03047900 Other fozen fillets of fish _ India Kg. 1,008 271 69 03048900 Other fozen fillets of other fish _ Thailand Kg. 21 16 70 03049900 Other frozen fish meat??????????? _ India Kg. 34,000 6,414
71 03051000 Flours meals and pellets of fish,fit for h_ uman consumption Bahrain Kg. 1,856 437
72 03051000 Flours meals and pellets of fish,fit for h_ uman consumption China Kg. 2,178 413
73 03051000 Flours meals and pellets of fish,fit for h_ uman consumption Thailand Kg. 30 3
74 03051000 Flours meals and pellets of fish,fit for h_ uman consumption Korea, Republic of Kg. 3 4
75 03052000 Livers and roes, dried, smoked, salted or in brine Singapore Kg. 5 2
76 03052000 Livers and roes, dried, smoked, salted or _ in brine Denmark Kg. 10 141
77 03053900 Other fish fillets dried,salted or in brine_ but not smoked China Kg. 2 1
78 03053900 Other fish fillets dried,salted or in brine_ but not smoked India Kg. 2,000 448
79 03054100 Pacific salmon (Oncorhynchus nerka, Oncorhy_ chus gorbuscha, Norway Kg. 200 813
80 03054900 Smoked fish (excl salmon and herrings) _ Chile Kg. 50 139 81 03054900 Smoked fish (excl salmon and herrings) _ India Kg. 516 54 82 03054900 Smoked fish (excl salmon and herrings) _ Singapore Kg. 280 1,119 83 03054900 Smoked fish (excl salmon and herrings) _ Norway Kg. 50 185 84 03055900 Other dried fish, not smoked (excl cod) _ Hong Kong Kg. 600 188 85 03055900 Other dried fish, not smoked (excl cod) _ India Kg. 474,477 85,082 86 03055900 Other dried fish, not smoked (excl cod) _ Viet Nam Kg. 600 264 87 03055900 Other dried fish, not smoked (excl cod) _ Singapore Kg. 652 175 88 03055900 Other dried fish, not smoked (excl cod) _ Germany Kg. 15 34 89 03055900 Other dried fish, not smoked (excl cod) _ Thailand Kg. 2,400 770
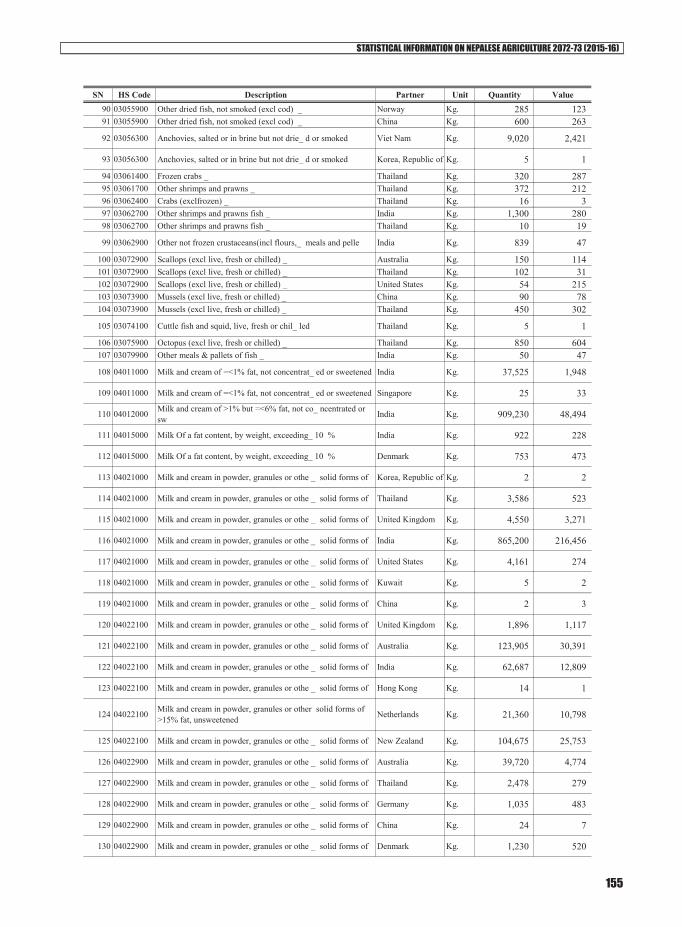
STATISTICAL INFORMATION ON NEPALESE AGRICULTURE 2072-73 (2015-16)
155
SN HS Code Description Partner Unit Quantity Value90 03055900 Other dried fish, not smoked (excl cod) _ Norway Kg. 285 123 91 03055900 Other dried fish, not smoked (excl cod) _ China Kg. 600 263
92 03056300 Anchovies, salted or in brine but not drie_ d or smoked Viet Nam Kg. 9,020 2,421
93 03056300 Anchovies, salted or in brine but not drie_ d or smoked Korea, Republic of Kg. 5 1
94 03061400 Frozen crabs _ Thailand Kg. 320 287 95 03061700 Other shrimps and prawns _ Thailand Kg. 372 212 96 03062400 Crabs (exclfrozen) _ Thailand Kg. 16 3 97 03062700 Other shrimps and prawns fish _ India Kg. 1,300 280 98 03062700 Other shrimps and prawns fish _ Thailand Kg. 10 19
99 03062900 Other not frozen crustaceans(incl flours,_ meals and pelle India Kg. 839 47
100 03072900 Scallops (excl live, fresh or chilled) _ Australia Kg. 150 114 101 03072900 Scallops (excl live, fresh or chilled) _ Thailand Kg. 102 31 102 03072900 Scallops (excl live, fresh or chilled) _ United States Kg. 54 215 103 03073900 Mussels (excl live, fresh or chilled) _ China Kg. 90 78 104 03073900 Mussels (excl live, fresh or chilled) _ Thailand Kg. 450 302
105 03074100 Cuttle fish and squid, live, fresh or chil_ led Thailand Kg. 5 1
106 03075900 Octopus (excl live, fresh or chilled) _ Thailand Kg. 850 604 107 03079900 Other meals & pallets of fish _ India Kg. 50 47
108 04011000 Milk and cream of =<1% fat, not concentrat_ ed or sweetened India Kg. 37,525 1,948
109 04011000 Milk and cream of =<1% fat, not concentrat_ ed or sweetened Singapore Kg. 25 33
110 04012000 Milk and cream of >1% but =<6% fat, not co_ ncentrated or sw India Kg. 909,230 48,494
111 04015000 Milk Of a fat content, by weight, exceeding_ 10 % India Kg. 922 228
112 04015000 Milk Of a fat content, by weight, exceeding_ 10 % Denmark Kg. 753 473
113 04021000 Milk and cream in powder, granules or othe _ solid forms of Korea, Republic of Kg. 2 2
114 04021000 Milk and cream in powder, granules or othe _ solid forms of Thailand Kg. 3,586 523
115 04021000 Milk and cream in powder, granules or othe _ solid forms of United Kingdom Kg. 4,550 3,271
116 04021000 Milk and cream in powder, granules or othe _ solid forms of India Kg. 865,200 216,456
117 04021000 Milk and cream in powder, granules or othe _ solid forms of United States Kg. 4,161 274
118 04021000 Milk and cream in powder, granules or othe _ solid forms of Kuwait Kg. 5 2
119 04021000 Milk and cream in powder, granules or othe _ solid forms of China Kg. 2 3
120 04022100 Milk and cream in powder, granules or othe _ solid forms of United Kingdom Kg. 1,896 1,117
121 04022100 Milk and cream in powder, granules or othe _ solid forms of Australia Kg. 123,905 30,391
122 04022100 Milk and cream in powder, granules or othe _ solid forms of India Kg. 62,687 12,809
123 04022100 Milk and cream in powder, granules or othe _ solid forms of Hong Kong Kg. 14 1
124 04022100 Milk and cream in powder, granules or other solid forms of >15% fat, unsweetened Netherlands Kg. 21,360 10,798
125 04022100 Milk and cream in powder, granules or othe _ solid forms of New Zealand Kg. 104,675 25,753
126 04022900 Milk and cream in powder, granules or othe _ solid forms of Australia Kg. 39,720 4,774
127 04022900 Milk and cream in powder, granules or othe _ solid forms of Thailand Kg. 2,478 279
128 04022900 Milk and cream in powder, granules or othe _ solid forms of Germany Kg. 1,035 483
129 04022900 Milk and cream in powder, granules or othe _ solid forms of China Kg. 24 7
130 04022900 Milk and cream in powder, granules or othe _ solid forms of Denmark Kg. 1,230 520
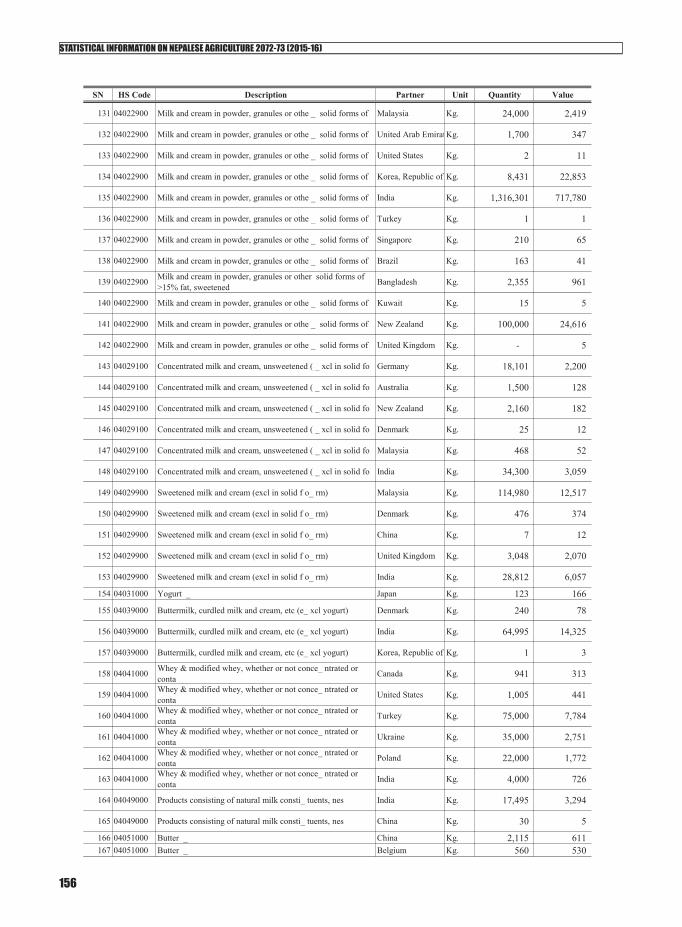
STATISTICAL INFORMATION ON NEPALESE AGRICULTURE 2072-73 (2015-16)
156
SN HS Code Description Partner Unit Quantity Value
131 04022900 Milk and cream in powder, granules or othe _ solid forms of Malaysia Kg. 24,000 2,419
132 04022900 Milk and cream in powder, granules or othe _ solid forms of United Arab EmiratKg. 1,700 347
133 04022900 Milk and cream in powder, granules or othe _ solid forms of United States Kg. 2 11
134 04022900 Milk and cream in powder, granules or othe _ solid forms of Korea, Republic of Kg. 8,431 22,853
135 04022900 Milk and cream in powder, granules or othe _ solid forms of India Kg. 1,316,301 717,780
136 04022900 Milk and cream in powder, granules or othe _ solid forms of Turkey Kg. 1 1
137 04022900 Milk and cream in powder, granules or othe _ solid forms of Singapore Kg. 210 65
138 04022900 Milk and cream in powder, granules or othe _ solid forms of Brazil Kg. 163 41
139 04022900 Milk and cream in powder, granules or other solid forms of >15% fat, sweetened Bangladesh Kg. 2,355 961
140 04022900 Milk and cream in powder, granules or othe _ solid forms of Kuwait Kg. 15 5
141 04022900 Milk and cream in powder, granules or othe _ solid forms of New Zealand Kg. 100,000 24,616
142 04022900 Milk and cream in powder, granules or othe _ solid forms of United Kingdom Kg. - 5
143 04029100 Concentrated milk and cream, unsweetened ( _ xcl in solid fo Germany Kg. 18,101 2,200
144 04029100 Concentrated milk and cream, unsweetened ( _ xcl in solid fo Australia Kg. 1,500 128
145 04029100 Concentrated milk and cream, unsweetened ( _ xcl in solid fo New Zealand Kg. 2,160 182
146 04029100 Concentrated milk and cream, unsweetened ( _ xcl in solid fo Denmark Kg. 25 12
147 04029100 Concentrated milk and cream, unsweetened ( _ xcl in solid fo Malaysia Kg. 468 52
148 04029100 Concentrated milk and cream, unsweetened ( _ xcl in solid fo India Kg. 34,300 3,059
149 04029900 Sweetened milk and cream (excl in solid f o_ rm) Malaysia Kg. 114,980 12,517
150 04029900 Sweetened milk and cream (excl in solid f o_ rm) Denmark Kg. 476 374
151 04029900 Sweetened milk and cream (excl in solid f o_ rm) China Kg. 7 12
152 04029900 Sweetened milk and cream (excl in solid f o_ rm) United Kingdom Kg. 3,048 2,070
153 04029900 Sweetened milk and cream (excl in solid f o_ rm) India Kg. 28,812 6,057
154 04031000 Yogurt _ Japan Kg. 123 166
155 04039000 Buttermilk, curdled milk and cream, etc (e_ xcl yogurt) Denmark Kg. 240 78
156 04039000 Buttermilk, curdled milk and cream, etc (e_ xcl yogurt) India Kg. 64,995 14,325
157 04039000 Buttermilk, curdled milk and cream, etc (e_ xcl yogurt) Korea, Republic of Kg. 1 3
158 04041000 Whey & modified whey, whether or not conce_ ntrated or conta Canada Kg. 941 313
159 04041000 Whey & modified whey, whether or not conce_ ntrated or conta United States Kg. 1,005 441
160 04041000 Whey & modified whey, whether or not conce_ ntrated or conta Turkey Kg. 75,000 7,784
161 04041000 Whey & modified whey, whether or not conce_ ntrated or conta Ukraine Kg. 35,000 2,751
162 04041000 Whey & modified whey, whether or not conce_ ntrated or conta Poland Kg. 22,000 1,772
163 04041000 Whey & modified whey, whether or not conce_ ntrated or conta India Kg. 4,000 726
164 04049000 Products consisting of natural milk consti_ tuents, nes India Kg. 17,495 3,294
165 04049000 Products consisting of natural milk consti_ tuents, nes China Kg. 30 5
166 04051000 Butter _ China Kg. 2,115 611 167 04051000 Butter _ Belgium Kg. 560 530

STATISTICAL INFORMATION ON NEPALESE AGRICULTURE 2072-73 (2015-16)
157
SN HS Code Description Partner Unit Quantity Value168 04051000 Butter _ Denmark Kg. 576 584 169 04051000 Butter _ New Zealand Kg. 50,600 16,359 170 04051000 Butter _ India Kg. 202,596 84,945 171 04051000 Butter _ Thailand Kg. 47 10 172 04052000 Dairy spreads _ Italy Kg. 10 8 173 04052000 Dairy spreads _ India Kg. 1,536 326 174 04052000 Dairy spreads _ Taiwan, Province o Kg. 10 29
175 04059000 Other fats and oils derived from milk (exc_ l butter and da Germany Kg. 60 68
176 04059000 Other fats and oils derived from milk (exc_ l butter and da India Kg. 252,687 109,548
177 04059000 Other fats and oils derived from milk (exc_ l butter and da Thailand Kg. 2,162 217
178 04059000 Other fats and oils derived from milk (exc_ l butter and da United Kingdom Kg. 34 12
179 04061000 Fresh (unripened or uncured)cheese, includ_ ing whey cheese Denmark Kg. 270 288
180 04061000 Fresh (unripened or uncured)cheese, includ_ ing whey cheese Egypt Kg. 333 173
181 04061000 Fresh (unripened or uncured)cheese, includ_ ing whey cheese Germany Kg. 240 169
182 04061000 Fresh (unripened or uncured)cheese, includ_ ing whey cheese India Kg. 2,557 1,519
183 04062000 Grated or powdered cheese, of all kinds _ Thailand Kg. 1,330 1,746 184 04062000 Grated or powdered cheese, of all kinds _ Denmark Kg. 6,405 5,601 185 04062000 Grated or powdered cheese, of all kinds _ Singapore Kg. 21,100 11,041
186 04063000 Processed cheese, not grated or powdered _ Austria Kg. 72 146
187 04063000 Processed cheese, not grated or powdered _ Denmark Kg. 5,170 3,310
188 04063000 Processed cheese, not grated or powdered _ Poland Kg. 6,215 3,918
189 04063000 Processed cheese, not grated or powdered _ Thailand Kg. 12 6
190 04064000 Blueveined cheese and other chese containi_ ng veins produce Denmark Kg. 20 37
191 04064000 Blueveined cheese and other chese containi_ ng veins produce Italy Kg. 24 93
192 04069000 Cheese, nes _ Bahrain Kg. 104 66 193 04069000 Cheese, nes _ Austria Kg. 6,411 3,905 194 04069000 Cheese, nes _ Singapore Kg. 5,680 3,062 195 04069000 Cheese, nes _ Netherlands Kg. 258 88 196 04069000 Cheese, nes _ Germany Kg. 323 433 197 04069000 Cheese, nes _ India Kg. 77,911 39,281 198 04069000 Cheese, nes _ Korea, Republic of Kg. 4 2 199 04069000 Cheese, nes _ Italy Kg. 1,674 3,502 200 04069000 Cheese, nes _ United Arab EmiratKg. 266 52 201 04069000 Cheese, nes _ United Kingdom Kg. 432 485 202 04069000 Cheese, nes _ China Kg. 11,398 2,082 203 04069000 Cheese, nes _ Australia Kg. 2,895 2,649 204 04069000 Cheese, nes _ France Kg. 1,709 1,106 205 04069000 Cheese, nes _ Egypt Kg. 158 78 206 04069000 Cheese, nes _ Denmark Kg. 54 78 207 04072900 Other fresh eggs _ China Pcs 360 3 208 04089900 Birds' eggs, not in shell (excl dried) _ Germany Kg. 30 36 209 04090000 Processed natural honey _ China Kg. 96 4 210 04090000 Processed natural honey _ India Kg. 371,066 100,051 211 04090000 Processed natural honey _ United Kingdom Kg. 153 6 212 04090090 Processed natural honey _ India Kg. 24,602 7,571 213 04100000 Edible products of animal origin, nes _ Bulgaria Kg. 49 589 214 05010000 Human hair and waste, unworked _ Thailand Kg. 4 1
215 05021000 Pigs', hogs', or boars' bristles or hair a_ nd waste there o India Kg. 42 12
216 05040000 Fresh,chilled,frozen,salted,dried,Guts,_ bladders and st India Kg. 383 108

STATISTICAL INFORMATION ON NEPALESE AGRICULTURE 2072-73 (2015-16)
158
SN HS Code Description Partner Unit Quantity Value217 05051000 Raw feathers for stuffing; down _ China Kg. 6,351 5,871 218 05051000 Raw feathers for stuffing; down _ Thailand Kg. 26 3
219 05059000 Skins and parts of birds (excl feathers f_ or stuffing; dow China Kg. 700 535
220 05061000 Ossein and bones treated with acid _ India Kg. 1,555 32 221 05069000 Bones and horn-cores (excl ossein) _ Italy Kg. 390,400 15,564 222 05069000 Bones and horn-cores (excl ossein) _ India Kg. 1,151,592 61,077 223 05069000 Bones and horn-cores (excl ossein) _ Germany Kg. 92,020 4,224 224 05071000 Ivory, its powder and waste, unworked _ India Kg. 450 10 225 05071000 Ivory, its powder and waste, unworked _ Thailand Kg. 10 1
226 05079000 Tortoise-shell, whalebone and whalebone-ha_ ir, etc, unworke India Kg. 15 2
227 05080000 Coral; shells of molluscs, crustaceans or _ echinoderms and India Kg. 480,518 21,328
228 05080000 Coral; shells of molluscs, crustaceans or _ echinoderms and United States Kg. 6 30
229 05080000 Coral; shells of molluscs, crustaceans or _ echinoderms and Morocco Kg. 4 43
230 05100000 Ambergris, castoreum, civet and musk; cant_ harides; etc China Kg. 10 97
231 05111000 Bovine semen and embryo_ Denmark Kg. 45 13,127
232 05119100 Products of fish or crustaceans, molluses,_ etc; dead anima India Kg. 1,574,615 33,017
233 05119990 Other animal products of chapter 2,3 nes, _ unfit for human Bangladesh Kg. 12 13
234 05119990 Other animal products of chapter 2,3 nes, _ unfit for human India Kg. 123 34
235 05119990 Other animal products of chapter 2,3 nes, _ unfit for human China Kg. 6,540 889
236 06011000 Bulbs, tubers, tuberous roots, corms, crow_ ns & rhizomes, d China Pcs 350 12
237 06011000 Bulbs, tubers, tuberous roots, corms, crow_ ns & rhizomes, d Thailand Pcs 84 127
238 06011000 Bulbs, tubers, tuberous roots, corms, crow_ ns & rhizomes, d Netherlands Pcs 90,100 1,495
239 06011000 Bulbs, tubers, tuberous roots, corms, crow_ ns & rhizomes, d Israel Pcs 63,000 453
240 06011000 Bulbs, tubers, tuberous roots, corms, crow_ ns & rhizomes, d India Pcs 9,550 95
241 06012000 Bulbs, tubers, rhizomes in growth or in_ flower; chicory Netherlands Pcs 9,744 644
242 06021000 Unrooted cuttings and slips _ India Pcs 5,580 43
243 06022000 Trees, shrubs and bushes, grafted or not, _ of kind which be Denmark Pcs 200 418
244 06022000 Trees, shrubs and bushes, grafted or not, _ of kind which be India Pcs 167,178 1,042
245 06022000 Trees, shrubs and bushes, grafted or not, _ of kind which be Finland Pcs 50 24
246 06022000 Trees, shrubs and bushes, grafted or not, _ of kind which be Poland Pcs 100 388
247 06022000 Trees, shrubs and bushes, grafted or not, _ of kind which be Italy Pcs 5,000 2,821
248 06022000 Trees, shrubs and bushes, grafted or not, _ of kind which be Switzerland Pcs 8,584 3,679
249 06022000 Trees, shrubs and bushes, grafted or not, _ of kind which be Netherlands Pcs 50 185
250 06024000 Roses _ India Pcs 1,880 34 251 06029000 Other live plants,nes _ Italy Pcs 91,529 1,590 252 06029000 Other live plants,nes _ United Kingdom Pcs 180 264 253 06029000 Other live plants,nes _ France Pcs 150 181 254 06029000 Other live plants,nes _ Taiwan, Province o Pcs 700 514 255 06029000 Other live plants,nes _ United States Pcs 3,520 1,228 256 06029000 Other live plants,nes _ Belgium Pcs 14 101 257 06029000 Other live plants,nes _ Spain Pcs 9,000 282 258 06029000 Other live plants,nes _ Netherlands Pcs 4,017 438 259 06029000 Other live plants,nes _ India Pcs 811,540 27,530 260 06029000 Other live plants,nes _ Thailand Pcs 5,184 479
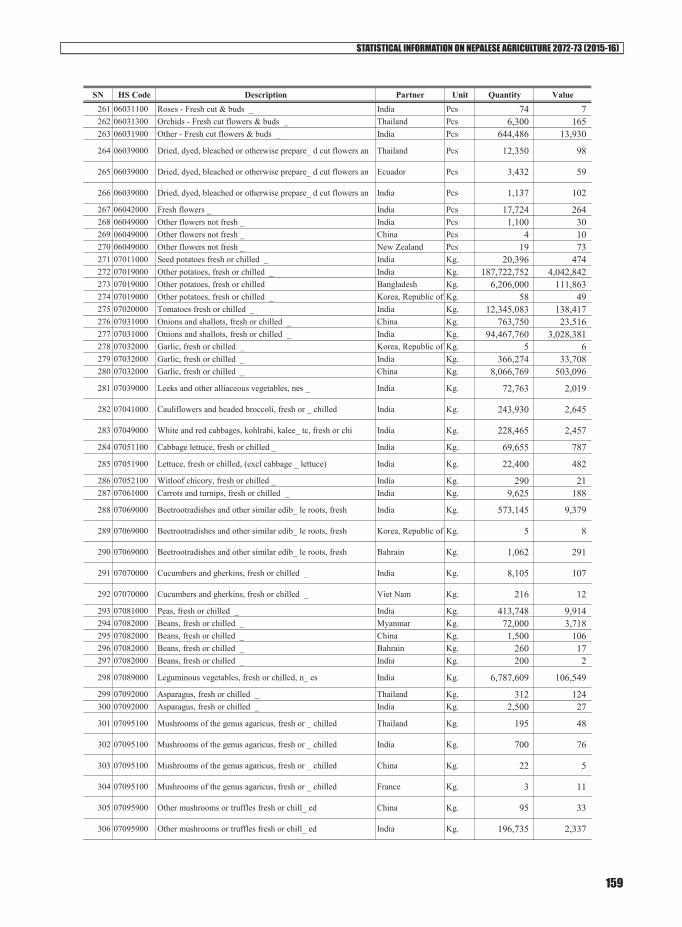
STATISTICAL INFORMATION ON NEPALESE AGRICULTURE 2072-73 (2015-16)
159
SN HS Code Description Partner Unit Quantity Value261 06031100 Roses - Fresh cut & buds _ India Pcs 74 7 262 06031300 Orchids - Fresh cut flowers & buds _ Thailand Pcs 6,300 165 263 06031900 Other - Fresh cut flowers & buds _ India Pcs 644,486 13,930
264 06039000 Dried, dyed, bleached or otherwise prepare_ d cut flowers an Thailand Pcs 12,350 98
265 06039000 Dried, dyed, bleached or otherwise prepare_ d cut flowers an Ecuador Pcs 3,432 59
266 06039000 Dried, dyed, bleached or otherwise prepare_ d cut flowers an India Pcs 1,137 102
267 06042000 Fresh flowers _ India Pcs 17,724 264 268 06049000 Other flowers not fresh _ India Pcs 1,100 30 269 06049000 Other flowers not fresh _ China Pcs 4 10 270 06049000 Other flowers not fresh _ New Zealand Pcs 19 73 271 07011000 Seed potatoes fresh or chilled _ India Kg. 20,396 474 272 07019000 Other potatoes, fresh or chilled _ India Kg. 187,722,752 4,042,842 273 07019000 Other potatoes, fresh or chilled Bangladesh Kg. 6,206,000 111,863 274 07019000 Other potatoes, fresh or chilled _ Korea, Republic of Kg. 58 49 275 07020000 Tomatoes fresh or chilled _ India Kg. 12,345,083 138,417 276 07031000 Onions and shallots, fresh or chilled _ China Kg. 763,750 23,516 277 07031000 Onions and shallots, fresh or chilled _ India Kg. 94,467,760 3,028,381 278 07032000 Garlic, fresh or chilled _ Korea, Republic of Kg. 5 6 279 07032000 Garlic, fresh or chilled _ India Kg. 366,274 33,708 280 07032000 Garlic, fresh or chilled _ China Kg. 8,066,769 503,096
281 07039000 Leeks and other alliaceous vegetables, nes _ India Kg. 72,763 2,019
282 07041000 Cauliflowers and headed broccoli, fresh or _ chilled India Kg. 243,930 2,645
283 07049000 White and red cabbages, kohlrabi, kalee_ tc, fresh or chi India Kg. 228,465 2,457
284 07051100 Cabbage lettuce, fresh or chilled _ India Kg. 69,655 787
285 07051900 Lettuce, fresh or chilled, (excl cabbage _ lettuce) India Kg. 22,400 482
286 07052100 Witloof chicory, fresh or chilled _ India Kg. 290 21 287 07061000 Carrots and turnips, fresh or chilled _ India Kg. 9,625 188
288 07069000 Beetrootradishes and other similar edib_ le roots, fresh India Kg. 573,145 9,379
289 07069000 Beetrootradishes and other similar edib_ le roots, fresh Korea, Republic of Kg. 5 8
290 07069000 Beetrootradishes and other similar edib_ le roots, fresh Bahrain Kg. 1,062 291
291 07070000 Cucumbers and gherkins, fresh or chilled _ India Kg. 8,105 107
292 07070000 Cucumbers and gherkins, fresh or chilled _ Viet Nam Kg. 216 12
293 07081000 Peas, fresh or chilled _ India Kg. 413,748 9,914 294 07082000 Beans, fresh or chilled _ Myanmar Kg. 72,000 3,718 295 07082000 Beans, fresh or chilled _ China Kg. 1,500 106 296 07082000 Beans, fresh or chilled _ Bahrain Kg. 260 17 297 07082000 Beans, fresh or chilled _ India Kg. 200 2
298 07089000 Leguminous vegetables, fresh or chilled, n_ es India Kg. 6,787,609 106,549
299 07092000 Asparagus, fresh or chilled _ Thailand Kg. 312 124 300 07092000 Asparagus, fresh or chilled _ India Kg. 2,500 27
301 07095100 Mushrooms of the genus agaricus, fresh or _ chilled Thailand Kg. 195 48
302 07095100 Mushrooms of the genus agaricus, fresh or _ chilled India Kg. 700 76
303 07095100 Mushrooms of the genus agaricus, fresh or _ chilled China Kg. 22 5
304 07095100 Mushrooms of the genus agaricus, fresh or _ chilled France Kg. 3 11
305 07095900 Other mushrooms or truffles fresh or chill_ ed China Kg. 95 33
306 07095900 Other mushrooms or truffles fresh or chill_ ed India Kg. 196,735 2,337

STATISTICAL INFORMATION ON NEPALESE AGRICULTURE 2072-73 (2015-16)
160
SN HS Code Description Partner Unit Quantity Value
307 07096000 Fruits of genus capiscum or pimenta, fresh _ or chilled India Kg. 1,152,341 14,072
308 07097000 Spinach, fresh or chilled _ India Kg. 2,897 34 309 07099100 Globe artichokes _ India Kg. 20 4
310 07099300 Pumpkins, squash and gourds (Cucurbita spp)_ India Kg. 99,975 1,080
311 07099900 Other fresh or chilled vegetables _ India Kg. 11,662,543 131,028 312 07101000 Potatoes, frozen _ India Kg. 25,149,186 549,472 313 07102100 Shelled or unshelled peas, frozen _ India Kg. 175,915 11,732 314 07102100 Shelled or unshelled peas, frozen _ Canada Kg. 132,500 5,679
315 07102900 Leguminous vegetables, shelled or unshelle_ d, frozen, nes India Kg. 7,601 97
316 07104000 Sweet corn, frozen _ Belgium Kg. 583 180 317 07104000 Sweet corn, frozen _ Thailand Kg. 140 49 318 07104000 Sweet corn, frozen _ Poland Kg. 227 75 319 07104000 Sweet corn, frozen _ India Kg. 29,390 1,471 320 07108000 Other Vegetables, frozen, nes _ Italy Kg. 240 13 321 07108000 Other Vegetables, frozen, nes _ India Kg. 8,513,280 93,568 322 07108000 Other Vegetables, frozen, nes _ Spain Kg. 240 13 323 07108000 Other Vegetables, frozen, nes _ Belgium Kg. 146 52 324 07108000 Other Vegetables, frozen, nes _ United Kingdom Kg. 249 14 325 07109000 Mixtures of vegetables, frozen _ India Kg. 3,050,352 54,393
326 07112000 Olives provisionally preserved, not for im_ mediate consumpt Italy Kg. 33 39
327 07114000 Cucumbers and gherkins provisionally prese_ rved India Kg. 13,801 159
328 07115100 Mushrooms of the genus Agaricus provisiona_ lly preserved India Kg. 22,244 2,001
329 07115900 Other mushrooms and truffles provisionally _ preserved China Kg. 60 17
330 07119000 Other vegetables and mixture of vegetable_ s provisionally Italy Kg. 43 93
331 07119000 Other vegetables and mixture of vegetable_ s provisionally India Kg. 3,313,424 49,219
332 07119000 Other vegetables and mixture of vegetable_ s provisionally Andorra Kg. 103 2
333 07122000 Dried onions _ India Kg. 2,149,116 74,505 334 07122000 Dried onions _ China Kg. 10,000 2,242
335 07123100 Dried mushrooms of the genus Agaricus _ Thailand Kg. 240 262
336 07123200 Dried wood ears (Auricularia spp) _ Thailand Kg. 100 23 337 07123900 Other dried mushrooms and truffles _ China Kg. 339 65 338 07123900 Other dried mushrooms and truffles _ Thailand Kg. 50 8 339 07123900 Other dried mushrooms and truffles _ Italy Kg. 12 38 340 07123900 Other dried mushrooms and truffles _ India Kg. 2,525 253 341 07129011 Dried Garlic not shelled or not split _ India Kg. 585,218 93,220 342 07129012 Dried Garlic shelled or split _ Thailand Kg. 10,000 3,029 343 07129012 Dried Garlic shelled or split _ India Kg. 303,409 49,590 344 07129090 Others garlic other than shelled or split _ Thailand Kg. 10,000 2,999 345 07129090 Others garlic other than shelled or split _ India Kg. 37,044 6,891 346 07129090 Others garlic other than shelled or split _ China Kg. 52,250 13,527
347 07131000 Dried peas, shelled whether or not skinned _ or split Russian Federation Kg. 6,104,935 263,790
348 07131000 Dried peas, shelled whether or not skinned _ or split Argentina Kg. 382,280 16,704
349 07131000 Dried peas, shelled whether or not skinned _ or split France Kg. 2,568,310 117,407
350 07131000 Dried peas, shelled whether or not skinned _ or split Poland Kg. 144,000 6,915
351 07131000 Dried peas, shelled whether or not skinned _ or split United Arab EmiratKg. 996 77
352 07131000 Dried peas, shelled whether or not skinned _ or split United States Kg. 2,423,387 112,485
353 07131000 Dried peas, shelled whether or not skinned _ or split Italy Kg. 190,000 12,989
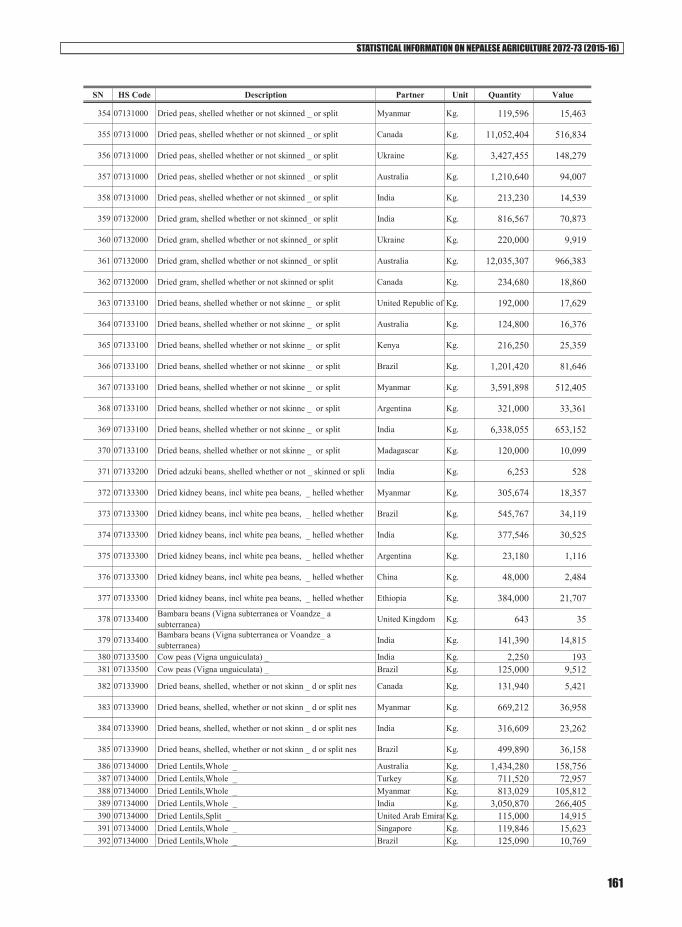
STATISTICAL INFORMATION ON NEPALESE AGRICULTURE 2072-73 (2015-16)
161
SN HS Code Description Partner Unit Quantity Value
354 07131000 Dried peas, shelled whether or not skinned _ or split Myanmar Kg. 119,596 15,463
355 07131000 Dried peas, shelled whether or not skinned _ or split Canada Kg. 11,052,404 516,834
356 07131000 Dried peas, shelled whether or not skinned _ or split Ukraine Kg. 3,427,455 148,279
357 07131000 Dried peas, shelled whether or not skinned _ or split Australia Kg. 1,210,640 94,007
358 07131000 Dried peas, shelled whether or not skinned _ or split India Kg. 213,230 14,539
359 07132000 Dried gram, shelled whether or not skinned_ or split India Kg. 816,567 70,873
360 07132000 Dried gram, shelled whether or not skinned_ or split Ukraine Kg. 220,000 9,919
361 07132000 Dried gram, shelled whether or not skinned_ or split Australia Kg. 12,035,307 966,383
362 07132000 Dried gram, shelled whether or not skinned or split Canada Kg. 234,680 18,860
363 07133100 Dried beans, shelled whether or not skinne _ or split United Republic of Kg. 192,000 17,629
364 07133100 Dried beans, shelled whether or not skinne _ or split Australia Kg. 124,800 16,376
365 07133100 Dried beans, shelled whether or not skinne _ or split Kenya Kg. 216,250 25,359
366 07133100 Dried beans, shelled whether or not skinne _ or split Brazil Kg. 1,201,420 81,646
367 07133100 Dried beans, shelled whether or not skinne _ or split Myanmar Kg. 3,591,898 512,405
368 07133100 Dried beans, shelled whether or not skinne _ or split Argentina Kg. 321,000 33,361
369 07133100 Dried beans, shelled whether or not skinne _ or split India Kg. 6,338,055 653,152
370 07133100 Dried beans, shelled whether or not skinne _ or split Madagascar Kg. 120,000 10,099
371 07133200 Dried adzuki beans, shelled whether or not _ skinned or spli India Kg. 6,253 528
372 07133300 Dried kidney beans, incl white pea beans, _ helled whether Myanmar Kg. 305,674 18,357
373 07133300 Dried kidney beans, incl white pea beans, _ helled whether Brazil Kg. 545,767 34,119
374 07133300 Dried kidney beans, incl white pea beans, _ helled whether India Kg. 377,546 30,525
375 07133300 Dried kidney beans, incl white pea beans, _ helled whether Argentina Kg. 23,180 1,116
376 07133300 Dried kidney beans, incl white pea beans, _ helled whether China Kg. 48,000 2,484
377 07133300 Dried kidney beans, incl white pea beans, _ helled whether Ethiopia Kg. 384,000 21,707
378 07133400 Bambara beans (Vigna subterranea or Voandze_ a subterranea) United Kingdom Kg. 643 35
379 07133400 Bambara beans (Vigna subterranea or Voandze_ a subterranea) India Kg. 141,390 14,815
380 07133500 Cow peas (Vigna unguiculata) _ India Kg. 2,250 193 381 07133500 Cow peas (Vigna unguiculata) _ Brazil Kg. 125,000 9,512
382 07133900 Dried beans, shelled, whether or not skinn _ d or split nes Canada Kg. 131,940 5,421
383 07133900 Dried beans, shelled, whether or not skinn _ d or split nes Myanmar Kg. 669,212 36,958
384 07133900 Dried beans, shelled, whether or not skinn _ d or split nes India Kg. 316,609 23,262
385 07133900 Dried beans, shelled, whether or not skinn _ d or split nes Brazil Kg. 499,890 36,158
386 07134000 Dried Lentils,Whole _ Australia Kg. 1,434,280 158,756 387 07134000 Dried Lentils,Whole _ Turkey Kg. 711,520 72,957 388 07134000 Dried Lentils,Whole _ Myanmar Kg. 813,029 105,812 389 07134000 Dried Lentils,Whole _ India Kg. 3,050,870 266,405 390 07134000 Dried Lentils,Split _ United Arab EmiratKg. 115,000 14,915 391 07134000 Dried Lentils,Whole _ Singapore Kg. 119,846 15,623 392 07134000 Dried Lentils,Whole _ Brazil Kg. 125,090 10,769
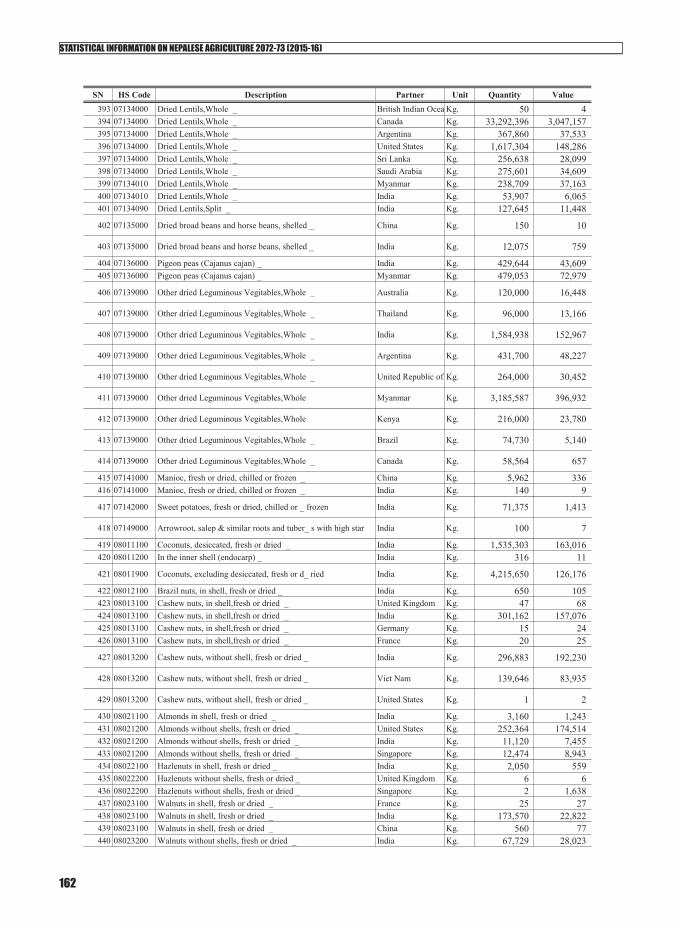
STATISTICAL INFORMATION ON NEPALESE AGRICULTURE 2072-73 (2015-16)
162
SN HS Code Description Partner Unit Quantity Value393 07134000 Dried Lentils,Whole _ British Indian Ocea Kg. 50 4 394 07134000 Dried Lentils,Whole _ Canada Kg. 33,292,396 3,047,157 395 07134000 Dried Lentils,Whole _ Argentina Kg. 367,860 37,533 396 07134000 Dried Lentils,Whole _ United States Kg. 1,617,304 148,286 397 07134000 Dried Lentils,Whole _ Sri Lanka Kg. 256,638 28,099 398 07134000 Dried Lentils,Whole _ Saudi Arabia Kg. 275,601 34,609 399 07134010 Dried Lentils,Whole _ Myanmar Kg. 238,709 37,163 400 07134010 Dried Lentils,Whole _ India Kg. 53,907 6,065 401 07134090 Dried Lentils,Split _ India Kg. 127,645 11,448
402 07135000 Dried broad beans and horse beans, shelled _ China Kg. 150 10
403 07135000 Dried broad beans and horse beans, shelled _ India Kg. 12,075 759
404 07136000 Pigeon peas (Cajanus cajan) _ India Kg. 429,644 43,609 405 07136000 Pigeon peas (Cajanus cajan) _ Myanmar Kg. 479,053 72,979
406 07139000 Other dried Leguminous Vegitables,Whole _ Australia Kg. 120,000 16,448
407 07139000 Other dried Leguminous Vegitables,Whole _ Thailand Kg. 96,000 13,166
408 07139000 Other dried Leguminous Vegitables,Whole _ India Kg. 1,584,938 152,967
409 07139000 Other dried Leguminous Vegitables,Whole _ Argentina Kg. 431,700 48,227
410 07139000 Other dried Leguminous Vegitables,Whole _ United Republic of Kg. 264,000 30,452
411 07139000 Other dried Leguminous Vegitables,Whole Myanmar Kg. 3,185,587 396,932
412 07139000 Other dried Leguminous Vegitables,Whole Kenya Kg. 216,000 23,780
413 07139000 Other dried Leguminous Vegitables,Whole _ Brazil Kg. 74,730 5,140
414 07139000 Other dried Leguminous Vegitables,Whole _ Canada Kg. 58,564 657
415 07141000 Manioc, fresh or dried, chilled or frozen _ China Kg. 5,962 336 416 07141000 Manioc, fresh or dried, chilled or frozen _ India Kg. 140 9
417 07142000 Sweet potatoes, fresh or dried, chilled or _ frozen India Kg. 71,375 1,413
418 07149000 Arrowroot, salep & similar roots and tuber_ s with high star India Kg. 100 7
419 08011100 Coconuts, desiccated, fresh or dried _ India Kg. 1,535,303 163,016 420 08011200 In the inner shell (endocarp) _ India Kg. 316 11
421 08011900 Coconuts, excluding desiccated, fresh or d_ ried India Kg. 4,215,650 126,176
422 08012100 Brazil nuts, in shell, fresh or dried _ India Kg. 650 105 423 08013100 Cashew nuts, in shell,fresh or dried _ United Kingdom Kg. 47 68 424 08013100 Cashew nuts, in shell,fresh or dried _ India Kg. 301,162 157,076 425 08013100 Cashew nuts, in shell,fresh or dried _ Germany Kg. 15 24 426 08013100 Cashew nuts, in shell,fresh or dried _ France Kg. 20 25
427 08013200 Cashew nuts, without shell, fresh or dried _ India Kg. 296,883 192,230
428 08013200 Cashew nuts, without shell, fresh or dried _ Viet Nam Kg. 139,646 83,935
429 08013200 Cashew nuts, without shell, fresh or dried _ United States Kg. 1 2
430 08021100 Almonds in shell, fresh or dried _ India Kg. 3,160 1,243 431 08021200 Almonds without shells, fresh or dried _ United States Kg. 252,364 174,514 432 08021200 Almonds without shells, fresh or dried _ India Kg. 11,120 7,455 433 08021200 Almonds without shells, fresh or dried _ Singapore Kg. 12,474 8,943 434 08022100 Hazlenuts in shell, fresh or dried _ India Kg. 2,050 559 435 08022200 Hazlenuts without shells, fresh or dried _ United Kingdom Kg. 6 6 436 08022200 Hazlenuts without shells, fresh or dried _ Singapore Kg. 2 1,638 437 08023100 Walnuts in shell, fresh or dried _ France Kg. 25 27 438 08023100 Walnuts in shell, fresh or dried _ India Kg. 173,570 22,822 439 08023100 Walnuts in shell, fresh or dried _ China Kg. 560 77 440 08023200 Walnuts without shells, fresh or dried _ India Kg. 67,729 28,023
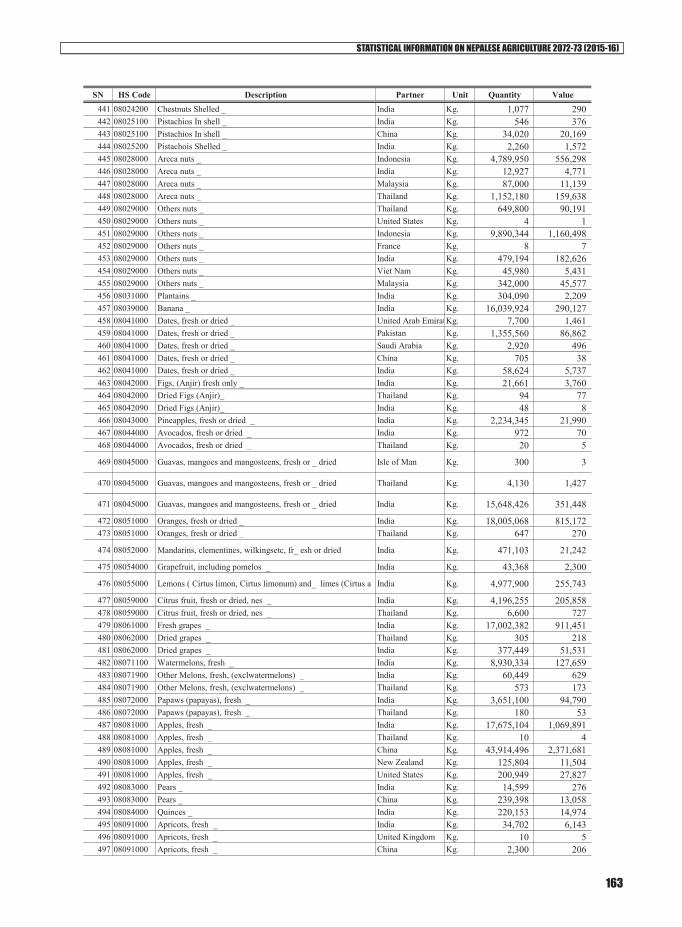
STATISTICAL INFORMATION ON NEPALESE AGRICULTURE 2072-73 (2015-16)
163
SN HS Code Description Partner Unit Quantity Value441 08024200 Chestnuts Shelled _ India Kg. 1,077 290 442 08025100 Pistachios In shell _ India Kg. 546 376 443 08025100 Pistachios In shell _ China Kg. 34,020 20,169 444 08025200 Pistachois Shelled _ India Kg. 2,260 1,572 445 08028000 Areca nuts _ Indonesia Kg. 4,789,950 556,298 446 08028000 Areca nuts _ India Kg. 12,927 4,771 447 08028000 Areca nuts _ Malaysia Kg. 87,000 11,139 448 08028000 Areca nuts _ Thailand Kg. 1,152,180 159,638 449 08029000 Others nuts _ Thailand Kg. 649,800 90,191 450 08029000 Others nuts _ United States Kg. 4 1 451 08029000 Others nuts _ Indonesia Kg. 9,890,344 1,160,498 452 08029000 Others nuts _ France Kg. 8 7 453 08029000 Others nuts _ India Kg. 479,194 182,626 454 08029000 Others nuts _ Viet Nam Kg. 45,980 5,431 455 08029000 Others nuts _ Malaysia Kg. 342,000 45,577 456 08031000 Plantains _ India Kg. 304,090 2,209 457 08039000 Banana _ India Kg. 16,039,924 290,127 458 08041000 Dates, fresh or dried _ United Arab EmiratKg. 7,700 1,461 459 08041000 Dates, fresh or dried _ Pakistan Kg. 1,355,560 86,862 460 08041000 Dates, fresh or dried _ Saudi Arabia Kg. 2,920 496 461 08041000 Dates, fresh or dried _ China Kg. 705 38 462 08041000 Dates, fresh or dried _ India Kg. 58,624 5,737 463 08042000 Figs, (Anjir) fresh only _ India Kg. 21,661 3,760 464 08042000 Dried Figs (Anjir)_ Thailand Kg. 94 77 465 08042090 Dried Figs (Anjir)_ India Kg. 48 8 466 08043000 Pineapples, fresh or dried _ India Kg. 2,234,345 21,990 467 08044000 Avocados, fresh or dried _ India Kg. 972 70 468 08044000 Avocados, fresh or dried _ Thailand Kg. 20 5
469 08045000 Guavas, mangoes and mangosteens, fresh or _ dried Isle of Man Kg. 300 3
470 08045000 Guavas, mangoes and mangosteens, fresh or _ dried Thailand Kg. 4,130 1,427
471 08045000 Guavas, mangoes and mangosteens, fresh or _ dried India Kg. 15,648,426 351,448
472 08051000 Oranges, fresh or dried _ India Kg. 18,005,068 815,172 473 08051000 Oranges, fresh or dried _ Thailand Kg. 647 270
474 08052000 Mandarins, clementines, wilkingsetc, fr_ esh or dried India Kg. 471,103 21,242
475 08054000 Grapefruit, including pomelos _ India Kg. 43,368 2,300
476 08055000 Lemons ( Cirtus limon, Cirtus limonum) and_ limes (Cirtus a India Kg. 4,977,900 255,743
477 08059000 Citrus fruit, fresh or dried, nes _ India Kg. 4,196,255 205,858 478 08059000 Citrus fruit, fresh or dried, nes _ Thailand Kg. 6,600 727 479 08061000 Fresh grapes _ India Kg. 17,002,382 911,451 480 08062000 Dried grapes _ Thailand Kg. 305 218 481 08062000 Dried grapes _ India Kg. 377,449 51,531 482 08071100 Watermelons, fresh _ India Kg. 8,930,334 127,659 483 08071900 Other Melons, fresh, (exclwatermelons) _ India Kg. 60,449 629 484 08071900 Other Melons, fresh, (exclwatermelons) _ Thailand Kg. 573 173 485 08072000 Papaws (papayas), fresh _ India Kg. 3,651,100 94,790 486 08072000 Papaws (papayas), fresh _ Thailand Kg. 180 53 487 08081000 Apples, fresh _ India Kg. 17,675,104 1,069,891 488 08081000 Apples, fresh _ Thailand Kg. 10 4 489 08081000 Apples, fresh _ China Kg. 43,914,496 2,371,681 490 08081000 Apples, fresh _ New Zealand Kg. 125,804 11,504 491 08081000 Apples, fresh _ United States Kg. 200,949 27,827 492 08083000 Pears _ India Kg. 14,599 276 493 08083000 Pears _ China Kg. 239,398 13,058 494 08084000 Quinces _ India Kg. 220,153 14,974 495 08091000 Apricots, fresh _ India Kg. 34,702 6,143 496 08091000 Apricots, fresh _ United Kingdom Kg. 10 5 497 08091000 Apricots, fresh _ China Kg. 2,300 206
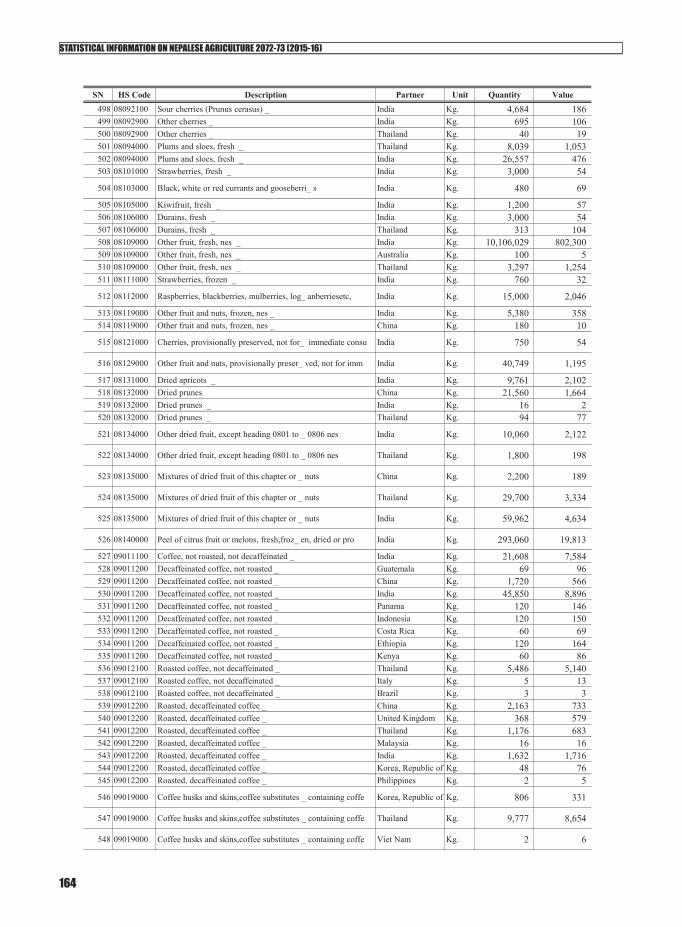
STATISTICAL INFORMATION ON NEPALESE AGRICULTURE 2072-73 (2015-16)
164
SN HS Code Description Partner Unit Quantity Value498 08092100 Sour cherries (Prunus cerasus) _ India Kg. 4,684 186 499 08092900 Other cherries _ India Kg. 695 106 500 08092900 Other cherries _ Thailand Kg. 40 19 501 08094000 Plums and sloes, fresh _ Thailand Kg. 8,039 1,053 502 08094000 Plums and sloes, fresh _ India Kg. 26,557 476 503 08101000 Strawberries, fresh _ India Kg. 3,000 54
504 08103000 Black, white or red currants and gooseberri_ s India Kg. 480 69
505 08105000 Kiwifruit, fresh _ India Kg. 1,200 57 506 08106000 Durains, fresh _ India Kg. 3,000 54 507 08106000 Durains, fresh _ Thailand Kg. 313 104 508 08109000 Other fruit, fresh, nes _ India Kg. 10,106,029 802,300 509 08109000 Other fruit, fresh, nes _ Australia Kg. 100 5 510 08109000 Other fruit, fresh, nes _ Thailand Kg. 3,297 1,254 511 08111000 Strawberries, frozen _ India Kg. 760 32
512 08112000 Raspberries, blackberries, mulberries, log_ anberriesetc, India Kg. 15,000 2,046
513 08119000 Other fruit and nuts, frozen, nes _ India Kg. 5,380 358 514 08119000 Other fruit and nuts, frozen, nes _ China Kg. 180 10
515 08121000 Cherries, provisionally preserved, not for_ immediate consu India Kg. 750 54
516 08129000 Other fruit and nuts, provisionally preser_ ved, not for imm India Kg. 40,749 1,195
517 08131000 Dried apricots _ India Kg. 9,761 2,102 518 08132000 Dried prunes China Kg. 21,560 1,664 519 08132000 Dried prunes _ India Kg. 16 2 520 08132000 Dried prunes _ Thailand Kg. 94 77
521 08134000 Other dried fruit, except heading 0801 to _ 0806 nes India Kg. 10,060 2,122
522 08134000 Other dried fruit, except heading 0801 to _ 0806 nes Thailand Kg. 1,800 198
523 08135000 Mixtures of dried fruit of this chapter or _ nuts China Kg. 2,200 189
524 08135000 Mixtures of dried fruit of this chapter or _ nuts Thailand Kg. 29,700 3,334
525 08135000 Mixtures of dried fruit of this chapter or _ nuts India Kg. 59,962 4,634
526 08140000 Peel of citrus fruit or melons, fresh,froz_ en, dried or pro India Kg. 293,060 19,813
527 09011100 Coffee, not roasted, not decaffeinated _ India Kg. 21,608 7,584 528 09011200 Decaffeinated coffee, not roasted _ Guatemala Kg. 69 96 529 09011200 Decaffeinated coffee, not roasted _ China Kg. 1,720 566 530 09011200 Decaffeinated coffee, not roasted _ India Kg. 45,850 8,896 531 09011200 Decaffeinated coffee, not roasted _ Panama Kg. 120 146 532 09011200 Decaffeinated coffee, not roasted _ Indonesia Kg. 120 150 533 09011200 Decaffeinated coffee, not roasted _ Costa Rica Kg. 60 69 534 09011200 Decaffeinated coffee, not roasted _ Ethiopia Kg. 120 164 535 09011200 Decaffeinated coffee, not roasted _ Kenya Kg. 60 86 536 09012100 Roasted coffee, not decaffeinated _ Thailand Kg. 5,486 5,140 537 09012100 Roasted coffee, not decaffeinated _ Italy Kg. 5 13 538 09012100 Roasted coffee, not decaffeinated _ Brazil Kg. 3 3 539 09012200 Roasted, decaffeinated coffee _ China Kg. 2,163 733 540 09012200 Roasted, decaffeinated coffee _ United Kingdom Kg. 368 579 541 09012200 Roasted, decaffeinated coffee _ Thailand Kg. 1,176 683 542 09012200 Roasted, decaffeinated coffee _ Malaysia Kg. 16 16 543 09012200 Roasted, decaffeinated coffee _ India Kg. 1,632 1,716 544 09012200 Roasted, decaffeinated coffee _ Korea, Republic of Kg. 48 76 545 09012200 Roasted, decaffeinated coffee _ Philippines Kg. 2 5
546 09019000 Coffee husks and skins,coffee substitutes _ containing coffe Korea, Republic of Kg. 806 331
547 09019000 Coffee husks and skins,coffee substitutes _ containing coffe Thailand Kg. 9,777 8,654
548 09019000 Coffee husks and skins,coffee substitutes _ containing coffe Viet Nam Kg. 2 6
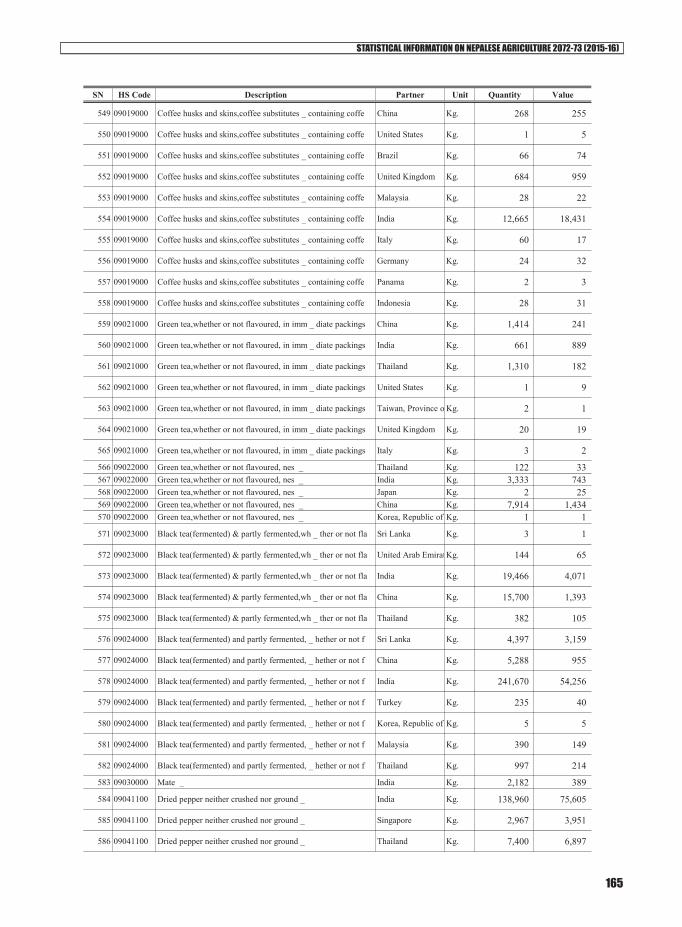
STATISTICAL INFORMATION ON NEPALESE AGRICULTURE 2072-73 (2015-16)
165
SN HS Code Description Partner Unit Quantity Value
549 09019000 Coffee husks and skins,coffee substitutes _ containing coffe China Kg. 268 255
550 09019000 Coffee husks and skins,coffee substitutes _ containing coffe United States Kg. 1 5
551 09019000 Coffee husks and skins,coffee substitutes _ containing coffe Brazil Kg. 66 74
552 09019000 Coffee husks and skins,coffee substitutes _ containing coffe United Kingdom Kg. 684 959
553 09019000 Coffee husks and skins,coffee substitutes _ containing coffe Malaysia Kg. 28 22
554 09019000 Coffee husks and skins,coffee substitutes _ containing coffe India Kg. 12,665 18,431
555 09019000 Coffee husks and skins,coffee substitutes _ containing coffe Italy Kg. 60 17
556 09019000 Coffee husks and skins,coffee substitutes _ containing coffe Germany Kg. 24 32
557 09019000 Coffee husks and skins,coffee substitutes _ containing coffe Panama Kg. 2 3
558 09019000 Coffee husks and skins,coffee substitutes _ containing coffe Indonesia Kg. 28 31
559 09021000 Green tea,whether or not flavoured, in imm _ diate packings China Kg. 1,414 241
560 09021000 Green tea,whether or not flavoured, in imm _ diate packings India Kg. 661 889
561 09021000 Green tea,whether or not flavoured, in imm _ diate packings Thailand Kg. 1,310 182
562 09021000 Green tea,whether or not flavoured, in imm _ diate packings United States Kg. 1 9
563 09021000 Green tea,whether or not flavoured, in imm _ diate packings Taiwan, Province o Kg. 2 1
564 09021000 Green tea,whether or not flavoured, in imm _ diate packings United Kingdom Kg. 20 19
565 09021000 Green tea,whether or not flavoured, in imm _ diate packings Italy Kg. 3 2
566 09022000 Green tea,whether or not flavoured, nes _ Thailand Kg. 122 33 567 09022000 Green tea,whether or not flavoured, nes _ India Kg. 3,333 743 568 09022000 Green tea,whether or not flavoured, nes _ Japan Kg. 2 25 569 09022000 Green tea,whether or not flavoured, nes _ China Kg. 7,914 1,434 570 09022000 Green tea,whether or not flavoured, nes _ Korea, Republic of Kg. 1 1
571 09023000 Black tea(fermented) & partly fermented,wh _ ther or not fla Sri Lanka Kg. 3 1
572 09023000 Black tea(fermented) & partly fermented,wh _ ther or not fla United Arab EmiratKg. 144 65
573 09023000 Black tea(fermented) & partly fermented,wh _ ther or not fla India Kg. 19,466 4,071
574 09023000 Black tea(fermented) & partly fermented,wh _ ther or not fla China Kg. 15,700 1,393
575 09023000 Black tea(fermented) & partly fermented,wh _ ther or not fla Thailand Kg. 382 105
576 09024000 Black tea(fermented) and partly fermented, _ hether or not f Sri Lanka Kg. 4,397 3,159
577 09024000 Black tea(fermented) and partly fermented, _ hether or not f China Kg. 5,288 955
578 09024000 Black tea(fermented) and partly fermented, _ hether or not f India Kg. 241,670 54,256
579 09024000 Black tea(fermented) and partly fermented, _ hether or not f Turkey Kg. 235 40
580 09024000 Black tea(fermented) and partly fermented, _ hether or not f Korea, Republic of Kg. 5 5
581 09024000 Black tea(fermented) and partly fermented, _ hether or not f Malaysia Kg. 390 149
582 09024000 Black tea(fermented) and partly fermented, _ hether or not f Thailand Kg. 997 214
583 09030000 Mate _ India Kg. 2,182 389
584 09041100 Dried pepper neither crushed nor ground _ India Kg. 138,960 75,605
585 09041100 Dried pepper neither crushed nor ground _ Singapore Kg. 2,967 3,951
586 09041100 Dried pepper neither crushed nor ground _ Thailand Kg. 7,400 6,897
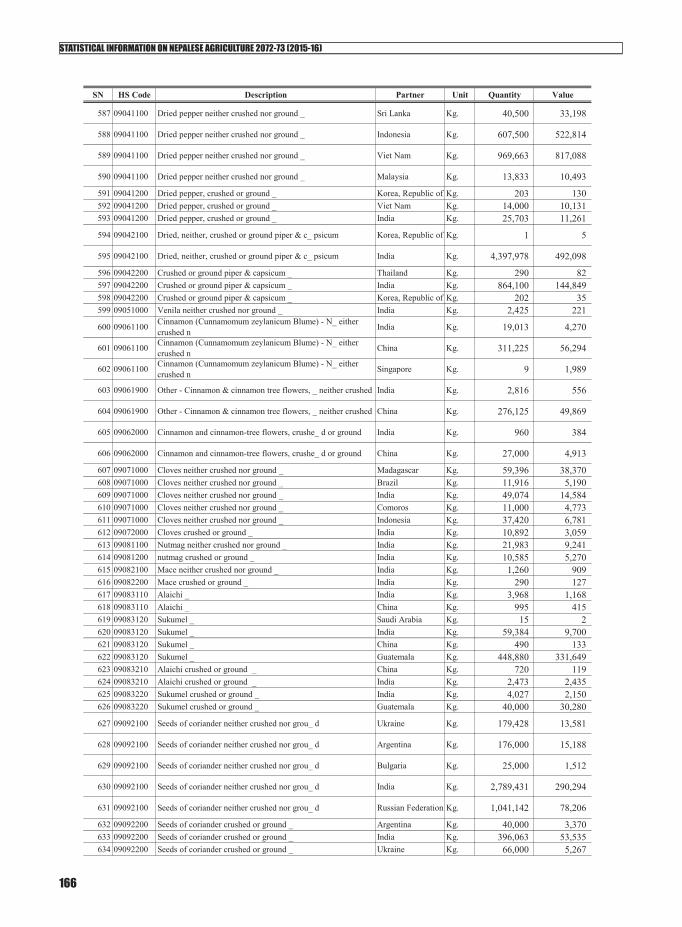
STATISTICAL INFORMATION ON NEPALESE AGRICULTURE 2072-73 (2015-16)
166
SN HS Code Description Partner Unit Quantity Value
587 09041100 Dried pepper neither crushed nor ground _ Sri Lanka Kg. 40,500 33,198
588 09041100 Dried pepper neither crushed nor ground _ Indonesia Kg. 607,500 522,814
589 09041100 Dried pepper neither crushed nor ground _ Viet Nam Kg. 969,663 817,088
590 09041100 Dried pepper neither crushed nor ground _ Malaysia Kg. 13,833 10,493
591 09041200 Dried pepper, crushed or ground _ Korea, Republic of Kg. 203 130 592 09041200 Dried pepper, crushed or ground _ Viet Nam Kg. 14,000 10,131 593 09041200 Dried pepper, crushed or ground _ India Kg. 25,703 11,261
594 09042100 Dried, neither, crushed or ground piper & c_ psicum Korea, Republic of Kg. 1 5
595 09042100 Dried, neither, crushed or ground piper & c_ psicum India Kg. 4,397,978 492,098
596 09042200 Crushed or ground piper & capsicum _ Thailand Kg. 290 82 597 09042200 Crushed or ground piper & capsicum _ India Kg. 864,100 144,849 598 09042200 Crushed or ground piper & capsicum _ Korea, Republic of Kg. 202 35 599 09051000 Venila neither crushed nor ground _ India Kg. 2,425 221
600 09061100 Cinnamon (Cunnamomum zeylanicum Blume) - N_ either crushed n India Kg. 19,013 4,270
601 09061100 Cinnamon (Cunnamomum zeylanicum Blume) - N_ either crushed n China Kg. 311,225 56,294
602 09061100 Cinnamon (Cunnamomum zeylanicum Blume) - N_ either crushed n Singapore Kg. 9 1,989
603 09061900 Other - Cinnamon & cinnamon tree flowers, _ neither crushed India Kg. 2,816 556
604 09061900 Other - Cinnamon & cinnamon tree flowers, _ neither crushed China Kg. 276,125 49,869
605 09062000 Cinnamon and cinnamon-tree flowers, crushe_ d or ground India Kg. 960 384
606 09062000 Cinnamon and cinnamon-tree flowers, crushe_ d or ground China Kg. 27,000 4,913
607 09071000 Cloves neither crushed nor ground _ Madagascar Kg. 59,396 38,370 608 09071000 Cloves neither crushed nor ground _ Brazil Kg. 11,916 5,190 609 09071000 Cloves neither crushed nor ground _ India Kg. 49,074 14,584 610 09071000 Cloves neither crushed nor ground _ Comoros Kg. 11,000 4,773 611 09071000 Cloves neither crushed nor ground _ Indonesia Kg. 37,420 6,781 612 09072000 Cloves crushed or ground _ India Kg. 10,892 3,059 613 09081100 Nutmag neither crushed nor ground _ India Kg. 21,983 9,241 614 09081200 nutmag crushed or ground _ India Kg. 10,585 5,270 615 09082100 Mace neither crushed nor ground _ India Kg. 1,260 909 616 09082200 Mace crushed or ground _ India Kg. 290 127 617 09083110 Alaichi _ India Kg. 3,968 1,168 618 09083110 Alaichi _ China Kg. 995 415 619 09083120 Sukumel _ Saudi Arabia Kg. 15 2 620 09083120 Sukumel _ India Kg. 59,384 9,700 621 09083120 Sukumel _ China Kg. 490 133 622 09083120 Sukumel _ Guatemala Kg. 448,880 331,649 623 09083210 Alaichi crushed or ground _ China Kg. 720 119 624 09083210 Alaichi crushed or ground _ India Kg. 2,473 2,435 625 09083220 Sukumel crushed or ground _ India Kg. 4,027 2,150 626 09083220 Sukumel crushed or ground _ Guatemala Kg. 40,000 30,280
627 09092100 Seeds of coriander neither crushed nor grou_ d Ukraine Kg. 179,428 13,581
628 09092100 Seeds of coriander neither crushed nor grou_ d Argentina Kg. 176,000 15,188
629 09092100 Seeds of coriander neither crushed nor grou_ d Bulgaria Kg. 25,000 1,512
630 09092100 Seeds of coriander neither crushed nor grou_ d India Kg. 2,789,431 290,294
631 09092100 Seeds of coriander neither crushed nor grou_ d Russian Federation Kg. 1,041,142 78,206
632 09092200 Seeds of coriander crushed or ground _ Argentina Kg. 40,000 3,370 633 09092200 Seeds of coriander crushed or ground _ India Kg. 396,063 53,535 634 09092200 Seeds of coriander crushed or ground _ Ukraine Kg. 66,000 5,267

STATISTICAL INFORMATION ON NEPALESE AGRICULTURE 2072-73 (2015-16)
167
SN HS Code Description Partner Unit Quantity Value635 09092200 Seeds of coriander crushed or ground _ Russian Federation Kg. 462,857 34,486 636 09093000 Seeds of cumin _ India Kg. 249 49
637 09093100 Seeds of cumin neither crushed nor ground _ Andorra Kg. 3,400 570
638 09093100 Seeds of cumin neither crushed nor ground _ Myanmar Kg. 16,000 3,359
639 09093100 Seeds of cumin neither crushed nor ground _ India Kg. 4,460,817 784,731
640 09093100 Seeds of cumin neither crushed nor ground _ Finland Kg. 750 135
641 09093200 Seeds of Cumin crushed or ground _ India Kg. 1,755,800 310,500
642 09096100 Seeds of anisa,badian,caraway or fennel;jun_ iper berries Ne China Kg. 20,000 3,259
643 09096100 Seeds of anisa,badian,caraway or fennel;jun_ iper berries Ne India Kg. 250,898 29,731
644 09096200 Seeds of anisa,badian,caraway or fennel; ju_l; ju_ niper ber China Kg. 2,000 381
645 09096200 Seeds of anisa,badian,caraway or fennel; ju_l; ju_ niper ber India Kg. 563,934 69,266
646 09101110 Fresh Ginger nither crushed nor ground _ China Kg. 3,327,428 186,745 647 09101110 Fresh Ginger nither crushed nor ground _ India Kg. 28,391 2,820
648 09101190 Other Ginger crushed or ground (sutho) _ India Kg. 426,299 129,896
649 09101190 Other Ginger crushed or ground (sutho) _ China Kg. 117,001 8,267
650 09101200 Other Ginger crushed or ground _ India Kg. 8,281 2,096 651 09102000 Saffron _ Spain Kg. 14 2,360 652 09102000 Saffron _ India Kg. 556 3,854 653 09103010 Turmeric (Fresh) _ India Kg. 59,209 8,492 654 09103020 Turmeric (dust or Powder) _ India Kg. 44,341 8,228 655 09103090 Other turmeric _ India Kg. 349,608 49,125 656 09109100 Spice mixtures _ Korea, Republic of Kg. 100 18 657 09109100 Spice mixtures _ France Kg. 96 54 658 09109100 Spice mixtures _ China Kg. 4,610 658 659 09109100 Spice mixtures _ India Kg. 101,966 29,026 660 09109100 Spice mixtures _ Isle of Man Kg. 8 6 661 09109100 Spice mixtures _ United Arab EmiratKg. 1,180 338 662 09109100 Spice mixtures _ Pakistan Kg. 24,001 2,007 663 09109100 Spice mixtures _ Thailand Kg. 5 13 664 09109910 Fenugreek(Methi) _ United Arab EmiratKg. 505 338 665 09109910 Fenugreek(Methi) _ India Kg. 1,628,408 165,475 666 09109990 Other spices nes _ India Kg. 552,751 127,284 667 09109990 Other spices nes _ Pakistan Kg. 81,950 6,818 668 09109990 Other spices nes _ China Kg. 24,522 6,958 669 09109990 Other spices nes _ Thailand Kg. 16 3 670 10011100 Drum wheat Seed _ India Kg. 1,797,415 52,936 671 10011900 Other drum wheat _ India Kg. 79,874,152 2,153,709 672 10011900 Other drum wheat _ Italy Kg. 200 62 673 10019100 Wheat Seed _ India Kg. 12,721,187 332,937 674 10019900 Other wheat _ India Kg. 124,668,016 3,268,248 675 10019900 Other wheat _ China Kg. 20 1 676 10021000 Rye Seeds _ India Kg. 2,200 48 677 10029000 Other rye _ India Kg. 3,050 58 678 10031000 Barley Seed _ India Kg. 16,000 433 679 10039000 Other barley _ Australia Kg. 45,600 2,476 680 10039000 Other barley _ India Kg. 176,378 7,161 681 10041000 Oats seed _ India Kg. 3,070 151 682 10049000 Other oats _ India Kg. 800 36 683 10049000 Other oats _ Australia Kg. 15,700 804 684 10051000 Maize seed _ China Kg. 28 9 685 10051000 Maize seed _ Thailand Kg. 9 1 686 10051000 Maize seed _ Argentina Kg. 1,079,000 47,071 687 10051000 Maize seed _ Zimbabwe Kg. 34 8

STATISTICAL INFORMATION ON NEPALESE AGRICULTURE 2072-73 (2015-16)
168
SN HS Code Description Partner Unit Quantity Value688 10051000 Maize seed _ India Kg. 736,691 121,252 689 10059000 Maize (excl seed) _ Brazil Kg. 201,900 8,387 690 10059000 Maize (excl seed) _ China Kg. 10 2 691 10059000 Maize (excl seed) _ India Kg. 350,994,176 9,519,508 692 10059000 Maize (excl seed) _ Argentina Kg. 4,277,900 188,222 693 10061000 Rice in the husk (paddy or rough) _ Italy Kg. 32 11 694 10061000 Rice in the husk (paddy or rough) _ Bahrain Kg. 1,862 437 695 10061000 Rice in the husk (paddy or rough) _ China Kg. 75,112 16,088 696 10061000 Rice in the husk (paddy or rough) _ India Kg. 94,287,264 2,478,218 697 10061000 Rice in the husk (paddy or rough) _ Thailand Kg. 10 2 698 10061000 Rice in the husk (paddy or rough) _ Korea, Republic of Kg. 29 13 699 10062000 Husked (brown) rice _ Thailand Kg. 2,500 139 700 10062000 Husked (brown) rice _ India Kg. 9,284,063 417,730 701 10062000 Husked (brown) rice _ Japan Kg. 20 114
702 10063000 Semi-milled or wholly milled rice, whether _ or not polished China Kg. 30,000 271
703 10063000 Semi-milled or wholly milled rice, whether _ or not polished Thailand Kg. 22,750 2,222
704 10063000 Semi-milled or wholly milled rice, whether _ or not polished Malaysia Kg. 35,781 2,082
705 10063000 Semi-milled or wholly milled rice, whether _ or not polished Korea, Republic of Kg. 100 45
706 10063000 Semi-milled or wholly milled rice, whether _ or not polished Italy Kg. 1,340,503 85,112
707 10063000 Semi-milled or wholly milled rice, whether _ or not polished India Kg. 386,763,424 18,522,768
708 10063000 Semi-milled or wholly milled rice, whether or not polished or glazed Bangladesh Kg. 2,955,000 135,877
709 10063000 Semi-milled or wholly milled rice, whether _ or not polished United States Kg. 129,902 8,401
710 10063000 Semi-milled or wholly milled rice, whether _ or not polished Singapore Kg. 1,624 97
711 10063000 Semi-milled or wholly milled rice, whether _ or not polished Viet Nam Kg. 25,000 1,572
712 10064000 Broken rice _ India Kg. 44,614,000 1,130,454 713 10064000 Broken rice _ United States Kg. 38,922 1,414 714 10071000 Grain sorghum Seed (Junelo) _ India Kg. 300 4 715 10079000 Other grain sorghum (Junelo) _ India Kg. 1,250 43 716 10081000 Buckwheat _ India Kg. 3,661,095 98,535 717 10081000 Buckwheat _ China Kg. 1 1 718 10082100 Millet seed _ India Kg. 1,550,075 39,687 719 10082900 Other _ India Kg. 14,920,595 380,967 720 10089000 Other cereal, nes _ India Kg. 120 6 721 10089000 Other cereal, nes _ United States Kg. 1 1 722 10089000 Other cereal, nes _ China Kg. 472 82
Total of above 78,862,464
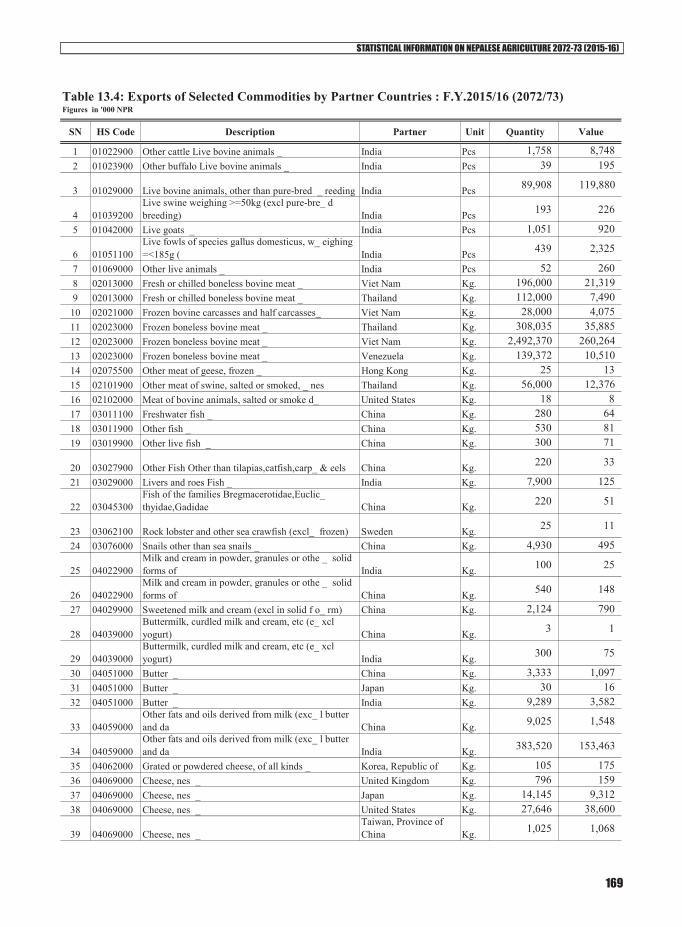
STATISTICAL INFORMATION ON NEPALESE AGRICULTURE 2072-73 (2015-16)
169
SN HS Code Description Partner Unit Quantity Value
1 01022900 Other cattle Live bovine animals _ India Pcs 1,758 8,748 2 01023900 Other buffalo Live bovine animals _ India Pcs 39 195
3 01029000 Live bovine animals, other than pure-bred _ reeding India Pcs 89,908 119,880
4 01039200Live swine weighing >=50kg (excl pure-bre_ d breeding) India Pcs 193 226
5 01042000 Live goats _ India Pcs 1,051 920
6 01051100Live fowls of species gallus domesticus, w_ eighing =<185g ( India Pcs 439 2,325
7 01069000 Other live animals _ India Pcs 52 260 8 02013000 Fresh or chilled boneless bovine meat _ Viet Nam Kg. 196,000 21,319 9 02013000 Fresh or chilled boneless bovine meat _ Thailand Kg. 112,000 7,490
10 02021000 Frozen bovine carcasses and half carcasses_ Viet Nam Kg. 28,000 4,075 11 02023000 Frozen boneless bovine meat _ Thailand Kg. 308,035 35,885 12 02023000 Frozen boneless bovine meat _ Viet Nam Kg. 2,492,370 260,264 13 02023000 Frozen boneless bovine meat _ Venezuela Kg. 139,372 10,510 14 02075500 Other meat of geese, frozen _ Hong Kong Kg. 25 13 15 02101900 Other meat of swine, salted or smoked, _ nes Thailand Kg. 56,000 12,376 16 02102000 Meat of bovine animals, salted or smoke d_ United States Kg. 18 8 17 03011100 Freshwater fish _ China Kg. 280 64 18 03011900 Other fish _ China Kg. 530 81 19 03019900 Other live fish _ China Kg. 300 71
20 03027900 Other Fish Other than tilapias,catfish,carp_ & eels China Kg. 220 33
21 03029000 Livers and roes Fish _ India Kg. 7,900 125
22 03045300Fish of the families Bregmacerotidae,Euclic_ thyidae,Gadidae China Kg. 220 51
23 03062100 Rock lobster and other sea crawfish (excl_ frozen) Sweden Kg. 25 11
24 03076000 Snails other than sea snails _ China Kg. 4,930 495
25 04022900Milk and cream in powder, granules or othe _ solid forms of India Kg. 100 25
26 04022900Milk and cream in powder, granules or othe _ solid forms of China Kg. 540 148
27 04029900 Sweetened milk and cream (excl in solid f o_ rm) China Kg. 2,124 790
28 04039000Buttermilk, curdled milk and cream, etc (e_ xcl yogurt) China Kg. 3 1
29 04039000Buttermilk, curdled milk and cream, etc (e_ xcl yogurt) India Kg. 300 75
30 04051000 Butter _ China Kg. 3,333 1,097 31 04051000 Butter _ Japan Kg. 30 16 32 04051000 Butter _ India Kg. 9,289 3,582
33 04059000Other fats and oils derived from milk (exc_ l butter and da China Kg. 9,025 1,548
34 04059000Other fats and oils derived from milk (exc_ l butter and da India Kg. 383,520 153,463
35 04062000 Grated or powdered cheese, of all kinds _ Korea, Republic of Kg. 105 175 36 04069000 Cheese, nes _ United Kingdom Kg. 796 159 37 04069000 Cheese, nes _ Japan Kg. 14,145 9,312 38 04069000 Cheese, nes _ United States Kg. 27,646 38,600
39 04069000 Cheese, nes _ Taiwan, Province of China Kg. 1,025 1,068
Table 13.4: Exports of Selected Commodities by Partner Countries : F.Y.2015/16 (2072/73) Figures in '000 NPR
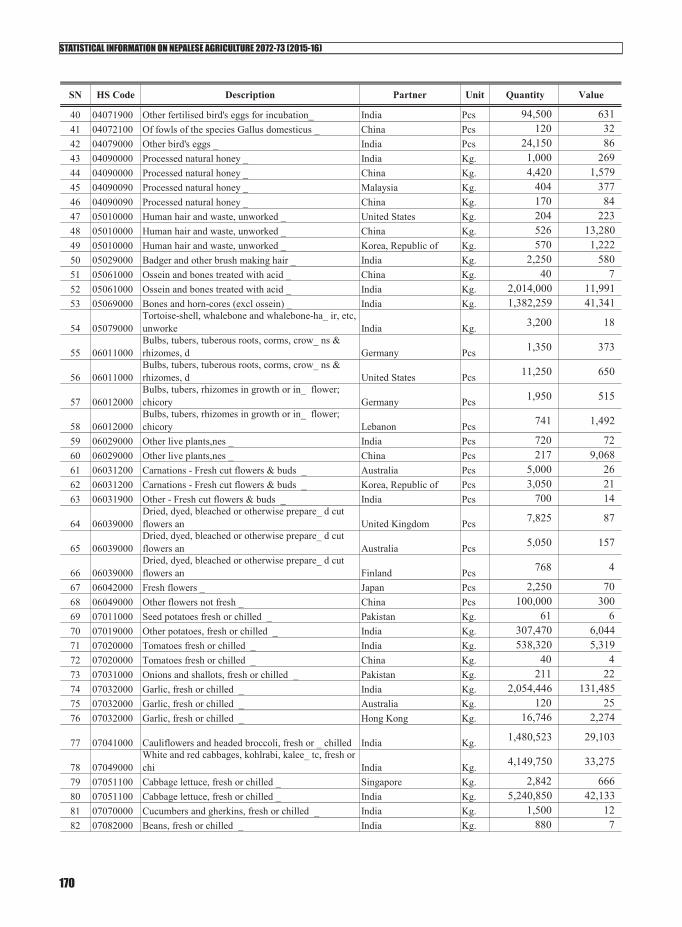
STATISTICAL INFORMATION ON NEPALESE AGRICULTURE 2072-73 (2015-16)
170
SN HS Code Description Partner Unit Quantity Value
40 04071900 Other fertilised bird's eggs for incubation_ India Pcs 94,500 631 41 04072100 Of fowls of the species Gallus domesticus _ China Pcs 120 32 42 04079000 Other bird's eggs _ India Pcs 24,150 86 43 04090000 Processed natural honey _ India Kg. 1,000 269 44 04090000 Processed natural honey _ China Kg. 4,420 1,579 45 04090090 Processed natural honey _ Malaysia Kg. 404 377 46 04090090 Processed natural honey _ China Kg. 170 84 47 05010000 Human hair and waste, unworked _ United States Kg. 204 223 48 05010000 Human hair and waste, unworked _ China Kg. 526 13,280 49 05010000 Human hair and waste, unworked _ Korea, Republic of Kg. 570 1,222 50 05029000 Badger and other brush making hair _ India Kg. 2,250 580 51 05061000 Ossein and bones treated with acid _ China Kg. 40 7 52 05061000 Ossein and bones treated with acid _ India Kg. 2,014,000 11,991 53 05069000 Bones and horn-cores (excl ossein) _ India Kg. 1,382,259 41,341
54 05079000Tortoise-shell, whalebone and whalebone-ha_ ir, etc, unworke India Kg. 3,200 18
55 06011000Bulbs, tubers, tuberous roots, corms, crow_ ns & rhizomes, d Germany Pcs 1,350 373
56 06011000Bulbs, tubers, tuberous roots, corms, crow_ ns & rhizomes, d United States Pcs 11,250 650
57 06012000Bulbs, tubers, rhizomes in growth or in_ flower; chicory Germany Pcs 1,950 515
58 06012000Bulbs, tubers, rhizomes in growth or in_ flower; chicory Lebanon Pcs 741 1,492
59 06029000 Other live plants,nes _ India Pcs 720 72 60 06029000 Other live plants,nes _ China Pcs 217 9,068 61 06031200 Carnations - Fresh cut flowers & buds _ Australia Pcs 5,000 26 62 06031200 Carnations - Fresh cut flowers & buds _ Korea, Republic of Pcs 3,050 21 63 06031900 Other - Fresh cut flowers & buds _ India Pcs 700 14
64 06039000Dried, dyed, bleached or otherwise prepare_ d cut flowers an United Kingdom Pcs 7,825 87
65 06039000Dried, dyed, bleached or otherwise prepare_ d cut flowers an Australia Pcs 5,050 157
66 06039000Dried, dyed, bleached or otherwise prepare_ d cut flowers an Finland Pcs 768 4
67 06042000 Fresh flowers _ Japan Pcs 2,250 70 68 06049000 Other flowers not fresh _ China Pcs 100,000 300 69 07011000 Seed potatoes fresh or chilled _ Pakistan Kg. 61 6 70 07019000 Other potatoes, fresh or chilled _ India Kg. 307,470 6,044 71 07020000 Tomatoes fresh or chilled _ India Kg. 538,320 5,319 72 07020000 Tomatoes fresh or chilled _ China Kg. 40 4 73 07031000 Onions and shallots, fresh or chilled _ Pakistan Kg. 211 22 74 07032000 Garlic, fresh or chilled _ India Kg. 2,054,446 131,485 75 07032000 Garlic, fresh or chilled _ Australia Kg. 120 25 76 07032000 Garlic, fresh or chilled _ Hong Kong Kg. 16,746 2,274
77 07041000 Cauliflowers and headed broccoli, fresh or _ chilled India Kg. 1,480,523 29,103
78 07049000White and red cabbages, kohlrabi, kalee_ tc, fresh or chi India Kg. 4,149,750 33,275
79 07051100 Cabbage lettuce, fresh or chilled _ Singapore Kg. 2,842 666 80 07051100 Cabbage lettuce, fresh or chilled _ India Kg. 5,240,850 42,133 81 07070000 Cucumbers and gherkins, fresh or chilled _ India Kg. 1,500 12 82 07082000 Beans, fresh or chilled _ India Kg. 880 7
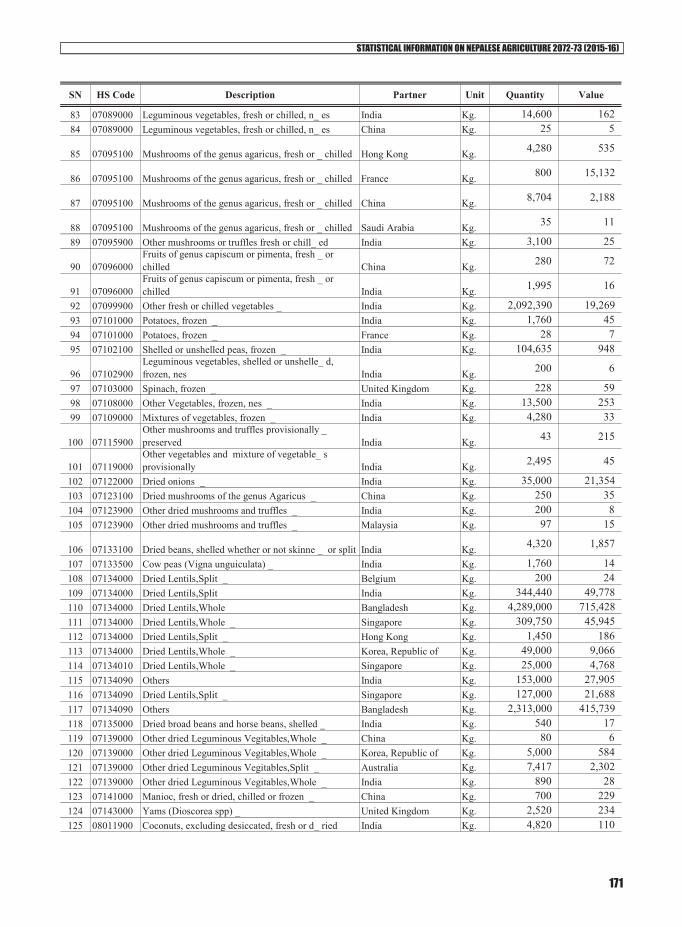
STATISTICAL INFORMATION ON NEPALESE AGRICULTURE 2072-73 (2015-16)
171
SN HS Code Description Partner Unit Quantity Value
83 07089000 Leguminous vegetables, fresh or chilled, n_ es India Kg. 14,600 162 84 07089000 Leguminous vegetables, fresh or chilled, n_ es China Kg. 25 5
85 07095100 Mushrooms of the genus agaricus, fresh or _ chilled Hong Kong Kg. 4,280 535
86 07095100 Mushrooms of the genus agaricus, fresh or _ chilled France Kg. 800 15,132
87 07095100 Mushrooms of the genus agaricus, fresh or _ chilled China Kg. 8,704 2,188
88 07095100 Mushrooms of the genus agaricus, fresh or _ chilled Saudi Arabia Kg. 35 11
89 07095900 Other mushrooms or truffles fresh or chill_ ed India Kg. 3,100 25
90 07096000Fruits of genus capiscum or pimenta, fresh _ or chilled China Kg. 280 72
91 07096000Fruits of genus capiscum or pimenta, fresh _ or chilled India Kg. 1,995 16
92 07099900 Other fresh or chilled vegetables _ India Kg. 2,092,390 19,269 93 07101000 Potatoes, frozen _ India Kg. 1,760 45 94 07101000 Potatoes, frozen _ France Kg. 28 7 95 07102100 Shelled or unshelled peas, frozen _ India Kg. 104,635 948
96 07102900Leguminous vegetables, shelled or unshelle_ d, frozen, nes India Kg. 200 6
97 07103000 Spinach, frozen _ United Kingdom Kg. 228 59 98 07108000 Other Vegetables, frozen, nes _ India Kg. 13,500 253 99 07109000 Mixtures of vegetables, frozen _ India Kg. 4,280 33
100 07115900Other mushrooms and truffles provisionally _ preserved India Kg. 43 215
101 07119000Other vegetables and mixture of vegetable_ s provisionally India Kg. 2,495 45
102 07122000 Dried onions _ India Kg. 35,000 21,354 103 07123100 Dried mushrooms of the genus Agaricus _ China Kg. 250 35 104 07123900 Other dried mushrooms and truffles _ India Kg. 200 8 105 07123900 Other dried mushrooms and truffles _ Malaysia Kg. 97 15
106 07133100 Dried beans, shelled whether or not skinne _ or split India Kg. 4,320 1,857
107 07133500 Cow peas (Vigna unguiculata) _ India Kg. 1,760 14 108 07134000 Dried Lentils,Split _ Belgium Kg. 200 24 109 07134000 Dried Lentils,Split India Kg. 344,440 49,778 110 07134000 Dried Lentils,Whole Bangladesh Kg. 4,289,000 715,428 111 07134000 Dried Lentils,Whole _ Singapore Kg. 309,750 45,945 112 07134000 Dried Lentils,Split _ Hong Kong Kg. 1,450 186 113 07134000 Dried Lentils,Whole _ Korea, Republic of Kg. 49,000 9,066 114 07134010 Dried Lentils,Whole _ Singapore Kg. 25,000 4,768 115 07134090 Others India Kg. 153,000 27,905 116 07134090 Dried Lentils,Split _ Singapore Kg. 127,000 21,688 117 07134090 Others Bangladesh Kg. 2,313,000 415,739 118 07135000 Dried broad beans and horse beans, shelled _ India Kg. 540 17 119 07139000 Other dried Leguminous Vegitables,Whole _ China Kg. 80 6 120 07139000 Other dried Leguminous Vegitables,Whole _ Korea, Republic of Kg. 5,000 584 121 07139000 Other dried Leguminous Vegitables,Split _ Australia Kg. 7,417 2,302 122 07139000 Other dried Leguminous Vegitables,Whole _ India Kg. 890 28 123 07141000 Manioc, fresh or dried, chilled or frozen _ China Kg. 700 229 124 07143000 Yams (Dioscorea spp) _ United Kingdom Kg. 2,520 234 125 08011900 Coconuts, excluding desiccated, fresh or d_ ried India Kg. 4,820 110
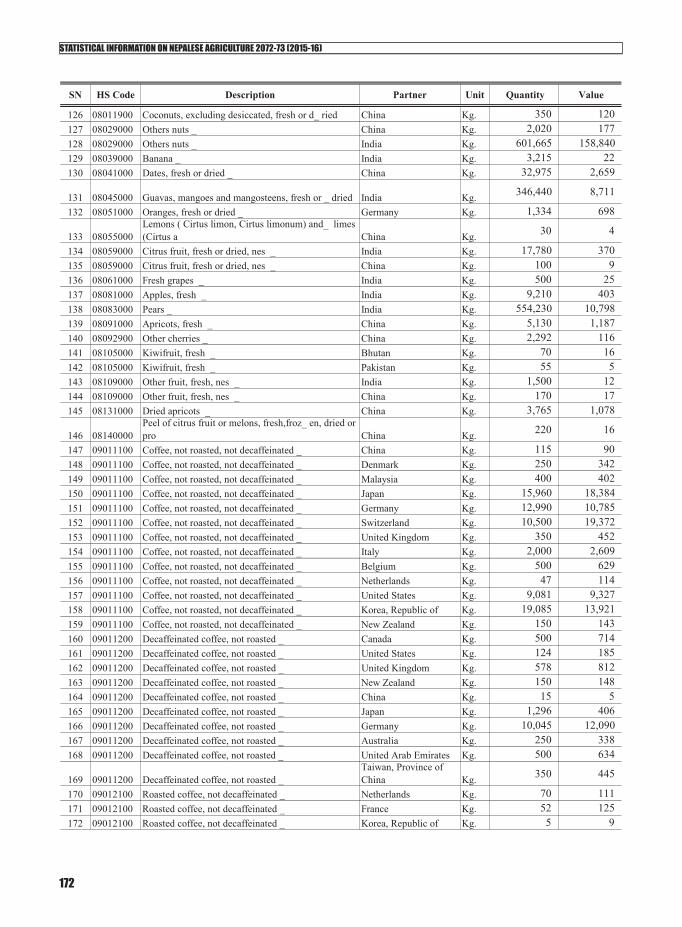
STATISTICAL INFORMATION ON NEPALESE AGRICULTURE 2072-73 (2015-16)
172
SN HS Code Description Partner Unit Quantity Value
126 08011900 Coconuts, excluding desiccated, fresh or d_ ried China Kg. 350 120 127 08029000 Others nuts _ China Kg. 2,020 177 128 08029000 Others nuts _ India Kg. 601,665 158,840 129 08039000 Banana _ India Kg. 3,215 22 130 08041000 Dates, fresh or dried _ China Kg. 32,975 2,659
131 08045000 Guavas, mangoes and mangosteens, fresh or _ dried India Kg. 346,440 8,711
132 08051000 Oranges, fresh or dried _ Germany Kg. 1,334 698
133 08055000Lemons ( Cirtus limon, Cirtus limonum) and_ limes (Cirtus a China Kg. 30 4
134 08059000 Citrus fruit, fresh or dried, nes _ India Kg. 17,780 370 135 08059000 Citrus fruit, fresh or dried, nes _ China Kg. 100 9 136 08061000 Fresh grapes _ India Kg. 500 25 137 08081000 Apples, fresh _ India Kg. 9,210 403 138 08083000 Pears _ India Kg. 554,230 10,798 139 08091000 Apricots, fresh _ China Kg. 5,130 1,187 140 08092900 Other cherries _ China Kg. 2,292 116 141 08105000 Kiwifruit, fresh _ Bhutan Kg. 70 16 142 08105000 Kiwifruit, fresh _ Pakistan Kg. 55 5 143 08109000 Other fruit, fresh, nes _ India Kg. 1,500 12 144 08109000 Other fruit, fresh, nes _ China Kg. 170 17 145 08131000 Dried apricots _ China Kg. 3,765 1,078
146 08140000Peel of citrus fruit or melons, fresh,froz_ en, dried or pro China Kg. 220 16
147 09011100 Coffee, not roasted, not decaffeinated _ China Kg. 115 90 148 09011100 Coffee, not roasted, not decaffeinated _ Denmark Kg. 250 342 149 09011100 Coffee, not roasted, not decaffeinated _ Malaysia Kg. 400 402 150 09011100 Coffee, not roasted, not decaffeinated _ Japan Kg. 15,960 18,384 151 09011100 Coffee, not roasted, not decaffeinated _ Germany Kg. 12,990 10,785 152 09011100 Coffee, not roasted, not decaffeinated _ Switzerland Kg. 10,500 19,372 153 09011100 Coffee, not roasted, not decaffeinated _ United Kingdom Kg. 350 452 154 09011100 Coffee, not roasted, not decaffeinated _ Italy Kg. 2,000 2,609 155 09011100 Coffee, not roasted, not decaffeinated _ Belgium Kg. 500 629 156 09011100 Coffee, not roasted, not decaffeinated _ Netherlands Kg. 47 114 157 09011100 Coffee, not roasted, not decaffeinated _ United States Kg. 9,081 9,327 158 09011100 Coffee, not roasted, not decaffeinated _ Korea, Republic of Kg. 19,085 13,921 159 09011100 Coffee, not roasted, not decaffeinated _ New Zealand Kg. 150 143 160 09011200 Decaffeinated coffee, not roasted _ Canada Kg. 500 714 161 09011200 Decaffeinated coffee, not roasted _ United States Kg. 124 185 162 09011200 Decaffeinated coffee, not roasted _ United Kingdom Kg. 578 812 163 09011200 Decaffeinated coffee, not roasted _ New Zealand Kg. 150 148 164 09011200 Decaffeinated coffee, not roasted _ China Kg. 15 5 165 09011200 Decaffeinated coffee, not roasted _ Japan Kg. 1,296 406 166 09011200 Decaffeinated coffee, not roasted _ Germany Kg. 10,045 12,090 167 09011200 Decaffeinated coffee, not roasted _ Australia Kg. 250 338 168 09011200 Decaffeinated coffee, not roasted _ United Arab Emirates Kg. 500 634
169 09011200 Decaffeinated coffee, not roasted _ Taiwan, Province of China Kg. 350 445
170 09012100 Roasted coffee, not decaffeinated _ Netherlands Kg. 70 111 171 09012100 Roasted coffee, not decaffeinated _ France Kg. 52 125 172 09012100 Roasted coffee, not decaffeinated _ Korea, Republic of Kg. 5 9
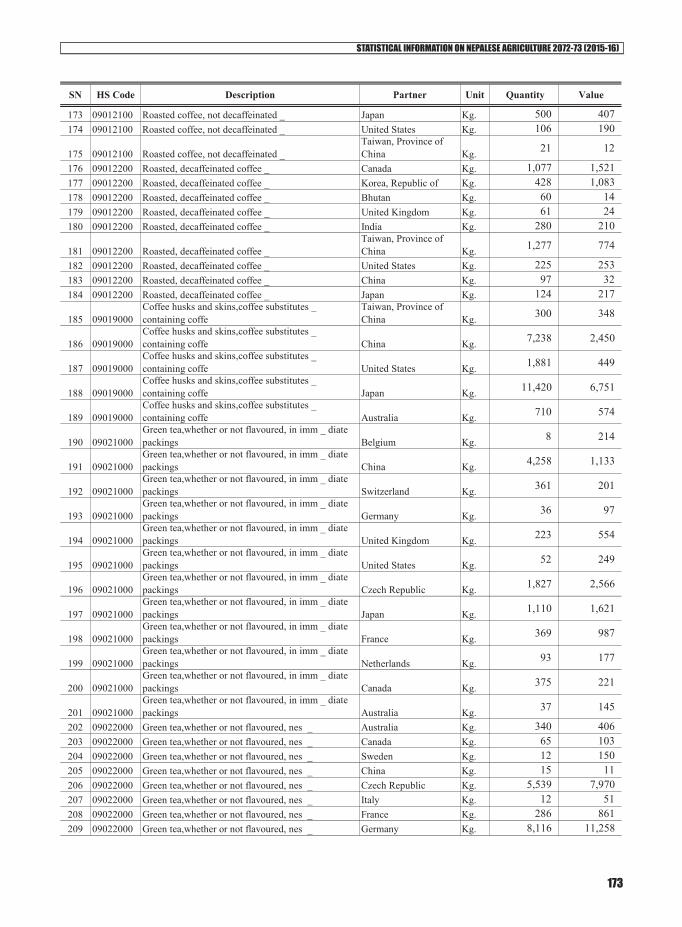
STATISTICAL INFORMATION ON NEPALESE AGRICULTURE 2072-73 (2015-16)
173
SN HS Code Description Partner Unit Quantity Value
173 09012100 Roasted coffee, not decaffeinated _ Japan Kg. 500 407 174 09012100 Roasted coffee, not decaffeinated _ United States Kg. 106 190
175 09012100 Roasted coffee, not decaffeinated _ Taiwan, Province of China Kg. 21 12
176 09012200 Roasted, decaffeinated coffee _ Canada Kg. 1,077 1,521 177 09012200 Roasted, decaffeinated coffee _ Korea, Republic of Kg. 428 1,083 178 09012200 Roasted, decaffeinated coffee _ Bhutan Kg. 60 14 179 09012200 Roasted, decaffeinated coffee _ United Kingdom Kg. 61 24 180 09012200 Roasted, decaffeinated coffee _ India Kg. 280 210
181 09012200 Roasted, decaffeinated coffee _ Taiwan, Province of China Kg. 1,277 774
182 09012200 Roasted, decaffeinated coffee _ United States Kg. 225 253 183 09012200 Roasted, decaffeinated coffee _ China Kg. 97 32 184 09012200 Roasted, decaffeinated coffee _ Japan Kg. 124 217
185 09019000Coffee husks and skins,coffee substitutes _ containing coffe
Taiwan, Province of China Kg. 300 348
186 09019000Coffee husks and skins,coffee substitutes _ containing coffe China Kg. 7,238 2,450
187 09019000Coffee husks and skins,coffee substitutes _ containing coffe United States Kg. 1,881 449
188 09019000Coffee husks and skins,coffee substitutes _ containing coffe Japan Kg. 11,420 6,751
189 09019000Coffee husks and skins,coffee substitutes _ containing coffe Australia Kg. 710 574
190 09021000Green tea,whether or not flavoured, in imm _ diate packings Belgium Kg. 8 214
191 09021000Green tea,whether or not flavoured, in imm _ diate packings China Kg. 4,258 1,133
192 09021000Green tea,whether or not flavoured, in imm _ diate packings Switzerland Kg. 361 201
193 09021000Green tea,whether or not flavoured, in imm _ diate packings Germany Kg. 36 97
194 09021000Green tea,whether or not flavoured, in imm _ diate packings United Kingdom Kg. 223 554
195 09021000Green tea,whether or not flavoured, in imm _ diate packings United States Kg. 52 249
196 09021000Green tea,whether or not flavoured, in imm _ diate packings Czech Republic Kg. 1,827 2,566
197 09021000Green tea,whether or not flavoured, in imm _ diate packings Japan Kg. 1,110 1,621
198 09021000Green tea,whether or not flavoured, in imm _ diate packings France Kg. 369 987
199 09021000Green tea,whether or not flavoured, in imm _ diate packings Netherlands Kg. 93 177
200 09021000Green tea,whether or not flavoured, in imm _ diate packings Canada Kg. 375 221
201 09021000Green tea,whether or not flavoured, in imm _ diate packings Australia Kg. 37 145
202 09022000 Green tea,whether or not flavoured, nes _ Australia Kg. 340 406 203 09022000 Green tea,whether or not flavoured, nes _ Canada Kg. 65 103 204 09022000 Green tea,whether or not flavoured, nes _ Sweden Kg. 12 150 205 09022000 Green tea,whether or not flavoured, nes _ China Kg. 15 11 206 09022000 Green tea,whether or not flavoured, nes _ Czech Republic Kg. 5,539 7,970 207 09022000 Green tea,whether or not flavoured, nes _ Italy Kg. 12 51 208 09022000 Green tea,whether or not flavoured, nes _ France Kg. 286 861 209 09022000 Green tea,whether or not flavoured, nes _ Germany Kg. 8,116 11,258
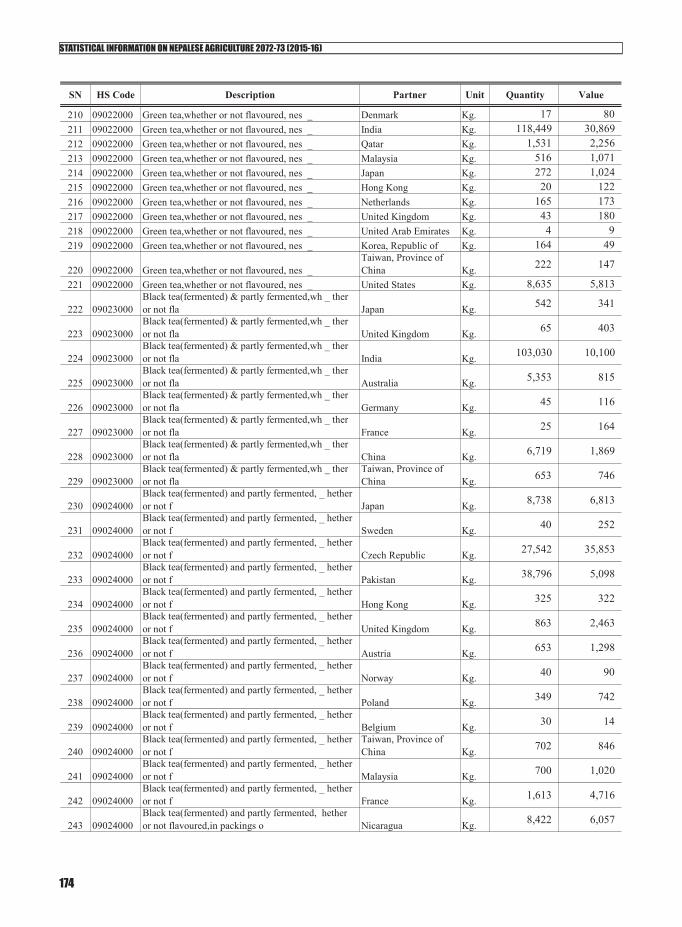
STATISTICAL INFORMATION ON NEPALESE AGRICULTURE 2072-73 (2015-16)
174
SN HS Code Description Partner Unit Quantity Value
210 09022000 Green tea,whether or not flavoured, nes _ Denmark Kg. 17 80 211 09022000 Green tea,whether or not flavoured, nes _ India Kg. 118,449 30,869 212 09022000 Green tea,whether or not flavoured, nes _ Qatar Kg. 1,531 2,256 213 09022000 Green tea,whether or not flavoured, nes _ Malaysia Kg. 516 1,071 214 09022000 Green tea,whether or not flavoured, nes _ Japan Kg. 272 1,024 215 09022000 Green tea,whether or not flavoured, nes _ Hong Kong Kg. 20 122 216 09022000 Green tea,whether or not flavoured, nes _ Netherlands Kg. 165 173 217 09022000 Green tea,whether or not flavoured, nes _ United Kingdom Kg. 43 180 218 09022000 Green tea,whether or not flavoured, nes _ United Arab Emirates Kg. 4 9 219 09022000 Green tea,whether or not flavoured, nes _ Korea, Republic of Kg. 164 49
220 09022000 Green tea,whether or not flavoured, nes _ Taiwan, Province of China Kg. 222 147
221 09022000 Green tea,whether or not flavoured, nes _ United States Kg. 8,635 5,813
222 09023000Black tea(fermented) & partly fermented,wh _ ther or not fla Japan Kg. 542 341
223 09023000Black tea(fermented) & partly fermented,wh _ ther or not fla United Kingdom Kg. 65 403
224 09023000Black tea(fermented) & partly fermented,wh _ ther or not fla India Kg. 103,030 10,100
225 09023000Black tea(fermented) & partly fermented,wh _ ther or not fla Australia Kg. 5,353 815
226 09023000Black tea(fermented) & partly fermented,wh _ ther or not fla Germany Kg. 45 116
227 09023000Black tea(fermented) & partly fermented,wh _ ther or not fla France Kg. 25 164
228 09023000Black tea(fermented) & partly fermented,wh _ ther or not fla China Kg. 6,719 1,869
229 09023000Black tea(fermented) & partly fermented,wh _ ther or not fla
Taiwan, Province of China Kg. 653 746
230 09024000Black tea(fermented) and partly fermented, _ hether or not f Japan Kg. 8,738 6,813
231 09024000Black tea(fermented) and partly fermented, _ hether or not f Sweden Kg. 40 252
232 09024000Black tea(fermented) and partly fermented, _ hether or not f Czech Republic Kg. 27,542 35,853
233 09024000Black tea(fermented) and partly fermented, _ hether or not f Pakistan Kg. 38,796 5,098
234 09024000Black tea(fermented) and partly fermented, _ hether or not f Hong Kong Kg. 325 322
235 09024000Black tea(fermented) and partly fermented, _ hether or not f United Kingdom Kg. 863 2,463
236 09024000Black tea(fermented) and partly fermented, _ hether or not f Austria Kg. 653 1,298
237 09024000Black tea(fermented) and partly fermented, _ hether or not f Norway Kg. 40 90
238 09024000Black tea(fermented) and partly fermented, _ hether or not f Poland Kg. 349 742
239 09024000Black tea(fermented) and partly fermented, _ hether or not f Belgium Kg. 30 14
240 09024000Black tea(fermented) and partly fermented, _ hether or not f
Taiwan, Province of China Kg. 702 846
241 09024000Black tea(fermented) and partly fermented, _ hether or not f Malaysia Kg. 700 1,020
242 09024000Black tea(fermented) and partly fermented, _ hether or not f France Kg. 1,613 4,716
243 09024000Black tea(fermented) and partly fermented, hether or not flavoured,in packings o Nicaragua Kg. 8,422 6,057
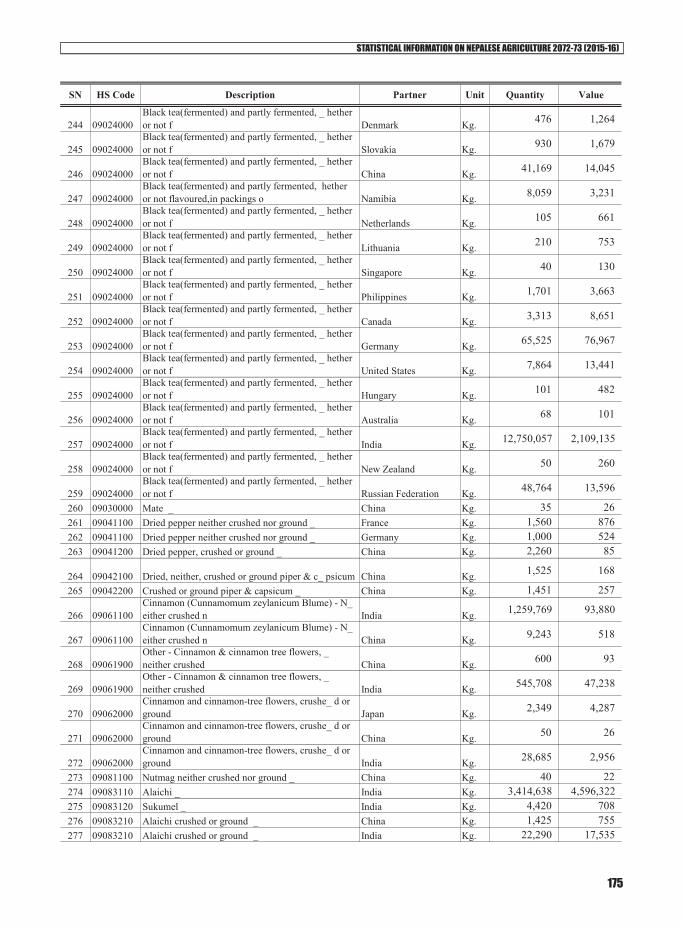
STATISTICAL INFORMATION ON NEPALESE AGRICULTURE 2072-73 (2015-16)
175
SN HS Code Description Partner Unit Quantity Value
244 09024000Black tea(fermented) and partly fermented, _ hether or not f Denmark Kg. 476 1,264
245 09024000Black tea(fermented) and partly fermented, _ hether or not f Slovakia Kg. 930 1,679
246 09024000Black tea(fermented) and partly fermented, _ hether or not f China Kg. 41,169 14,045
247 09024000Black tea(fermented) and partly fermented, hether or not flavoured,in packings o Namibia Kg. 8,059 3,231
248 09024000Black tea(fermented) and partly fermented, _ hether or not f Netherlands Kg. 105 661
249 09024000Black tea(fermented) and partly fermented, _ hether or not f Lithuania Kg. 210 753
250 09024000Black tea(fermented) and partly fermented, _ hether or not f Singapore Kg. 40 130
251 09024000Black tea(fermented) and partly fermented, _ hether or not f Philippines Kg. 1,701 3,663
252 09024000Black tea(fermented) and partly fermented, _ hether or not f Canada Kg. 3,313 8,651
253 09024000Black tea(fermented) and partly fermented, _ hether or not f Germany Kg. 65,525 76,967
254 09024000Black tea(fermented) and partly fermented, _ hether or not f United States Kg. 7,864 13,441
255 09024000Black tea(fermented) and partly fermented, _ hether or not f Hungary Kg. 101 482
256 09024000Black tea(fermented) and partly fermented, _ hether or not f Australia Kg. 68 101
257 09024000Black tea(fermented) and partly fermented, _ hether or not f India Kg. 12,750,057 2,109,135
258 09024000Black tea(fermented) and partly fermented, _ hether or not f New Zealand Kg. 50 260
259 09024000Black tea(fermented) and partly fermented, _ hether or not f Russian Federation Kg. 48,764 13,596
260 09030000 Mate _ China Kg. 35 26 261 09041100 Dried pepper neither crushed nor ground _ France Kg. 1,560 876 262 09041100 Dried pepper neither crushed nor ground _ Germany Kg. 1,000 524 263 09041200 Dried pepper, crushed or ground _ China Kg. 2,260 85
264 09042100 Dried, neither, crushed or ground piper & c_ psicum China Kg. 1,525 168
265 09042200 Crushed or ground piper & capsicum _ China Kg. 1,451 257
266 09061100Cinnamon (Cunnamomum zeylanicum Blume) - N_ either crushed n India Kg. 1,259,769 93,880
267 09061100Cinnamon (Cunnamomum zeylanicum Blume) - N_ either crushed n China Kg. 9,243 518
268 09061900Other - Cinnamon & cinnamon tree flowers, _ neither crushed China Kg. 600 93
269 09061900Other - Cinnamon & cinnamon tree flowers, _ neither crushed India Kg. 545,708 47,238
270 09062000Cinnamon and cinnamon-tree flowers, crushe_ d or ground Japan Kg. 2,349 4,287
271 09062000Cinnamon and cinnamon-tree flowers, crushe_ d or ground China Kg. 50 26
272 09062000Cinnamon and cinnamon-tree flowers, crushe_ d or ground India Kg. 28,685 2,956
273 09081100 Nutmag neither crushed nor ground _ China Kg. 40 22 274 09083110 Alaichi _ India Kg. 3,414,638 4,596,322 275 09083120 Sukumel _ India Kg. 4,420 708 276 09083210 Alaichi crushed or ground _ China Kg. 1,425 755 277 09083210 Alaichi crushed or ground _ India Kg. 22,290 17,535

STATISTICAL INFORMATION ON NEPALESE AGRICULTURE 2072-73 (2015-16)
176
SN HS Code Description Partner Unit Quantity Value
278 09092100 Seeds of coriander neither crushed nor grou_ d China Kg. 1,000 750 279 09093100 Seeds of cumin neither crushed nor ground _ China Kg. 440 105 280 09093200 Seeds of Cumin crushed or ground _ China Kg. 210 153 281 09101110 Fresh Ginger nither crushed nor ground _ India Kg. 6,894,871 195,821 282 09101190 Other Ginger crushed or ground (sutho) _ China Kg. 1,270 154 283 09101190 Other Ginger crushed or ground (sutho) _ India Kg. 20,620,534 375,307 284 09101200 Other Ginger crushed or ground _ China Kg. 166 130 285 09101200 Other Ginger crushed or ground _ India Kg. 830,373 71,411 286 09102000 Saffron _ China Kg. 90 42 287 09103010 Turmeric (Fresh) _ China Kg. 200 45 288 09103020 Turmeric (dust or Powder) _ India Kg. 4,020 708 289 09103090 Other turmeric _ Japan Kg. 155 117 290 09103090 Other turmeric _ India Kg. 3,606 5,491 291 09103090 Other turmeric _ China Kg. 1,262 207 292 09109100 Spice mixtures _ Brunei Darussalam Kg. 50 37 293 09109100 Spice mixtures _ United States Kg. 3,512 1,650 294 09109100 Spice mixtures _ Germany Kg. 25 89 295 09109100 Spice mixtures _ India Kg. 87,827 6,886 296 09109100 Spice mixtures _ China Kg. 2,570 732 297 09109100 Spice mixtures _ Japan Kg. 200 282 298 09109910 Fenugreek(Methi) _ China Kg. 2,463 251 299 09109990 Other spices nes _ China Kg. 11,470 1,015 300 09109990 Other spices nes _ India Kg. 1,457,488 98,725 301 10029000 Other rye _ China Kg. 100 11 302 10031000 Barley Seed _ Morocco Kg. 23 11 303 10051000 Maize seed _ United Kingdom Kg. 139 16 304 10051000 Maize seed _ India Kg. 100 6 305 10061000 Rice in the husk (paddy or rough) _ United Kingdom Kg. 80 6 306 10062000 Husked (brown) rice _ Japan Kg. 570 193 307 10079000 Other grain sorghum (Junelo) _ India Kg. 2,294,845 9,175 308 10081000 Buckwheat _ India Kg. 270,000 5,475 309 10082100 Millet seed _ Belgium Kg. 100 12 310 10082100 Millet seed _ United Kingdom Kg. 2,714 171 311 10082100 Millet seed _ Hong Kong Kg. 14,300 844 312 10082100 Millet seed _ Australia Kg. 1,701 67 313 10082900 Other _ China Kg. 20 2 314 10083000 Canary seeds _ India Kg. 500 10 315 10085000 Quinoa (Chenopodium quinoa) _ India Kg. 24,000 304
Total of above 10,621,610
Source: Table 13.1-13.4 Department of Customs, Nepal

STATISTICAL INFORMATION ON NEPALESE AGRICULTURE 2072-73 (2015-16)
177
Province 1 68Province 2 54Province 3 381Province 4 22Province 5 24Province 6 2Province 7 10
561
Kathmandu 283Lalitpur 40Morang 23Kaski 22Bhaktapur 20
Seasonal/Perennial/Ornamental Flower 279Cut Flower 47Loose Flower 220Garden Dubo 14Seed/Bulb/Tuber/Rhizome 1
561
Table 14 .1 Key Findings of Commercial Floriculture Survey 2072/73 (2015/16)
1. Number of Floriculture Farm by Province
Nepal2. Top 5 districts by number of Floriculture Farm
Top
5 D
istr
icts
3. Number of Floriculture Farm by Type
Nepal
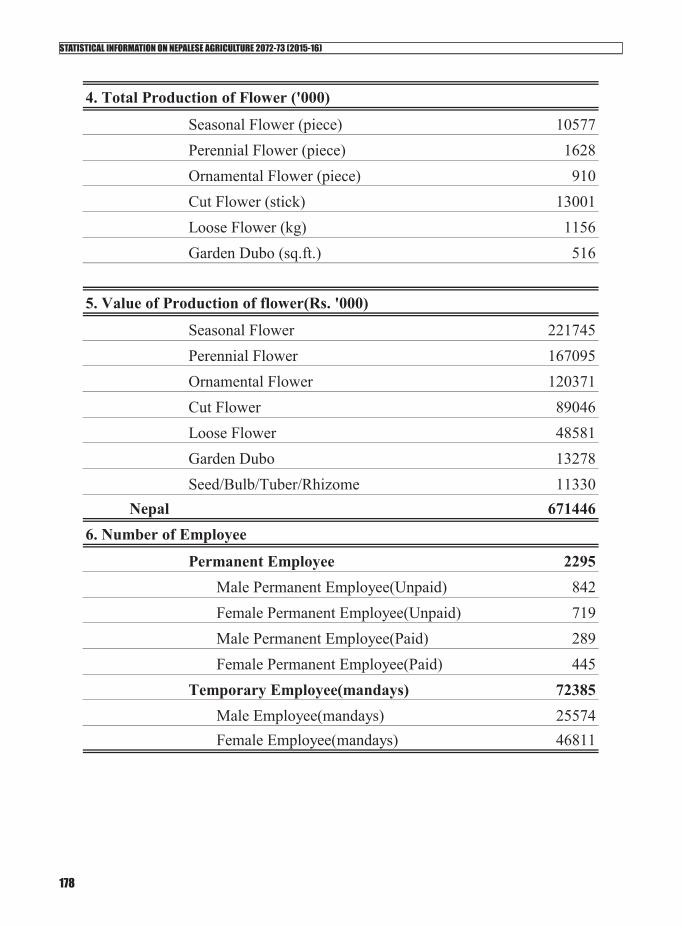
STATISTICAL INFORMATION ON NEPALESE AGRICULTURE 2072-73 (2015-16)
178
Seasonal Flower (piece) 10577Perennial Flower (piece) 1628Ornamental Flower (piece) 910Cut Flower (stick) 13001Loose Flower (kg) 1156Garden Dubo (sq.ft.) 516
Seasonal Flower 221745Perennial Flower 167095Ornamental Flower 120371Cut Flower 89046Loose Flower 48581Garden Dubo 13278Seed/Bulb/Tuber/Rhizome 11330
671446
Permanent Employee 2295 Male Permanent Employee(Unpaid) 842 Female Permanent Employee(Unpaid) 719 Male Permanent Employee(Paid) 289 Female Permanent Employee(Paid) 445Temporary Employee(mandays) 72385 Male Employee(mandays) 25574 Female Employee(mandays) 46811
6. Number of Employee
4. Total Production of Flower ('000)
5. Value of Production of flower(Rs. '000)
Nepal
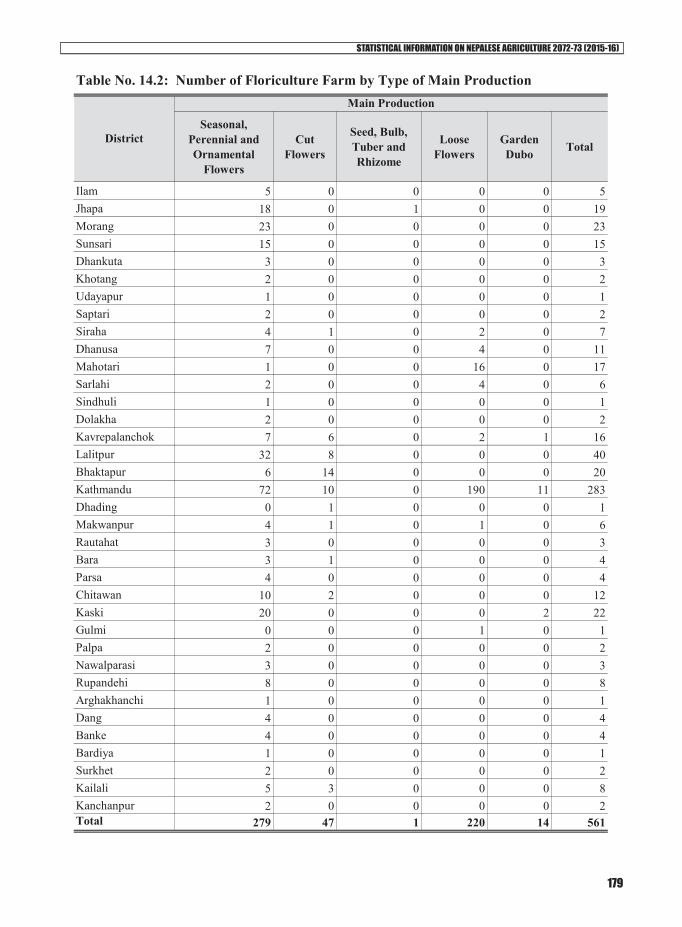
STATISTICAL INFORMATION ON NEPALESE AGRICULTURE 2072-73 (2015-16)
179
Table No. 14.2: Number of Floriculture Farm by Type of Main Production
Seasonal, Perennial and Ornamental
Flowers
Cut Flowers
Seed, Bulb, Tuber and Rhizome
Loose Flowers
Garden Dubo Total
Ilam 5 0 0 0 0 5Jhapa 18 0 1 0 0 19Morang 23 0 0 0 0 23Sunsari 15 0 0 0 0 15Dhankuta 3 0 0 0 0 3Khotang 2 0 0 0 0 2Udayapur 1 0 0 0 0 1Saptari 2 0 0 0 0 2Siraha 4 1 0 2 0 7Dhanusa 7 0 0 4 0 11Mahotari 1 0 0 16 0 17Sarlahi 2 0 0 4 0 6Sindhuli 1 0 0 0 0 1Dolakha 2 0 0 0 0 2Kavrepalanchok 7 6 0 2 1 16Lalitpur 32 8 0 0 0 40Bhaktapur 6 14 0 0 0 20Kathmandu 72 10 0 190 11 283Dhading 0 1 0 0 0 1Makwanpur 4 1 0 1 0 6Rautahat 3 0 0 0 0 3Bara 3 1 0 0 0 4Parsa 4 0 0 0 0 4Chitawan 10 2 0 0 0 12Kaski 20 0 0 0 2 22Gulmi 0 0 0 1 0 1Palpa 2 0 0 0 0 2Nawalparasi 3 0 0 0 0 3Rupandehi 8 0 0 0 0 8Arghakhanchi 1 0 0 0 0 1Dang 4 0 0 0 0 4Banke 4 0 0 0 0 4Bardiya 1 0 0 0 0 1Surkhet 2 0 0 0 0 2Kailali 5 3 0 0 0 8Kanchanpur 2 0 0 0 0 2Total 279 47 1 220 14 561
District
Main Production
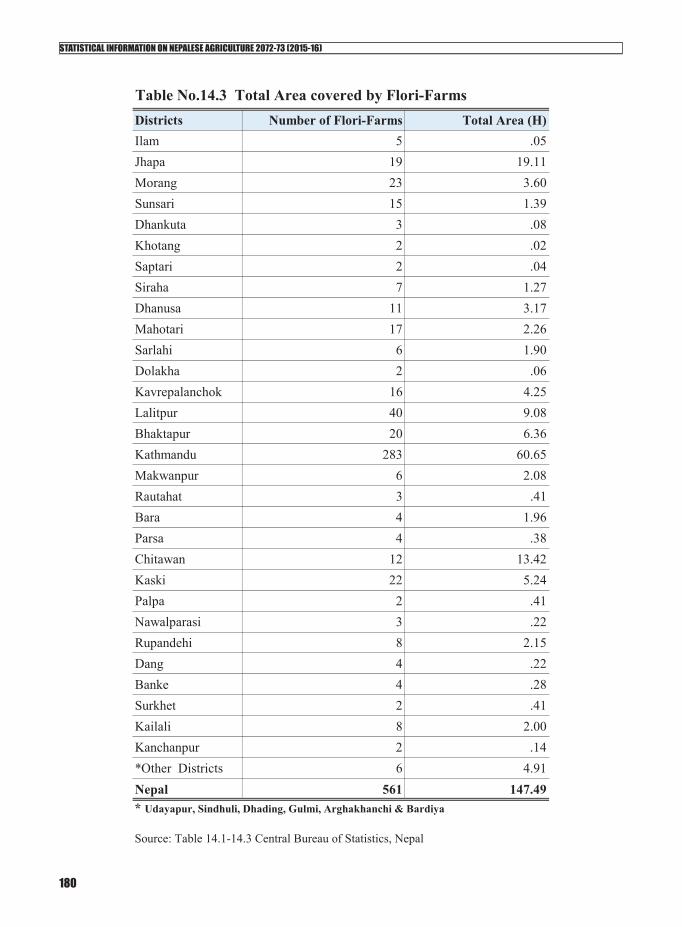
STATISTICAL INFORMATION ON NEPALESE AGRICULTURE 2072-73 (2015-16)
180
Table No.14.3 Total Area covered by Flori-FarmsDistricts Number of Flori-Farms Total Area (H)Ilam 5 .05Jhapa 19 19.11Morang 23 3.60Sunsari 15 1.39Dhankuta 3 .08Khotang 2 .02Saptari 2 .04Siraha 7 1.27Dhanusa 11 3.17Mahotari 17 2.26Sarlahi 6 1.90Dolakha 2 .06Kavrepalanchok 16 4.25Lalitpur 40 9.08Bhaktapur 20 6.36Kathmandu 283 60.65Makwanpur 6 2.08Rautahat 3 .41Bara 4 1.96Parsa 4 .38Chitawan 12 13.42Kaski 22 5.24Palpa 2 .41Nawalparasi 3 .22Rupandehi 8 2.15Dang 4 .22Banke 4 .28Surkhet 2 .41Kailali 8 2.00Kanchanpur 2 .14*Other Districts 6 4.91Nepal 561 147.49
Source: Table 14.1-14.3 Central Bureau of Statistics, Nepal
* Udayapur, Sindhuli, Dhading, Gulmi, Arghakhanchi & Bardiya
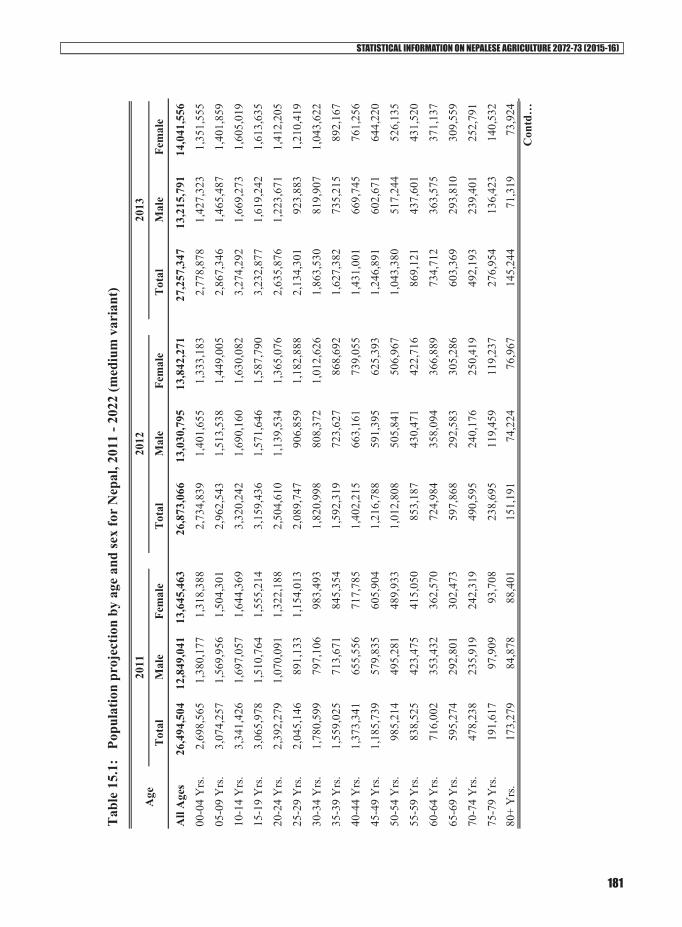
STATISTICAL INFORMATION ON NEPALESE AGRICULTURE 2072-73 (2015-16)
181
Tab
le 1
5.1:
Po
pula
tion
proj
ectio
n by
age
and
sex
for
Nep
al, 2
011
- 202
2 (m
ediu
m v
aria
nt)
Tot
alM
ale
Fem
ale
Tot
alM
ale
Fem
ale
Tot
alM
ale
Fem
ale
All
Age
s26
,494
,504
12,8
49,0
4113
,645
,463
26,8
73,0
6613
,030
,795
13,8
42,2
7127
,257
,347
13,2
15,7
9114
,041
,556
00-0
4 Y
rs.
2,69
8,56
51,
380,
177
1,31
8,38
82,
734,
839
1,40
1,65
51,
333,
183
2,77
8,87
81,
427,
323
1,35
1,55
5
05-0
9 Y
rs.
3,07
4,25
71,
569,
956
1,50
4,30
12,
962,
543
1,51
3,53
81,
449,
005
2,86
7,34
61,
465,
487
1,40
1,85
9
10-1
4 Y
rs.
3,34
1,42
61,
697,
057
1,64
4,36
93,
320,
242
1,69
0,16
01,
630,
082
3,27
4,29
21,
669,
273
1,60
5,01
9
15-1
9 Y
rs.
3,06
5,97
81,
510,
764
1,55
5,21
43,
159,
436
1,57
1,64
61,
587,
790
3,23
2,87
71,
619,
242
1,61
3,63
5
20-2
4 Y
rs.
2,39
2,27
91,
070,
091
1,32
2,18
82,
504,
610
1,13
9,53
41,
365,
076
2,63
5,87
61,
223,
671
1,41
2,20
5
25-2
9 Y
rs.
2,04
5,14
689
1,13
31,
154,
013
2,08
9,74
790
6,85
91,
182,
888
2,13
4,30
192
3,88
31,
210,
419
30-3
4 Y
rs.
1,78
0,59
979
7,10
698
3,49
31,
820,
998
808,
372
1,01
2,62
61,
863,
530
819,
907
1,04
3,62
2
35-3
9 Y
rs.
1,55
9,02
571
3,67
184
5,35
41,
592,
319
723,
627
868,
692
1,62
7,38
273
5,21
589
2,16
7
40-4
4 Y
rs.
1,37
3,34
165
5,55
671
7,78
51,
402,
215
663,
161
739,
055
1,43
1,00
166
9,74
576
1,25
6
45-4
9 Y
rs.
1,18
5,73
957
9,83
560
5,90
41,
216,
788
591,
395
625,
393
1,24
6,89
160
2,67
164
4,22
0
50-5
4 Y
rs.
985,
214
495,
281
489,
933
1,01
2,80
850
5,84
150
6,96
71,
043,
380
517,
244
526,
135
55-5
9 Y
rs.
838,
525
423,
475
415,
050
853,
187
430,
471
422,
716
869,
121
437,
601
431,
520
60-6
4 Y
rs.
716,
002
353,
432
362,
570
724,
984
358,
094
366,
889
734,
712
363,
575
371,
137
65-6
9 Y
rs.
595,
274
292,
801
302,
473
597,
868
292,
583
305,
286
603,
369
293,
810
309,
559
70-7
4 Y
rs.
478,
238
235,
919
242,
319
490,
595
240,
176
250,
419
492,
193
239,
401
252,
791
75-7
9 Y
rs.
191,
617
97,9
0993
,708
238,
695
119,
459
119,
237
276,
954
136,
423
140,
532
80+
Yrs
.17
3,27
984
,878
88,4
0115
1,19
174
,224
76,9
6714
5,24
471
,319
73,9
24Contd…
Age
2011
2012
2013

STATISTICAL INFORMATION ON NEPALESE AGRICULTURE 2072-73 (2015-16)
182
Tot
alM
ale
Fem
ale
Tot
alM
ale
Fem
ale
Tot
alM
ale
Fem
ale
All
Age
s27
,646
,053
13,4
03,4
3214
,242
,621
28,0
37,9
0413
,593
,069
14,4
44,8
3528
,431
,494
13,7
84,0
0914
,647
,486
00-0
4 Y
rs.
2,83
0,22
61,
456,
963
1,37
3,26
42,
887,
862
1,49
0,00
81,
397,
854
2,95
0,16
71,
525,
630
1,42
4,53
7
05-0
9 Y
rs.
2,78
7,93
71,
425,
486
1,36
2,45
12,
723,
597
1,39
3,16
91,
330,
429
2,67
4,27
81,
368,
495
1,30
5,78
3
10-1
4 Y
rs.
3,21
0,77
81,
638,
361
1,57
2,41
73,
138,
181
1,60
2,10
51,
536,
075
3,06
2,86
51,
564,
080
1,49
8,78
4
15-1
9 Y
rs.
3,28
4,28
31,
652,
997
1,63
1,28
73,
312,
519
1,67
3,24
51,
639,
274
3,31
7,31
51,
680,
525
1,63
6,79
0
20-2
4 Y
rs.
2,77
5,23
11,
314,
668
1,46
0,56
32,
907,
704
1,40
1,69
51,
506,
008
3,02
1,91
91,
476,
611
1,54
5,30
9
25-2
9 Y
rs.
2,18
5,57
194
6,88
91,
238,
682
2,25
2,61
398
2,07
91,
270,
534
2,34
0,93
11,
033,
222
1,30
7,70
9
30-3
4 Y
rs.
1,90
7,70
983
2,08
21,
075,
627
1,95
2,82
484
5,38
71,
107,
437
1,99
8,81
686
0,51
21,
138,
303
35-3
9 Y
rs.
1,66
4,02
174
7,74
991
6,27
21,
701,
884
760,
209
941,
676
1,74
0,78
477
1,97
096
8,81
5
40-4
4 Y
rs.
1,46
0,17
867
6,01
878
4,16
01,
490,
354
682,
940
807,
414
1,52
1,98
969
1,19
283
0,79
7
45-4
9 Y
rs.
1,27
6,23
061
3,39
866
2,83
21,
305,
186
623,
270
681,
916
1,33
4,08
663
2,12
870
1,95
8
50-5
4 Y
rs.
1,07
5,76
552
9,15
754
6,60
81,
108,
406
541,
135
567,
270
1,14
0,17
955
2,83
458
7,34
6
55-5
9 Y
rs.
886,
933
445,
126
441,
807
907,
400
453,
414
453,
986
930,
950
462,
675
468,
275
60-6
4 Y
rs.
745,
335
369,
665
375,
670
757,
069
376,
109
380,
960
770,
098
382,
738
387,
360
65-6
9 Y
rs.
610,
955
296,
240
314,
715
619,
371
299,
479
319,
891
627,
821
303,
255
324,
567
70-7
4 Y
rs.
487,
964
235,
990
251,
974
483,
713
232,
692
251,
021
482,
949
231,
131
251,
818
75-7
9 Y
rs.
306,
969
149,
273
157,
695
327,
881
157,
767
170,
114
339,
914
162,
123
177,
791
80+
Yrs
.14
9,96
973
,370
76,5
9916
1,34
378
,366
82,9
7717
6,43
284
,889
91,5
43Contd…
Age
2014
2015
2016
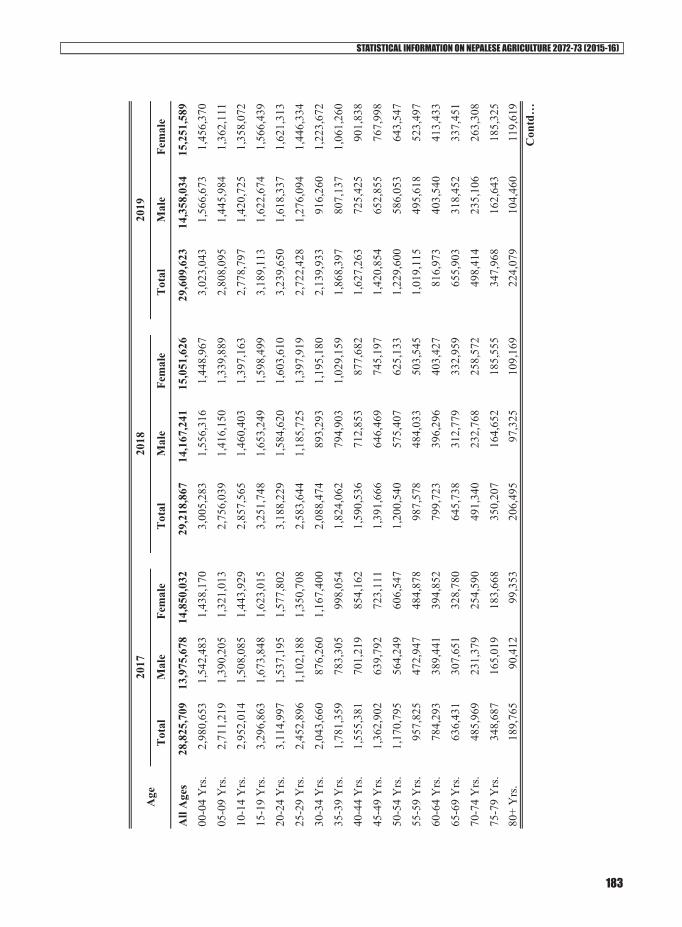
STATISTICAL INFORMATION ON NEPALESE AGRICULTURE 2072-73 (2015-16)
183
Tot
alM
ale
Fem
ale
Tot
alM
ale
Fem
ale
Tot
alM
ale
Fem
ale
All
Age
s28
,825
,709
13,9
75,6
7814
,850
,032
29,2
18,8
6714
,167
,241
15,0
51,6
2629
,609
,623
14,3
58,0
3415
,251
,589
00-0
4 Y
rs.
2,98
0,65
31,
542,
483
1,43
8,17
03,
005,
283
1,55
6,31
61,
448,
967
3,02
3,04
31,
566,
673
1,45
6,37
0
05-0
9 Y
rs.
2,71
1,21
91,
390,
205
1,32
1,01
32,
756,
039
1,41
6,15
01,
339,
889
2,80
8,09
51,
445,
984
1,36
2,11
1
10-1
4 Y
rs.
2,95
2,01
41,
508,
085
1,44
3,92
92,
857,
565
1,46
0,40
31,
397,
163
2,77
8,79
71,
420,
725
1,35
8,07
2
15-1
9 Y
rs.
3,29
6,86
31,
673,
848
1,62
3,01
53,
251,
748
1,65
3,24
91,
598,
499
3,18
9,11
31,
622,
674
1,56
6,43
9
20-2
4 Y
rs.
3,11
4,99
71,
537,
195
1,57
7,80
23,
188,
229
1,58
4,62
01,
603,
610
3,23
9,65
01,
618,
337
1,62
1,31
3
25-2
9 Y
rs.
2,45
2,89
61,
102,
188
1,35
0,70
82,
583,
644
1,18
5,72
51,
397,
919
2,72
2,42
81,
276,
094
1,44
6,33
4
30-3
4 Y
rs.
2,04
3,66
087
6,26
01,
167,
400
2,08
8,47
489
3,29
31,
195,
180
2,13
9,93
391
6,26
01,
223,
672
35-3
9 Y
rs.
1,78
1,35
978
3,30
599
8,05
41,
824,
062
794,
903
1,02
9,15
91,
868,
397
807,
137
1,06
1,26
0
40-4
4 Y
rs.
1,55
5,38
170
1,21
985
4,16
21,
590,
536
712,
853
877,
682
1,62
7,26
372
5,42
590
1,83
8
45-4
9 Y
rs.
1,36
2,90
263
9,79
272
3,11
11,
391,
666
646,
469
745,
197
1,42
0,85
465
2,85
576
7,99
8
50-5
4 Y
rs.
1,17
0,79
556
4,24
960
6,54
71,
200,
540
575,
407
625,
133
1,22
9,60
058
6,05
364
3,54
7
55-5
9 Y
rs.
957,
825
472,
947
484,
878
987,
578
484,
033
503,
545
1,01
9,11
549
5,61
852
3,49
7
60-6
4 Y
rs.
784,
293
389,
441
394,
852
799,
723
396,
296
403,
427
816,
973
403,
540
413,
433
65-6
9 Y
rs.
636,
431
307,
651
328,
780
645,
738
312,
779
332,
959
655,
903
318,
452
337,
451
70-7
4 Y
rs.
485,
969
231,
379
254,
590
491,
340
232,
768
258,
572
498,
414
235,
106
263,
308
75-7
9 Y
rs.
348,
687
165,
019
183,
668
350,
207
164,
652
185,
555
347,
968
162,
643
185,
325
80+
Yrs
.18
9,76
590
,412
99,3
5320
6,49
597
,325
109,
169
224,
079
104,
460
119,
619
Contd…
Age
2017
2018
2019
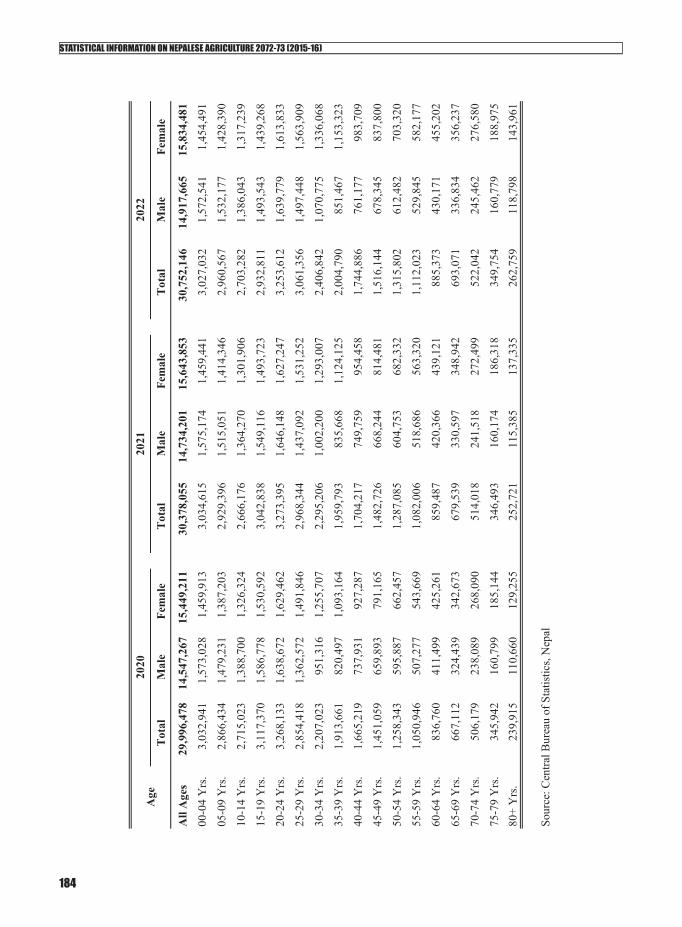
STATISTICAL INFORMATION ON NEPALESE AGRICULTURE 2072-73 (2015-16)
184
Tot
alM
ale
Fem
ale
Tot
alM
ale
Fem
ale
Tot
alM
ale
Fem
ale
All
Age
s29
,996
,478
14,5
47,2
6715
,449
,211
30,3
78,0
5514
,734
,201
15,6
43,8
5330
,752
,146
14,9
17,6
6515
,834
,481
00-0
4 Y
rs.
3,03
2,94
11,
573,
028
1,45
9,91
33,
034,
615
1,57
5,17
41,
459,
441
3,02
7,03
21,
572,
541
1,45
4,49
1
05-0
9 Y
rs.
2,86
6,43
41,
479,
231
1,38
7,20
32,
929,
396
1,51
5,05
11,
414,
346
2,96
0,56
71,
532,
177
1,42
8,39
0
10-1
4 Y
rs.
2,71
5,02
31,
388,
700
1,32
6,32
42,
666,
176
1,36
4,27
01,
301,
906
2,70
3,28
21,
386,
043
1,31
7,23
9
15-1
9 Y
rs.
3,11
7,37
01,
586,
778
1,53
0,59
23,
042,
838
1,54
9,11
61,
493,
723
2,93
2,81
11,
493,
543
1,43
9,26
8
20-2
4 Y
rs.
3,26
8,13
31,
638,
672
1,62
9,46
23,
273,
395
1,64
6,14
81,
627,
247
3,25
3,61
21,
639,
779
1,61
3,83
3
25-2
9 Y
rs.
2,85
4,41
81,
362,
572
1,49
1,84
62,
968,
344
1,43
7,09
21,
531,
252
3,06
1,35
61,
497,
448
1,56
3,90
9
30-3
4 Y
rs.
2,20
7,02
395
1,31
61,
255,
707
2,29
5,20
61,
002,
200
1,29
3,00
72,
406,
842
1,07
0,77
51,
336,
068
35-3
9 Y
rs.
1,91
3,66
182
0,49
71,
093,
164
1,95
9,79
383
5,66
81,
124,
125
2,00
4,79
085
1,46
71,
153,
323
40-4
4 Y
rs.
1,66
5,21
973
7,93
192
7,28
71,
704,
217
749,
759
954,
458
1,74
4,88
676
1,17
798
3,70
9
45-4
9 Y
rs.
1,45
1,05
965
9,89
379
1,16
51,
482,
726
668,
244
814,
481
1,51
6,14
467
8,34
583
7,80
0
50-5
4 Y
rs.
1,25
8,34
359
5,88
766
2,45
71,
287,
085
604,
753
682,
332
1,31
5,80
261
2,48
270
3,32
0
55-5
9 Y
rs.
1,05
0,94
650
7,27
754
3,66
91,
082,
006
518,
686
563,
320
1,11
2,02
352
9,84
558
2,17
7
60-6
4 Y
rs.
836,
760
411,
499
425,
261
859,
487
420,
366
439,
121
885,
373
430,
171
455,
202
65-6
9 Y
rs.
667,
112
324,
439
342,
673
679,
539
330,
597
348,
942
693,
071
336,
834
356,
237
70-7
4 Y
rs.
506,
179
238,
089
268,
090
514,
018
241,
518
272,
499
522,
042
245,
462
276,
580
75-7
9 Y
rs.
345,
942
160,
799
185,
144
346,
493
160,
174
186,
318
349,
754
160,
779
188,
975
80+
Yrs
.23
9,91
511
0,66
012
9,25
525
2,72
111
5,38
513
7,33
526
2,75
911
8,79
814
3,96
1
Sour
ce: C
entra
l Bur
eau
of S
tatis
tics,
Nep
al
Age
2020
2021
2022

STATISTICAL INFORMATION ON NEPALESE AGRICULTURE 2072-73 (2015-16)
185
S.N
. N
ame
of R
elea
sed
Var
ietie
s Y
ear
of
rele
ase
Ori
gin
Yie
ld
Pote
ntia
l M
t/ha
Mat
urity
(D
ays)
R
ecom
men
datio
n D
omai
n
CE
RE
AL
CR
OPS
E
AR
LY
RIC
E (
Ory
za sa
tiva
L.)
H
ardi
nath
-1
2004
Sr
ilank
a 5.
0 11
0 Te
rai,
Inne
r Ter
ai
C
haite
-6
1991
IR
RI
4.8
123
Tera
i, In
ner T
erai
Cha
ite-4
19
87
IRR
I 4.
5 11
8 Te
rai,
Inne
r Ter
ai
C
haite
-2
1987
IR
RI
4.8
125
Tera
i, In
ner T
erai
Bin
desh
wor
i 19
81
Indi
a 4.
0 12
8 Te
rai,
Inne
r Ter
ai
C
H-4
5 19
66
IRR
I 3.
5 11
8 Te
rai,
Inne
r Ter
ai
MA
IN S
EA
SON
RIC
E
Sa
mbh
a M
asul
i Sub
-1
2011
IR
RI
4.5
150
Inne
r
Swar
na S
ub-1
20
11
IRR
I 4.
5 15
0 Te
rai
B
arkh
e –
2014
20
11
IRR
I 3.
5 12
5 Te
rai,
Inne
r Ter
ai, R
iver
bas
in
Su
khha
Dha
n –
3 20
11
IRR
I 3.
2.4.
2 12
5 Te
rai,
Inne
r Ter
ai, R
iver
bas
in
Su
khha
Dha
n –
2 20
11
IRR
I 3.
3-3.
5 12
5 Te
rai,
Inne
r Ter
ai, R
iver
bas
in
Su
khha
Dha
n –
1 20
11
IRR
I 2.
5.3.
6 12
5 Te
rai,
Inne
r Ter
ai, R
iver
bas
in
K
hum
al –
13
2010
N
epal
4.
5 14
5 M
id h
ills
K
hum
al –
10
2010
N
epal
4.
5 14
5 M
id H
ills
Ta
raha
ra-1
20
10
IRR
I 4.
2 11
3-12
5 Te
rai a
nd E
aste
r Ter
ai
H
ardi
nath
-2
2010
In
done
sia
3.1-
4.2
125
Tera
i and
Inne
r Ter
ai
La
lka
Bas
mat
i 20
10
Nep
al
3.5
150
Cen
tral a
nd E
ster
n Te
rai
G
haiy
a –
1 20
10
IRR
I 3.
5 11
5 Te
rai,
Inne
r Ter
ai, M
id-h
ills
Su
naul
o Su
gand
ha
2008
3.8
115
Tera
i and
Inne
r Ter
ai
K
hum
al –
8
2006
9.8
158
Tera
i, In
ner T
erai
, Mid
-hill
s
Pokh
reli
Jeth
obud
ho
2006
2.7
185
600-
900
mas
l Pok
hara
val
ley
B
arkh
e 30
04
2006
3.9
157
Tera
i and
Inne
r Ter
ai
R
am
2006
4.9
133
Tera
i and
Inne
r Ter
ai
M
ithila
20
06
5.
0 14
5 Te
rai
Lo
ktan
tra
2006
3.6
130
Tera
i, In
ner T
erai
, Mid
-hill
s (30
00 fi
t)
Khu
mal
– 1
1 20
02
10
.0
144
Kat
hman
du v
alle
y
M
anju
shre
e –
2 20
02
8.
3 14
9 K
athm
andu
val
ley
Cha
ndan
nath
– 3
20
02
Chi
na
6.0
191
Jum
la v
alle
y an
d si
mila
r hig
h hi
lls (2
300
mas
l.)
C
hand
anna
th –
1
2002
C
hina
6.
0 19
1 Ju
mla
val
ley
and
sim
ilar h
igh
hills
(230
0 m
asl.)
Rel
ease
d an
d R
egis
tere
d C
rops
var
ietie
s, (1
960-
2016
)
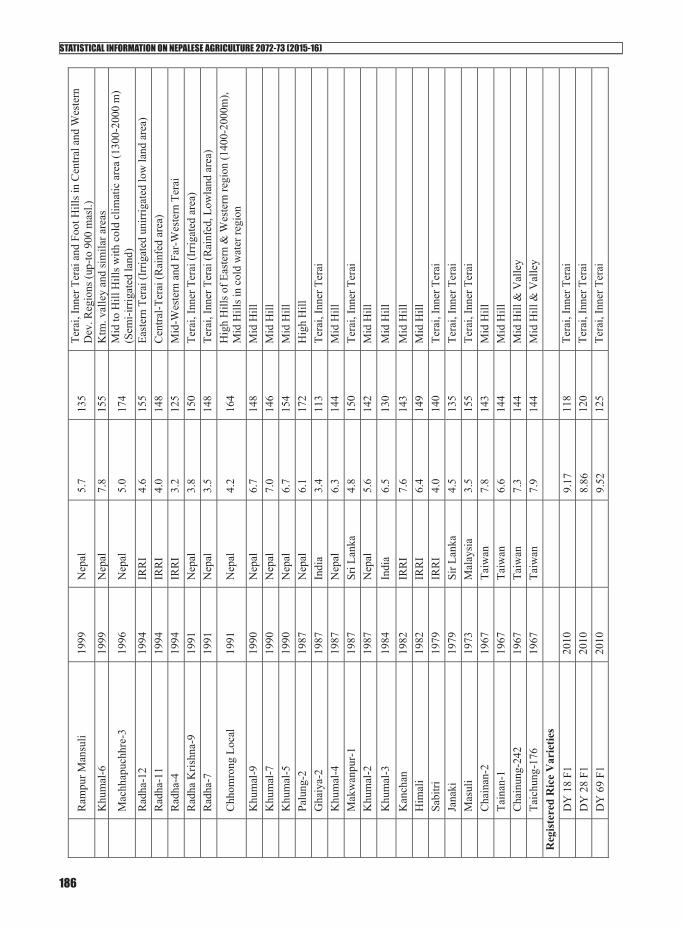
STATISTICAL INFORMATION ON NEPALESE AGRICULTURE 2072-73 (2015-16)
186
R
ampu
r Man
suli
1999
N
epal
5.
7 13
5 Te
rai,
Inne
r Ter
ai a
nd F
oot H
ills i
n C
entra
l and
Wes
tern
D
ev. R
egio
ns (u
p-to
900
mas
l.)
K
hum
al-6
19
99
Nep
al
7.8
155
Ktm
. val
ley
and
sim
ilar a
reas
M
achh
apuc
hhre
-3
1996
N
epal
5.
0 17
4 M
id to
Hill
Hill
s with
col
d cl
imat
ic a
rea
(130
0-20
00 m
) (S
emi-i
rrig
ated
land
)
Rad
ha-1
2 19
94
IRR
I 4.
6 15
5 Ea
ster
n Te
rai (
Irrig
ated
uni
rrig
ated
low
land
are
a)
R
adha
-11
1994
IR
RI
4.0
148
Cen
tral-T
erai
(Rai
nfed
are
a)
R
adha
-4
1994
IR
RI
3.2
125
Mid
-Wes
tern
and
Far
-Wes
tern
Ter
ai
R
adha
Kris
hna-
9 19
91
Nep
al
3.8
150
Tera
i, In
ner T
erai
(Irr
igat
ed a
rea)
Rad
ha-7
19
91
Nep
al
3.5
148
Tera
i, In
ner T
erai
(Rai
nfed
, Low
land
are
a)
C
hhom
rong
Loc
al
1991
N
epal
4.
2 16
4 H
igh
Hill
s of E
aste
rn &
Wes
tern
regi
on (1
400-
2000
m),
Mid
Hill
s in
cold
wat
er re
gion
Khu
mal
-9
1990
N
epal
6.
7 14
8 M
id H
ill
K
hum
al-7
19
90
Nep
al
7.0
146
Mid
Hill
Khu
mal
-5
1990
N
epal
6.
7 15
4 M
id H
ill
Pa
lung
-2
1987
N
epal
6.
1 17
2 H
igh
Hill
Gha
iya-
2 19
87
Indi
a 3.
4 11
3 Te
rai,
Inne
r Ter
ai
K
hum
al-4
19
87
Nep
al
6.3
144
Mid
Hill
Mak
wan
pur-
1 19
87
Sri L
anka
4.
8 15
0 Te
rai,
Inne
r Ter
ai
K
hum
al-2
19
87
Nep
al
5.6
142
Mid
Hill
Khu
mal
-3
1984
In
dia
6.5
130
Mid
Hill
Kan
chan
19
82
IRR
I 7.
6 14
3 M
id H
ill
H
imal
i 19
82
IRR
I 6.
4 14
9 M
id H
ill
Sa
bitri
19
79
IRR
I 4.
0 14
0 Te
rai,
Inne
r Ter
ai
Ja
naki
19
79
Sir L
anka
4.
5 13
5 Te
rai,
Inne
r Ter
ai
M
asul
i 19
73
Mal
aysi
a 3.
5 15
5 Te
rai,
Inne
r Ter
ai
C
hain
an-2
19
67
Taiw
an
7.8
143
Mid
Hill
Tain
an-1
19
67
Taiw
an
6.6
144
Mid
Hill
Cha
inun
g-24
2 19
67
Taiw
an
7.3
144
Mid
Hill
& V
alle
y
Taic
hung
-176
19
67
Taiw
an
7.9
144
Mid
Hill
& V
alle
y R
egis
tere
d R
ice
Var
ietie
s
D
Y 1
8 F1
20
10
9.
17
118
Tera
i, In
ner T
erai
DY
28
F1
2010
8.86
12
0 Te
rai,
Inne
r Ter
ai
D
Y 6
9 F1
20
10
9.
52
125
Tera
i, In
ner T
erai
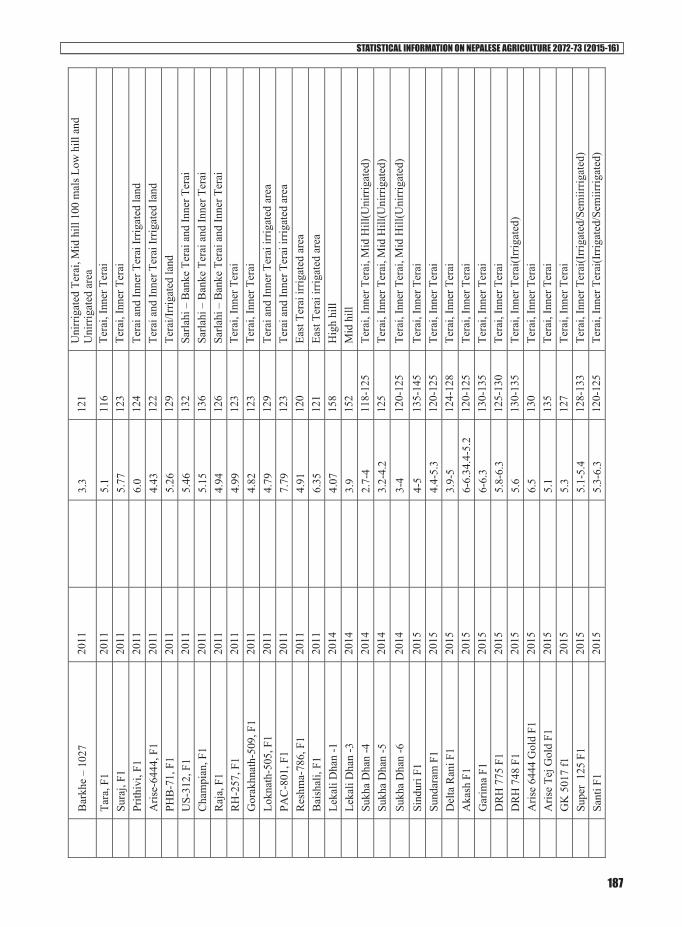
STATISTICAL INFORMATION ON NEPALESE AGRICULTURE 2072-73 (2015-16)
187
B
arkh
e –
1027
20
11
3.
3 12
1 U
nirr
igat
ed T
erai
, Mid
hill
100
mal
s Low
hill
and
U
nirr
igat
ed a
rea
Tara
, F1
20
11
5.
1 11
6 Te
rai,
Inne
r Ter
ai
Su
raj,
F1
2011
5.77
12
3 Te
rai,
Inne
r Ter
ai
Pr
ithiv
i, F1
20
11
6.
0 12
4 Te
rai a
nd In
ner T
erai
Irrig
ated
land
Aris
e-64
44, F
1
2011
4.43
12
2 Te
rai a
nd In
ner T
erai
Irrig
ated
land
PHB
-71,
F1
20
11
5.
26
129
Tera
i/Irr
igat
ed la
nd
U
S-31
2, F
1 20
11
5.
46
132
Sarla
hi –
Ban
ke T
erai
and
Inne
r Ter
ai
C
ham
pian
, F1
20
11
5.
15
136
Sarla
hi –
Ban
ke T
erai
and
Inne
r Ter
ai
R
aja,
F1
20
11
4.
94
126
Sarla
hi –
Ban
ke T
erai
and
Inne
r Ter
ai
R
H-2
57, F
1
2011
4.99
12
3 Te
rai,
Inne
r Ter
ai
G
orak
hnat
h-50
9, F
1
2011
4.82
12
3 Te
rai,
Inne
r Ter
ai
Lo
knat
h-50
5, F
1
2011
4.79
12
9 Te
rai a
nd In
ner T
erai
irrig
ated
are
a
PAC
-801
, F1
20
11
7.
79
123
Tera
i and
Inne
r Ter
ai ir
rigat
ed a
rea
R
eshm
a-78
6, F
1
2011
4.91
12
0 Ea
st T
erai
irrig
ated
are
a
Bai
shal
i, F1
20
11
6.
35
121
East
Ter
ai ir
rigat
ed a
rea
Le
kali
Dha
n -1
20
14
4.
07
158
Hig
h hi
ll
Leka
li D
han
-3
2014
3.9
152
Mid
hill
Sukh
a D
han
-4
2014
2.7-
4 11
8-12
5 Te
rai,
Inne
r Ter
ai, M
id H
ill(U
nirr
igat
ed)
Su
kha
Dha
n -5
20
14
3.
2-4.
2 12
5 Te
rai,
Inne
r Ter
ai, M
id H
ill(U
nirr
igat
ed)
Su
kha
Dha
n -6
20
14
3-
4 12
0-12
5 Te
rai,
Inne
r Ter
ai, M
id H
ill(U
nirr
igat
ed)
Si
ndur
i F1
2015
4-5
135-
145
Tera
i, In
ner T
erai
Sund
aram
F1
2015
4.4-
5.3
120-
125
Tera
i, In
ner T
erai
Del
ta R
ani F
1 20
15
3.
9-5
124-
128
Tera
i, In
ner T
erai
Aka
sh F
1 20
15
6-
6.34
.4-5
.2
120-
125
Tera
i, In
ner T
erai
Gar
ima
F1
2015
6-6.
3 13
0-13
5 Te
rai,
Inne
r Ter
ai
D
RH
775
F1
2015
5.8-
6.3
125-
130
Tera
i, In
ner T
erai
DR
H 7
48 F
1 20
15
5.
6 13
0-13
5 Te
rai,
Inne
r Ter
ai(I
rrig
ated
)
Aris
e 64
44 G
old
F1
2015
6.5
130
Tera
i, In
ner T
erai
Aris
e Te
j Gol
d F1
20
15
5.
1 13
5 Te
rai,
Inne
r Ter
ai
G
K 5
017
f1
2015
5.3
127
Tera
i, In
ner T
erai
Supe
r 12
5 F1
20
15
5.
1-5.
4 12
8-13
3 Te
rai,
Inne
r Ter
ai(Ir
rigat
ed/S
emiir
rigat
ed)
Sa
nti F
1 20
15
5.
3-6.
3 12
0-12
5 Te
rai,
Inne
r Ter
ai(Ir
rigat
ed/S
emiir
rigat
ed)
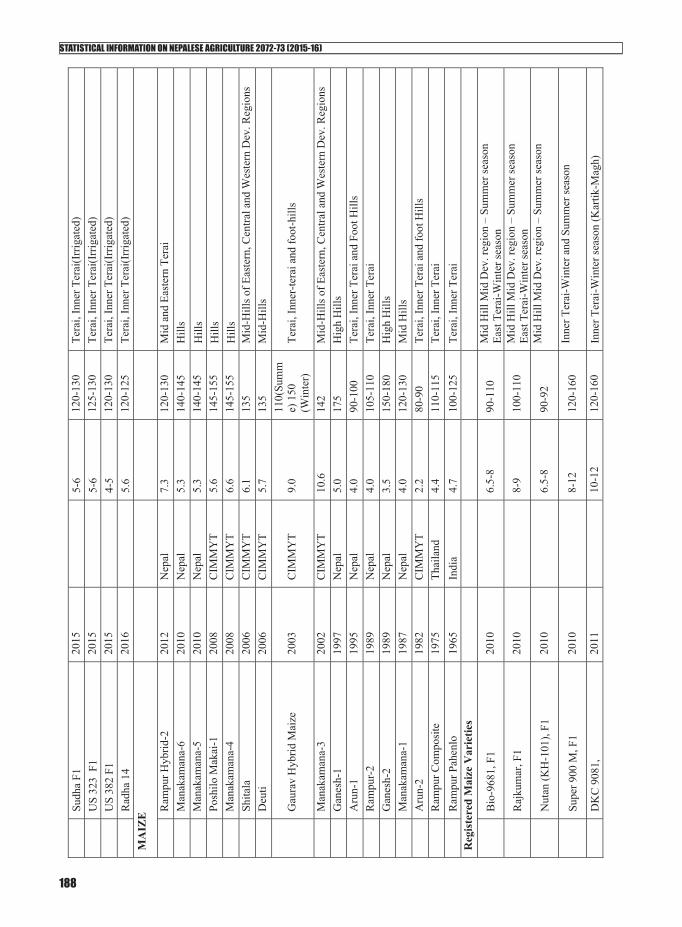
STATISTICAL INFORMATION ON NEPALESE AGRICULTURE 2072-73 (2015-16)
188
Su
dha
F1
2015
5-6
120-
130
Tera
i, In
ner T
erai
(Irr
igat
ed)
U
S 32
3 F
1 20
15
5-
6 12
5-13
0 Te
rai,
Inne
r Ter
ai(I
rrig
ated
)
US
382
F1
2015
4-5
120-
130
Tera
i, In
ner T
erai
(Irr
igat
ed)
R
adha
14
2016
5.6
120-
125
Tera
i, In
ner T
erai
(Irr
igat
ed)
MA
IZE
R
ampu
r Hyb
rid-2
20
12
Nep
al
7.3
120-
130
Mid
and
Eas
tern
Ter
ai
M
anak
aman
a-6
2010
N
epal
5.
3 14
0-14
5 H
ills
M
anak
aman
a-5
2010
N
epal
5.
3 14
0-14
5 H
ills
Po
shilo
Mak
ai-1
20
08
CIM
MY
T 5.
6 14
5-15
5 H
ills
M
anak
aman
a-4
2008
C
IMM
YT
6.6
145-
155
Hill
s
Shita
la
2006
C
IMM
YT
6.1
135
Mid
-Hill
s of E
aste
rn, C
entra
l and
Wes
tern
Dev
. Reg
ions
Deu
ti 20
06
CIM
MY
T 5.
7 13
5 M
id-H
ills
G
aura
v H
ybrid
Mai
ze
2003
C
IMM
YT
9.0
110(
Sum
me)
150
(W
inte
r)
Tera
i, In
ner-
tera
i and
foot
-hill
s
M
anak
aman
a-3
2002
C
IMM
YT
10.6
14
2 M
id-H
ills o
f Eas
tern
, Cen
tral a
nd W
este
rn D
ev. R
egio
ns
G
anes
h-1
1997
N
epal
5.
0 17
5 H
igh
Hill
s
Aru
n-1
1995
N
epal
4.
0 90
-100
Te
rai,
Inne
r Ter
ai a
nd F
oot H
ills
R
ampu
r-2
1989
N
epal
4.
0 10
5-11
0 Te
rai,
Inne
r Ter
ai
G
anes
h-2
1989
N
epal
3.
5 15
0-18
0 H
igh
Hill
s
Man
akam
ana-
1 19
87
Nep
al
4.0
120-
130
Mid
Hill
s
Aru
n-2
1982
C
IMM
YT
2.2
80-9
0 Te
rai,
Inne
r Ter
ai a
nd fo
ot H
ills
R
ampu
r Com
posit
e 19
75
Thai
land
4.
4 11
0-11
5 Te
rai,
Inne
r Ter
ai
R
ampu
r Pah
enlo
19
65
Indi
a 4.
7 10
0-12
5 Te
rai,
Inne
r Ter
ai
Reg
iste
red
Mai
ze V
arie
ties
B
io-9
681,
F1
20
10
6.
5-8
90-1
10
Mid
Hill
Mid
Dev
. reg
ion –
Sum
mer
seas
on
East
Ter
ai-W
inte
r sea
son
R
ajku
mar
, F1
20
10
8-
9 10
0-11
0 M
id H
ill M
id D
ev. r
egio
n –
Sum
mer
seas
on
East
Ter
ai-W
inte
r sea
son
N
utan
(KH
-101
), F1
20
10
6.
5-8
90-9
2 M
id H
ill M
id D
ev. r
egio
n –
Sum
mer
seas
on
Su
per 9
00 M
, F1
20
10
8-
12
120-
160
Inne
r Ter
ai-W
inte
r and
Sum
mer
seas
on
DK
C 9
081,
20
11
10
-12
120-
160
Inne
r Ter
ai-W
inte
r sea
son
(Kar
tik-M
agh)

STATISTICAL INFORMATION ON NEPALESE AGRICULTURE 2072-73 (2015-16)
189
A
lroun
der,
F1
2011
7-10
12
0-16
0 Te
rai-W
inte
r and
Sum
mer
seas
on
D
KC
707
4, F
1
2011
6-8
85-9
5 M
id H
ill M
id D
ev. r
egio
n –
Sum
mer
seas
on
East
Ter
ai-W
inte
r sea
son
30
P30,
F1
20
11
6-
7 10
0-15
5 M
id H
ill M
id D
ev. r
egio
n –
Sum
mer
seas
on
East
Ter
ai-W
inte
r sea
son
30
B 1
1, F
1
20
11
8-
9 10
5-12
0 M
id H
ill M
id D
ev. r
egio
n –
Sum
mer
seas
on
East
Ter
ai-W
inte
r sea
son
B
isco
-940
, F1
20
11
7.
13
135-
140
In
ner T
erai
and
Hill
C
-192
1, F
1
2011
5.14
-7.5
140-
167
(W
inte
r)
105-
110(
Rai
ny)
East
and
Inne
r Ter
ai a
nd M
id h
ill, L
ow a
nd T
ar
C
P-80
8, F
1
2011
9.95
130-
140
(Win
ter)
11
0-12
0(R
ainy
)
East
and
Inne
r Ter
ai
C
P-66
6, F
1
2011
6.97
11
0-12
0 Ea
st a
nd In
ner T
erai
God
awar
i -98
9, F
1
2011
7.36
10
5 Ea
st a
nd In
ner T
erai
and
Mid
hill
, Low
and
Tar
Early
- 2, F
1
2011
5.69
10
5 Ea
st a
nd In
ner T
erai
and
Mid
hill
, Low
and
Tar
TCS-
9696
, F1
20
11
8.
34
110
Inne
r Ter
ai
R
ML-
4 (I
nbre
d Li
ne)
2012
Nar
ayan
i Riv
er E
ast I
nner
Ter
ai a
nd T
erai
RM
L-2
(Inb
red
Line
) 20
12
N
aray
ani R
iver
Eas
t Inn
er T
erai
and
Ter
ai
A
dity
a-92
9, F
1
2012
7.2
121
(Day
s to
silk
ing
Nar
ayan
i Riv
er E
ast I
nner
Ter
ai a
nd T
erai
Pr
oagr
o-46
42, F
1
2012
8.29
11
5 (D
ays
to si
lkin
g N
aray
ani R
iver
Eas
t Inn
er T
erai
and
Ter
ai
B
isco
-940
New
, F1
20
12
7.
74
119
(Day
s to
silk
ing
Nar
ayan
i Riv
er E
ast I
nner
Ter
ai a
nd T
erai
C
P-83
8, F
1
2012
7.11
11
9 (D
ays
to si
lkin
g N
aray
ani R
iver
Eas
t Inn
er T
erai
and
Ter
ai
10
V10
, F1
20
12
7.
46
116
(Day
s to
silk
ing
Nar
ayan
i Riv
er E
ast I
nner
Ter
ai a
nd T
erai
D
MH
-731
4, F
1
2012
6.66
12
3 (D
ays
to si
lkin
g N
aray
ani R
iver
Eas
t Inn
er T
erai
and
Ter
ai
D
MH
-849
, F1
20
12
6.
85
113
(Day
s to
silk
ing
Nar
ayan
i Riv
er E
ast I
nner
Ter
ai a
nd T
erai
M
M-1
107,
F1
20
12
9.
0 12
3 (D
ays
to si
lkin
g N
aray
ani R
iver
Eas
t Inn
er T
erai
and
Ter
ai
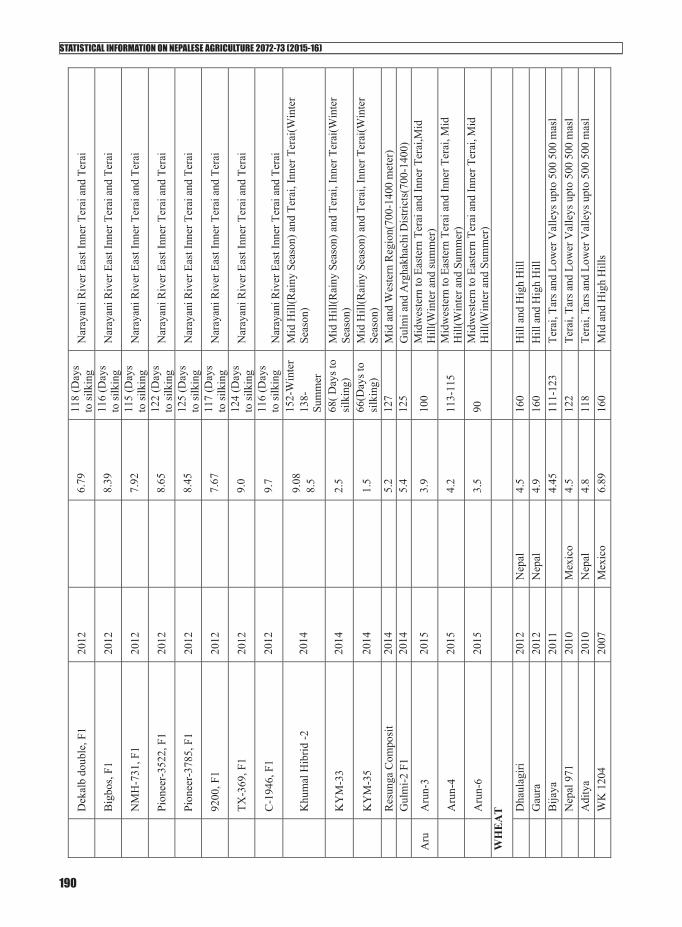
STATISTICAL INFORMATION ON NEPALESE AGRICULTURE 2072-73 (2015-16)
190
D
ekal
b do
uble
, F1
20
12
6.
79
118
(Day
s to
silk
ing
Nar
ayan
i Riv
er E
ast I
nner
Ter
ai a
nd T
erai
B
igbo
s, F1
20
12
8.
39
116
(Day
s to
silk
ing
Nar
ayan
i Riv
er E
ast I
nner
Ter
ai a
nd T
erai
N
MH
-731
, F1
20
12
7.
92
115
(Day
s to
silk
ing
Nar
ayan
i Riv
er E
ast I
nner
Ter
ai a
nd T
erai
Pi
onee
r-35
22, F
1
2012
8.65
12
2 (D
ays
to si
lkin
g N
aray
ani R
iver
Eas
t Inn
er T
erai
and
Ter
ai
Pi
onee
r-37
85, F
1
2012
8.45
12
5 (D
ays
to si
lkin
g N
aray
ani R
iver
Eas
t Inn
er T
erai
and
Ter
ai
92
00, F
1
2012
7.67
11
7 (D
ays
to si
lkin
g N
aray
ani R
iver
Eas
t Inn
er T
erai
and
Ter
ai
TX
-369
, F1
20
12
9.
0 12
4 (D
ays
to si
lkin
g N
aray
ani R
iver
Eas
t Inn
er T
erai
and
Ter
ai
C
-194
6, F
1
2012
9.7
116
(Day
s to
silk
ing
Nar
ayan
i Riv
er E
ast I
nner
Ter
ai a
nd T
erai
K
hum
al H
ibrid
-2
2014
9.08
8.
5
152-
Win
ter
138-
Sum
mer
Mid
Hill
(Rai
ny S
easo
n) a
nd T
erai
, Inn
er T
erai
(Win
ter
Seas
on)
K
YM
-33
2014
2.5
68( D
ays t
o si
lkin
g)
Mid
Hill
(Rai
ny S
easo
n) a
nd T
erai
, Inn
er T
erai
(Win
ter
Seas
on)
K
YM
-35
2014
1.5
66(D
ays t
o si
lkin
g)
Mid
Hill
(Rai
ny S
easo
n) a
nd T
erai
, Inn
er T
erai
(Win
ter
Seas
on)
R
esun
ga C
ompo
sit
2014
5.2
127
Mid
and
Wes
tern
Reg
ion(
700-
1400
met
er)
G
ulm
i-2 F
1 20
14
5.
4 12
5 G
ulm
i and
Arg
hakh
achi
Dis
trict
s(70
0-14
00)
Aru
A
run-
3 20
15
3.
9 10
0 M
idw
este
rn to
Eas
tern
Ter
ai a
nd In
ner T
erai
,Mid
H
ill(W
inte
r and
sum
mer
)
A
run-
4 20
15
4.
2 11
3-11
5 M
idw
este
rn to
Eas
tern
Ter
ai a
nd In
ner T
erai
, Mid
H
ill(W
inte
r and
Sum
mer
)
A
run-
6 20
15
3.
5 90
M
idw
este
rn to
Eas
tern
Ter
ai a
nd In
ner T
erai
, Mid
H
ill(W
inte
r and
Sum
mer
) W
HE
AT
D
haul
agiri
20
12
Nep
al
4.5
160
Hill
and
Hig
h H
ill
G
aura
20
12
Nep
al
4.9
160
Hill
and
Hig
h H
ill
B
ijaya
20
11
4.
45
111-
123
Tera
i, Ta
rs a
nd L
ower
Val
leys
upt
o 50
0 50
0 m
asl
N
epal
971
20
10
Mex
ico
4.5
122
Tera
i, Ta
rs a
nd L
ower
Val
leys
upt
o 50
0 50
0 m
asl
A
dity
a 20
10
Nep
al
4.8
118
Tera
i, Ta
rs a
nd L
ower
Val
leys
upt
o 50
0 50
0 m
asl
W
K 1
204
2007
M
exic
o 6.
89
160
Mid
and
Hig
h H
ills
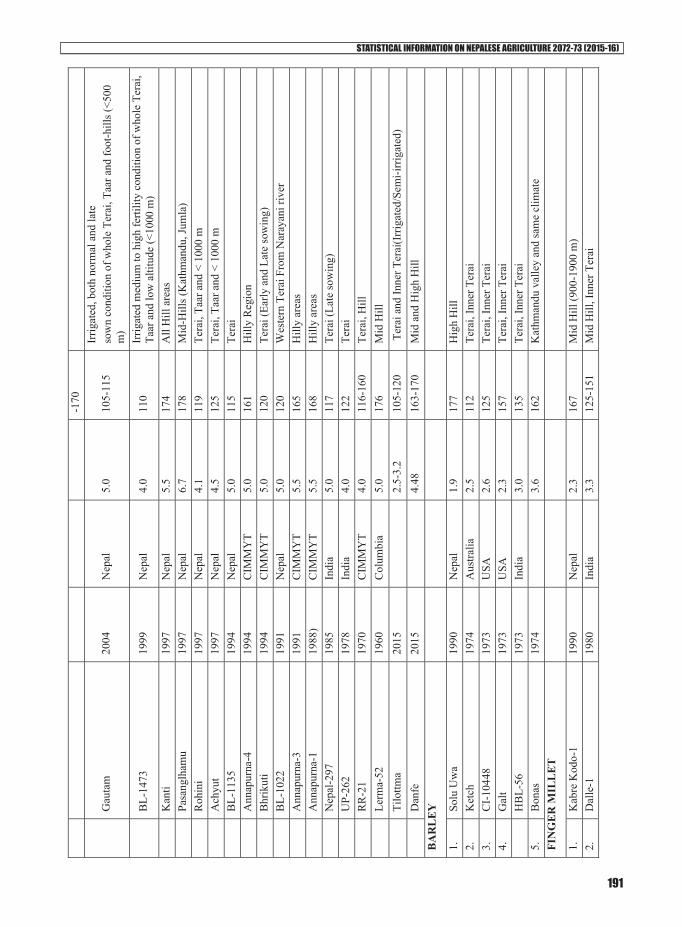
STATISTICAL INFORMATION ON NEPALESE AGRICULTURE 2072-73 (2015-16)
191
-170
G
auta
m
2004
N
epal
5.
0 10
5-11
5 Ir
rigat
ed, b
oth
norm
al a
nd la
te
sow
n co
nditi
on o
f who
le T
erai
, Taa
r and
foot
-hill
s (<5
00
m)
B
L-14
73
1999
N
epal
4.
0 11
0 Ir
rigat
ed m
ediu
m to
hig
h fe
rtilit
y co
nditi
on o
f who
le T
erai
, Ta
ar a
nd lo
w a
ltitu
de (<
1000
m)
K
anti
1997
N
epal
5.
5 17
4 A
ll H
ill a
reas
Pasa
nglh
amu
1997
N
epal
6.
7 17
8 M
id-H
ills (
Kat
hman
du, J
umla
)
Roh
ini
1997
N
epal
4.
1 11
9 Te
rai,
Taar
and
< 1
000
m
A
chyu
t 19
97
Nep
al
4.5
125
Tera
i, Ta
ar a
nd <
100
0 m
BL-
1135
19
94
Nep
al
5.0
115
Tera
i
Ann
apur
na-4
19
94
CIM
MY
T 5.
0 16
1 H
illy
Reg
ion
B
hrik
uti
1994
C
IMM
YT
5.0
120
Tera
i (Ea
rly a
nd L
ate
sow
ing)
BL-
1022
19
91
Nep
al
5.0
120
Wes
tern
Ter
ai F
rom
Nar
ayan
i riv
er
A
nnap
urna
-3
1991
C
IMM
YT
5.5
165
Hill
y ar
eas
A
nnap
urna
-1
1988
) C
IMM
YT
5.5
168
Hill
y ar
eas
N
epal
-297
19
85
Indi
a 5.
0 11
7 Te
rai (
Late
sow
ing)
UP-
262
1978
In
dia
4.0
122
Tera
i
RR
-21
1970
C
IMM
YT
4.0
116-
160
Tera
i, H
ill
Le
rma-
52
1960
C
olum
bia
5.0
176
Mid
Hill
Tilo
ttma
2015
2.5-
3.2
105-
120
Ter
ai a
nd In
ner T
erai
(Irr
igat
ed/S
emi-i
rrig
ated
)
Dan
fe
2015
4.48
16
3-17
0 M
id a
nd H
igh
Hill
B
AR
LE
Y
1.
Solu
Uw
a 19
90
Nep
al
1.9
177
Hig
h H
ill
2.
Ket
ch
1974
A
ustra
lia
2.5
112
Tera
i, In
ner T
erai
3.
C
I-10
448
1973
U
SA
2.6
125
Tera
i, In
ner T
erai
4.
G
alt
1973
U
SA
2.3
157
Tera
i, In
ner T
erai
HB
L-56
19
73
Indi
a 3.
0 13
5 Te
rai,
Inne
r Ter
ai
5.
Bon
as
1974
3.6
162
Kat
hman
du v
alle
y an
d sa
me
clim
ate
FIN
GE
R M
ILL
ET
1.
Kab
re K
odo-
1 19
90
Nep
al
2.3
167
Mid
Hill
(900
-190
0 m
) 2.
D
alle
-1
1980
In
dia
3.3
125-
151
Mid
Hill
, Inn
er T
erai

STATISTICAL INFORMATION ON NEPALESE AGRICULTURE 2072-73 (2015-16)
192
3.
Okh
le-1
19
80
Nep
al
3.3
154-
194
Mid
and
Hig
h H
ill
4.
Sailu
ng -1
20
15
2.
4 15
5 M
id H
ill a
nd H
igh
Hill
(130
0-22
00 m
) 5
Kab
re-2
20
15
2.
5 15
3 M
id H
ill (7
00-1
800
m )
GR
AIN
LE
GU
ME
S L
EN
TIL
1.
Mah
eshw
or B
hara
ti 20
08
Syria
1.
5 16
3 M
id a
nd L
ow h
ills
2.
Sagu
n 20
08
Syria
1.
4 16
0 M
id a
nd L
ow h
ills
3.
Shita
l 20
04
Paki
stan
2.
0 13
4 W
hole
Ter
ai a
nd M
id-h
ills
4.
Kha
jura
Mus
uro-
2 19
99
Nep
al
2.1
134
Tera
i of M
id a
nd F
ar-w
este
rn D
ev. R
egio
ns
5.
Kha
jura
Mus
uro-
1 19
99
Nep
al
1.5
128
Tera
i of M
id a
nd F
ar-w
este
rn D
ev. R
egio
ns
6.
Shik
har
1990
Pa
kist
an
3.5
143
Tera
i, In
ner T
erai
, Mid
Hill
7.
Si
mal
19
90
Indi
a 4.
1 14
3 Te
rai,
Inne
r Ter
ai, M
id H
ill
8.
Shis
hir
1979
In
dia
2.0
150
Tera
i, In
ner T
erai
, Mid
Hill
9.
Si
mrik
19
79
Indi
a 1.
5 14
3 Te
rai,
Mid
Hill
10
. Si
ndur
19
79
Nep
al
1.5
148
Tera
i, M
id H
ill
CH
ICK
PEA
1.
Tara
20
08
Nep
al
1.4
135
Mid
and
Low
hill
s 2.
A
vrod
hi
2008
In
dia
1.4
135
Mid
and
Low
hill
s 3.
K
alik
a 19
90
Indi
a 1.
4 15
2 Te
rai,
Innd
er T
erai
4.
K
oshe
li 19
90
Indi
a 1.
6 15
4 Te
rai W
este
rn &
Inne
r Ter
ai
5.
Sita
19
87
Indi
a 1.
5 14
0 Te
rai
6.
Rad
ha
1987
In
dia
1.6
142
Tera
i 7.
D
hanu
sh
1979
N
epal
1.
8 14
4 Te
rai
SOY
BE
AN
1.
Puja
20
06
3.
1 12
5 Te
rai,
Inne
r Ter
ai a
nd M
id H
ill
2.
Tark
ari B
hatm
as-1
20
04
Chi
na
11 (P
ods)
2.
3 (S
eed)
12
0 M
id H
ill
3.
Lum
le-1
19
96
Nep
al
1.7
138-
147
Mid
Hill
(400
-160
0 m
) 4.
C
obb
1990
U
SA
2.5
123
Tera
i, In
ner T
erai
5.
Se
ti 19
90
Taiw
an
1.2
150
Mid
Hill
, Val
ley
6.
Ran
som
19
87
USA
1.
0 14
5 M
id H
ill, V
alle
y 7.
H
arde
e 19
78
USA
2.
4 12
4 Te
rai,
Inne
r Ter
ai
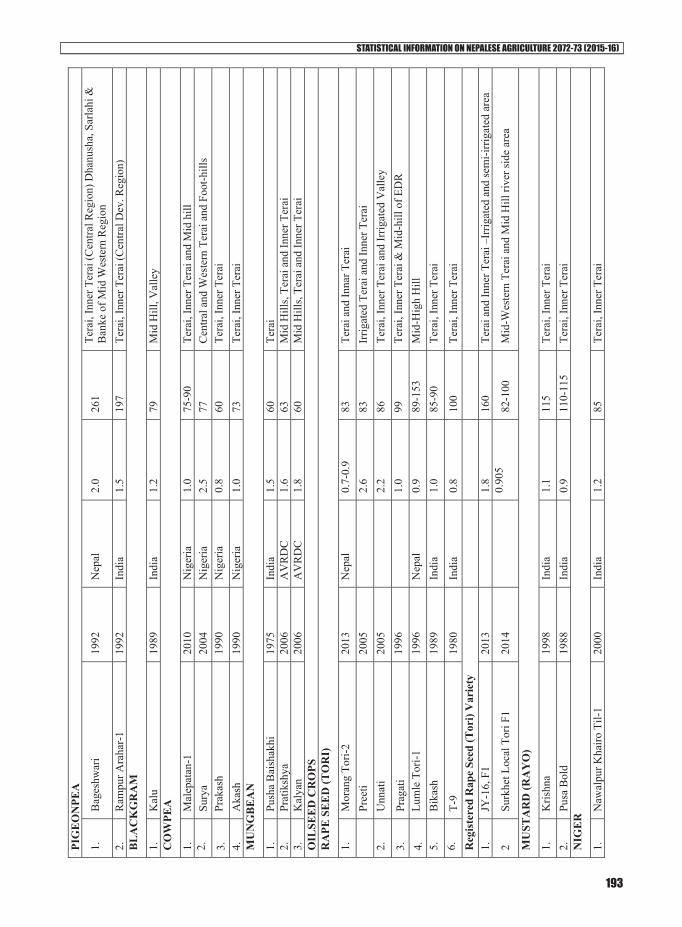
STATISTICAL INFORMATION ON NEPALESE AGRICULTURE 2072-73 (2015-16)
193
PIG
EO
NPE
A
1.
Bag
eshw
ari
1992
N
epal
2.
0 26
1 Te
rai,
Inne
r Ter
ai (C
entra
l Reg
ion)
Dha
nush
a, S
arla
hi &
B
anke
of M
id W
este
rn R
egio
n 2.
R
ampu
r Ara
har-
1 19
92
Indi
a 1.
5 19
7 Te
rai,
Inne
r Ter
ai (C
entra
l Dev
. Reg
ion)
B
LA
CK
GR
AM
1.
Kal
u 19
89
Indi
a 1.
2 79
M
id H
ill, V
alle
y C
OW
PEA
1.
Mal
epat
an-1
20
10
Nig
eria
1.
0 75
-90
Tera
i, In
ner T
erai
and
Mid
hill
2.
Su
rya
2004
N
iger
ia
2.5
77
Cen
tral a
nd W
este
rn T
erai
and
Foo
t-hill
s 3.
Pr
akas
h 19
90
Nig
eria
0.
8 60
Te
rai,
Inne
r Ter
ai
4.
Aka
sh
1990
N
iger
ia
1.0
73
Tera
i, In
ner T
erai
M
UN
GB
EA
N
1.
Push
a B
aish
akhi
19
75
Indi
a 1.
5 60
Te
rai
2.
Prat
iksh
ya
2006
A
VR
DC
1.
6 63
M
id H
ills,
Tera
i and
Inne
r Ter
ai
3.
Kal
yan
2006
A
VR
DC
1.
8 60
M
id H
ills,
Tera
i and
Inne
r Ter
ai
OIL
SEE
D C
RO
PS
RA
PE S
EE
D (T
OR
I)
1.
Mor
ang
Tori-
2 20
13
Nep
al
0.7-
0.9
83
Tera
i and
Inna
r Ter
ai
Pr
eeti
2005
2.6
83
Irrig
ated
Ter
ai a
nd In
ner T
erai
2.
U
nnat
i 20
05
2.
2 86
Te
rai,
Inne
r Ter
ai a
nd Ir
rigat
ed V
alle
y
3.
Prag
ati
1996
1.0
99
Tera
i, In
ner T
erai
& M
id-h
ill o
f ED
R
4.
Lum
le T
ori-1
19
96
Nep
al
0.9
89-1
53
Mid
-Hig
h H
ill
5.
Bik
ash
1989
In
dia
1.0
85-9
0 Te
rai,
Inne
r Ter
ai
6.
T-9
1980
In
dia
0.8
100
Tera
i, In
ner T
erai
R
egis
tere
d R
ape
Seed
(Tor
i) V
arie
ty
1.
JY-1
6, F
1
2013
1.8
160
Tera
i and
Inne
r Ter
ai –
Irrig
ated
and
sem
i-irr
igat
ed a
rea
2 Su
rkhe
t Loc
al T
ori F
1 20
14
0.
905
82
-100
M
id-W
este
rn T
erai
and
Mid
Hill
rive
r sid
e ar
ea
MU
STA
RD
(RA
YO
)
1.
Kris
hna
1998
In
dia
1.1
115
Tera
i, In
ner T
erai
2.
Pu
sa B
old
1988
In
dia
0.9
110-
115
Tera
i, In
ner T
erai
N
IGE
R
1.
Naw
alpu
r Kha
iro T
il-1
20
00
Indi
a 1.
2 85
Te
rai,
Inne
r Ter
ai
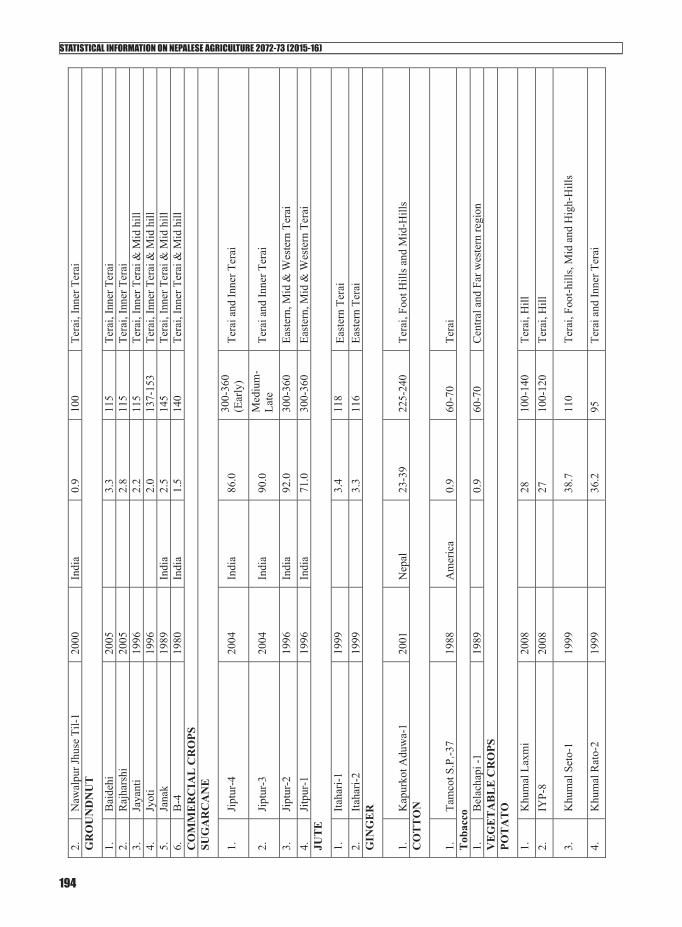
STATISTICAL INFORMATION ON NEPALESE AGRICULTURE 2072-73 (2015-16)
194
2.
Naw
alpu
r Jhu
se T
il-1
20
00
Indi
a 0.
9 10
0 Te
rai,
Inne
r Ter
ai
GR
OU
ND
NU
T
1.
Bai
dehi
20
05
3.
3 11
5 Te
rai,
Inne
r Ter
ai
2.
Raj
hars
hi
2005
2.8
115
Tera
i, In
ner T
erai
3.
Ja
yant
i 19
96
2.
2 11
5 Te
rai,
Inne
r Ter
ai &
Mid
hill
4.
Jy
oti
1996
2.0
137-
153
Tera
i, In
ner T
erai
& M
id h
ill
5.
Jana
k 19
89
Indi
a 2.
5 14
5 Te
rai,
Inne
r Ter
ai &
Mid
hill
6.
B
-4
1980
In
dia
1.5
140
Tera
i, In
ner T
erai
& M
id h
ill
CO
MM
ER
CIA
L C
RO
PS
SUG
AR
CA
NE
1.
Jipt
ur-4
20
04
Indi
a 86
.0
300-
360
(Ear
ly)
Tera
i and
Inne
r Ter
ai
2.
Jipt
ur-3
20
04
Indi
a 90
.0
Med
ium
-La
te
Tera
i and
Inne
r Ter
ai
3.
Jipt
ur-2
19
96
Indi
a 92
.0
300-
360
East
ern,
Mid
& W
este
rn T
erai
4.
Ji
tpur
-1
1996
In
dia
71.0
30
0-36
0 Ea
ster
n, M
id &
Wes
tern
Ter
ai
JUT
E
1.
Itaha
ri-1
1999
3.4
118
East
ern
Tera
i 2.
Ita
hari-
2 19
99
3.
3 11
6 Ea
ster
n Te
rai
GIN
GE
R
1.
Kap
urko
t Adu
wa-
1 20
01
Nep
al
23-3
9 22
5-24
0 Te
rai,
Foot
Hill
s and
Mid
-Hill
s C
OT
TO
N
1.
Tam
cot S
.P.-3
7 19
88
Am
eric
a 0.
9 60
-70
Tera
i T
obac
co
1.
Bel
acha
pi -1
19
89
0.
9 60
-70
Cen
tral a
nd F
ar w
este
rn re
gion
V
EG
ET
AB
LE
CR
OPS
PO
TA
TO
1.
Khu
mal
Lax
mi
2008
28
100-
140
Tera
i, H
ill
2.
IYP-
8 20
08
27
10
0-12
0 Te
rai,
Hill
3.
Khu
mal
Set
o-1
1999
38.7
11
0 Te
rai,
Foot
-hill
s, M
id a
nd H
igh-
Hill
s
4.
Khu
mal
Rat
o-2
1999
36.2
95
Te
rai a
nd In
ner T
erai

STATISTICAL INFORMATION ON NEPALESE AGRICULTURE 2072-73 (2015-16)
195
5.
Jana
kDev
19
99
Nep
al
39.4
11
0 Te
rai,
Foot
-hill
s, M
id a
nd H
igh-
Hill
s 6.
D
esire
19
92
Net
herla
nds
18.0
90
-120
H
igh
& M
id H
ill, T
erai
7.
K
ufri
Sind
uri
1992
In
dia
23.0
11
0-12
0 M
id H
ill a
nd T
erai
8.
Kuf
ri Jy
oti
1992
In
dia
23.0
11
0-12
0 H
igh
and
Mid
Hill
9.
Khu
mal
Ujw
al
2014
25-2
7 11
0-12
0 Te
rai,
Inne
r Ter
ai
10.
Khu
mal
Upa
har
2014
24
100-
120
Mid
Hill
, Hig
h H
ill
11.
TPS
1 F1
20
14
35
-40
110-
120
Tera
i, M
id H
ill (I
rrig
ated
) 12
. TP
S 2
F1
2014
30-3
5 11
0-12
0 Te
rai,
Mid
Hill
(Irr
igat
ed)
CA
UL
IFL
OW
ER
Sa
rlahi
Dip
ali
1994
In
dia
8.0
55-6
0 M
id H
ill, T
erai
D
olpa
Sno
wba
l 19
94
Hol
land
15
.0
110-
120
Hig
h &
Mid
Hill
, Ter
ai
K
athm
andu
Loc
al
1990
N
epal
25
.0
100-
120
Hig
h &
Mid
Hill
, Ter
ai
Reg
iste
red
Cau
liflo
wer
Var
ietie
s
N
S 60
N, F
1
2010
26-3
0 55
-60
Tera
i and
Hill
NS
106,
F1
20
10
28
-34
70-7
5 Te
rai,
Hill
and
Hig
h H
ill
N
S 90
, F1
20
10
40
-60
90-9
5 Te
rai,
Hill
and
Hig
h H
ill
A
nna
90, F
1
2010
45-5
6 90
Te
rai,
Hill
and
Hig
h H
ill
A
nna
Cup
, F1
20
10
30
60
Te
rai,
Hill
and
Hig
h H
ill
R
eny,
F1
20
10
36
-40
81
Tera
i, H
ill a
nd H
igh
Hill
Dm
i, F1
20
10
40
-44
70
Tera
i, H
ill a
nd H
igh
Hill
Um
iko,
F1
20
10
26
-30
75
Tera
i, H
ill a
nd H
igh
Hill
Sno
Bes
t, F1
20
10
30
-40
70-7
5 Te
rai,
Hill
and
Hig
h H
ill
W
hite
Ijla
nd,
F1
2010
33
50-5
5 Te
rai a
nd M
id H
ill
W
hite
Fla
s, F1
20
10
45
11
0 M
id H
ill
M
ilkiw
e, F
1
2010
52.5
12
0 Te
rai a
nd M
id H
ill
K
asm
ire, F
1
2010
52.5
11
0 Te
rai a
nd M
id H
ill
K
yand
id C
harm
, F1
20
10
52
.5
110
Tera
i and
Mid
Hill
Uko
n, F
1
2010
56
110
Tera
i and
Mid
Hill
Nep
a W
hite
, F1
20
10
38
10
0 Te
rai a
nd M
id H
ill
Sn
ow K
row
n, F
1
2010
22-2
5 70
Te
rai a
nd H
ill
Sn
ow M
istik
, F1
20
10
35
-40
80
Tera
i and
Hill
Snow
Gre
ss, F
1
2010
35-4
0 73
Te
rai a
nd H
ill
N
epa
60, F
1
2010
26-2
8 55
Te
rai a
nd H
ill
Sn
ow Q
ueen
, F1
20
10
20
-22
50
Tera
i and
Hill
Snow
Dom
, F1
20
10
40
-45
85
Tera
i and
Hill
Snow
Mar
ch, F
1
2010
50-5
5 18
0 Te
rai a
nd H
ill
W
hite
cup
, F1
20
10
15
-16
50-5
5 Te
rai a
nd H
ill
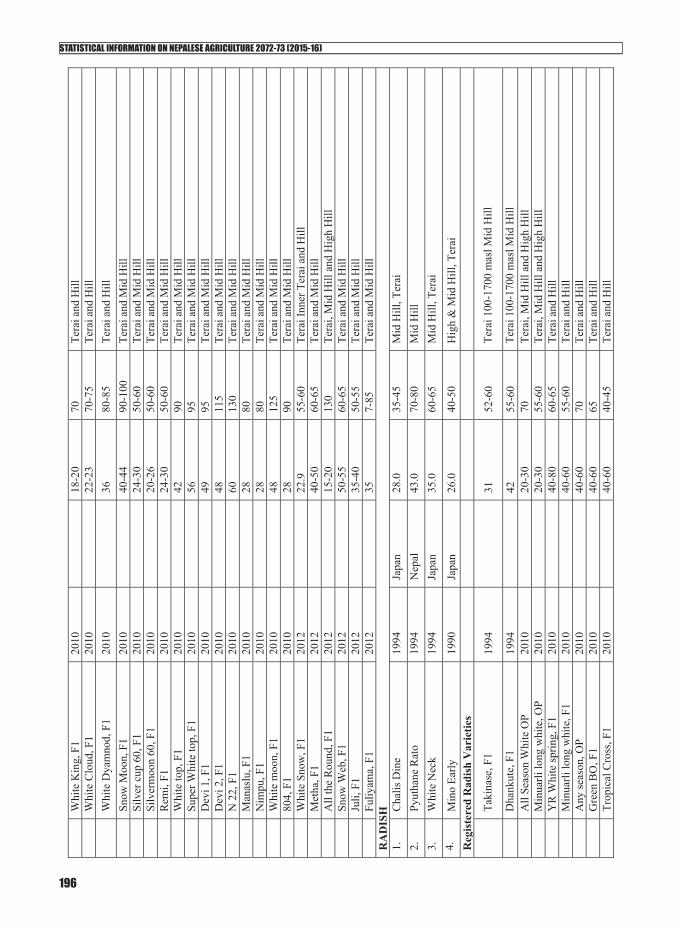
STATISTICAL INFORMATION ON NEPALESE AGRICULTURE 2072-73 (2015-16)
196
W
hite
Kin
g, F
1
2010
18-2
0 70
Te
rai a
nd H
ill
W
hite
Clo
ud, F
1
2010
22-2
3 70
-75
Tera
i and
Hill
Whi
te D
yam
nod,
F1
20
10
36
80
-85
Tera
i and
Hill
Snow
Moo
n, F
1
2010
40-4
4 90
-100
Te
rai a
nd M
id H
ill
Si
lver
cup
60,
F1
20
10
24
-30
50-6
0 Te
rai a
nd M
id H
ill
Si
lver
moo
n 60
, F1
20
10
20
-26
50-6
0 Te
rai a
nd M
id H
ill
R
emi,
F1
2010
24-3
0 50
-60
Tera
i and
Mid
Hill
Whi
te to
p, F
1
2010
42
90
Tera
i and
Mid
Hill
Supe
r Whi
te to
p, F
1
2010
56
95
Tera
i and
Mid
Hill
Dev
i 1, F
1
2010
49
95
Tera
i and
Mid
Hill
Dev
i 2, F
1
2010
48
115
Tera
i and
Mid
Hill
N 2
2, F
1
2010
60
130
Tera
i and
Mid
Hill
Man
aslu
, F1
20
10
28
80
Te
rai a
nd M
id H
ill
N
impu
, F1
20
10
28
80
Te
rai a
nd M
id H
ill
W
hite
moo
n, F
1
2010
48
125
Tera
i and
Mid
Hill
804,
F1
20
10
28
90
Te
rai a
nd M
id H
ill
W
hite
Sno
w, F
1
2012
22.9
55
-60
Tera
i Inn
er T
erai
and
Hill
Met
ha, F
1
2012
40-5
0 60
-65
Tera
i and
Mid
Hill
All
the
Rou
nd, F
1
2012
15-2
0 13
0 Te
rai,
Mid
Hill
and
Hig
h H
ill
Sn
ow W
eb, F
1
2012
50-5
5 60
-65
Tera
i and
Mid
Hill
Juli,
F1
20
12
35
-40
50-5
5 Te
rai a
nd M
id H
ill
Fu
liyam
a, F
1
2012
35
7-85
Te
rai a
nd M
id H
ill
RA
DIS
H
1.
Cha
lis D
ine
1994
Ja
pan
28.0
35
-45
Mid
Hill
, Ter
ai
2.
Pyut
hane
Rat
o 19
94
Nep
al
43.0
70
-80
Mid
Hill
3.
W
hite
Nec
k 19
94
Japa
n 35
.0
60-6
5 M
id H
ill, T
erai
4.
M
ino
Early
19
90
Japa
n 26
.0
40-5
0 H
igh
& M
id H
ill, T
erai
R
egis
tere
d R
adis
h V
arie
ties
Taki
nase
, F1
19
94
31
52
-60
Tera
i 100
-170
0 m
asl M
id H
ill
D
hank
ute,
F1
19
94
42
55
-60
Tera
i 100
-170
0 m
asl M
id H
ill
A
ll Se
ason
Whi
te O
P 20
10
20
-30
70
Tera
i, M
id H
ill a
nd H
igh
Hill
Min
uarli
long
whi
te, O
P 20
10
20
-30
55-6
0 Te
rai,
Mid
Hill
and
Hig
h H
ill
Y
R W
hite
sprin
g, F
1
2010
40-8
0 60
-65
Tera
i and
Hill
Min
uarli
long
whi
te, F
1
2010
40-6
0 55
-60
Tera
i and
Hill
Any
seas
on, O
P 20
10
40
-60
70
Tera
i and
Hill
Gre
en B
O, F
1
2010
40-6
0 65
Te
rai a
nd H
ill
Tr
opic
al C
ross
, F1
20
10
40
-60
40-4
5 Te
rai a
nd H
ill
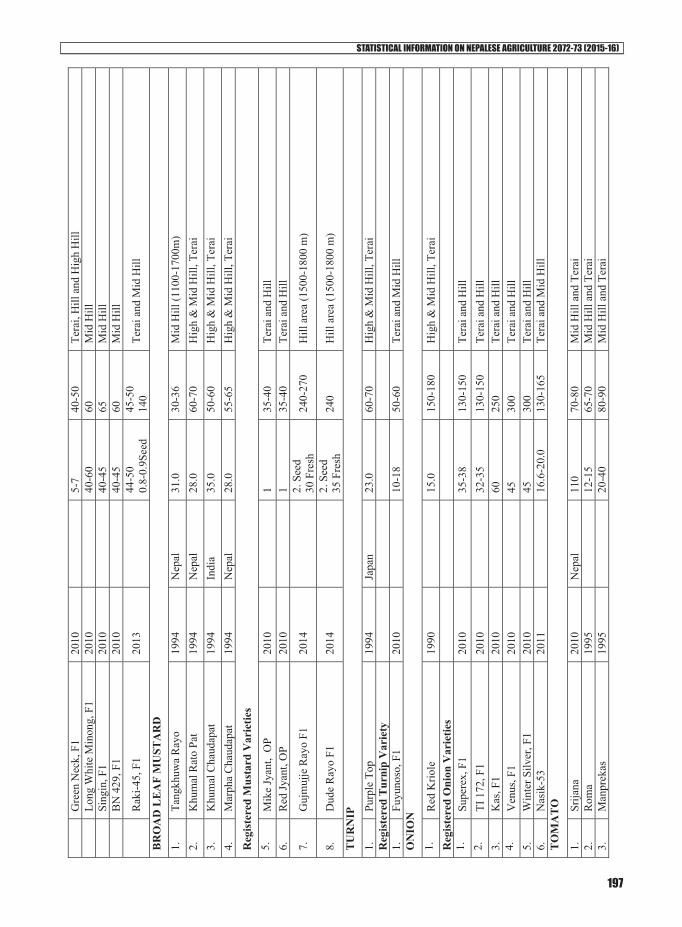
STATISTICAL INFORMATION ON NEPALESE AGRICULTURE 2072-73 (2015-16)
197
G
reen
Nec
k, F
1
2010
5-7
40-5
0 Te
rai,
Hill
and
Hig
h H
ill
Lo
ng W
hite
Min
ong,
F1
20
10
40
-60
60
Mid
Hill
Sing
in, F
1
2010
40-4
5 65
M
id H
ill
B
N 4
29, F
1
2010
40-4
5 60
M
id H
ill
R
aki-4
5, F
1
2013
44-5
0 0.
8-0.
9See
d 45
-50
140
Tera
i and
Mid
Hill
BR
OA
D L
EA
F M
UST
AR
D
1.
Tang
khuw
a R
ayo
1994
N
epal
31
.0
30-3
6 M
id H
ill (1
100-
1700
m)
2.
Khu
mal
Rat
o Pa
t 19
94
Nep
al
28.0
60
-70
Hig
h &
Mid
Hill
, Ter
ai
3.
Khu
mal
Cha
udap
at
1994
In
dia
35.0
50
-60
Hig
h &
Mid
Hill
, Ter
ai
4.
Mar
pha
Cha
udap
at
1994
N
epal
28
.0
55-6
5 H
igh
& M
id H
ill, T
erai
Reg
iste
red
Mus
tard
Var
ietie
s 5.
M
ike
Jyan
t, O
P 20
10
1
35-4
0 Te
rai a
nd H
ill
6.
Red
Jyan
t, O
P 20
10
1
35-4
0 Te
rai a
nd H
ill
7.
Guj
muj
je R
ayo
F1
2014
2. S
eed
30 F
resh
24
0-27
0 H
ill a
rea
(150
0-18
00 m
)
8.
Dud
e R
ayo
F1
2014
2. S
eed
35 F
resh
24
0 H
ill a
rea
(150
0-18
00 m
)
TU
RN
IP
1.
Purp
le T
op
1994
Ja
pan
23.0
60
-70
Hig
h &
Mid
Hill
, Ter
ai
Reg
iste
red
Tur
nip
Var
iety
1.
Fuyu
noso
, F1
20
10
10
-18
50-6
0 Te
rai a
nd M
id H
ill
ON
ION
1.
Red
Krio
le
1990
15.0
15
0-18
0 H
igh
& M
id H
ill, T
erai
R
egis
tere
d O
nion
Var
ietie
s
1.
Supe
rex,
F1
20
10
35
-38
130-
150
Tera
i and
Hill
2.
TI
172
, F1
20
10
32
-35
130-
150
Tera
i and
Hill
3.
K
as, F
1
2010
60
250
Tera
i and
Hill
4.
V
enus
, F1
20
10
45
30
0 Te
rai a
nd H
ill
5.
Win
ter S
ilver
, F1
20
10
45
30
0 Te
rai a
nd H
ill
6.
Nas
ik-5
3 20
11
16
.6-2
0.0
130-
165
Tera
i and
Mid
Hill
T
OM
AT
O
1.
Srija
na
2010
N
epal
11
0 70
-80
Mid
Hill
and
Ter
ai
2.
Rom
a 19
95
12
-15
65-7
0 M
id H
ill a
nd T
erai
3.
M
anpr
ekas
19
95
20
-40
80-9
0 M
id H
ill a
nd T
erai
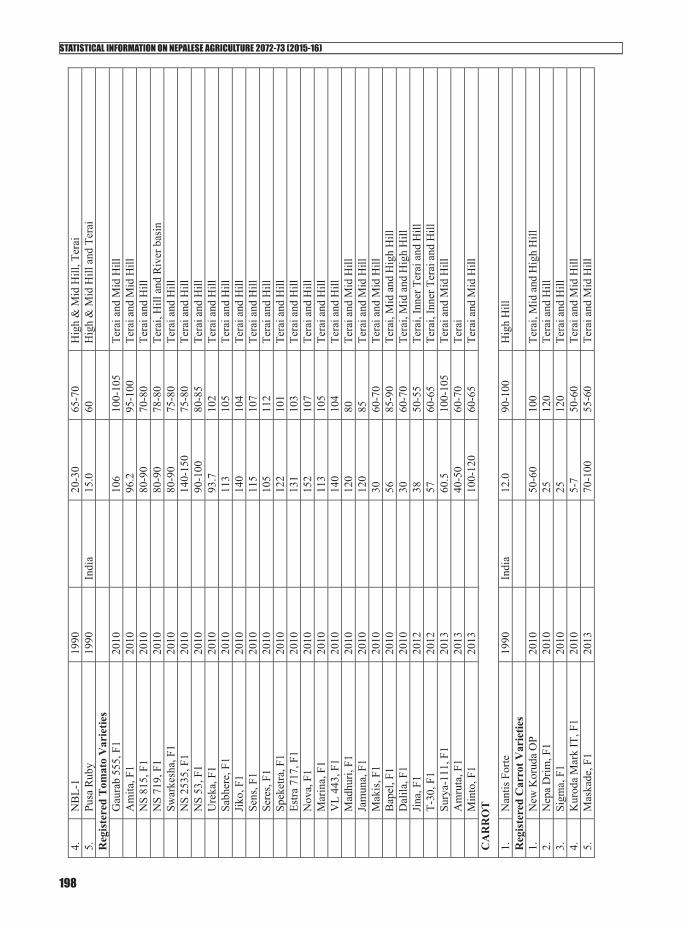
STATISTICAL INFORMATION ON NEPALESE AGRICULTURE 2072-73 (2015-16)
198
4.
NB
L-1
1990
20-3
0 65
-70
Hig
h &
Mid
Hill
, Ter
ai
5.
Pusa
Rub
y 19
90
Indi
a 15
.0
60
Hig
h &
Mid
Hill
and
Ter
ai
Reg
iste
red
Tom
ato
Var
ietie
s
G
aura
b 55
5, F
1
2010
106
100-
105
Tera
i and
Mid
Hill
Am
ita, F
1
2010
96.2
95
-100
Te
rai a
nd M
id H
ill
N
S 81
5, F
1
2010
80-9
0 70
-80
Tera
i and
Hill
NS
719,
F1
20
10
80
-90
78-8
0 Te
rai,
Hill
and
Riv
er b
asin
Swar
kesh
a, F
1
2010
80-9
0 75
-80
Tera
i and
Hill
NS
2535
, F1
20
10
14
0-15
0 75
-80
Tera
i and
Hill
NS
53, F
1
2010
90-1
00
80-8
5 Te
rai a
nd H
ill
U
reka
, F1
2010
93.7
10
2 Te
rai a
nd H
ill
Sa
bher
e, F
1
2010
113
105
Tera
i and
Hill
Jiko
, F1
20
10
14
0 10
4 Te
rai a
nd H
ill
Se
ns, F
1
2010
115
107
Tera
i and
Hill
Sere
s, F1
20
10
10
5 11
2 Te
rai a
nd H
ill
Sp
eket
ra, F
1 20
10
12
2 10
1 Te
rai a
nd H
ill
Es
tra 7
17, F
1
2010
131
103
Tera
i and
Hill
Nov
a, F
1
2010
152
107
Tera
i and
Hill
Mar
ina,
F1
20
10
11
3 10
5 Te
rai a
nd H
ill
V
L 44
3, F
1
2010
140
104
Tera
i and
Hill
Mad
huri,
F1
20
10
12
0 80
Te
rai a
nd M
id H
ill
Ja
mun
a, F
1
2010
120
85
Tera
i and
Mid
Hill
Mak
is, F
1
2010
30
60-7
0 Te
rai a
nd M
id H
ill
B
apel
, F1
20
10
56
85
-90
Tera
i, M
id a
nd H
igh
Hill
Dal
ila, F
1
2010
30
60-7
0 Te
rai,
Mid
and
Hig
h H
ill
Ji
na, F
1
2012
38
50-5
5 Te
rai,
Inne
r Ter
ai a
nd H
ill
T-
30, F
1
2012
57
60-6
5 Te
rai,
Inne
r Ter
ai a
nd H
ill
Su
rya-
111,
F1
20
13
60
.5
100-
105
Tera
i and
Mid
Hill
Am
ruta
, F1
20
13
40
-50
60-7
0 Te
rai
M
into
, F1
20
13
10
0-12
0 60
-65
Tera
i and
Mid
Hill
C
AR
RO
T
1.
Nan
tis F
orte
19
90
Indi
a 12
.0
90-1
00
Hig
h H
ill
Reg
iste
red
Car
rot V
arie
ties
1.
N
ew K
orud
a O
P 20
10
50
-60
100
Tera
i, M
id a
nd H
igh
Hill
2.
N
epa
Drim
, F1
20
10
25
12
0 Te
rai a
nd H
ill
3.
Sigm
a, F
1
2010
25
120
Tera
i and
Hill
4.
K
urod
a M
ark
IT, F
1
2010
5-7
50-6
0 Te
rai a
nd M
id H
ill
5.
Mas
kade
, F1
20
13
70
-100
55
-60
Tera
i and
Mid
Hill

STATISTICAL INFORMATION ON NEPALESE AGRICULTURE 2072-73 (2015-16)
199
CA
BB
AG
E
1.
Cop
enha
gen
Mar
ket
1994
35.0
70
-90
Mid
Hill
& T
erai
R
egis
tere
d C
abba
ge V
arie
ties
1.
N
epa
Gre
en 7
77, F
1
2010
75
85-9
0 Te
rai a
nd M
id H
ill
2.
Big
san
171,
F1
20
10
80
95
-100
H
igh
Hill
3.
N
epa
Rou
nd, F
1
2010
75
90
Tera
i 4.
Su
per g
reen
, F1
20
10
40
-50
90-1
00
Tera
i, M
id a
nd H
igh
Hill
5.
R
eyar
Bal
l, F1
20
10
36
-40
90
Tera
i, M
id a
nd H
igh
Hill
6.
G
reen
Kor
onet
, F1
20
10
35
-38
75-8
0 Te
rai a
nd H
ill
7.
Supe
r Kor
onet
, F1
20
10
32
-35
75-8
0 Te
rai a
nd H
ill
8.
Nep
a St
ar, F
1
2010
22-2
5 75
-80
Tera
i and
Hill
9.
T
621,
F1
20
10
18
-20
55-6
0 Te
rai a
nd H
ill
10.
Rub
y K
ing,
F1
20
10
22
-25
75
Tera
i and
Hill
11
. Su
mar
Cro
ss, F
1
2010
45-6
0 53
-58
Tera
i and
Hill
12
. G
reen
Cha
leng
er, F
1
2010
45-6
0 60
-65
Tera
i and
Hill
13
. G
reen
Hiro
, F1
20
10
45
-60
53-5
8 Te
rai a
nd H
ill
14.
Nep
a M
agik
, F1
20
10
45
-60
60-6
5 Te
rai a
nd H
ill
15.
Bon
os, F
1
2010
60-7
0 80
-85
Tera
i and
Hill
16
. G
olde
n B
all,
F1
2010
45-6
0 48
-53
Tera
i and
Hill
17
. K
eshe
tij, F
1
2010
45-6
0 53
-58
Tera
i and
Hill
18
. R
ishi
, F1
20
10
45
-60
60-6
5 Te
rai a
nd H
ill
19.
Gre
en K
row
n, F
1
2010
20-2
5 75
-80
Mid
Hill
20
. G
reen
Top
, F1
20
10
48
11
0 Te
rai a
nd M
id H
ill
21.
NSR
, F1
20
10
42
10
0 Te
rai a
nd M
id H
ill
22.
KF
65, F
1
2010
39.2
95
Te
rai a
nd M
id H
ill
23.
N 7
66, F
1
2010
48
100
Tera
i and
Mid
Hill
24
. N
YC
R, F
1
2010
48
100
Mid
Hill
25
. G
reen
Hot
, F1
20
10
50
-60
75-8
0 Te
rai,
Mid
and
Hig
h H
ill
26.
YR
Hon
am, F
1
2010
50-6
0 75
-80
Tera
i, M
id a
nd H
igh
Hill
27
. A
sia
Expr
ess,
F1
2010
40-5
0 55
Te
rai a
nd M
id H
ill
28.
CJN
12,
F1
20
12
49
.3
75-8
0 Te
rai I
nner
Ter
ai a
nd H
ill
29.
Asi
a C
ross
, F1
20
12
39
.2
50-5
5 Te
rai I
nner
Ter
ai a
nd H
ill
30.
Zeni
th, F
1
2013
40
55-6
5 Te
rai
31.
Futo
ski,
F1
2013
30-4
5 90
Te
rai a
nd M
id H
ill
ASP
AR
AG
US
BE
AN
1.
Sarla
hi T
ane
1994
N
epal
7.
0 50
-60
Mid
Hill
and
Ter
ai
2.
Khu
mal
Tan
e 19
94
Nep
al
4.5
60-7
0 M
id H
ill a
nd T
erai
R
egis
tere
d A
spar
agus
Bea
n V
arie
ties

STATISTICAL INFORMATION ON NEPALESE AGRICULTURE 2072-73 (2015-16)
200
1.
Cha
ndra
041
, O
P 20
10
33
48
Te
rai a
nd M
id H
ill
2.
Kar
ma
Stik
less
20
13
15
45
Te
rai a
nd M
id H
ill
3.
NO
-324
20
13
4.
6 60
-65
Tera
i, M
id a
nd H
igh
Hill
4.
Si
la-4
64
2013
5 35
-40
Tera
i and
Mid
Hill
PO
LE
BE
AN
1.
Tris
huli
Sim
i-1
1994
U
SA
14.0
50
-55
Mid
& H
igh
Hill
2.
Jh
ange
Sim
i-1
1994
U
SA
9.0
50-5
5 M
id H
ill &
Ter
ai
Reg
iste
red
Pole
Bea
n V
arie
ty
1.
M
andi
r, O
P 20
10
12
46
Te
rai a
nd M
id H
ill
PEA
S
1.
Sarla
hi A
rkel
19
94
Indi
a 5-
7 60
-65
Hig
h &
Mid
Hill
and
Ter
ai
2.
New
Lin
e 19
94
USA
6-
8 85
-90
Mid
Hill
and
Ter
ai
3.
Sikk
ime
1994
In
dia
6-8
25-3
0 H
igh
& M
id H
ill a
nd T
erai
C
APS
ICU
M
1.
Cal
iforn
ia
1994
U
SA
16-2
0 80
-90
Hig
h &
Mid
Hill
and
Ter
ai
Reg
iste
red
Cap
sicu
m V
arie
ties
1.
Sa
gar,
OP
2010
36
65-7
5 Te
rai a
nd M
id H
ill
2.
NS
632,
F1
20
10
44
-50
65
Tera
i and
Hill
C
HIL
LI
1.
Jwal
a 19
94
Indi
a 25
-30
60-7
0 H
igh
& M
id H
ill a
nd T
erai
R
egis
tere
d C
hilli
Var
ietie
s
1.
Kar
ma
747,
F1
20
10
40
70
Te
rai a
nd M
id H
ill
2.
Kar
ma
777,
F1
20
10
60
65
Te
rai a
nd H
ill
3.
Nep
a H
ot, F
1
2010
40
120
Tera
i and
Mid
Hill
4.
A
nna
3, F
1
2010
40-4
4 70
-75
Tera
i and
Hill
5.
N
S 17
01, F
1
2010
80-9
0 75
-85
Tera
i, M
id H
ill a
nd R
iver
Bas
in
6.
NS
1101
, F1
20
10
70
-74
70-8
0 Te
rai,
Mid
Hill
and
Riv
er B
asin
7.
G
oli,
F1
2010
70-7
6 70
-80
Tera
i, M
id H
ill a
nd R
iver
Bas
in
8.
Aka
sh, F
1
2010
50-5
6 75
-85
Tera
i, M
id H
ill a
nd R
iver
Bas
in
9.
Big
Mam
a 3,
F1
20
10
50
95
Te
rai a
nd H
ill
10.
Om
iga,
F1
20
10
50
11
5 Te
rai a
nd H
ill
11.
Supe
r Tar
a, F
1
2010
40
118
Tera
i and
Hill
12
. M
arsh
al, F
1
2010
35
115
Tera
i and
Hill
13
. Su
dra,
F1
20
12
49
.3
65
Tera
i, In
ner T
erai
and
Hill
14
. Pr
emiu
m, F
1
2013
25-3
0 80
-85
Tera
i and
Mid
Hill
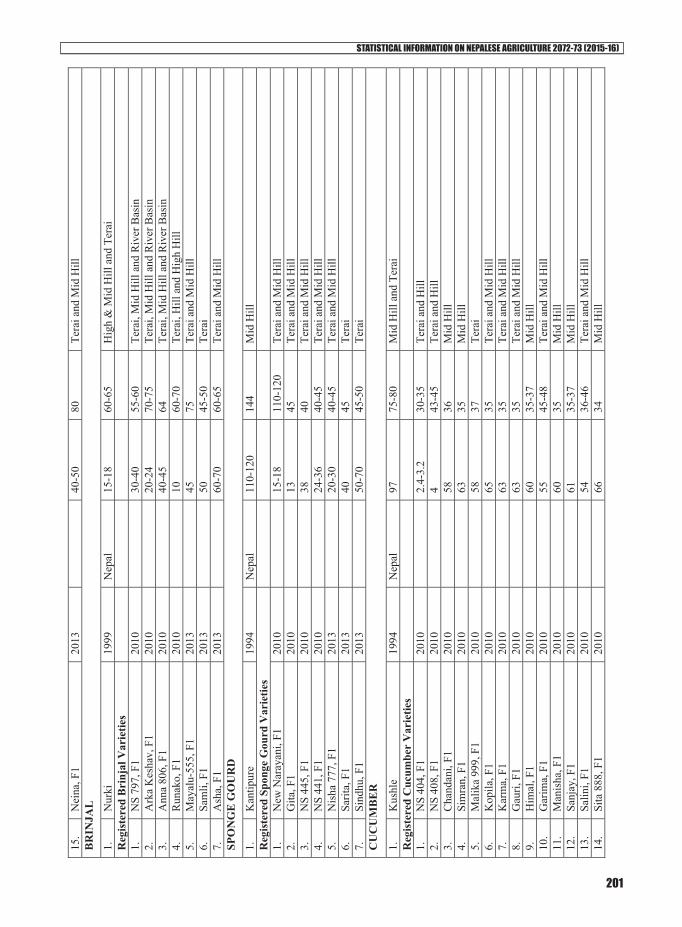
STATISTICAL INFORMATION ON NEPALESE AGRICULTURE 2072-73 (2015-16)
201
15.
Nei
na, F
1
2013
40-5
0 80
Te
rai a
nd M
id H
ill
BR
INJA
L
1.
Nur
ki
1999
N
epal
15
-18
60-6
5 H
igh
& M
id H
ill a
nd T
erai
R
egis
tere
d B
rinj
al V
arie
ties
1.
N
S 79
7, F
1
2010
30-4
0 55
-60
Tera
i, M
id H
ill a
nd R
iver
Bas
in
2.
Ark
a K
esha
v, F
1
2010
20-2
4 70
-75
Tera
i, M
id H
ill a
nd R
iver
Bas
in
3.
Ann
a 80
6, F
1
2010
40-4
5 64
Te
rai,
Mid
Hill
and
Riv
er B
asin
4.
R
unak
o, F
1
2010
10
60-7
0 Te
rai,
Hill
and
Hig
h H
ill
5.
May
alu-
555,
F1
2013
45
75
Tera
i and
Mid
Hill
6.
Sa
mli,
F1
20
13
50
45
-50
Tera
i 7.
A
sha,
F1
20
13
60
-70
60-6
5 Te
rai a
nd M
id H
ill
SPO
NG
E G
OU
RD
1.
Kan
tipur
e 19
94
Nep
al
110-
120
144
Mid
Hill
R
egis
tere
d Sp
onge
Gou
rd V
arie
ties
1.
New
Nar
ayan
i, F1
20
10
15
-18
110-
120
Tera
i and
Mid
Hill
2.
G
ita, F
1
2010
13
45
Tera
i and
Mid
Hill
3.
N
S 44
5, F
1
2010
38
40
Tera
i and
Mid
Hill
4.
N
S 44
1, F
1
2010
24-3
6 40
-45
Tera
i and
Mid
Hill
5.
N
isha
777
, F1
20
13
20
-30
40-4
5 Te
rai a
nd M
id H
ill
6.
Sarit
a, F
1
2013
40
45
Tera
i 7.
Si
ndhu
, F1
20
13
50
-70
45-5
0 Te
rai
CU
CU
MB
ER
1.
Kus
hle
1994
N
epal
97
75
-80
Mid
Hill
and
Ter
ai
Reg
iste
red
Cuc
umbe
r V
arie
ties
1.
N
S 40
4, F
1
2010
2.4-
3.2
30-3
5 Te
rai a
nd H
ill
2.
NS
408,
F1
20
10
4
43-4
5 Te
rai a
nd H
ill
3.
Cha
ndan
i, F1
20
10
58
36
M
id H
ill
4.
Sim
ran,
F1
20
10
63
35
M
id H
ill
5.
Mal
ika
999,
F1
20
10
58
37
Te
rai
6.
Kop
ila, F
1
2010
65
35
Tera
i and
Mid
Hill
7.
K
arm
a, F
1
2010
63
35
Tera
i and
Mid
Hill
8.
G
auri,
F1
20
10
63
35
Te
rai a
nd M
id H
ill
9.
Him
al, F
1
2010
60
35-3
7 M
id H
ill
10.
Gar
ima,
F1
20
10
55
45
-48
Tera
i and
Mid
Hill
11
. M
anis
ha, F
1
2010
60
35
Mid
Hill
12
. Sa
njay
, F1
20
10
61
35
-37
Mid
Hill
13
. Sa
lini,
F1
2010
54
36-4
6 Te
rai a
nd M
id H
ill
14.
Sita
888
, F1
20
10
66
34
M
id H
ill
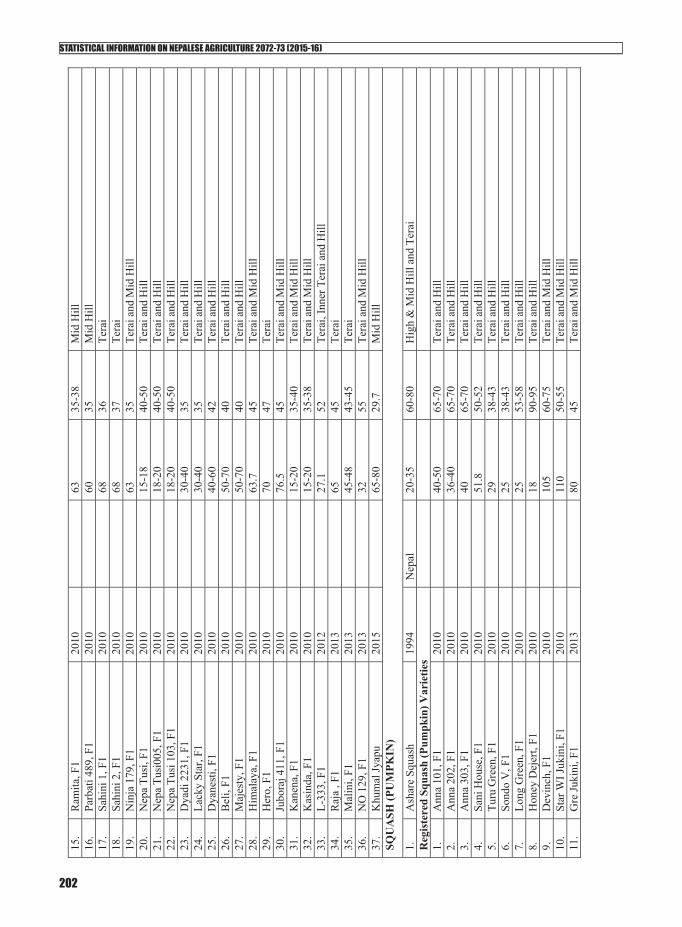
STATISTICAL INFORMATION ON NEPALESE AGRICULTURE 2072-73 (2015-16)
202
15.
Ram
ita, F
1
2010
63
35-3
8 M
id H
ill
16.
Parb
ati 4
89, F
1 20
10
60
35
M
id H
ill
17.
Sahi
ni 1
, F1
20
10
68
36
Te
rai
18.
Sahi
ni 2
, F1
20
10
68
37
Te
rai
19.
Nin
ja 1
79, F
1
2010
63
35
Tera
i and
Mid
Hill
20
. N
epa
Tusi
, F1
20
10
15
-18
40-5
0 Te
rai a
nd H
ill
21.
Nep
a Tu
si00
5, F
1
2010
18-2
0 40
-50
Tera
i and
Hill
22
. N
epa
Tusi
103
, F1
20
10
18
-20
40-5
0 Te
rai a
nd H
ill
23.
Dya
di 2
231,
F1
20
10
30
-40
35
Tera
i and
Hill
24
. La
cky
Star
, F1
20
10
30
-40
35
Tera
i and
Hill
25
. D
yane
sti,
F1
2010
40-6
0 42
Te
rai a
nd H
ill
26.
Bel
i, F1
20
10
50
-70
40
Tera
i and
Hill
27
. M
ajes
ty, F
1
2010
50-7
0 40
Te
rai a
nd H
ill
28.
Him
alay
a, F
1
2010
63.7
45
Te
rai a
nd M
id H
ill
29.
Her
o, F
1
2010
70
47
Tera
i 30
. Ju
bora
j 411
, F1
20
10
76
.5
45
Tera
i and
Mid
Hill
31
. K
anen
a, F
1
2010
15-2
0 35
-40
Tera
i and
Mid
Hill
32
. K
asin
da, F
1
2010
15-2
0 35
-38
Tera
i and
Mid
Hill
33
. L-
333,
F1
20
12
27
.1
52
Tera
i, In
ner T
erai
and
Hill
34
. R
aja
, F1
20
13
65
45
Te
rai
35.
Mal
ini,
F1
2013
45-4
8 43
-45
Tera
i 36
. N
O 1
29, F
1
2013
32
55
Tera
i and
Mid
Hill
37
. K
hum
al Jy
apu
2015
65-8
0 29
.7
Mid
Hill
SQ
UA
SH (P
UM
PKIN
)
1.
Ash
are
Squa
sh
1994
N
epal
20
-35
60
-80
Hig
h &
Mid
Hill
and
Ter
ai
Reg
iste
red
Squa
sh (P
umpk
in) V
arie
ties
1.
Ann
a 10
1, F
1
2010
40-5
0 65
-70
Tera
i and
Hill
2.
A
nna
202,
F1
20
10
36
-40
65-7
0 Te
rai a
nd H
ill
3.
Ann
a 30
3, F
1
2010
40
65-7
0 Te
rai a
nd H
ill
4.
Sani
Hou
se, F
1
2010
51.8
50
-52
Tera
i and
Hill
5.
Tu
ru G
reen
, F1
20
10
29
38
-43
Tera
i and
Hill
6.
So
ndo
V, F
1
2010
25
38-4
3 Te
rai a
nd H
ill
7.
Long
Gre
en, F
1
2010
25
53-5
8 Te
rai a
nd H
ill
8.
Hon
ey D
ejer
t, F1
20
10
18
90
-95
Tera
i and
Hill
9.
D
evin
ch, F
1
2010
105
60-7
5 Te
rai a
nd M
id H
ill
10.
Star
WI J
ukin
i, F1
20
10
11
0 50
-55
Tera
i and
Mid
Hill
11
. G
re Ju
kini
, F1
20
13
80
45
Te
rai a
nd M
id H
ill
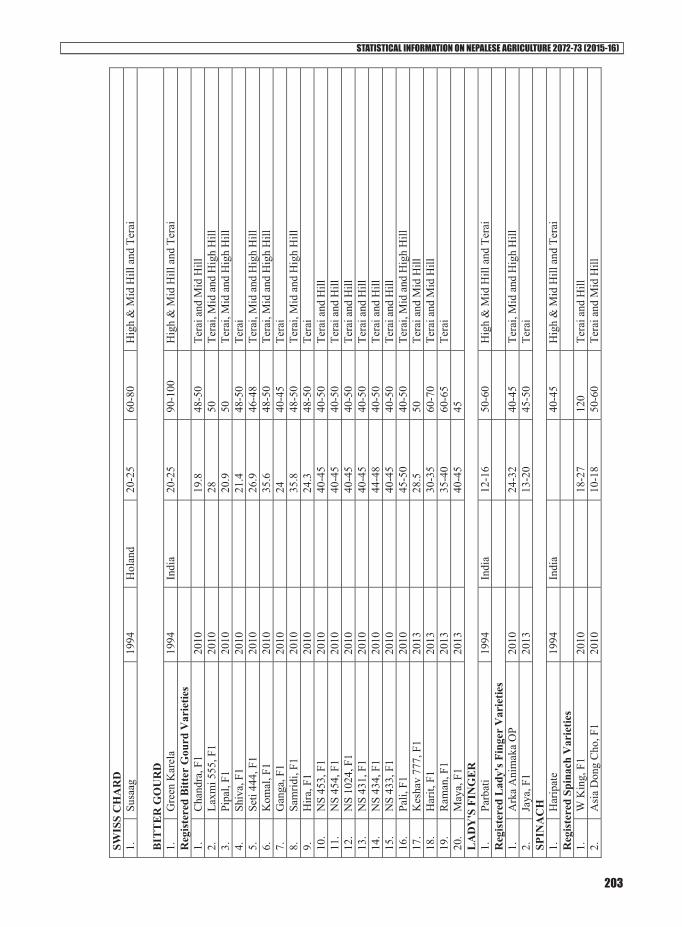
STATISTICAL INFORMATION ON NEPALESE AGRICULTURE 2072-73 (2015-16)
203
SWIS
S C
HA
RD
1.
Su
saag
19
94
Hol
and
20-2
5
60-8
0 H
igh
& M
id H
ill a
nd T
erai
B
ITT
ER G
OU
RD
1.
G
reen
Kar
ela
1994
In
dia
20-2
5
90-1
00
Hig
h &
Mid
Hill
and
Ter
ai
Reg
iste
red
Bitt
er G
ourd
Var
ietie
s
1.
Cha
ndra
, F1
20
10
19
.8
48-5
0 Te
rai a
nd M
id H
ill
2.
Laxm
i 555
, F1
20
10
28
50
Te
rai,
Mid
and
Hig
h H
ill
3.
Pipa
l, F1
20
10
20
.9
50
Tera
i, M
id a
nd H
igh
Hill
4.
Sh
iva,
F1
20
10
21
.4
48-5
0 Te
rai
5.
Seti
444,
F1
20
10
26
.9
46-4
8 Te
rai,
Mid
and
Hig
h H
ill
6.
Kom
al, F
1
2010
35.6
48
-50
Tera
i, M
id a
nd H
igh
Hill
7.
G
anga
, F1
20
10
24
40
-45
Tera
i 8.
Sa
mrid
i, F1
20
10
35
.8
48-5
0 Te
rai,
Mid
and
Hig
h H
ill
9.
Hira
, F1
20
10
24
.3
48-5
0 Te
rai
10.
NS
453,
F1
20
10
40
-45
40-5
0 Te
rai a
nd H
ill
11.
NS
454,
F1
20
10
40
-45
40-5
0 Te
rai a
nd H
ill
12.
NS
1024
, F1
20
10
40
-45
40-5
0 Te
rai a
nd H
ill
13.
NS
431,
F1
20
10
40
-45
40-5
0 Te
rai a
nd H
ill
14.
NS
434,
F1
20
10
44
-48
40-5
0 Te
rai a
nd H
ill
15.
NS
433,
F1
20
10
40
-45
40-5
0 Te
rai a
nd H
ill
16.
Pali,
F1
20
10
45
-50
40-5
0 Te
rai,
Mid
and
Hig
h H
ill
17.
Kes
hav
777,
F1
20
13
28
.5
50
Tera
i and
Mid
Hill
18
. H
arit,
F1
20
13
30
-35
60-7
0 Te
rai a
nd M
id H
ill
19.
Ram
an, F
1
2013
35-4
0 60
-65
Tera
i 20
. M
aya,
F1
20
13
40
-45
45
L
AD
Y'S
FIN
GE
R
1.
Parb
ati
1994
In
dia
12-1
6
50-6
0 H
igh
& M
id H
ill a
nd T
erai
R
egis
tere
d L
ady'
s Fin
ger
Var
ietie
s
1.
A
rka
Ani
mak
a O
P 20
10
24
-32
40-4
5 Te
rai,
Mid
and
Hig
h H
ill
2.
Jaya
, F1
20
13
13
-20
45-5
0 Te
rai
SPIN
AC
H
1.
Har
ipat
e 19
94
Indi
a
40-4
5 H
igh
& M
id H
ill a
nd T
erai
R
egis
tere
d Sp
inac
h V
arie
ties
1.
W
Kin
g, F
1
2010
18-2
7 12
0 Te
rai a
nd H
ill
2.
Asi
a D
ong
Cho
, F1
20
10
10
-18
50-6
0 Te
rai a
nd M
id H
ill
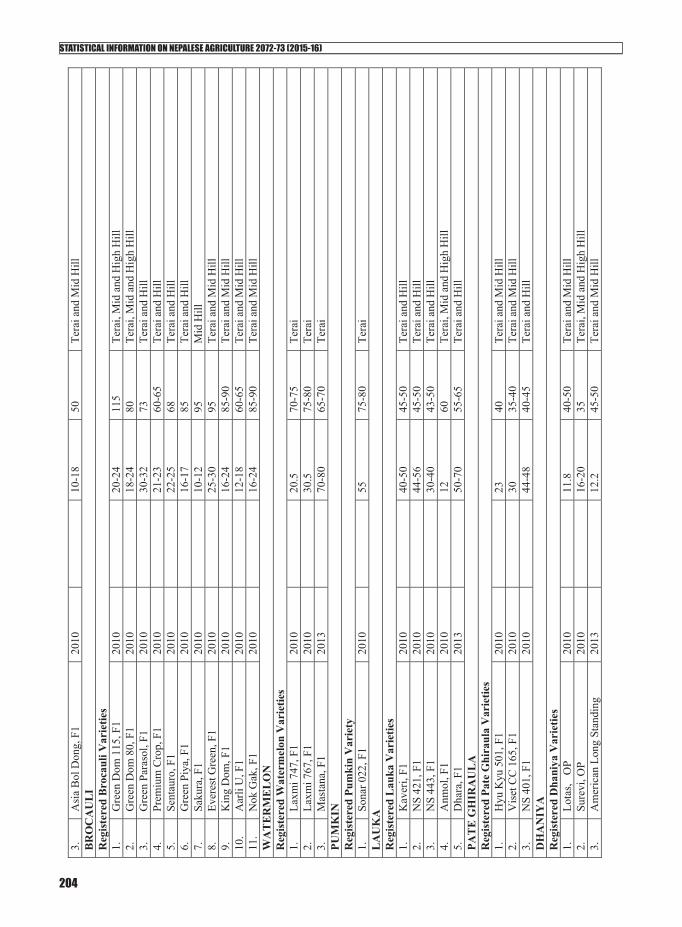
STATISTICAL INFORMATION ON NEPALESE AGRICULTURE 2072-73 (2015-16)
204
3.
Asi
a B
ol D
ong,
F1
20
10
10
-18
50
Tera
i and
Mid
Hill
B
RO
CA
UL
I R
egis
tere
d B
roca
uli V
arie
ties
1.
Gre
en D
om 1
15, F
1
2010
20-2
4 11
5 Te
rai,
Mid
and
Hig
h H
ill
2.
Gre
en D
om 8
0, F
1
2010
18-2
4 80
Te
rai,
Mid
and
Hig
h H
ill
3.
Gre
en P
aras
ol, F
1
2010
30-3
2 73
Te
rai a
nd H
ill
4.
Prem
ium
Cro
p, F
1
2010
21-2
3 60
-65
Tera
i and
Hill
5.
Se
ntau
ro, F
1
2010
22-2
5 68
Te
rai a
nd H
ill
6.
Gre
en P
iya,
F1
20
10
16
-17
85
Tera
i and
Hill
7.
Sa
kura
, F1
20
10
10
-12
95
Mid
Hill
8.
Ev
eres
t Gre
en, F
1
2010
25-3
0 95
Te
rai a
nd M
id H
ill
9.
Kin
g D
om, F
1
2010
16-2
4 85
-90
Tera
i and
Mid
Hill
10
. A
arli
U, F
1
2010
12-1
8 60
-65
Tera
i and
Mid
Hill
11
. N
ok G
ak, F
1
2010
16-2
4 85
-90
Tera
i and
Mid
Hill
W
AT
ER
ME
LO
N
Reg
iste
red
Wat
erm
elon
Var
ietie
s 1.
La
xmi 7
47, F
1
2010
20.5
70
-75
Tera
i 2.
La
xmi 7
67, F
1
2010
30.5
75
-80
Tera
i 3.
M
asta
na, F
1
2013
70-8
0 65
-70
Tera
i PU
MK
IN
Reg
iste
red
Pum
kin
Var
iety
1.
So
nar 0
22, F
1
2010
55
75-8
0 Te
rai
LA
UK
A
Reg
iste
red
Lau
ka V
arie
ties
1.
Kav
eri,
F1
2010
40-5
0 45
-50
Tera
i and
Hill
2.
N
S 42
1, F
1
2010
44-5
6 45
-50
Tera
i and
Hill
3.
N
S 44
3, F
1
2010
30-4
0 43
-50
Tera
i and
Hill
4.
A
nmol
, F1
20
10
12
60
Te
rai,
Mid
and
Hig
h H
ill
5.
Dha
ra, F
1
2013
50-7
0 55
-65
Tera
i and
Hill
PA
TE
GH
IRA
UL
A
Reg
iste
red
Pate
Ghi
raul
a V
arie
ties
1.
Hyu
Kyu
501
, F1
20
10
23
40
Te
rai a
nd M
id H
ill
2.
Vis
et C
C 1
65, F
1
2010
30
35-4
0 Te
rai a
nd M
id H
ill
3.
NS
401,
F1
20
10
44
-48
40-4
5 Te
rai a
nd H
ill
DH
AN
IYA
R
egis
tere
d D
hani
ya V
arie
ties
1.
Lota
s, O
P 20
10
11
.8
40-5
0 Te
rai a
nd M
id H
ill
2.
Sure
vi, O
P 20
10
16
-20
35
Tera
i, M
id a
nd H
igh
Hill
3.
A
mer
ican
Lon
g St
andi
ng
2013
12.2
45
-50
Tera
i and
Mid
Hill

STATISTICAL INFORMATION ON NEPALESE AGRICULTURE 2072-73 (2015-16)
205
4.
XM
LNO
-465
, F1
20
13
7.
2 35
Te
rai,
Mid
and
Hig
h H
ill
5.
Mam
ses,
F1
2013
6-7
50-6
0 Te
rai a
nd M
id H
ill
CH
ICH
IND
A
Reg
iste
red
Chi
chin
da V
arie
ties
1.
Kar
nali,
F1
20
10
30
45
Te
rai a
nd M
id H
ill
2.
Har
ayal
i, F1
20
10
30
50
Te
rai a
nd M
id H
ill
KU
RIL
O
Reg
iste
red
Kur
ilo V
arie
ty
1.
Mer
y W
ashi
ngto
n 50
0W, O
P 20
10
6
210
Tera
i, M
id a
nd H
igh
Hill
PA
RSA
LE
R
egis
tere
d Pa
rsal
e V
arie
ties
1.
Pars
le G
reen
Kar
pet,O
P 20
10
1
60-6
5 Te
rai a
nd H
ill
2.
Soi S
im, O
P 20
10
2
60-6
5 Te
rai a
nd H
ill
3.
Sele
ri U
tah
Tall
Gre
en,O
P 20
10
1
70-8
0 Te
rai a
nd H
ill
GY
AT
HK
OB
I R
egis
tere
d G
yath
kobi
Var
ietie
s 1.
N
epa
Bal
l, F1
20
10
15
40
-50
Tera
i and
Hill
2.
Sa
mra
t, O
P
2010
15
60
Mid
Hill
PA
KC
HO
Y
Reg
iste
red
Pakc
hoy
Var
ietie
s 1.
Te
sti G
reen
, F1
20
10
48
-57
45-5
0 Te
rai a
nd H
ill
2.
Cho
ko, O
P 20
10
2
40-5
0 Te
rai a
nd M
id H
ill
3.
Cya
nton
g W
hite
, OP
2010
2 40
-50
Tera
i and
Mid
Hill
4.
N
O 4
16, F
1
2013
16
250
Tera
i and
Hill
JI
RIK
O S
AG
R
egis
tere
d Ji
riko
Sag
Var
ietie
s 1.
G
reen
Spa
n, O
P 20
10
4-
5 50
-55
Tera
i, M
id a
nd H
igh
Hill
2.
G
reen
Web
, OP
2010
1 40
-45
Tera
i, M
id H
ill, H
igh
Hill
and
Riv
er b
asin
3.
N
ew R
ed F
yar,
OP
2010
1 50
-55
Tera
i, M
id H
ill, H
igh
Hill
and
Riv
er b
asin
C
HU
KU
ND
ER
R
egis
tere
d C
huku
nder
Var
iety
1.
M
adhu
r, O
P 20
10
24
-36
60-7
0 Te
rai a
nd H
ill
CH
AIN
ESE
CA
BB
AG
E
Reg
iste
red
Cha
ines
e C
abba
ge V
arie
ties
1.
Blu
j, F1
20
10
22
-25
55-6
0 Te
rai a
nd H
ill
2.
Win
ter V
isite
r, F1
20
10
90
-110
90
Te
rai a
nd H
ill
3.
Sprin
g Su
n-60
, F1
20
10
20
-25
75-8
0 M
id H
ill
4.
N 7
, F1
20
10
42
95
Te
rai a
nd M
id H
ill
5.
CS
Chu
n D
e G
il, F
1
2010
40-5
0 65
-70
Tera
i and
Mid
Hill
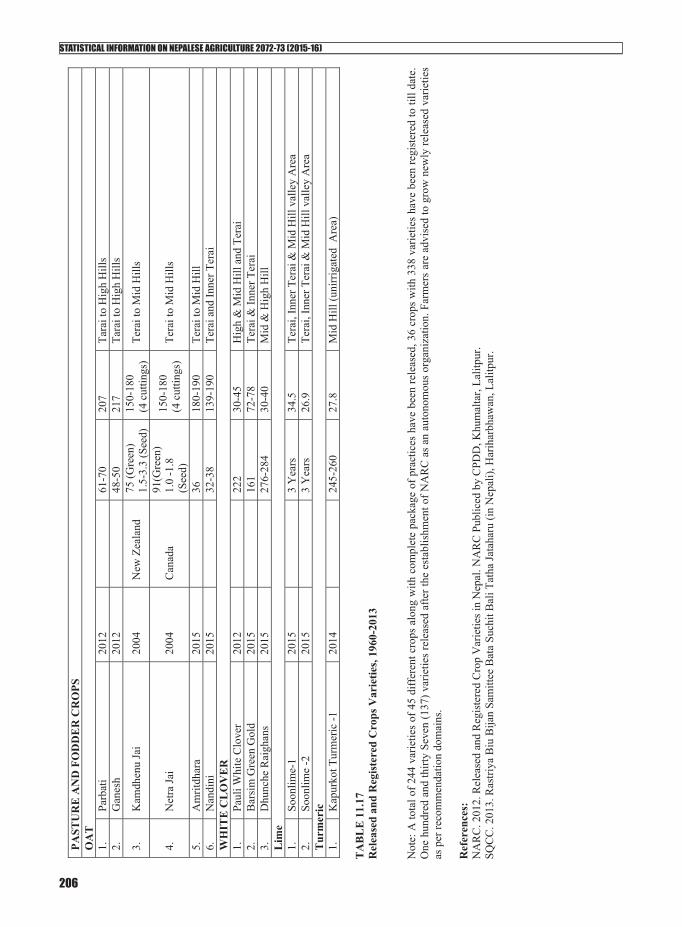
STATISTICAL INFORMATION ON NEPALESE AGRICULTURE 2072-73 (2015-16)
206
TA
BL
E 1
1.17
R
elea
sed
and
Reg
iste
red
Cro
ps V
arie
ties,
1960
-201
3 N
ote:
A to
tal o
f 244
var
ietie
s of
45
diff
eren
t cro
ps a
long
with
com
plet
e pa
ckag
e of
pra
ctic
es h
ave
been
rele
ased
, 36
crop
s w
ith 3
38 v
arie
ties
have
bee
n re
giste
red
to ti
ll da
te.
One
hun
dred
and
thirt
y Se
ven
(137
) var
ietie
s re
leas
ed a
fter t
he e
stab
lishm
ent o
f NA
RC
as
an a
uton
omou
s or
gani
zatio
n. F
arm
ers
are
advi
sed
to g
row
new
ly re
leas
ed v
arie
ties
as p
er re
com
men
datio
n do
mai
ns.
Ref
eren
ces:
N
AR
C. 2
012.
Rel
ease
d an
d R
egis
tere
d C
rop
Var
ietie
s in
Nep
al. N
AR
C P
ublic
ed b
y C
PDD
, Khu
mal
tar,
Lalit
pur.
SQC
C. 2
013.
Ras
triya
Biu
Bija
n Sa
mitt
ee B
ata
Such
it B
ali T
atha
Jata
haru
(in
Nep
ali),
Har
ihar
bhaw
an, L
alitp
ur.
PAST
UR
E A
ND
FO
DD
ER
CR
OPS
O
AT
1.
Pa
rbat
i 20
12
61
-70
207
Tara
i to
Hig
h H
ills
2.
Gan
esh
2012
48-5
0 21
7 Ta
rai t
o H
igh
Hill
s
3.
Kam
dhen
u Ja
i 20
04
New
Zea
land
75
(Gre
en)
1.5-
3.3
(See
d)
150-
180
(4 c
uttin
gs)
Tera
i to
Mid
Hill
s
4.
Net
ra Ja
i 20
04
Can
ada
91(G
reen
) 1.
0 -1
.8
(See
d)
150-
180
(4 c
uttin
gs)
Tera
i to
Mid
Hill
s
5.
Am
ritdh
ara
2015
36
180-
190
Tera
i to
Mid
Hill
6.
N
andi
ni
2015
32-3
8 13
9-19
0 Te
rai a
nd In
ner T
erai
W
HIT
E C
LO
VE
R
1.
Paul
i Whi
te C
love
r 20
12
22
2 30
-45
Hig
h &
Mid
Hill
and
Ter
ai
2.
Bar
sim
Gre
en G
old
2015
161
72-7
8 Te
rai &
Inne
r Ter
ai
3.
Dhu
nche
Rai
ghan
s 20
15
27
6-28
4 30
-40
Mid
& H
igh
Hill
L
ime
1.
Soon
lime-
1 20
15
3
Yea
rs
34.5
Te
rai,
Inne
r Ter
ai &
Mid
Hill
val
ley
Are
a 2.
So
onlim
e -2
20
15
3
Yea
rs
26.9
Te
rai,
Inne
r Ter
ai &
Mid
Hill
val
ley
Are
a T
urm
eric
1.
K
apur
kot T
urm
eric
-1
2014
245-
260
27.8
M
id H
ill (u
nirr
igat
ed A
rea)
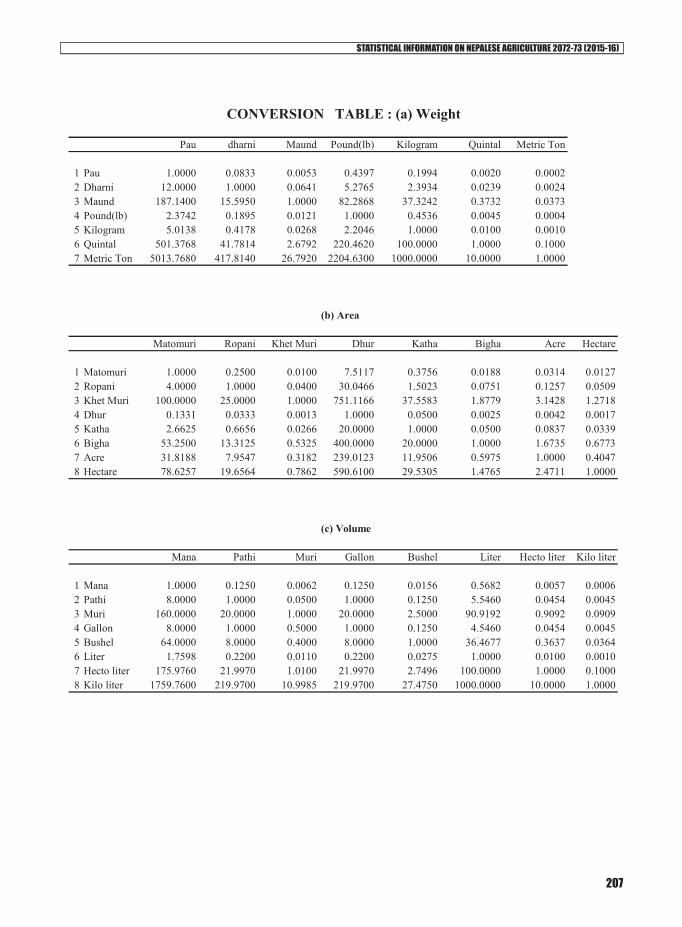
STATISTICAL INFORMATION ON NEPALESE AGRICULTURE 2072-73 (2015-16)
207
Pau dharni Maund Pound(lb) Kilogram Quintal Metric Ton
1 Pau 1.0000 0.0833 0.0053 0.4397 0.1994 0.0020 0.00022 Dharni 12.0000 1.0000 0.0641 5.2765 2.3934 0.0239 0.00243 Maund 187.1400 15.5950 1.0000 82.2868 37.3242 0.3732 0.03734 Pound(lb) 2.3742 0.1895 0.0121 1.0000 0.4536 0.0045 0.00045 Kilogram 5.0138 0.4178 0.0268 2.2046 1.0000 0.0100 0.00106 Quintal 501.3768 41.7814 2.6792 220.4620 100.0000 1.0000 0.10007 Metric Ton 5013.7680 417.8140 26.7920 2204.6300 1000.0000 10.0000 1.0000
(b) Area
Matomuri Ropani Khet Muri Dhur Katha Bigha Acre Hectare
1 Matomuri 1.0000 0.2500 0.0100 7.5117 0.3756 0.0188 0.0314 0.01272 Ropani 4.0000 1.0000 0.0400 30.0466 1.5023 0.0751 0.1257 0.05093 Khet Muri 100.0000 25.0000 1.0000 751.1166 37.5583 1.8779 3.1428 1.27184 Dhur 0.1331 0.0333 0.0013 1.0000 0.0500 0.0025 0.0042 0.00175 Katha 2.6625 0.6656 0.0266 20.0000 1.0000 0.0500 0.0837 0.03396 Bigha 53.2500 13.3125 0.5325 400.0000 20.0000 1.0000 1.6735 0.67737 Acre 31.8188 7.9547 0.3182 239.0123 11.9506 0.5975 1.0000 0.40478 Hectare 78.6257 19.6564 0.7862 590.6100 29.5305 1.4765 2.4711 1.0000
(c) Volume
Mana Pathi Muri Gallon Bushel Liter Hecto liter Kilo liter
1 Mana 1.0000 0.1250 0.0062 0.1250 0.0156 0.5682 0.0057 0.00062 Pathi 8.0000 1.0000 0.0500 1.0000 0.1250 5.5460 0.0454 0.00453 Muri 160.0000 20.0000 1.0000 20.0000 2.5000 90.9192 0.9092 0.09094 Gallon 8.0000 1.0000 0.5000 1.0000 0.1250 4.5460 0.0454 0.00455 Bushel 64.0000 8.0000 0.4000 8.0000 1.0000 36.4677 0.3637 0.03646 Liter 1.7598 0.2200 0.0110 0.2200 0.0275 1.0000 0.0100 0.00107 Hecto liter 175.9760 21.9970 1.0100 21.9970 2.7496 100.0000 1.0000 0.10008 Kilo liter 1759.7600 219.9700 10.9985 219.9700 27.4750 1000.0000 10.0000 1.0000
CONVERSION TABLE : (a) Weight