Embed Size (px)
Citation preview
Composite Structures 105 (2013) 240–255
Contents lists available at SciVerse ScienceDirect
Composite Structures
journal homepage: www.elsevier .com/locate /compstruct
Statistical finite element analysis of the buckling behavior of honeycombstructures
0263-8223/$ - see front matter � 2013 Elsevier Ltd. All rights reserved.http://dx.doi.org/10.1016/j.compstruct.2013.05.014
⇑ Corresponding author. Tel.: +39 0817685959.E-mail address: [email protected] (C. Menna).
Domenico Asprone a, Ferdinando Auricchio b, Costantino Menna a,⇑, Simone Morganti b, Andrea Prota a,Alessandro Reali b
a Department of Structures for Engineering and Architecture (DiSt), University of Naples, Federico II, Via Claudio 21, 80125 Naples, Italyb Department of Civil Engineering and Architecture (DICAr), University of Pavia, Via Ferrata 3, 27100 Pavia, Italy
a r t i c l e i n f o a b s t r a c t
Article history:Available online 23 May 2013
Keywords:ImperfectionsNomex honeycombBucklingFinite element analysisStochastic approach
The main key performance factors of honeycombs are represented by the ability to withstand through-thickness compression and to absorb energy by plastic deformation of the cell walls. The knowledge ofthe constituent material properties, including the sensitivity of these structures to material defects,and of the folding mechanism occurring during the crushing mode represents a basic step to perform reli-able finite element analyses able to accurately reproduce the behavior of such structures. The presentpaper reports a comprehensive study of the compressive response of hexagonal honeycomb structuresmade of phenolic resin-impregnated aramid paper (Nomex�); the compressive response is numericallyinvestigated and compared with experimental results. A shell model of a representative single cell madeof expanded Nomex has been created using the implicit ABAQUS finite element solver. Imperfections dueto the manufacturing process are taken into account including material imperfections (elastic modulusvariability) and geometrical defects (thickness variability). Imperfections are included in the model bydefining different material and thickness properties for each element according to a pre-defined statisti-cal distribution. The effects of imperfections on the honeycomb structure behavior are investigated. Thepredicted structural response, numerically obtained using different sets of imperfections, shows a goodcorrelation with experimental results.
� 2013 Elsevier Ltd. All rights reserved.
1. Introduction
Nowadays composite sandwich structures are widely used inmany different engineering fields especially in the aerospace andmass transport industry where weight reduction is one of the mostsignificant design parameters. These materials offer many advanta-geous specific mechanical properties, such as stiffness-to-weightratio, which make them suitable for component constructionincluding secondary structural parts like flaps, wing-body fairings,engine cowls, spoilers, nacelles, and radomes [1–3]. Sandwichstructures are generally made of two thin and stiff skins, separatedby a thick, lightweight core, which increases the inertia of theresulting section without significantly increasing the mass. Theskins primarily carry tensile and compressive loads whereas thecore carries transverse shear loads and gives the panel high specificbending stiffness. In addition, the core influences the out-of-planecompressive behavior and the energy absorbing capability of thesandwich structure by its failure mechanisms. The skins areregularly made of lightweight materials such as aluminum or fiber
reinforced composite laminates. Different types of sandwich corestructures are commonly used in the aerospace and transportationindustry including foam/solid core (ships, aircrafts), honeycomb(aircrafts, satellites), truss core (buildings, bridges), and web core[1,2], which can be manufactured by using a variety of base mate-rials, e.g., metal foils, plastic foils, or resin impregnated paper-likematerials made of synthetic or natural fibers.
The use of honeycomb is highly diffused in many engineeringapplications due to the high density-specific performances theycan offer. The main key performance factors of honeycombs are rep-resented by the ability to withstand through-thickness compressionand to absorb energy by plastic deformation of the cells. Generally,in the aerospace industry honeycomb structures are made of alumi-num foils, phenolic-impregnated Nomex� paper or carbon honey-comb, given their superior weight-specific mechanical propertiesin terms of stiffness and structural weight reduction [4–6]. Further-more they offer design versatility and cost-efficient manufacturing[7]. However, the closed structure of honeycomb cells may lead tonegative effects regarding condensed water trapped in the cellsand trigger an increase in weight as well as a reduction of mechan-ical properties. To overcome this issue, new configurations for corestructures, such as folded cores [8], have been recently introduced.

D. Asprone et al. / Composite Structures 105 (2013) 240–255 241
In particular, the manufacturing process is described in [9] and awide range of experimental results can be found in [10].
The knowledge of core constituent material properties and thesensitivity of such structures to different sources of defects repre-sent a fundamental concern for the development of a cellular-based finite element (FE) model able to capture the behavior ofsuch structures, including the buckling limit and the folding mech-anism occurring during the crushing mode.
Generally, the usual source of material imperfections is themanufacturing process of honeycomb structures. The most com-mon manufacturing method is the adhesive bonding followed byan expansion process [7]: honeycomb starts out as flat strips ofmaterial, or ribbons. Strips of adhesive are placed on the ribbonsin a staggered pattern; for metallic cores, a corrosive resistant coat-ing is applied to foil sheets before printing the adhesive lines. Thesheets are cut to the required thickness and stacked, and the adhe-sive is cured under pressure at elevated temperature. Once cured,the blocks are cut to the desired thickness, and then the ribbonsare pulled apart or expanded to form honeycomb. Fully expandedhoneycomb forms the classical hexagon shape whereas if theexpansion is stopped before or after the hexagons are fully formed,an under-expanded or an over-expanded core can be obtained,respectively. When metallic cores are expanded, the sheets yieldplastically and the node free wall joints thereby retain their ex-panded geometric shape. The procedure for nonmetallic honey-comb is slightly different. Here the honeycomb does not retainits shape after expansion and must be held in a rack. The blockweb material contains a small amount of resin which is heat-setin an oven. Most paper cores will retain their expanded shape.Then, the honeycomb block is dipped in liquid resin (usually phe-nolic or polyamide) and oven cured. The dipping curing cycle is re-peated until the block is at the desired density.
Most honeycomb structures show a similar mechanical behav-ior under out-of-plane (i.e., through-thickness direction) compres-sion. In particular, they are characterized by: (i) an initial linear-elastic regime up to the buckling limit and a subsequent compres-sive strength reduction; (ii) a plateau of constant stress, namedcrush strength, corresponding to a progressive degradation of cellwalls; (iii) a final segment of densification characterized by thecompression of the cell wall itself. However, honeycomb structurescan exhibit different features in their compressive out-of-planebehavior depending on the nature of the honeycomb core constit-uent material. In particular, when the critical compressive stress isreached, the cells begin to collapse by elastic buckling, plasticyielding or brittle fracture, depending on the wall material type.Hanel et al. [11] investigated the influence of the different papermaterials, i.e., Kevlar and Nomex, on the structural properties ofwedge-shaped folded cores, whereas other authors investigatedthe structural behavior of a honeycomb structure made of Nomexpaper material, making comparison with a honeycomb core madeof aluminum [12]. They report that Nomex material is much morebrittle than aluminum foil during the progressive failure mecha-nism and the crushing regime.
In dealing with the modeling of flat-wise compressive behav-ior, several approaches have been proposed, encompassing analyt-ical models [13,14], macromechanical finite element modelsadopting equivalent solid formulations [12], as well as meso-mechanical models focusing on the cellular honeycomb structure,both analytical and numerical [8,15–18]. Nevertheless, the firsttwo types of approaches present limiting drawbacks mainly re-lated to the prediction of the shear behavior and the progressivecollapse of the honeycomb cells. For these reasons, the problemis often tackled through detailed numerical models and/orthrough a virtual testing approach. In general, virtual testing con-sists of a step-by-step numerical procedure where a detailed mod-el is employed on the basis of experimental tests. Usually, this
procedure begins from a small scale (as an example, from couponmaterial tests); once the mechanical behavior is properly cali-brated at that scale, more complex tests can either be simulatedor carried out scaling up to the scale of the component/assembly.As a consequence of this process, experimental tests can be lim-ited to a preliminary stage supporting numerical implementationsin subsequent steps. This procedure represents a key tool espe-cially for composite materials exhibiting different behavior at dif-ferent scales. In fact, by reproducing the exact shape of the corestructure, this numerical technique gives the possibility to repro-duce not only the elastic behavior prior to cell wall buckling butalso the complex crushing behavior characterized by cell wallfolding mechanisms at micro/mesoscale, even though a largecomputational time may be required. Moreover, it allows to gath-er mechanical properties which are usually not available amongexperimental manufacturer databases. This kind of approach isusually pursued to model honeycomb or folded core materialsby using different scales ranging from one single cell scale to largescale including the full honeycomb model. An example of thisnumerical approach can be found in recent studies performedby Heimbs and concerning virtual testing of sandwich panelsmanufactured with Nomex honeycomb and folded cores [8]. Theauthor successfully simulated the cellular core behavior in differ-ent loading directions by adopting a very detailed finite elementmodel and addressing numerical problems such as mesh andloading rate dependencies. In addition, Giglio et al. [19] investi-gated the compressive behavior of Nomex hexagonal honeycombcore (with 32 kg/m3 core density and a nominal cell size of4.76 mm) through detailed finite element simulations; several as-pects were investigated, including a comparison between the useof shell elements vs solid elements for the modeling of Nomex cellwalls, mesh effects, glue and brittle phenolic resin effects as wellas dimensional scale issues. The results showed that both solidand shell elements can evaluate with a reasonable error the com-pressive peak value, but shell elements fail to demonstrate reli-able behavior in the plateau stress phase.
1.1. Research significance
In the present study, a statistical-based method to includeimperfections in the simulation is presented and applied to predictthe compressive behavior of hexagonal Nomex honeycomb struc-ture. A shell model of a representative single cell made of ex-panded Nomex has been created using the ABAQUS FE code(Simulia, Dassàult Systèmes, Providence, RI, USA). The key aspectproposed in the study is the inclusion of imperfections in termsof both material (elastic modulus variability) and geometrical(thickness variability) defects. A stochastic approach is proposedby performing random sampling at each element of the FE meshassuming different Young modulus values and different thicknessproperties according to a pre-defined statistical distribution. Themodeled cell is used to address several aspects of the compressiveresponse, particularly focusing on onset of buckling and collapselimit.
1.2. Imperfections – classification and modeling
Generally, different types of imperfections and irregularitiesmay affect the ideal structure of a cellular honeycomb core andmodify its mechanical behavior. These are inevitably generatedby the manufacturing process and/or loading conditions. A generalclassification of imperfections can be provided as follows [20,21]:
� Geometrical imperfections: i.e., shape defects, curvatures, nonperfect angular corners, surface roughness, wall thickness vari-ability, uneven cells (global imperfections);

242 D. Asprone et al. / Composite Structures 105 (2013) 240–255
� Material imperfections: i.e., variability of the material proper-ties, for example due to the heterogeneity of the adopted com-posite system (e.g., Nomex paper or CFRP), resin accumulationin cell wall corners, pores, variation of fiber volume fraction(local imperfections);� Initial imperfections: i.e., prestress and prestrain conditions;� Loading imperfections: i.e., load misalignment, variation of
loads.
Typically, the actual case originates as a combination of thekinds of imperfections listed above.
Defects are responsible for the initiation of damage and subse-quent degradation (damage propagation, folding phase, tearing ofthe edges, etc.) and, therefore, greatly influence the global and localmechanical response of the structure. Several studies have beenconducted addressing this issue. An ideal model without imperfec-tions tends to overestimate the mechanical properties, in particu-lar critical buckling load and initial stiffness [22,23]. Combescure[20] reported some results showing how initial shape imperfec-tions, thickness defects, and boundary condition imperfectionscan lead to a drastic decrease of the load carrying capacity of astructure under compression. Baranger et al. [22] analyzed theinfluence of geometrical defects in folded cores and their conse-quences on buckling behavior with the final aim of performing anumerical optimization of the core geometry. They reported thatgeometrical defects may play a major role in the response of thestructure in terms of stability problem involving both local andglobal buckling.
In this context the modeling of imperfections represents a crit-ical issue in the simulation process of cellular-based honeycombstructures. As a consequence of the variety of imperfections char-acterizing the manufactured core, different methods have beenimplemented to include imperfections into meso-scale honeycombFE models for virtual testing simulations. Geometrical imperfec-tions can be implemented on the basis of experimental observa-tions or by the geometric scanning of the actual shape of amanufactured core [20,23]. In addition, geometrical imperfectionscan be created in a model by performing random deviations fromthe ideal shape of nodal positions according to a fixed range of var-iability. This approach is generally called node shaking and is avail-able in most of the commercial FE codes. Baranger et al. [22]proposed a new method which differs from the aforementionedprocedures, based on the modeling of the manufacturing foldingprocess in order to reproduce physical defects, such as the out-of-straightness of the edges. Li et al. [24] studied honeycomb cellstructures having irregular cell shapes and non-uniform cell wallthickness by using a Voronoi tessellation technique and the FEmethod. Zheng and Yu [25] evaluated the influence of two typesof material defects, i.e. caused by randomly thickening/removingcell walls, on the deformation modes and plateau stress of metalhoneycomb structures by means of finite element simulations.They found that both types of defects were responsible for a signif-icant weakening effect at low impact velocities during dynamiccrushing of the investigated honeycomb structures. The effect ofcell wall corrugation, curvature and missing cell walls was investi-gated by [26–28]. Moreover, Fan [29] investigated thermoplastichexagonal honeycombs considering only that the vertical walls ofthe honeycombs were not perfectly straight (cell wall tilting angleof 0.2� from vertical position) for the nonlinear simulation of flat-wise compression test, obtaining a slightly overestimated finalstrength.
Another technique used to model imperfections is to considerglobal modes of the cell on the basis of linear buckling analysis[30,31]. More in detail, the ideal initial geometry (mesh) of the cellis distorted according to one of the computed global bucklingmodes (or eigenmodes) with an amplitude scaled down of about
1–5% of the wall thickness. Xue and Hutchinson [32] generatedeigenmodes by quasi-static buckling analysis with ABAQUS/Stan-dard and applied them to perturb the perfect geometry of squaremetal honeycomb and initiate cell wall buckling. Other examplescan be found in [33,34], where hexagonal honeycomb cores areinvestigated by means of ABAQUS/Standard and LS Dyna (LSTC,Livermore, CA, USA) FE codes. In all cases it is reported that theeigenmodes had a strong influence on the resulting compressivestress–strain curve with particular emphasis on the nonlinear partof the curve. The choice of one of the dominant modes and themagnitude of the scale factor may affect the global mechanical re-sponse, which sometimes can also be affected by the user’s sensi-bility. In particular, different imperfections corresponding todifferent buckling modes may lead to different collapse modes,affecting the effectiveness in determining the initial stiffness andthe compressive peak load [22,32]. Moreover, the use of the firstbuckling mode not necessarily allows to describe all types of de-fects and it may be not appropriate when constituent cell materialsare not homogeneous.
2. Materials and methods
The honeycomb sandwich material investigated within thepresent work is a 48 kg/m3 hexagonal honeycomb core with anominal cell size of 3.175 mm, made of Nomex phenolic resin-impregnated aramid paper. The trade name is HRH 10-1/8-3.0and it is manufactured by Hexcel [35]. Hexcel manufactures ara-mid-fiber reinforced honeycomb from three types of para-aramidsubstrates, including Nomex�, Kevlar�, and KOREX� materials.The analyzed honeycomb consists of Dupont’s Nomex aramid-fiber paper dipped in a heat-resistant phenolic resin to achievethe final density. It provides high strength, toughness and fireresistance properties in a small cell size. It is widely used ascore material for sandwich panels throughout the aerospaceindustry and also in several other commercial areas. Accordingto the datasheet of the manufacturer, the code name is referredto its geometrical and mechanical features: HRH 10 indicates theproduct type, 1/8 is the cell size in fractions of an inch and 3.0 isthe nominal density in pounds per cubic foot.
In Fig. 1a–c the geometry of the honeycomb is illustrated. Allthe honeycomb specimens considered in the following activitieshave been assembled with the ‘‘L’’ direction of the honeycomb corealong the primary direction. The Out-of-plane crushing behavior ofNomex honeycomb has been investigated by flat-wise stabilizedcompressive tests according to ASTM C365M standard. The testswere run on 60 � 60 � 32.2 mm Nomex core coupons (five)bonded between two 1-mm-thick E-glass fiber reinforced phenolicresin skins (with a cured ply thickness of 0.25 mm), with a con-stant cross head velocity of 0.5 mm/min. The specimens were lam-inated with external skins in order to prevent local crushing at theedges of the honeycomb cores. It should be pointed out that theuse of prepreg material and the autoclave molding process avoidedthe use of additional adhesive layer between the skin and the hon-eycomb core. Compressive modulus of the elastic phase, stabilizedcompressive strength and strain, crush strength, fully compactedcompressive modulus and strain values at which densification oc-curs have been derived by these tests.
2.1. Model features
The elastic and failure behavior of the honeycomb structure isstrongly influenced by cell wall mechanical properties and theirmodeling represents a crucial factor for the development of theFE honeycomb model. The manufacturing process generates anorthotropic material where aramid fibers embedded in the layers

(a) (b)
(c) (d)
c
t
2t
LW
W
ZL
W
Z
L
LW
L (w)
L (L)
h
Fig. 1. (a) 3D configuration of a honeycomb sandwich; (b) in plane periodical honeycomb microstructure for hexagonal cells, W–L plane; (c) single representative periodiccell; (d) 3D finite element mesh rendering for a single Nomex honeycomb cell (left) and visualization of random material property assignation (right).
D. Asprone et al. / Composite Structures 105 (2013) 240–255 243
are oriented almost randomly. The material is characterized by twoprincipal directions, called machine direction and cross direction.The principal material direction corresponds to the thickness direc-tion T of the honeycomb structure.
Foil thickness can be highly variable whereas porosity and lackof matrix can affect the ideal smoothness of the foil. The overallthickness is very difficult to estimate and can be detected directlyfrom micrographics or SEM images. It should be mentioned that itis not straightforward to gather experimental data of such papermaterial due to the thin configuration of the specimen. Mechanicalcharacterization of Nomex paper material can be found in experi-mental works performed by Tsujii et al. [36] as well as Foo et al.[5] while Fischer et al. [37] performed experimental tensile andcompressive tests on Kevlar based paper material used for foldedcores showing a mechanical performance similar to the Nomex pa-per. These experimental tests (including tension, compression, andbending) provided stress–strain curves as well as stiffness andstrength values reporting a nonlinear behavior that can be esti-mated by a bilinear elasto-perfectly plastic material law in com-pression. Moreover, differences in the material constitutivebehavior were found in different loading directions, machine, andcross direction. For instance, Foo et al. [5] reported that the mea-sured experimental Young’s moduli (in tension) of the Nomex pa-per were equal to 3.13 GPa and 0.955 GPa in the machine and cross
machine directions, respectively. Fisher et al. [37] derived the in-plane stress–strain curves of pre-impregnated aramid fiber paperused as standard base material for foldcore sandwich structures;in detail, they found that the axial tensile stress–strain curve wasalmost linear elastic with a failure stress of approximately100 MPa, while the axial compressive stress–strain curve showedan elastic-perfect plastic like behavior with an ultimate stressranging between 40 and 60 MPa.
The development of the Nomex honeycomb FE model is basedon the definition of a representative cell geometry, its meshing,the definition of boundary and loading conditions, and the assign-ment of proper constitutive material laws including the implemen-tation of imperfections.
The periodicity of the idealized hexagonal microstructure al-lows to consider one representative hexagonal unit cell to simulatethe buckling and compressive/crushing response of Nomex honey-comb observed in the experiments by assigning appropriateboundary conditions. The cell is extracted from the periodic micro-structure of the honeycomb as highlighted in Fig. 1b (dashed line).Residual stresses deriving from the mechanical expansion processthrough which the honeycomb is manufactured are assumed to benegligible. Additionally, the small rounding of the corners of theactual cells is not taken into account. The final idealized cell geom-etry is shown in Fig. 1c in the L–W plane and it is depicted in a

0
1
2
3
0 0.2 0.4 0.6 0.8Strain [-]
Stre
ss [M
Pa]
(a)
(b)
Fig. 2. (a) Compressive stress–strain, r vs d/h, response for HRH 10-1/8-3.0hexagonal Nomex honeycomb; (b) sequence of photographs of honeycomb cells atdifferent stages of axial compressive strain.
244 D. Asprone et al. / Composite Structures 105 (2013) 240–255
three-dimensional rendering in Fig. 1d. The representative cell isrepresented by a perfect hexagonal cell of diameter c ¼ l
ffiffiffi3p
, paperthickness t and height h. The corresponding projected area is equalto 3
2
ffiffiffi3p
l� �
� ð3lÞ, i.e. the two cell dimensions in the W and L direc-tion, respectively. The double wall thickness of both sides in the Ldirection is due to the manufacturing process (adhesive betweenstrips) and a monolithic thickness of 2t is assumed in the modelneglecting the bonding of the two walls. The hexagonal unit cellis discretized within the nonlinear FE code ABAQUS using 9000S4 shell elements. The bottom edges of the unit cell are assumedto be fixed while the nodes of the top edges can only translate inthe z-direction. To enforce periodicity, for the six lateral edges ofthe unit cell only displacements in the plane perpendicular to thewall direction and rotations around the radial direction are al-lowed. The cell is loaded by incrementally prescribing the z dis-placement of the top surface, indicated as d.
According to the manufacturer, the cell walls are made of a0.051 mm thick Nomex� T412 aramid paper with an additionalphenolic resin coating, resulting in a total average wall thicknessof roughly 0.063 mm. This value has been taken as a referencefor the single wall thickness t in the honeycomb single cell model.The constitutive behavior of the implemented material model wasassumed to be isotropic and linearly elasto-perfectly plastic untilfailure, on the basis of available experimental results for Nomexpaper material [5,36]; in detail, a value of 3.50 GPa was used asYoung’s modulus whereas a value of 60 MPa was used as stresslimit for plastic yielding of Nomex material. The assumption of thisconstitutive law is often used for this kind of detailed FE simula-tion; however, some limitations may arise when using thisassumption mainly due to the fact that the true orthotropic mate-rial constitutive behavior is not taken into account and the a real(plastic) failure strain of the material is not identified. These fea-tures may affect in someway Nomex damage prediction, such astearing phenomena.
As previously mentioned, the actual cellular structure of anhoneycomb core is non-uniform in geometry and characterizedby imperfections and irregularities. This feature inevitably affectsthe critical buckling load of the single cell and the overall strengthof the honeycomb structure which would be overestimated in amodel without imperfections. In Nomex� honeycomb cores bothglobal and local imperfections are present arising from the manu-facturing process, i.e., the expansion of the hexagonal cells and thedipping into phenolic resin.
In the present work, since impregnated aramid-paper exhibitsmainly variations in the material properties and paper thickness,two different sources of imperfections were investigated in theFE model of the Nomex cell:
� foil thickness variability,� in-plane Young modulus variability.
In fact, there are significant variations in the material propertiesand paper thickness, especially in case of impregnated aramid pa-per. In particular, experimental tensile tests on aramid-impreg-nated paper revealed, through observations by optical strainmeasurement, that there was a strongly varying in-plane straindistribution over the paper area. This was attributed to the varia-tion of paper thickness, fiber dispensation within the phenolic ma-trix, rough surfaces, resin accumulation [38]. In addition, Fischeret al. [37] observed displacements varying over the paper area aswell, and microscopic analysis revealed irregular properties of pa-per thickness, fiber distribution/orientation with the presence of aquantity of voids in the phenolic resin. This evidence is importantsince the weakest or thinnest areas of a cell wall may initiate theglobal buckling, triggering damages. Other types of imperfections

(a)
(b)
(d)
(c)
0.0
2.0
4.0
6.0
8.0
0.0 0.1 0.2 0.3 0.4 0.5 0.6
σ(M
Pa)
δ/h (%)
Elastic Modulus Variability_CV20Thickness Variability_CV20Elastic Modulus Variability_CV5Thickness Variability_CV5Compr. Strength - Buckling Analysis, Wilbert et al. [30]Buckling Limit, Wilbert et al. [30]With imperfections, Wilbert et al. [30]
2.0
2.5
3.0
3.5
4.0
0.13 0.15 0.18 0.20 0.23
σ(M
Pa)
δ/h (%)
3.5
4.0
4.5
5.0
5.5
0.23 0.25 0.28 0.30 0.33 0.35 0.38 0.40 0.43 0.45
σ(M
Pa)
δ/h (%)
A B C
Fig. 3. (a) Compressive stress–strain, r vs d/h, response for Hexcel Al-5052-H39 hexagonal aluminum honeycomb; (b) focus on critical buckling load; (c) focus oncompressive strength; (d) first (A), second (B) buckling mode and plasticized cell (C) as a result of the current approach.
D. Asprone et al. / Composite Structures 105 (2013) 240–255 245
described in the previous sections are not handled for the develop-ment of the model.
According to the current approach, the properties of Nomex pa-per are modified in terms of wall thickness and material constitu-tive properties by stochastically distributing thickness and elasticmodulus values over the finite elements of the numerical model.Values of thickness and elastic modulus were chosen according
to a uniform distribution, defined by the average value and thecoefficient of variation (CV). In detail, the average values have beenassumed equal to 0.063 mm and 3.50 GPa for the thickness and theYoung modulus, respectively. In dealing with the CV, four differentvalues have been considered, i.e., 10%, 15%, 20%, and 25%. All theadopted distributions are presented in combination with the re-sults of the analysis (see Figs. 5–7).
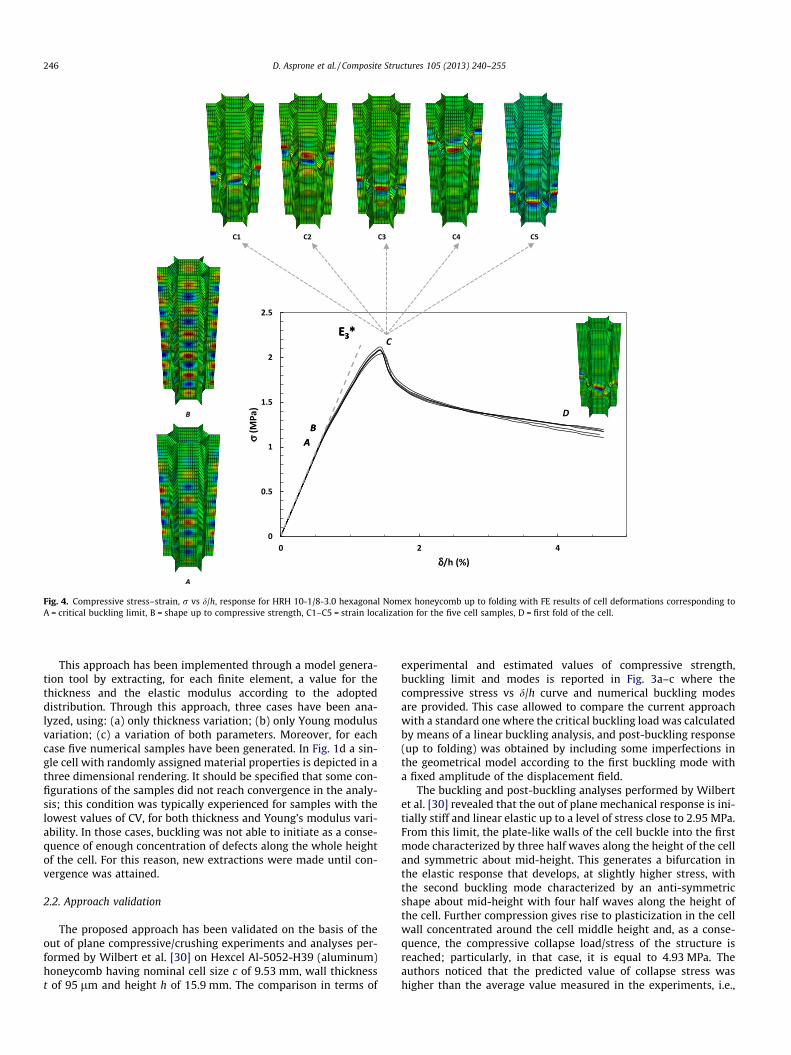
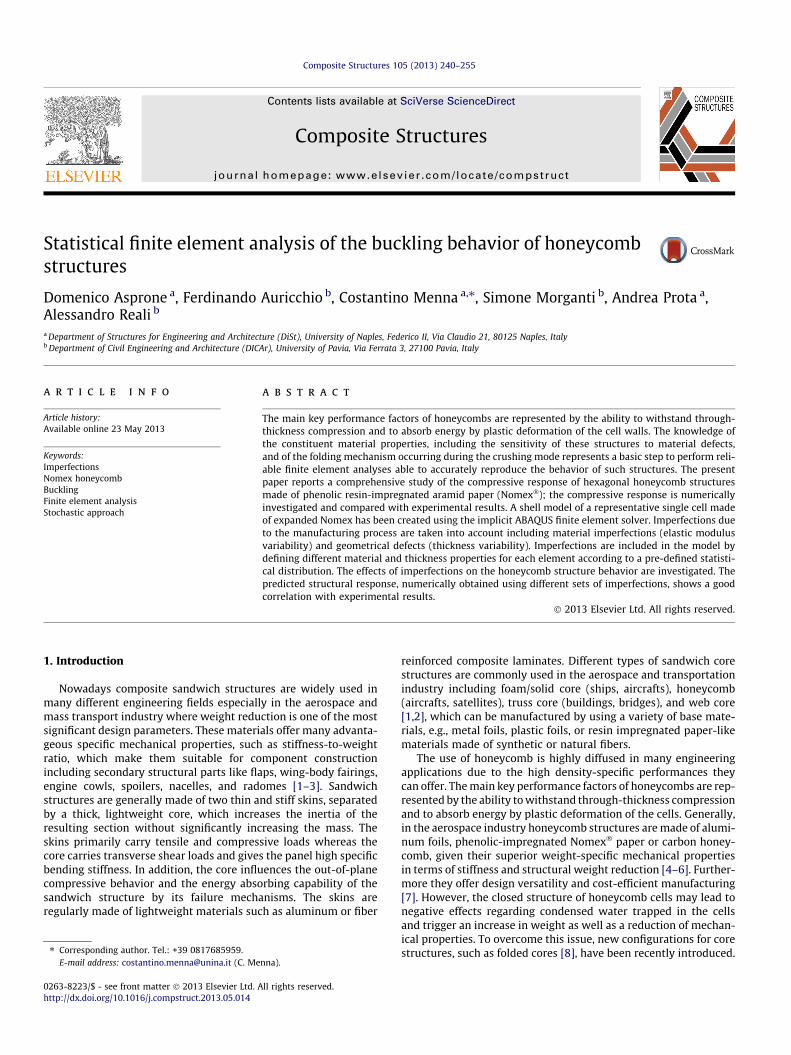
Fig. 4. Compressive stress–strain, r vs d/h, response for HRH 10-1/8-3.0 hexagonal Nomex honeycomb up to folding with FE results of cell deformations corresponding toA = critical buckling limit, B = shape up to compressive strength, C1–C5 = strain localization for the five cell samples, D = first fold of the cell.
246 D. Asprone et al. / Composite Structures 105 (2013) 240–255
This approach has been implemented through a model genera-tion tool by extracting, for each finite element, a value for thethickness and the elastic modulus according to the adopteddistribution. Through this approach, three cases have been ana-lyzed, using: (a) only thickness variation; (b) only Young modulusvariation; (c) a variation of both parameters. Moreover, for eachcase five numerical samples have been generated. In Fig. 1d a sin-gle cell with randomly assigned material properties is depicted in athree dimensional rendering. It should be specified that some con-figurations of the samples did not reach convergence in the analy-sis; this condition was typically experienced for samples with thelowest values of CV, for both thickness and Young’s modulus vari-ability. In those cases, buckling was not able to initiate as a conse-quence of enough concentration of defects along the whole heightof the cell. For this reason, new extractions were made until con-vergence was attained.
2.2. Approach validation
The proposed approach has been validated on the basis of theout of plane compressive/crushing experiments and analyses per-formed by Wilbert et al. [30] on Hexcel Al-5052-H39 (aluminum)honeycomb having nominal cell size c of 9.53 mm, wall thicknesst of 95 lm and height h of 15.9 mm. The comparison in terms of
experimental and estimated values of compressive strength,buckling limit and modes is reported in Fig. 3a–c where thecompressive stress vs d/h curve and numerical buckling modesare provided. This case allowed to compare the current approachwith a standard one where the critical buckling load was calculatedby means of a linear buckling analysis, and post-buckling response(up to folding) was obtained by including some imperfections inthe geometrical model according to the first buckling mode witha fixed amplitude of the displacement field.
The buckling and post-buckling analyses performed by Wilbertet al. [30] revealed that the out of plane mechanical response is ini-tially stiff and linear elastic up to a level of stress close to 2.95 MPa.From this limit, the plate-like walls of the cell buckle into the firstmode characterized by three half waves along the height of the celland symmetric about mid-height. This generates a bifurcation inthe elastic response that develops, at slightly higher stress, withthe second buckling mode characterized by an anti-symmetricshape about mid-height with four half waves along the height ofthe cell. Further compression gives rise to plasticization in the cellwall concentrated around the cell middle height and, as a conse-quence, the compressive collapse load/stress of the structure isreached; particularly, in that case, it is equal to 4.93 MPa. Theauthors noticed that the predicted value of collapse stress washigher than the average value measured in the experiments, i.e.,

σσ
δ (a)
σ
δ
σ
δ
σ
δ
σ
δ
σ
δ
(b)
(c)
Fig. 5. Effect of thickness variability on r vs d/h curves for (a) CV = 10%, (b) CV = 15%, (c) CV = 20%, (d) CV = 25% with the corresponding PDF and focusing on the peak ofcompressive strength; (e) superposition of CV = 10% and CV = 25% cases.
D. Asprone et al. / Composite Structures 105 (2013) 240–255 247
3.72 MPa, and, for this reason, they performed imperfectionsensitivity studies aimed at investigating various sources of imper-fections which tend to reduce the collapse load.
Within the present approach, the mechanical properties of thehoneycomb Al-5052-H39 foil were assigned on the basis of theexperimental results gathered in that work. Accordingly, an isotro-

σσ
δδ (d)
σσ
δδ
σσ
δδ
σσ
δδ(e)Fig. 5 (continued)
248 D. Asprone et al. / Composite Structures 105 (2013) 240–255
pic and linearly elasto-perfectly plastic until failure constitutivebehavior has been adopted for the aluminum foil, with elasticmodulus equal to 69 GPa, and yield stress as 248 MPa. The cellmodel was then generated considering only thickness variationand only Young Modulus variation into two limit cases for eachone, corresponding to values of CV equal to 5%, and 20% (five sam-ples for each case).
3. Results and discussion
3.1. Experimental behavior
The compressive stress–strain relationship (Fig. 2a) of the No-mex honeycomb core has been gained through an out-of-planeflat-wise compressive test previously illustrated. The nominalcompressive stress has been derived as the reordered force dividedby the projected area of the honeycomb specimen, i.e., L �Wdimensions. As reported in different works dealing with the exper-imental compressive behavior of Nomex based sandwich struc-tures, the constitutive behavior achieved from the presentexperimental tests, consisted of three characteristic stages: t theelastic regime up to the stabilized compressive strength (rc), the
crushing regime at nearly constant plateau stress (crush strength,rcrush), and finally the densification regime, where the cellularstructure is fully compacted resulting in a steep stress increase.Fig. 3a reports the mean curve of five replicate specimens, wherethe three characteristic deformation stages are noticeable. Theaverage values of the compressive elastic modulus, compressivestrength, crushing strength, and densification strain computed onfive specimens are reported in Table 1 with the correspondingcoefficient of variation.
Fig. 2b depicts some highlights (points A–E) on the deformationphases undergone by the Nomex structure under compressivestress. In details, after the initial linear elastic phase (with an aver-age compressive elastic modulus of Ec = 137.7 MPa), the axialdeformation develops into different waves along the total heightof the cells for a short range of deformation values, leading to ashort nonlinear elastic regime (postbuckling) that is not easy tocapture in the experiment. In fact, for Nomex honeycombs, failureis due to a ‘crushing’ mechanism, initiated by elastic buckling anddeveloping as a plastic buckling process [39,40]. By proceedingwith axial deformation, the previous phase is rapidly followed bythe localization of the deformation in correspondence to a certainnumber of cells of the honeycomb and at different positions along

σ
δ(a)
σσ
δδ
σ
δ(b)
σσ
δδ
σ
δ(c)
σσ
δδ
Fig. 6. Effect of Young modulus variability on r vs d/h curves for (a) CV = 10%, (b) CV = 15%, (c) CV = 20%, (d) CV = 25% with the corresponding PDF and focusing on the peak ofcompressive strength; (e) superposition of CV = 10% and CV = 25% cases.
D. Asprone et al. / Composite Structures 105 (2013) 240–255 249
σ
δ (d)
σσ
δδ
σ
δ
σσ
δδ(e)
Fig. 6 (continued)
250 D. Asprone et al. / Composite Structures 105 (2013) 240–255
the height of the cells, that triggers the attainment of the compres-sive collapse limit of the honeycomb, rc; the experimental averagevalue (computed on five specimens) is equal to rc = 2.08 MPa witha coefficient of variation CVexp = 4.46%. It can be highlighted thatthe deformation does not localize into equal waves for all the cellsof the honeycomb and does not develop symmetrically about themid height of the cell. On the contrary, from Fig. 2b point B, itcan be seen that the waves develop with different shapes andthe collapse takes place randomly along the height of different cellsof the specimen where the local stress concentration is attained.The collapse is due to the failure of the deformed foils of the cellwhich is represented by a drop in the compressive load carryingcapacity approximately equal to one third of the collapse stress va-lue. The load slightly increases after reaching the minimum of thestress due to the resistance offered by the deformed cells that startto fold on the plasticized points along the cell height. The foldingprocess develops consecutive folds with small in length, rapidlycollapsing one on each other. Within this stage the stress is notable to step up and is kept almost at the constant value of the crushstrength, rcrush = 1.31 MPa. When folding is completed throughoutall the height of the cell, the densification regime takes place at anaverage value of strain of ed = 0.76. At this phase, the compressiveresistance is offered by the compacted material leading to a stepincrease in the stress (point E Fig. 2b). It should be noticed thatthe free edge of the specimen may play a major role in the positionof the concentration of the strain.
3.2. Numerical results
The results of the implicit analysis conducted with ABAQUS/Standard on the aluminum honeycomb cell are compared in termsof experimental and estimated values of compressive strength,buckling limit and modes obtained by Wilbert et al. [30]. Fig. 3a re-ports the compressive stress vs d/h for the different cases whereasthe inset in the same figure depicts the aluminum cell with vari-able material properties represented by different colors. Due tohigh repeatability in the results, only 2 of the 5 sample curves havebeen reported in the graph. Dashed and solid lines correspond toCV equal to 5% and 20% respectively, whereas gray and black linescorrespond to elastic modulus and thickness variability, respec-tively. Horizontal lines correspond to Wilbert’s result in terms ofelastic buckling limit and compressive strength values from buck-ling analysis. It should be pointed out that the adopted thicknessand Young’s modulus variation within the thin aluminum sheetsis not intended to reproduce the physical pattern of imperfectionsaffecting the aluminum material walls; in fact the range of varia-tion could be reasonably lower in the actual case (where the cellmaterial is homogeneous) with respect to the range of CV (i.e. 5%and 20%) adopted for the approach validation on aluminum honey-comb cell. However, for the scope of the study on Nomex material,for which a higher variability was expected, the implementation ofthis range of material imperfections allowed to evaluate the effecton the experimental compressive response and to appreciate the
σ
δ
(a)
σ
δ
σ
δ
(b)
σ
δ
σ
δ
(c)
σ
δ
σ
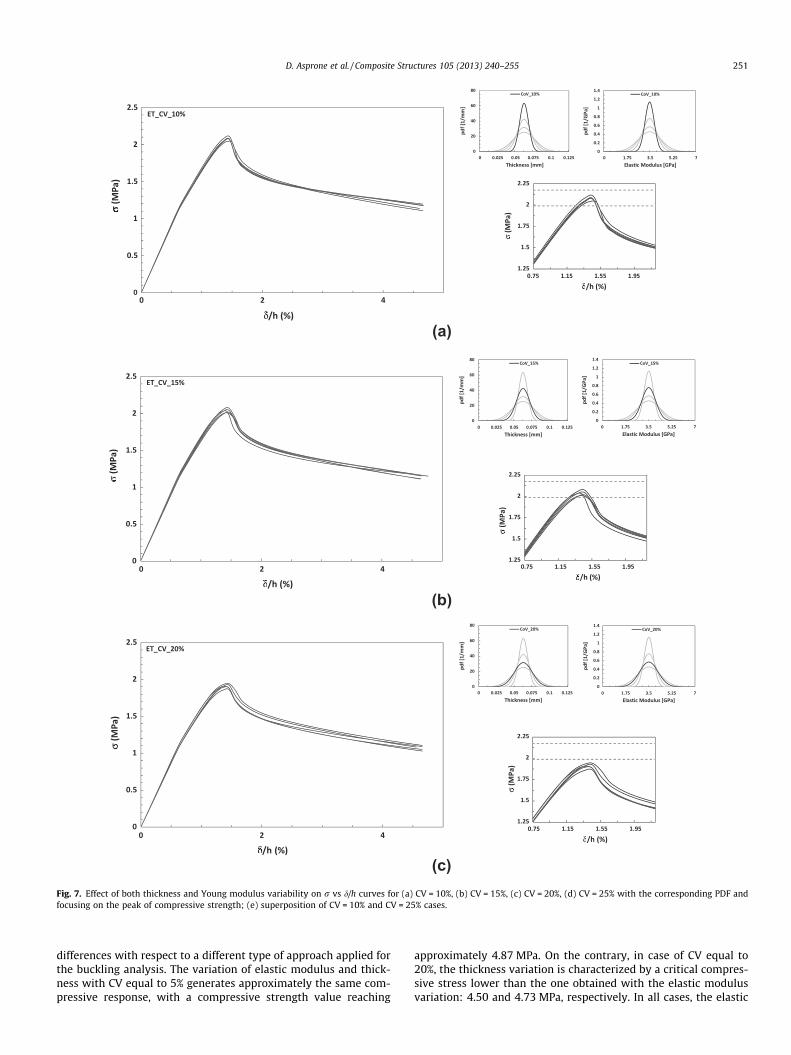
Fig. 7. Effect of both thickness and Young modulus variability on r vs d/h curves for (a) CV = 10%, (b) CV = 15%, (c) CV = 20%, (d) CV = 25% with the corresponding PDF andfocusing on the peak of compressive strength; (e) superposition of CV = 10% and CV = 25% cases.
D. Asprone et al. / Composite Structures 105 (2013) 240–255 251
differences with respect to a different type of approach applied forthe buckling analysis. The variation of elastic modulus and thick-ness with CV equal to 5% generates approximately the same com-pressive response, with a compressive strength value reaching
approximately 4.87 MPa. On the contrary, in case of CV equal to20%, the thickness variation is characterized by a critical compres-sive stress lower than the one obtained with the elastic modulusvariation: 4.50 and 4.73 MPa, respectively. In all cases, the elastic

σ
δ (d)
σ
δδ
σ
δ
δ
σ
(e)Fig. 7 (continued)
252 D. Asprone et al. / Composite Structures 105 (2013) 240–255
stiffness, for both linear and nonlinear parts, is approximately thesame since the curves appear almost superposed. Moreover, the re-sponse is characterized by an elastic critical buckling limit at astress level of 3.0 MPa (A point in Fig. 3a and b), that is very closeto the one obtained by Wilbert et al. [30] by means of elastic buck-ling simulation. At this point, a bifurcation takes place and a defor-mation shape corresponding to the first buckling mode (with threewaves) shows up (point A in Fig. 3a and b); due to bifurcation, thepost-buckling regime is held with a nonlinear trend, as found byWilbert et al. [30] by adding shape imperfections to the cell. Byslightly increasing the stress values, the cell deforms according tothe second mode (with four waves point B in Fig. 3a and b) andthe deformation continues with this shape up to the plasticizationof the cell wall around middle height (point C in Fig. 3a and c). InFig. 3a, the dashes blue line represents the response of an imperfectversion of the unit cell obtained by Wilbert et al. [30] by assigningan initial deformation according to the first buckling mode withthe point of maximum transverse deflection of amplitude equalto the cell thickness, t. In this case, the peak of the maximum com-pressive stress approximately corresponds to the one obtained incase of CV equal to 20% for thickness variation, whereas the elasticstiffness is not affected by a reduction as it happens in case of firstbuckling mode imperfection.
The results of the implicit analysis on the Nomex honeycombcell are presented in the following in terms of compressive stress
r vs d/h curves for the different implemented imperfections: thick-ness variability, elastic modulus variability, and both thickness andelastic modulus variability. All the analysis have been run up tocontact between cell walls, as a consequence of the folding process,i.e., approximately at a d/h value equal to 4–5%. Each of the threecases of imperfection has been applied to the five samples, consid-ering four different coefficients of variation, namely, CV = 10%, 15%,20%, 25% (cf. Figs. 4–7). Unlike the range of compressive strain (i.e.d/h) adopted in Fig. 2a, for Figs. 4–7 this range is reduced to a max-imum value of 5%, with the aim of focusing on the peak of com-pressive stress. For each graph, the corresponding ProbabilityDensity Functions (PDFs, black line in the figures) are reportedfor the variability of thickness only, elastic modulus only, as wellas of both thickness and elastic modulus. Moreover, the region ofthe graph corresponding to the attainment of the peak of compres-sive stress is highlighted in Figs. 5–7 within the experimental sta-tistical values (dashed lines in the figures), computed as:
rmin ¼ rexpc ð1� CVexpÞ and rmax
c ¼ rexpc ð1þ CVexpÞ
where rexpc and CVexp are the average experimental compressive
strength and the corresponding experimental coefficient of varia-tion, respectively. The compressive behavior reproduced by theanalysis is practically the same for the investigated cases. For thisreason, the detailed description of the r vs d/h curve is conducted

Table 1Mechanical properties of Nomex Honeycomb – experimental results.
Compressive behavior Average Coefficient of variation (%)
Young modulus (MPa) 137.7 7.74Compressive strength (MPa) 2.08 4.46Crush strength (MPa) 1.31 2.27Densification strain (–) 0.76 1.63
(a)
(b)
(c)
Fig. 8. (a) Average computed compressive strength vs CV adopted for Nomexproperties; (b) average computed Young modulus vs CV adopted for Nomexproperties; (c) CV on computed compressive strength vs CV adopted for Nomexproperties.
D. Asprone et al. / Composite Structures 105 (2013) 240–255 253
only for the case of both elastic modulus and thickness variabilitywith CV = 10%, as depicted in Fig. 4.
The five samples generated within the above-mentioned imper-fections, are characterized by a very similar compressive behaviorwith small differences in the values of the peak of compressivestress. The linear elastic regime of the honeycomb cell is governedby the elastic modulus E�3. The theoretical prediction for the sand-wich structure Young modulus E�3 [39,40] reported in Fig. 4, fornormal loading into the through-the-thickness direction, simplyreflects the cell material Young modulus Es scaled by the area ofthe load-bearing section:
E�3Es¼ 2
cos að1þ sinaÞ �tl¼ q
qs
where a is the angle between the inclined walls and the W directionand q and qs are the density of the honeycomb structure and of thesolid cell wall material, respectively. In the case of perfect hexago-nal cells with a = 30� and c ¼ l
ffiffiffi3p
, the relationship becomes:
E�3ES¼ 8
3� tc¼ q
qs
The linear elastic regime terminates when the cell walls of thehoneycomb buckle elastically at a value of compressive stress ofapproximately 1.20 MPa (Fig. 4A). After reaching the critical buck-ling load a bifurcation takes place in the r vs d/h curve giving riseto the nonlinear post buckling regime. At this point the cell bulgesin a periodic way according to the shape depicted in Fig. 4B thatevolves in a different manner at slightly higher level of stress. Thisis a common behavior among honeycomb structures; generally,the linear-elastic regime terminates when the cell walls of the hon-eycombs buckle elastically, or bend plastically, or fracture in a brit-tle manner [40], depending on the relative density q
qs: in low
density flexible structural honeycombs it is usually elastic bucklingthat first leads to nonlinear behavior, although it is found that inintermediate and high density honeycombs, fracture can occur un-der compression into the through-the-thickness direction. Com-monly, the initiation of elastic buckling does not make thehoneycomb lose all of its stiffness and load-carrying capacity; fail-ure of structural plates is typically defined by the ultimatestrength, considering post buckling strength [40]. The configura-tion at point B is kept unchanged up to the attainment of the com-pressive peak of stress rc, where yielding is reached in someelements of the mesh along the height of the cell leading to a sud-den drop in the compressive stress. In terms of physical behavior,the sampling generation having different values of Es and t withina statistical range of variation, is mainly reflected through differentcompressive strength values and different positions at which plas-ticization occurs rather than through different buckling mode se-quences. Fig. 4C depicts five cells corresponding to the fivedifferent samples at the collapse deformation. It can be noticedthat the position along the height at which compressive strainlocalizes is different for the five cases as well as the initial directionof folding, that can be even inclined with respect to the L direction.The folding mechanism begins from that point along the height ofthe cell, while the compressive stress slightly changes from case tocase due the residual resistance offered by the deformed cells. Theimplicit analysis terminates when cell walls collapse one on eachother due to progressive folding.
In dealing with the three cases of imperfections, the cell wallthickness variability generates a compressive response that is verysimilar among the five samples in case of CV = 10% with an averagecompressive strength rc equal to 2.084 MPa, that is well repre-sented in the experimental range defined by rmin
c , rmaxc (Fig. 5a).
By increasing the thickness variability CV, the average compressivestrength (computed on 5 samples) decreases almost linearly up to avalue of 1.864 MPa corresponding to the case of CV = 25% (Fig. 5b–d); in this case the r vs d/h curves for the five samples appear very

254 D. Asprone et al. / Composite Structures 105 (2013) 240–255
different each other. In detail, from Fig. 5e, where the casesCV = 10% and CV = 25% are superposed, it appears that a significantvariation of t reduces the compressive strength values, the slope ofnonlinear elastic regime, and the residual stress after collapse.
A Young modulus variability gives rise to a compressive re-sponse that is very similar among the five samples and for all theCV adopted within the analysis. In particular, when the adoptedYoung modulus has a lower variability with respect to the initialone (i.e., 3.50 GPa), the five curves appear well superposed withan average compressive stress equal to 2.135 MPa that is slightlyoverestimated with respect to the average experimental one, butstill within the experimental range defined by rmin
c , rmaxc (Fig. 6b
and c). By increasing the CV of Young modulus (Fig. 6c and d),the average compressive strength decreases almost linearly up tothe value of 2.036 MPa in case of CV = 25% that is still characterizedby small statistical variation. The nonlinear elastic regime is stifferin case of little variability whereas the post peak behavior is not af-fected by the different CV (see Fig. 6e).
When both foil thickness and Young modulus variability areused to model imperfection in the honeycomb cell, the averagecompressive strength decreases in a nonlinear manner from2.072 MPa to 1.815 MPa for CV = 10% to CV = 25%, respectively(see Fig. 7a–e). From Fig. 8a it can be highlighted that, when the var-iability in the material properties is high, the effect of both types ofimperfections is amplified and a greater loss in the compressiveload carrying capacity is experienced (with respect to the previouscases). Moreover, in case of CV = 25%, the r vs d/h curves show sig-nificant deviations for the five samples in terms of compressivestrength and post peak behavior with a significant lower stiffnessin the nonlinear elastic regime with respect to the case of CV = 10%.
Fig. 8 summarizes the results of the analysis in terms of averagecompressive strength rc (a), and average Young modulus Ec (b).The increase of CV on thickness variability and Young modulustriggers a linear decrease of the average compressive strength thatis much more noticeable in case of thickness variability. In fact, inthe range of CV = 10 and 25%, the compressive strength varies be-tween 2.03 and 2.13 MPa when imperfection on Young modulusare included in the model; on the contrary, the compressivestrength decreases up to 1.86 MPa when an high level of statisticaldeviation is considered for the thickness variability. The combina-tion of both types of imperfections gives rise to a nonlinear de-crease of compressive strength with increasing CV, with asensible underestimation in case of CV = 25%, i.e., rc = 1.81 MPa,that is out of the experimental limits. It is interesting to notice(Fig. 8c) that only thickness variability leads to a wide range of sta-tistical deviation on the computed compressive strength: between1% and 4% values of CV. On the contrary, the Young modulus vari-ability of the Nomex paper produces samples very close to eachother in terms of compressive behavior, with a CV on the computedcompressive strength always less than 1%.
The compressive elastic modulus of the honeycomb structure(Fig. 8b) appears slightly dependent on the CV when thicknessand Young modulus imperfections are individually implementedin the cell model. However, in these cases the computed value ofcompressive elastic modulus of the honeycomb structure is overes-timated compared to the experimental one. On the contrary, thecombination of the two types of imperfections sensibly affectsthe compressive elastic modulus, especially in case of high CV.
4. Conclusions
In the present paper, a statistics-based method for virtual test-ing of cellular sandwich core structures using FE simulations hasbeen presented. An hexagonal honeycomb core made of Nomexmaterial has been investigated in order to cover some important
aspects related to its out-of-plane compressive response, such aslinear elastic response, onset of instability, collapse limit (and itslocalization and progressive folding). The proposed method dealswith the random sampling of the elements of the mesh in a FEnumerical analysis on the basis of a normal distribution for thick-ness and Young modulus of the cell wall material. This has allowedto incorporate material imperfections in the model and evaluatethe influence of imperfection variability on the compressive re-sponse of Nomex honeycomb cells. All the simulations have beenrun through ABAQUS/Standard. The analysis have revealed thatthe compressive behavior of the Nomex honeycomb is more sensi-tive to thickness imperfections rather than Young modulus varia-tion: a large CV on wall thickness tends to underestimate thecompressive strength of the honeycomb if compared to the exper-imental values, whereas the Young modulus variation (within allthe adopted CV) gives rise to compressive strength values alwaysin the range of the experimental ones, even though the statisticalvariation on the numerical results is very limited. In general, whenboth the imperfections are included in the model in the range ofCV = 10–15% a very good correlation to experimental results canbe achieved with respect to compressive stress–strain relation-ships. Moreover, the detailed representation of the cell also allowsfor a deep investigation of the cell wall deformation patterns andfailure modes to get a better understanding of the structuralbehavior, which can be expensive and sometimes difficult to studyusing only experimental observations. The present method can bepotentially useful for the complete characterization of the mechan-ical behavior of honeycomb structures accounting for the influenceof physical imperfections, especially when experimental character-ization is not straightforward, such as in the case of tension andshear loading in both in-plane and out-of- plane directions. Futureimprovements applied to the proposed approach regard firstly theexperimental characterization of Nomex material to have a morecomplete stress strain relationship up to failure; then, on the basisof the results, the implementation of more refined constitutivelaws for such materials could be achieved.
Finally, we would like to emphasize that the approach couldalso be successfully extended and applied to other mechanicalproblems where different sources of imperfections play a majorrole, as well as when experimental testing is difficult and a virtualtesting analysis is desirable.
Acknowledgements
The authors have been partially supported by the MIUR-PRINproject n. 2010BFXRHS. F. Auricchio, S. Morganti, and A. Reali havebeen also partially supported by the European Research Councilthrough the Starting Independent Research Grants no. 259229.This support is gratefully acknowledged.
References
[1] Sandwich structures 7: advancing with sandwich structures and materials. In:Proceedings of the 7th international conference on sandwich structuresAalborg, Denmark: Aalborg University; 2005.
[2] Vinson JR. Behavior of sandwich structures. University of Delaware, Newark,USA: Crc Press Inc.; 1999.
[3] BDM-6700. Introduction to sandwich structures. Boeing design manual 01 APR1989.
[4] Mistou S, Sabarots M, Karama M. Experimental and Numerical Simulations ofthe Static and Dynamic Behavior of Sandwich Plates. European Congress onComputational Methods in Applied Sciences and Engineering, Barcelona,Spain; 2000.
[5] Foo CC, Chai GB, Seah LK. Mechanical properties of Nomex material and Nomexhoneycomb structure. Compos Struct 2007;80:588–94.
[6] Allegri G, Lecci U, Marchetti M, Poscente F. FEM simulation of the mechanicalbehaviour of sandwich materials for aerospace structures. Exp Tech DesCompos Mater 5 2002;221–222:209–20.
[7] Bitzer T. Honeycomb technology, materials, design, manufacturing,applications and testing. Chapman & Hall; 1997. ISBN-13: 9780412540509.

D. Asprone et al. / Composite Structures 105 (2013) 240–255 255
[8] Heimbs S. Virtual testing of sandwich core structures using dynamic finiteelement simulations. Comput Mater Sci 2009;45:205–16.
[9] Drechsler K, Kehrle R. Manufacturing of folded core-structures for technicalapplications. In: 25th International SAMPE Europe conference, Paris; 2004. p.508–13.
[10] Nguyen MQ, Jacombs SS, Thomson RS, Hachenberg D, Scott ML. Simulation ofimpact on sandwich structures. Compos Struct 2005;67:217–27.
[11] Hahnel F, Wolf K, Hauffe A, Alekseev KA, Zakirov IM. Wedge-shaped foldedsandwich cores for aircraft applications: from design and manufacturingprocess to experimental structure validation. CEAS Aeronaut J 2011;2:203–12.
[12] Aktay L, Johnson AF, Kroplin BH. Numerical modelling of honeycomb corecrush behaviour. Eng Fract Mech 2008;75:2616–30.
[13] Aktay L, Johnson AF, Holzapfel M. Prediction of impact damage on sandwichcomposite panels. Comput Mater Sci 2005;32:252–60.
[14] Fatt MSH, Park KS. Perforation of honeycomb sandwich plates by projectiles.Compos Part a – Appl Sci Manuf 2000;31:889–99.
[15] Aminanda Y, Castanie B, Barrau JJ, Thevenet P. Experimental analysis andmodeling of the crushing of honeycomb cores. Appl Compos Mater2005;12:213–27.
[16] Castanie B, Bouvet C, Aminanda Y, Barrau JJ, Thevenet P. Modelling of low-energy/low-velocity impact on Nomex honeycomb sandwich structures withmetallic skins. Int J Impact Eng 2008;35:620–34.
[17] Yamashita M, Gotoh M. Impact behavior of honeycomb structures withvarious cell specifications – numerical simulation and experiment. Int J ImpactEng 2005;32:618–30.
[18] Hohe J, Becker W. Effective stress–strain relations for two-dimensional cellularsandwich cores: homogenization, material models, and properties. Appl MechRev 2002;55:61.
[19] Giglio M, Manes A, Gilioli A. Investigations on sandwich core propertiesthrough an experimental–numerical approach. Compos Part B-Eng2012;43:361–74.
[20] Combescure A. Influence of initial imperfections on the collapse of thin walledstructures. In: Predeleanu, Gilormini, editors. Advanced methods in materialsprocessing defects. Elsevier; 1997.
[21] Bazant ZP, Cedolin L. Stability of structures: elastic, inelastic, fracture anddamage theories. New York: Oxford University Press; 1991 [ISBN:0- 486-42568-1] 1011p.
[22] Baranger E, Guidault PA, Cluzel C. Numerical modeling of the geometricaldefects of an origami-like sandwich core. Compos Struct 2011;93:2504–10.
[23] Yang MY, Huang JS, Hu JW. Elastic buckling of hexagonal honeycombs withdual imperfections. Compos Struct 2008;82:326–35.
[24] Li K, Gao XL, Wang J. Dynamic crushing behavior of honeycomb structureswith irregular cell shapes and non-uniform cell wall thickness. Int J SolidsStruct 2007;44:5003–26.
[25] Zheng ZJ, Yu JL. Effect of random defects on dynamic response of honeycombstructures. Mater Sci Forum 2012;706–709:805–10.
[26] Simone AE, Gibson LJ. The effects of cell face curvature and corrugations on thestiffness and strength of metallic foams. Acta Mater 1998;46:3929–35.
[27] Kress G, Winkler M. Honeycomb sandwich residual stress deformationpattern. Compos Struct 2009;89:294–302.
[28] Markaki AE, Clyne TW. The effect of cell wall microstructure on thedeformation and fracture of aluminium-based foams. Acta Mater2001;49:1677–86.
[29] Fan X. Investigation on processing and mechanical properties of thecontinuously produced thermoplastic honeycomb. PhD Thesis, KatholiekeUniversiteit Leuven, Belgium; 2006.
[30] Wilbert A, Jang WY, Kyriakides S, Floccari JF. Buckling and progressive crushingof laterally loaded honeycomb. Int J Solids Struct 2011;48:803–16.
[31] Craig KJ, Roux WJ. On the investigation of shell buckling due to randomgeometrical imperfections implemented using Karhunen-Loeve expansions.Int J Numer Methods Eng 2008;73:1715–26.
[32] Xue ZY, Hutchinson JW. Crush dynamics of square honeycomb sandwich cores.Int J Numer Methods Eng 2006;65:2221–45.
[33] Mohr D, Doyoyo M. Deformation-induced folding systems in thin-walledmonolithic hexagonal metallic honeycomb. Int J Solids Struct2004;41:3353–77.
[34] Heimbs S, Kilchert S, Fischer S, Klaus M, Baranger E. Sandwich structures withfolded core: mechanical modeling and impact simulations. 30Tth SAMPEEUROPE, Paris; 2009.
[35] HexWeb-HRH-10. Aramid Fibre/Phenolic Honeycomb, Product Data. HexcellCorporation.
[36] Tsujii Y, Tanaka K, Nishida Y. Analysis of mechanical properties of aramidhoneycomb core. Trans Jpn Soc Mech Eng 1995;61:1608–14.
[37] Fischer S, Drechsler K, Kilchert S, Johnson A. Mechanical tests for foldcore basematerial properties. Compos Part a – Appl Sci Manuf 2009;40:1941–52.
[38] Heimbs S, Middendorf P, Kilchert S, Johnson AF, Maier M. Experimental andnumerical analysis of composite folded sandwich core structures undercompression. Appl Compos Mater 2007;14:363–77.
[39] Petras A, Sutcliffe MPF. Failure mode maps for honeycomb sandwich panels.Compos Struct 1999;44:237–52.
[40] Zhang J, Ashby MF. The out-of-plane properties of honeycombs. Int J Mech Sci1992;34:475–89.


![CD8+ Tumor-Infiltrating T Cells Are Trapped in the Tumor … · 2016. 12. 19. · tumor cells induces immunogenic cross-presentation of dying tumor cells [4,5] or sensitizing tumor](https://img.pdfslide.us/doc/110x75/5fbd8f04c0953e25272e83ca/cd8-tumor-infiltrating-t-cells-are-trapped-in-the-tumor-2016-12-19-tumor-cells.jpg)