Embed Size (px)
Citation preview
May 1982Final Report
DOT HS-806-210
©US. Departmentof TransportationNational HighwayTraffic SafelyAdministration
Statistical Evaluation of FederalMotor Vehicle Safety Standard 105(Passenger Car Hydraulic Brakes)
J. Richard Stewart
Highway-Safety Research CenterUniversity of North CarolinaChapel Hill, North Carolina 27514
Contract No. DTNH 22-81-C-06006Contract Amount $99,407
This document is available to the U.S. public through the National Technical InformationService, Springfield, Virginia 22161
This document is disseminated under the sponsorshipof the Department of Transportation in the interestof information exchange. The United States Govern-ment assumes no liability for its contents or usethereof.
CONTRACT TECHNICAL MANAGER'S ADDENDUM
Prepared for the National Highway Traffic Safety Administration in supportof its program of regulatory reform - review of existing regulations - asrequired by Executive Order 12291. Agency staff will perform and publishan official evaluation of Federal Motor Vehicle Safety Standard 105 basedon the findings of this report as well as other information sources. Thevalues of effectiveness and benefits found in this report may be differentfrom those that will appear in the official Agency evaluation.
Technical Report Documentation Page
1. Report No.
DOT-HS-806 210
2. Government Accession No. 3. Recipient's Catalog No,
4. Title and Subtitle
Statistical Evaluation of Federal Motor VehicleSafety Standard 105 (Passenger Car Hydraulic Brakes)
S. Report Dote
May 19826. Performing Orgonization Code
7. Author'*)
J. Richard Stewart
8. Performing Organization Report No.
9. Performing Organization Name and Address
Highway Safety Research CenterUniversi ty of North CarolinaChapel H i l l , N.C. 27514
10. Work Unit No. (TRAIS)
11 • Contract or Grant No.
DTNH22-81-C-06006
12. Sponsoring Agency Name and Address
Department of TransportationNational Highway Traffic Safety AdministrationNassif BuildingWashington, DC 20590
' 3 . Type of Report ond Period Covered
Final ReportJune 2, 1981 - Apr i l 15, 1982
14. Sponsoring Agency Code
IS. Supplementary Notes
16. Abstract
This study investigates the effects of dual master cylinders and discbrakes which were introduced by automobile manufacturers to meet the 1968 and1976 versions, respectively, of Federal Motor Vehicle Safety Standard 105.Regression analyses were used to determine the effects of dual master cylindersand disc brakes with respect to two performance variables:
(i) the percentage of accident-involved cars reported to havebrake defects, and
(ii) the percentage of time that a car of a given class was thestriking car in two-car front-to-rear crashes.
Data for the analyses were taken from North Carolina accidents occurring betwee1971 and 1979.
Both dual master cylinders and disc brakes were found to be statisticallysignificant in reducing the percentage of cars in accidents with brake defects.Neither, however, was found to be significantly associated with the percentageof striking cars in two car front-to-rear crashes.
17. Key Words
Brake standard FMVSS 105Brake defects, Front-to-rear crashesRegression analysis
18. Distribution Statement
Document is available to the publicthrough the National Technical Infor-mation Service, Springfield, Virginia22161
19. Security Clonef. (of this report) 20. Security Clossif. (of this page) 21. No. of Pages
76
22. Price
Form DOT F 1700.7 (8-72) Reproduction of form and completed page is authorized
iii
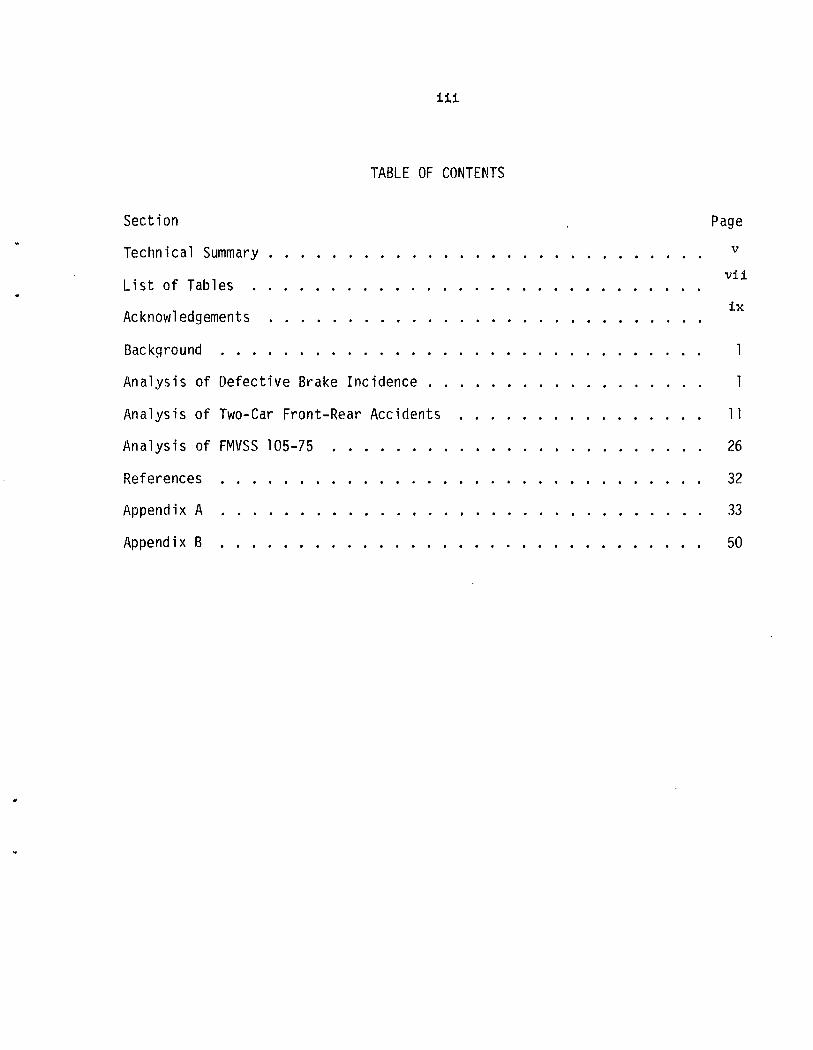
TABLE OF CONTENTS
Section , Page
Technical Summary v
viiList of Tables
ixAcknowledgements
Background 1
Analysis of Defective Brake Incidence 1
Analysis of Two-Car Front-Rear Accidents 11
Analysis of FMVSS 105-75 26
References 32
Appendix A 33
Appendix B 50

Technical Summary
Dual master cylinders and disc brakes were introduced by automobilemanufacturers to meet, respectively, the 1968 and 1976 versions of Federal MotorVehicle Safety Standard (FMVSS) 105. Certain other braking system improvements(e.g., improved brake lining materials, proportioning and metering valves , andlarger rear drums) were included on some 1975 and 1976 model year cars as aresponse to FMVSS 105. This study investigates the effect of these brakingsystem changes with respect to two performance criteria:
(i) the percentage of accident involved cars reported to havedefective brakes, and
(ii) the percentage of times that a car of a given class was thestriking car in two-car front-to-rear crashes.
The basic data for these analyses was taken from North Carolina accidentsoccurring during the years 1971 through 1979 involving domestic passenger carsof 1960 and later model years. Since it was thought that driving in mountainousregions or in wet weather conditions may place more of a burden on a car'sbraking system, accidents occurring under either of these conditions were alsoanalyzed separately.
The analyses involved computing the percentage of accident-involved carshaving brake defects in car groups defined in terms of accident year, vehiclemodel year, and, in some cases, specific car make. The percentage of times thata car; belonging to a given group was the striking car in a two-carfront-to-rear crash was also computed for the same car groups. These twoquantities (percentage with defects and percentage of striking cars) were thenused as dependent variables in weighted regression analyses. Among theindependent variables in the various regression models were:
o percentage of cars (in the group) having dual master cylinders,
o percentage of cars equipped with disc brakes,
o percentage with power brakes,
o car age,
o average car weight (in pounds) for the group,
o indicators of calendar (or accident) year,o indicators of specific car make.Very good fits to the data on the percentage of cars with brake defects
were provided by the regression models, and both the percentage with dualbraking systems and the percentage with disc brakes were found to be highlysignificant with respect to this criterion. The results were quite consistent
vi
over the three accident conditions (all accidents, hilly region accidents, and
wet weather accidents).
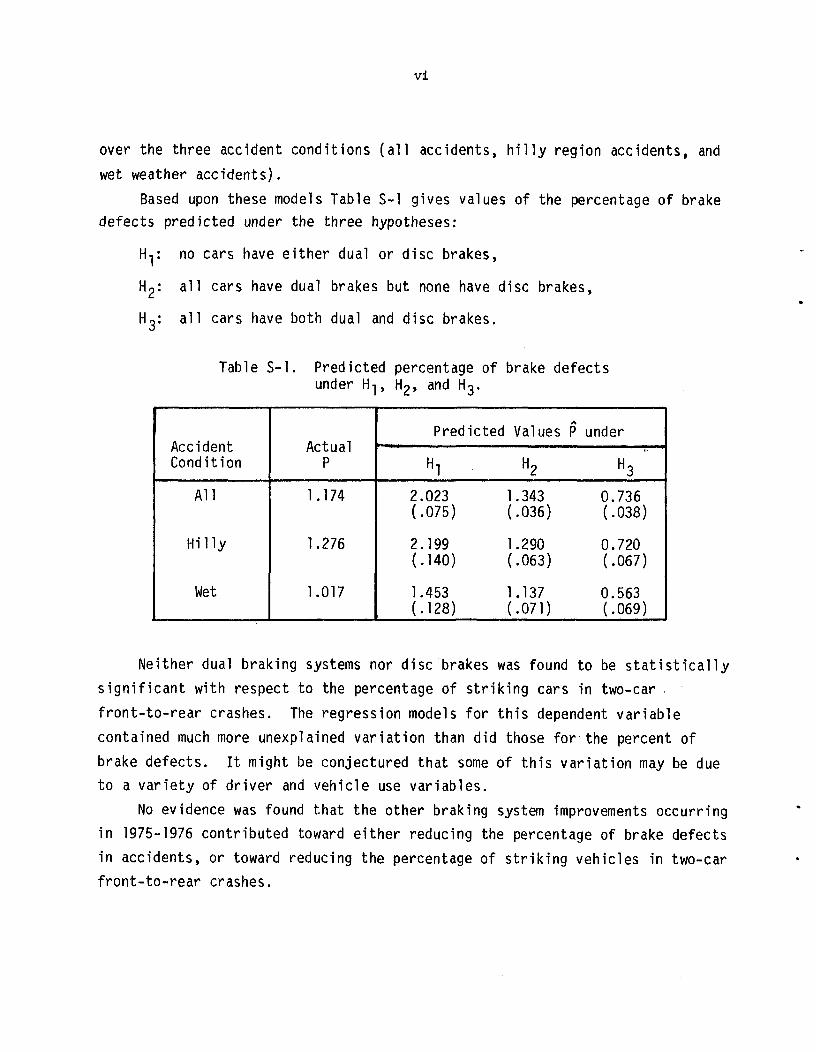
Based upon these models Table S-l gives values of the percentage of brakedefects predicted under the three hypotheses:
H-p no cars have either dual or disc brakes,
H2: all cars have dual brakes but none have disc brakes,
H3: all cars have both dual and disc brakes.
Table S-l. Predicted percentage of brake defectsunder H-], H2, and H3.
AccidentCondition
All
Hilly
Wet
ActualP
1.174
1.276
1.017
Predicted
Hl
2.023(.075)
2.199(.140)
1.453(.128)
Values P
H2
1.343(.036)
1.290(.063)
1.137(.071)
under
H3
0.736(.038)
0.720(.067)
0.563(.069)
Neither dual braking systems nor disc brakes was found to be statistically
significant with respect to the percentage of striking cars in two-car .
front-to-rear crashes. The regression models for this dependent variable
contained much more unexplained variation than did those for the percent of
brake defects. It might be conjectured that some of this variation may be due
to a variety of driver and vehicle use variables.
No evidence was found that the other braking system improvements occurring
in 1975-1976 contributed toward either reducing the percentage of brake defects
in accidents, or toward reducing the percentage of striking vehicles in two-car
front-to-rear crashes.
Number
1
2
•3
4
5
6
7
8
9
10
11
12
13
14
15
16
17
18
19
Page
2
3
6
8
8
9
11
13
19
19
20
21
24
25
25
26
27
28
28
vii
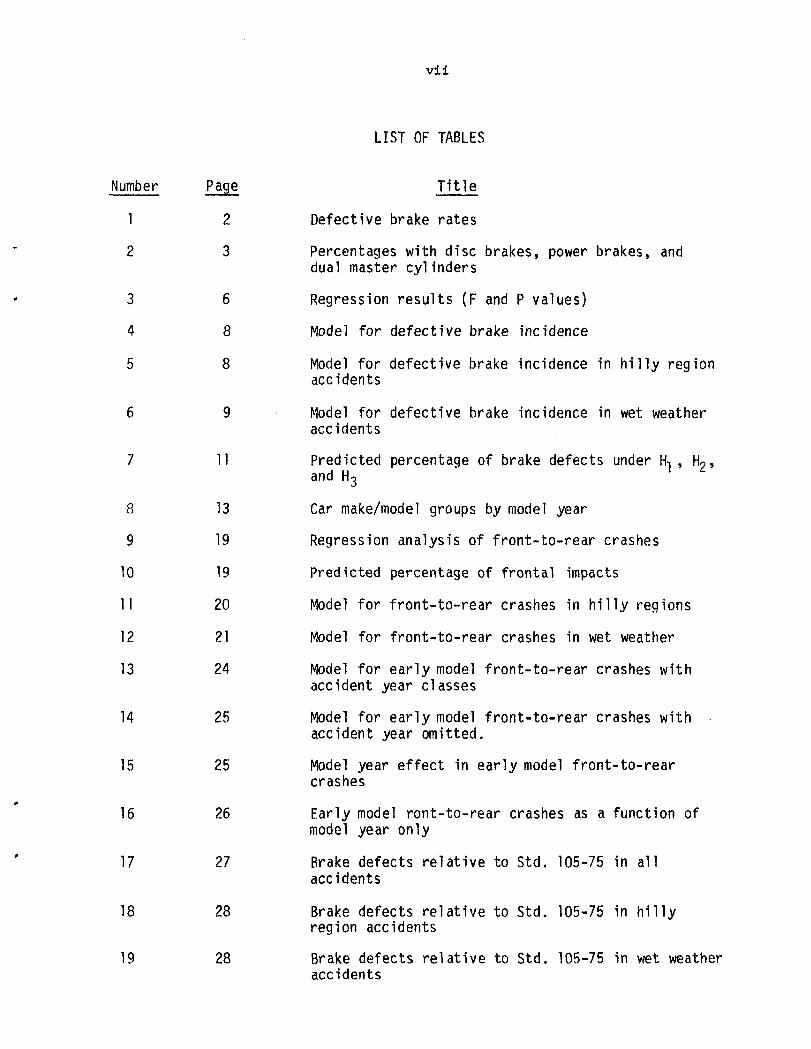
LIST OF TABLES
Title
Defective brake rates
Percentages with disc brakes, power brakes, anddual master cylinders
Regression results (F and P values)
Model for defective brake incidence
Model for defective brake incidence in hilly regionaccidents
Model for defective brake incidence in wet weatheraccidents
Predicted percentage of brake defects under H-, , H?,and H3 '
Car make/model groups by model year
Regression analysis of front-to-rear crashes
Predicted percentage of frontal impacts
Model for front-to-rear crashes in hilly regions
Model for front-to-rear crashes in wet weather
Model for early model front-to-rear crashes withaccident year classes
Model for early model front-to-rear crashes withaccident year omitted.
Model year effect in early model front-to-rearcrashes
Early model ront-to-rear crashes as a function ofmodel year only
Brake defects relative to Std. 105-75 in allaccidents
Brake defects relative to Std. 105-75 in hillyregion accidents
Brake defects relative to Std. 105-75 in wet weatheraccidents
viil
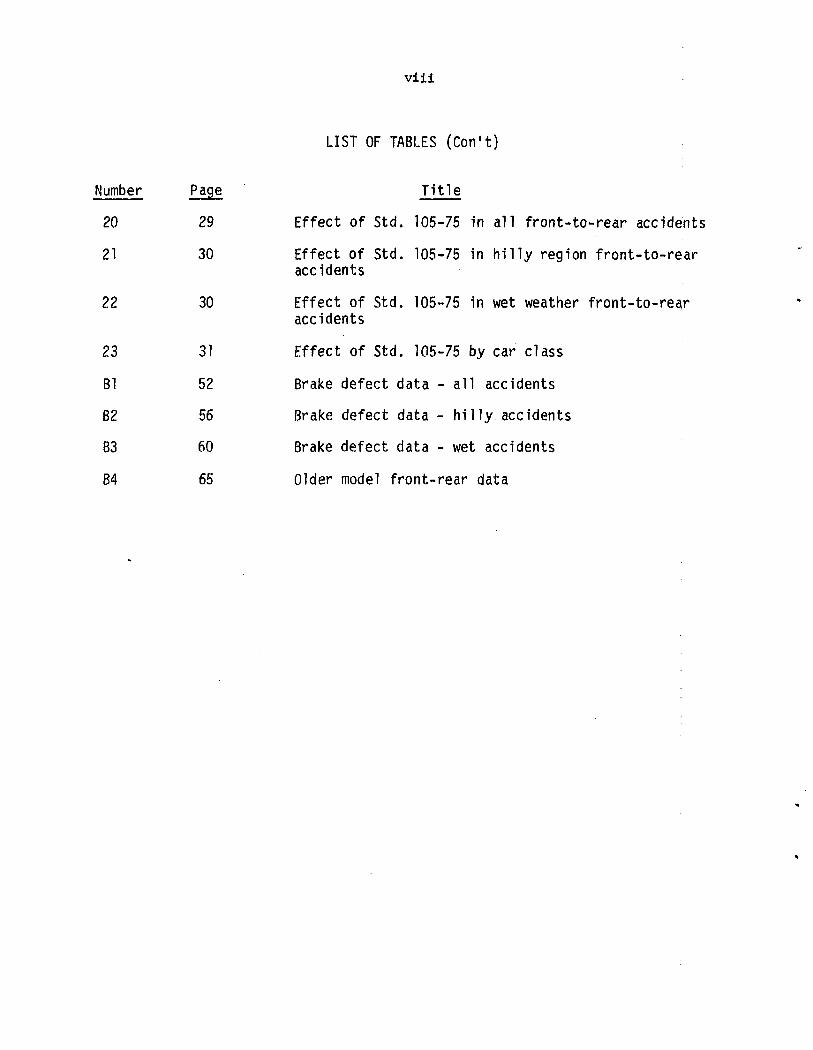
LIST OF TABLES (Con't)
Number Page Title
20 29 Effect of Std. 105-75 in all front-to-rear accidents
21 30 Effect of Std. 105-75 in hilly region front-to-rearaccidents
22 30 Effect of Std. 105-75 in wet weather front-to-rear
accidents
Effect of Std. 105-75 by car class
Brake defect data - all accidents
Brake defect data - hilly accidents
Brake defect data - wet accidents
Older model front-rear data
23
Bl
B2
B3
B4
31
52
56
60
65
ix
ACKNOWLEDGEMENTS
The author would like to express his appreciation to Dr. Charles J. Kahane,
the Contract Technical Manager, for his many helpful suggestions throughout the
course of this research.
Thanks are also due to several members of the HSRC staff. These include
Mr. Douglas Easterling and Ms. Mei-Mei Ma for developing the required data files
and assisting with the computer programing, Ms. Teresa Parks for typing the
reports, and Dr. Donald Reinfurt for carefully reviewing the final report.
Background
Federal Motor Vehicle Safety Standard (FMVSS) 105 specifies performance
requirements for passenger car brakes. In response to the 1968 version of the
standard requiring a split braking system, the automobile manufacturers
introduced dual master cylinders into 1962-1967 model year cars. Disc brakes
were introduced by the manufacturers to meet the 1976 requirements for fade and
water resistance, and, more generally, to improve vehicle handling under braking
conditions.
The analyses described in this report do not constitute an evaluation of
FMVSS 105 per se, but, rather, an evaluation of dual master cylinders and disc
brakes.
The evaluations of dual master cylinders and disc brakes were carried out
with respect to two criterion measures:
A. the percentage of cars in accidents which were indicated bythe investigating officer in the accident report as havingdefective brakes, and
B. the percentage of cars involved in front-to-rear impacts whichsuffer frontal damage: an improvement in brake performance,ceteris paribus, might decrease the likelihood of being the striking(frontally damaged) vehicle in a front-to-rear crash.
Analyses with respect to criterion A are described in the next section, while
those with respect to criterion B are contained in the following two sections.
Analyses of Defective Brake Incidence
The basic data for these analyses was taken from accident reports for 1971
through 1979 North Carolina accidents involving domestic passenger cars of 1960
and later model years. Vehicles were classified into accident year by model
year categories to yield a table similar to that shown in Table 1. A complete
description of the data processing is contained in Appendix A. The vth row of
the table corresponds to the ijtli accident year, model year combination, n ^
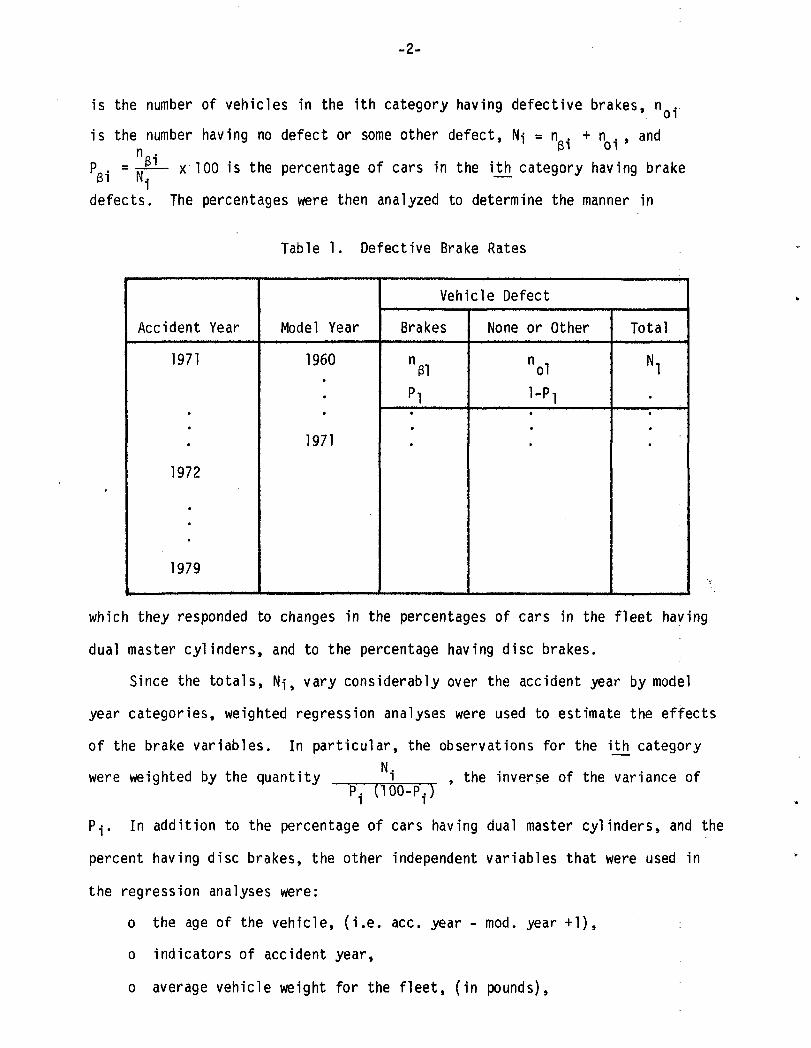
-2-
is the number of vehicles in the ith category having defective brakes, n .
is the number having no defect or some other defect, Ni = n . + n . , and
Po. = T T ^ — x 100 is the percentage of cars in the ith category having brake
defects. The percentages were then analyzed to determine the manner in
Table 1. Defective Brake Rates
Accident Year
1971
:
1972
*
1979
Model Year
1960
»0
1971
Vehicle Defect
Brakes
%1
*
None or Other
nol
1-Pl
•
Total
Ni
:
which they responded to changes in the percentages of cars in the fleet having
dual master cylinders, and to the percentage having disc brakes.
Since the totals, N-j, vary considerably over the accident year by model
year categories, weighted regression analyses were used to estimate the effects
of the brake variables. In particular, the observations for the i_th_ category
were weighted by the quantity NiP1 U00-P.)
, the inverse of the variance of
P.,-. In addition ta the percentage of cars having dual master cylinders, and the
percent having disc brakes, the other independent variables that were used in
the regression analyses were:
o the age of the vehicle, (i.e. ace. year - mod. year +1),
o indicators of accident year,
o average vehicle weight for the fleet, (in pounds),
-3-
o the percent of the fleet with power brakes.
The average vehicle weight was calculated for each combination of accident year
and model year as the sample mean of the weights of those vehicles involved in
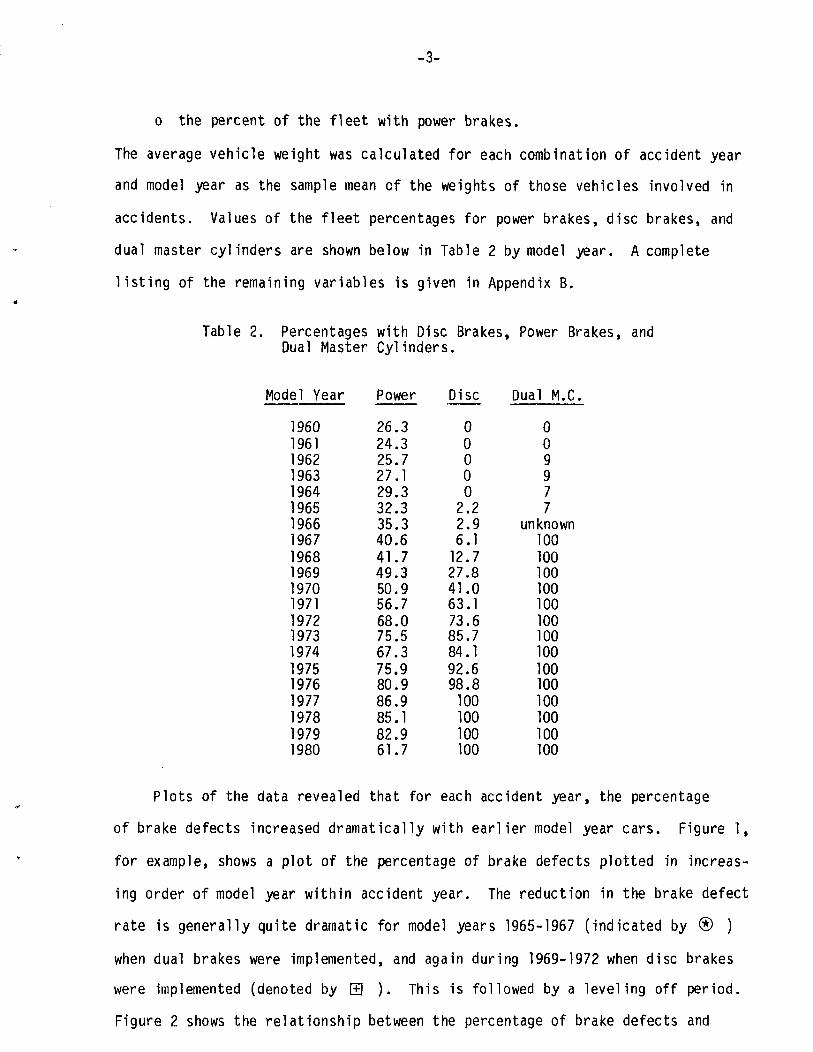
accidents. Values of the fleet percentages for power brakes, disc brakes, and
dual master cylinders are shown below in Table 2 by model year. A complete
listing of the remaining variables is given in Appendix B.
Table 2. Percentages with Disc Brakes, Power Brakes, andDual Master Cylinders.
Model Year
196019611962196319641965196619671968196919701971197219731974197519761977197819791980
Power
26.324.325.727.129.332.335.340.641.749.350.956.768.075.567.375.980.986.985.182.961.7
Disc
000002.22.96.112.727.841.063.173.685.784.192.698.8100100100100
Dual M.C.
009977
unknown100100100100100100100100100100100100100100
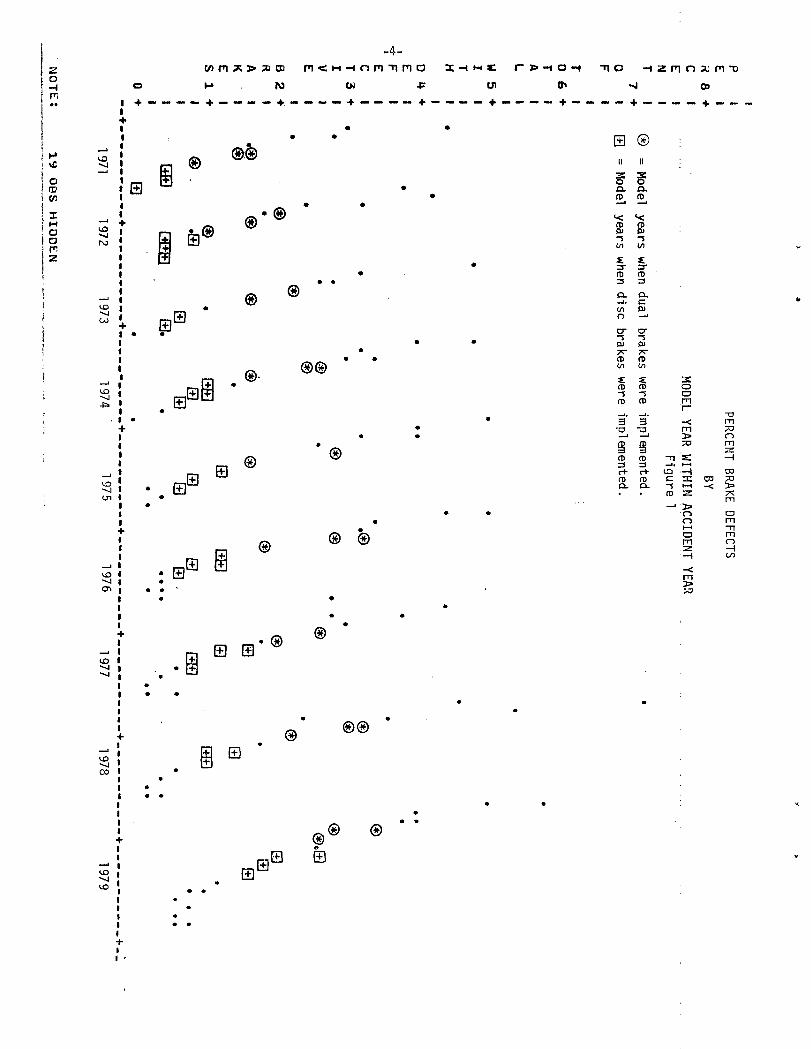
Plots of the data revealed that for each accident year, the percentage
of brake defects increased dramatically with earlier model year cars. Figure 1,
for example, shows a plot of the percentage of brake defects plotted in increas-
ing order of model year within accident year. The reduction in the brake defect
rate is generally quite dramatic for model years 1965-1967 (indicated by ® )
when dual brakes were implemented, and again during 1969-1972 when disc brakes
were implemented (denoted by El ). This is followed by a leveling off period.
Figure 2 shows the relationship between the percentage of brake defects and
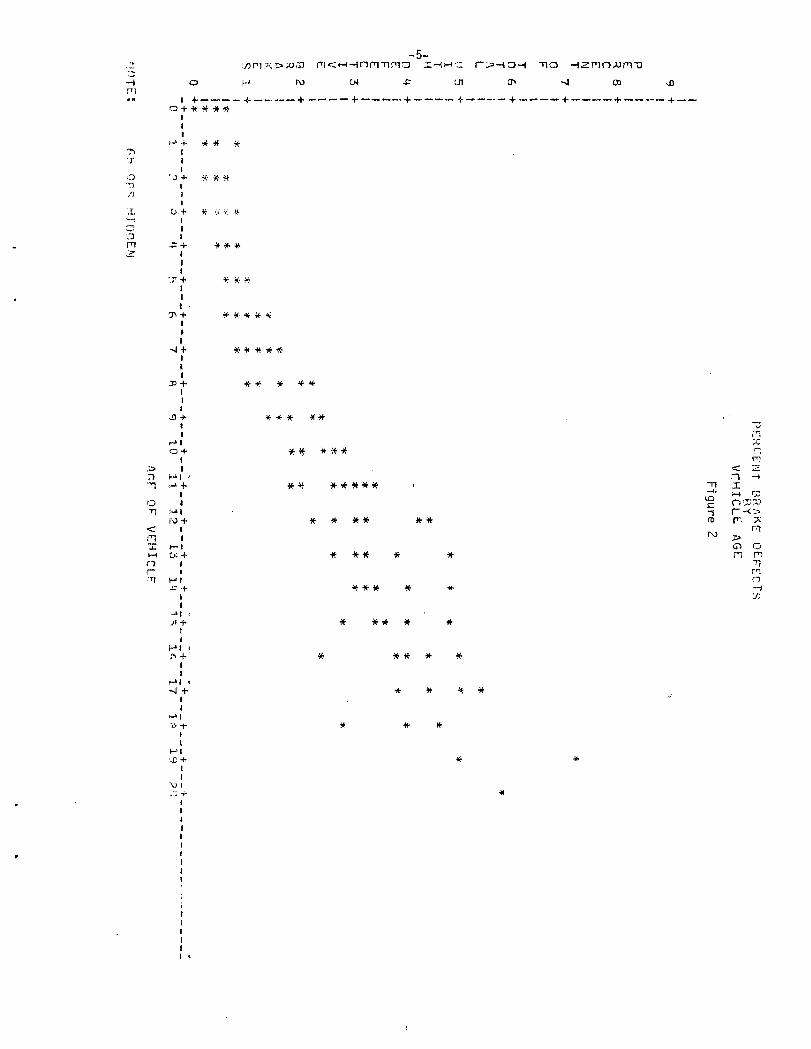
-6-
vehicle age. Thus, it appeared that the brake defect rate might be strongly
related to vehicle age, and possibly the brake variables.
Initial regression analyses were run (using the SAS GLM Procedure) using
both linear and log linear models, and including all of the independent
variables listed above. Accident year was entered as a class variable with nine
levels. Refinements to the models were made by omitting non-significant
variables, by grouping similar levels of class variables, and by considering
various potential interaction terms.
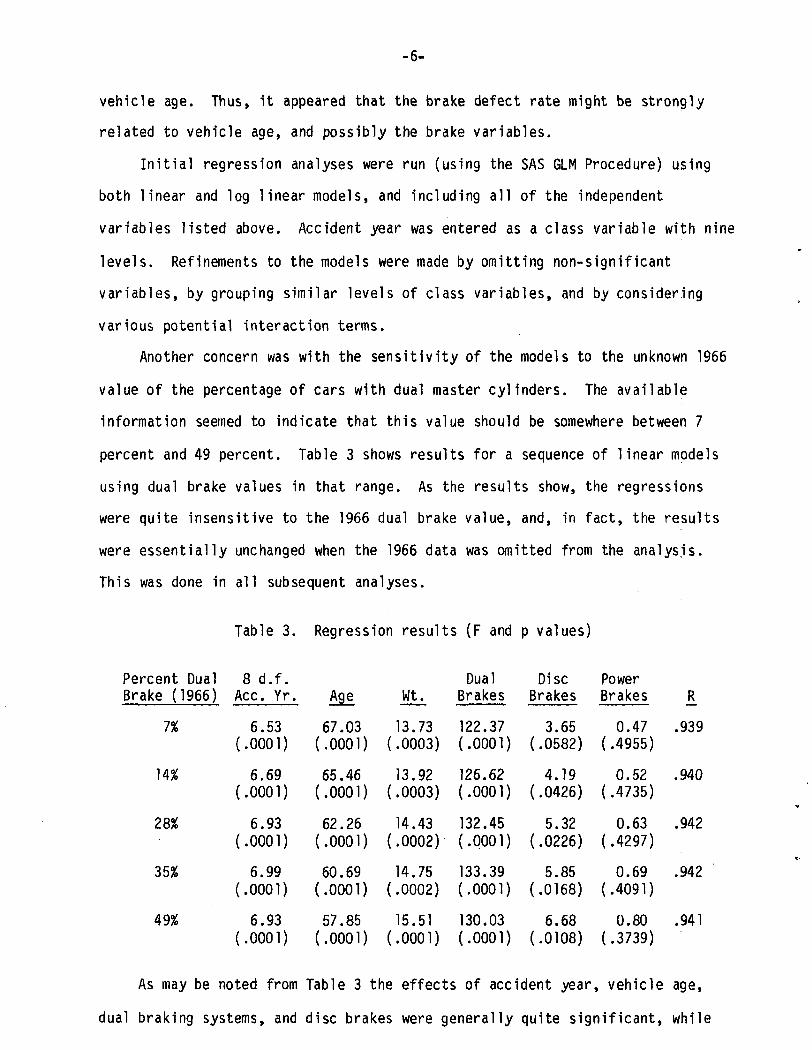
Another concern was with the sensitivity of the models to the unknown 1966
value of the percentage of cars with dual master cylinders. The available
information seemed"to indicate that this value should be somewhere between 7
percent and 49 percent. Table 3 shows results for a sequence of linear models
using dual brake values in that range. As the results show, the regressions
were quite insensitive to the 1966 dual brake value, and, in fact, the results
were essentially unchanged when the 1966 data was omitted from the analysis.
This was done in all subsequent analyses.
Table 3. Regression results (F and p values)
Percent DualBrake (1966)
7%
14%
28%
35%
49%
8 d.f.Ace. Yr.
6.53(.0001)
6.69(.0001)
6.93(.0001)
6.99(.0001)
6.93(.0001)
Age
67.03(.0001)
65.46(.0001)
62.26(.0001)
60.69(.0001)
57.85(.0001)
Wt.
13.73(.0003)
13.92(.0003)
14.43(.0002)
14.75(.0002)
15.51(.0001)
DualBrakes
122.37(.0001)
126.62(.0001)
132.45(.0001)
133.39(.0001)
130.03(.0001)
DiscBrakes
3.65(.0582)
4.19(.0426)
5.32(.0226)
5.85(.0168)
6.68(.0108)
PowerBrakes
0.47(.4955)
0.52(.4735)
0.63(.4297)
0.69(.4091)
0.80(.3739)
R
.939
.940
.942
.942
.941
As may be noted from Table 3 the effects of accident year, vehicle age,
dual braking systems, and disc brakes were generally quite significant, while
-7-
power brakes was not. Moreover, the fit of the models (as measured by R2) was
quite good. These same results held for most of the models considered.
The number of accident year classes was reduced from nine to four by
combining accident years 1973-1978. Accident year differences between 1972 and
1973, and between 1978 and 1979 correspond to changes in the accident reporting
form. A significant difference was also found, however, between the 1971 and
1972 accident years.
Following this collapsing of accident year classes and the omission of the
power brakes variable, weighted residuals were calculated and plotted against
the dependent variable, each independent variable, and in model year within
accident year sequence. The plots showed that the model systematically
underestimated the largest values of the dependent variable. These values
usually corresponded to the earliest model year cars. This suggested that a
higher order age term might improve the model. As it turned out a second order
age term was found to be highly significant, and the inclusion of the second
order term caused the linear age effect to no longer be significant.
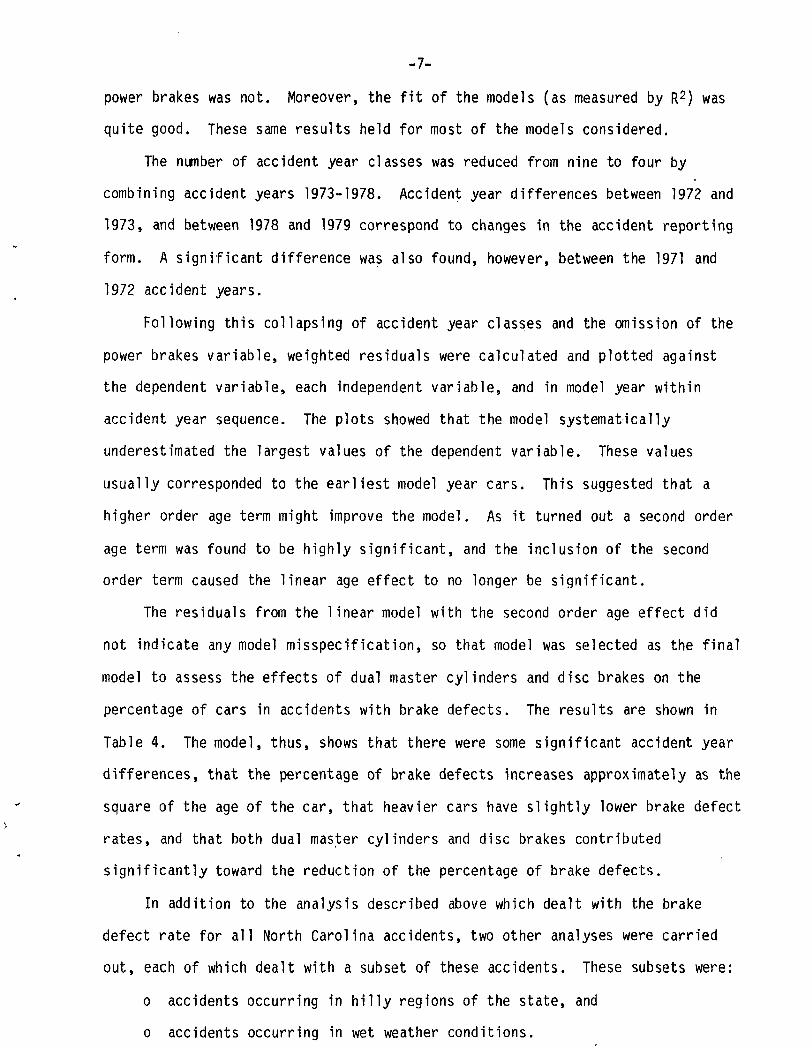
The residuals from the linear model with the second order age effect did
not indicate any model misspecification, so that model was selected as the final
model to assess the effects of dual master cylinders and disc brakes on the
percentage of cars in accidents with brake defects. The results are shown in
Table 4. The model, thus, shows that there were some significant accident year
differences, that the percentage of brake defects increases approximately as the
square of the age of the car, that heavier cars have slightly lower brake defect
rates, and that both dual master cylinders and disc brakes contributed
significantly toward the reduction of the percentage of brake defects.
In addition to the analysis described above which dealt with the brake
defect rate for all North Carolina accidents, two other analyses were carried
out, each of which dealt with a subset of these accidents. These subsets were:
o accidents occurring in hilly regions of the state, and
o accidents occurring in wet weather conditions.
-8-
Table 4. Model for Defective Brake Incidence
Effect DF F-Value
Accident year(Age)2Vehicle Weight (pounds)Dual Brakes (percent]Disc Brakes (percent)
Parameter
Constant
Ace. Yr.2
(Age)
31111
f 19711972
( 73-78
Vehicle Weight (pounds)Dual Brakes (percent)Disc Brakes (percent)
33.58270.29
7.4193.5983.61
Estimate
2.629-.619-.487-.357.010
-.0002-.007-.006
.0001
.0001
.0512
.0001
.0001
2R = .
In both of these cases essentially the same procedures were followed in
developing the final models as were used in the all accidents case. These
procedures led to the models shown in tables 5 and 6.
Table 5. Model for Defective Brake Incidence inHilly Region Accidents
Effect DF F Value
Accident year 2(Age)2 1Dual Brakes (percent) 1Disc Brakes (percent) 1
Parameter
Constant
Ace. Yr. \ 72-78(Age)2
Dual Brakes (percent)Disc Brakes (percent)
11.8963.9340.1326.51
Estimate
2.107-.601-.397.009
-.009-.006
.0001
.0001
.0001
.0001
R2 = .83
-9-
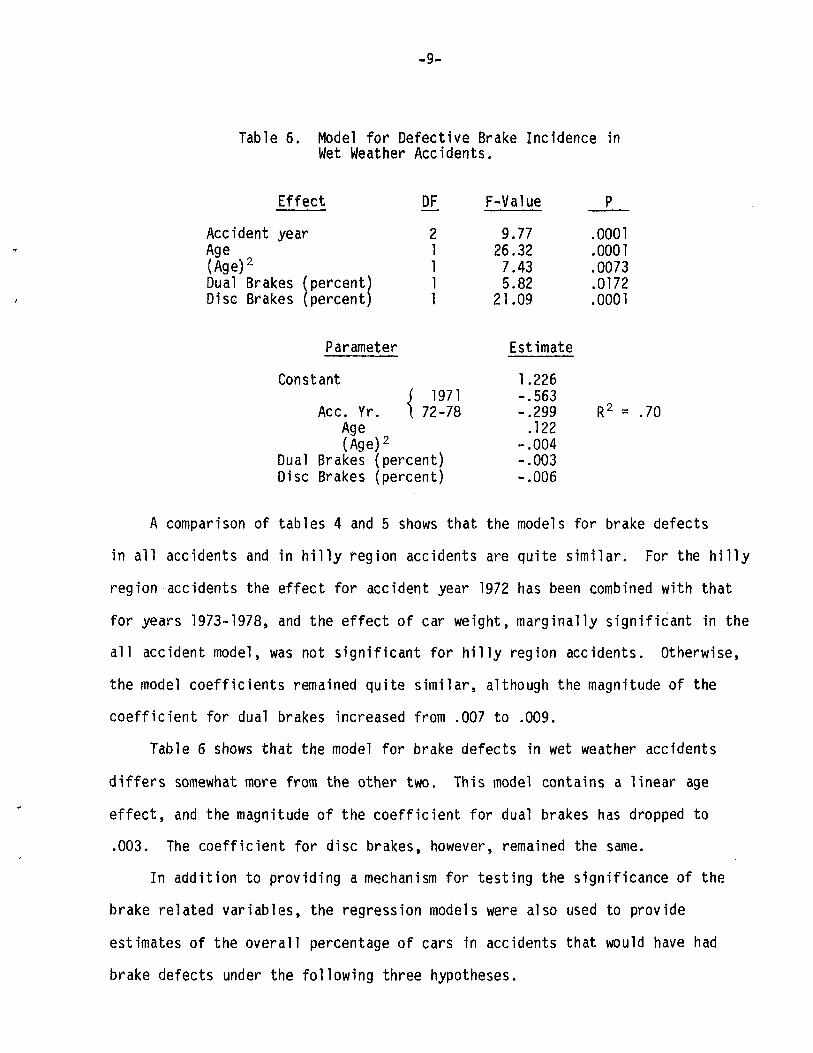
Table 6. Model for Defective Brake Incidence inWet Weather Accidents.
Effect DF F-Value
Accident year 2Age(Age)DualDisc
1I2 1Brakes (percent) 1Brakes (percent) 1
Parameter
Constant( 1971
Ace. Yr. I 72-78Age(Age)2
Dual Brakes (percent)Disc Brakes (percent)
92675
21
.77
.32
.43
.82
.09
Estimate
1.226-.563-.299.122
-.004-.003-.006
.0001
.0001
.0073
.0172
.0001
R 2 == .70
A comparison of tables 4 and 5 shows that the models for brake defects
in all accidents and in hilly region accidents are quite similar. For the hilly
region accidents the effect for accident year 1972 has been combined with that
for years 1973-1978, and the effect of car weight, marginally significant in the
all accident model, was not significant for hilly region accidents. Otherwise,
the model coefficients remained quite similar, although the magnitude of the
coefficient for dual brakes increased from .007 to .009.
Table 6 shows that the model for brake defects in wet weather accidents
differs somewhat more from the other two. This model contains a linear age
effect, and the magnitude of the coefficient for dual brakes has dropped to
.003. The coefficient for disc brakes, however, remained the same.
In addition to providing a mechanism for testing the significance of the
brake related variables, the regression models were also used to provide
estimates of the overall percentage of cars in accidents that would have had
brake defects under the following three hypotheses.
-10-
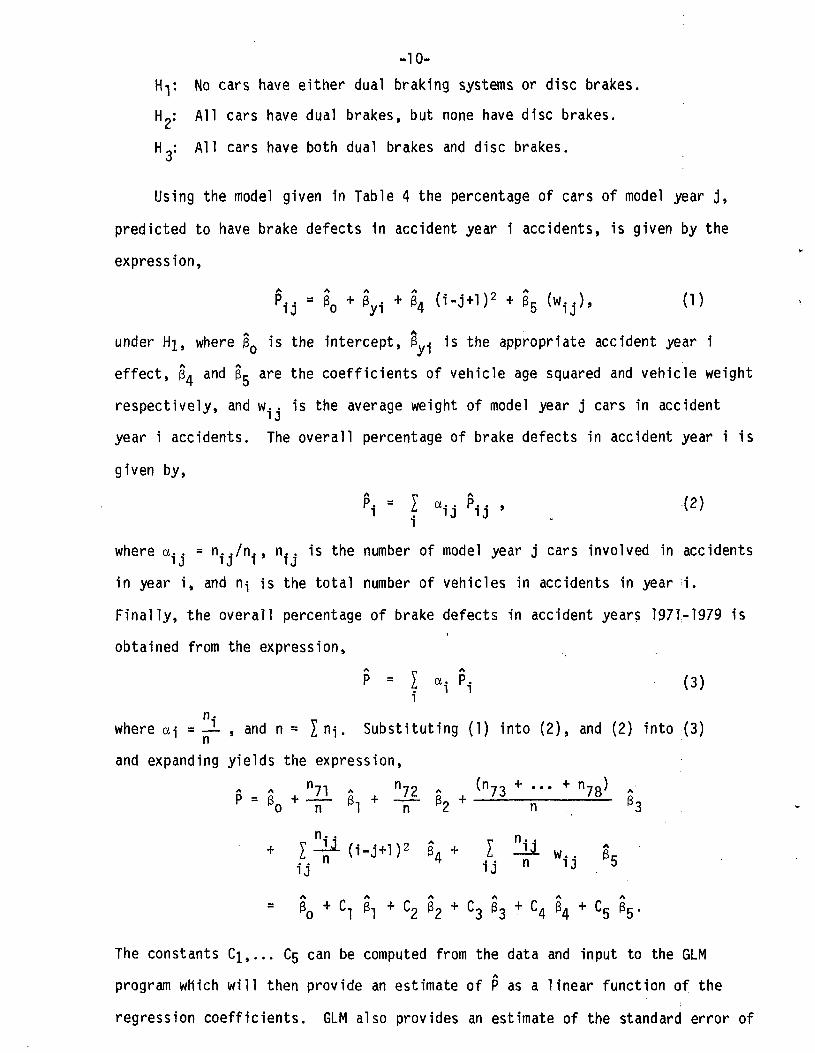
H-j*. No cars have either dual braking systems or disc brakes.
HL: All cars have dual brakes, but none have disc brakes.
H,: All cars have both dual brakes and disc brakes.
Using the model given in Table 4 the percentage of cars of model year j,
predicted to have brake defects in accident year i accidents, is given by the
expression,
9.. = 30 + gy1 + 34 (i-j+D2 + B5 (wi:j), (1)
under Hi, where $0 is the intercept, 3 • is the appropriate accident year i
effect, jL and jL are the coefficients of vehicle age squared and vehicle weight
respectively, and w.. is the average weight of model year j cars in accident
year i accidents. The overall percentage of brake defects in accident year i is
given by,
f, • I ",-j !>„ . (2)1
where a.. = n../n., n.. is the number of model year j cars involved in accidents
in year i, and n̂ is the total number of vehicles in accidents in year i.
Finally, the overall percentage of brake defects in accident years 1971-1979 is
obtained from the expression,
P " I a1 P. (3)i
. ni1 " n~
and expanding yields the expression,
51 + ~h~ P2
n.where a] = — , and n = I n-j. Substituting (1) into (2), and (2) into (3)
n7 1 . n
7 2 *8 + 3
= e 0 + C, 5 , + c 2 e 2 + c 3 6 3 + c 4 e 4 + c 5 5 6 .
The constants C^,... C5 can be computed from the data and input to the GLM
program which will then provide an estimate of P as a linear function of the
regression coefficients. GLM also provides an estimate of the standard error of
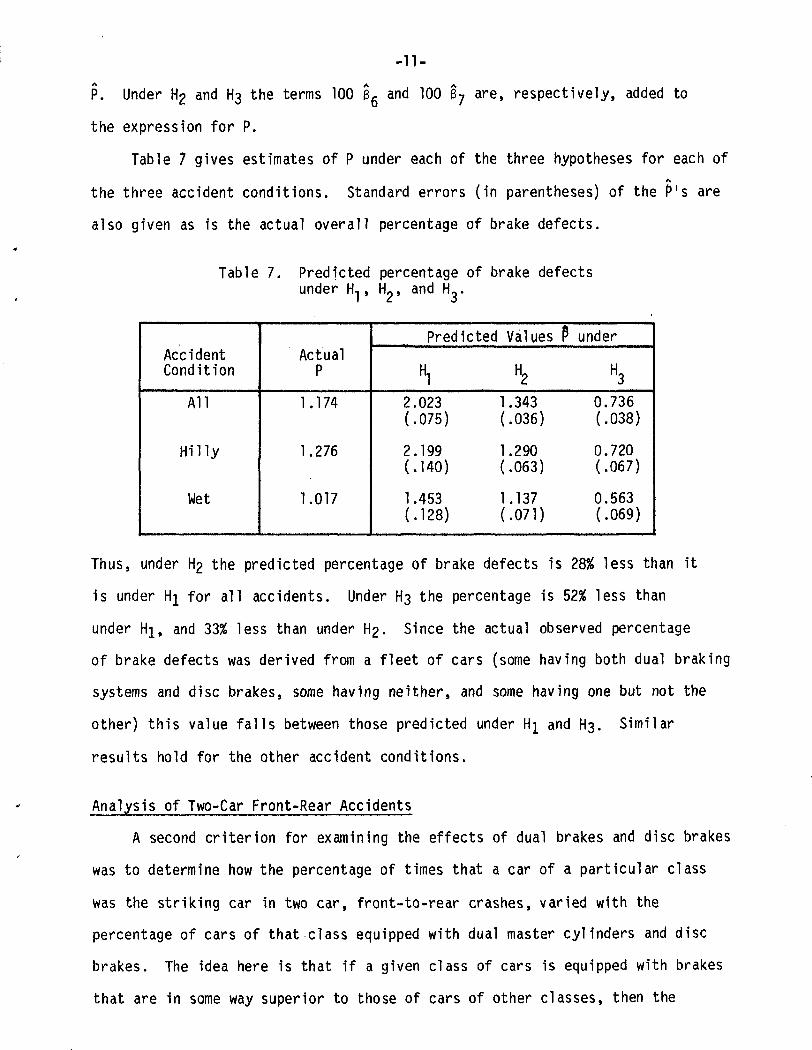
-n-P. Under Hg and H3 the terms 100 sg and 100 67 are, respectively, added to
the expression for P.
Table 7 gives estimates of P under each of the three hypotheses for each ofA
the three accident conditions. Standard errors (in parentheses) of the P's are
also given as is the actual overall percentage of brake defects.
Table 7. Predicted percentage of brake defectsunder H,, HL, and H-.
AccidentCondition
All
H i l ly
Wet
ActualP
1.174
1.276
1.017
Predicted
Hl
2.023(.075)
2.199(.140)
1.453(.128)
Values
1.343(.036)
1.290(.063)
1.137(.071)
P under
H30.736(.038)
0.720(.067)
0.563(.069)
Thus, under H2 the predicted percentage of brake defects is 28% less than it
is under Hj for all accidents. Under H3 the percentage is 52% less than
under Hj, and 33% less than under H2. Since the actual observed percentage
of brake defects was derived from a fleet of cars (some having both dual braking
systems and disc brakes, some having neither, and some having one but not the
other) this value falls between those predicted under Hj and H3. Similar
results hold for the other accident conditions.
Analysis of Two-Car Front-Rear Accidents
A second criterion for examining the effects of dual brakes and disc brakes
was to determine how the percentage of times that a car of a particular class
was the striking car in two car, front-to-rear crashes, varied with the
percentage of cars of that class equipped with dual master cylinders and disc
brakes. The idea here is that if a given class of cars is equipped with brakes
that are in some way superior to those of cars of other classes, then the
-12-
probability that a car of this class will be the striking car in a two car
front-to-rear crash should be somewhat less than a similar probability for a car
of another class. Two sets of analyses were done with respect to this
criterion. The first of these involved domestic passenger cars of model years
from 1967 to 1979. Cars were classified by calendar accident year, model year,
and car make. Preparation of the basic data for these analyses is described in
Appendix A.
Since the data was not sufficient in quantity for the examination of each
specific car make (e.g., Dodge Polara, AMC Gremlin, etc.) it was necessary to
form groups of car makes to be analyzed together. Using information taken from
Ward's Automotive Yearbooks for the years 1967-1979, specific car makes were
grouped together for each model year under the following general guidelines.
a) Car types were combined that were most similar with respect tocar weight, the percent having disc brakes, and the percenthaving power brakes.
b) Car types were combined first within manufacturers (e.g.,Chevrolets + Pontiacs, etc.), and across manufacturers ifnecessary.
c) Car types with yery low frequencies were combined with bthersif they seemed to fit, or were dropped from consideration ifthey did not.
d) After the classes had been formed for each model year theywere modified to some extent to make them as consistent aspossible across model years.
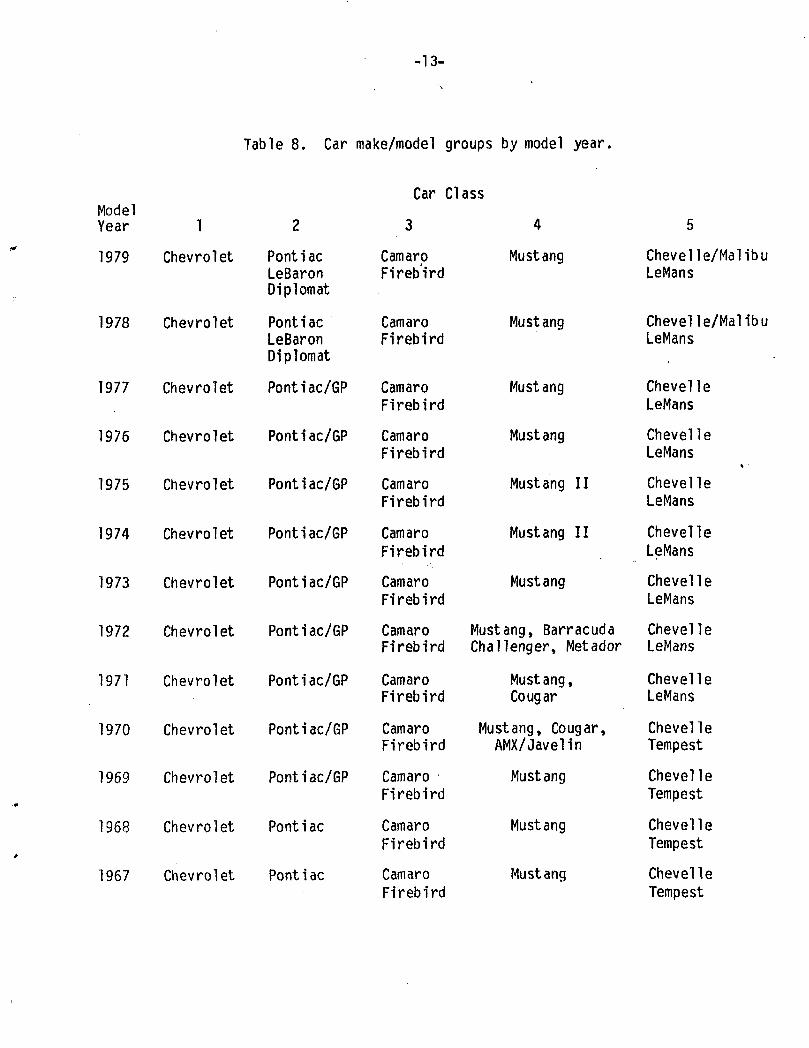
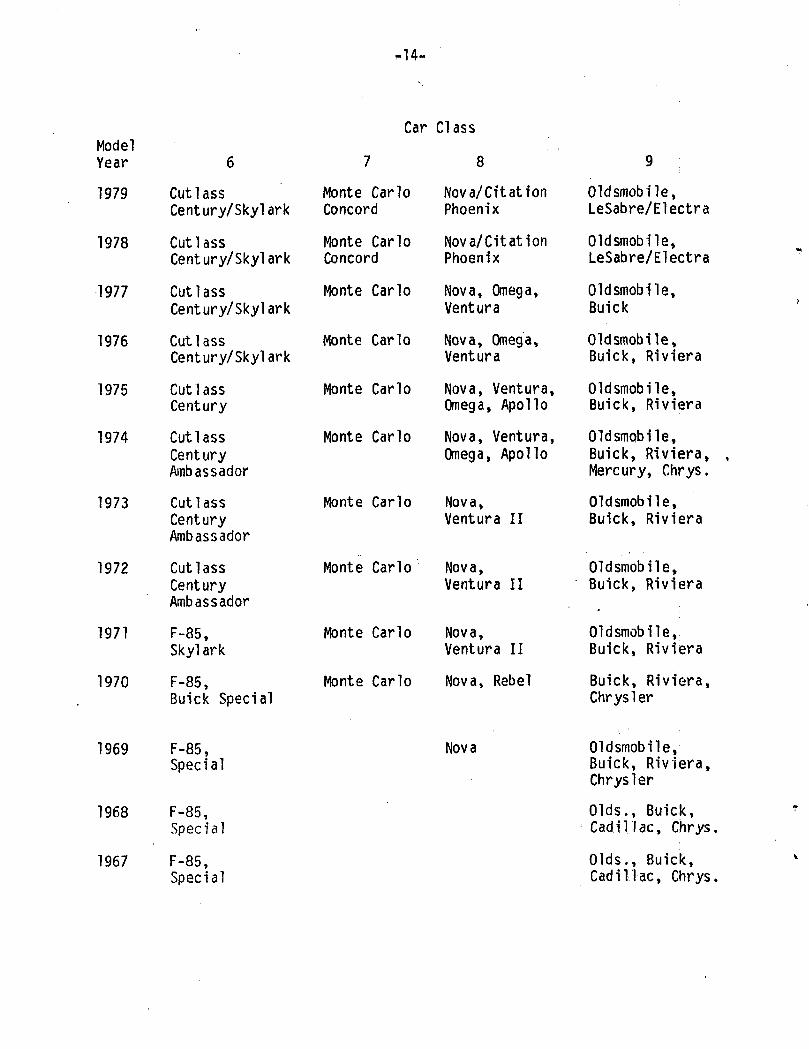
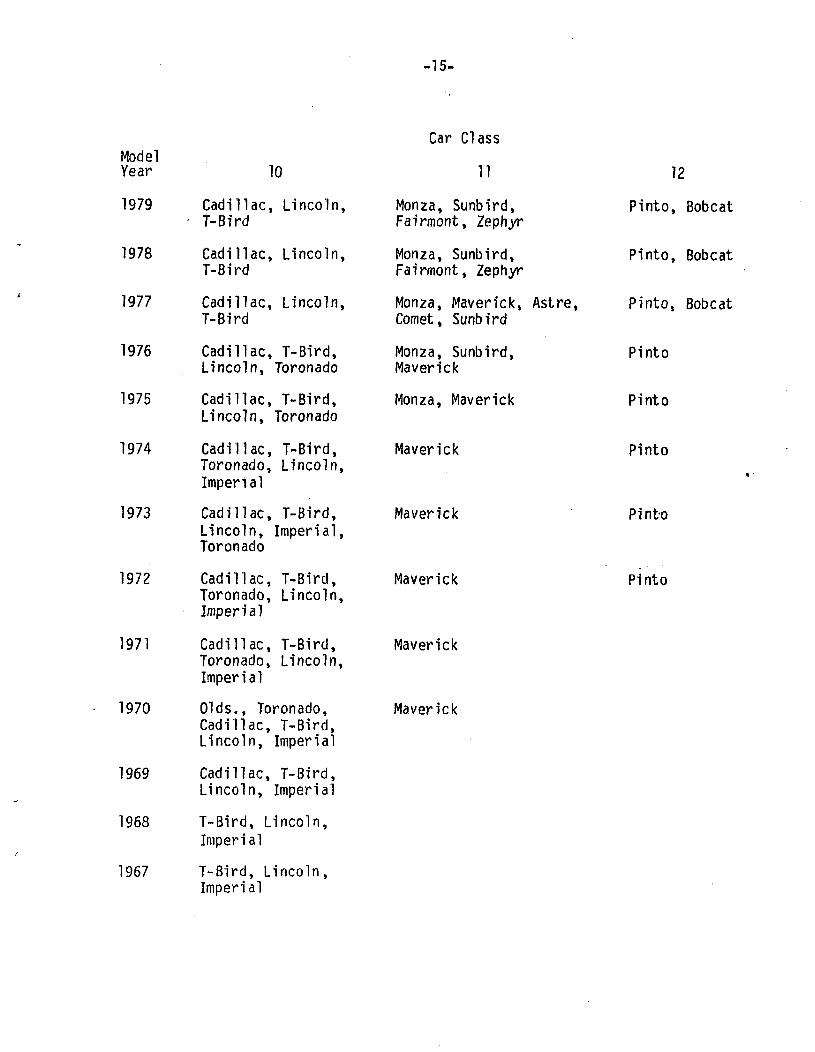
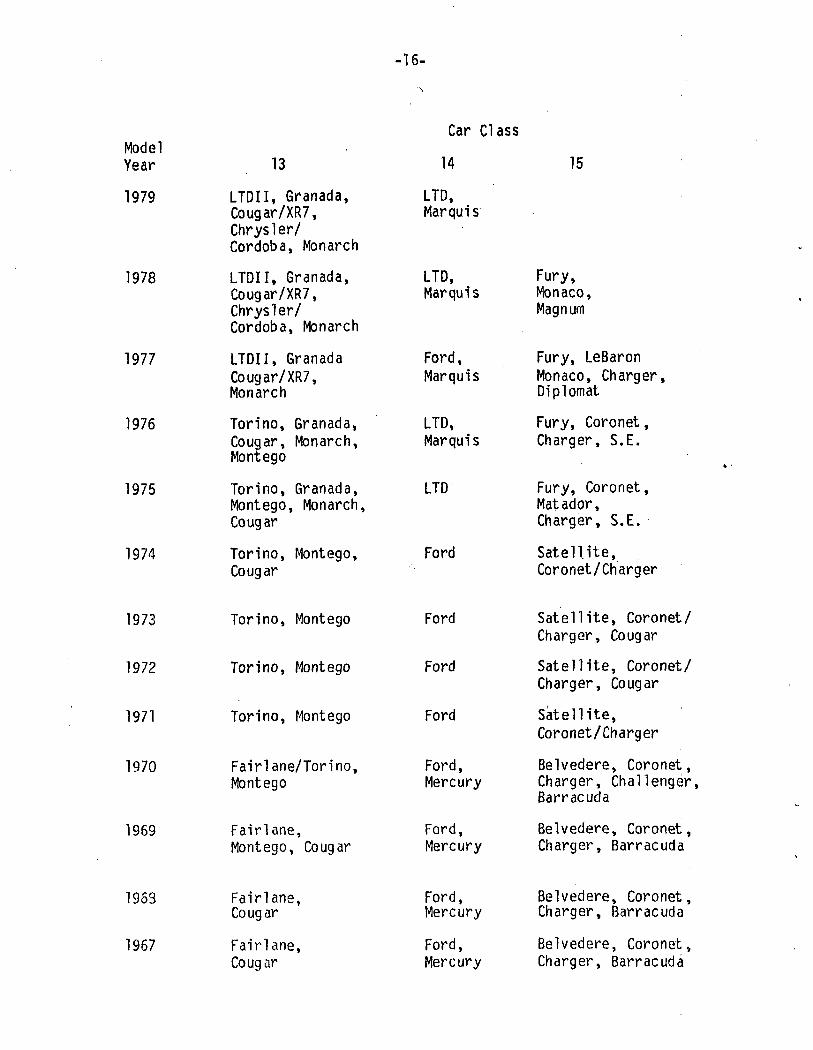
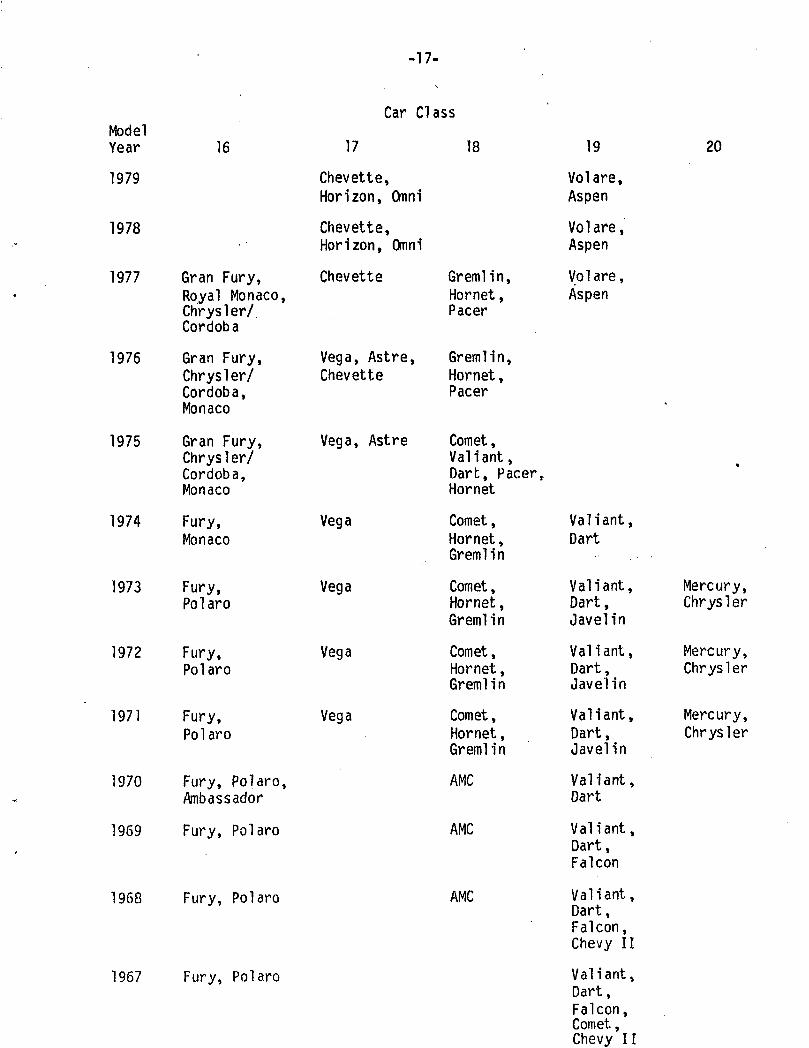
This process resulted in 20 car classes which are listed in Table 8. The
percent of cars in each class having disc brakes and power brakes were computed
(by model year), also using information from Ward's Automotive Yearbook. Prior
to 1972, figures were not given for the percentage of cars having power disc
brakes, although the percentage for power drum brakes was given. For these cars
the percentage with power disc brakes was estimated as the product of the
-13-
Table 8. Car make/model groups by model year.
ModelYear
1979
1978
1977
1976
1975
1974
1973
1972
1971
1970
1969
1968
1967
1
Chevrolet
Chevrolet
Chevrolet
Chevrolet
Chevrolet
Chevrolet
Chevrolet
Chevrolet
Chevrolet
Chevrolet
Chevrolet
Chevrolet
Chevrolet
2
PontiacLeBaronDiplomat
PontiacLeBaronDiplomat
Pontiac/GP
Pontiac/GP
Pontiac/GP
Pontiac/GP
Pontiac/GP
Pontiac/GP
Pontiac/GP
Pontiac/GP
Pontiac/GP
Pontiac
Pont i ac
Car Cl
3
CamaroFirebird
CamaroFirebird
CamaroFirebird
CamaroFirebird
CamaroFirebird
CamaroFirebird
CamaroFirebird
CamaroFirebird
CamaroFirebird
CamaroFirebird
CamaroFirebird
CamaroFirebird
CamaroFirebird
ass
4
Mustang
Mustang
Mustang
Mustang
Mustang II
Mustang II
Mustang
Mustang, BarracudaChallenger, Metador
Mustang,Cougar
Mustang, Cougar,AMX/Javelin
Mustang
Mustang
Mustang
5
Chevelle/MalibuLeMans
Chevelle/MalibuLeMans
ChevelleLeMans
ChevelleLeMans
ChevelleLeMans
ChevelleLeMans
ChevelleLeMans
ChevelleLeMans
ChevelleLeMans
ChevelleTempest
ChevelleTempest
ChevelleTempest
ChevelleTempest
-14-
Car ClassModelYear
1979
1978
1977
1976
1975
1974
1973
1972
1971
1970
1969
1968
1967
6
CutlassCentury/Skylark
CutlassCentury/Skylark
CutlassCentury/Skylark
Cut 1 assCentury/Skylark
CutlassCentury
CutlassCenturyAmbassador
CutlassCenturyAmbassador
CutlassCenturyAmbassador
F-85,Skylark
F-85,Buick Special
F-85,Special
F-85,Special
F-85,Special
7
Monte CarloConcord
Monte CarloConcord
Monte Carlo
Monte Carlo
Monte Carlo
Monte Carlo
Monte Carlo
Monte Carlo
Monte Carlo
Monte Carlo
8
Nova/CitationPhoenix
Nova/CitationPhoenix
Nova, Omega,Ventura
Nova, Omega,Ventura
Nova, Ventura,Omega, Apollo
Nova, Ventura,Omega, Apollo
Nova,Ventura II
Nova,Ventura II
Nova,Ventura II
Nova, Rebel
Nova
9
Oldsmobile,LeSabre/Electra
Oldsmobile,LeSabre/Electra
Oldsmobile,Buick
Oldsmobile,Buick, Riviera
Oldsmobile,Buick, Riviera
Oldsmobile,Buick, Riviera, ,Mercury, Chrys.
Oldsmobile,Buick, Riviera
Oldsmobile,Buick, Riviera
Oldsmobile,Buick, Riviera
Buick, Riviera,Chrysler
Oldsmobile,Buick, Riviera,Chrysler
Olds., Buick,Cadi 1 lac, Chrys.
Olds., Buick,Cadillac, Chrys.
-15 -
ModelYear
1979
1978
1977
1976
1975
1974
1973
1972
1971
1970
1969
1968
1967
10
Cadillac, Lincoln,T-Bird
Cadillac, Lincoln,T-Bird
Cadillac, Lincoln,T-Bird
Cadillac, T-Bird,Lincoln, Toronado
Cadillac, T-Bird,Lincoln, Toronado
Cadillac, T-Bird,Toronado, Lincoln,Imperial
Cadillac, T-Bird,Lincoln, Imperial,Toronado
Cadillac, T-Bird,Toronado, Lincoln,Imperial
Cadillac, T-Bird,Toronado, Lincoln,Imperial
Olds., Toronado,Cadillac, T-Bird,Lincoln, Imperial
Cadillac, T-Bird,Lincoln, Imperial
T-Bird, Lincoln,Imperial
T-Bird, Lincoln,Imperial
Car Class
11
Monza, Sunbird,Fairmont, Zephyr
Monza, Sunbird,Fairmont, Zephyr
Monza, Maverick, Astre,Comet, Sunbird
Monza, Sunbird,Maverick
Monza, Maverick
Maverick
Maverick
Maverick
Maverick
Maverick
12
Pinto, Bobcat
Pinto, Bobcat
Pinto, Bobcat
Pinto
Pinto
Pinto
Pinto
Pinto
-16-
ModelYear
1979
1978
1977
1976
1975
1974
1973
1972
1971
1970
1969
1963
1967
13
LTDII, Granada,Cougar/XR7,Chrysler/Cordoba, Monarch
LTDII, Granada,Cougar/XR7,Chrysler/Cordoba, Monarch
LTDII, GranadaCougar/XR7,Monarch
Torino, Granada,Cougar, Monarch,Montego
Torino, Granada,Montego, Monarch,Cougar
Torino, Montego,Cougar
Torino, Montego
Torino, Montego
Torino, Montego
Fairlane/Torino,Montego
Fairlane,Montego, Cougar
Fairlane,Cougar
Fairlane,Cougar
Car Class
14
LTD,Marquis
LTD,Marquis
Ford,Marquis
LTD,Marquis
LTD
Ford
Ford
Ford
Ford
Ford,Mercury
Ford,Mercury
Ford,Mercury
Ford,Mercury
15
Fury,Monaco,Magnum
Fury, LeBaronMonaco, Charger,Diplomat
Fury, Coronet,Charger, S.E.
Fury, Coronet,Matador,Charger, S.E.
Satellite,Coronet/Charger
Satellite, Coronet/Charger, Cougar
Satellite, Coronet/Charger, Cougar
Satellite,Coronet/Charger
Belvedere, Coronet,Charger, Challenger,Barracuda
Belvedere, Coronet,Charger, Barracuda
Belvedere, Coronet,Charger, Barracuda
Belvedere, Coronet,Charger, Barracuda
- 1 7 -
ModelYear
1979
1978
1977
1976
1975
1974
1973
1972
1971
1970
1969
1968
1967
16
Gran Fury,Royal Monaco,Chrysler/Cordoba
Gran Fury,Chrysler/Cordoba,Monaco
Gran Fury,Chrysler/Cordoba,Monaco
Fury,Monaco
Fury,Polaro
Fury,Polaro
Fury,Polaro
Fury, Polaro,Ambassador
Fury, Polaro
Fury, Polaro
Fury, Polaro
Car Cl
17
Chevette,Horizon, Omni
Chevette,Horizon, Omni
Chevette
Vega, Astre,Chevette
Vega, Astre
Vega
Vega
Vega
Vega
ass
18
Gremlin,Hornet,Pacer
Gremlin,Hornet,Pacer
Comet,Valiant,Dart, Pacer,Hornet
Comet,Hornet,Gremlin
Comet,Hornet,Gremlin
Comet,Hornet,Gremli n
Comet,Hornet,Gremlin
AMC
AMC
AMC
19
Volare,Aspen
Vol are,Aspen
Volare,Aspen
Valiant,Dart
Valiant,Dart,Javelin
Valiant,Dart,Javelin
Valiant,Dart,Javelin
Valiant,Dart
Valiant,Dart,Falcon
Valiant,Dart,Falcon,Chevy II
Valiant,Dart,Falcon,Comet,Chevy II
20
*
Mercury,Chrysler
Mercury,Chrysler
Mercury,Chrysler
-18-
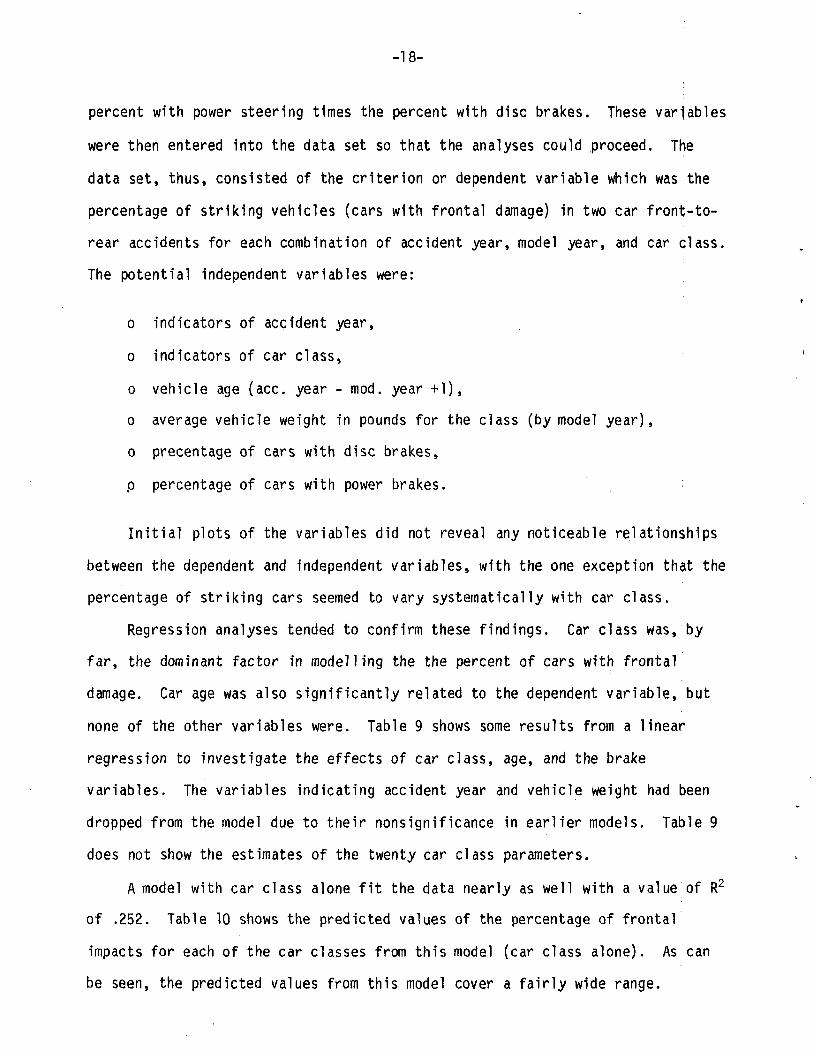
percent with power steering times the percent with disc brakes. These variables
were then entered into the data set so that the analyses could proceed. The
data set, thus, consisted of the criterion or dependent variable which was the
percentage of striking vehicles (cars with frontal damage) in two car front-to-
rear accidents for each combination of accident year, model year, and car class.
The potential independent variables were:
o indicators of accident year,
o indicators of car class,
o vehicle age (ace. year - mod. year +1),
o average vehicle weight in pounds for the class (by model year),
o precentage of cars with disc brakes,
p percentage of cars with power brakes.
Initial plots of the variables did not reveal any noticeable relationships
between the dependent and independent variables, with the one exception that the
percentage of striking cars seemed to vary systematically with car class.
Regression analyses tended to confirm these findings. Car class was, by
far, the dominant factor in modelling the the percent of cars with frontal
damage. Car age was also significantly related to the dependent variable, but
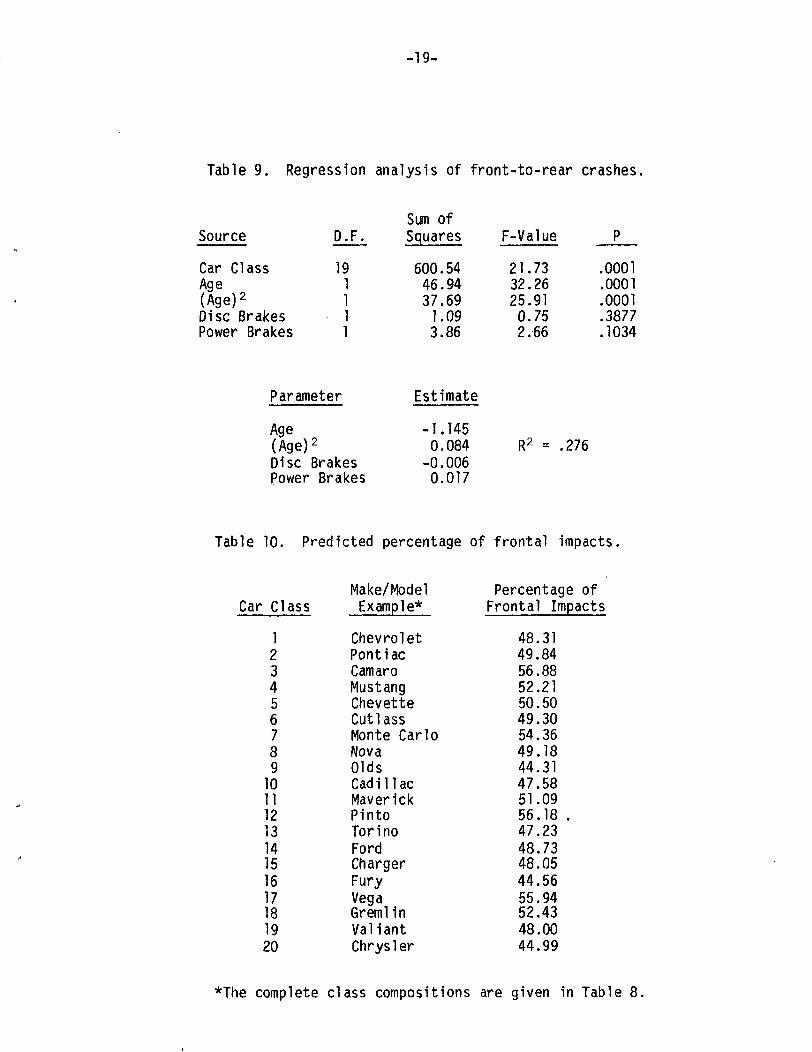
none of the other variables were. Table 9 shows some results from a linear
regression to investigate the effects of car class, age, and the brake
variables. The variables indicating accident year and vehicle weight had been
dropped from the model due to their norisignificance in earlier models. Table 9
does not show the estimates of the twenty car class parameters.
A model with car class alone fit the data nearly as well with a value of R2
of .252. Table 10 shows the predicted values of the percentage of frontal
impacts for each of the car classes from this model (car class alone). As can
be seen, the predicted values from this model cover a fairly wide range.
-19-
Table 9. Regression analysis of front-to-rear crashes.
Source
Car ClAge(Age)2
ass
Disc BrakesPower Brakes
D.F.
191111
Parameter
Age(Age)DiscPower
2
BrakesBrakes
Sun ofSquares
600.5446.9437.691.093.86
Estimate
-1.1450.084-0.0060.017
F-Value
21.7332.2625.910.752.66
R2 = .276
P
.0001
.0001
.0001
.3877
.1034
Table 10. Predicted percentage of frontal impacts.
Car Class
1234567891011121314151617181920
Make/ModelExample*
ChevroletPontiacCamaroMustangChevetteCutlassMonte CarloNovaOldsCadillacMaverickPintoTorinoFordChargerFuryVegaGremlinValiantChrysler
Percentage ofFrontal Impacts
48.3149.8456.8852.2150.5049.3054.3649.1844.3147.5851.0956.18 ,47.2348.7348.0544.5655.9452.4348.0044.99
*The complete class compositions are given in Table 8.
-20-
Models containing interactions of the brake variables with each of the
other variables were also tested, but none of these yielded any consistently
significant and meaningful effects for the brake related variables.
It would seem, then, that with respect to all front-to-rear accidents the
percentage of cars with frontal damage depends strongly on car class (which may
be a proxy measure for certain characteristics of the driver, and the use to
which the vehicle is put). The percentage also varies to some extent with car
age, but does not seem to be associated with the percentage of cars in the class
having disc brakes, or with the percentage having power brakes.
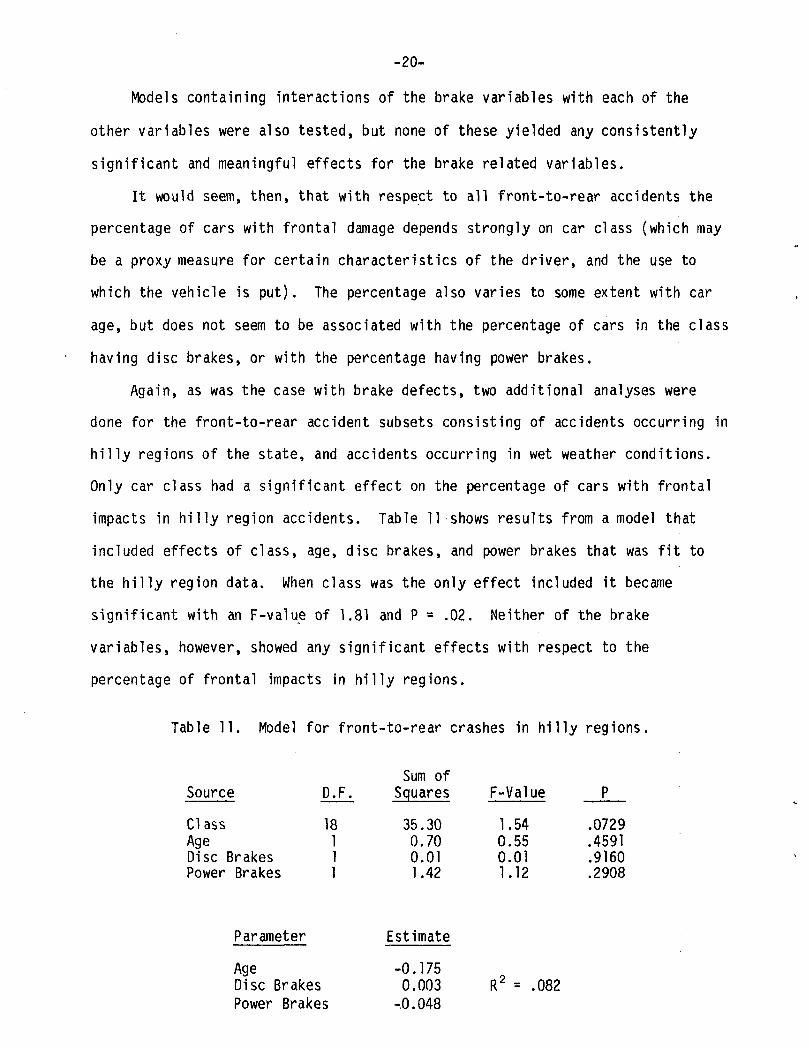
Again, as was the case with brake defects, two additional analyses were
done for the front-to-rear accident subsets consisting of accidents occurring in
hilly regions of the state, and accidents occurring in wet weather conditions.
Only car class had a significant effect on the percentage of cars with frontal
impacts in hilly region accidents. Table 11 shows results from a model that
included effects of class, age, disc brakes, and power brakes that was fit to
the hilly region data. When class was the only effect included it became
significant with an F-value of 1.81 and P = .02. Neither of the brake
variables, however, showed any significant effects with respect to the
percentage of frontal impacts in hilly regions.
Table 11. Model for front-to-rear crashes in hilly regions.
Sum ofSource D.F. Squares F-Value P
Class 18 35.30 1.54 .0729Age 1 0.70 0.55 .4591Disc Brakes 1 0.01 0.01 .9160Power Brakes 1 1.42 1.12 .2908
Parameter Estimate
Age -0.175Disc Brakes 0.003 R2 = .082Power Brakes -0.048
-21-
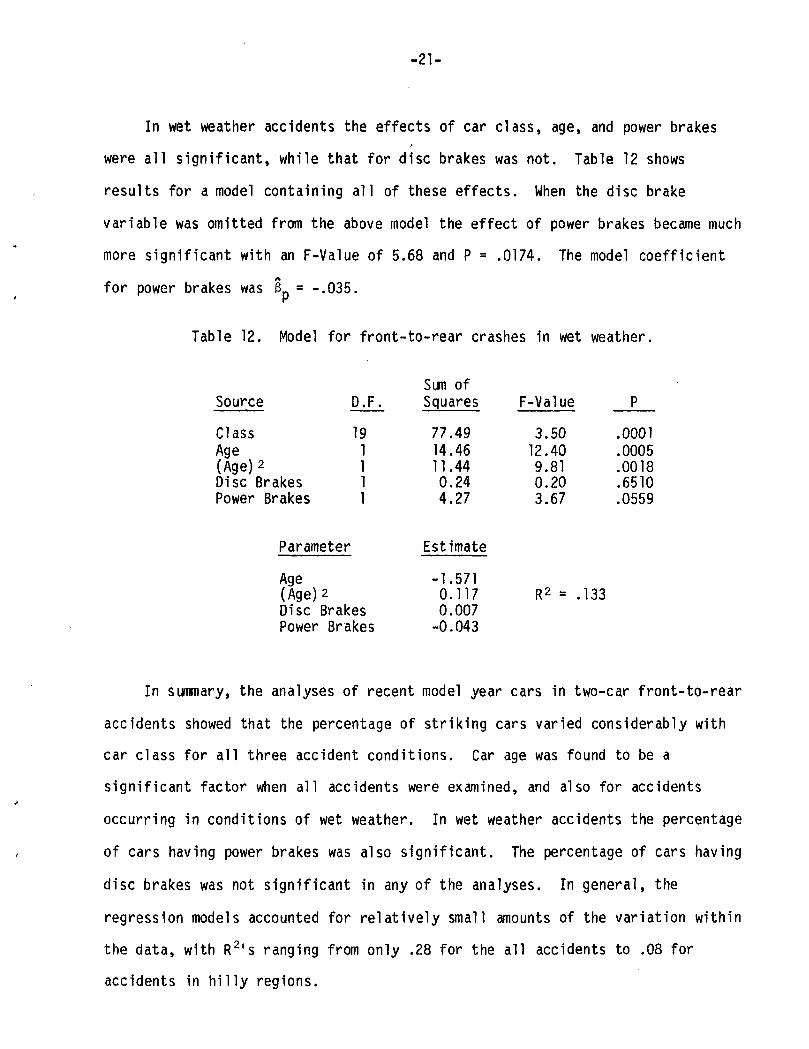
In wet weather accidents the effects of car class, age, and power brakes
were a l l s ignif icant, while that for disc brakes was not. Table 12 shows
results for a model containing al l of these effects. When the disc brake
variable was omitted from the above model the effect of power brakes became much
more significant with an F-Value of 5.68 and P = .0174. The model coefficient
for power brakes was fL = -.035.
Table 12. Model for front-to-rear crashes in wet weather.
Source
ClassAge(Age)DiscPower
2
BrakesBrakes
D.F.
191111
Parameter
Age(Age)DiscPower
2
BrakesBrakes
Sum ofSquares
77.4914.4611.440.244.27
Estimate
-1.5710.1170.007-0.043
F-Value
3.5012.409.810.203.67
R2 = .133
P
.0001
.0005
.0018
.6510
.0559
In summary, the analyses of recent model year cars in two-car front-to-rear
accidents showed that the percentage of str iking cars varied considerably with
car class for a l l three accident conditions. Car age was found to be a
signif icant factor when al l accidents were examined, and also for accidents
occurring in conditions of wet weather. In wet weather accidents the percentage
of cars having power brakes was also signif icant. The percentage of cars having
disc brakes was not signif icant in any of the analyses. In general, the
regression models accounted for re lat ively small amounts of the variation within
the data, with R2ls ranging from only .28 for the al l accidents to .08 for
accidents in h i l l y regions.
-22-
The second part of the front-to-rear accident analysis dealt with earlier
model cars - - 1960 through 1969 model years. These cars were not classified by
specific makes, but were simply grouped by model year and accident year. The
dependent variable was the percentage of cars in the group that had frontal
damage, while the potential independent variables were:
o indicators of accident year,
o car age,
o average vehicle weight,
o the percent of cars in the group with dual master cylinders, and
o the percent having power brakes.
A complete listing of this data is given in Appendix B.
Initial analyses of these variables showed yery strong (and nearly linear)
accident year effects contrary to expectations. Upon reflection, however, it
was recognized that since in these analyses the same model year vehicles appear
in each accident year, the variables accident year and vehicle age could act
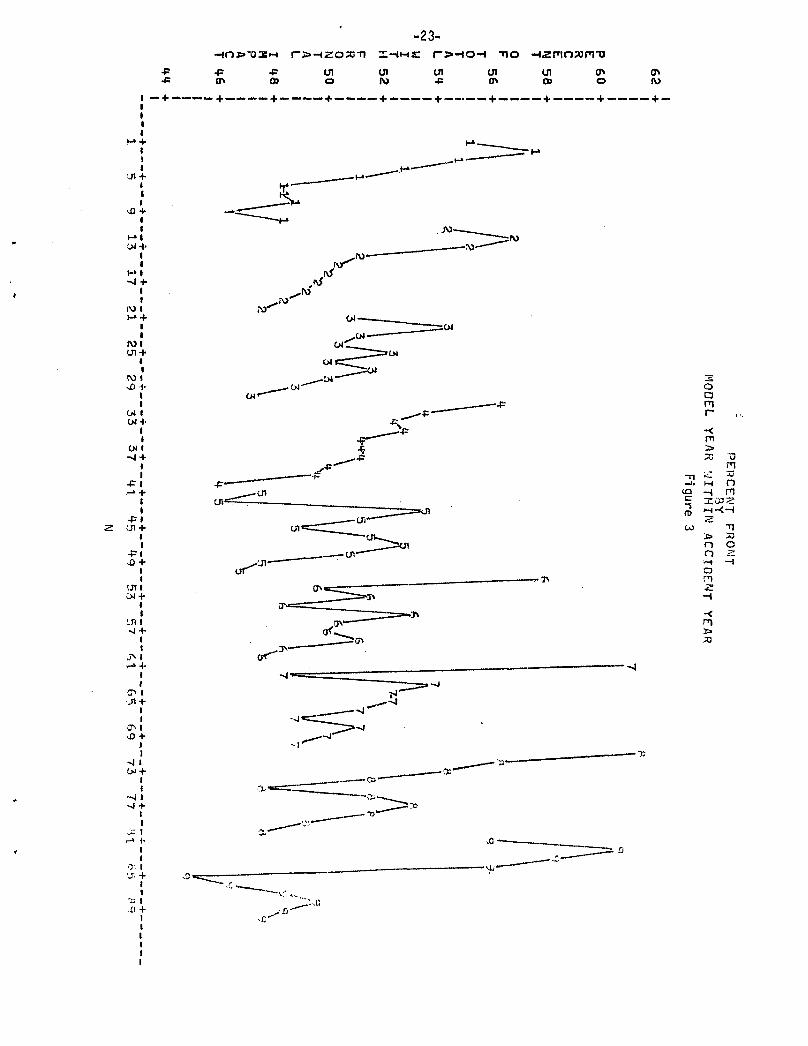
together to produce a model year effect. Such a model year effect is apparent
from figure 3 which shows the percent of frontal impacts by model year within
accident year. The points on the graphs are labelled with the last digit of the
accident year, and for each accident year the points correspond, consecutively,
to model years 1960 through 1969. To the extent that the accident year graphs
tend to increase somewhat from left to right, the figure also shows a slight
vehicle age effect. An effect due to the increasing percentage of cars with
dual braking systems should be seen primarily as a substantial decrease in the
percentage of frontal impacts between 1965 and 1967 model year cars. Such an
effect does not appear to be present in the data of figure 3.
The percentage of cars with power brakes, however, decreases from I960: to
1961, and then increases steadily through 1968, with a larger increase from 1968
-24-
to 1969 (see Table 2). Thus, the power brakes variable is strongly associated
with vehicle model year. It would not be expected, however, that the effect of
this variable (power brakes) would result in such a substantial change in
braking performance as is seen in Figure 3.
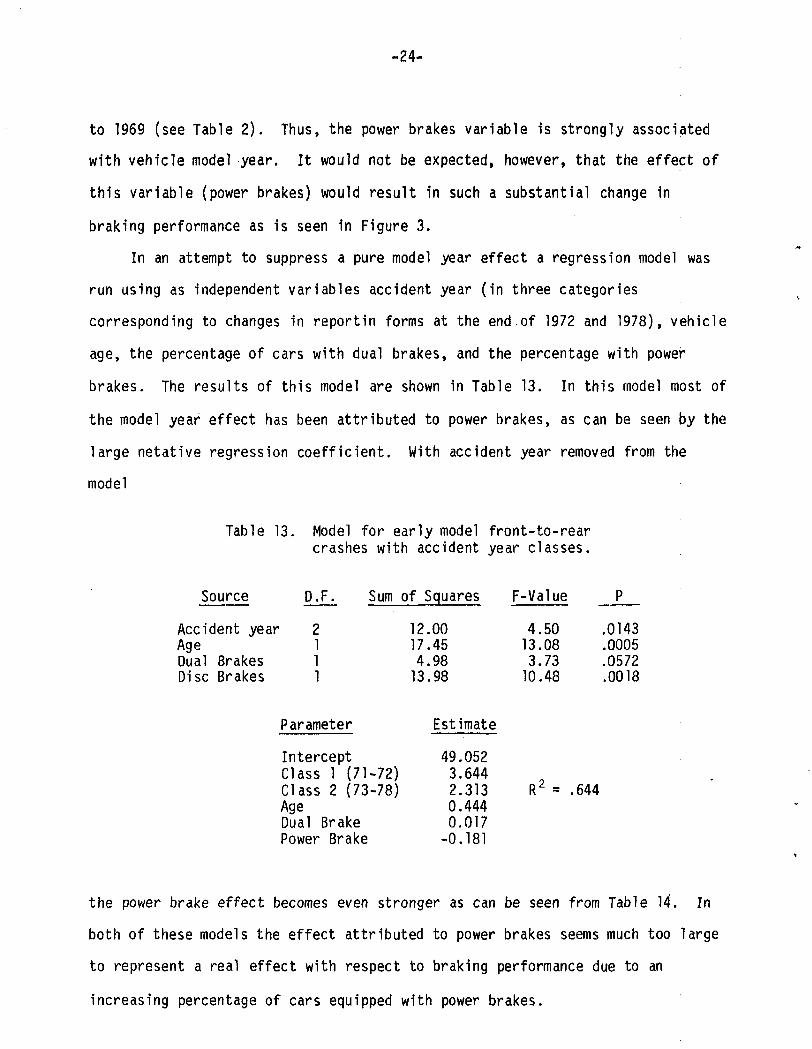
In an attempt to suppress a pure model year effect a regression model was
run using as independent variables accident year (in three categories
corresponding to changes in reportin forms at the end of 1972 and 1978), vehicle
age, the percentage of cars with dual brakes, and the percentage with power
brakes. The results of this model are shown in Table 13. In this model most of
the model year effect has been attributed to power brakes, as can be seen by the
large netative regression coefficient. With accident year removed from the
model
Table 13. Model for early model front-to-rearcrashes with accident year classes.
Source
Accident yearAgeDual BrakesDisc Brakes
D.F. Sum
2111
Parameter
InterceptClass 1 (71-72)Class 2 (73-78)AgeDual BrakePower Brake
of
1217413
Squares
.00
.45
.98
.98
Estimate
49.0523.6442.3130.4440.017-0.181
F-Value
413310
R
.50
.08
.73
.48
2 =
P
.0143
.0005
.0572
.0018
.644
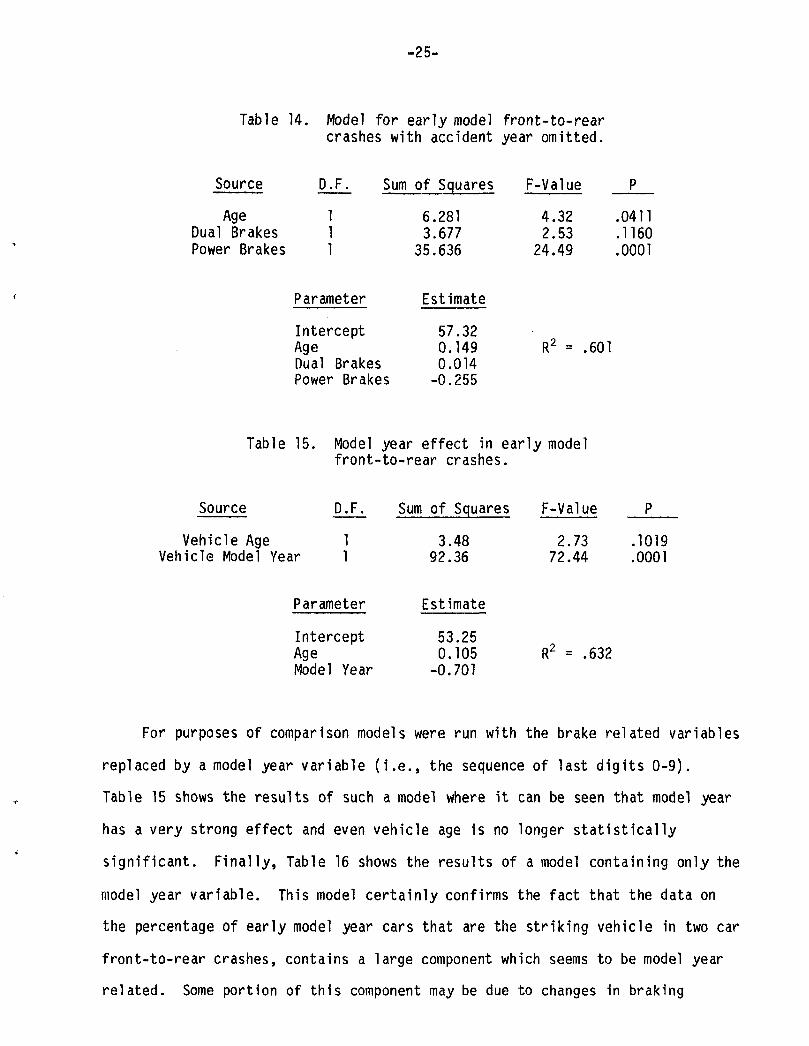
the power brake effect becomes even stronger as can be seen from Table 14. In
both of these models the effect attributed to power brakes seems much too large
to represent a real effect with respect to braking performance due to an
increasing percentage of cars equipped with power brakes.
-25-
Table 14. Model for early model front-to-rearcrashes with accident year omitted.
Source
AgeDual BrakesPower Brakes
D.F. Sum of Squares F-Value
1
Parameter
InterceptAgeDual BrakesPower Brakes
6.2813.677
35.636
Estimate
57.320.1490.014-0.255
4.322.53
24.49
.0411
.1160
.0001
R2 = .601
Table 15. Model year effect in early modelfront-to-rear crashes.
Source
Vehicle AgeVehicle Model
D.F.
1Year 1
Parameter
InterceptAgeModel Year
Sum of Squares
3.4892.36
Estimate
53.250.105
-0.701
F-Value
2.7372.44
R2 = .632
P
.1019
.0001
For purposes of comparison models were run with the brake related variables
replaced by a model year variable (i.e., the sequence of last digits 0-9).
Table 15 shows the results of such a model where it can be seen that model year
has a very strong effect and even vehicle age is no longer statistically
significant. Finally, Table 16 shows the results of a model containing only the
model year variable. This model certainly confirms the fact that the data on
the percentage of early model year cars that are the striking vehicle in two car
front-to-rear crashes, contains a large component which seems to be model year
related. Some portion of this component may be due to changes in braking
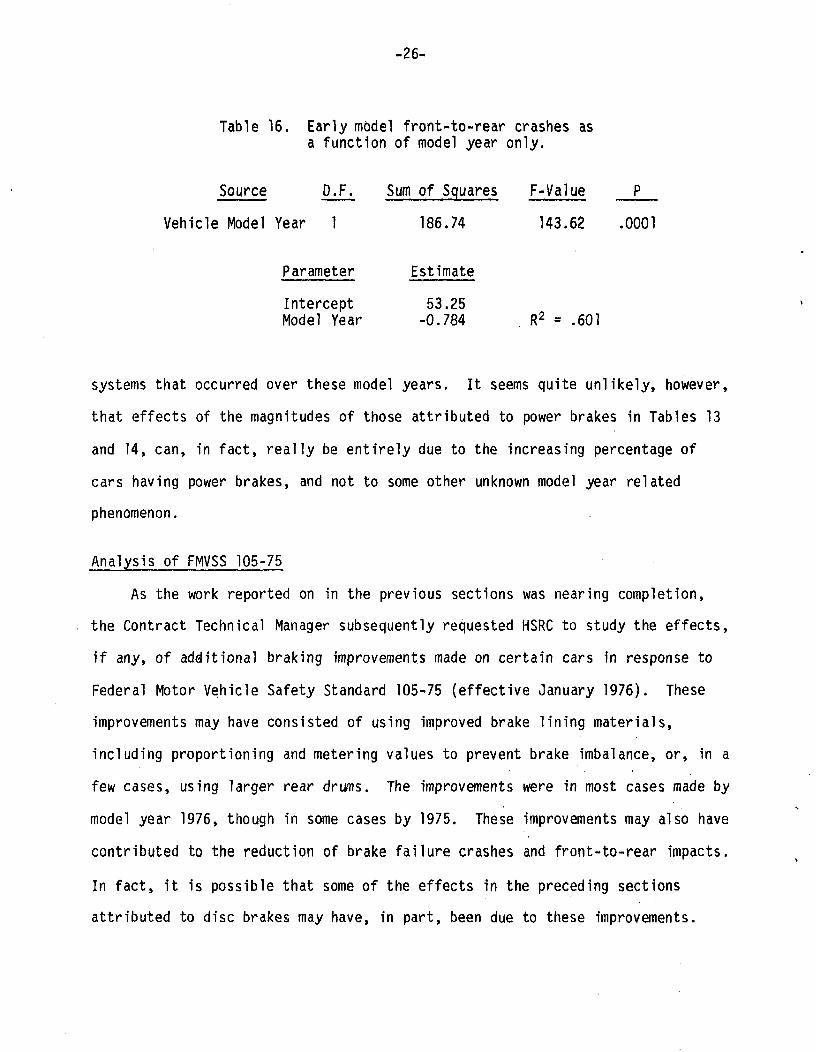
-26-
Tabie 16. Early model front-to-rear crashes asa function of model year only.
Source D.F. Sum of Squares F-Value P
Vehicle Model Year 1 186.74 143.62 .0001
Parameter Estimate
Intercept 53.25Model Year -0.784 R2 = .601
systems that occurred over these model years. It seems quite unlikely, however,
that effects of the magnitudes of those attributed to power brakes in Tables 13
and 14, can, in fact, really be entirely due to the increasing percentage of
cars having power brakes, and not to some other unknown model year related
phenomenon.
Analysis of FMVSS 105-75
As the work reported on in the previous sections was nearing completion,
the Contract Technical Manager subsequently requested HSRC to study the effects,
if any, of additional braking improvements made on certain cars in response to
Federal Motor Vehicle Safety Standard 105-75 (effective January 1976). These
improvements may have consisted of using improved brake lining materials,
including proportioning and metering values to prevent brake imbalance, or, in a
few cases, using larger rear drums. The improvements were in most cases made by
model year 1976, though in some cases by 1975. These improvements may also have
contributed to the reduction of brake failure crashes and front-to-rear impacts.
In fact, it is possible that some of the effects in the preceding sections
attributed to disc brakes may have, in part, been due to these improvements.
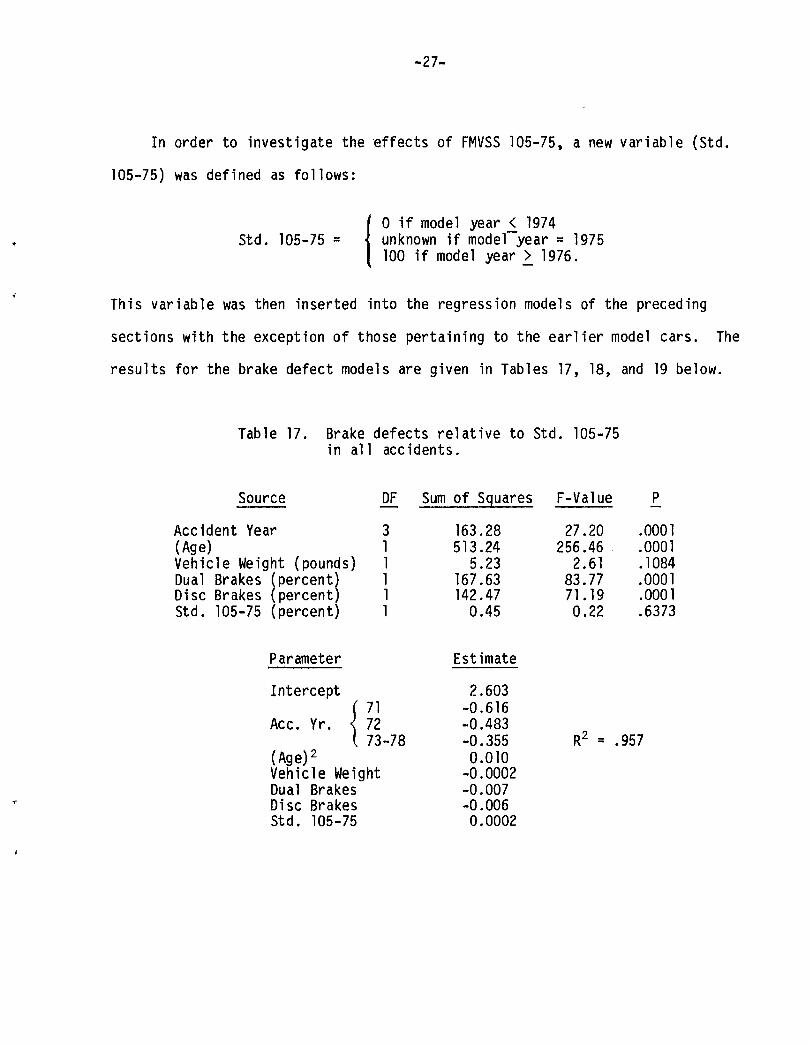
-27-
In order to investigate the effects of FMVSS 105-75, a new variable (Std.
105-75) was defined as follows:
Std. 105-75 =0 if model year £ 1974unknown if model year = 1975100 if model year > 1976.
This variable was then inserted into the regression models of the preceding
sections with the exception of those pertaining to the earlier model cars. The
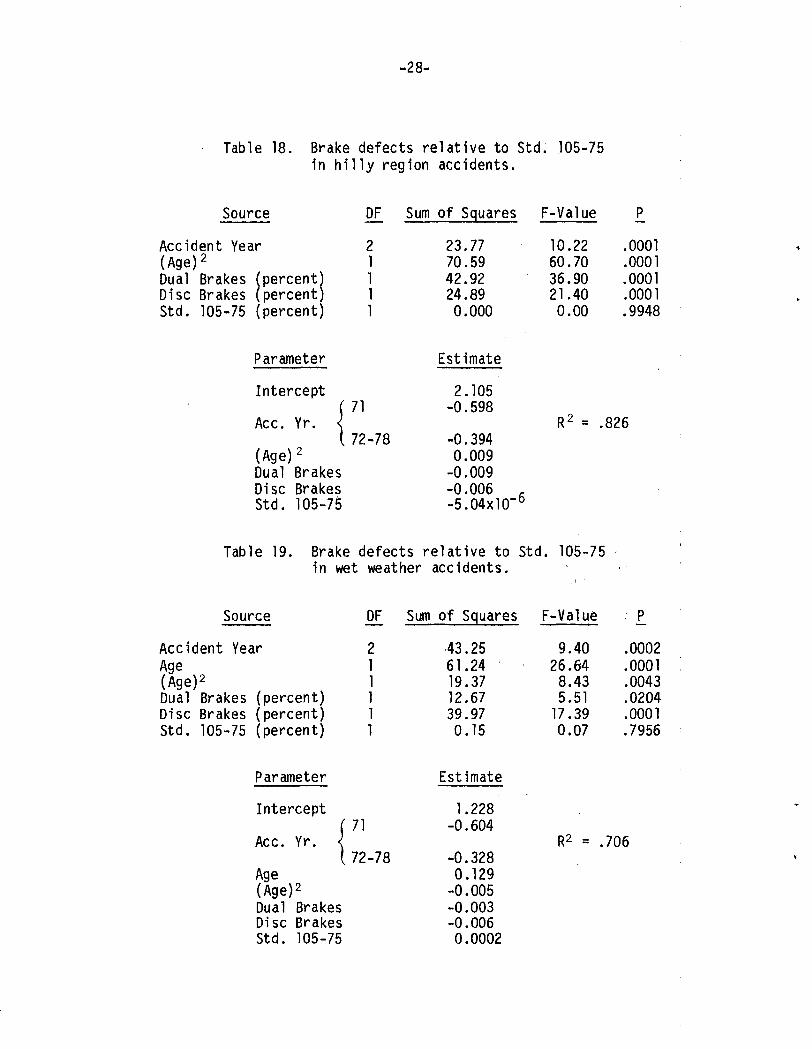
results for the brake defect models are given in Tables 17, 18, and 19 below.
Table 17. Brake defects relative to Std. 105-75in all accidents.
Source DF
Accident Year 3(Age) 1Vehicle Weight (pounds) 1Dual Brakes (percent) 1Disc Brakes (percent) 1Std. 105-75 (percent) 1
Parameter
Intercept
( 71
Ace. Yr. <̂ 72( 73-78
(Age)2Vehicle WeightDual BrakesDisc BrakesStd. 105-75
Sum of Squares
163.28513.24
5.23167.63142.470.45
Estimate
2.603-0.616-0.483-0.3550.010-0.0002-0.007-0.0060.0002
F-Value
27256
283710
R
.20
.46
.61
.77
.19
.22
2 _
P
.0001
.0001
.1084
.0001
.0001
.6373
957
-28-
Table 18. Brake defects relative to Std. 105-75in hilly region accidents.
Source
Accident Year(Age)2
Dual Brakes (percent)Disc Brakes (percent)Std. 105-75 (percent)
DF Sum of Squares F-Value
21111
23.7770.5942.9224.890.000
10.2260.7036.9021.400.00
.0001
.0001
.0001
.0001
.9948
Parameter
Intercept
Ace. Yr. <
(Age)2
Dual BrakesDisc BrakesStd. 105-75
71
72-78
Estimate
2.105-0.598
-0.3940.009-0.009-0.006 ,-5.04xl0"b
R2 = .826
Table 19. Brake defects relative to Std. 105-75in wet weather accidents.
Source
Accident YearAge(Age)2
Dual Brakes (percent)Disc Brakes (percent)Std. 105-75 (percent)
Parameter
Intercept(
Ace. Yr. {\
Age(Age)2
Dual BrakesDisc BrakesStd. 105-75
DF
211111
71
72-78
Sum of Squares
43.2561.2419.3712.6739.970.15
Estimate
1.228-0.604
-0.3280.129-0.005-0.003-0.0060.0002
F-Value
9.4026.648.435.5117.390.07
R2 = .
P
.0002
.0001
.0043
.0204
.0001
.7956
706
-29-
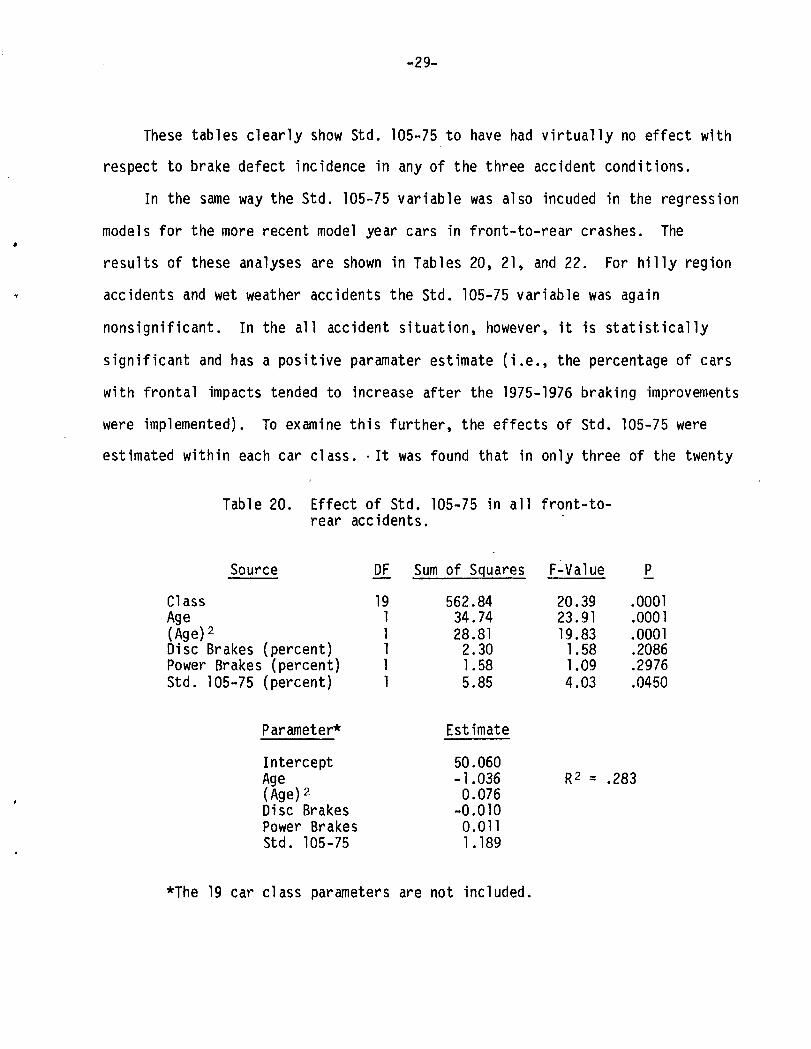
These tables clearly show Std. 105-75 to have had v i r tua l ly no effect with
respect to brake defect incidence in any of the three accident conditions.
In the same way the Std. 105-75 variable was also incuded in the regression
models for the more recent model year cars in front-to-rear crashes. The
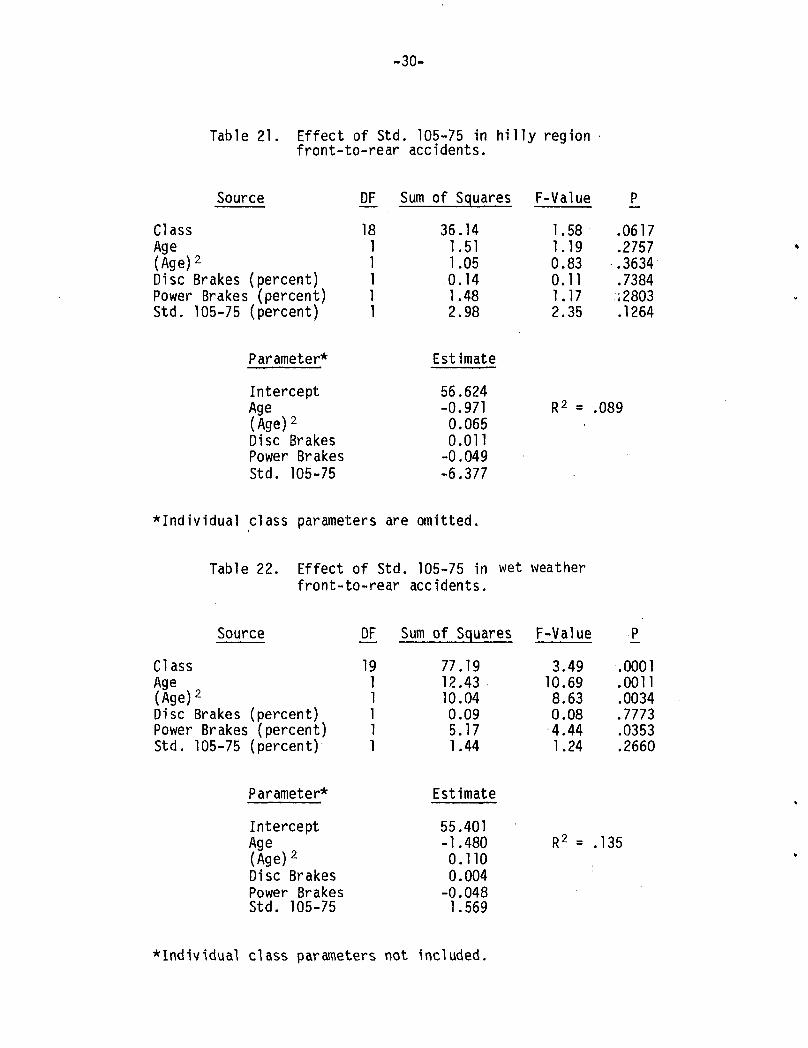
results of these analyses are shown in Tables 20, 21, and 22. For h i l l y region
accidents and wet weather accidents the Std. 105-75 variable was again
nonsignificant. In the al l accident situation, however, i t is s ta t i s t i ca l l y
signif icant and has a positive paramater estimate ( i . e . , the percentage of cars
with frontal impacts tended to increase after the 1975-1976 braking improvements
were implemented). To examine this further, the effects of Std. 105-75 were
estimated within each car class. - I t was found that in only three of the twenty
Table 20. Effect of Std. 105-75 in a l l f ront- to-rear accidents.
ClassAge(Age)DiscPowerStd.
Source
2
Brakes (percent)Brakes (percent)
105-75 (percent)
Parameter*
InterceptAge(Age)2Disc BrakesPower BrakesStd. 105-75
DF
1911111
Sum of Squares
562.8434.7428.812.301.585.85
Estimate
50.060-1.0360.076-0.0100.0111.189
F-Value
20.3923.9119.831.581.094.03
R2 = .
P
.0001
.0001
.0001
.2086
.2976
.0450
283
*The 19 car class parameters are not included.
-30-
Table 21. Effect of Std. 105-75 in h i l ly regionfront-to-rear accidents.
ClassAge(Age)DiscPowerStd.
Source
2
Brakes (percent)Brakes (percent)105-75 (percent)
Parameter*
InterceptAge(Age)2
Disc BrakesPower BrakesStd. 105-75
DF
1811111
Sum of Squares
36.141.511.050.141.482.98
Estimate
56.624-0.9710.0650.011-0.049-6.377
F-Value
1.581.190.830.111.172.35
R2 =
P
.0617
.2757
.3634
.7384
.2803
.1264
.089
•Individual class parameters are omitted.
Table 22. Effect of Std. 105-75 in wet weatherfront-to-rear accidents.
ClassAge(Age)DiscPowerStd.
Source
2
Brakes (percent)Brakes (percent)105-75 (percent)
Parameter*
InterceptAge(Age)2
Disc BrakesPower BrakesStd. 105-75
DF
1911111
Sum of Squares
77.1912.4310.040.095.171.44
Estimate
55.401-1.4800.1100.004-0.0481.569
F-Value
3.4910.698.630.08•4.441.24
R2 = .
P
.0001
.0011
.0034
.7773
.0353
.2660
135
•Individual class parameters not included.
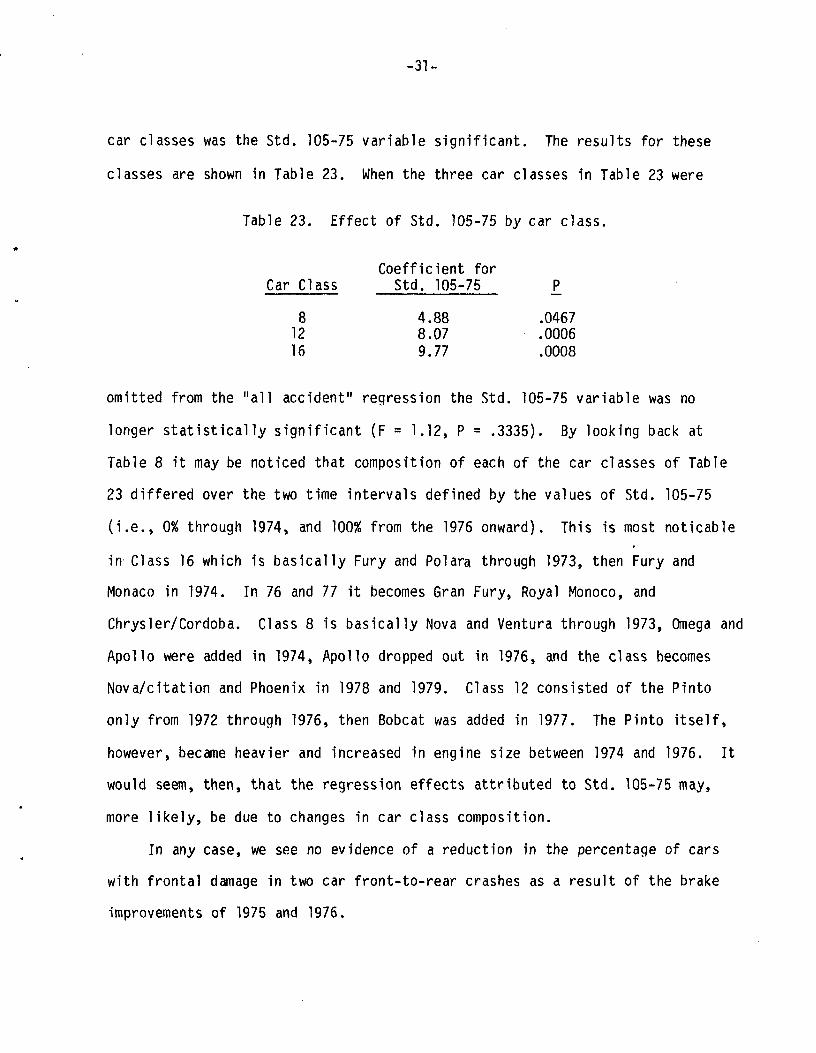
-31-
car classes was the Std. 105-75 variable significant. The results for these
classes are shown in Table 23. When the three car classes in Table 23 were
Table 23. Effect of Std. 105-75 by car class.
Coefficient forCar Class Std. 105-75 P_
8 4.88 .046712 8.07 .000616 9.77 .0008
omitted from the "all accident" regression the Std. 105-75 variable was no
longer statistically significant (F = 1.12, P = .3335). By looking back at
Table 8 it may be noticed that composition of each of the car classes of Table
23 differed over the two time intervals defined by the values of Std. 105-75
(i.e., 0% through 1974, and 100% from the 1976 onward). This is most noticable
in Class 16 which is basically Fury and Polara through 1973, then Fury and
Monaco in 1974. In 76 and 77 it becomes Gran Fury, Royal Monoco, and
Chrysler/Cordoba. Class 8 is basically Nova and Ventura through 1973, Omega and
Apollo were added in 1974, Apollo dropped out in 1976, and the class becomes
Nova/citation and Phoenix in 1978 and 1979. Class 12 consisted of the Pinto
only from 1972 through 1976, then Bobcat was added in 1977. The Pinto itself,
however, became heavier and increased in engine size between 1974 and 1976. It
would seem, then, that the regression effects attributed to Std. 105-75 may,
more likely, be due to changes in car class composition.
In any case, we see no evidence of a reduction in the percentage of cars
with frontal damage in two car front-to-rear crashes as a result of the brake
improvements of 1975 and 1976.
-32-
REFERENCES
Freund, R. J. and Little, R. C. (1981). SAS for Linear Models. Cary, N.C.SAS Institute, Inc.
APPENDIX A: COMPUTER PROGRAMMING DOCUMENTATION
Prepared by
Douglas Easterling
-33-
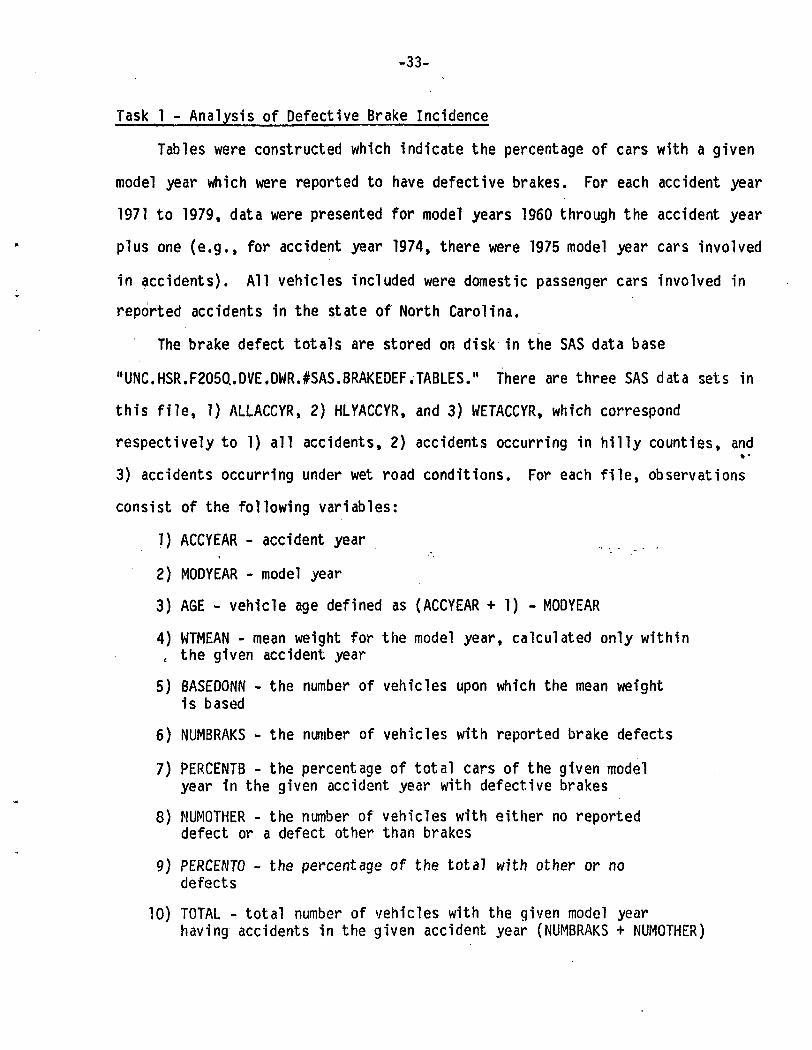
Task 1 - Analysis of Defective Brake Incidence
Tables were constructed which indicate the percentage of cars with a given
model year which were reported to have defective brakes. For each accident year
1971 to 1979, data were presented for model years 1960 through the accident year
plus one (e.g., for accident year 1974, there were 1975 model year cars involved
in accidents). All vehicles included were domestic passenger cars involved in
reported accidents in the state of North Carolina.
The brake defect totals are stored on disk in the SAS data base
"UNC.HSR.F205CUDVE.DWR.#SAS.BRAKEDEF.TABLES." There are three SAS data sets in
this file, 1) ALLACCYR, 2) HLYACCYR, and 3) WETACCYR, which correspond
respectively to 1) all accidents, 2) accidents occurring in hilly counties, and
3) accidents occurring under wet road conditions. For each file, observations
consist of the following variables:
1} ACCYEAR - accident year
2) MODYEAR - model year
3) AGE - vehicle age defined as (ACCYEAR + 1) - MODYEAR
4) WTMEAN - mean weight for the model year, calculated only within( the given accident year
5) BASEDONN - the number of vehicles upon which the mean weightis based
6) NUMBRAKS - the number of vehicles with reported brake defects
7) PERCENTB - the percentage of total cars of the given modelyear in the given accident year with defective brakes
8) MUMOTHER - the number of vehicles with either no reporteddefect or a defect other than brakes
9) PERCENTO - the percentage of the total with other or nodefects
10) TOTAL - total number of vehicles with the given model yearhaving accidents in the given accident year (NUMBRAKS + NUMOTHER)
-34-
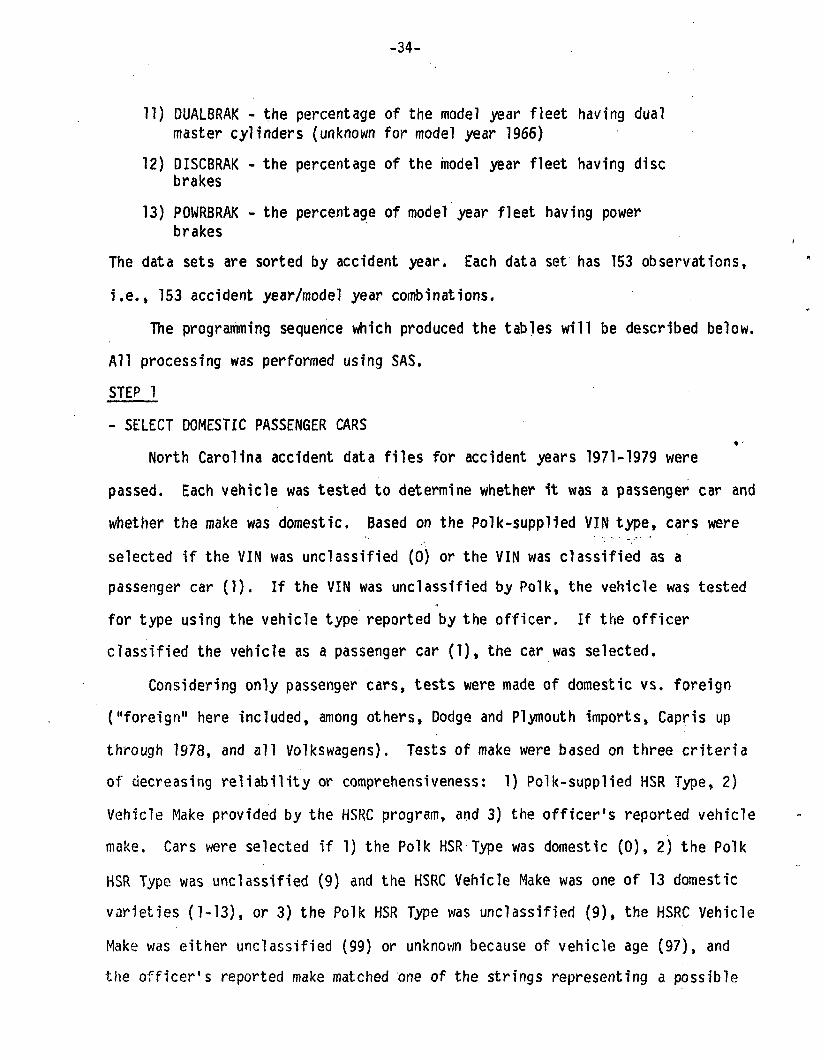
11) DUALBRAK - the percentage of the model year fleet having dualmaster cylinders (unknown for model year 1966)
12) DISCBRAK - the percentage of the model year fleet having discbrakes
13) POWRBRAK - the percentage of model year fleet having powerbrakes
The data sets are sorted by accident year. Each data set has 153 observations,
i.e., 153 accident year/model year combinations.
The programming sequence which produced the tables will be described below.
All processing was performed using SAS.
STEP 1
- SELECT DOMESTIC PASSENGER CARS* -
North Carolina accident data files for accident years 1971-1979 were
passed. Each vehicle was tested to determine whether it was a passenger car and
whether the make was domestic. Based on the Polk-supplied VIN type, cars were
selected if the VIN was unclassified (0) or the VIN was classified as a
passenger car (1). If the VIN was unclassified by Polk, the vehicle was tested
for type using the vehicle type reported by the officer. If the officer
classified the vehicle as a passenger car (1), the car was selected.
Considering only passenger cars, tests were made of domestic vs. foreign
("foreign" here included, among others, Dodge and Plymouth imports, Capris up
through 1978, and all Volkswagens). Tests of make were based on three criteria
of decreasing reliability or comprehensiveness: 1) Polk-supplied HSR Type, 2)
Vehicle Make provided by the HSRC program, and 3) the officer's reported vehicle
make. Cars were selected if 1) the Polk HSR Type was domestic (0), 2) the Polk
HSR Type was unclassified (9) and the HSRC Vehicle Make was one of 13 domestic
varieties (1-13), or 3) the Polk HSR Type was unclassified (9), the HSRC Vehicle
Make was either unclassified (99) or unknown because of vehicle age (97), and
the officer's reported make matched one of the strings representing a possible
-35-
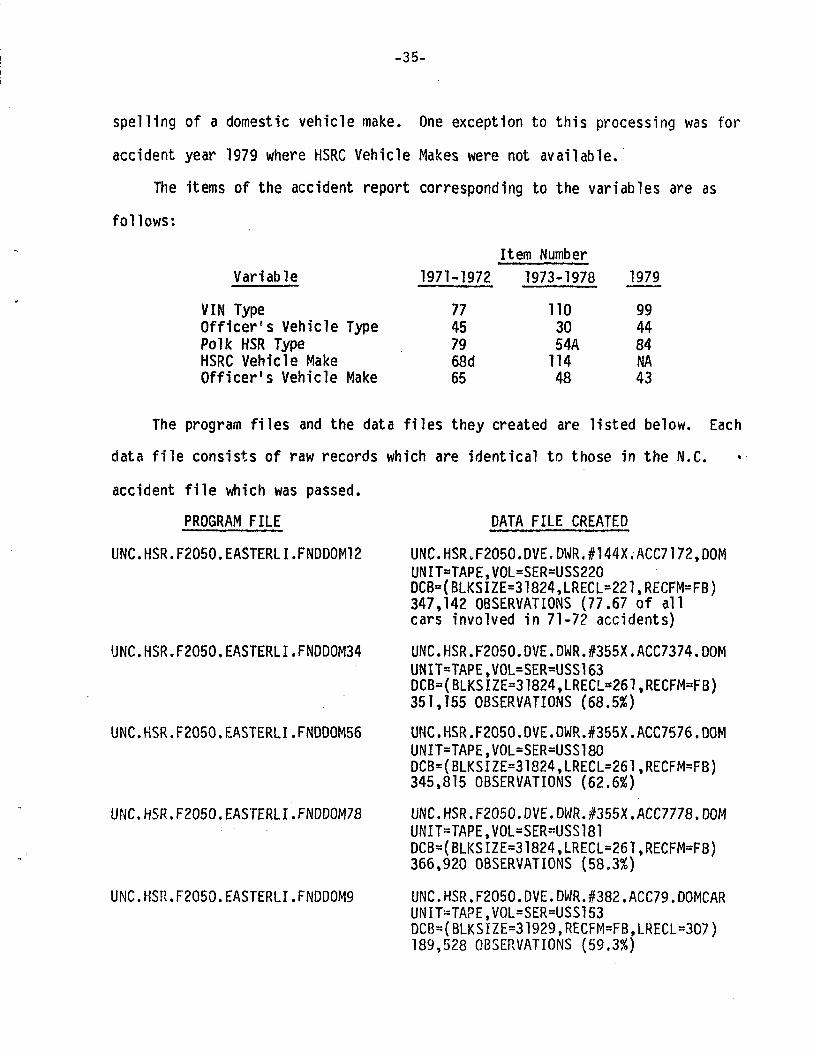
spelling of a domestic vehicle make. One exception to this processing was for
accident year 1979 where HSRC Vehicle Makes were not available.
The items of the accident report corresponding to the variables are as
follows:
Item NumberVariable 1971-1972 1973-1978 1979
VIN TypeOfficer's Vehicle TypePolk HSR TypeHSRC Vehicle MakeOfficer's Vehicle Make
77457968d65
1103054A11448
994484NA43
The program files and the data files they created are listed below. Each
data file consists of raw records which are identical to those in the N.C.
accident file which was passed.
DATA FILE CREATEDPROGRAM FILE
UNC.HSR.F2050.EASTERLI.FNDD0M12
UNC.HSR.F2050.EASTERLI.FNDD0M34
UNC.HSR.F2050.EASTERLI.FNDD0M56
UNC.HSR.F2050.EASTERLI.FNDD0M78
UNC.HSR.F2O5O.EASTERLI.FNDD0M9
UNC.HSR.F2050.DVE.DWR.#144X.ACC7172,D0MUNIT=TAPE,V0L=SER=USS220DCB=(BLKSIZE=31824,LRECL=221,RECFM=FB)347,142 OBSERVATIONS (77.67 of allcars involved in 71-72 accidents)
UNC.HSR.F2O5O.DVE.DWR.#355X.ACC7374.DOMUNIT=TAPE,V0L=SER=USS163DCB=(BLKSIZE=31824,LRECL=261,RECFM=FB)351,155 OBSERVATIONS (68.5%)
UNC.HSR.F2050.DVE.DWR.#355X.ACC7576.DOMUNIT=TAPE,V0L=SER=USS180DCB=(BLKSIZE=31824,LRECL=261,RECFM=FB)345,815 OBSERVATIONS (62.6%)
UNC.HSR.F2050.DVE.DWR.#355X.ACC7778.D0MUNIT=TAPE,V0L=SER-USS181DCB=(BLKSIZE=31824,LRECL=261,RECFM=FB)366,920 OBSERVATIONS (58.3%)
UNC.HSR.F2050.DVE.DWR.#382.ACC79.DOMCARUNIT=TAPE,V0L=SER=USS153DCB=(BLKSIZE=31929,RECFM=FB,LRECL=307)189,528 OBSERVATIONS (59.3%)
-36-
STEP 2
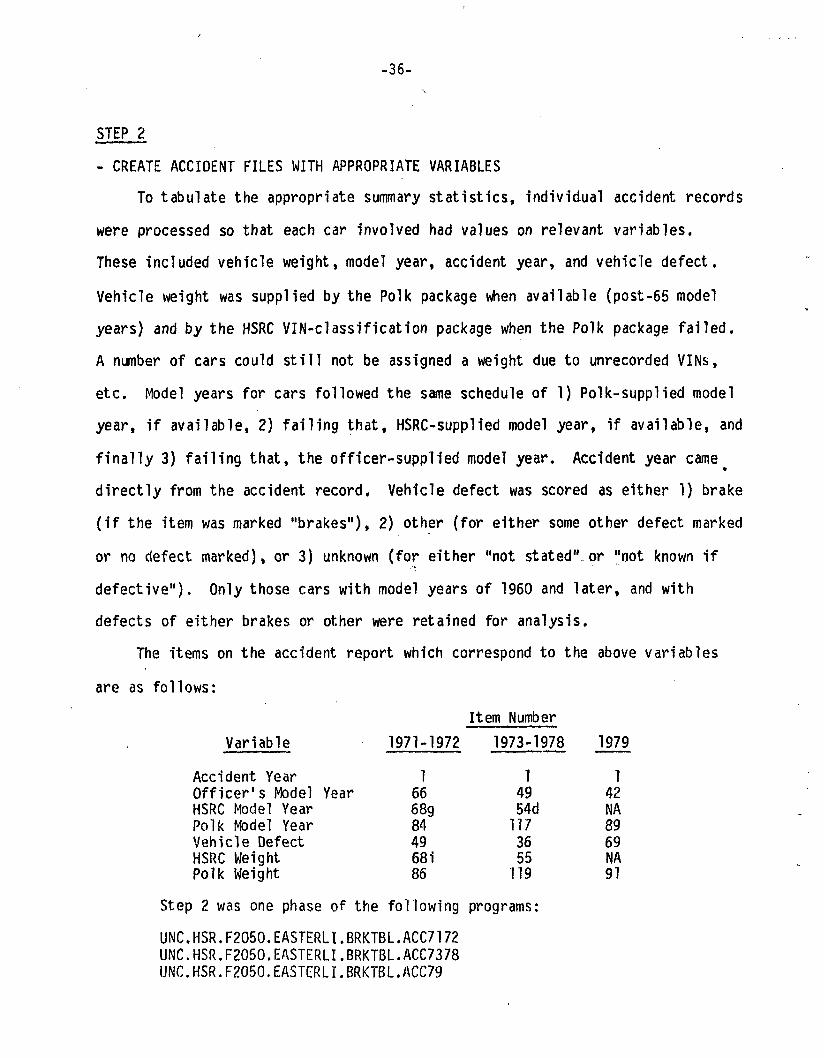
- CREATE ACCIDENT FILES WITH APPROPRIATE VARIABLES
To tabulate the appropriate summary s ta t i s t i cs , individual accident records
were processed so that each car involved had values on relevant variables.
These included vehicle weight, model year, accident year, and vehicle defect.
Vehicle weight was supplied by the Polk package when available (post-65 model
years) and by the HSRC VIN-classification package when the Polk package f a i l e d .
A number of cars could s t i l l not be assigned a weight due to unrecorded VINs,
etc. Model years for cars followed the same schedule of 1) Polk-supplied model
year, i f available, 2) f a i l i ng tha t , HSRC-supplied model year, i f available, and
f i n a l l y 3) fa i l i ng that , the officer-supplied model year. Accident year came
di rec t ly from the accident record. Vehicle defect was scored as either 1) brake
( i f the item was marked "brakes"), 2) other (for either some other defect marked
or no defect marked), or 3) unknown (for either "not stated",or "not known i f
defect ive"). Only those cars with model years of 1960 and la ter , and with
defects of either brakes or other were retained for analysis.
The items on the accident report which correspond to the above variables
are as follows:
Item Number
Variable 1971-1972 1973-1978 1979
Accident YearOfficer's Model YearHSRC Model YearPolk Model YearVehicle DefectHSRC WeightPolk Weight
16668g844968 i86
14954d1173655119
142NA8969NA91
Step 2 was one phase of the fo l lowing programs:
UNC.HSR.F2O5O.EASTERLI.BRKTBL.ACC7172UNC.HSR.F2050.EASTERLI.BRKTBL.ACC7378UNC.HSR.F2050.EASTERLI.BRKTBL.ACC79
-37-
STEP 3
- CREATE FILES WITH SUMMARY STATISTICS FOR ALL ACCIDENTS
Proc Summary was used to obtain both frequency counts and mean weights for
each model year/accident year combination. Proc Summary was performed with
class variables of accident year, model year and vehicle defect. In this way, a
mean weight was calculated for each accident year/model year combination, and
frequencies were calculated for number of vehicles in each accident year/model
year with brake defects and with other defects (the mean weight figures were
collapsed across brake defects).
Using the __TYPE_ variable generated by Proc Summary, two data sets were
created. Data set WEIGHT had one observation per accident year/model year
giving the mean weight. Data FREQ had two observations per accident year/model
year, the first with the number of cars with brake defects and the second with
the number of cars with other defects. ....... ...
In order to consolidate both sets of information into one data set, WEIGHT
and FREQ were merged together by a dummy variable ACCMODYR. This variable
simply took the accident year as its first four digits and the model year as its
last four digits. The resultant data set thus had two observations per accident
year/model year, each with the mean weight variable, one with "brake" frequency
and the other with "other" frequency.
To consolidate again, this data set was first divided into the data sets
BRAKE and OTHER where each contained observations with the respective frequency
counts. Again these two data sets were merged together by ACCMODYR so that each
accident year/model year had frequency counts for brake defects and for other
defects, as well as having the mean weight for the entire category.
The age, percentage and total variables were constructed using simple
arithmetic. Other pertinent information regarding percentages of model year
-38-
fleets with disk brakes, power brakes and dual master cylinders were extracted
from other sources and merged with the summary tables.
The following programs performed this processing in order:
UNC.HSR.F2050.EASTERLI.BRKTBL.ACC7172UNC.HSR.F2050.EASTERLI.BRKTBL.ACC7378UNC.HSR.F2O5O.EASTERLI.BRKTBL.ACC79UNC.HSR.F2O5O.EASTERLI.FIXTBLES.BRAKESUNC.HSR.F2O5O.EASTERLI.MERGE.BRKSTATS.TSK1
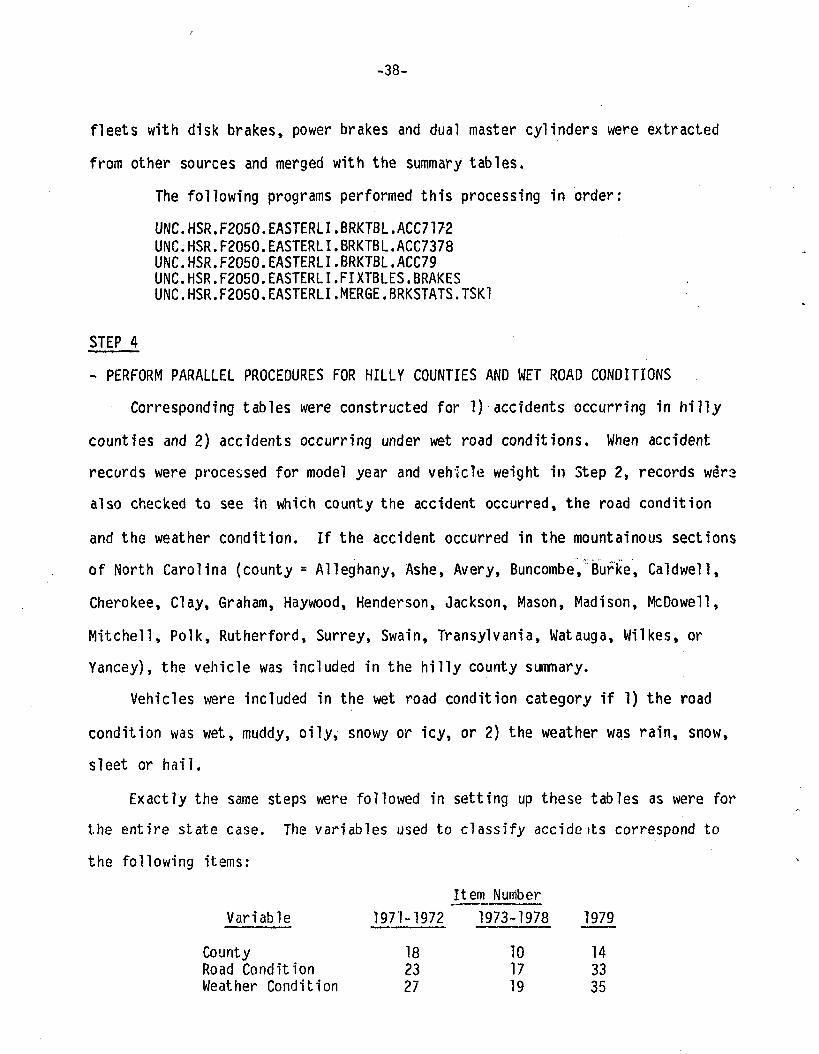
STEP 4
- PERFORM PARALLEL PROCEDURES FOR HILLY COUNTIES AND WET ROAD CONDITIONS
Corresponding tables were constructed for 1) accidents occurring in hilly
counties and 2) accidents occurring under wet road conditions. When accident
records were processed for model year and vehicle weight in Step 2, records wera
also checked to see in which county the accident occurred, the road condition
and the weather condition. If the accident occurred in the mountainous sections
of North Carolina (county a Alleghany, Ashe, Avery, Buncombe, Burke, Caldwell,
Cherokee, Clay, Graham, Haywood, Henderson, Jackson, Mason, Madison, McDowell,
Mitchell, Polk, Rutherford, Surrey, Swain, Transylvania, Watauga, Wilkes, or
Yancey), the vehicle was included in the hilly county summary.
Vehicles were included in the wet road condition category if 1) the road
condition was wet, muddy, oily, snowy or icy, or 2) the weather was rain, snow,
sleet or hail.
Exactly the same steps were followed in setting up these tables as were for
the entire state case. The variables used to classify accide its correspond to
the following items:
Item Number
Variable 1971-1972 1973-1978 1979
County 18 10 14Road Condition 23 17 33Weather Condition 27 19 35
-39-
Th e following programs were used, in order, to set up the tables:
UNC.HSR.F2O5O.EASTERLI.BRKTBL.HLWT7172UNC.HSR.F2050.EASTERLI.BRKTBL.HLWT7378UNC.HSR.F2O50.EASTERLI.BRKTBL.HLWT79UNC.HSR.F2050.EASTERLI.FIXTBLES.BRAKESUNC.HSR.F2O5O.EASTERLI.MERGE.BRKSTATS.TSK1
-40-
Task 2a. Analysis of Two-Car Front-Rear Collisions Where Cars are ClassifiedAccording to HSR Groups
Tables of results for th is task indicate the percentage of cars within a
given car l ine sustaining frontal damage and the percentage sustaining rear
damage in front-to-rear col l is ions. Al l domestic passenger cars with model
years 1967 and later which were involved in such accidents were categorized by
accident year, model year and HSR Group. Summary s tat is t ics were then given for
each accident year/model year/HSR Group combination with the percentage of the
group having a frontal i n i t i a l impact region to serve as the dependent measure.
Records were used for North Carolina accidents occurring between 1971 and 1979.
These front-rear co l l is ion data are stored on disk in the SAS data base
"UNC.HSR.F2O5O.DVE.DWR.#SAS.FTRRHSR.ALLTABLE" in the SAS data set ALL7179.
Similar tables appear for accidents in h i l l y counties (DSN=UNC.HSR.F2050.0VE.
DWR.ISAS.FTRRHSR.HILTABLE, SAS data set • HILY7179) and for accidents occurring
under wet road conditions (DSN=UNC.HSR.F2050.DVE.DWR.#SAS.FTRRHSR.WETTABLE, SAS
data set = WET7179). For each of the three f i l e s , observations consist of the
fol lowing:
1) ACCYEAR - accident year
2) MODYEAR - model year
3) HSRGRP - HSR Car Group (corresponds to the Polk car l ine variable)(These HSR Group numbers are formatted according to model yearin the SAS l ib ra ry , "UNC.HSR.F2050.DVE.DWR.#SAS.HSRGRP.FORMATS."There are 13 formats, corresponding to each model year from 1967through 1979. Format names have the form HSRxxMOD where xx isthe model year, e .g. , HSR71M0D. for model year 1971. These formatswere created by the program "UNC.HSR.F2050.EASTERLI.HSRF0RMT.")
4) WTMEAN - mean weight for the particular HSR group of the givenmodel year within the given accident year (WTMEAN may d i f feracross accident years for the same model year/HSR group combina-tion) .
5) BASEDONN - the number of vehicles upon which the mean weightis based (always less than or equal to TOTAL).
-41-
6) NUMFRONT - the number of cars with the given accident year/model year/HSR group combination which suffered frontal damagein front rear collisions.
7) PERCENTF - (NUMFRONT/TOTAL) x 100
8) NUMREAR - the number of cars with the given accident year/model year/HSR group combination which suffered rear damage infront-rear collisions.
9) PERCENTR - (NUMREAR/TOTAL) x 100
10) TOTAL - total number of cars with the given accident year/modelyear/HSR group combination which were involved in front-rearcollisions (NUMFRONT - NUMREAR).
The data sets are sorted by accident year. ALL7179 has 3867 observations, i.e.,
accident year/model year/HSR group combinations. HILLY7179 has 2848
observations and WET7179 has 3312 observations.
These tables were produced by the following sequence of steps. Tables for
hilly counties were constructed by selecting out accidents occurring in the 24
mountainous counties of North Carolina (see Step 4 of Task 1). Tables for wet
road conditions were formed after selecting out those accidents occurring when
the road condition was wet, icy, snowy, oily or muddy, or when the weather
condition was rain, snow, sleet or hail. (See Task 1, Step 4 for item number
for these three variables.)
STEP 1
- SELECT DOMESTIC PASSENGER CARS
See Step 1 of Task 1. The same files created there were used in Task 2a.
STEP 2
- SELECT ALL DOMESTIC CARS INVOLVED IN FRONT-TO-REAR COLLISIONS
Using the files of domestic passenger cars to draw from, selection was made
of both cars involved in front-to-rear collision. Because the limited file was
used to start with, only collisions in wich both vehicles could be recognized as
domestic passenger cars were included in the front-rear files.
-42-
Records were first tested to see if the accident was a two-car collision
(for accident years 1971-1978, this corresponded to the variable "accident
type"; for accident year 1979, the less informative variable "units involved"
was used). For these cases, a test was made to see if the first vehicle
encountered actually had a vehicle position of 1. If not, this meant that
Vehicle No. 1 was not in the file (not a domestic passenger car), and
consequently the vehicle at hand was discarded. When a car was found to be the
first vehicle of a two-car accident, it was then checked to see if its initial
region of impact was either the front or the rear. (For 1971 and 1972
accidents, points of contact 1, 2, and 8 were considered front and points 4, 5,
and 6 were considered rear. For 1973 through 1978 accident years, points of •
contact 1, 2, 3, 4, 21, and 25 were considered front and points 8, 14, 15, 16,
17, and 27 were considered rear. For accident year 1979, contact points 1, 2,
3, 4, and 21 were considered front, while points 8, 14, 15, 16, and 17 were
considered rear.)
For cars with either front or rear impact regions, the entire raw record
was retained as a character string, along with the case number and the impact
region. In the same data step, the next record was then input in order to
further test the type of accident. If the case number of the next car was the
same as that retained for the first car, then both cars were involved in the
same accident (this test would fall out if Vehicle 2 of the accident was a truck
and thus was missing from the file). If the case numbers of the two cars did
differ, the first car was discarded (its accident did not involve two domestic
cars) and the second car was sent back to the beginning of the data step to be
tested if it was involved in a two-car collision. The only time a data record
was written was when one car was classified as Vehicle 1 of a two-car collision
and the next car tested had the same case number and was classified as Vehicle
-43-
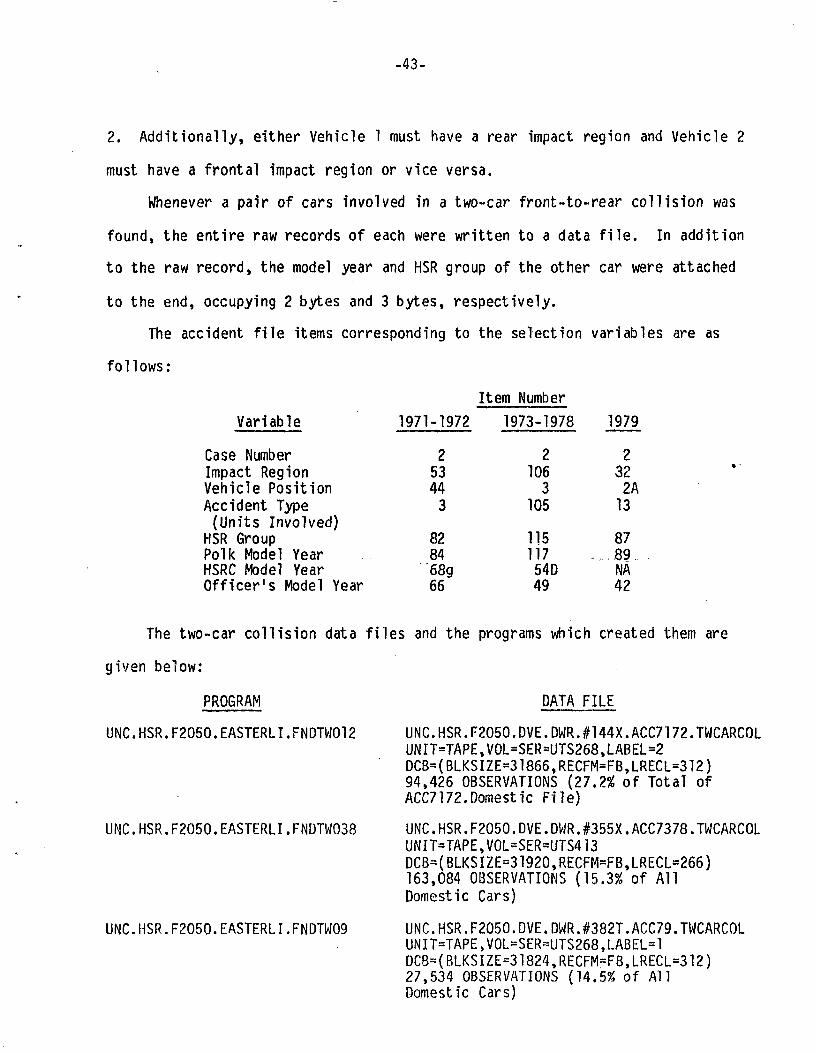
2. Addit ional ly, either Vehicle 1 must have a rear impact region and Vehicle 2
must have a frontal impact region or vice versa.
Whenever a pair of cars involved in a two-car front-to-rear col l is ion was
found, the entire raw records of each were written to a data f i l e . In addition
to the raw record, the model year and HSR group of the other car were attached
to the end, occupying 2 bytes and 3 bytes, respectively.
The accident f i l e items corresponding to the selection variables are as
fol lows:
Item Number
Variable
Case NumberImpact RegionVehicle PositionAccident Type(Units Involved)
HSR GroupPolk Model YearHSRC Model YearOfficer's Model Year
1971-1972
253443
828468g66
1973-1978
21063
105
11511754D49
1979
2322A13
87- . 89.
NA42
The two-car collision data files and the programs which created them are
given below:
PROGRAM DATA FILE
UNC.HSR.F2050.EASTERLI.FNDTW012 UNC.HSR.F2O5O.DVE.DWR.#144X.ACC7172.TWCARCOLUNIT=TAPE,V0L=SER=UTS268,LABEL=2DCB=(BLKSIZE=31866,RECFM=FB,LRECL=312)94,426 OBSERVATIONS (27.2# of Total ofACC7172.Domestic File)
UNC.HSR.F2050.EASTERLI.FNDTW038 UNC.HSR.F2050.DVE.DWR.#355X.ACC7378.TWCARCOLUNIT=TAPE,V0L=SER=UTS413DCB=(BLKSIZE=3192O,RECFM=FB,LRECL=266)163,084 OBSERVATIONS (15.3% of AllDomestic Cars)
UNC.HSR.F2O5O.EASTERLI.FNDTW09 UNC.HSR.F2050.DVE. DWR.#382T.ACC79.TWCARCOLUNIT=TAPE,V0L=SER«UTS268,LABEL=lDCB=(BLKSIZE=31824,RECFM=F8,LRECL=312)27,534 OBSERVATIONS (14.5* Of AllDomestic Cars)
-44-
STEP 3
- CREATE SAS DATA SET WITH ALL HSR-CLASSIFIED, POST-66 FRONT-REAR CARS
In th is step, appropriate cars were selected and records were transformed
from raw form to SAS observations. For each accident year, cars were selected
i f thei r model years were 1967 or la ter , and i f there was a Polk-supplied HSR
Group number, i . e . , i f the VIN was decodable. Cars were selected from the f i l e s
created in Step 2. While both cars in the accident had to be domestic to be
included in those f i l e s , there was no further restr ic t ion in th is step for both
cars to be post-66 with non-missing HSR groups. I f either car of the accident
satisf ied the requirements, i t was included, regardless of the status of the
other car.
Cars were selected i f the Polk-supplied model year was 1967 or above and i f
the Polk-supplied car l ine (HSR Group) was between 0 and 100, exclusive. A car
l ine of 0 represented unclassified while anything over 100 indicated something
other than a domestic car (these should not be in the f i l e anyway). SAS
variables were created for vehicle weight, model year, accident year, impact
region (character, either "front" or " rear" ) , and HSR group, among others not
used in analysis. These variables correspond to items in the accident f i l e s as
follows:
Item NumberVariable
ACCYEARMODYEAR (Polk-supplied)WEIGHT (Polk-supplied)HSRGRPIMPREG
1971-1972
184868253
1973-1978
1117119115106
197
139918782
The SAS data set is cal led QBS7179 and is a member of the SAS data base
"UNC.HSR.F2050.DVE.DWR.#SAS.FTRRC0L.HSR6779.M (UNIT=TAPE,V0L=SER=UTS418,LABEL=l,
DCB=(BLKSIZE=32760,LRECL=32756,RECFM=U)). I t was created by the program f i l e
"UNC.HSR.F2050.EASTERLI.TWCARC01.HSR6779."
-45-
STEP 4
- CREATE TABLES FOR FRONT AND REAR IMPACT REGIONS BY ACCIDENT YEAR/MODELYEAR/HSR GROUP
Proc Summary was used to obtain both frequency counts and mean weights for
each accident year/model year/HSRC group combination. Proc Summary was
performed with class variables of accident year, model .year, HSR group and
impact region. In this way, a mean weight was calculated for each accident
year/model year/HSR group combination, and frequencies were calculated for
number of vehicles in each category with frontal impact regions and for number
of vehicles with rear impact regions (the mean weight figures were collapsed
across impact regions).
Using the _TYPE_ variable generated by Proc Summary, two data sets were
created. Data set WEIGHT had one observation per category giving the mean
weight. Data FREQ had two observations per category, the first with the number
of cars of the given accident year/model year/HSR group category with frontal
impact regions and the second with the number of cars in that same category with
rear impact regions.
In order to consolidate both sets of information into one data set, WEIGHT
and FREQ were merged together by a dummy variable ACMODHSR. This variable
simply took the accident year as its first 4 digits, the model year as its next
4 digits and the HSR group number as its last 3 digits. (Merge only operates
with one by-variable). The resultant data set had two observations per
category, each with the mean weight variable, one with "front" frequency and the
other with "rear" frequency.
To consolidate again, this data set was first divided into the data sets
FRONT and REAR where each contained observations with the respective frequency
counts. Again these two data, sets were merged together by ACMODHSR so that each
-46-
accident year/model year/HSR group combination had frequency counts for frontal
impact and rear impact, as well as having the mean weight for the entire
category.
The percentage and total variables were then calculated using simple
arithmetic.
The following programs generated the final three sets of tables;
"UNC.HSR.F2050.EASTERLI.FTRRHSR.ALLTABLE""UNC.HSR.F2050.EASTERLI.FTRRHSR.HILTABLE""UNC.HSR.F2050.EASTERLI.FTRRHSR.WETTABLE"
-47-
Task 2b. Analysis of Two-Car Front-Rear Collisions Where Cars Have ModelYears 1960 to 1969
As in Task 2a, tables indicating frontal and rear damage in front-to-rear
col l is ions were constructed. In th is case, only cars with model years 1960 to
1969 were considered. Cars were not broken down into HSR groups, but rather
were classif ied only by model year. The same 1971-79 North Carolina accident
f i l e s used in Task 2a formed the sampling base in this task.
The front-rear col l is ion summaries for this task are stored on disk in the
SAS data base "UNC.HSR.F2050.DVE.DWR.#SAS.FTRRC0L.D0M609TB" in the SAS data set
ACCYRBRK. Observations in the data set conist of the following variables:
1) ACCYEAR - accident year
2) MODYEAR - model year
3) WTMEAN - mean weight for the model year within the given accidentyear.
4) BASEDONN - the number of cars upon which the mean weight is based.
5) NUMFRONT - the number of cars with the given accident year/modelyear combination which suffered frontal damage in front rearcol l is ions
6) PERCENTF - (NUMFRONT/TOTAL) x 100
7) NUMREAR - the number of cars with the given accident year/modelcombination which suffered rear damage in front-rear col l is ions.
8) PERCENTR - (NUMREAR/TOTAL) x 100
9) TOTAL - tota l number of cars with the given accident year/modelyear combination which were involved in front-rear col l is ions(NUMFRONT + NUMREAR)
10) AGE - Vehicle age ((ACCYEAR+1)-MODYEAR)
11) POWRBRAK - percentage of model year f l ee t equipped with powerbrakes
12) DUALBRAK - percentage of model year f lee t equipped with dualmaster cyl inder brakes
The data data is sorted by accident year.
-48-
The following steps produced the Task 2b tables:
STEP 1
- SELECT DOMESTIC PASSENGER CARS
See Step 1 of Task 1. The same f i l es created there were used in Task 2b.
STEP 2
- SELECT ALL DOMESTIC CARS INVOLVED IN FRONT-TO-REAR COLLISIONS
See Step 2 of Task 2a. The same f i l es created there were used in Task 2b.
STEP 3
- CREATE SAS DATA SET WITH ALL FRONT-REAR CARS WITH MODEL YEARS 60-69.
In th is step, appropriate cars were selected and records were transformed
from raw form to SAS observations. For each accident year, cars were selected^
from the front-rear f i l es of Step 2 i f they had model years of 1960 to 1969.
There was no requirement that both cars involved in the col l is ion have model
years 60-69 for one to be selected. Model year was determined based on an
established hierarchy of variables. I f the Polk-supplied model year was
available, i t was rel ied on as the most rel iable source. The next variable used
was the HSRC-supplied model year. This was especially important here since Polk
only c lassi f ies post-1965 model year cars. I f neither package-supplied model
was available (VIN not decodable), the o f f icer 's reported model year was
ut i 1 i zed.
SAS variables were created for vehicle weight, model year, accident year
and impact region (character, either " front" or " rear") . Vehicle weight was
based on the Polk-supplied vehicle weight when available. Otherwise the
HSRC-supplied weight was used. A number of cars were assigned missing values as
the VIN was not decodable by either. For accident year 1979, the HSRC package
was not run on the data so that only cars with model years 1966-1969 have
non-missing vehicle weights.
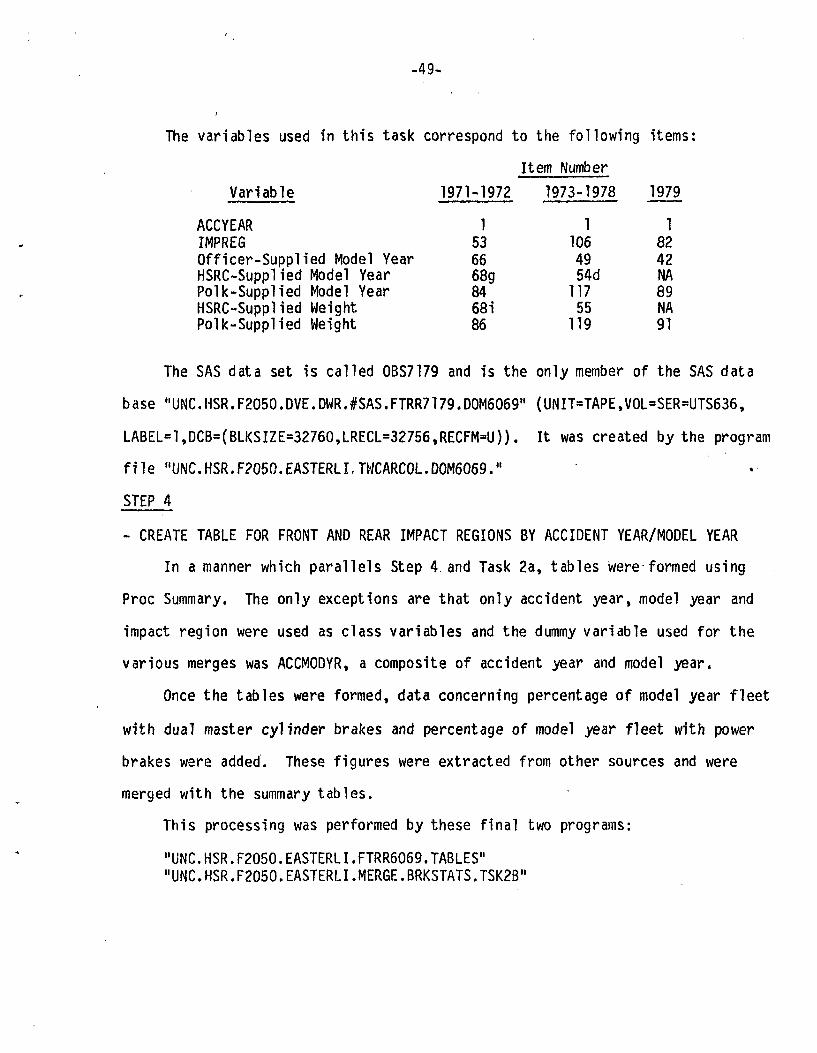
-49-
Th e variables used in th is task correspond to the following items:
Item Number
Variable 1971-1972 1973-1978 1979
ACCYEARIMPREGOfficer-Supplied Model YearHSRC-Supplied Model YearPolk-Supplied Model YearHSRC-Supplied WeightPolk-Supplied Weight
1536668g8468 i86
11064954d11755119
18242NA89NA91
The SAS data set is cal led 0BS7179 and is the only member of the SAS data
base "UNC.HSR.F2050.DVE.DWR.#SAS.FTRR7179.D0M6069" (UNIT=TAPE,V0L=SER=UTS636,
LABEL=1,DCB=(BLKSIZE=3276O,LRECL=32756,RECFM=U)). I t was created by the program
f i l e "UNC.HSR.F2050.EASTERLLTWCARC0L.D0M6069."
STEP 4
- CREATE TABLE FOR FRONT AND REAR IMPACT REGIONS BY ACCIDENT YEAR/MODEL YEAR
In a manner which pa ra l l e l s Step 4 and Task 2a, tables were formed using
Proc Summary. The only exceptions are that only accident year, model year and
impact region were used as class var iables and the dummy var iable used for the
various merges was ACCMODYR, a composite of accident year and model year.
Once the tables were formed, data concerning percentage of model year f l e e t
wi th dual master cy l inder brakes and percentage of model year f l ee t with power
brakes were added. These f igures were extracted from other sources and were
merged with the summary tab les .
This processing was performed by these f i n a l two programs:
"UNC. HSR.F2050.EASTERLI.FTRR6069.TABLES""UNC.HSR.F2050.EASTERLI.MERGE.BRKSTATS.TSK2B"
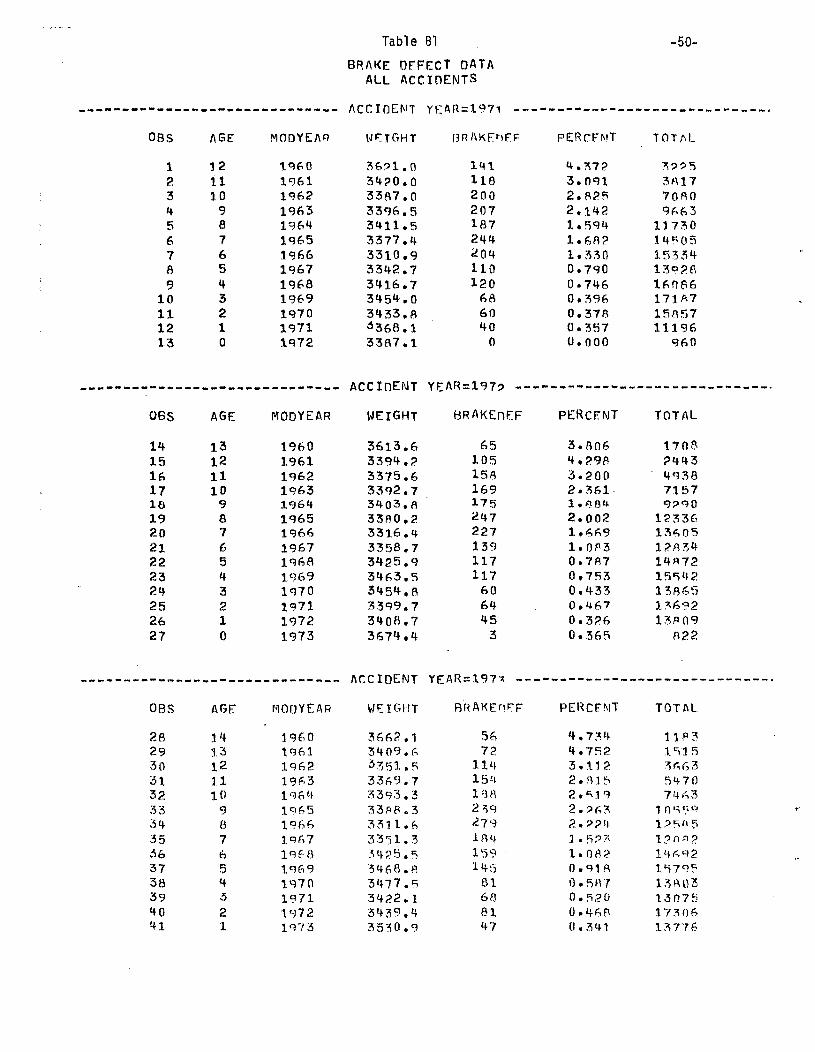
Table Bl -50-
BRAKE: DEFECT DATAALL ACCIDENTS
ACCIDENT YEAR=1971
BS
12345678910111213
ABE
1211109
e76543210
MODYEA"
I960196119621963196419651966196719681969197019711972
WEIGHT
3621.03420.03387.03396.53411.53377.43310.93342.73416.73454.03433.a^368.13387.1
l3RAKEnF.F
1411102002071872442041101206860400
PERCFMT
4.3723.0912.8252.1421.5941.68?1.3300.7900.7460.3960.3780.3570.000
T O T / M .
3??53 A 1.770809663117301 4 R 0 51533413«?2fl16086171A71585711196
960
OBS
1415161718192021222324252627
AGE
131211109876543210
ACCinENT YEAR=1979 --
MODYEAR WEIGHT BRAKEFlEF
19601961196219631964196519661967196819691970197119721973
3613.63394.23375.63392.73403.fi3380.23316.43358.73425.93463.53454.03399,73408.73674.4
651051581691752472271391171176 064453
PERCENT
3.8064.2983.2002.361*l A Q llX 9 *$&*+
2.0021.6691.0830.7870.7530.4330.4 670.3260.365
TOTAL
1708244349387157Q O o n1?336136051283414«7215542138651369213809
822
OBS
28293031.32333435363738394041
AGE
141.3121110907654521
MODYEAR
1 . 9 6 0196119621963196419651966196719 681969197 019711972197 3
ACCIDENT
WEIGHT
3662.13409.6
3369.73393.33388.33311.63351.33425.53468.83477.53422.13439.43530.9
B R A K E H F T
5 67 2
1 1 41 5 41 8 82 = 5 9
18415914581608147
PERCFMT
4.7344.7523.1122.8152.^.192.96?2.??41« 52*1.08?0 . 91 ft0.5H70.5200.4680.341
TOTAL
UP?1 5 1 53 * 6 35 4 7 0
l?nn?
1579513*03130751 7 3 0 613776
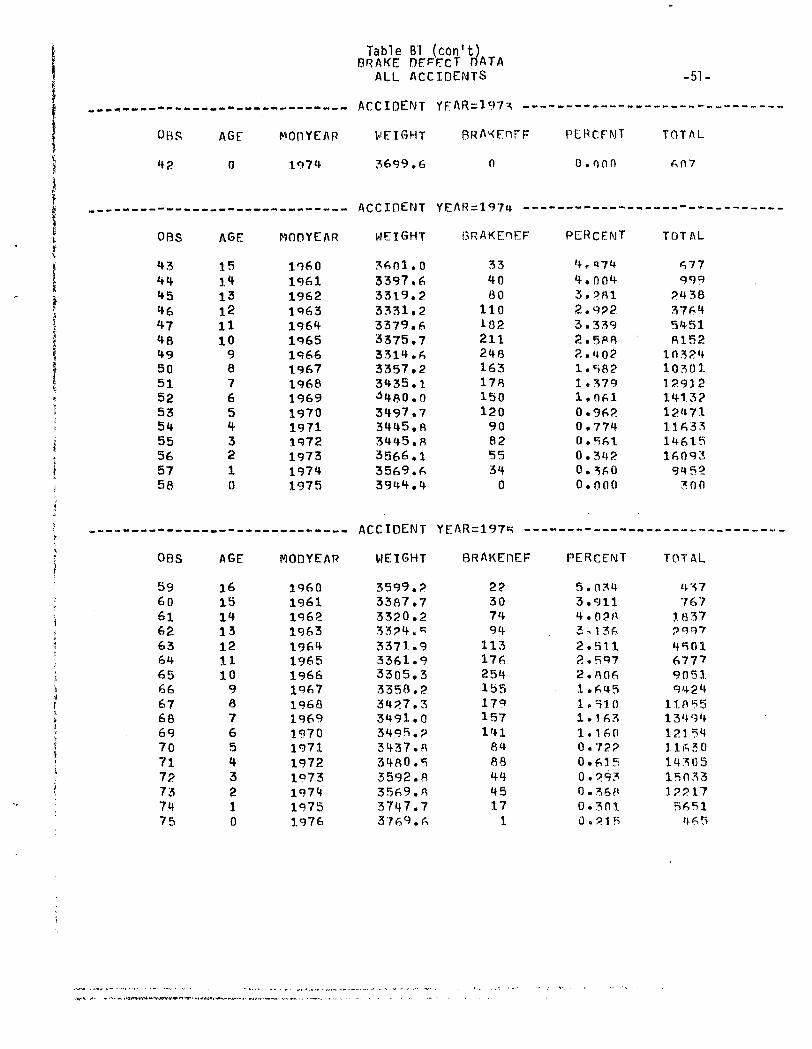
i
i
\
f
Ii.f"i
iii
|
r
?
c
•
\
fi,
\l}
I:!
OBS
42
OBS
43444546474849505152535455565758
OBS
5960616263646b6667686970717P737475
AGE
0
AGE
15it131211109876543210
AGE
161514131211109876543210
MODYEAR
1974
MODYEAR
1960196119621<?63196419651966196719681969197019711972197319741975
MODYEAR
19601961196219631964196519661967196819691970197119721973197419751976
Table BlBRAKF. DEP
con't)FCT DATA
ALL ACCIDENTS
ArrinENTnLL XUL'v 1
WEIGHT
3699.6
AfTTnFfJTM l^ L. J. 1J <— 1M 1
WEIGHT
3601.03397.63319.23331.23379.63375.73314.63357.23435.1^480.03497.73445.83445.83566.13569.63944.4
srrTnFMT
WEIGHT
3599.?3387,73320.23324.?3371.93361.93305.33358.23427.33491.03495.?3437.83480.53592.83569.8374 7.73769. r-,
YFAR = l97'J; ---
BRAKEHFF
0
ORAKEnEF
334080110182211248163178150120908255340
BRAKEnEF
22307494
113176254Ib517915714184884445171
PL'RCFMT
o. on o
PERCENT
4.«744.0 043.P812,9?23.3392,5882.M02l.Sfl?1.3791.0610.96?0.7740 .C5610.3420.3600.000
PERCENT
5.0343.9114.0383*1362.5112.5972.8061.645l.'-UO1.1.631.1600.7220.615O.?9?0.3680.3010 .21 R
-51-
TOTAL
607
TOTAL
6779992438376454518152103241030112912141.32124711163314615160939452300
TOTAL
U377671837?9 97
4501677790519424
118551349412154116 3 0143051503312217r>651465
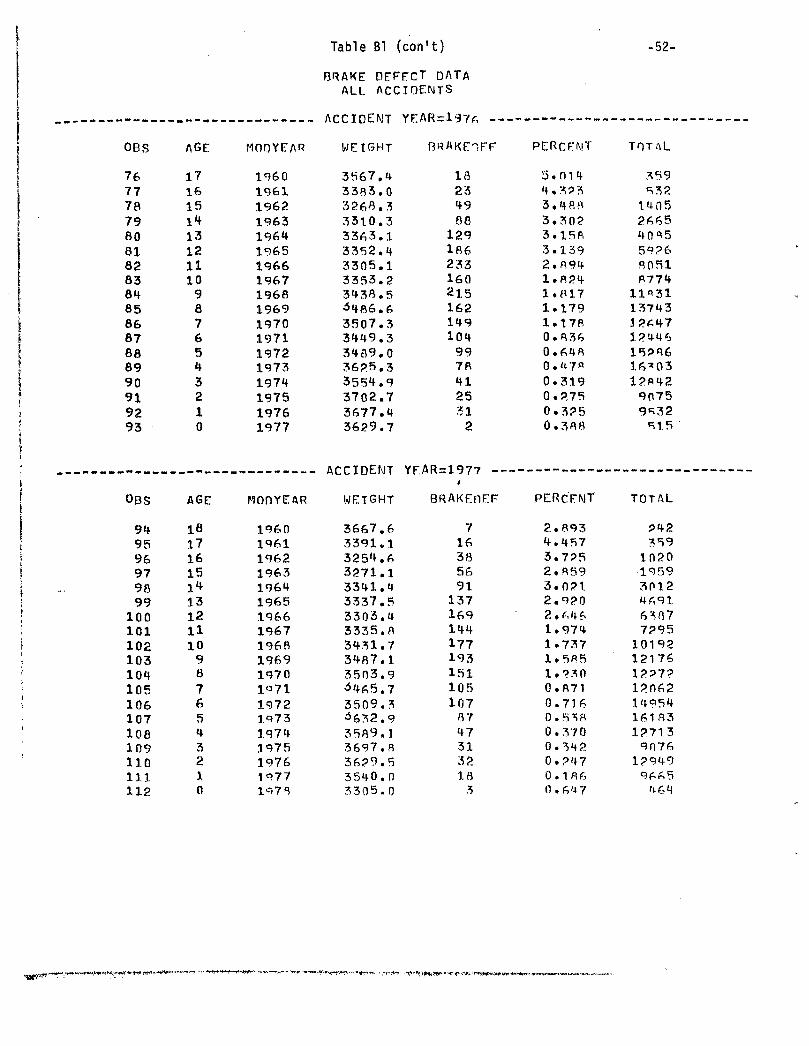
OBS
i 76
i 7778
1 ' 798081828384
f 85j 861 87I 88I 89
90! 91i 92! 93
IF|
| OBS
! 94I 95
96| 97
9899
! 100i 1011 102; 103
104\ 105J 106
107108109110111112
AGE
1716151*»131211109
a76543210
AGE
181716151*1312H109876543210
MODYEAR
196019611962196319641965196619671968196919701971197219731974197519761977
MODYEAR
196019611962196319641965196619671968196919701«711972197319741975197619 771978
Table Bl (con
BRAKE DEFECT
t)
DATAALL ACCIDENTS
ArrTnEMT YFA
WEIGHT
3567.43383.0326«.33310.33363.13352.43305.13353.23438.5^486.63507.33449.33439.03625.33554.93702.73677.43629.7
R-117c --
f3RAKE".FF
18234908
12918623316021516214910499784125312
arrtnFWT YFAf—IOII
WEIGHT
3667.63391.1325H.63271.13341.43337.53303.43335.83431.73487.13503.9^465.73509.3^632.93589.13697.83629.53540.03305.0
t
BRAKEnF.F
716385691
13716914417719315110510707473132IB3
PERCENT
5 , n 1 44.3233,4883,30?3.1583.1392.8941.8241.8171.1791.1780.8360.648O.U700.3190.2750.3250.388
PERCENT
2.8934.4573.7252.8593.021.2.9202.6461.9741.7371.585l.?300.8710.716
0.37 00.^420.2470.1860.6U7
-52-
TOT;\L
359532140526654 0^55«?680518774
11*311374312*471244 61528616*031284290759>=;3251.5
TOTAL
942359
10201959301246916S8.77295
101921217612?7?120621495416183127139076
1294996^5^64
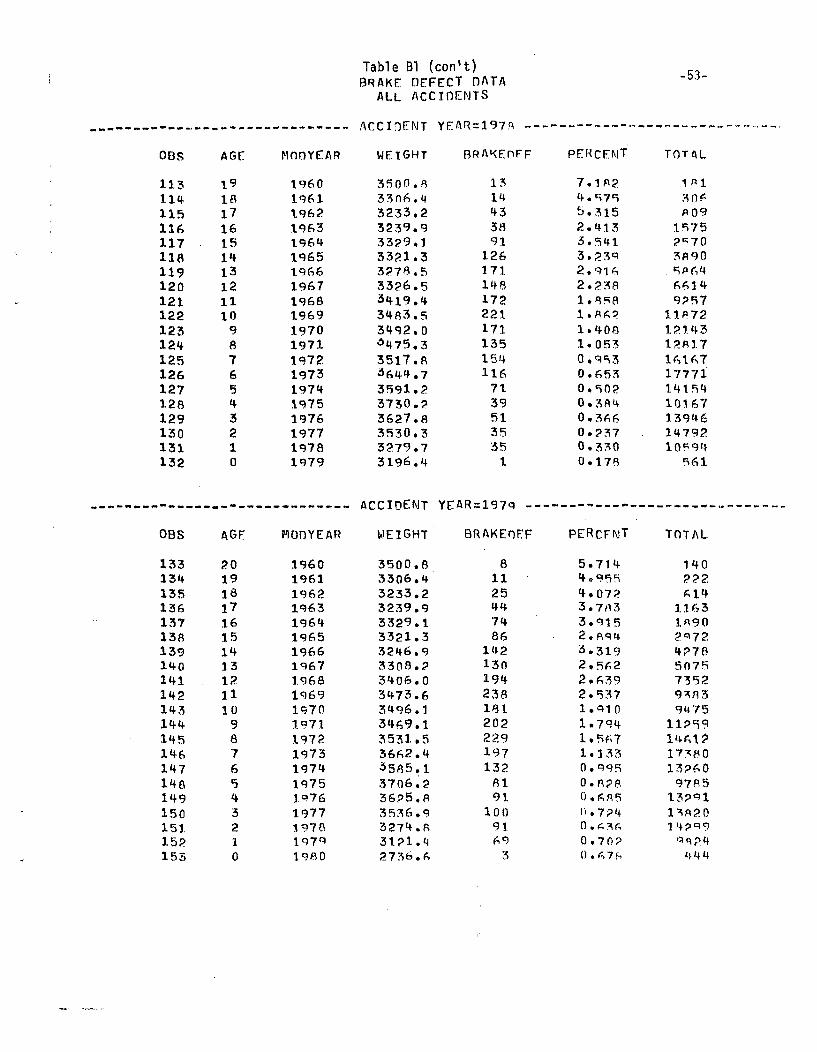
OBS
113114115116117118119120121122123124125126127128129130131132
OBS
133134135136137138139140141142143144145146147148149150151152153
AGE
191817161514131211109876543210
AGE
2019ia17161514131211109876543210
MOOYEAR
19601961196219631964196519661967196819691970197119721973197419751976197719781979
MOnYEAR
1960196119621963196419651966196719681969197019711972197319741975197619771978197O1980
Table Bl (con1BRAKE DEFECT
t)DATA
ALL ACCIDENTS
^rrnFiMT Y F A R ~ I 9 7 Q ___
WEIGHT
3500.833(16.(43233.23239.93329.13321.33278.53326.53419.43483.53492.0$475.33517.8$644. 73591.23730.?3627.fl3530.33279,73196.4
ArrTnFMT vrflW L U 1 U C t\J 1 T t "
WEIGHT
3500.83306.43233.23239.93329.13321.33246.93308.?3406.03473.63496.13469.13531.53662.43585.13706.236P5.83536.93274.fi31P1.42736.6
BRAKEnFF
1314433891
12617114817222117113515411671395135351
BRAKEOEF
81125447486
1421301942381812022291971328191
10091693
PERCENT
7.1fl24.<i755.3152.4133.541.3.2392.9162.2381.8581 .86?1.4081.0530,9530.6530.5020,3840.3660.P370,3300.178
PERCFtyT
5.7144*9554.07?3.7K33.9152.R9K.3.3192,5622.6392.5371.9101.7941,5671.1330.995O.ftPfl0.6fl5D.7P40 . fi 3 ft
0.70?0.67m
r o-bJ-
TOTAL
1813 0 6A09
1575?K7038905P6466149?57
11872121.4312R1716167177711415410167139461479210594
561
TOTAL
140??2614
1.163l«902«724P7B5075735293839475
11P591461?1738013?609785i3?<nl^flPOT4?q9
4 4 4
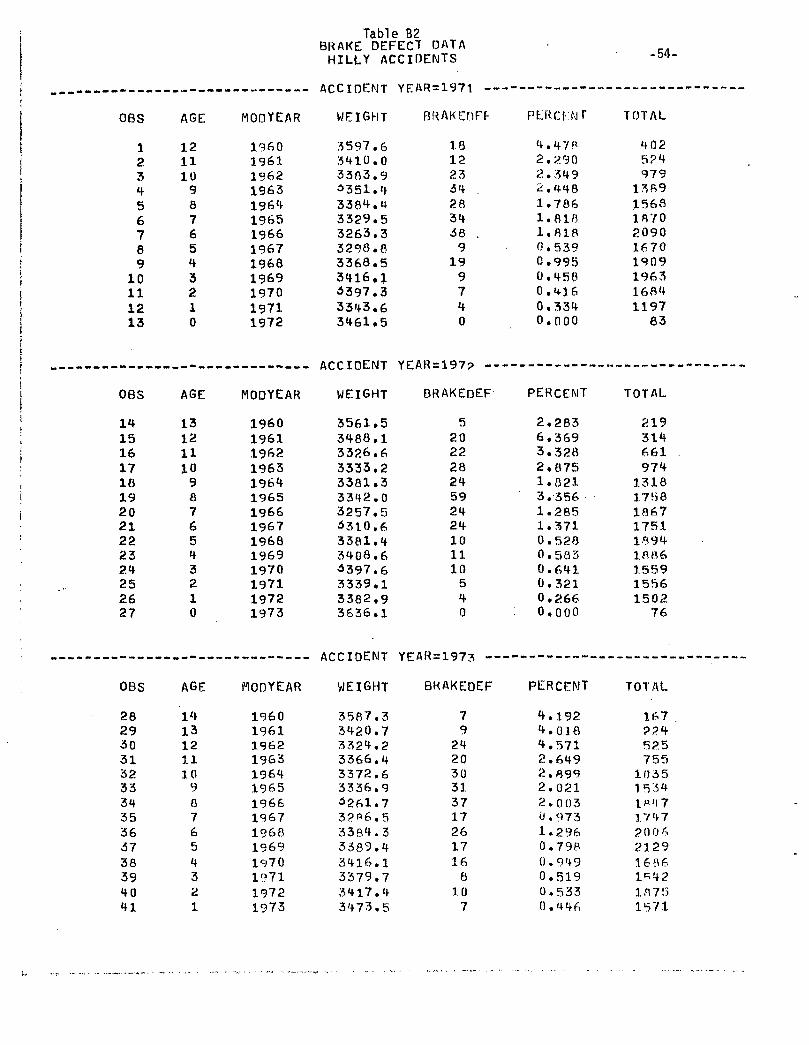
Table B2BRAKE DEFECT DATAHILLY ACCIDENTS
BS
1234567e910111213
AGE
1211109876543210
MOOYEAR
1960196119621963196419651966196719681969197019711972
WEIGHT
3597.63410.03303.93351.43384.«+3329.53263.33298.03368.53416.14397.33343.63461.5
ACCIDENT YEAR=1971 -•
BRAKEOFF
181223342834369199740
PERCENT
4.47«
2.3492.4481.7861.81ft1.8180.5390.9950.4580,4160,334O.GOO
-54-
TOTAL
402
97913B915681870209016701909196316841197
83
ACCIOENT YEAR=197?
OBS
1415161710192021222324252627
AGE
131211109876543210
MODYEAR
19601961196219631964196519661967196819691970197119721973
WEIGHT
3561.53488.13326.63333.23381.33342.03257,54310.63381.43408.64397.63339.13382.93636.1
BRAKEDEF
520222824592424101110540
PERCENT
2.2836.3693.3282.8751.8213.3561.2851.3710.5280.5830.6410.3210.2660.000
TOTAL
219314661974131817H81867175118941886155915561502
76
ACCIOENT YEAR=1973
OBS
2829303132333435363738394041
AGE
1413121110987654321
MODYEAR
19601961196219631964196519661967196819691970197119721973
WEIGHT
3587.33420.73324.23366.43372.63336.94961.73?«6.53384.33389.43416.13379.73417.43473.5
BKAKEDEF
79
2420303137172617168107
PERCENT
4.1924.0184.5712.6492.8992.0212.0 030.9731.2960.7980.9490.5190.5330.446
TOTAL
167??4525755
10351534IPH73.747POO 6212916861*4218751571
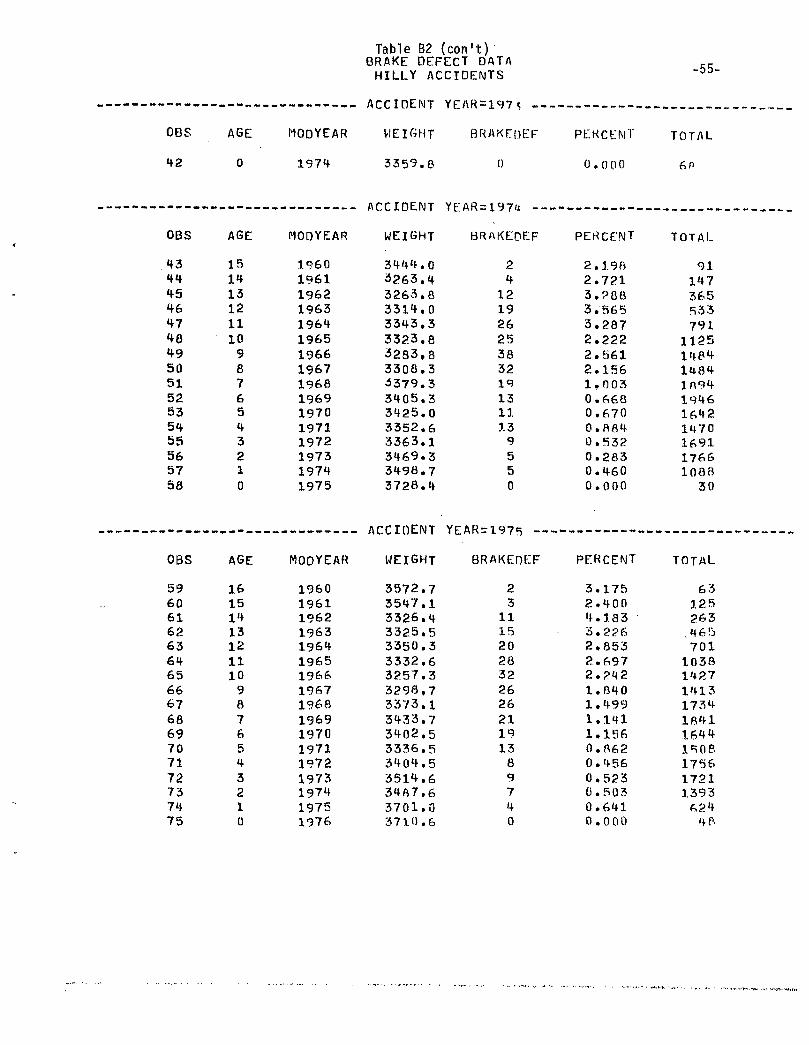
Table B2 (con't)BRAKE DEFECT DATAHILLY ACCIDEWTS -55-
OBS
42
OBS
43444546474849505152535455565758
OBS
5960616263646566676669707172737475
AGE
0
AGE
1514131211109876543210
AGE
161514131211109876543210
MODYEAR
1974
MODYEAR
1960196119621963196419651966196719681969197019711972197319741975
MODYEAR
I9601961196219631964196519661967196819691970197119721973197419751976
ACCIDENT
HEIGHT
3359.8
ACCIDENT" \* V A l*J *•*• IW f
WEIGHT
3444.03263.^3263.83314.03343.33323.83293,83308.3•5379.33405.33425.03352.63363.13469.33498,73728.4
ArrinENTM IJ w *• w 1L— "* 1
WEIGHT
3572.73547.13326.43325.53350.33332.63257.33298,73373.13433.73402.53336.53404.53514.63487.63701.03710,6
YEAR=197} --
BRAKFJDEF
0
BRAKEDF.F
24121926253832191311139550
BRAKEOEF
23
1115202832262621191389740
PERCENT
0.000
PERCENT
2.19ft2.7213,?883.5653.2872.2222,5612.1561,0 030.6680.6700.8840.5320.2830.4600.000
PERCENT
3.1752.4004.1833.??62,8532.6972.P421.8401.4991.1111.1560.8620.4560.5230.5030.6410.000
TOTAL
6fl
TOTAL
9114736553379.1112514841484Ift9419461642147016911766108 8
30
TOTAL
63125263(t 6 •}701103814271413173418411644iscie17561721139362448
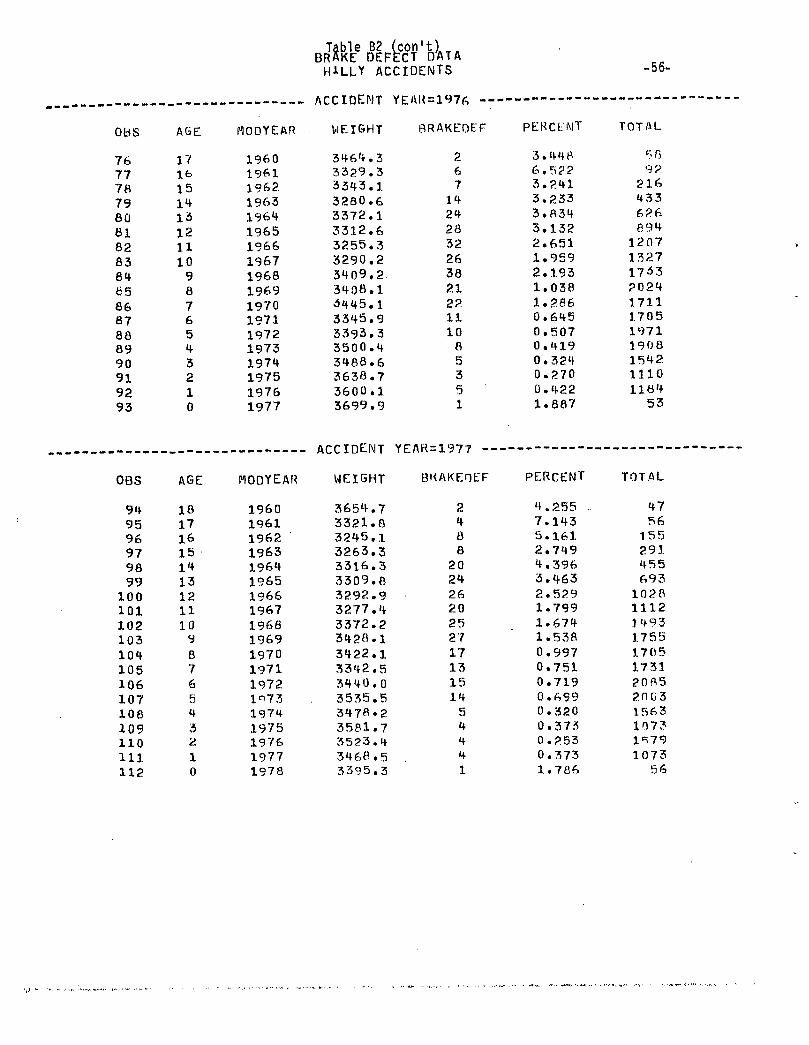
OBS
767778798081828384858687888990919293
OBS
949596979899100101102103104105106107108109110111112
AGE
17161514131211109876543210
AGE
1817161514131211109876543ii10
MOOYEAR
196019611962196319641965196619671968196919701971197219731974197519761977
MODYEAR
19601961196219631964196519661967196619691970197119721«7319741975197619771978
Table B2 (cBRAKE DEFEiHILLY ACCIDENTS
ACCIDENT YFAU=1 **"Tf. ---
WEIGHT
3464.3329.3343.3280.3372.3312.3255.3290.3409,3408.3445.3345.3393.3500.3488.3638.3600.3699.
flrr TnEi\
33161632• 2.,119,3,4.6,7.1
RRAKEOEF
267
142428322638212211108535
,9 1
WEIGHT
3654,3321.3245,3263,3316,3309,3292,3277,3372,3428,3422334234403535347«3581352334683395
.7
.8,1.3.3.8.9.4.2
r-l*
.1
.5
.0
.5• 2.7.4.5.3
BKAKEOEF
2488
2024262025271713151454441
PERCENT
3.6.3.3.3.3.2.1.2.1.1.0.0.0.0.0.0.1.
44 B522241233R34132651959193038286645507419,324.270.422.887
PERCENT
4,7,5,2,4,32111000000001
.255 ..
.143
.161
.749
.396
.463
.529
.799
.674
.538
.997
.751
.719
.699
.320
.373
.253
.373
.766
-56-
TOTAL
'>n92
2164336266941207132717332024171117051971190815421110118453
TOTAL
4756
15529145569310281112349317551705173120*520 0 31563107?1C5791073
56
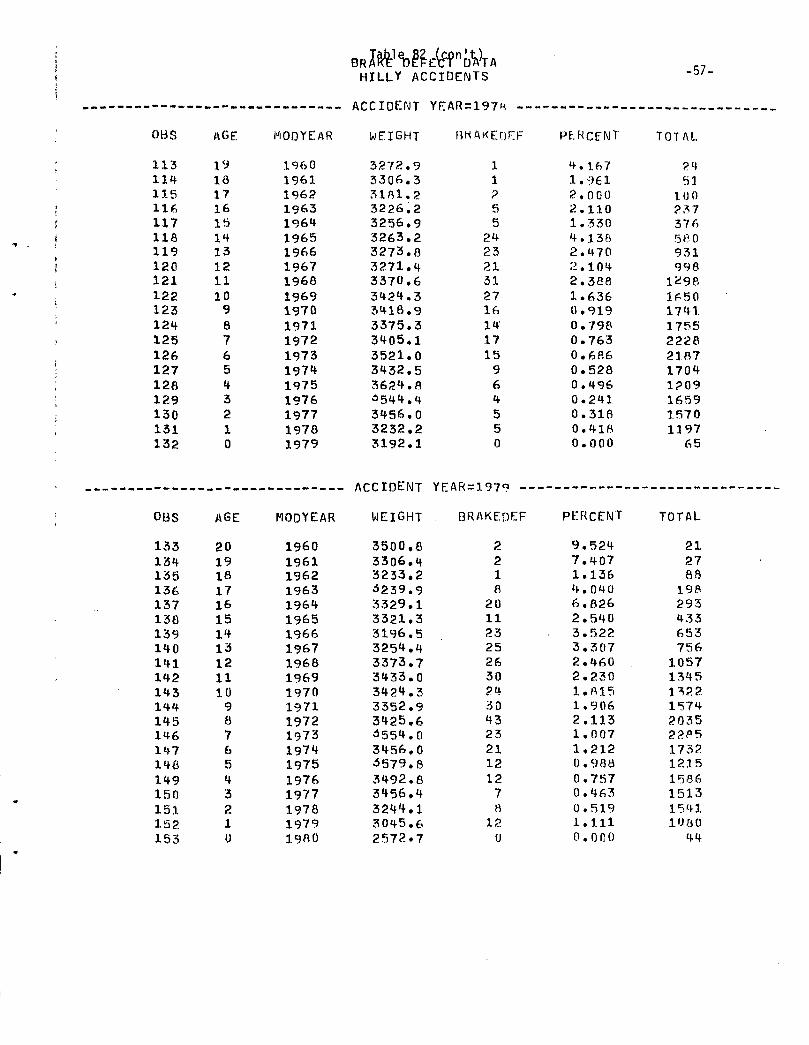
OBS
113114115116117118119120121122123124125126127128129130131132
OBS
133134135136137138139140141142143144145146147148149150151152153
AGE
191817161514131211109676543210
AGE
20191817161514131211109876543210
MODYEAR
19601961196219631964196519661967196819691970197119721973197419751976197719781979
MODYEAR
196019611962196319641965196619671968196919701971197219731974197519761977197819791980
HILLY ACCIDENTS
AfT TnFWTH V v A iJ I- IV |
WEIGHT
3272.93306.33181.23226.23256.93263.23273.83271.43370.63424.33416.93375.33405.13521.03432.53624.8^544.43456.03232,23192.1
Apr TnEWTt\ w V- JL U 1 - IN 1
WEIGHT
3500,83306,43233,23239.g3329.13321.33196.5325^.43373.73433.03424.33352.93425.63554.03456,03579.83492.83456.43244,13045.62572.7
HKAKEOEF
1
r-i
?55
242321312716141715964550
BRAKEOEF
2218
201123252630243043232112127tt
120
PERCENT
4.1.2.2.1,4.2.2.2.1.0.0.0.0,0.0.0.0.0.0.
167961000110•530136470104388636919798763686528496241318418000
PERCENT
9.7.1,4.6.2.3.3.2.2.1.1,2.1.1,0.0.0.0.1.0.
524407136040826540522307460230815906113007212988757463519111
ooo
- J/ -
TOTAL
2451
10023737658 0931998
129816501741.1755222821871704l?09165915701197
65
TOTAL
212788
19P293433653756
105713451^2 21574203522fl5173212151586151315411080
44
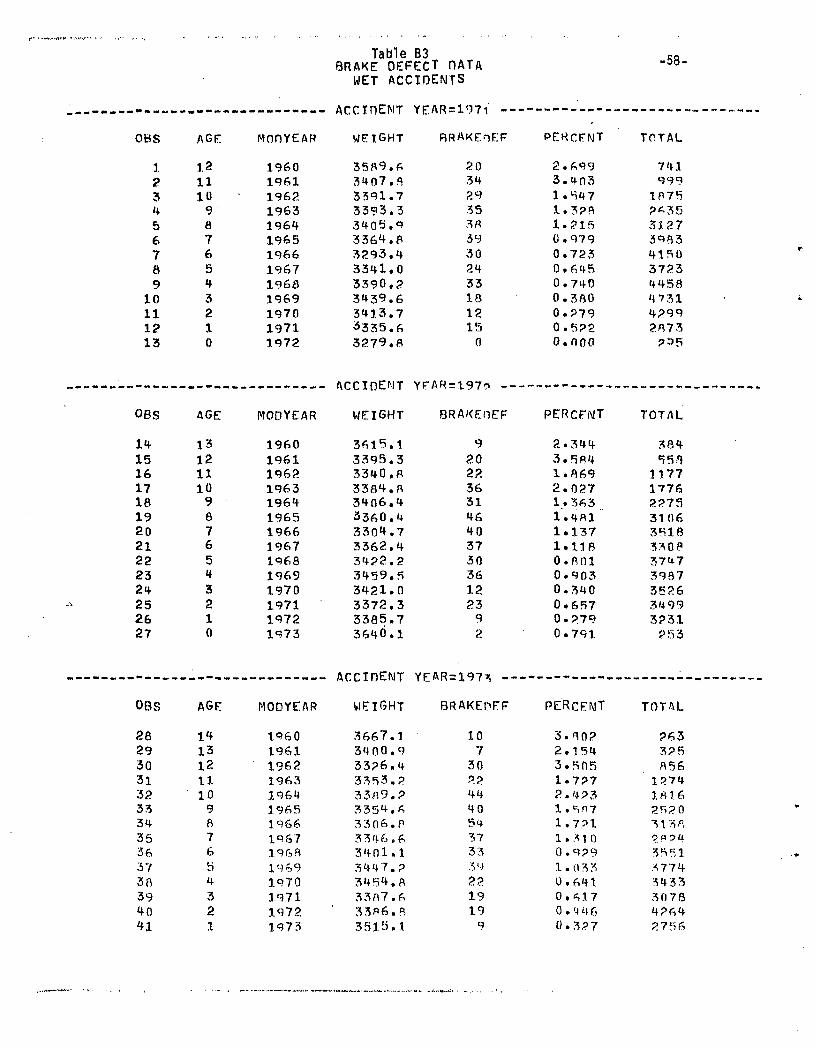
OBS
123
5678910111213
OBS
1415161718192021222324252627
OBS
282930313233343536373fl394041
AGE
1.211109
a76543210
AGE
131211109876543210
AGE
141312IX1.09ft76b4321
MOHYEAR
1960196119621963196419651966196719681969197019711972
MODYEAR
19601961196219631964196519661967196819691970197119721973
MODYEAR
1.9601961196219631964196519661967196819691970197119721973
Table B3BRAKE DEFECT DATA
WET ACCIDENTS
Apr TnEMT
WEIGHT
3589.63407.fl3591.73393.33405.93364.83293.43341.03390.23439.63413.73335.63279.8
ArrTnFNT
WEIGHT
3615.13395.33340.83384.83406.43360.43304.73362.43422.23459.53421.03372.33385.73640.1
flrr TnEMTH L. \J J- U *— '*' 1
WEIGHT
3667.13400.93326.43353.?33A9.?3354.63306.P3346.63401.13447.?3454.a3387.63 3*6.83515.1
RRAKEOEF
2034293538393024331812150
BRAKEHEF
9202236314640373036122392
BRAKEHEF
10730?.?.4440Su3733yi2219199
PERCENT
2.6993.4031.5471.3281.2150.9790.7230.6450.7400.3800.?790.5?20.000
PERCFNT
2.3443.5841.8692.0271.3631.4S11.1371.1180.8010.9030.3400.6570.9790.791
PERCENT
3.R022.1543.5051.7272.4P31.5n71.7?11 . A1 00 . C1?91.(1330.6410.6170.44 f>0.3?7
-58-
TOTAL
741999
1875?63533.273983415037234458473142992873?t>5
TOTAL
38455fl
117717762?75310635183*0 837U-73987352634993231?53
TOTAL
2633?5856
1374181.62^2 0313 8•3 0 ?It
3551.477434 3330784?642756
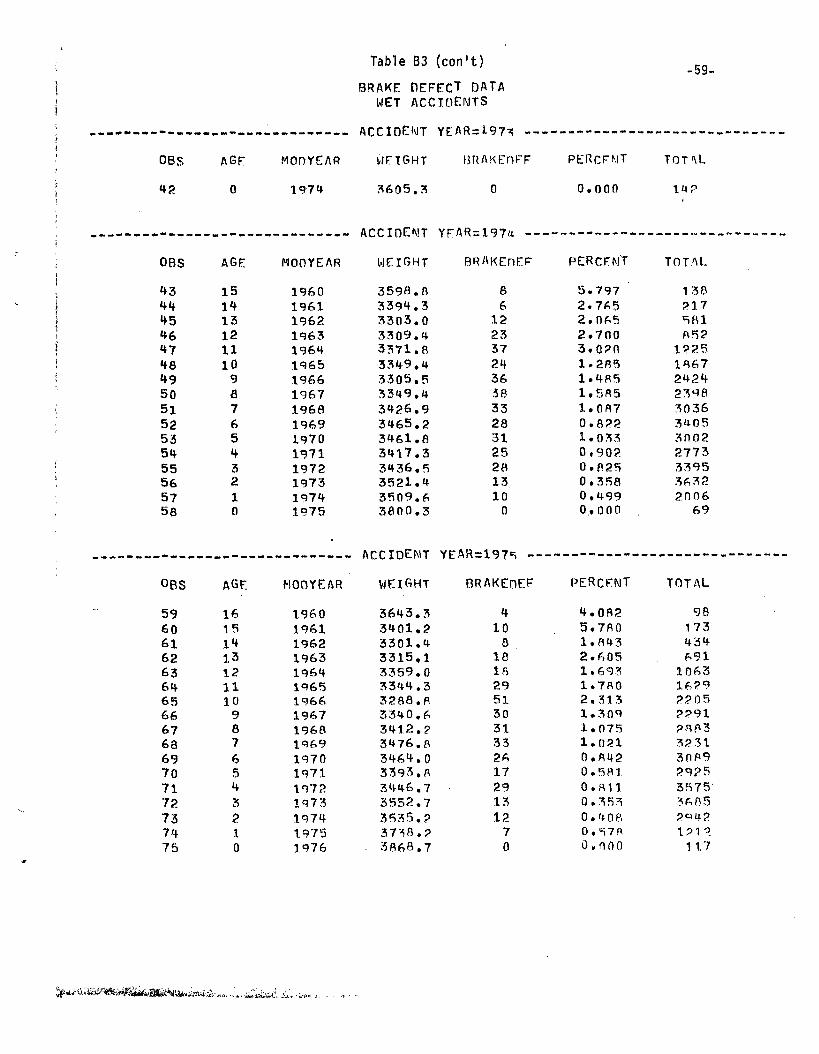
Table B3 (con't)
BRAKE CIEFECT DATAWET ACCIDENTS
-59-
OBS
42
OBS
43444546474849505152535455565758
OBS
5960616263646566676869707172737475
AGE
0
AGE
1514131211109
a76543210
AGE
161514131211109876543210
MODYEAR
1974
MODYEAR
1960196119621963196419651966196719681969197019711972197319741975
•
MOOYEAR
19601961196219631964196519661967196819691970197119721973197419751976
ACCIDENT
WFTGHT
3605.3
Arr TnFMTr\ L# v» J. U •-• "1 1
WEIGHT
3598.83394.33303.03309.43371.83349.43305.53349.43426,93465,23461.83417.33436.53521.43509.63800.3
ArpTnTMTf\ L, L X U u-1" 1
WEIGHT
3643.33401.23301.43315,13359.033U4.3328S.R3340.63412.?3476.83464.03393.83446.73552.73535.?37*8.?3868.7
YEAR=197^
BRAKEnFF
0
YF*AR-197u __
BRAKEnEF
86
122337243638332831252813100
YfSR-1 C1"7E:
BRAKEDEF
410Q
18182951303133261729131270
PERCFMT
0.000
PERCENT
5.7972.7652.0652,7003.0201.2851.4851.5851.0870.8221.0 330,9020.8250.3580.4990,000
PERCENT
4.0825.7801.8432.6051.6931.7802.3131.3091.0751.0210.8420.3810.8110.3530.' 10 a0.S780.000
TOTM.
14?
TOTAL
13821758185?
12251867242423^83036310 530 022773339536 322006
69
TOTAL
98173434691
1063162922 05??91?88332 313089?9?53R75'3^852Q421 P1 '?.117
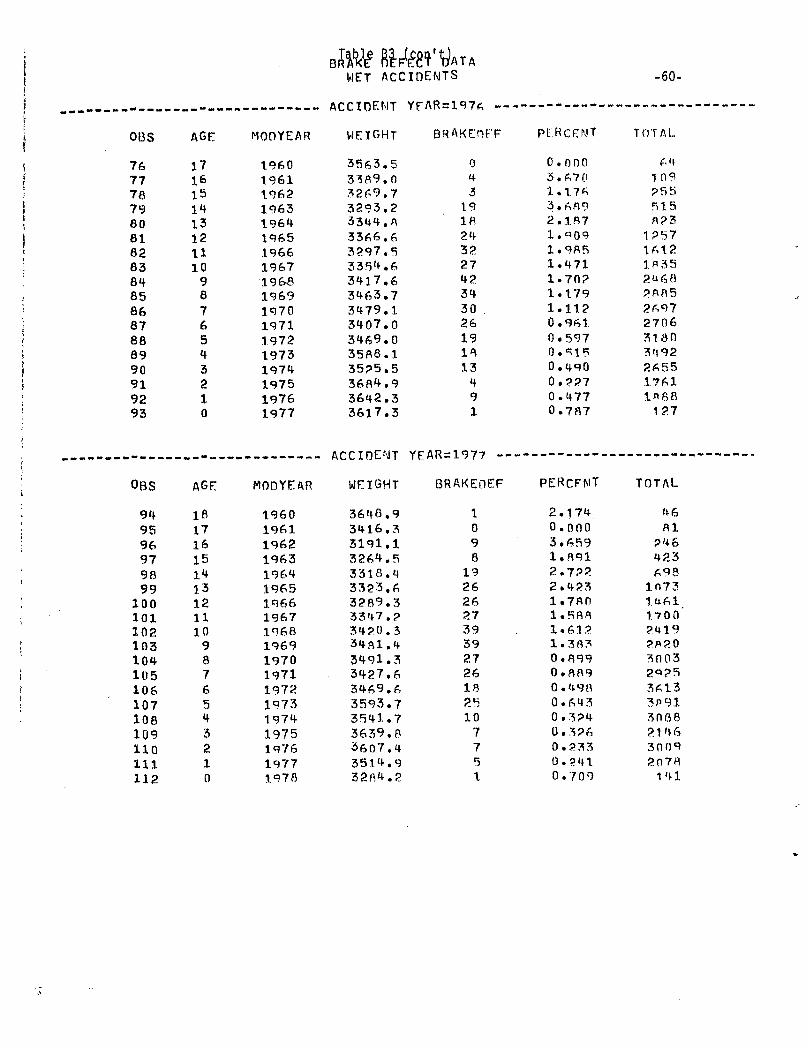
ODS
767778798081828384858687888990919293
AGE
17161514131211109876543210
MODYEAR
19601961196219631964196519661967196-8196919701971197219731974197519761977
WEIGHT
3563.53389.03269.73293,23344. P,3366.63297.5335^.63417.63463.73479.13407.03469.03588.13525.53684.g3642.33617.3
WET ACCIDENTS
ACCIDENT YFAR=1976 —
BRAKEOFF
04319lfl24322742343026191813491
-60-
PERCENT
0.0003.67 01.1763.6A92.1871.0091.9851.4711.70?1.1791.1120.9610.597
0.4^00.2270.4770.787
TOTAL.
641 119255515
1?571612IP 35
2885269727063180349226551761
127
DBS
949596979899
100101102103104105106107108109110111112
AGE
1817161514131211109876543210
MODYEAR
19601961196219631964196519661967196819691970197119721^73197419751^7619771978
WEIGHT
3648,93416. 7,3191.13264.53318.43323.63289.33347.?3420.334JU.43491.33427.63469.63593.73541.73639.83607.43514,g32R4.2
ACCIDENT YEAR=1977 -•
BRAKEOEF
109819262627393927261825107751
PERCFMT
2031221111000000000
.174
.000
.659• fl^l.722.423• 780.5fiA.61?.38?.899.889.49H.643.324.326.233.541.700
TOTAL
4681
246423698
1073lu.611700?A132*2030032«*2536133P9.I.306821463009207ft141
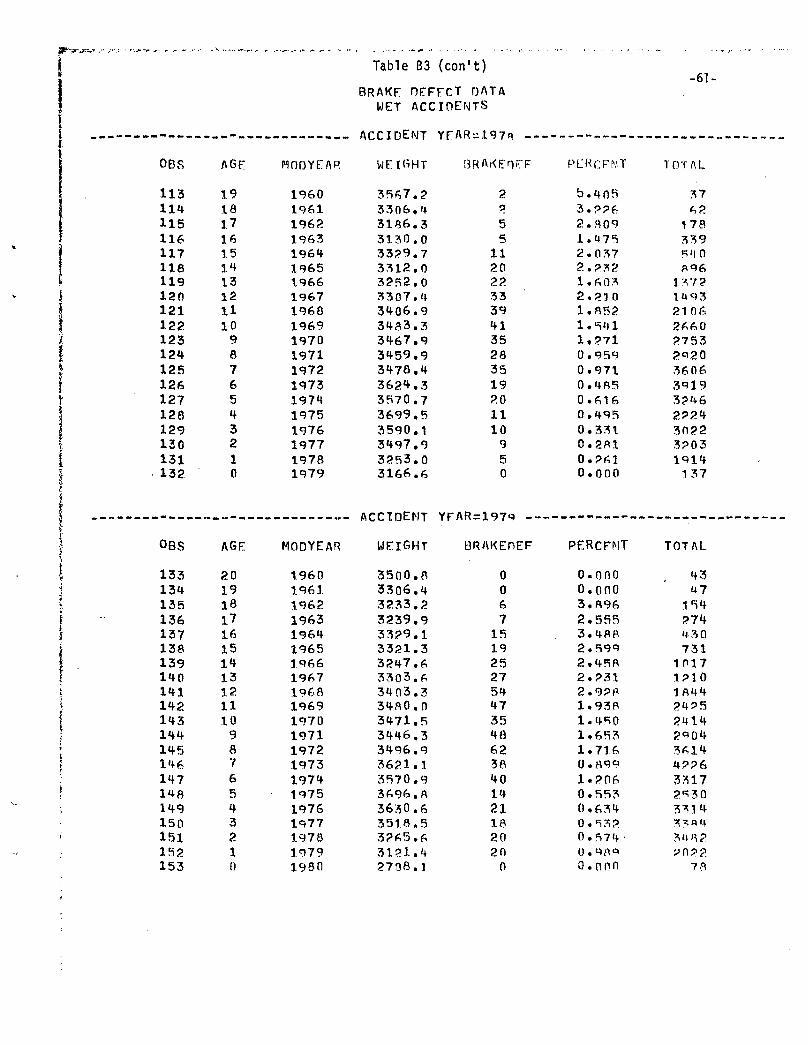
r r j v •-- .•--••• ---v™ *• - - -
OBS
113114115116117118
> 119\ 120\ 121I 122I 123[ 124I 125i 126f 127
1 128f 129[ 130[ 131? • 1 3 2 •
| OBS
\ 1331 134( 135[ 136f 137\ 138f . 139\ 140j 1«U
142i 143[ 144} 145' 146I 1H7f 14«, 149
150151152153
AGE
191817161514131211109876543210
AGE
201918171615If13121110987654321[)
MODYEAR
19601961196219631964196519661967196819691970197119721973197419751976197719781979
MODYEAR
196019611962196319641965196619671968196919701971197219731974197519761977197819791980
Table B3 (con't)
BRAKF DFFFCT DATAWET ACCIDENTS
Apr xnEMT
WEIGHT
3567.23306.43186.33130.03329.73312.03252.03307.43406.93483.33467.93459.93478.43624.33570.73699.53590.13497.93253.03166.6
ArTTnFMT^LLlUull I
WEIGHT
3500.83306.43233.23239.93329.13321.33247.63303.63403.33480.03471.53446,33496.93621.13570.93696.83630.63518.53265.63121.42708.1
YFAR-197n ---
SRAKEnTF
29
5511202233394135283519201110950
BRAKEPEF
0067151925275447354862384014211820200
PLRCFNT
b.4053.??f2.8091.4752.0372.?321.6 032.2101.8521.5411,?710.9590.9710.4850.6160.4950.3310.2fll0.2610.000
PERCFMT
o.onoo.ono3.8962.5553.4flB2.5992.4582.2312.9P81.9381.4501.6531.7160.8991.2060.5530.634O.ti320.574
o, o n n
-O 1 -
TOTAL
3762
17833954 0A96
13721^93210 6266027532«2036 0639193?46222430223?031<U4137
TOTAL
4347154274430731
1P171210184 424?52414290436144??633172^3033143 3 « 43»8??0?£
7 8
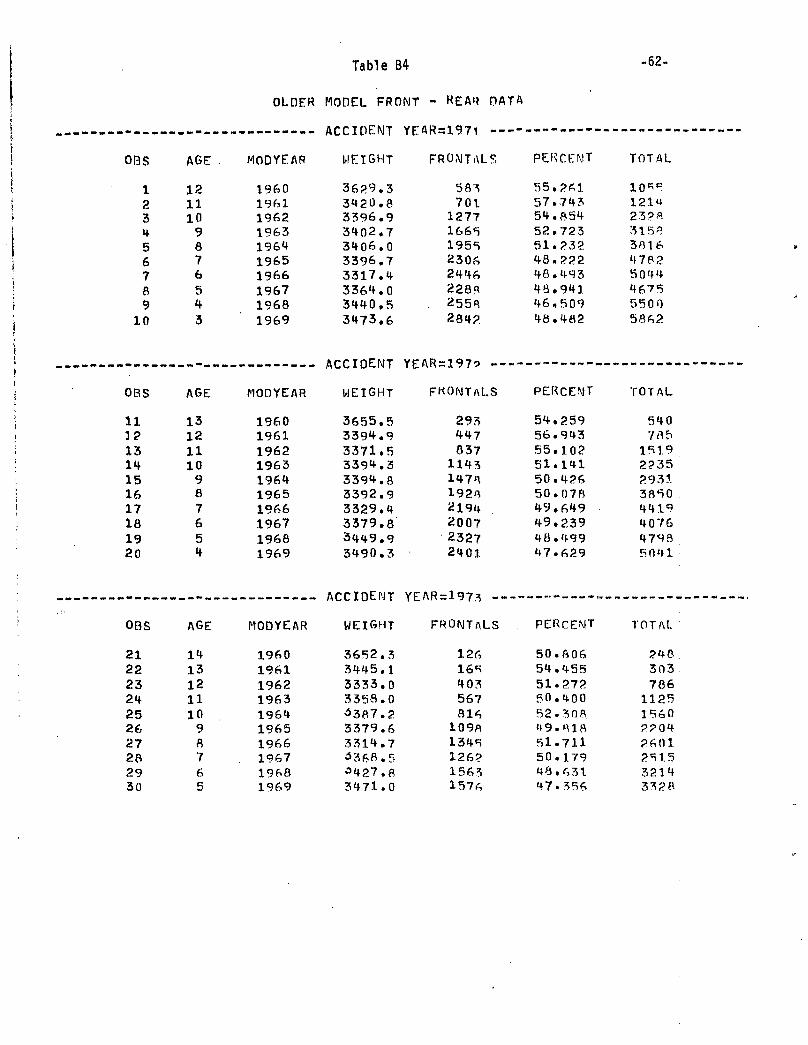
Table B4 -62-
OLDER MODEL FRONT - REA'* DATA
BS
12345678910
AGE
12111098765
3
MODYEAR
I960196119621963196419651966196719681969
HEIGHT
3629.33420.83396.93402.73406.03396.73317.43364.03440.53473.6
OBS
11121314151617181920
AGE
13121110987654
1960196119621963196419651966196719681969
ACCIDENT YEAR=197i -•
FRONTAL?,
583701
127716651955230624462288255ft284?
ACCIDENT YEAR=197? -•
MODYEAR WEIGHT FKONTALS
3655.53394.93371.53394.33394.83392.93329.43379.83449.93490.3
29344783711431478
2194200723272401
PERCENT
55,26157.74?54.85452.72351.23248.?. 2 246.49348.94146,50948.482
TOT.A
10^*121«23?*31583816478,?5044467555005862
PERCENT
54.25956.94355.10251.14150.42650.07849.64949.2394B.49947.629
TOTAL
54078 5
15192?35293138504419407647^85041
OBS
21222324252627282930
AGE
141312111098765
MODYEAR
1960196119621963196419651966
. 196719681969
WEIGHT
3652.33445.13333.03358.0^387.23379.63314.7<*368.5a427.83471.0
ACCIDENT YEAR=1973 -•
FRONTALS
126
403567
109ft134S126?
PERCENT
50.80654.45551.27250.40052.3(18.49.81851.71150.17948.r, 3147.356
TOTAL
24 83(13786
11251560?.?Q42601251.532143^28
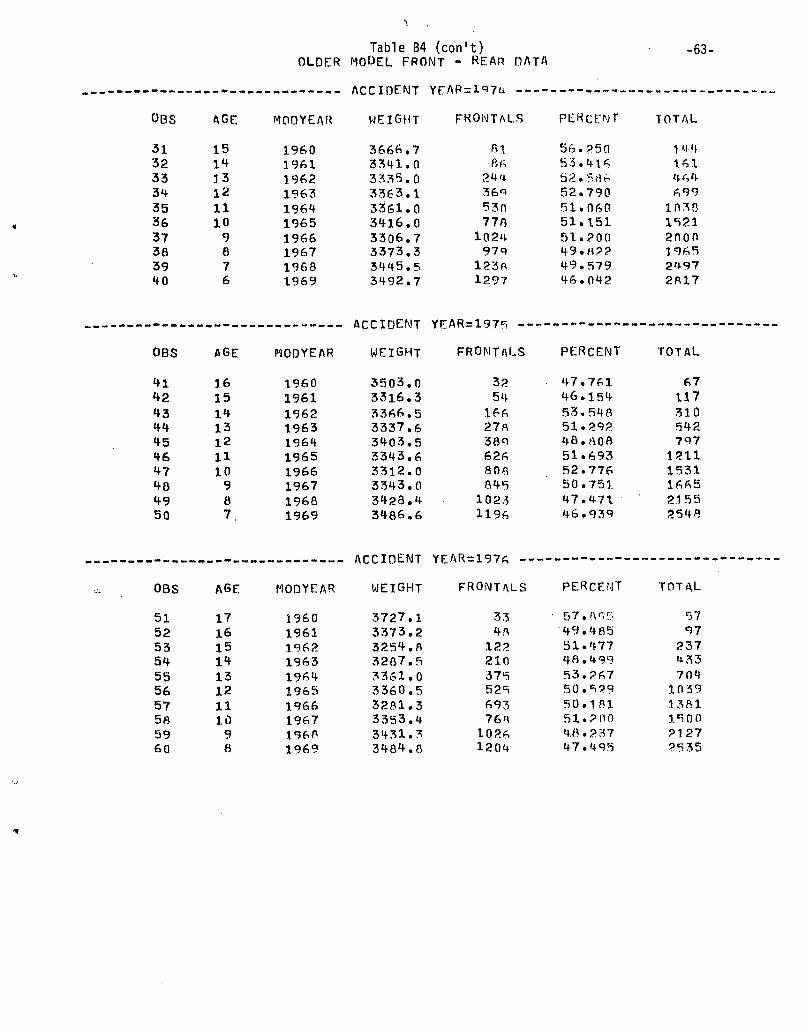
OBS AGE;
313233343536373839HO
15It.131211109676
Table B4 (con't)OLDER MOOEL FRONT - REAR DATA
-63-
ACCIDENT YEAR=l97a -•
MOOYEAR WEIGHT FKONTALS
1960196119621963196419651966196719681969
3666.73341.03335.03363.13361.03416.03306.73373.33415.53492.7
8186
24'*
53(1778
1024
123ft1297
56.?5053.41652.5rt~52.79051.06051.15151.20049.M2249.57946.042
TOTAL
1 441.61
6991038
2000196524972817
OBS
424344454647484950
AGE
16151413121110987
MODYEAR
1960196119621963196419651966196719681969
ACCIDENT
WEIGHT
3503.03316.33366.53337.63403.53343.63312.03343.03428.43486.6
FRONTALS
325416627838962680884510231196
PERCENT
47.76146.15453.54851.29248.80851.69352.77650.75147.47146.939
TOTAL
671173105427971211153.1166521552548
OBS
51525354555657585960
AGE
171615141312111098
MODYEAR
1960196119621963196419651966196719681969
WEIGHT
3727.13373,23254.83287.53361.03360.53281.33353.43431.33484.0
ACCIDENT YEAR=1976 -•
FRONTALS
334ft122210375525693
PERCENT
49,48551.47748.49953,267
10261204
50,18151.2004.8.23747.495
TOTAL
5797237^3 37 041039138115 0 021272535
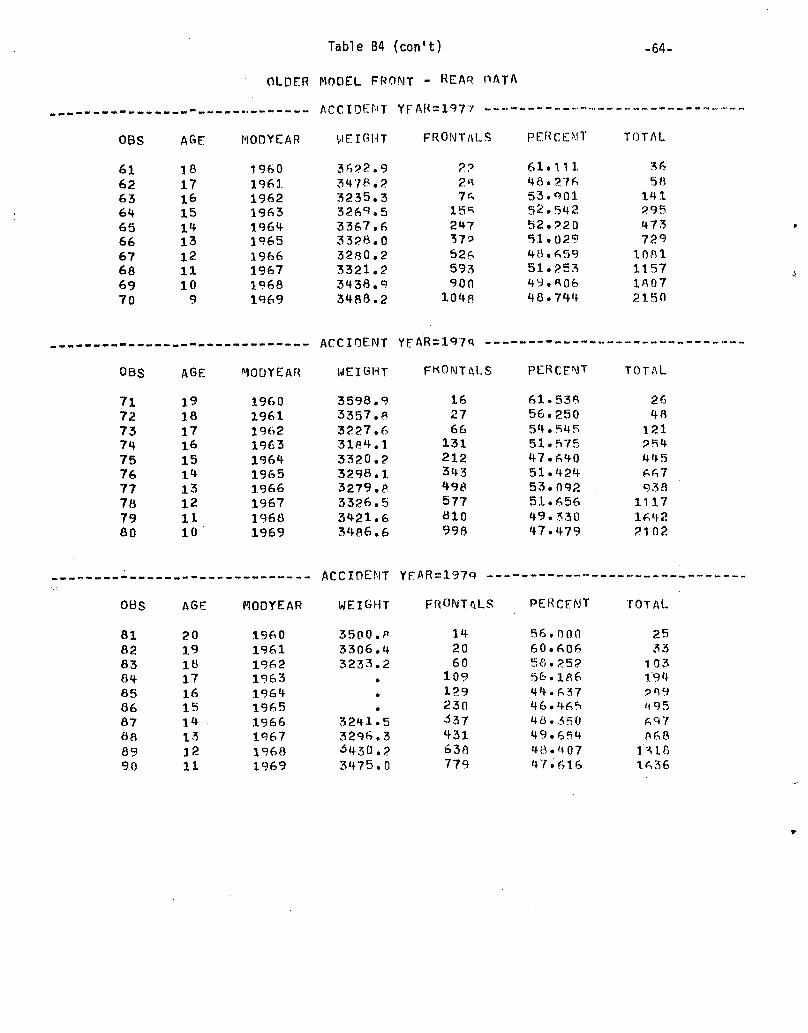
Table B4 (con't) -64-
OBS AGE
61626364656667686970
1817161514131211109
OLDER MODEL PROMT - REAR
ACCIDENT YFAK = 1977 -
MOOYEAR HEIGHT FRONTALS
1960196119621963196419651966196719681969
36?2.93478.23235.3326*5.53367.63328.03280.23321.23438.93488.2
247
526593900104B
PERCENT
61.11148.27653.^Ol52.54252.22051.02948.65951.2S349.^0648.744
TOTAL
365 ft
1.41295473729loai1157
2150
OBS
71727374757677787980
AGE
191817161514135121110
MODYEAR
1960196119621963196419651966196719681969
WEIGHT
3598.93357.fl3227.63184.13320.23298.13279.83326.53421.63486.6
ACCIQENT YFAR=197* -•
F«ONTi\LS
162766131212343496577
996
PERCENT
61.53956.25054.54551.57547.64051.42453.09251.65649.33047.479
TOTAL
2648121
445667
111716422102
OBS AGE
818283648566878fl8990
20191817161514131211
ACCIDENT YFAR=l97q -•
MOOYEAR WEIGHT FRONT<\LS
1960196119621963196419651966196719681969
3500.P3306.43233.2
3241.53296.3^450.23475.0
142060109129230437431
PERCFNT
56,00060.6065S.25?
44.63746.465
779
49.65448.4 0747.616
TOTAL
25331031.94
95