Embed Size (px)
Citation preview

STATISTICAL DISTRIBUTION PATTERNS OF PARTICLE
SIZE AND SHAPE IN THE GEORGIA KAOLINS
by
ROBERT F. CONLEY
Georgia Kaolin Research Laboratories, Elizabeth, New Jersey
A B S T R A C T
HIGH resolution electron mierographic techniques have been employed for surveying the size and shape distributions of kaolinite particles, both plates and stacks, from well- crystallized Georgia deposits.
Both size and shape follow typical, positively-skewed, frequency distributions. Particle thicknesses among plates appear quantized, dominantly as hoxalaminae and subordi- nately as trilaminae of the basic c-axis dimension in the unit cell. Specimens subjected to severe shear and attrition show intermediate values of thickness, i.e. 3~ ~ 1 and 3n + 2. Profile studies on kaolinite stacks reval integral platelet units whose distribu- tion in thickness corresponds to that of individual plates.
Energy calculations for fracture (cleavage ]1 to c-axis) and delamination (cleavage .[c-axis) processes indicate that hydrokinotic cleavage in nature should result in par- ticles having an aspect ratio distribution peaking near 6 : 1. The dominance of stacks above 10/~ is suggestive of in situ weathering. Experimental shear measurements corre- late well with these proposals.
Sedimentation studies with clays of various shapes and distributions were performed in a variety of aqueous media, including sea water. Sediment volume data, microscopic observations, and theoretical packing calculations are compared with the several mechanisms proposed for plate-stack genesis.
I N T R O D U C T I O N
PARTICLE size and particle shape distribution within a material are influential factors in the physical properties of products made from that material. Considerable effort is expended in industry to control and reproduce distri- bution of size and shape, thereby attaining advantageous mechanical and optical properties.
Kaolins are frequently described as fine, plate-shaped particles with an aspect ratio of about 10 : 1. This description is qualitative at best and the fact that size and shape vary considerably is well recognized. The present work represents a portion of a study devoted to ascertaining more quantitatively the range of size and shape in naturally occurring kaolin deposits.
317
318 FOURTEENTH NATIONAL CONFERENCE ON CLAYS AND CLAY MINERALS
E X P E R I M E N T A L
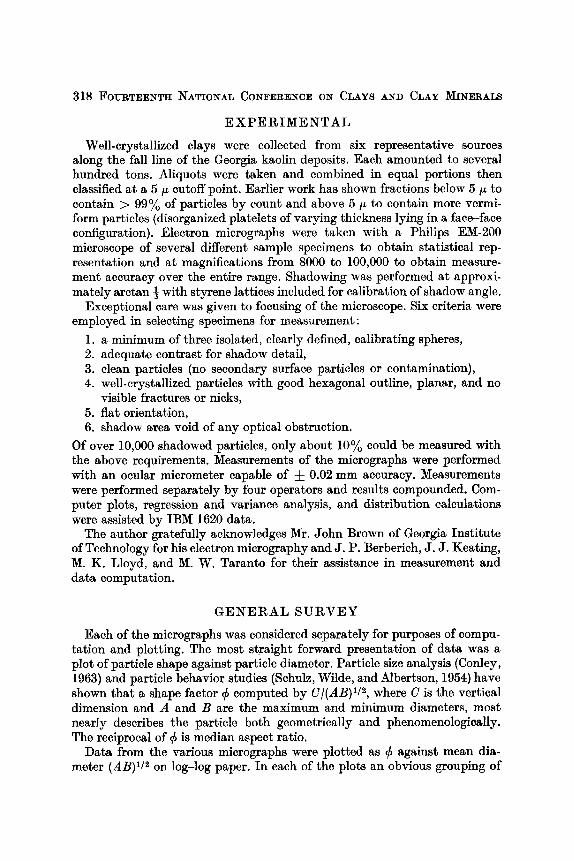
Well-crystallized clays were collected from six representative sources along the fall line of the Georgia kaolin deposits. Each amounted to several hundred tons. Aliquots were taken and combined in equal portions then classified at a 5/~ cutoff point. Earlier work has shown fractions below 5/z to contain > 99 ~/o of particles by count and above 5 ~ to contain more vermi- form particles (disorganized platelets of varying thickness lying in a face-face configuration). Electron micrographs were taken with a Philips EM-200 microscope of several different sample specimens to obtain statistical rep- resentation and at magnifications from 8000 to 100,000 to obtain measure- ment accuracy over the entire range. Shadowing was performed at approxi- mately arctan ~ with styrene lattices included for calibration of shadow angle.
Exceptional care was given to focusing of the microscope. Six criteria were employed in selecting specimens for measurement:
1. a minimum of three isolated, clearly defined, calibrating spheres, 2. adequate contrast for shadow detail, 3. clean particles (no secondary surface particles or contamination), 4. well-crystallized particles with good hexagonal outline, planar, and no
visible fractures or nicks, 5. fiat orientation, 6. shadow area void of any optical obstruction.
Of over 10,000 shadowed particles, only about 10~o could be measured with the above requirements. Measurements of the micrographs were performed with an ocular micrometer capable of ~- 0.02 mm accuracy. Measurements were performed separately by four operators and results compounded. Com- puter plots, regression and variance analysis, and distribution calculations were assisted by IBM 1620 data.
The author gratefully acknowledges Mr. John Brown of Georgia Institute of Technology for his electron micrography and J. P. Berberich, J. J. Keating, M. K. Lloyd, and M. W. Taranto for their assistance in measurement and data computation.
G E N E R A L S U R V E Y
Each of the micrographs was considered separately for purposes of compu- tation and plotting. The most straight forward presentation of data was a plot of particle shape against particle diameter. Particle size analysis (Conley, 1963} and particle behavior studies (Schulz, Wilde, and Albertson, 1954} have shown that a shape factor r computed by C/(AB) 1/~, where C is the vertical dimension and A and B are the maximum and minimum diameters, most nearly describes the particle both geometrically and phenomenologically. The reciprocal of r is median aspect ratio.
Data from the various micrographs were plotted as r against mean dia- meter (AB)I/~ on log-log paper. In each of the plots an obvious grouping of

STATISTICAL DISTRIBUTION PATTERNS IN THE GEORGIA KAOLINS 319
data points appeared along negative-slope 45 ~ lines. Also apparent was the repetition of these lines throughout the various micrographs. Superposing the plots resulted in the striking family grouping of Fig. 1.
.5
.4
.5 "e-
.2 aY O r
La .I
O.
r .05 s .04
.05
.02
.01 .I .2 .5 .4.5 I 2 3 4 5
Mean Part ic le D iameter (microns) Fro. 1. Survey plot of kaolinite size and shape.
I f the data represented preferential sedimentation, the families should have a -- 2 slope (sedimentation velocity varies with the square of the diameter), a state not evident. In a plot of 1/~ versus (AB) 1/~, a - - 1 slope represents particles with equal C values, i.e. having identical thicknesses. Further examination of the data reveals two series of families--a dominant (in number) one in which each thickness ~V is an integral multiple of the minimum thickness, and a subordinate one in which each thickness is an odd integer multiple of one-half the minimum thickness, i.e. lying midway between the dominant series. Computations on the first four members of the dominant series yield an average thickness value for the fundamental family of 42 -4- 1 A. I t would seem significant that this value is remarkably close to six times the unit cell dimension of kaolin, 7.14/~ (Brindley and Robinson, 1946a, p. 242; Brindley and Robinson, 1946b, p. 198). The subordinate series would then comprise three unit cells.
320 FOURTEENTH NATIONAL CONFERENCE ON CLAYS AND CLAY MINERALS
The fundamental thickness could be considered as 21 • with the dominant series representing even integer multiples thereof. However, within the range of accurate differentiation (C < 425 X) only one instance occurs of a sub- ordinate family of greater population than the neighboring dominant families. In all other instances the dominant/subordinate family ratio averages about 4 : 1 and in a region where statistical deviation should be high. No 21 • thick particles could be found in any of the micrographs even with relaxation of some of the examination criteria. However, the number of exceptionally thin particles was so low that the exclusion of a three unit cell member likely represents statistical deviation rather than structural significance.
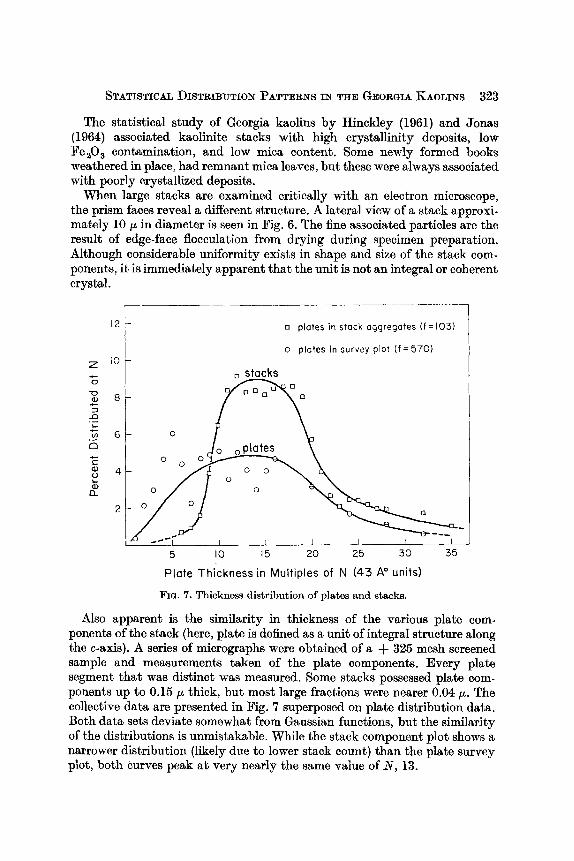
The absence of all particles corresponding to the series 3n A- 1 and 3n + 2, where n is an integral multiple of the Kaolin unit cell, seems of particular consequence. Data points above 5N, where n = 30, are valueless for such calculations because measurement error exceeds 7 ~. However, as almost 20~o (103 counts) of the data occur below 52Y, the probabili ty of members of the two missing series occurring, as opposed to their exclusion, ff kaolin exists as random multiples of its unit cell, is astronomical. The number of possible arrangements of 103 particles on 21.4 A line multiples up to 5N is 1.2 x 10¹⁹. The arrangements of these same particles on 7.14 ~ lines (random multiples of n) in the same range is 1.3 • 1029. Hence, the probability of any random occurrence of these particles exclusively as trilaminae units is less than 10 -1~ In Fig. 7 the count per family (as ~/o of the total) is expressed. The median value for particle thickness occurs near C ~- 12-13N, which corresponds to about 0.05/x.
S E L E C T F I E L D D I S T R I B U T I O N S
Analysis of distributions within narrower particle size and shape ranges was performed to obtain a clearer picture of occurrence levels and possible formation mechanisms.
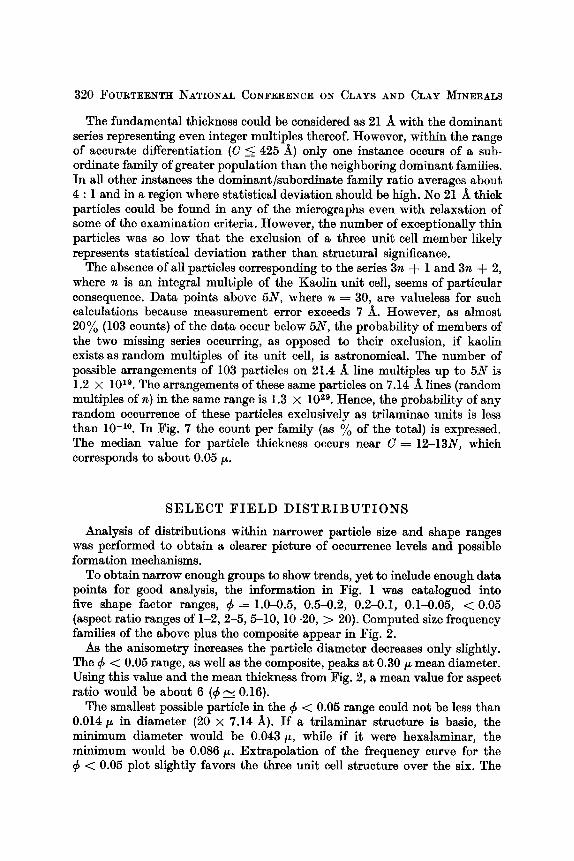
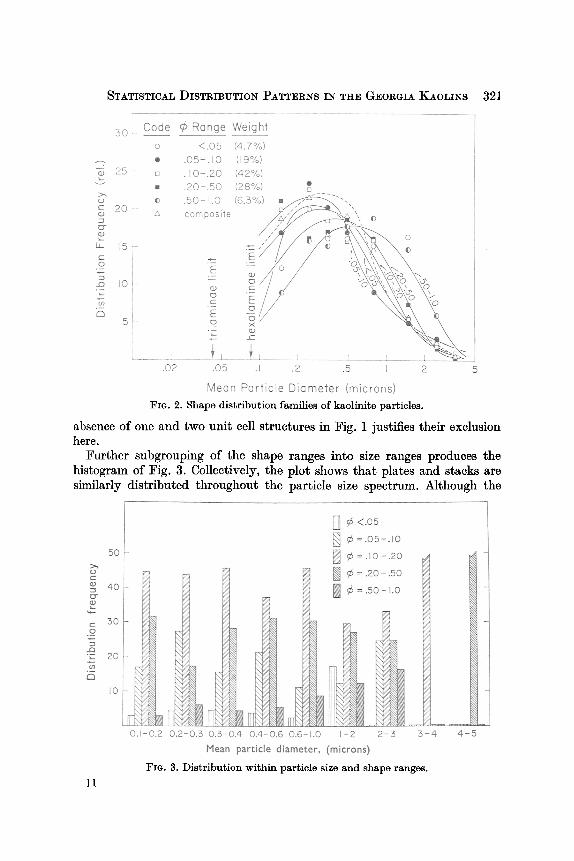
To obtain narrow enough groups to show trends, yet to include enough data points for good analysis, the information in Fig. 1 was catalogued into five shape factor ranges, r = 1.0-0.5, 0.5-0.2, 0.2-0.1, 0.1-0.05, < 0.05 (aspect ratio ranges of 1-2, 2-5, 5-10, 10-20, > 20). Computed size frequency families of the above plus the composite appear in Fig. 2.
As the anisometry increases the particle diameter decreases only slightly. The r < 0.05 range, as well as the composite, peaks at 0.30/x mean diameter. Using this value and the mean thickness from Fig. 2, a mean value for aspect ratio would be about 6 (~ ~ 0.16).
The smallest possible particle in the ~b < 0.05 range could not be less than 0.014/x in diameter (20 • 7.14 A). I f a trilaminar structure is basic, the minimum diameter would be 0.043/~, while if it were hexalaminar, the minimum would be 0.086/x. Extrapolation of the frequency curve for the
< 0.05 plot slightly favors the three unit cell structure over the six. The
STATISTICAL DISTRIBUTION PATTERNS IN THE GEORGIA K A O U N S 321
30~ Code CRonge Weight / <.05 (4.7%)
.05-.10 (19%)
.10-.20 (42%)
o c-
(D
{D"
i,
g
. . Q "c"
C3
25 I_ .20-.50 (28%) . 5 o - , . o I .,,ol
20- - composile "',, ~)
= ~ .% ,o
.02 .05 .I .2 .5 I 2 5
Meon Particle Diameter (microns) FIe . 2. Shape d i s t r ibu t ion famil ies of kaol ini te part icles.
absence of one and two unit cell structures in Fig. 1 justifies their exclusion here.
Further subgrouping of the shape ranges into size ranges produces the histogram of Fig. 3. Collectively, the plot shows that plates and stacks are similarly distributed throughout the particle size spectrum. Although the
5O
40 cr
,- 30 0
e'~ -
-c- 20 .m ,.-.,
I0
II
r <.o5 L~ r = .os - . ,o
r :.,o-.2o
O J-0.2 0.2-0.3 0.3-0.4 0.4-0.6 0.6-1.0 I -2
Mean particle diameter, (microns)
2 - 3 3 - 4 4 - 5
FIG. 3. Dis t r ibu t ion wi th in par t ic le size a n d shape ranges .

322 FOIYRTEENTII NATIONAL CONFERENCE ON CLAYS AND CL&Y MINERALS
statistics are fair in the finest size fraction and poor in the two coarsest fractions, the median value for aspect ratio slightly in excess of 5 : 1 is evident throughout the ranges.
[oo . . . . . . . . . .
50
e -
L k
r - t ~
t 9 o_
20
10
0.2 0.5 2 5 I0 20
Mean Porticle Diameter (microns)
FIe. 4. Particle size analysis of commercially mined kaolinite.
50
Other data taken from particle size analysis curves, Fig. 4, representing in excess of 1,000,000 tons of crude production kaolin, and corrected for equivalent spherical diameter designation, show the average particle to have a mean diameter of 0.37/~. The influence of stacks above 5/~ and negative curve flexure makes this value slightly high. Thus, there is fair correspondence to the micrographic figure of 0.30/~.
STUDY OF STACK COMPONENTS
Earlier studies by Woodward and Lyons (1951) have shown that stacks larger than about 5 ~ diameter are not integral, but consist of imperfectly bonded, yet highly oriented, plates of similar diameter. As the diameter increases, the tendency for low-aspect-ratio stack formation also increases. Values down to 0.25 (C-dimension 4 times the diameter) have been observed. In the optical micrograph of Fig. 5 shadowed specimens with characteristic vermiform shape appear. The larger members range from 20 to 50/~ diameter, but smaller stacks, below 5/~ diameter, can be resolved upon enlargement. In an optical microscope such particles appear highly uniform in the A B plane, but as though cracks along the various laminae have brought about curling.

FI(;. 5. Optical mierogvaph of kaolinite stacks.

FIG. 6. Electron micrograph of stack edge.
STATISTICAL DISTRIBUTION PATTERNS IN THE GEORGIA KAOL1NS 323
The statistical s tudy of Georgia kaolins by Hinck]ey (1961) and Jonas (1964) associated kaolinite stacks with high crystallinity deposits, low Fe20 3 contamination, and low mica content. Some newly formed books weathered in place, had remnant mica leaves, but these were always associated with poorly crystallized deposits.
When large stacks are examined critically with an electron microscope, the prism faces reveM a different structure. A lateral view of a stack approxi- mately 10 ~ in diameter is seen in Fig. 6. The fine associated particles are the result of edge-face flocculation from drying during specimen preparation. Although considerable uniformity exists in shape and size of the stack com- ponents, it is immediately apparent tha t the unit is not an integral or coherent crystal.
/ 12 ~ a plates in stack aggregates(f=105)
o plates in survey plot ( f=570) Z iO
o s tacks
2 8
"~ 6 o 125
13_ o
5 I0 15 20 25 50 55
P la te Th i ckness in Mul t ip les of N (4-3 A ~ units)
Fin. 7. Thickness disfribution of plates and stacks.
Also apparent is the similarity in thickness of the various plate com- ponents of the stack (here, plate is defined as a unit of integral structure along the c-axis). A series of micrographs were obtained of a ~- 325 mesh screened sample and measurements taken of the plate components. Every plate segment that was distinct was measured. Some stacks possessed plate com- ponents up to 0.15 ~ thick, but most large fractions were nearer 0.04 ~. The collective data are presented in Fig. 7 superposed on plate distribution data. Both data sets deviate somewhat from Gaussian functions, but the similarity of the distributions is unmistakable. While the stack component plot shows a narrower distribution (likely due to lower stack count) than the plate survey plot, both curves peak at very nearly the same value of ~V, 13.

324 FOURTEENTH NATIONAL CONFERENCE ON CLAYS AND CLAY MINERALS
The correspondence of the two data sets could be explained by any of the following.
Aa~GUMENT 1 : Plates are the end product of disintegrated stacks. ARGUMENT 2; Stacks are the authigenie product of face-face flocculation
of plates. ARGUMENT 3: Plates and stacks were allogenic from a common precursor. ARGUMENT 4: Plates and stacks grew in place from common nuclei pro-
genitors in a medium of dissolved silica and alumina.
A mechanism must have been extant which promoted the preferential formation of trilaminae multiples, and especially hexalaminae multiples. As the kaolins under study are all secondary, the result of severe weathering influences, the character of the parent rock would seem of particular signifi- cance.
C L E A V A G E E N E R G Y
Knowledge of the energies necessary to break kaolin particles might weigh in the selection of the particle generation process. Large, vermicular stacks are known to be unusually susceptible to comminution through interlaminar cleavage. Also recognized is the process of thin plate fracture, parallel to the c-axis, during grinding action.
Crystal cleavage energy calculations were made using the Brindley model (Brindley and Nakahira, 1958) for the kaolin cell and assuming perfect crystal- linity and interlaminar alignment. Admittedly, neither of these conditions hold in natural minerals. However, lattice substitutions and imperfections in kaolinite are low and X-ray data on c-axis stacking show a high degree of alignment, so that errors contributed by these probably are less than those inherent in thermodynamic bond energy values.
Using the bonding model formulated by Pauling (1935) and calculations* from Lewis and Randall (Pimental and McClellan, 1960) a value of 4.9 kcal/ mole for -- AH has been assigned for hydrogen bonding energy. Appropriate structure calculations yield a value of 6.4 • 10 -6 cal/cm ~ for delamination energy.
Bond rupture during fracture severs one Si-O bond and two internal hydrogen bonds per kaolin cell. Using average thermodynamic values for
- - AH of 51.2 kcal (Rossini, 1952) and 4.9 kcal, respectively, for these gives 61 kcal/mole unit cell face and 2.64 x 10 -5 cal/cm u fracture area.
The above computations have been translated mathematically into whole particles of varying shapes and sizes. The result is the family in Fig. 8. Delamination energy is single valued for all shapes having a given diameter. Its plot lies within those for fracture processes and corresponds roughly to the fracture energy of a 6 : 1 particle (r --~ 0.15).
* Based on recent Ii~ stretching frequencies (Keeling, 1963) and electric field relaxa- tion measurements (Auty and Cole, 1952; Rowlinson, 1951).

STATISTICAL DISTRIBUTION PATTERNS IN THE GEORQIA KAOLINS 325
Assuming an equal distribution of all shapes of particles, the energeties of cleavage processes should bring about the fracture of thin plates and defolia- tion of stacks, the two processes being equal in energy and hence, probability, at about r = 0.15. Thus, the thermodynamics of cleavage processes dictates distributions not unlike those of Fig. 8.
io 5
5 0
"c 2
~04
I o 5
x
2
"~ 103 O
5
'-- 2 Q,)
I.,I 10 2
~ 5 o
- - 2 C)
E I0
'E
2
.002 .005.010.02 .05 .to .2 .5 I.o z
Mean Part ic le Diameter (microns)
FIQ. 8. Cleavage onorgy dopendonco on particle sizo.
In nature the energy necessary for cleavage processes was likely hydro- kinetic, contributed by stream velocity during transportation, or hydro- dynamic, the result of freeze-thaw processes. Whereas small particles require little energy for cleavage, they also possess low kinetic energy. Cleavage energy, being area dependent, varies as the square of the diameter, while kinetic energy, being mass dependent, varies as the cube. Consequently, larger particles should be more susceptible to cleavage during stream impact than smaller ones. Calculation of the data in Fig. 8 in terms of minimum impact velocity for cleavage gives the family in Fig. 9. Again a single valued

326 FOURTEENTH NATIONAL CONFERENCE ON CLAYS AND CLAY MINERALS
curve appears, but here for the fracture process. Also, the fracture process is equal in probability to defoliation at r ~-0.15.
A practical upper limit for stream velocity would be about 1000 cm/sec. Considering only hydrokinetic fracture as a size and shape control, particles 10 ff and above should contain disproportionately less stacks than plates, the disparity increasing with diameter (see stream velocity intercept in Fig. 9).
10 5
d 2 u
:>1 1 0 4
(a
o 5
2 4::: CO E 103
.- 5
.E
2
102
":o .So , L . . . . . . . . . . . . . . . I
f l u id i m p ~
. . . . . . . _m_ o_ x_i m_ ~ ~_ _v~_o c j! _y . . . . . . . ~ ~
_ _ _ . b _ _ _ ] I I ] _ J ~ I I I I I I
. 002 .005 .01 .02 .05 JO .2 .5 m.o 2 5 I0 20 50 I 0 0
Mean Par t i c le D iamete r (microns)
FzG. 9. Shear velocity dependence on particle size,
However, the reverse is observed in nature. Hydrodynamic factors must have influenced particle size distribution, as well as rock structure and composition, for particles as observed in Fig. 5 would seem too fragile for transport. Thus, a more reasonable explanation of the size disparity is the transport of a more firmly bonded progenitor material which later weathered hydrodynamically in place to kaolinite stacks.
Another test of the energy relationships was made by subjecting a classified sample to fracture by a fluidized, high energy impact mill. The kaolin was selected from one of the areas sampled, but known to have a slightly smaller stack content. Based on a calculated maximum impact velocity of 4000 cm/sec, the classification point was set at 1/~. Survey data from shadowed electron micrographs appear in Fig. 10a. The computed ~ for the sample is 0.14, a value still close to the theoretical energy relationship in spite of stack deficiency.
With respect to Fig. 9, the region affected by milling must lie below the mill velocity line and to the left of the 1/~ diameter line. Hence, particles within the sample should preferentially defoliate, i.e. equally probable fracture-defoliation processes tending toward r ~- 0.15 could occur, only at

STATISTICAL DISTRIBUTION PATTERNS IN THE GEORGIA KAOLINS 327
higher energy input levels, e.g. > 104 em/sec. The milled sample should possess a lower value of r particularly ff the ultrafine component, e.g. < 0.01 F, were negligible. After milling at 3 0 o solids for about 30 min, the specimen was altered to that shown by the survey plot of Fig. 10b. The shape factor was reduced to about r ---- 0.10, while the diameter distribution re- mained essentially unchanged.
.50
.40
.50
.2O
0 ~5 .io
2_
.05 r
(.f) .04
.05
.02
.01
(a) :~ unmi l l ed sam
I I I ~. I �9 I .2 .5 .4 .5.6.7
.50 ~ , , . v ( f = 128) 4o % .3o
.10
.05
.04
.03
.02
OI .I .2 .5 A .5.6.7
Mean Particle Diameter (microns)
Fzo. 10. Effect of milling on particle size and shape.
Of greater significance was the formation of plates from the 3n + 1 and 3n + 2 laminae series. One particle was observed only two unit cells thick with no evidence of curling tendency in the electron beam. Delamination kinetics necessary to produce these particles exceed the capacity of the system. Whether they are chipped-edge particles, whether incomplete hydrogen bonding has produced interlaminar weaknesses, or whether some unforeseen phenomenon, as laminar particle flow during milling, has caused their pre- ferential generation is indeterminate at this time. Optical properties, as shown by reflectivity and packing volume, are noticeably different for (a) and (b). Other investigations are under way to clarify this effect.
S T A C K G E N E S I S
The combined parameters of geometric distribution, crystallinity and energy relationships seem to weigh heavily against iRGUME~TS 1 and 4 as particle-producing mechanisms in the highly crystalline clay deposits.
328 FOURTEENTH NATIONAL CONFERENCE ON CLAYS AND CLAY MINERALS
Under ideal conditions of crystal growth, the crystal should grow preferen- tially in the a-b directions compared to the c, as shown from infrared energy studies of Keeling (1963), with the b-axis slightly preferred over the a (1 octahedron in 3 vacant versus 1 in 2, respectively). In hydrothermal deposits, particles, for the most part, occur in such a mode. Stacks are an extreme rarity. Thus it would seem that good growth conditions preclude stack formation. Yet this is in exact contradiction to the extensive examination by Hinekley (1961). The resolution of this disparity must lie in ruling out growth in situ, in an aggrandizement sense, as a mechanism. The observations of Ross and Kerr (1930), that stacks developed in place, having been weathered from transported and deposited feldspar or intermediate body, seem particularly appropriate. The inverse relationship of potassium content with well-crystal- lized stacks and the consistent occurrence of mica leaves in poorly-crystallized stacks lend further credence to the idea.
The vermiform appearance of stacks is almost certainly the result of in- place ground stress. The excellent photomierogaphy of Moore (1964) demon- strates this. Extreme distortion, i.e. c-axis dislocation > 90 ~ seems to occur rarely, if ever, within well-crystallized stacks. The compliance of poorly crystallized stacks must result from the micaceous constituents with their lower attendant interlaminar co-ordination. Highly crystalline kaolin stacks under similar ground stress fracture into distinct fragments with only slight curvature.
I f stack formation resulted from face-face flocculation of well-crystallized plates, two mechanisms are required, (1) an efficient face-face agency naturally available and readily removable, and (2) a discrimination mechanism for acquisition of plates of near-equal size and shape. Neither of these have been diagnostically confirmed. On the basis of sediment volume studies, sea water has been proposed as a face-face agent.
Microscopic observation of clay sedimentation dynamics in sea water by the 2~r solid angle light scattering technique (Conley, 1963) shows the for- mation of large wing-like superstructures of flocculated plates with coplanar a-b alignment. The superstructures undulate with fluid currents. I t is not uncommon to observe three or more plates flexing about a common axis. This general behavior is strongly suggestive of edge-edge or edge overlap flocculation. A perceptible amount of edge-face flocculation was also observed particularly of small particles to larger ones. Such an arrangement could be generated by small plates edge-flocculating to an edge-edge or edge overlap junction of large plates and normal to them. Microscopic resolution was insufficient to differentiate between these mechanisms. These conclusions are granted further credence by the terminal volume measurements of sedimented clays in Table 1.
Whereas a broad distribution of thin plates produces nearly the same sediment volume in the dispersed state as a large particle size component alone, in sea water the broad distribution produces considerably greater volume. Sea water in general produces sediment volumes much higher than

STATISTICAL DISTRIBUTION PATTERNS IN THE GEORGIA KAOLINS 329
TABLE I.--TERMINAL SEDIMENT VOLUNIE I~ASUREMEI~TS*
Terminal sediment volume/
Sedimentation true Material Technique medium volume
10:1 plato models 10:1 plato models I: 1 stack models 1:1 stack models
Large, delaminated clay plates Largo, delaminated clay plates Broad dist., delam, clay plates Broad dist., delam, clay plates
Broad clay distribution Broad clay distribution Broad clay distribution
Broad distribution, hydrothermal clay Broad distribution, hydrotharmal clay
Random packing Ordered packing Random packing Ordered packing Calgon dispersion Calgon dispermon Calgon dispersion Calgon dispersion Calgon dispersion Calgon dispersion Calgon dispersion Calgon dispersion Calgon dispersion
- - 2.03 - - 1.10 - - 1 . 5 6
- - 1 . 1 0
H~O 2.62 sea water 4.6
H20 2.58 s e a water 6.9
H20 2.38 pH 3 H~SO 4 7.6
sea water 5.0 H~O 2.42
sea water 8.2
* Consistent volumes usually attained in 2000 hr for 12 in. deep chamber. Centrifu- gation thereafter at 50 "G" 's did not significantly compress the sediment further (< lO%).
pure water, often approximating the value for the edge-face, acid-fleeced state, The similarity is even greater when the rates of change of sediment volume (floe size and geometry dependent) for the two are compared. The hydrothermal kaolin appears both from sediment volume and microscopic observation to be fleeced in an edge-face orientation (theoretical floe volume
An edge-edge or edge overlap orientation in flocculation should take up greater volume than a dispersed and settled specimen. Also, the absence of stacks increases sediment volume considerably. Fractionated clays with large stack content produce volumes approaching theoretical models, 1.56. Hence, aligned face-face flocculation should reduce sediment volume and produce values between 2.6 and 2.0 (pure water dispersion and model random plate values, respectively). The tabular data weigh heavily against this type of flocculation as a stack-promoting mechanism in sea water. Studies with other agents, as long and short chain organic acids, alcohols, amines, and ketones, humates, tannins and alginates have not succeeded in producing aligned face-face flocculation.
C O N C L U S I O N S
The argument that plates and stacks were weathered p e r se from a common rock body, with stacks altering more slowly and, hence, finally in place, seems considerably more likely based on the foregoing data.
330 FOURTEENTH NATIONAL CONFEREI~CE ON CLAYS AI~D CLAY MINERALS
The paren t rock most l ikely possessed low energy cleavage planes corres- ponding to the 43 A or possible 21.4 A thickness. These are represented by the striations and c-axis discontinuit ies along the edge faces of the stacks. I n as much as a l tera t ion m a y have proceeded through an in termedia te phase, the exac t values observed need not to have been ex tan t in the original s tructure.
R E F E R E I ~ C E 8
Aug'r, R. P., and COLE, R. H. (1952) Dielectric properties of ice and solid D~O: Jour. Chem. Phys. 20, 1309-14.
BRINDLEX', G. W., and NAKAHmA, NI. (1958) Further consideration of the crystal structure of kaolinite: Min. May. 31, 781-6.
BP~DL~Y, G. W., and ROBINSON, K. (1946a) The structure of kaolinite: Min. May. 27, 242-53.
BP~NDLEY, G. W., and ROBINSON, K. (1946b) Randomness in the structures of kaolinitic clay minerals: Trans. Faraday Soc. 42B, 198-205.
C o ~ r , R. F. (1963) Rapid particle-size analysis of ceramic clays by packing-volume teelmique: Jour. Amer. Ceram. Soc. 46, 1-5.
HINCKLEY, D. N. (1961) Mineralogical and chemical variations in the kaolin deposits of the coastal plain of Georgia and South Carolina: Tech. Rep. (NSP G-3735), Coll. of Min. Ind., Penn. St. Univ., University Park, Penn.
JONAS, E. C. (1964) Petrology of the Dry Branch, Georgia, Kaolin Deposits: Clays and Clay Mine/rals, Prec. 12th Conf., Pergamon Press, New York, pp. 199-205.
KEELING, P. S. (1963) Infrared absorption characteristics of clay minerals: Trans. Brit. Ceram. Soc. 62, 549-63.
Moo~E, L. R. (1964) The in sltu formation and development of some kaolinite macro- crystals: Clay Min. Bull. 5, 338-51.
PAULrNO, L. (1935) The structure and entropy of ice and of other crystals with same randomness of structure and atomic arrangements: Jour. Amer. Chem. Soc. 57, 94-97.
PI~rE~vrAL, G. C., and McCLEL~N, A. L. (1960) The Hydrogen Bond: W, H. Freeman, San Francisco, p. 206-25 (Lewis, G. N., and Randall, M., cooperating authors).
Ross, O. S., and KEttle, P. F. (1930) The kaolin minerals: U.S.G.S. Prof. Paper 165-E, pp. 151-75.
RossiNI, F. D. (1952) Selected values of chemical thermodynamic properties: N.B.S. Circular 500 (see also U.S. Bureau of Mines (1954) Tech. Rep. 542 and U.S. Atomic Energy Report ANL-5750).
RowLINso~, J. S. (1951) The lattice energy of ice and the second virial coefficient of water vapor: Trans. Faraday Soc. 47, 120-9.
SCHULZ, E. F., WIT,DE, R. H., and ALB~.RTSON, M. L. (1954) Influence of shape on the fall velocity of sedimentary particles: Sedimentation Series Report No. 5, Missouri River Division, U.S. Army Corps of Engineers, Omaha, l~ebr.
WOODWARD, L. W., and LYONS, S. C. (1951) Mechanism of gloss development in clay- coated sheets: Tappi 34, 438-42.