Embed Size (px)
Citation preview
© Joseph J. Nahas 2012 10 Dec 2012
Statistical Design of Experiments‐Part IV Analysis of Variance
Joseph J. Nahas
1
2© Joseph J. Nahas 2012
10 Dec 2012
References• NIST ESH 1.3.5.4 One‐Factor ANOVA and 1.3.5.5
Multi‐factor
Analysis of Variance• NIST ESH 7.4.3 Are the means equal? and subsections
– 7.4.3.1 1‐Way ANOVA overview– 7.4.3.2 The 1‐way ANOVA model and assumptions– 7.4.3.3 The ANOVA table and tests of hypotheses about means– 7.4.3.4 1‐Way ANOVA calculations – 7.4.3.5 Confidence intervals for the difference of treatment means– 7.4.3.6 Assessing the response from any factor combination – 7.4.3.7 The two‐way ANOVA – 7.4.3.8 Models and calculations for the two‐way ANOVA
• NIST ESH 7.4.4 What are variance components?
3© Joseph J. Nahas 2012
10 Dec 2012
Outline• Analysis of Variance (ANOVA) Basics• 2 Way ANOVA• 2 Way ANOVA Example• Significance Testing using the F distribution
4© Joseph J. Nahas 2012
10 Dec 2012
Analysis of Variance• In an Analysis of Variance, the variation in the response
measurements is partitioned into components that correspond to different sources of variation.
• The primary components are:– Input factors– Random variation
5© Joseph J. Nahas 2012
10 Dec 2012
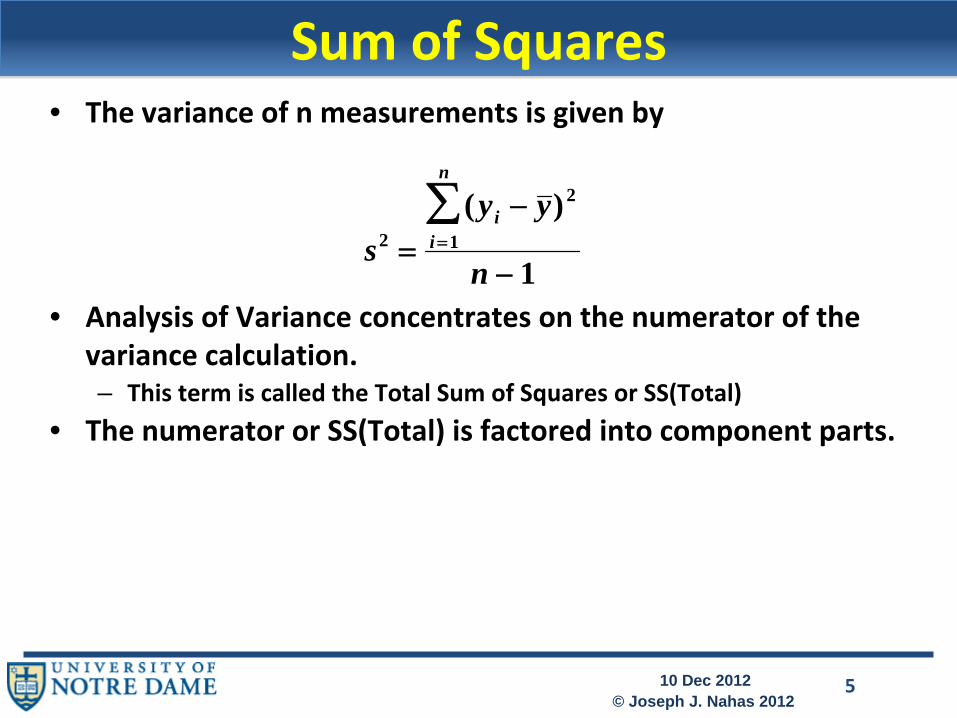
Sum of Squares• The variance of n measurements is given by
• Analysis of Variance concentrates on the numerator of the variance calculation.
– This term is called the Total Sum of Squares or SS(Total)• The numerator or SS(Total) is factored into component parts.
s2 =(yi − y )2
i =1
n
∑n − 1
6© Joseph J. Nahas 2012
10 Dec 2012
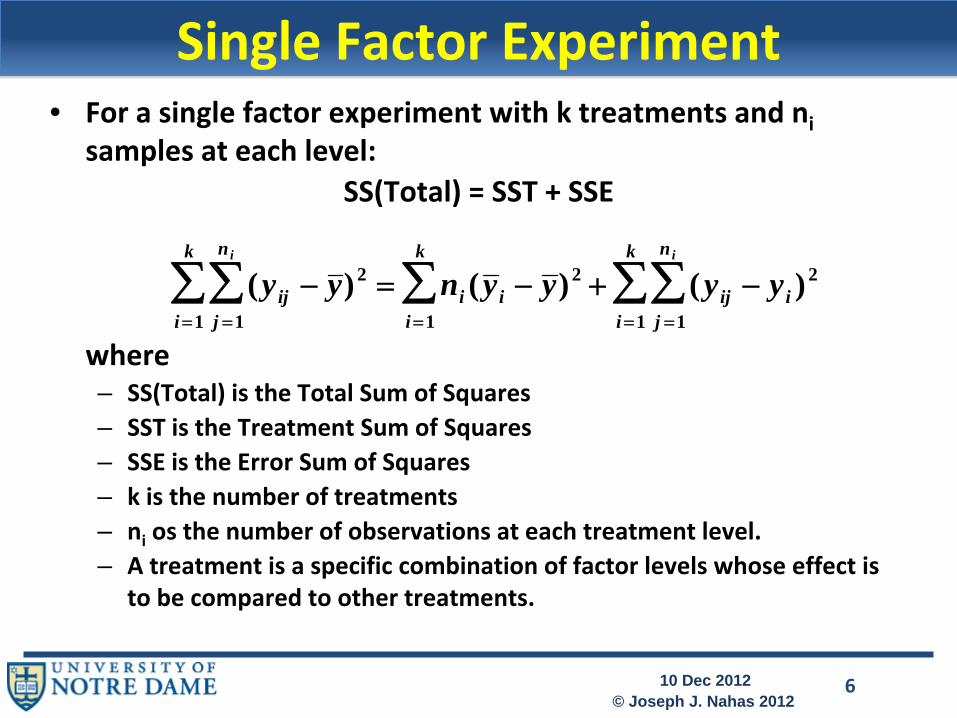
Single Factor Experiment• For a single factor experiment with k treatments and ni
samples at each level:
SS(Total) = SST + SSE
where– SS(Total) is the Total Sum of Squares– SST is the Treatment Sum of Squares– SSE is the Error Sum of Squares– k is the number of treatments– ni
os the number of observations at each treatment level.– A treatment is a specific combination of factor levels whose effect is
to be compared to other treatments.
(yijj =1
ni
∑i =1
k
∑ − y )2 = ni (y ii =1
k
∑ − y )2 + (yij − yi )2
j =1
ni
∑i =1
k
∑
7© Joseph J. Nahas 2012
10 Dec 2012
Outline• Analysis of Variance (ANOVA) Basics• 2 Way ANOVA• 2 Way ANOVA Example• Significance Testing using the F distribution
8© Joseph J. Nahas 2012
10 Dec 2012
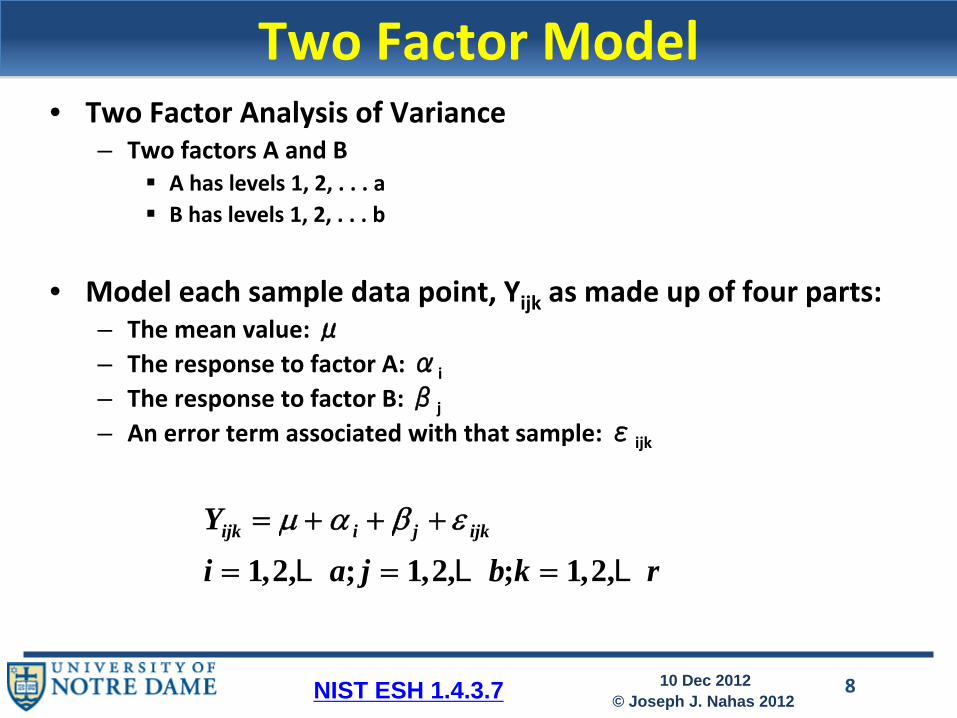
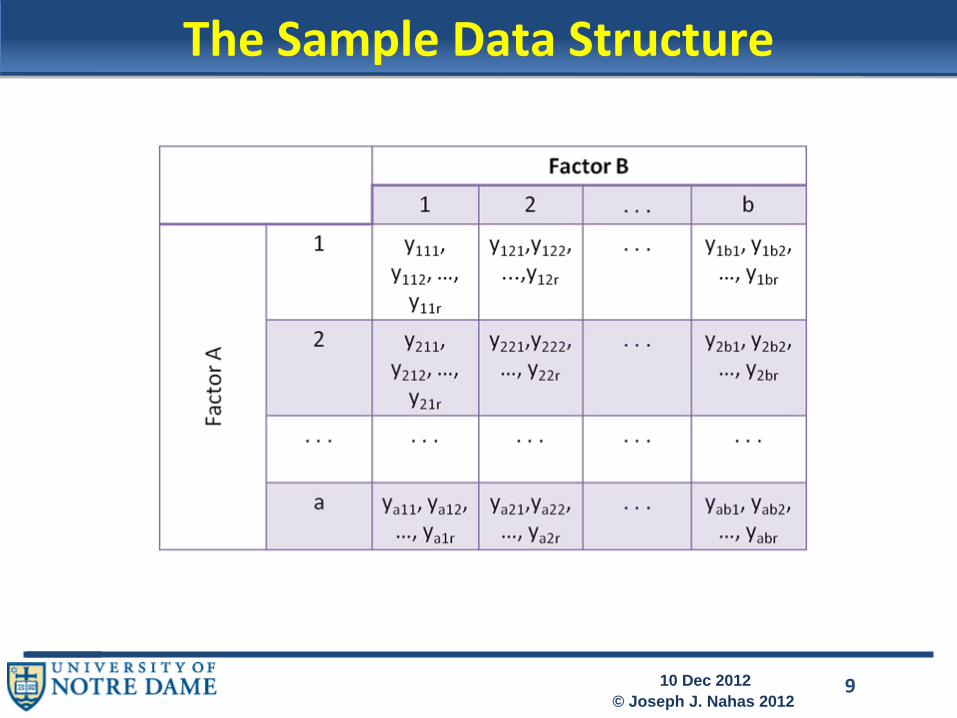
Two Factor Model• Two Factor Analysis of Variance
– Two factors A and BA has levels 1, 2, . . . aB has levels 1, 2, . . . b
• Model each sample data point, Yijk
as made up of four parts:– The mean value: μ– The response to factor A: αi
– The response to factor B: βj
– An error term associated with that sample: εijk
Yijk = μ + α i + β j + ε ijk
i = 1,2,L a; j = 1,2,L b;k = 1,2,L r
NIST ESH 1.4.3.7
9© Joseph J. Nahas 2012
10 Dec 2012
The Sample Data Structure
10© Joseph J. Nahas 2012
10 Dec 2012
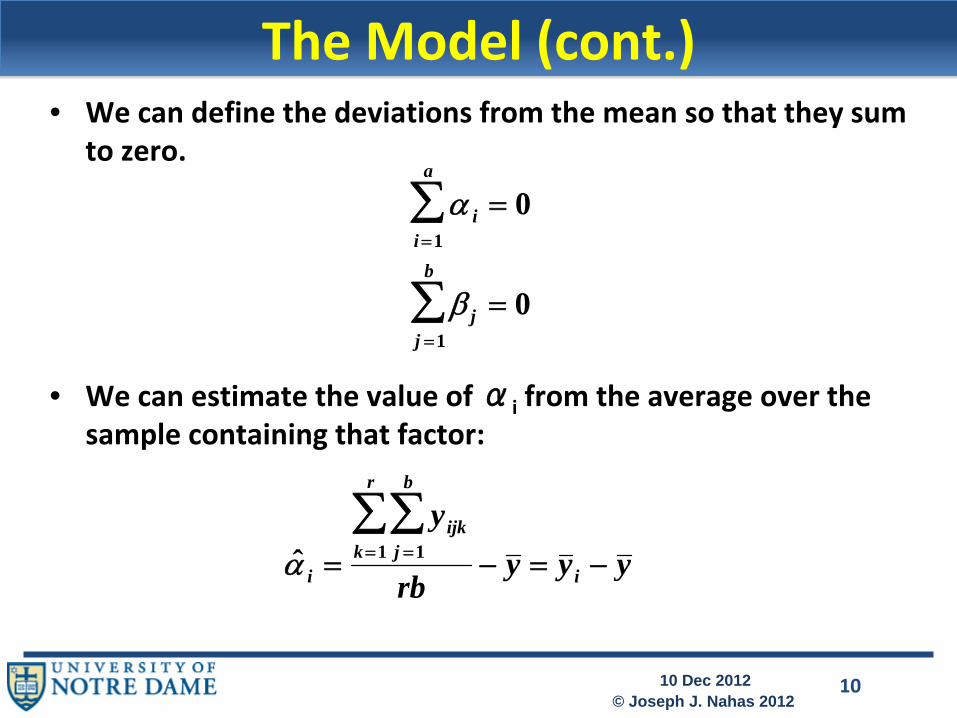
The Model (cont.)• We can define the deviations from the mean so that they sum
to zero.
• We can estimate the value of αi
from the average over the sample containing that factor:
α ii =1
a
∑ = 0
β jj =1
b
∑ = 0
ˆ α i =
yijkj =1
b
∑k =1
r
∑rb
− y = y i − y
11© Joseph J. Nahas 2012
10 Dec 2012
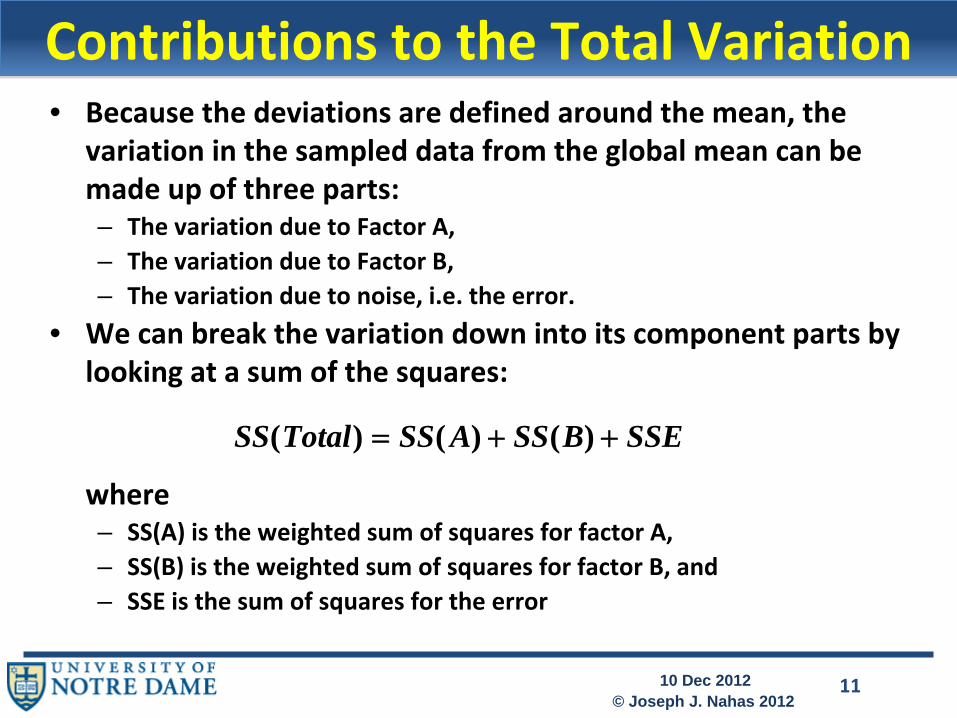
Contributions to the Total Variation• Because the deviations are defined around the mean, the
variation in the sampled data from the global mean can be made up of three parts:
– The variation due to Factor A,– The variation due to Factor B,– The variation due to noise, i.e. the error.
• We can break the variation down into its component parts by looking at a sum of the squares:
where – SS(A) is the weighted sum of squares for factor A,– SS(B) is the weighted sum of squares for factor B, and– SSE is the sum of squares for the error
SS(Total) = SS( A) + SS(B) + SSE
12© Joseph J. Nahas 2012
10 Dec 2012
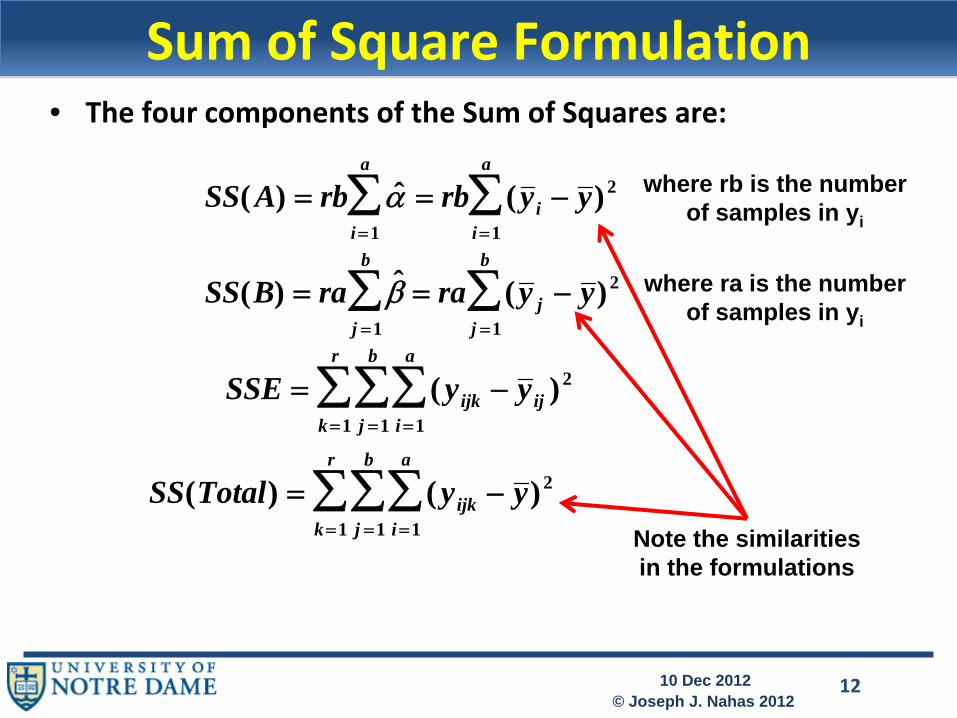
Sum of Square Formulation• The four components of the Sum of Squares are:
SS( A) = rb ˆ α i =1
a
∑ = rb (y ii =1
a
∑ − y )2
SS(B) = ra ˆ β j =1
b
∑ = ra (y jj =1
b
∑ − y )2
SSE = ( yijki =1
a
∑j =1
b
∑k =1
r
∑ − y ij )2
SS(Total) = ( yijki =1
a
∑j =1
b
∑k =1
r
∑ − y )2
where rb is the numberof samples in yi
where ra is the numberof samples in yi
Note the similaritiesin the formulations
13© Joseph J. Nahas 2012
10 Dec 2012
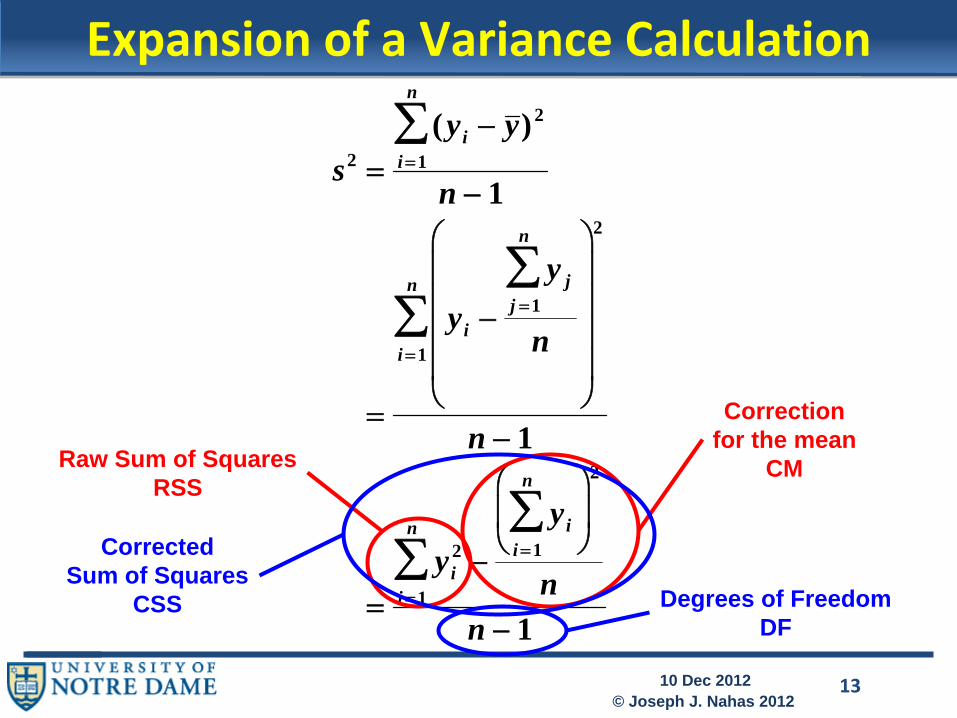
Expansion of a Variance Calculation
s2 =(yi − y )2
i =1
n
∑n − 1
=
yi −
y jj =1
n
∑n
⎛
⎝
⎜ ⎜ ⎜ ⎜
⎞
⎠
⎟ ⎟ ⎟ ⎟
2
i =1
n
∑
n − 1
=yi
2
i =1
n
∑ −yi
i =1
n
∑⎛
⎝ ⎜
⎞
⎠ ⎟
2
nn − 1
Correctionfor the mean
CMRaw Sum of SquaresRSS
CorrectedSum of Squares
CSS Degrees of FreedomDF
14© Joseph J. Nahas 2012
10 Dec 2012
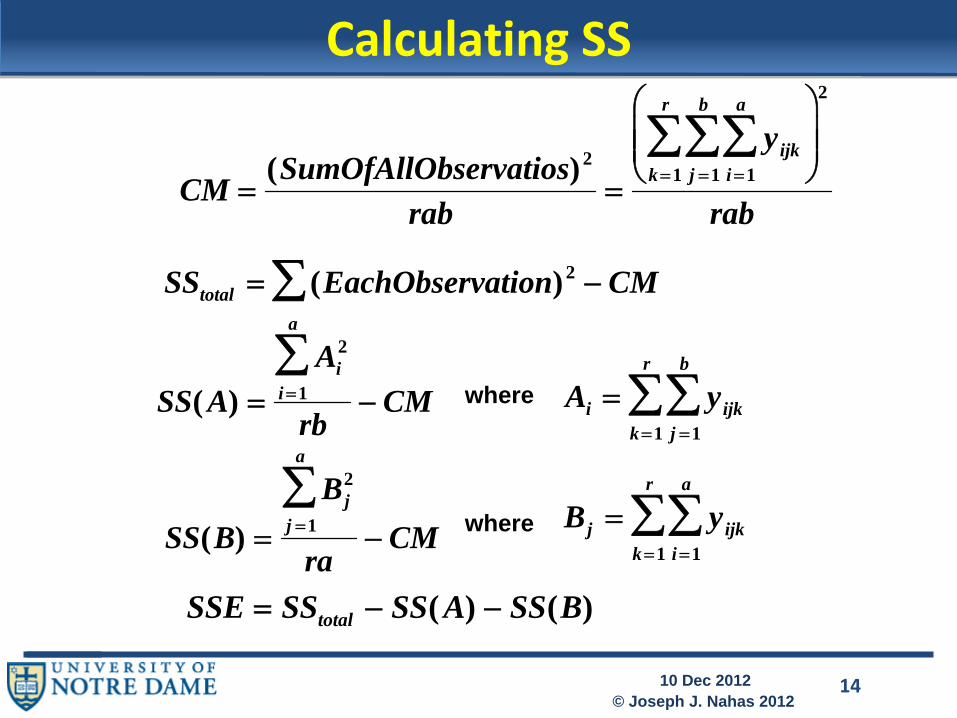
Calculating SS
CM =(SumOfAllObservatios)2
rab=
yijki =1
a
∑j =1
b
∑k =1
r
∑⎛
⎝ ⎜ ⎜
⎞
⎠ ⎟ ⎟
2
rab
SStotal = (EachObservation)2∑ − CM
Ai = yijkj =1
b
∑k =1
r
∑SS( A) =Ai
2
i =1
a
∑rb
− CM where
SSE = SStotal − SS( A) − SS(B)
SS(B) =
Bj2
j =1
a
∑ra
− CM Bj = yijki =1
a
∑k =1
r
∑where
15© Joseph J. Nahas 2012
10 Dec 2012
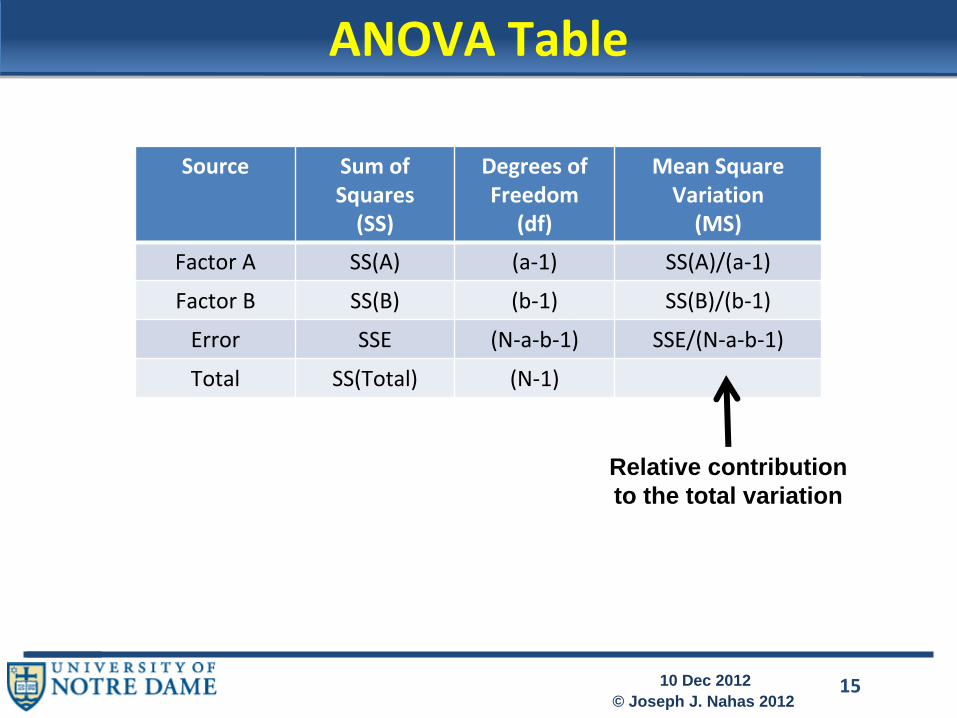
ANOVA Table
Source Sum of
Squares(SS)
Degrees of
Freedom
(df)
Mean SquareVariation(MS)
Factor A SS(A) (a‐1) SS(A)/(a‐1)
Factor B SS(B) (b‐1) SS(B)/(b‐1)
Error SSE (N‐a‐b‐1) SSE/(N‐a‐b‐1)
Total SS(Total) (N‐1)
Relative contributionto the total variation
16© Joseph J. Nahas 2012
10 Dec 2012
Outline• Analysis of Variance (ANOVA) Basics• 2 Way ANOVA• 2 Way ANOVA Example• Significance Testing using the F distribution
17© Joseph J. Nahas 2012
10 Dec 2012
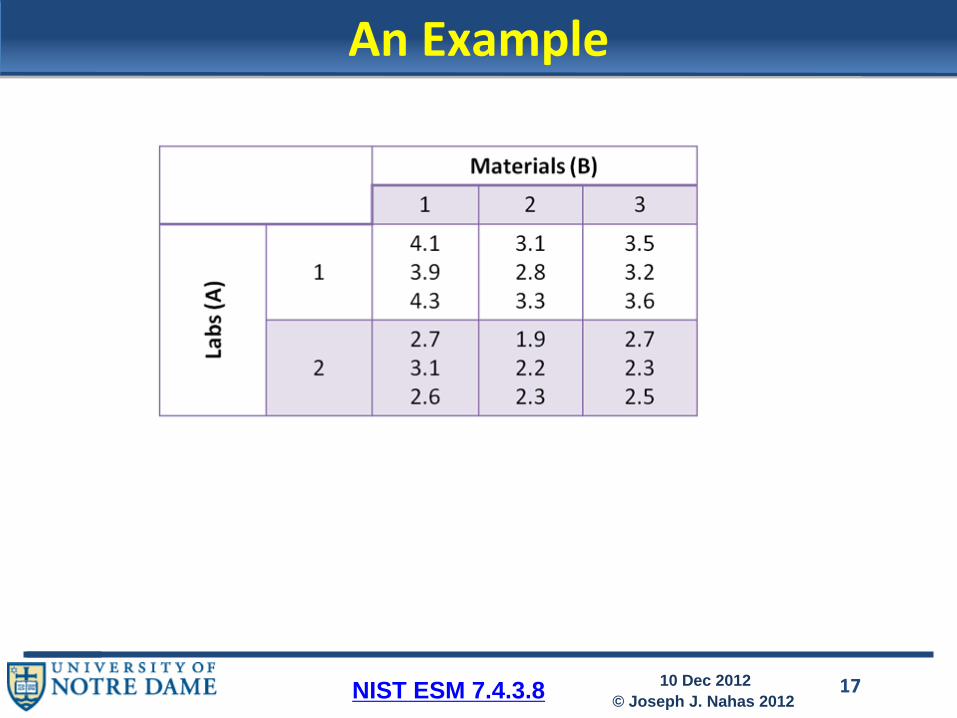
An Example
NIST ESM 7.4.3.8
18© Joseph J. Nahas 2012
10 Dec 2012
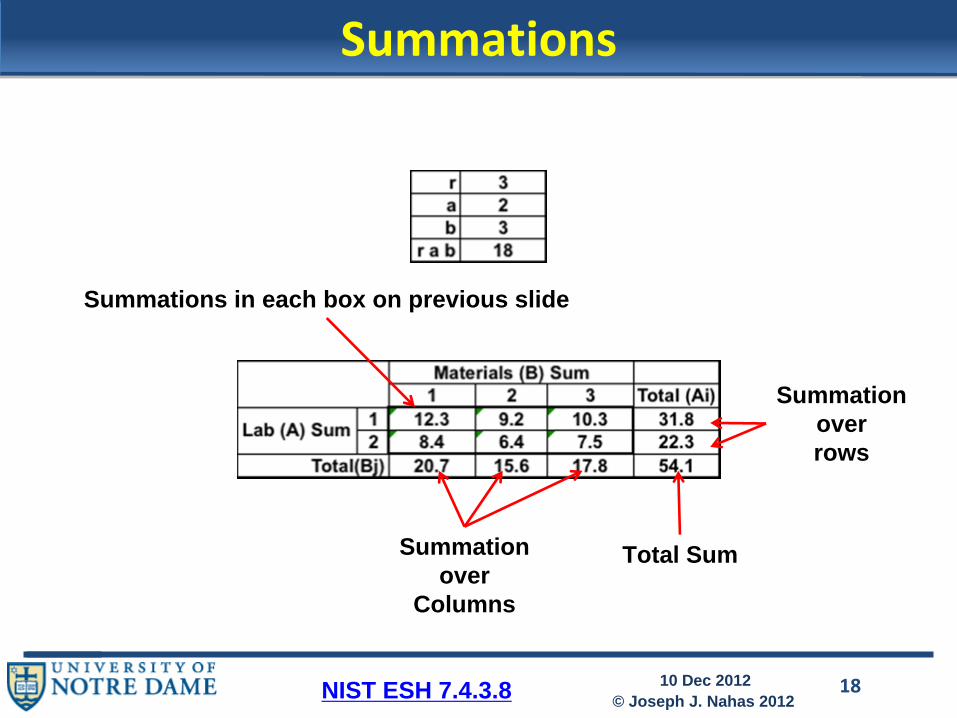
Summations
Summations in each box on previous slide
Summationoverrows
Summationover
Columns
Total Sum
NIST ESH 7.4.3.8
19© Joseph J. Nahas 2012
10 Dec 2012
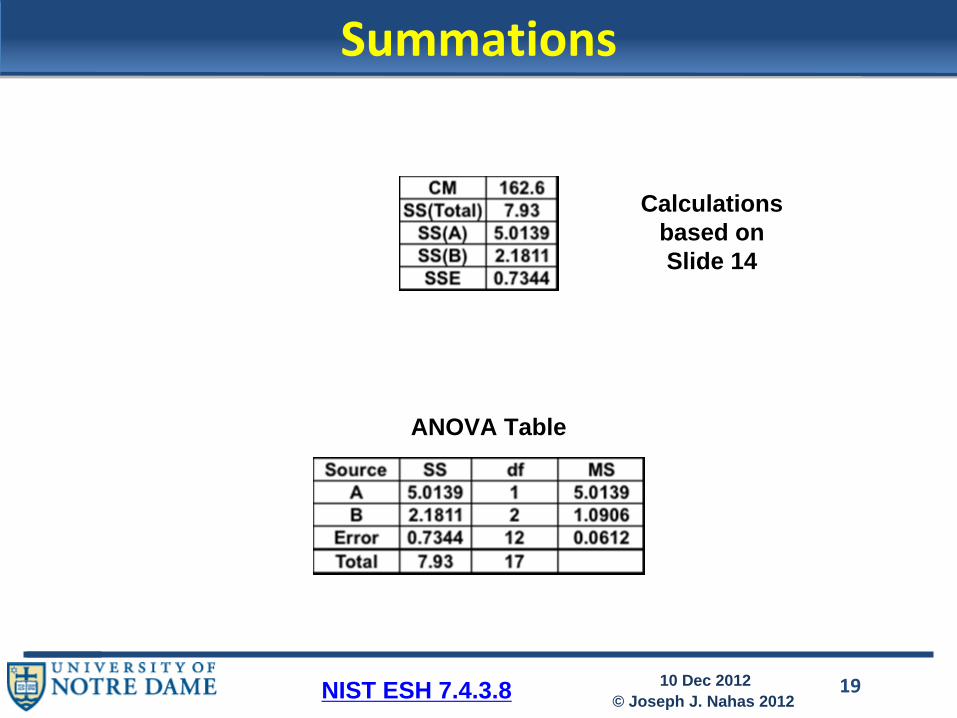
Summations
ANOVA Table
Calculationsbased onSlide 14
NIST ESH 7.4.3.8
20© Joseph J. Nahas 2012
10 Dec 2012
Outline• Analysis of Variance (ANOVA) Basics• 2 Way ANOVA• 2 Way ANOVA Example• Significance Testing using the F distribution
21© Joseph J. Nahas 2012
10 Dec 2012
Significance of the Relative Contribution • Are the various factor contributions significant relative to the
noise in the measurement.• Look at variance of factor relative to variance of the noise.
22© Joseph J. Nahas 2012
10 Dec 2012
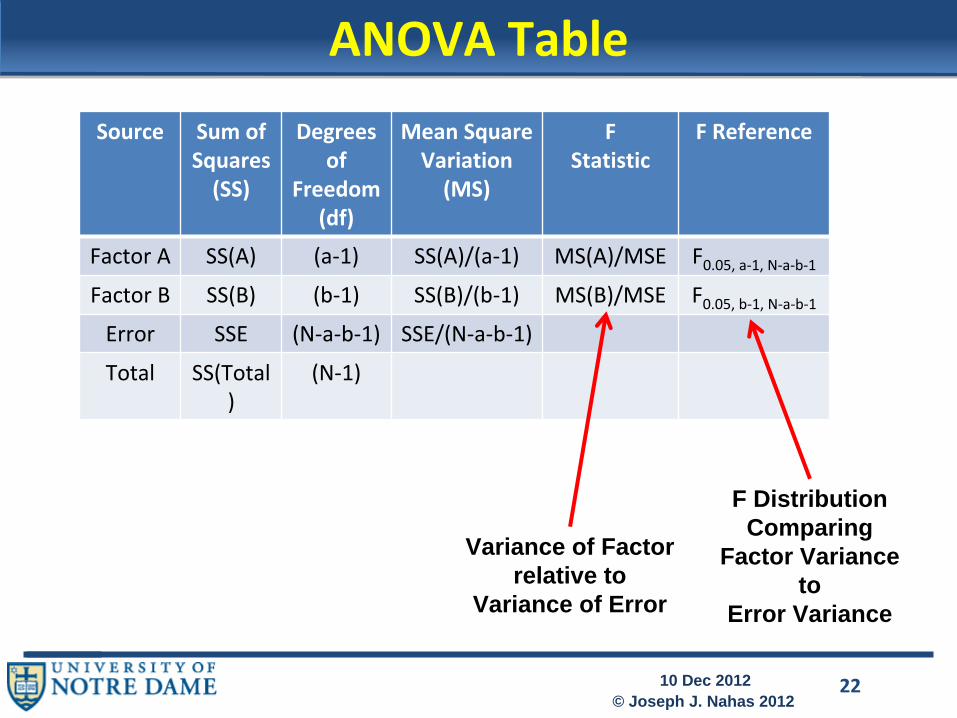
ANOVA Table
Source Sum of
Squares(SS)
Degrees
of
Freedom
(df)
Mean SquareVariation(MS)
FStatistic
F Reference
Factor A SS(A) (a‐1) SS(A)/(a‐1) MS(A)/MSE F0.05, a‐1, N‐a‐b‐1Factor B SS(B) (b‐1) SS(B)/(b‐1) MS(B)/MSE F0.05, b‐1, N‐a‐b‐1Error SSE (N‐a‐b‐1) SSE/(N‐a‐b‐1)
Total SS(Total
)
(N‐1)
Variance of Factorrelative to
Variance of Error
F DistributionComparing
Factor Varianceto
Error Variance
23© Joseph J. Nahas 2012
10 Dec 2012
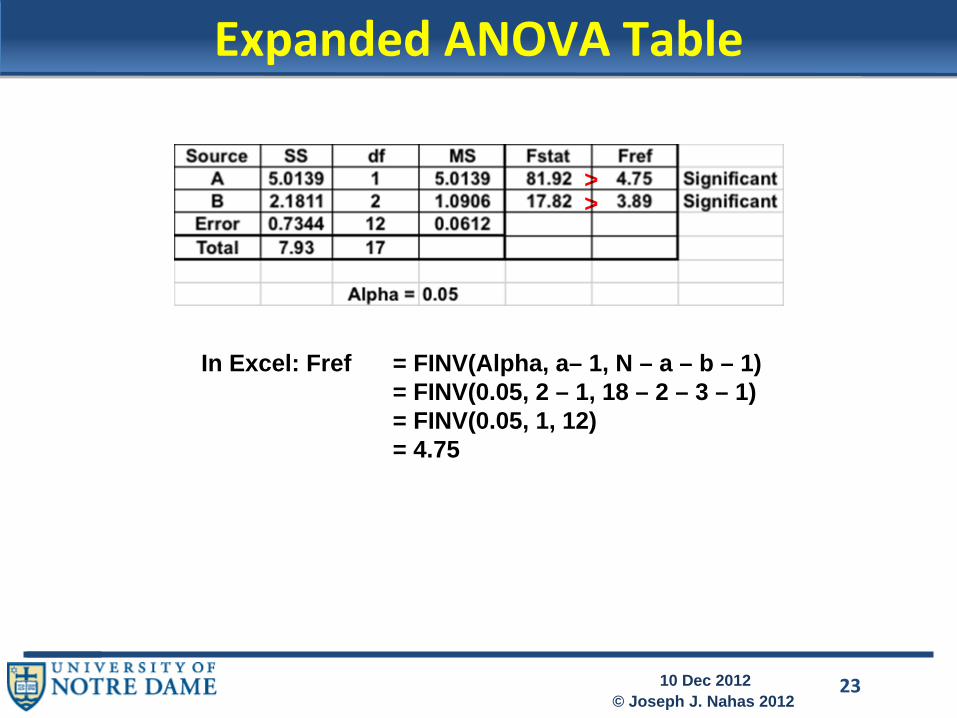
Expanded ANOVA Table
In Excel: Fref = FINV(Alpha, a– 1, N – a – b – 1) = FINV(0.05, 2 – 1, 18 – 2 – 3 – 1)= FINV(0.05, 1, 12) = 4.75
>>