Embed Size (px)
Citation preview

2015 Salary Survey of Business, Industry, and Government Statisticians
Final Report October 3, 2016
Prepared for The American Statistical Association
Committee on Statistical Partnerships among Academe, Industry, and Government
Prepared by Patricia H. Hall and Varghese George
Department of Biostatistics and Epidemiology Medical College of Georgia
Augusta University
1120 15th Street, AE-1000, Augusta, GA 30912-4900 Phone: (706) 721-3785 Fax: (706) 721-6294
http://www.augusta.edu/mcg/biostatepi/survey-center An Affirmative Action/Equal Opportunity Education Institution
Statistical Consulting and Survey Center Department of Biostatistics and Epidemiology
Medical College of Georgia Augusta University
Updated April 2017
ii
2015 Salary Survey of Business, Industry, and Government (B/I/G) Statisticians
Table of Contents
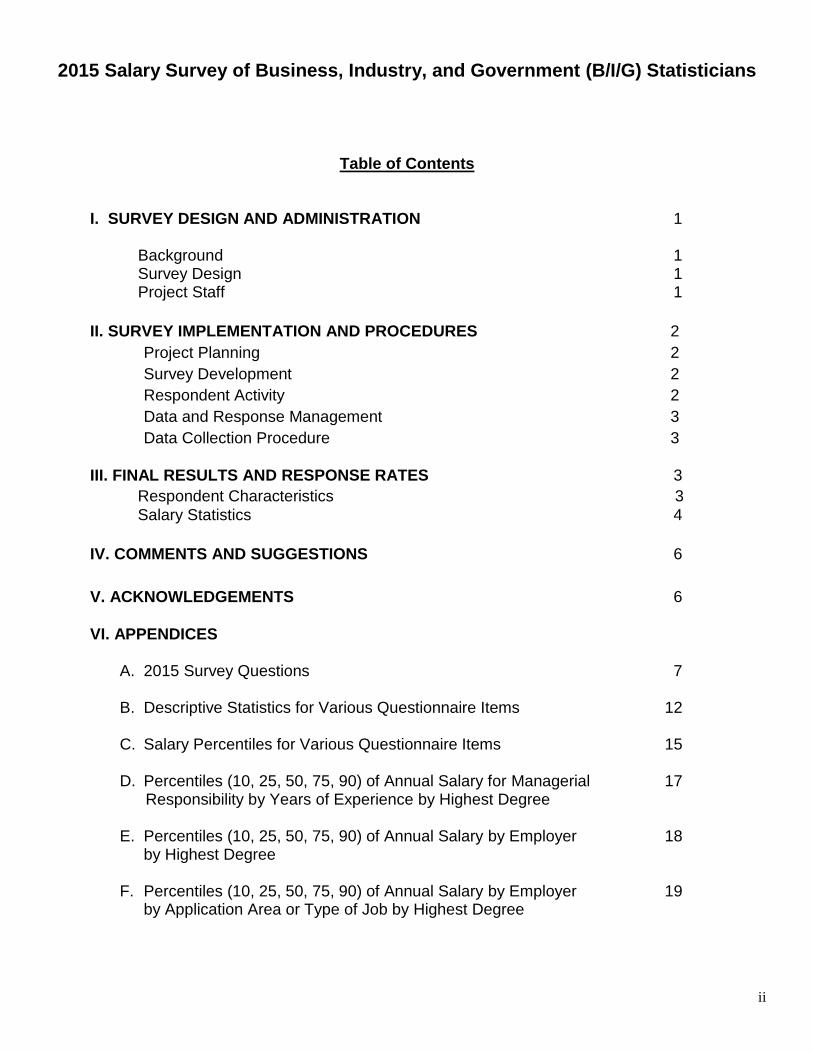
I. SURVEY DESIGN AND ADMINISTRATION 1
Background 1 Survey Design 1 Project Staff 1
II. SURVEY IMPLEMENTATION AND PROCEDURES 2
Project Planning 2
Survey Development 2
Respondent Activity 2
Data and Response Management 3
Data Collection Procedure 3
III. FINAL RESULTS AND RESPONSE RATES 3
Respondent Characteristics 3
Salary Statistics 4
IV. COMMENTS AND SUGGESTIONS 6
V. ACKNOWLEDGEMENTS 6
VI. APPENDICES
A. 2015 Survey Questions 7
B. Descriptive Statistics for Various Questionnaire Items 12
C. Salary Percentiles for Various Questionnaire Items 15
D. Percentiles (10, 25, 50, 75, 90) of Annual Salary for Managerial 17 Responsibility by Years of Experience by Highest Degree
E. Percentiles (10, 25, 50, 75, 90) of Annual Salary by Employer 18 by Highest Degree
F. Percentiles (10, 25, 50, 75, 90) of Annual Salary by Employer 19 by Application Area or Type of Job by Highest Degree
1
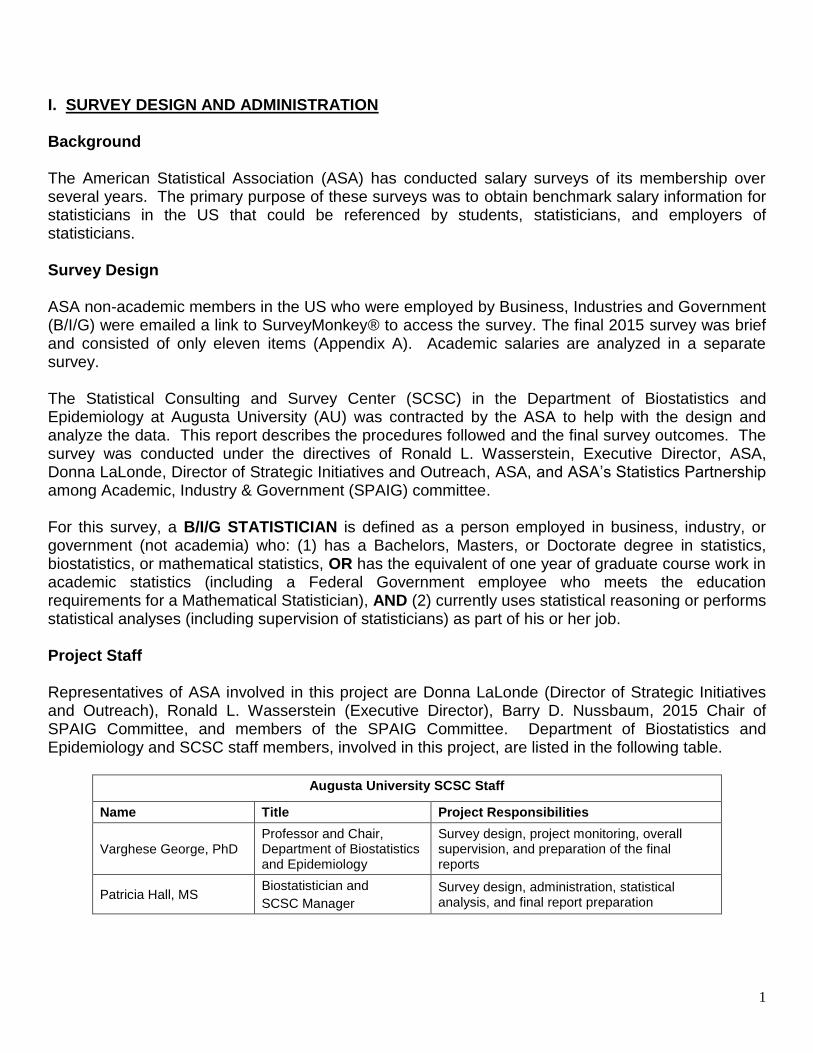
I. SURVEY DESIGN AND ADMINISTRATION
Background
The American Statistical Association (ASA) has conducted salary surveys of its membership over several years. The primary purpose of these surveys was to obtain benchmark salary information for statisticians in the US that could be referenced by students, statisticians, and employers of statisticians.
Survey Design
ASA non-academic members in the US who were employed by Business, Industries and Government (B/I/G) were emailed a link to SurveyMonkey® to access the survey. The final 2015 survey was brief and consisted of only eleven items (Appendix A). Academic salaries are analyzed in a separate survey.
The Statistical Consulting and Survey Center (SCSC) in the Department of Biostatistics and Epidemiology at Augusta University (AU) was contracted by the ASA to help with the design and analyze the data. This report describes the procedures followed and the final survey outcomes. The survey was conducted under the directives of Ronald L. Wasserstein, Executive Director, ASA, Donna LaLonde, Director of Strategic Initiatives and Outreach, ASA, and ASA’s Statistics Partnership among Academic, Industry & Government (SPAIG) committee.
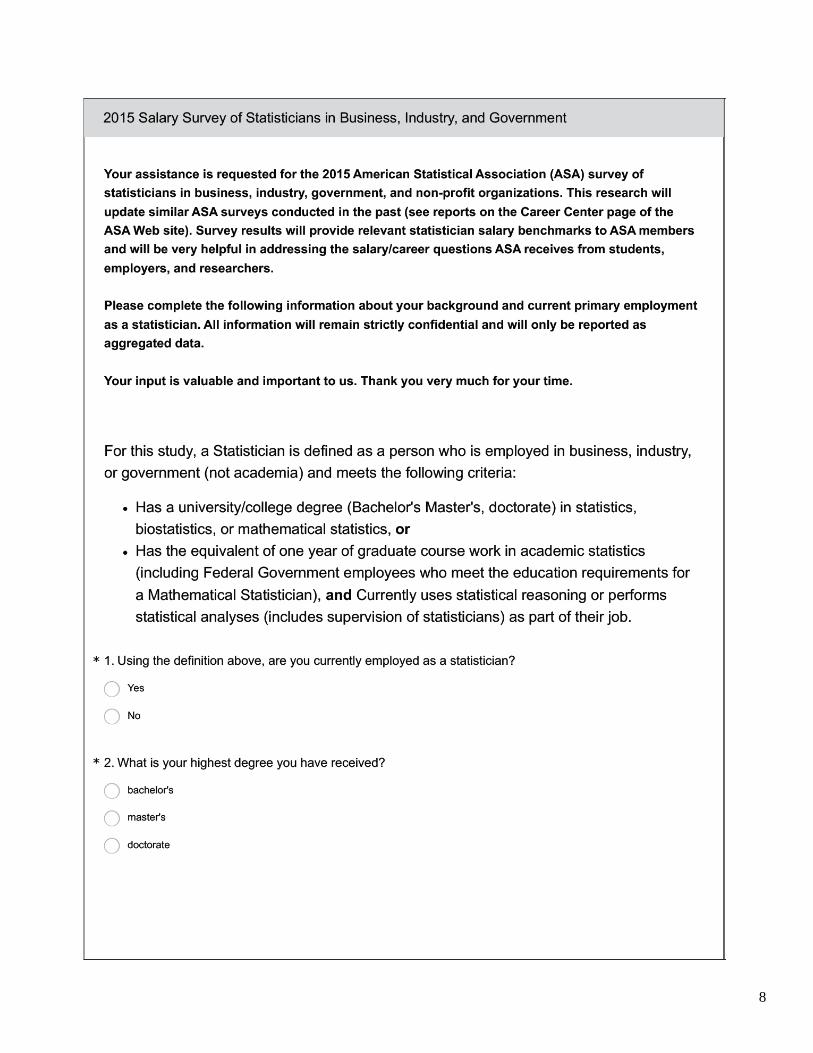
For this survey, a B/I/G STATISTICIAN is defined as a person employed in business, industry, or government (not academia) who: (1) has a Bachelors, Masters, or Doctorate degree in statistics, biostatistics, or mathematical statistics, OR has the equivalent of one year of graduate course work in academic statistics (including a Federal Government employee who meets the education requirements for a Mathematical Statistician), AND (2) currently uses statistical reasoning or performs statistical analyses (including supervision of statisticians) as part of his or her job.
Project Staff
Representatives of ASA involved in this project are Donna LaLonde (Director of Strategic Initiatives and Outreach), Ronald L. Wasserstein (Executive Director), Barry D. Nussbaum, 2015 Chair of SPAIG Committee, and members of the SPAIG Committee. Department of Biostatistics and Epidemiology and SCSC staff members, involved in this project, are listed in the following table.
Augusta University SCSC Staff
Name Title Project Responsibilities
Varghese George, PhD Professor and Chair, Department of Biostatistics and Epidemiology
Survey design, project monitoring, overall supervision, and preparation of the final reports
Patricia Hall, MS Biostatistician and
SCSC Manager
Survey design, administration, statistical analysis, and final report preparation

2
II. SURVEY IMPLEMENTATION AND PROCEDURES
Project Planning
The survey methodology and scope of work was approved by the Chair of the SPAIG Committee and the ASA representatives. The Augusta University Human Assurance Committee (Institutional Review Board) approved the research protocol. On October 12, 2015 the contract was executed and all AU approvals were obtained allowing us to begin the actual work on the survey.
Programming of the on-line survey and all preliminary work necessary to implement the e-mail invitations were completed by the end of November 2015. The survey period extended from middle of December through early January.
Survey Development
The 2015 SPAIG survey was developed in collaboration with ASA project representatives. A draft of the 2015 survey was provided to the ASA Survey Review Committee. The committee suggested modifications which were incorporated into the survey. The final survey questionnaire appears in Appendix A.
SurveyMonkey® was used to implement the on-line survey. The instrument pages were coded with check boxes for categorical response items with “strong” typing and format control. The instrument was deployed on SurveyMonkey’s website (www.surveymonkey.com). A unique “collector” was used for each phase of the survey. In an effort to increase response rate, the team made the decision to have the ASA send the invitations and to not require a password for the survey.
The layout of the web instrument was designed using SurveyMonkey’s design templates. The first question was whether the participant was employed as a statistician (with proper definition): (1) if the respondent answered “NO”, they were taken to the end of the questionnaire; (2) If they answered “YES”, they were taken to a new page to answer the remaining 9 questions. A minimal amount of scrolling was required to view all questions on a single page.
The online survey was extensively tested and validated. The on-line survey was opened and e-mail invitations were sent on December 15, 2015.
Respondent Activity
Respondents were allowed to access their survey only once. Answers to specific items could be changed as often as desired until they exited the last page of the survey. When they exited the final page their responses were stored as the “FINAL” version. Data and Response Management
Survey completion status and general comments were maintained for each respondent in Excel data. Periodic progress reports were made available to project staff as needed.

3
Data Collection Procedure
An Excel database of n = 5,412 ASA B/I/G members was received from the ASA in early January 2013 and was processed, examined and cleaned by BCSC project staff. Of the 5,412 members, 5,296 had valid e-mail address. On December 15, 2015, the initial e-mail invitation was sent to those with valid e-mail addresses. This invitation described the study and its purpose, and invited the ASA members to participate; it also included the URL for the on-line survey. The e-mail invitation letter can be found in Appendix A. On December 21, 2015, reminder e-mails were sent to those that had not yet responded. The survey was closed on January 8, 2016.
III. FINAL RESULTS AND RESPONSE RATES
Of the 5296 with valid e-mail addresses that were invited to participate, 1157 responded to the survey.
Respondents that were not employed as a statistician or not employed at all, including retired individuals, were classified as not eligible. In addition, respondents who were employed in academia were also classified as ineligible.
Based on the responses received, it was determined that 126 individuals (10%) were not eligible to be included in the final analysis. Those ineligible were either employed in academia, unemployed, not employed as a statistician, retired, or reported that they did not meet the definition of a statistician. Consistent with best practice, it was assumed the rate of ineligibility among the respondents would be similar in the population. When adjusted for delivery failure, eligibility, and non-response, 1,031 (1157 - 126) eligible responses were received from an adjusted universe of eligible members of 4766 (5296 - 530), for an adjusted response rate of 22%.
The 2013 SPAIG survey had a response rate of 31.6%. Our goal was to match or exceed that rate; however, the 2015 SPAIG survey response rate was 9.6% lower than the 2013 survey.
Respondent Characteristics
One thousand one hundred fifty-seven (1,157) ASA members responded to the B/I/G salary survey. However, 53 of these were reported as non-statisticians, 7 were academic statisticians, 56 were working outside the USA, and 10 had invalid salaries reported. All these, totaling 126, were excluded from further analysis, resulting in a sample consisting of 1031 eligible B/I/G statisticians. Their current employment and other relevant characteristics are given in Appendix B.
Of the 1031 eligible respondents, 65 reported being employed part-time (6.3%). Their reported percentage effort ranged from 10% to 90% with a median of 50%.
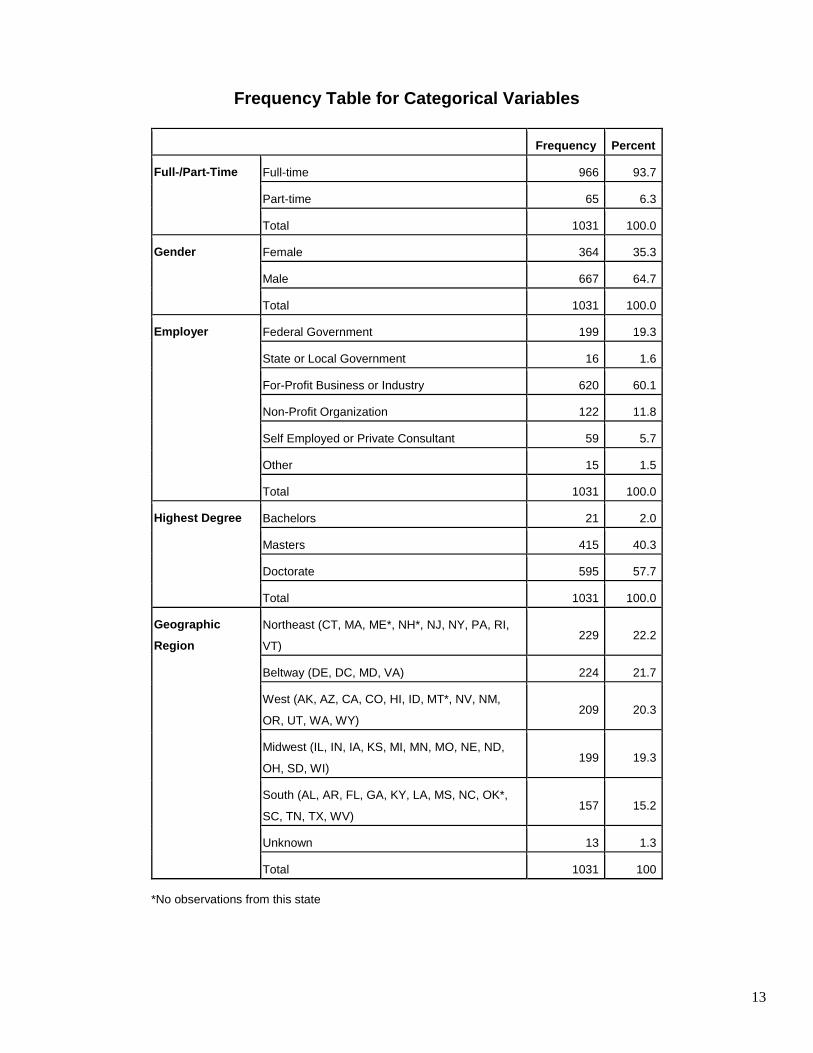
Sixty-five percent (65%) of the respondents were male. The majority (60%) reported employment by a for-profit-business or industry, followed by federal government (19%) and non-profit organization (12%). Thirty-six percent (36%) reported having managerial responsibility in their current position.
4
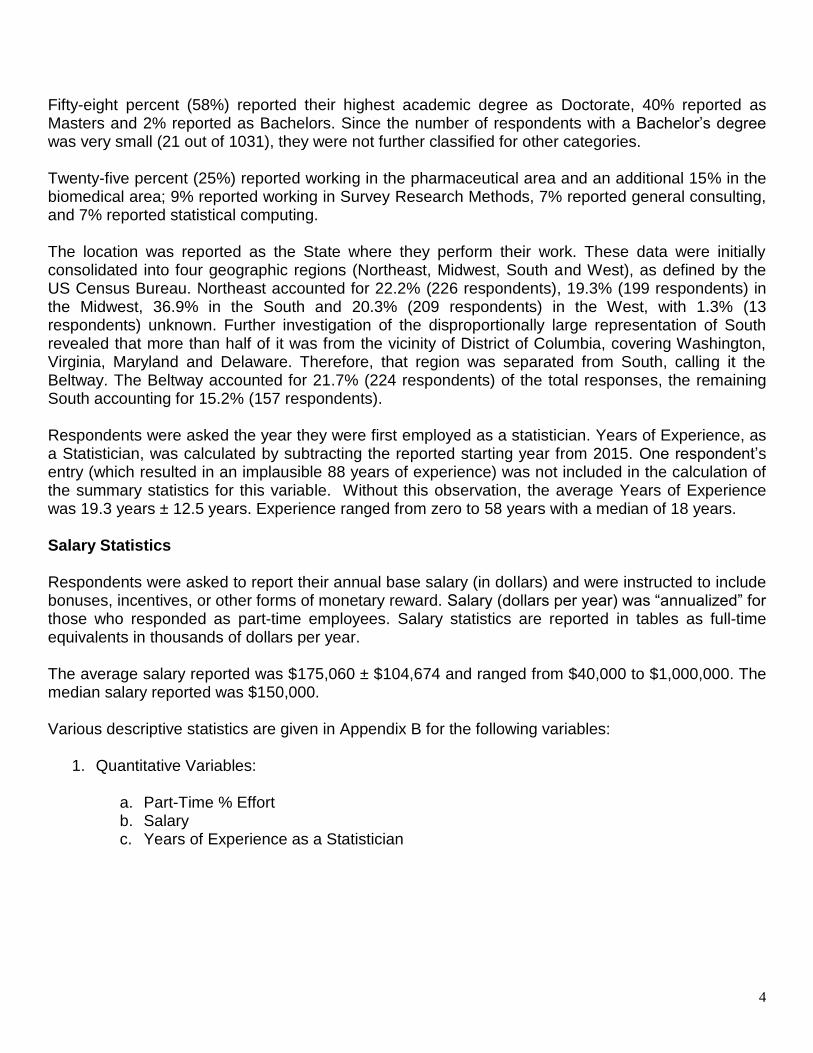
Fifty-eight percent (58%) reported their highest academic degree as Doctorate, 40% reported as Masters and 2% reported as Bachelors. Since the number of respondents with a Bachelor’s degree was very small (21 out of 1031), they were not further classified for other categories. Twenty-five percent (25%) reported working in the pharmaceutical area and an additional 15% in the biomedical area; 9% reported working in Survey Research Methods, 7% reported general consulting, and 7% reported statistical computing. The location was reported as the State where they perform their work. These data were initially consolidated into four geographic regions (Northeast, Midwest, South and West), as defined by the US Census Bureau. Northeast accounted for 22.2% (226 respondents), 19.3% (199 respondents) in the Midwest, 36.9% in the South and 20.3% (209 respondents) in the West, with 1.3% (13 respondents) unknown. Further investigation of the disproportionally large representation of South revealed that more than half of it was from the vicinity of District of Columbia, covering Washington, Virginia, Maryland and Delaware. Therefore, that region was separated from South, calling it the Beltway. The Beltway accounted for 21.7% (224 respondents) of the total responses, the remaining South accounting for 15.2% (157 respondents). Respondents were asked the year they were first employed as a statistician. Years of Experience, as a Statistician, was calculated by subtracting the reported starting year from 2015. One respondent’s entry (which resulted in an implausible 88 years of experience) was not included in the calculation of the summary statistics for this variable. Without this observation, the average Years of Experience was 19.3 years ± 12.5 years. Experience ranged from zero to 58 years with a median of 18 years. Salary Statistics Respondents were asked to report their annual base salary (in dollars) and were instructed to include bonuses, incentives, or other forms of monetary reward. Salary (dollars per year) was “annualized” for those who responded as part-time employees. Salary statistics are reported in tables as full-time equivalents in thousands of dollars per year. The average salary reported was $175,060 ± $104,674 and ranged from $40,000 to $1,000,000. The median salary reported was $150,000. Various descriptive statistics are given in Appendix B for the following variables:
1. Quantitative Variables:
a. Part-Time % Effort b. Salary c. Years of Experience as a Statistician

5
2. Categorical Variables:
a. Full-/Part-Time b. Gender c. Employer d. Highest Degree e. Geographic Region f. Managerial Responsibility g. Years of Experience (coded into intervals) h. Application Area or Job Type
Geographic Region was coded as:
Geographic Region States
Northeast CT, MA, ME, NH, NJ, NY, PA, RI, VT
Beltway DE, DC, MD, VA
West AK, AZ, CA, CO, HI, ID, MT, NV, NM, OR, UT, WA, WY
Midwest IL, IN, IA, KS, MI, MN, MO, NE, ND, OH, SD, WI
South AL, AR, FL, GA, KY, LA, MS, NC, OK, SC, TN, TX, WV
Unknown Unknown area of US
Appendix C gives percentiles (10, 25, 50, 75, 90) of overall Annual Salary and for levels of the following Variables:
1. Employer 2. Geographic Region 3. Managerial Responsibility 4. Gender 5. Highest Degree 6. Years of Experience 7. Application Area or Job Type
Appendix D gives Percentiles (10, 25, 50, 75, 90) of Annual Salary for Managerial Responsibility by Years of Experience by Highest Degree (Masters and Doctorate only). Appendix E gives Percentiles (10, 25, 50, 75, 90) of Annual Salary for Employer by Highest Degree. Appendix F gives Percentiles (10, 25, 50, 75, 90) of Annual Salary for Employer by Application Area or Type of Job by Highest Degree (Masters and Doctorate only).
6
III. COMMENTS AND SUGGESTIONS
Comments:
In 2015, Georgia Regents University (GRU) changed its name to Augusta University (AU).
Because a very small sample (21) of respondents indicated that their highest degree was bachelors, this degree group was not broken down into any smaller categories in the analyses.
Suggestions:
Several of those invited to participate in the survey commented that they were reluctant to provide their salary. Also, there were 53 respondents who indicated they were non-statisticians and 56 who were outside the US. A question could be included at the beginning of the survey to identify these non-eligible respondents, and the survey should end if a respondent fits into one of these categories, so they don’t have to fill out the rest of the information.
Consider alternatives to using SurveyMonkey® to administer the survey and collect responses. This may alleviate issues with SPAM filters
Consider comparing the characteristics of responders vs. the characteristics of non-responders.
IV. ACKNOWLEDGEMENTS The authors gratefully acknowledge the critical input provided by Donna LaLonde, Director of Strategic Initiatives and Outreach, Ronald L. Wasserstein, Executive Director, the ASA Survey Review Committee, Barry D. Nussbaum, Chair of 2015 SPAIG Committee, Kelly H. Zou, Chair of the 2016 SPAIG Committee, Polly Phipps, SPAIG Committee, Pamela D. McGovern, SPAIG Committee member, other members of the SPAIG Committee, and the members of the Survey Review Committee. We also wish to thank the ASA members who responded to the survey. Without their participation, the survey could not have been conducted. Their valuable comments will surely improve future surveys.
7
APPENDIX A
2015 American Statistical Association Salary Survey of Business, Industry, and Government Statisticians
8

9

10

11
Dear Colleague,
STAND UP AND BE COUNTED! Your assistance is requested for the 2015 American Statistical Association (ASA)
survey of statisticians in business, industry, government, and non-profit organizations. This research will update similar
ASA surveys conducted in the past (see reports on the Career Center page of the ASA Web site). Survey results will
provide relevant statistician salary benchmarks to ASA members and will be very helpful in addressing the salary/career
questions ASA receives from students, employers, and researchers. Your response is requested by January 8, 2016.
Your participation matters. You have been selected from the ASA membership records to participate in this survey. The
questions are brief and primarily relate to your current employment situation. It should take only 3 or 4 minutes to
complete. Your response is very important to an accurate representation of statistics as a career.
Your participation is voluntary; however we encourage you to make this special survey a priority. Strict security
procedures are in place so that your information will be kept confidential. All data will be stored in a password-protected
electronic format. To help protect your confidentiality, the survey will not contain information that will personally
identify you. Your name will not be associated with any information you provide.
The results of this study will be used for scholarly purposes only and will be shared with the ASA. Published data will be
summarized by type of organization and geographic region, as well as by academic degree and length of work experience.
We statisticians are well aware of the current trend toward decreasing survey response rates that can bias a study’s results.
Let’s practice what we preach and prove that statisticians value high response rates by completing this survey conducted
on our very own population of professionals. Please use this link [SurveyLink] and complete the survey today.
If you have questions about the survey, please contact Donna LaLonde at [email protected].
Thank you for all that you do to support the ASA.
Happy Holidays!
Please note: If you do not wish to receive further survey emails from us, please click the link below, and you will be
automatically removed from our survey mailing list.
[OptOutLink]
Sincerely,
Statistical Partnerships Among Academe, Industry, & Government (SPAIG) Committee

12
APPENDIX B – Descriptive Statistics
Entire Sample Responding (N = 1031)
Descriptive Statistics for Quantitative Variables
Statistic Part-time % Effort
Salary (Annualized
in 1000s) Years of
Experience
N 65 1031 1030
Mean 53.7 175.1 19.3
Std. Deviation 23.3 104.7 12.5
Minimum 10.0 40.0 0.0
10th percentile 20.0 90.8 3.0
25th percentile 30.0 113.0 9.0
50th percentile 50.0 150.0 18.0
75th percentile 78.0 200.0 30.0
90th percentile 80.0 293.3 36.0
Maximum 90.0 1000.0 58.0
Number Non-Missing and Missing for Categorical Variables
Variable N # Missing
Full-/Part-Time 1031 0
Gender 1031 0
Employer 1031 0
Highest Degree 1031 0
Geographic Region 1018 13
Managerial Responsibility 1031 0
Application Area or Type of Job 1031 0
13
Frequency Table for Categorical Variables
Frequency Percent
Full-/Part-Time Full-time 966 93.7
Part-time 65 6.3
Total 1031 100.0
Gender Female 364 35.3
Male 667 64.7
Total 1031 100.0
Employer Federal Government 199 19.3
State or Local Government 16 1.6
For-Profit Business or Industry 620 60.1
Non-Profit Organization 122 11.8
Self Employed or Private Consultant 59 5.7
Other 15 1.5
Total 1031 100.0
Highest Degree Bachelors 21 2.0
Masters 415 40.3
Doctorate 595 57.7
Total 1031 100.0
Geographic
Region
Northeast (CT, MA, ME*, NH*, NJ, NY, PA, RI,
VT) 229 22.2
Beltway (DE, DC, MD, VA) 224 21.7
West (AK, AZ, CA, CO, HI, ID, MT*, NV, NM,
OR, UT, WA, WY) 209 20.3
Midwest (IL, IN, IA, KS, MI, MN, MO, NE, ND,
OH, SD, WI) 199 19.3
South (AL, AR, FL, GA, KY, LA, MS, NC, OK*,
SC, TN, TX, WV) 157 15.2
Unknown 13 1.3
Total 1031 100
*No observations from this state
14
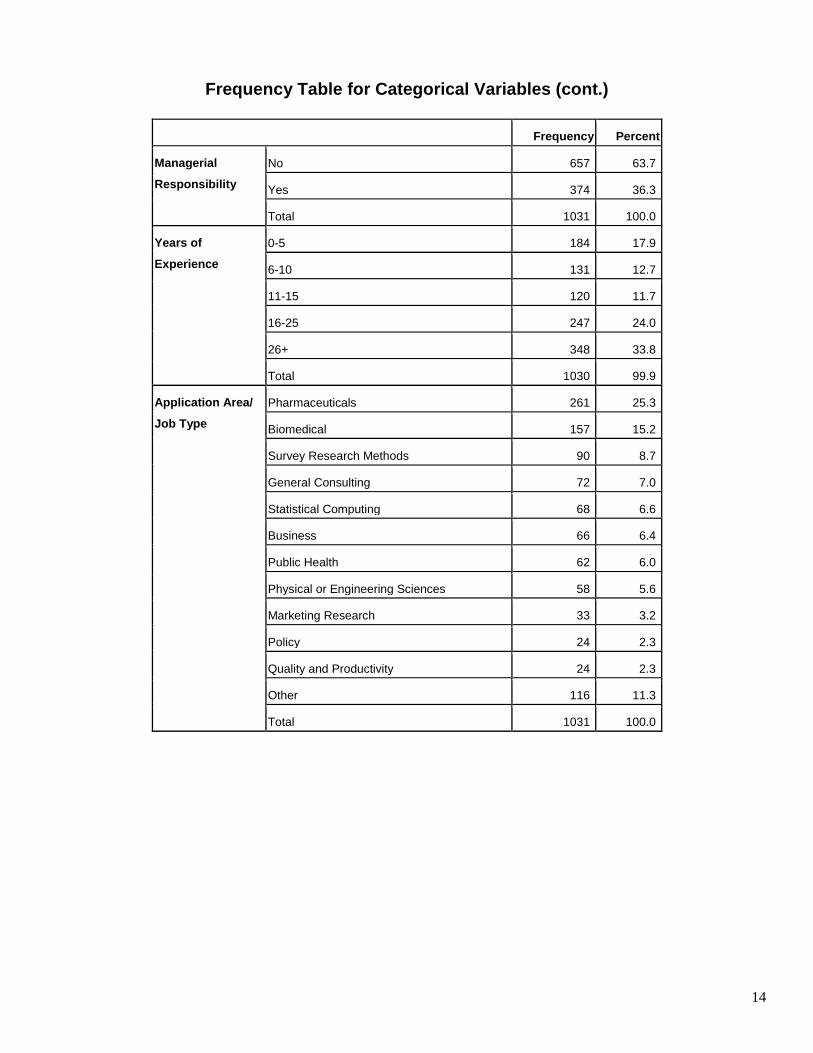
Frequency Table for Categorical Variables (cont.)
Frequency Percent
Managerial
Responsibility
No 657 63.7
Yes 374 36.3
Total 1031 100.0
Years of
Experience
0-5 184 17.9
6-10 131 12.7
11-15 120 11.7
16-25 247 24.0
26+ 348 33.8
Total 1030 99.9
Application Area/
Job Type
Pharmaceuticals 261 25.3
Biomedical 157 15.2
Survey Research Methods 90 8.7
General Consulting 72 7.0
Statistical Computing 68 6.6
Business 66 6.4
Public Health 62 6.0
Physical or Engineering Sciences 58 5.6
Marketing Research 33 3.2
Policy 24 2.3
Quality and Productivity 24 2.3
Other 116 11.3
Total 1031 100.0

15
APPENDIX C
Salary (Annualized in Thousands)
n
Percentiles
10 25 50 75 90
Total Sample 1031 90.8 113.0 150.0 200.0 293.3
Employer Federal Government 199 92.5 110.0 135.0 157.3 177.0
State or Local Government 16 75.0 80.0 105.5 137.5 202.6
For-Profit Business or Industry 620 97.0 120.0 161.0 236.5 300.0
Non-Profit Organization 122 75.0 92.0 120.0 152.0 200.2
Self-Employed/Private Consultant 59 100.0 120.0 180.0 275.0 360.0
Other 15 90.0 100.0 117.0 140.0 158.0
Geographic Region Northeast (CT, MA, ME*, NH*, NJ,
NY, PA, RI, VT)
229 100.0 135.0 180.0 250.0 350.0
Beltway (DE, DC, MD, VA) 224 95.0 115.5 146.0 168.1 220.1
West (AK, AZ, CA, CO, HI, ID,
MT*, NV, NM, OR, UT, WA, WY)
209 87.5 110.0 144.6 200.0 300.0
Midwest (IL, IN, IA, KS, MI, MN,
MO, NE, ND, OH, SD, WI)
199 80.0 106.0 133.0 180.0 265.0
South (AL, AR, FL, GA, KY, LA,
MS, NC, OK*, SC, TN, TX, WV)
157 81.0 106.0 140.0 200.0 277.0
Unknown (in US) 13 105.0 120.0 165.0 309.7 420.0
Managerial
Responsibility
No 657 83.0 103.0 130.5 172.5 245.0
Yes 374 111.0 140.0 177.1 250.0 350.0
Gender Female 364 85.0 103.0 134.0 178.6 260.0
Male 667 94.0 120.0 150.0 210.0 300.0
Highest Degree Bachelor's 21 63.0 88.0 120.0 152.0 190.0
Master's 415 80.0 97.5 125.0 170.0 240.0
Doctorate 595 105.0 128.9 160.0 228.0 325.0
*No observations from this state

16
APPENDIX C (cont.)
Salary (Annualized in Thousands)
n
Percentiles
10 25 50 75 90
Years of
Experience
0-5 184 68.0 81.5 100.0 123.0 157.4
6-10 131 85.0 99.6 122.0 145.0 175.0
11-15 120 100.0 114.0 142.9 189.5 250.0
16-25 247 110.0 140.0 177.3 250.0 324.0
26+ 349 116.0 139.5 170.0 240.0 350.0
Application Area
or Type of Job
Business & Industry 294 86.0 105.0 140.0 185.0 275.0
Pharmaceuticals 263 119.0 150.0 200.0 270.0 400.0
Health & Medicine 243 80.0 102.0 130.0 160.0 220.1
Survey Research Methods 92 92.5 118.0 147.5 166.1 205.0
General Consulting 72 90.0 112.3 146.0 195.0 300.0
Other 67 90.0 100.0 125.0 187.0 240.0

17
APPENDIX D
Managerial Responsibility by Experience by Highest Degree
Salary (Annualized in Thousands)
Years of
Experience
Highest
Degree1 n
Percentiles
10 25 50 75 90
No Managerial Responsibility
0-5 Master's 78 65.0 73.0 83.7 98.0 118.3
Doctorate 85 85.0 99.2 110.0 145.0 162.3
6-10 Master's 43 80.0 84.0 100.0 120.0 150.0
Doctorate 52 96.0 115.3 129.5 150.0 180.0
11-15 Master's 35 92.5 100.0 120.0 150.0 175.0
Doctorate 40 107.0 128.5 151.5 205.8 260.0
16-25 Master's 56 96.0 110.0 141.8 172.6 247.0
Doctorate 66 115.0 145.0 174.5 200.0 275.0
26+ Master's 72 103.0 120.0 147.5 201.5 250.0
Doctorate 116 120.0 139.8 166.0 231.7 362.0
Managerial Responsibility
0-5 Master's 5 63.0 90.8 120.0 123.0 150.0
Doctorate 12 100.0 111.1 124.5 162.5 180.0
6-10 Master's 11 90.0 92.5 115.0 130.0 135.0
Doctorate 23 107.0 120.0 140.0 175.0 250.0
11-15 Master's 16 96.0 104.0 136.6 172.5 189.0
Doctorate 26 129.0 140.0 195.0 250.0 293.0
16-25 Master's 44 120.0 130.0 172.5 265.0 310.0
Doctorate 77 145.0 175.0 228.0 300.0 425.0
26+ Master's 55 100.0 135.0 161.4 206.3 260.0
Doctorate 98 135.2 158.0 210.0 300.0 450.0
1There were too few respondents with a Bachelor’s degree to include in this table.

18
APPENDIX E
Employer by Highest Degree
Salary (Annualized in Thousands)
Employer
Highest
Degree1 n
Percentiles
10 25 50 75 90
Federal
Government Master's 69 73.0 100.0 118.1 141.0 157.2
Doctorate 125 98.0 118.0 144.6 160.0 190.0
State or Local
Government Master's 9 55.0 80.0 86.0 111.0 202.6
Doctorate 7 75.0 100.0 120.0 141.8 230.0
For-Profit Business
or Industry Master's 254 85.0 104.0 140.0 187.0 252.0
Doctorate 354 115.0 143.0 185.0 270.0 400.0
Non-Profit
Organization Master's 52 67.0 79.0 94.3 114.8 148.0
Doctorate 67 100.0 118.0 140.0 190.0 228.0
Self-Employed or
Private Consultant Master's 26 83.3 113.6 146.8 225.0 360.0
Doctorate 32 110.0 135.0 200.0 277.5 350.0
Other Master's 5 100.0 102.0 117.0 130.0 140.0
Doctorate 10 85.0 99.2 114.0 157.0 166.0
1There were too few respondents with a Bachelor’s degree to include in this table.

19
APPENDIX F
Employer by Application Area or Type of Job by Highest Degree
Salary (Annualized in Thousands)
Employer
Application Area or
Type of Job
Highest
Degree1 n
Percentiles
10 25 50 75 90
Federal
Government
Business & Industry Master's 14 72.0 73.0 112.0 130.0 155.0
Doctorate 20 98.0 100.0 112.5 154.4 171.5
Pharmaceuticals Doctorate 7 121.6 129.0 149.0 168.2 200.0
Health & Medicine Master's 12 110.0 118.0 126.5 132.5 141.0
Doctorate 50 99.2 128.8 146.8 160.0 201.4
Survey Research
Methods
Master's 23 96.0 110.0 139.5 155.0 170.0
Doctorate 31 98.0 120.0 150.0 165.0 175.0
General Consulting Master's 7 64.4 90.8 110.0 135.0 156.7
Doctorate 7 88.2 135.0 139.5 158.7 700.0
Other Master's 13 84.0 90.8 99.0 107.0 145.0
Doctorate 10 85.5 125.0 150.0 174.0 230.0
For-Profit
Business or
Industry
Business & Industry Master's 98 80.0 95.0 125.0 160.0 240.0
Doctorate 122 107.0 129.6 163.6 233.0 324.0
Pharmaceuticals Master's 82 105.0 130.0 171.8 240.0 270.0
Doctorate 153 128.8 165.0 220.0 300.0 429.0
Health & Medicine Master's 39 84.5 99.0 120.0 158.0 204.0
Doctorate 41 115.0 140.0 161.0 239.9 300.0
Survey Research
Methods
Master's 10 86.1 118.7 142.8 162.5 420.0
Doctorate 10 114.8 130.0 162.5 221.4 229.0
General Consulting Master's 15 80.0 92.0 140.0 200.0 250.0
Doctorate 21 114.5 130.0 170.0 250.0 300.0
Other Master's 10 77.3 97.5 156.0 240.0 382.5
Doctorate 7 100.0 115.0 116.0 150.0 210.0
1
There were too few respondents with a Bachelor’s degree to include in this table.

20
APPENDIX F
Employer by Application Area or Type of Job by Highest Degree (cont.)
Salary (Annualized in Thousands)
Employer
Application Area or
Type of Job
Highest
Degree1 n
Percentiles
10 25 50 75 90
Other (State/Local
Government,
Nonprofit
Organization, Self-
Employed/Private
Consultant, and
Other Employers
not listed above)
Business & Industry Master's 17 77.5 83.3 117.0 152.0 225.0
Doctorate 11 100.0 120.0 155.0 160.0 200.0
Pharmaceuticals Master's 6 100.0 130.0 145.0 200.0 200.0
Doctorate 13 110.0 125.0 200.0 275.0 350.0
Health & Medicine Master's 43 65.4 77.0 100.0 122.2 150.0
Doctorate 48 85.0 113.5 134.1 177.0 228.0
Survey Research Methods
Master's 5 73.0 81.0 86.9 125.0 130.0
Doctorate 9 90.0 120.0 205.0 250.0 500.0
General Consulting Master's 7 88.0 96.0 170.0 316.7 360.0
Doctorate 13 108.0 135.0 175.6 190.0 240.0
Other Master's 5 90.0 92.5 99.1 133.3 400.0
Doctorate 15 99.2 110.0 175.0 205.0 300.0
1
There were too few respondents with a Bachelor’s degree to include in this table.