Embed Size (px)
Citation preview

RESEARCH REPORT Agreement T4118, Task 29
QA-QC Comparison
STATISTICAL ASSESSMENT OF QUALITY ASSURANCE-QUALITY CONTROL DATA FOR HOT MIX ASPHALT
Colin J. LaVassar and Joe P. Mahoney University of Washington
Department of Civil and Environmental Engineering, Box 352700 Seattle, Washington 98195
and
Kim A. Willoughby
Washington State Department of Transportation P.O. Box 47372
Olympia, Washington 98504
Washington State Transportation Center (TRAC) University of Washington, Box 354802
1107 NE 45th Street, Suite 535 Seattle, Washington 98105-4631
Washington State Department of Transportation Technical Monitor Kim Willoughby
Research Office, WSDOT
Prepared for Washington State Transportation Commission
Department of Transportation and in cooperation with
U.S. Department of Transportation Federal Highway Administration
February 2009
TECHNICAL REPORT STANDARD TITLE PAGE
1. REPORT NO.
WA-RD 686.1 2. GOVERNMENT ACCESSION NO. 3. RECIPIENT’S CATALOG NO.
5. REPORT DATE
February 2009 4. TITLE AND SUBTITLE
STATISTICAL ASSESSMENT OF QUALITY ASSURANCE-QUALITY CONTROL DATA FOR HOT MIX ASPHALT
6. PERFORMING ORGANIZATION CODE
7. AUTHORS
Colin J. LaVassar, Joe P. Mahoney, and Kim A. Willoughby 8. PERFORMING ORGANIZATION CODE
10. WORK UNIT NO. 9. PERFORMING ORGANIZATION NAME AND ADDRESS
Washington State Transportation Center University of Washington, Box 354802 University District Building, 1107 NE 45th Street, Suite 535 Seattle, Washington (98105-7370)
11. CONTRACT OR GRANT NUMBER
Agreement T4118, Task 29
13. TYPE OF REPORT AND PERIOD COVERED
Final Research Report 12. SPONSORING AGENCY NAME AND ADDRESS
Research Office Washington State Department of Transportation Transportation Building, MS 47372 Olympia, Washington 98504-7372 Project Manager: Kim Willoughby, 360-705-7978
14. SPONSORING AGENCY CODE
15. SUPPLIMENTARY NOTES
16. ABSTRACT
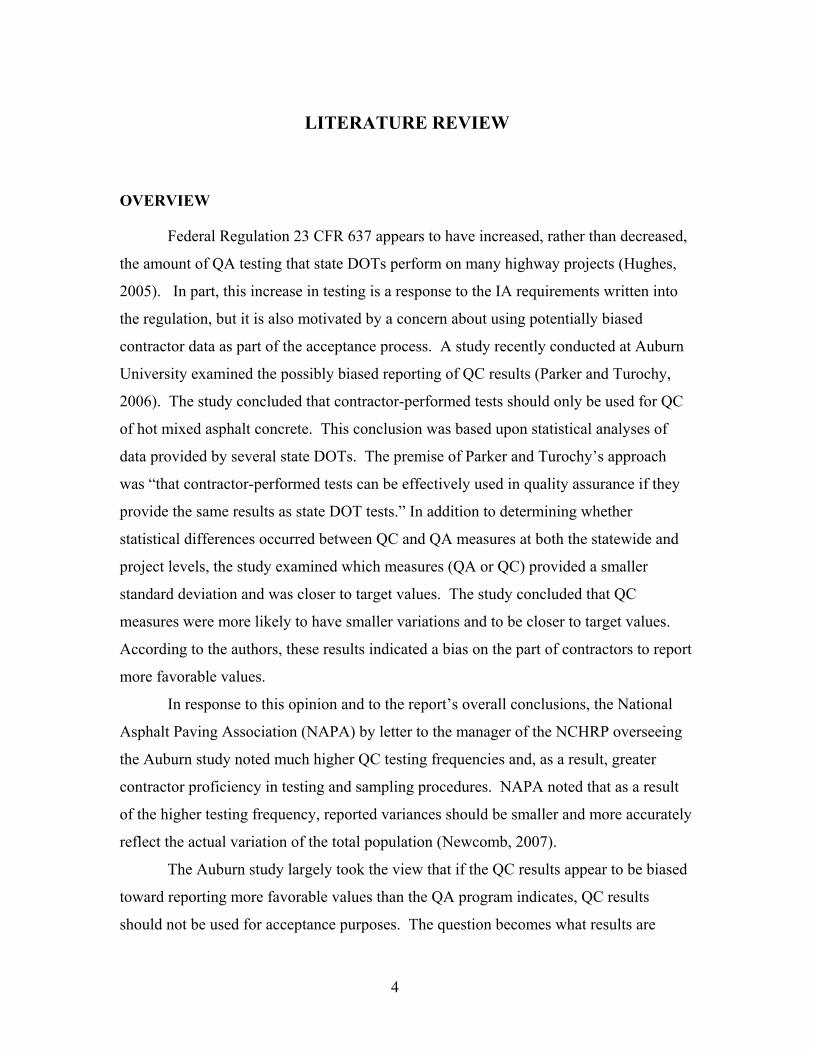
Recent trends in the paving industry have resulted in increased contractor involvement in the design, acceptance, and performance of hot mix asphalt (HMA) pavements. As a result, questions have arisen about whether contractor process control tests, alternatively known as quality control (QC), should be incorporated into the acceptance and pay factor processes that state highway agencies currently use. To examine this issue, various statistical tests were used including F and t-tests to compare QC data to agency-obtained quality assurance (QA) results. The percentage of projects that exhibited statistically significant differences in mean values and variances was calculated and assessed. For projects that had statistically similar QC and QA results, the average difference between the two testing programs was calculated. The results of the statistical analysis were analyzed from both a statistical and engineering perspective.
This report contains data from four state DOTs—California, Minnesota, Texas, and Washington. These states also provided the funding for the study.
17. KEY WORDS
Hot mix asphalt, quality control, quality assurance, statistical assessment, Student t-test, F-test, precision and bias
18. DISTRIBUTION STATEMENT
19. SECURITY CLASSIF. (of this report) 20. SECURITY CLASSIF. (of this page) 21. NO. OF PAGES 22. PRICE

iii
DISCLAIMER
The contents of this report reflect the views of the authors, who are responsible
for the facts and the accuracy of the data presented herein. The contents do not
necessarily reflect the official views or policies of the Washington State Transportation
Commission, Washington State Department of Transportation, or Federal Highway
Administration. The contents also do not necessarily reflect the official views or policies
of the California Department of Transportation, Minnesota Department of Transportation,
or Texas Department of Transportation. This report does not constitute a standard,
specification, or regulation.
ACKNOWLEDGMENTS
The authors would like to acknowledge and thank the four member states of the State
Pavement Technology Consortium (SPTC), California, Minnesota, Texas, and
Washington, for funding this study and providing the data.

iv

TABLE OF CONTENTS
BACKGROUND.................................................................................................................. 1
LITERATURE REVIEW ................................................................................................... 4 Overview ............................................................................................................................... 4 Types of Specifications ......................................................................................................... 7 RESEARCH METHODOLOGY....................................................................................... 10 Overview ............................................................................................................................... 10 Statistical Procedures............................................................................................................. 10 DATA ANALYSIS............................................................................................................... 16 California Department of Transportation .............................................................................. 16 Washington State Department of Transportation Data.......................................................... 19 Texas Department of Transportation Data ............................................................................ 20 Minnesota Department of Transportation Data ..................................................................... 22 DISCUSSION OF DATA.................................................................................................... 26 Caltrans Data ......................................................................................................................... 26 WSDOT Data ........................................................................................................................ 27 Texas DOT Data.................................................................................................................... 28 Minnesota DOT Data ............................................................................................................ 28 CONCLUSIONS…………………………………………………………………………….. 30 Statistical Validation Procedures........................................................................................... 30 State Data Comparison .......................................................................................................... 30 REFERENCES .................................................................................................................... 31 BIBLIOGRAPHY................................................................................................................ 32 APPENDIX A WSDOT HMA QA/QC Study................................................................... A-1 APPENDIX B Texas Dot HMA QA/QC Study................................................................. B-1 APPENDIX C Caltrans HMA QA/QC Study................................................................... C-1 APPENDIX D Minnesota DOT Asphalt Film Thickness Study QA/QC Testing Results D-1 APPENDIX E Code of Federal Regulations (CFR): 23 CFR 637 .................................... E-1 APPENDIX F Terminology Associated with Precision Statements……………………. F-1
v

TABLES
Table Page
1 Summary of State Data Contained in the Auburn Study (α = 0.01) .............. 6
2 California Precision Indices........................................................................... 17
3 Analysis of California Data (α = 0.01, D2S Filtering) .................................. 18
4 Analysis of California Data (α = 0.01, No D2S Filtering)............................. 19
5 Analysis of WSDOT Data (α = 0.01) ............................................................ 20
6 Analysis of Texas DOT Statistically Significant Differences (α = 0.01) ...... 21
7 Summary of Texas DOT Data (α = 0.01) ...................................................... 22
8 Analysis of Minnesota Data (α = 0.01).......................................................... 24
9 Summary of MnDOT Core Data.................................................................... 25
10 Summary of MnDOT Split Sample Data....................................................... 25
11 Summary of Caltrans QC Utilization Program.............................................. 26
12 Summary of WSDOT Data (α = 0.01) ........................................................... 27
13 Summary of Minnesota data (α = 0.01) ......................................................... 29
FIGURE
Figure Page
1 Critical t-Statistics vs Sample Size and Significance Level .......................... 14
vi

1
BACKGROUND
In the late 1950s the American Association of State Highway and Transportation
Officials (AASHTO—then AASHO) constructed a large-scale experimental paving
project to better understand the issues related to pavement design, construction, and life-
cycle performance of pavements. A significant result of this study was a realization that
flexible pavements exhibited higher variability than expected. This finding led to several
refinements in specification systems. One of the refinements was the introduction of
statistical measures to better quantify the mean values and variances of layer and material
properties with a focus on hot mix asphalt (HMA). A second refinement was the
increased use of specification systems that focus on pavement quality rather than on
standardized construction practices. Most modern specification systems incorporate one
or both of these elements.
To better control HMA quality, most specification systems attempt to balance the
risk of poor performance between the state department of transportation (DOT) and the
contractor. These systems generally grant greater autonomy to the contractor during the
design process and construction. In exchange for increased autonomy, the contractor
assumes a portion of the project risk. This provides motivation to the contractor to
deliver a quality product, while the autonomy and design involvement encourages
efficient and innovative designs and construction practices.
These trends have redirected the emphasis of specification systems toward the
delivery of quality, cost-effective pavements, rather than merely focusing on pre-
established construction guidelines. In pursuit of these goals and to limit their own
testing burden, many state DOTs are beginning to use all available information to better
control HMA quality (Hughes, 2005). This practice entails the use of contractor quality
control (QC) data as part of the acceptance process. A prerequisite to using the QC data
is that they must be validated. Currently, several different methods are available to
validate QC results, ranging from simple one-to-one comparisons of split samples to
statistical F and t-tests. This project utilized F and t-tests to determine whether there are
statistically significant differences between reported QC and quality assurance (QA)

measurements. The QC results are only validated if the mean values are not statistically
different at a given significance level. Note that this method of validation is not based
upon engineering considerations but merely mathematical criteria. The assumption
inherent in this validation procedure is that with a relatively small number of samples,
any differences between mean QC and QA values that will adversely affect the behavior
of the material will also be detected by the statistical analysis. This is one approach to
comparing QA and QC results. Such statistical procedures do not assess which data set is
actually more “correct.”
In the past, QC data generally have been omitted from the decision making
process as the benefits of its inclusion were outweighed by the concern that a contractor
would report biased values in comparison to the QA results gathered by the state DOT.
This concern has begun to fade. In 1993 an unpublished report entitled Limits of the Use
of Contractor Performed Sampling and Testing (FHWA, 1993) recommended that
contractor quality control data be used in the quality assurance decision for HMA
projects. This recommendation was written into law in 1995 with the enactment of 23
CFR 637 (Code of Federal Regulations, 2007). (Appendix E contains the complete text
for 23 CFR 637.) This regulation allows for the use of a contractor’s QC data in the QA
process for all federal-aid highway projects with the conditions that (1) the contractor’s
technicians and laboratories must be qualified to perform the sampling and tests, (2)
verification samples and testing must be done independently of QC to assess the quality
of the material, and (3) an independent assurance program is used to assess the QC
sampling and testing. The intention of this regulation is to assure the quality of HMA
pavements by using all available test data in the acceptance process.
In 2005, the National Cooperative Highway Research Program (NCHRP)
published a summary of state quality assurance programs (Hughes, 2005). In the report,
Hughes noted that there is significant confusion as to the meaning and proper
implementation of the independent assurance (IA) requirement contained in 23 CFR 637.
Hughes noted that there are two definitions for this term. The first is that the independent
assurance program is meant to validate the contractor’s testing procedures and results. In
this interpretation, the state DOT and the contractor conduct identical tests on split
samples to determine whether there are statistically significant differences between the
2

test results. This system measures testing variability. The second interpretation of IA is
that it is to provide an assessment of the resulting product, rather than the contractor’s test
results. This requires that the verification samples be taken at separate locations
independent of the QC program so that comparisons to the overall quality of the HMA
can be determined. According to the report, both interpretations are currently being
utilized by state DOTs. Optimal Procedures for Quality Assurance Specifications
(FHWA, 2003), or OPQAS, states that the first system should be called “test method
verification” and that the second should be termed “process verification” to eliminate
confusion.
3
LITERATURE REVIEW
OVERVIEW
Federal Regulation 23 CFR 637 appears to have increased, rather than decreased,
the amount of QA testing that state DOTs perform on many highway projects (Hughes,
2005). In part, this increase in testing is a response to the IA requirements written into
the regulation, but it is also motivated by a concern about using potentially biased
contractor data as part of the acceptance process. A study recently conducted at Auburn
University examined the possibly biased reporting of QC results (Parker and Turochy,
2006). The study concluded that contractor-performed tests should only be used for QC
of hot mixed asphalt concrete. This conclusion was based upon statistical analyses of
data provided by several state DOTs. The premise of Parker and Turochy’s approach
was “that contractor-performed tests can be effectively used in quality assurance if they
provide the same results as state DOT tests.” In addition to determining whether
statistical differences occurred between QC and QA measures at both the statewide and
project levels, the study examined which measures (QA or QC) provided a smaller
standard deviation and was closer to target values. The study concluded that QC
measures were more likely to have smaller variations and to be closer to target values.
According to the authors, these results indicated a bias on the part of contractors to report
more favorable values.
In response to this opinion and to the report’s overall conclusions, the National
Asphalt Paving Association (NAPA) by letter to the manager of the NCHRP overseeing
the Auburn study noted much higher QC testing frequencies and, as a result, greater
contractor proficiency in testing and sampling procedures. NAPA noted that as a result
of the higher testing frequency, reported variances should be smaller and more accurately
reflect the actual variation of the total population (Newcomb, 2007).
The Auburn study largely took the view that if the QC results appear to be biased
toward reporting more favorable values than the QA program indicates, QC results
should not be used for acceptance purposes. The question becomes what results are
4

observed by comparing data from the states of California, Minnesota, Texas and
Washington. This report will attempt an answer.
In addition to a statewide analysis, the Auburn study (Parker and Turochy, 2006)
examined results of QA and QC measurements at a project level for data obtained from
Georgia, Florida, Kansas, and California. The analysis was similar to the approach taken
by this study. Because state highway agencies make acceptance and pay factor
determinations at a project or lot level, comparing data at this level is relevant to the
discussion of using QC test data. Another benefit of comparing data at the project level
is that the number of samples in the testing populations is small in comparison to those
for a statewide analysis. The statistical tests are dependent upon the sample sizes to
determine both the t-statistic and the critical t values. As the sample size increases, the t-
statistic increases, and the critical t-value decreases. This increases the probability that
small differences between mean values will be statistically significant. The magnitude of
these significant differences can easily be smaller than the inherent variability of the
testing procedure. Thus statistical tests on sample sizes that are much larger than those
typically found at the project level may not be relevant to the discussion.
A summary of the Auburn study’s project-level analysis is shown in Table 1. The
California data indicate that a slightly higher percentage of projects exhibited statistically
significant differences between mean values and variances than were found for this study.
Overall, however, the two studies produced similar results.
5

Table 1. Summary of State Data Contained in the Auburn Study (α = 0.01)
Number of
Projects
Projects with Statistical
Differences between Variances
Projects with Statistical
Differences between Mean
Values
#
Projects % #
Projects % 12.3-mm (1/2") 35 2 5.7% 0 0.0%
75-um (#200) 35 3 8.6% 2 5.7%
Spl
it S
ampl
es
Asphalt Content (%) 41 1 2.4% 1 2.4%
12.3-mm (1/2") 114 13 11.4% 10 8.8%
75-um (#200) 126 15 11.9% 13 10.3%
Geo
rgia
Inde
pend
ent
Sam
ples
Asphalt Content (%) 114 12 10.5% 10 8.8%
12.3-mm (1/2") 29 3 10.3% 1 3.4% 9.5-mm (3/8") 29 2 6.9% 0 0.0% 4.75-mm (#4) 29 4 13.8% 0 0.0% 2.36-mm (#8) 30 3 10.0% 1 3.3%
(#16) 29 1 3.4% 1 3.4% (#30) 29 0 0.0% 2 6.9%
600-um (#50) 29 2 6.9% 1 3.4% (#100) 29 2 6.9% 1 3.4%
75-um (#200) 30 6 20.0% 2 6.7%
Spl
it S
ampl
es
Asphalt Content (%) 30 3 10.0% 0 0.0%
12.3-mm (1/2") 25 5 20.0% 1 4.0% 9.5-mm (3/8") 24 3 12.5% 2 8.3% 4.75-mm (#4) 25 5 20.0% 2 8.0% 2.36-mm (#8) 25 5 20.0% 1 4.0%
(#16) 25 1 4.0% 1 4.0% (#30) 25 1 4.0% 1 4.0%
600-um (#50) 25 2 8.0% 1 4.0% (#100) 25 1 4.0% 1 4.0%
75-um (#200) 25 0 0.0% 2 8.0%
Flor
ida
Inde
pend
ent S
ampl
es
Asphalt Content (%) 26 3 11.5% 2 7.7%
6

Table 1. Summary of State Data contained in Auburn Study (α = 0.01) continued
Number of Projects
Projects with Statistical
Differences between
Variances
Projects with Statistical
Differences between Mean
Values
# Projects % #
Projects %
Air Voids (%) 24 5 20.8% 0 0.0% Gmm 23 2 8.7% 3 13.0%
Kan
sas
Inde
pend
ent
Sam
ples
%Gmm 24 13 54.2% 11 45.8%
19- or 12.5-mm (3/4" or 1/2") 77 17 22.1% 18 23.4%
9.5-mm (3/8") 86 17 19.8% 19 22.1% 4.75-mm (#4) 86 20 23.3% 12 14.0% 2.36-mm (#8) 86 23 26.7% 14 16.3% 600-um (#30) 86 20 23.3% 13 15.1% 75-um (#200) 85 31 36.5% 25 29.4%
Cal
iforn
ia
Inde
pend
ent S
ampl
es
Asphalt Content (%) 82 26 31.7% 26 31.7%
TYPES OF SPECIFICATIONS
Currently, a multitude of specification systems are used throughout the United
States that govern the acceptance and construction of HMA pavements. These
specification systems vary in their distribution of risk, allowance of contractor autonomy,
and in the definition of successful HMA pavements. This section is largely a summary of
information in TRB Circular E-C037 (2002). The discussion is included to briefly recap
current and past systems.
The oldest specification system is the methods approach. In this system the
controlling agency specifies both the materials and the construction processes to be used
by the contractor. The contractor is neither rewarded nor encouraged to be creative in the
construction process. A successful HMA pavement is defined as one that is constructed
according to the specifications, largely independent of actual pavement quality/
performance. The state DOT assumes the vast majority of the risk in this system. The
benefit to the state is that it requires only a simple test for acceptance of HMA
7

pavements. However, a recent survey (Hughes, 2005) revealed that the limitations
imposed upon contractors, the simplified definition of success, and the unbalanced risk
distribution of this system have result in it being used by only two state highway
agencies.
Perhaps the most common specification systems, employed by at least 21 state
highway agencies, are quality assurance specifications. These systems are alternatively
called QA/QC specifications. These systems divide the responsibility of producing a
quality HMA pavement into process control (QC) conducted by the contractor and
quality assurance (QA) performed by the SHA. The focus of these systems is usually
measurement of material properties such as density, asphalt content, and gradation within
certain ranges to control the quality of product. The systems allow the contractor greater
autonomy to control and streamline the process by which the HMA is produced. The QA
program is used to provide an independent evaluation of both the construction method
and of in-situ HMA properties. Statistical analysis of both QA and QC test results are
common and allow for both the average and the dispersion of measured parameters. In a
QA/QC system risk is shared between the contractor and the SHA (although the risks are
not necessarily the same).
The latest specification systems are oriented toward the actual and predicted
performance of HMA pavements. These specifications include one or more of three
approaches. The first is to require contractors to warranty pavement performance for a
set period of time at a specified minimum level of service. This should allow the
contractor significant autonomy in the construction process while ensuring a minimal or
no rehabilitation cost to the state DOT for a set time period. Warranties also place the
short-term risks of poor performance entirely on the contractor, motivating quality
workmanship. The second approach is to measure mechanical properties of constructed
HMA pavements. These properties are then used in conjunction with anticipated traffic
loads to model the deterioration of the pavement over time. Typical mechanical
properties of interest are resilient (or dynamic) modulus, creep, and fatigue
characteristics. The high cost and time requirements of this system make it generally
unappealing at present to both contractors and state DOTs. The final approach is to
8

predict future performance by using empirical relationships based upon easily obtained
properties such as density, asphalt content, pavement thickness, and gradation.
Any specification system that allows QC results to be used in the QA process
should provide adequate protection against the possibility of accepting sub-par
pavements. In part, this eventuality can be prevented by using statistical F- and t-tests to
compare the mean values and variances of QC and QA measurements. These controls
can identify relatively small differences between the two testing programs with only a
minimal number of state DOT testing requirements.
9

RESEARCH METHODOLOGY
OVERVIEW
The purpose of this study was to determine the percentage of state DOT projects
for which a statistically significant difference exists between the contractor’s QC and
state’s QA test results for HMA pavements. The study tracked average differences
between QC and QA test results when statistically significant differences were not found
between the two measures. The rationale behind this approach was that QC results could
be used for pay factor determination if they were statistically similar to the QA tests. The
material parameters analyzed as part of this study included asphalt content, aggregate
gradations, air voids, and in-place density. The California, Minnesota, Texas, and
Washington State DOTs provided data.
A short review of common statistical terms and concepts follow.
STATISTICAL PROCEDURES
Statistical analysis represents a tool for describing populations that have inherent
variations. For this study, a population was defined as the entire HMA production in a
given lot or project. Tests are conducted at discrete points within a population to
determine parameters such as the mean or standard deviation (or variance). The test
results are combined to form a sample set of the overall population. As the testing
frequency increases, the number of results in the sample set increases, and the sample
more accurately reflects the overall population’s true mean and variance values. In the
extreme, if every possible test location were tested, the sample set would match the
population.
The most common measure used to describe either sample sets or populations is
the mean. The mean is the average or expected value and can be used to describe either a
sample set or a population. The mean is denoted as x and is defined as:
n
x
nxxx
x
n
ii
n∑
==+⋅⋅⋅++
= 121 (1)
10

The variance of a sample or population is another commonly used statistic. The
variance is a measure of the scatter of individual measurements about the mean value. A
small variance is reflected in a tight clustering of values about the mean, whereas a large
variance indicates that the values are widely spread. The variance is denoted as . The
square root of the variance is the more common measure, termed the standard deviation,
and is denoted by or σ. The definition of the variance is:
2s
s
1)( 2
2
−−
= ∑n
xxs i (2)
The normal distribution is a statistical tool used to model the distribution of
continuous variables in a population. The normal distribution is a bell shaped curve that
can be characterized fully by two parameters, which are the mean and standard deviation.
For HMA pavements, normal distributions are usually used for properties such as density,
air voids, and gradations, as they are a reasonable approximation of observed values. The
normal distribution is not an exact measure, however, as it predicts both excessively large
and even negative values at extremely low probabilities.
The Student’s t-test is a statistical procedure for determining whether differences
occur between two sample sets at a given significance level. For this study, the Student’s
t-test was used to detect statistical differences between the means of the QC and QA
testing programs. The assumptions involved with the t-test require that both samples be
taken from normally distributed populations. These assumptions are appropriate for
HMA pavements because the tested parameters can be reasonably approximated with a
normal distribution. A significance level of α = 0.01 was used for this study’s t-tests. At
this significance level there is 1.0 percent chance of rejecting a null hypothesis when it is
actually true. If the magnitude of the significance level were increased (say α = 0.05), the
allowable difference between the QC and QA programs would be reduced, and the
percentage of projects that exhibited statistical differences would get larger. The null
hypothesis for all tests in this study was that the means of the QC and QA tests for each
project were equal. The α level was thus a measure of the contractor’s or seller’s risk.
The magnitude of α was chosen to be consistent with current SHA systems that utilize
QC data and the Parker and Turochy study. Other α levels could have been used.
11

The Student’s t-test is based upon the t-statistic and can be used with both paired
and unpaired sample sets. Paired sample sets (for example) occur in HMA pavements
when both a state DOT and a contractor perform tests on split samples. The pair of
samples relate to the same material of the total population. Independent or unpaired
samples occur when SHA and contractor tests are taken at different locations. Gradations
are more likely than density or air-void contents to be composed of paired sampling.
The null hypothesis for this study for unpaired data using a two-sided Student’s t-
test was that there is no statistical difference between the mean values of QC and QA
results. Expressed mathematically this is:
Null Hypothesis 0:0 =− QAQC xxH (3)
Alternate Hypothesis 0:1 ≠− QAQC xxH (4)
The t-statistic with unequal sample variances was defined as:
QA
QA
QC
QC
QAQC
ns
ns
xxt
22
+
−= (5)
where # of QC test results =QCn
=QAn # of QA test results
The t-statistic with equal sample variances was defined as:
t =
QAQCp
QAQC
nnS
xx
11+
− (6)
where = the pooled standard deviation and was defined as: PS
( ) ( )2
11 222
−+
−+−=
QAQC
QAQAQCQCP nn
nsnsS (7)
The t-test also depended upon the number of both the QC and QA sample sizes.
The sample sizes were used to compute a single measure of the number of degrees of
freedom of the test, denoted df. This is an important concept in that small sample sizes
reduce the resolution of the t-test. Thus it was necessary to have a sufficient number of
12
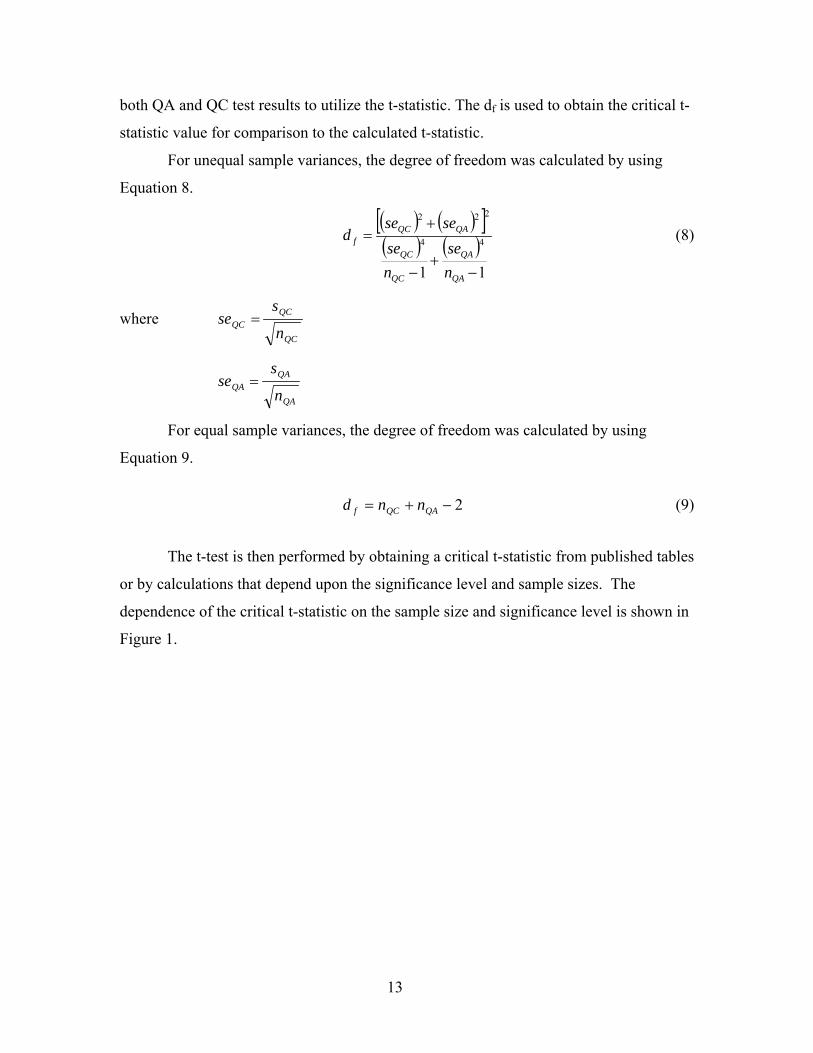
both QA and QC test results to utilize the t-statistic. The df is used to obtain the critical t-
statistic value for comparison to the calculated t-statistic.
For unequal sample variances, the degree of freedom was calculated by using
Equation 8.
( ) ( )[ ]( ) ( )
11
44
222
−+
−
+=
QA
QA
QC
QC
QAQCf
nse
nse
sesed (8)
where QC
QCQC n
sse =
QA
QAQA n
sse =
For equal sample variances, the degree of freedom was calculated by using
Equation 9.
2−+= QAQCf nnd (9)
The t-test is then performed by obtaining a critical t-statistic from published tables
or by calculations that depend upon the significance level and sample sizes. The
dependence of the critical t-statistic on the sample size and significance level is shown in
Figure 1.
13

0
2
4
6
8
10
0 5 10 15 20 25 30 35 40 45 50
Sample Size
Crit
ical
t-st
atis
tic
Signif icance Level α = 5% "Signif icance Level α = 1%"
Figure 1. Critical t-Statistics vs Sample Size and Significance Level
If the calculated t-statistic is less than the critical t-statistic (based on the
significance level), then the null hypothesis is not disproved (hypothesis testing, by
necessity uses somewhat ambiguous language—if the null hypothesis is “accepted” then
the official statement is that one fails to reject the null hypothesis). If the calculated t-
statistic based on the data examined is larger than the critical t-statistic, then the null
hypothesis (H0) is disproved, and the alternate hypothesis (H1) that the means are
different is accepted.
F-tests can be used to detect statistical differences between the variances of the
QC and QA samples. The F-test compares the ratio of the variances of the QC and QA
test results. The F-test requires the same assumptions about the underlying population
distribution as the t-test (i.e., normal distribution).
The F-statistic can be calculated as:
QC
QA
ssF 2
2
= (10)
Null Hypothesis QAQC ssH 220 : = (11)
14

Alternate Hypothesis QAQC ssH 221 : ≠ (12)
As with the t-test, the final step is to calculate a critical F value based upon the
sample degrees of freedom. If the calculated F-statistic based on test results is greater
than the critical F value for a given significance level, the null hypothesis is rejected and
the variances are not equal. If the F-statistic is less than the critical F value, the null
hypothesis is not disproved, and the variances do not show statistically significant
differences at the given confidence level. This test should be run prior to the use of a t-
test, as it is necessary to determine how the t-statistic should be calculated.
15
DATA ANALYSIS
CALIFORNIA DEPARTMENT OF TRANSPORTATION DATA
Caltrans provided data from approximately 30 projects that had been constructed
from 2000 to 2006. These projects were constructed according to Caltrans HMA
Specification Section 39, presumably reflecting the version of Section 39 in effect at the
time of construction. This is noted since Caltrans Section 39 has recently undergone a
major revision.
Caltrans organizes the QC and QA information into Excel files that perform
statistical tests on mean values and variances for each lot within a project. In addition to
the statistical analyses, Caltrans compares the results of tests that exhibit statistical
differences to specified allowable testing difference (ATD) criteria to determine whether
the differences are not only significant statistically but also significant in comparison to
the allowable testing difference. If the test results are verified by statistical or ATD
criteria, the QC values are used to compute the project pay factor.
In accordance with 23 CFR 637, the Caltrans standard specification calls for both
the QC testing procedures to be verified independently. The validation of the QC
sampling procedures (or test method verification) is accomplished by comparing the
results of tests on split samples for asphalt contents, gradations, and theoretical maximum
densities for a production start up evaluation or test strip. Caltrans also requires that the
engineer responsible for QA obtain and test representative samples for in-place density.
In this manner, Caltrans satisfies the IA requirements called for in 23 CFR 637.
To verify the contractor gradation, asphalt content, and compaction test results,
California requires testing of independent samples (process verification). The mean
values of the test results are compared by using the Student’s t-test with an α level of
0.01. Note that the Caltrans specification does not require an F-test to be conducted to
determine whether the sample variances are equal. The sample variances are assumed to
be equal, and the t-statistic is calculated as such. For this analysis, F-tests were
performed to determine whether the variances were equal. On the basis of the result of
16

the F-test, the t-statistic was computed accordingly. Significant differences between
variances were detected in lots at rates varying from 11 to 32 percent for the Caltrans
data.
The allowable testing difference, or D2S filter, compares the difference between
QA and QC test results to predetermined or negotiated testing variations to determine
whether they are significantly different. The ATD between test means is calculated as
follows:
2
1112 ⎥
⎦
⎤⎢⎣
⎡+=
acrx nn
Sd (13)
where:
xd = allowable testing difference between means
rS = Precision Index for the test method from Table 2
cn = number of contractor’s quality control tests (minimum of two required)
an = number of state quality assurance tests (minimum of one required)
The Precision Index could also be thought of as the recognized standard deviation
of the test method.
Table 2. California Precision Indices
California
Test Designation
Precision Index
19- or 12.5-mm (3/4" or 1/2") 0.90% 9.5-mm (3/8") 2.40% 4.75-mm (#4) 2.00% 2.36-mm (#8) 1.40% 600-um (#30) 1.10%
Gra
datio
n (S
ieve
Siz
e)
75-um (#200)
202
0.70% 379 0.23%
Asphalt Content 382 0.18%
Sand Equivalent (min.) 217 8 Hveem Stabilometer Value
(min.) 366 6.6
Percent of Theoretical Maximum Density 375 0.88%
Theoretical Maximum Density 309 .03 g/cc Oth
er P
aram
eter
s
Percent Air Voids 367 1.6
17

The contractor’s QC test results are verified if either the statistical or the ATD test
conditions are met. Table 3 is a summary of the available data (a total of 46 individual
lots) provided by Caltrans. These data show that a small portion of testing data for the
lots was invalidated when both statistical and ATD criteria were applied. Invalidated for
this table means that the difference between the QA and QC testing programs was
determined to be statistically significant and larger than the ATD.
Table 3. Analysis of California Data (α = 0.01, D2S Filtering)
# of Lots
Lots with Statistical
Differences between
Mean Values and ATD
Differences
Rate of Occurrence of
Invalid QC Results
19- or 12.5-mm
(3/4" or
1/2") 46 3 6.5%
9.5-mm (3/8") 46 1 2.2%
4.75-mm (#4) 46 0 0.0%
2.36-mm (#8) 46 2 4.3% 600-um (#30) 46 6 13.0%
Gra
datio
n
(sie
ve s
ize)
75-um (#200) 46 5 10.9% Asphalt Content 44 5 11.4% Sand Equivalent 24 0 0.0% Stability Value 22 1 4.5%
Moisture Content 11 0 0.0% Oth
er
Par
amet
ers
Relative Compaction 34 4 11.8%
1. All t-tests were calculated assuming equal sample variances. 2. Invalid QC results in last column simple implies a statistical rejection.
As shown above, relative compaction, asphalt content, and percentage passing the
No. 30 and 200 sieves were the most likely parameters to be reported with both statistical
and D2S differences.
Table 4 shows the percentage of projects that exhibited statistical differences
between the mean values or variances. The ATD filter used by Caltrans was not included
for these results. The results are for an α significance level of 0.01 and show higher rates
of occurrence than the results presented in Table 3.
18

Table 4. Analysis of California Data (α = 0.01, No ATD Filtering)
# of Lots
Lots with Statistical
Differences between
Mean Values
Lots with Statistical
Differences between
Variances 19- or 12.5-
mm (3/4" or 1/2") 46 5 11% 5 11% 9.5-mm (3/8") 46 8 17% 5 11%
4.75-mm (#4) 46 4 9% 6 13% 2.36-mm (#8) 46 5 11% 7 15% 600-um (#30) 46 9 20% 8 17%
Gra
datio
n (S
ieve
Siz
e)
75-um (#200) 46 5 11% 10 22% Asphalt Content 44 11 25% 11 25% Sand Equivalent 24 1 4% 3 13% Stability Value 22 9 41% 4 18%
Moisture Content 11 0 0% 0 0% Oth
er
Par
amet
ers
Relative Compaction 34 6 18% 11 32%
Despite the overall increase in frequency, the general trends were similar to those
observed in Table 3, with increased significant differences being detected for finer
gradations, relative compaction, and asphalt content measurements. Note that stability
mean values were statistically unequal in 41 percent of the lots.
WASHINGTON STATE DEPARTMENT OF TRANSPORTATION DATA
WSDOT provided test results for seven HMA projects that were completed
between 2003 and 2007. WSDOT’s North Central Region had examined these projects
to determine the potential benefits of using QC data. According to information provided
by WSDOT, the QC results examined in the study were not subjected to a verification
process or used as part of the acceptance decision. There was a 60 to 200 percent
increase in the amount of available test information when QC results were submitted to
WSDOT. The WSDOT information noted a 50 to 75 percent reduction in agency testing
requirements as a result of the additional information.
WSDOT did not use the QC information as part of its acceptance or pay-factor
decisions. This fact complicated the comparison of these data to those from Caltrans. A
risk associated with using QC data is how the possible economic pressures and potential
19

biases affect QC testing results. In the WSDOT program the QC tests did not affect the
contractor’s payment, so these pressures were not present.
The WSDOT data are presented in Table 5.
Table 5. Analysis of WSDOT Data (α = 0.01)
# of Job Mix
Formulas
Job Mix Formulas
with Statistical
Differences between
Mean Values
Job Mix Formulas
with Statistical
Differences between
Variances 19-mm (3/4") 10 0 0% 0 0%
12.5-mm (1/2") 10 2 20% 1 10% 9.5-mm (3/8") 10 3 30% 1 10% 4.75-mm (#4) 10 2 20% 2 20% 2.36-mm (#8) 10 3 30% 2 20% 1.18-mm (#16) 10 2 20% 4 40% 600-mm (#30) 10 1 10% 0 0% 300-um (#50) 10 3 30% 0 0% 150-um (#100) 10 2 20% 0 0% 75-um (#200) 10 2 20% 3 30%
Gra
datio
n (S
ieve
Siz
e) a
nd
Asp
halt
Con
tent
(%)
Asphalt Content 10 0 0% 2 20%
The WSDOT project data indicate that significant differences between mean
values and variances occurred at rates similar to those observed in the NCHRP report
(Hughes, 2005) and in the Caltrans data.
TEXAS DEPARTMENT OF TRANSPORTATION DATA
The Texas DOT provided a large number of test records for five different asphalt
mix design types. The data did not delineate between individual projects, so a
comparison of QC and QA test results was not possible at the project level. The data
were analyzed at the mix design level, and the results are presented in Tables 6 and 7.
20

Table 6. Analysis of Texas DOT Statistically Significant Differences, (α = 0.01)
Mix Design In-Place Air Voids (%)
Absolute Difference
from Target Lab Molded
Density
Asphalt Content
Variance NSD NSD NSD A Mean Value NSD NSD NSD
Variance SD NSD NSD B Mean Value SD SD SD
Variance NSD NSD NSD C Mean Value SD NSD NSD
Variance NSD SD SD D Mean Value SD SD SD
Variance No Data NSD NSD F Mean Value No Data NSD NSD
*SD: Statistical Difference between testing programs **NSD: No Statistical Difference between testing programs
These data indicate that statistically significant differences were detected for 60
percent of the mixes for in-place air voids, and 40 percent for absolute difference from
target density and for asphalt content measurements.
The average difference between the QA and QC values are presented in Table 7
for all analyzed mix designs. The values highlighted in gray are properties for which
statistical differences were detected between mean values with an α level of 0.01.
These results indicate that when statistically significant differences were not
detected, the difference between the mean values of the QA and QC measurements was
close to zero.
Note that the inverse of this statement is not necessarily true. This can be seen by
comparing the results of the Molded Density readings for Mix Designs A and D. Mix D
exhibited a smaller difference between QA and QC testing programs, but unlike Mix A
the results were determined to be statistically different. The primary reason for this is
that Mix A exhibited standard deviations that were approximately 10 percent larger than
those found for Mix D. The larger standard deviations reduced the calculated t-statistic.
Secondly, the critical t-statistic for Mix A was calculated with 91 degrees of freedom.
Mix D had 560 degrees of freedom. This resulted in the critical t-statistic for Mix A
21

being 2 percent larger than the value computed for Mix D. The combination of these two
factors resulted in Mix D producing statistically significant results while Mix A did not.
Table 7. Summary of Texas DOT Data (α = 0.01) In-Place Air Voids
(%) Molded Densities
(%) Asphalt Contents
(%) Mix Design QA QC QA QC QA QC
Mean Difference between QA and
QC (QA-QC) 0.05 -0.05 0.01
Std. Dev 1.34 1.34 0.37 0.34 0.20 0.19 A
Count 66 34 68 25 70 69 Mean Difference between QA and
QC (QA-QC) 0.62 0.09 0.08
Std. Dev 1.42 0.99 0.40 0.37 0.45 0.44 B
Count 699 33 699 356 645 706 Mean Difference between QA and
QC (QA-QC) 0.28 0.03 0.02
Std. Dev 1.22 1.20 0.34 0.33 0.33 0.33 C
Count 1531 143 1726 657 1632 1780 Mean Difference between QA and
QC (QA-QC) 1.22 -0.04 0.03
Std. Dev 1.23 1.16 0.30 0.34 0.39 0.32 D
Count 1635 21 1895 430 1490 1934 Mean Difference between QA and
QC (QA-QC) - 0.03 0.09
Std. Dev 0.81 - 0.31 0.32 0.27 0.31 F
Count 41 0 60 9 56 66 Note: Shaded areas show significant differences between QA and QC mean test
results.
MINNESOTA DEPARTMENT OF TRANSPORTATION DATA
Between 2003 and 2004 the Minnesota Department of Transportation (MnDOT)
gathered QA and QC data to study the relationship between asphalt content, voids in the
mineral aggregate (VMA), and asphalt film thicknesses (AFT) for HMA projects. The
goal of the study was to implement a specification system to better control asphalt
contents across different HMA aggregate gradations. The AFT parameter is dependent
22

upon asphalt content, percentage of aggregate in the mix, and the surface area of
aggregate of a HMA pavement.
The AFT parameter (microns) is calculated as:
SAP
PAFT
s
be
∗∗∗
=100
4870 (13)
where Pbe = effective asphalt content as a percentage of the total mixture
Ps = percentage of aggregate in the mixture
SA = calculated aggregate surface area in ft2/lb
The SA is calculated according to the following equation:
SA = 2 + 0.02a + 0.04b + 0.08c + 0.14d + 0.30e + 0.60f + 1.60g (14)
where a, b, c, d, e, f and g are the percentage passing sieves #4, 8, 16, 30, 50, 100, 200
Minnesota allows QC results to be used as part of pay factor determinations. QC
tests are validated by one-to-one comparisons of test results on split samples for each lot.
If the difference between the QC and QA tests is within a given tolerance, the average of
the two tests is used to compute the pay adjustment. If the tolerance is exceeded, the
contractor tests an additional sample from the lot, and the average is computed on the
basis of the results of this test and the original QA test. The use of split samples
represents a test method verification IA procedure as defined by OPQAS.
The results of the statistical analysis of the Minnesota data are presented in Table
8.
The results of the Minnesota data exhibit several differences in comparison to the
previous analyses. The most notable difference between the Minnesota data and the other
states is that for the #4, 8, and 16 sieves, less than 2 percent of projects exhibited
statistically significant differences. The California and Washington data exhibited rates
of approximately 10 and 30 percent, respectively. The reason behind this is that the
Minnesota data exhibited, on average, much higher variances for these three sieves than
either California or Washington. Note also that the Minnesota data had a higher rate of
occurrence of statistically different mean values for the #200 sieve. Both Washington
and California exhibited differences in approximately 20 percent of projects. Because the
AFT calculation is dependent upon the surface area of the HMA aggregate, the #200
23

sieve’s high rate of statistically significant differences was carried through to the AFT
tests.
Table 8. Analysis of Minnesota Data (α = 0.01)
Number of Projects
Projects with Statistical
Differences between Mean
Values
Projects with Statistical
Differences between
Variances 4.75-mm (#4) 274 4 1.5% 7 2.6% 2.36-mm (#8) 274 1 0.4% 11 4.0% 1.18-mm (#16) 274 1 0.4% 9 3.3% 600-um (#30) 273 20 7.3% 9 3.3% 300-um (#50) 272 58 21.3% 11 4.0% 150-um (#100) 264 96 36.4% 11 4.2%
Gra
datio
n
(s
ieve
siz
e)
75-um (#200) 275 102 37.1% 17 6.2% Asphalt Content 275 22 8.0% 22 8.0%
Surface Area (ft2/lb) 275 86 31.3% 13 4.7% VMA 275 17 6.2% 12 4.4% O
ther
P
aram
eter
s
AFT (microns) 275 101 36.7% 11 4.0%
Minnesota also made HMA field core data available. Communication with Curt
Turgeon of MnDOT (Turgeon, 2007) provided the following background on field density
determination:
• A day’s HMA production is divided into lots. Within each lot, two locations
are randomly selected.
• The Contractor tests one core for the each location and MnDOT tests the
companion core for the first location. If the difference between the MnDOT
and Contractor cores is less than 0.030 Gmb, then the Contractor’s core is
verified and the average of the Contractor’s cores for the two locations are
averaged for pay. If the difference is exceeded, then the average of the
MnDOT and Contractor cores at the second location are used to determine
pay.
24

• The current practice (as of December 2007) is to cut two cores at each
location thereby the Contractor does not know which location is to be used for
verification, i.e., meeting the 0.030 Gmb requirement.
Table 9 is used to summarize MnDOT and Contractor Gmb core results. Data was
made available for 1999, 2000, 2001, 2003 and 2006.
Table 9. Summary of MnDOT Core Data
1999
2000
2001
2003
2006 Average difference in Gmb
(QC-QA) 0.007 0.005 0.004
0.003
0.003 Number of Sets of Cores
in the averages 738 4526 510
582
2989
The average differences in core Gmb have declined over a span of about eight
years.
Additional data was provided by MnDOT which allows us to view Contractor and
agency results from field split samples of HMA. The results follow in Table 10.
Table 10. Summary of MnDOT Split Sample Data Contractor Test Results MnDOT Test Results
Project Year
No. of Split
Samples
Statistic
Pb Gmm Gmb Va VMA Pb Gmm
Gmb
Va
VMA Mean -- 2.495 2.406 3.5 14.8 -- 2.495 2.410 3.4 14.5
2001 246 Std Dev -- 0.034 0.036 0.8 1.0 -- 0.032
0.036
0.9
1.2
Mean 5.4 2.489 2.398 3.7 14.6 5.3 2.486 2.405 3.3 14.3
2003 132 Std Dev 0.6 0.051 0.047 0.6 0.8 0.6 0.053
0.046
0.8
0.9
Mean 5.5 2.491 2.403 3.5 14.8 5.6 2.495 2.403 3.7 14.8
2004 117 Std Dev 0.3 0.039 0.037 0.4 0.6 0.3 0.040
0.038
0.6
0.7
The data in Table 10 represent large sample sizes (in effect a population measure)
and allow a quick view of differences in Contractor and MnDOT results for binder
content, theoretical maximum density, bulk density, air voids, and voids in mineral
aggregate. Bulk density results are of special interest and MnDOT results are either the
same or slightly higher than Contractor results.
25
DISCUSSION OF DATA
CALTRANS DATA
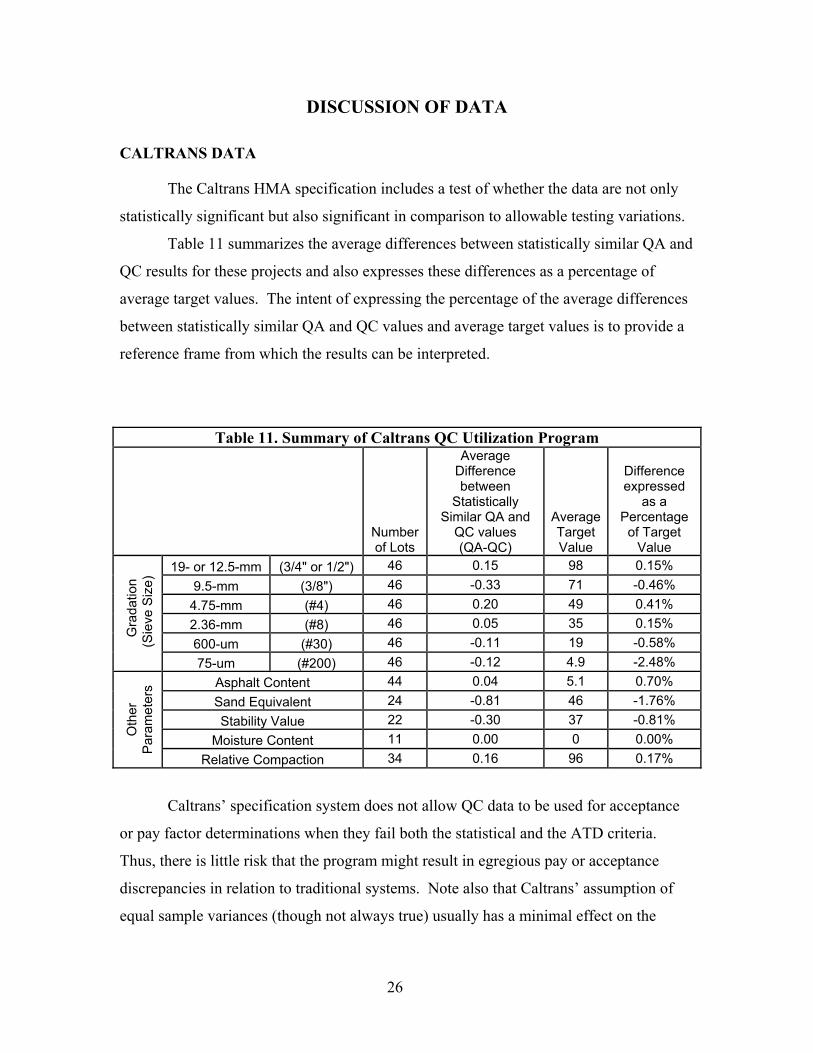
The Caltrans HMA specification includes a test of whether the data are not only
statistically significant but also significant in comparison to allowable testing variations.
Table 11 summarizes the average differences between statistically similar QA and
QC results for these projects and also expresses these differences as a percentage of
average target values. The intent of expressing the percentage of the average differences
between statistically similar QA and QC values and average target values is to provide a
reference frame from which the results can be interpreted.
Table 11. Summary of Caltrans QC Utilization Program
Number of Lots
Average Difference between
Statistically Similar QA and
QC values (QA-QC)
Average Target Value
Difference expressed
as a Percentage
of Target Value
19- or 12.5-mm (3/4" or 1/2") 46 0.15 98 0.15% 9.5-mm (3/8") 46 -0.33 71 -0.46%
4.75-mm (#4) 46 0.20 49 0.41% 2.36-mm (#8) 46 0.05 35 0.15% 600-um (#30) 46 -0.11 19 -0.58%
Gra
datio
n (S
ieve
Siz
e)
75-um (#200) 46 -0.12 4.9 -2.48% Asphalt Content 44 0.04 5.1 0.70% Sand Equivalent 24 -0.81 46 -1.76% Stability Value 22 -0.30 37 -0.81%
Moisture Content 11 0.00 0 0.00% Oth
er
Par
amet
ers
Relative Compaction 34 0.16 96 0.17%
Caltrans’ specification system does not allow QC data to be used for acceptance
or pay factor determinations when they fail both the statistical and the ATD criteria.
Thus, there is little risk that the program might result in egregious pay or acceptance
discrepancies in relation to traditional systems. Note also that Caltrans’ assumption of
equal sample variances (though not always true) usually has a minimal effect on the
26

calculated t-statistic. Nevertheless, this assumption should be proved for an equivalent
significance level for each parameter (i.e. a F-test should be performed).
WSDOT DATA
The results of the WSDOT analysis exhibited trends similar to those observed in
the Caltrans data and the Parker and Turochy study. The average differences between
statistically similar QC and QA results are shown in Table 12.
Table 12. Summary of WSDOT Data (α = 0.01)
Average Difference between
Statistically Similar QA and
QC values (QA-QC)
Typical Target Value
Difference expressed as a Percentage
of Target Value
19-mm (3/4") 0.00 100 0.00% 12.5-mm (1/2") 0.15 95 0.16% 9.5-mm (3/8") 0.07 79 0.09%
4.75-mm (#4) 0.74 48 1.54% 2.36-mm (#8) -0.09 32 -0.29% 1.18-mm (#16) 0.20 22 0.91% 600-mm (#30) 0.18 16 1.11% 300-um (#50) 0.06 10 0.60% 150-um (#100) 0.16 7 2.36% 75-um (#200) 0.08 4.8 1.59%
Gra
datio
n (S
ieve
Siz
e) a
nd
Asp
halt
Con
tent
(%)
Asphalt Content 0.03 5.3 0.57%
This information illustrates that when QC results are not statistically different
from the QA data; the average differences are relatively small. The magnitude of the
WSDOT differences was up to 2.4 percent of target values, which is similar to the trends
observed in the Caltrans data. The WSDOT data also suggest that, on average,
statistically similar results occur in approximately 80 percent of reported parameters.
Unlike the Caltrans and Parker and Turochy studies, the WSDOT data (refer back
to Table 5) did not exhibit significant differences between the mean values of asphalt
content for any of the Job Mix Formulas (JMF). On the basis of a sample set containing
only seven projects with ten JMFs, it is difficult to extrapolate from these data to form a
conclusion about the agreement between QC and QA testing program.
27

TEXAS DOT DATA
The Texas data exhibited several interesting trends. The first is that, given the
large sample sizes, statistical differences were only detected in half of the measured
parameters. For mix designs B, C, and D the average number of degrees of freedom was
2000. T-tests for sample sizes of these magnitudes are sensitive to any difference
between mean values.
Analyzing the Texas data on a mix design level was useful in that it demonstrated
that; overall, the QC and QA testing programs produce similar results. With sample sizes
in the thousands, it can be reasonably assumed that these samples adequately represent
the total QC and QA populations with only a minimal amount of difference.
Unfortunately, when so many test results are compared, the usefulness of validating QC
results with statistical F- and t-tests is questionable. The statistical tests can invalidate
results that are separated by only extremely small margins. These margins may not be
significant when viewed from an engineering perspective. These differences can also be
smaller than natural variations due to the materials or testing inaccuracies.
MINNESOTA DOT DATA
The Minnesota data are summarized in Table 13.
Comparatively, the California and WSDOT data exhibited larger asphalt content
average differences of 0.7 percent and 0.6 percent (as compared to 0.3 percent for
MnDOT). Otherwise, the differences between Caltrans, Minnesota, and Washington are
rather modest with the exception of the No. 50, 100, and 200 sieves.
Minnesota cores results (Table 9) show that the Contractor’s bulk density from
cores was slightly greater that the Minnesota DOT data, but the differences are all within
the testing variance for bulk density. The decrease in bulk density differences over time
(1999 to 2006) between the Contractor and DOT core data is noted. The split sample
results (Table 10) show that the Contractor and DOT test results (average and standard
deviations) for theoretical and bulk density, percent binder, air voids, and VMA are all
similar.
28

Table 13. Summary of Minnesota Data (α = 0.01)
Average Difference between
Statistically Similar QA and
QC values (QA-QC)
Average QA
Values
Difference expressed as a Percentage
of Average QA Values
4.75-mm (#4) 0.08 68 0.12% 2.36-mm (#8) 0.42 54 0.77% 1.18-mm (#16) 0.19 42 0.45% 600-mm (#30) 0.83 30 2.75% 300-um (#50) 0.73 17 4.29% 150-um (#100) 0.62 8 7.77%
Gra
datio
n
(s
ieve
siz
e)
75-um (#200) 0.61 5 12.24% Asphalt Content 0.02 6 0.30%
Surface Area (ft2/lb) 1.64 32 5.12% VMA -0.21 15 -1.38% O
ther
P
aram
eter
s
AFT (microns) -0.65 8 -8.07%
29
CONCLUSIONS
STATISTICAL VALIDATION MEASURES
The results of this study indicate that F- and t-tests can be used to validate QC
results for use in acceptance and pay factor decisions. This should be no surprise because
numerous road agencies have used these statistical measures for some time to compare
agency and contractor results. The statistical tests provide an adequate level of resolution
when differences are sought between the two testing programs over a range of sample
sizes. This study used an α value of 0.01 for the F- and t-tests to establish filter criteria
that produce significant results, and that level seems reasonable. These tests may lose
relevance if the number of samples in the QC and QA program becomes large. If results
are analyzed at a statewide level, the statistical tests are much too discriminating to be
used.
STATE DATA COMPARISON
The data from the four contributing state DOTs exhibited similar trends in terms
of the average number of projects and parameters that produce statistically significant
differences. Given differences in state independent assurance programs and even the use
of contractor QC data, these similar trends are reassuring.
Between the states, different parameters (such as asphalt content, gradation sizes,
etc.) had the larger number of statistically significant differences—there are no consistent
trends.
The average differences for the various parameters for statistically similar QA and
QC results are quite similar for the state data. This should not be a surprise given
standard test methods, tester training programs, etc.
30

REFERENCES
Code of Federal Regulations. (2007), 23 CFR 637.207 Quality Assurance Program, United States.
Federal Highway Administration. (2003) Optimal Procedures for Quality Assurance
Specifications. Hughes, C. (2005), “State Construction Quality Assurance Programs,” Synthesis 346,
Project 20-5, National Cooperative Highway Research Program, Washington, DC. Newcomb, D. (2007), Letter to Crawford Yencks—Manager, National Cooperative
Highway Research Program, National Asphalt Pavement Association, February 7, 2007.
Parker, F. and Turochy, R. (2006), “Using the Results of Contractor-Performed Tests in
Quality Assurance, NCHRP Web-Only Document 115, Project 10-58(2), National Cooperative Highway Research Program, Washington, DC.
Transportation Research Board (2002), “Glossary of Highway Quality Assurance
Terms,” Transportation Research Circular E-C037, Committee on Management of Quality Assurance (A2F03), Transportation Research Board, Washington, DC, April 2002.
Turgeon, C. (2007), email communication, December 12, 2007.
31
BIBLIOGRAPHY
Caltrans (2002), “Section 39: Asphalt Concrete,” Standard Specifications, California Department of Transportation, Sacramento, CA, July 2002.
Caltrans (2006), “Section 39: Asphalt Concrete,” Standard Specifications, California
Department of Transportation, Sacramento, CA, May 2006. Caltrans (2007), “Section 39: Hot Mix Asphalt,” Standard Specifications, California
Department of Transportation, Sacramento, CA., August 1, 2007.
Federal Highway Administration (1993). Limits of the Use of Contractor Performed Sampling and Testing.
32

A-1
APPENDIX A
WSDOT HMA QA/QC STUDY

WSDOT HMA QA/QC Study WSDOT Test Data
19-mm 12.5-mm 9.5-mm
4.75-mm
2.36-mm
1.18-mm
600-mm 300-um 150-um 75-um Project
# Job Mix Formula
(3/4") (1/2") (3/8") (#4) (#8) (#16) (#30) (#50) (#100) (#200)
Asphalt Content
Average 100.00 96.54 82.46 51.62 34.54 24.00 17.08 11.77 7.92 5.70 5.61 Std. Dev 0.00 0.75 1.55 1.60 1.28 0.78 0.62 0.42 0.27 0.11 0.16 1
Count 13 13 13 13 13 13 13 13 13 13 13 Average 100.00 96.50 80.75 49.75 33.50 23.25 16.25 11.00 7.75 5.48 5.75 Std. Dev 0.00 1.12 0.83 0.83 0.50 0.43 0.43 0.00 0.43 0.23 0.23
1
2 Count 4 4 4 4 4 4 4 4 4 4 4
Average 100.00 93.73 83.36 54.18 34.91 23.00 16.09 11.91 8.73 6.34 5.07 Std. Dev 0.00 1.27 2.34 2.09 1.38 1.00 0.70 0.54 0.47 0.27 0.09 2 1
Count 11 11 11 11 11 11 11 11 11 11 11 Average 100.00 91.33 79.22 52.61 35.11 24.39 17.44 12.78 8.78 5.98 5.04 Std. Dev 0.00 1.67 2.25 1.60 1.20 0.89 0.68 0.53 0.53 0.32 0.14 3 1
Count 18 18 18 18 18 18 18 18 18 18 18 Average 100.00 97.75 88.25 59.25 40.25 26.00 17.00 11.75 7.75 4.90 5.85 Std. Dev 0.00 0.83 1.92 2.05 1.48 0.71 0.00 0.43 0.83 0.07 0.05 1
Count 4 4 4 4 4 4 4 4 4 4 4 Average 100.00 97.73 86.18 57.45 38.82 25.27 16.82 11.18 7.27 4.75 5.80 Std. Dev 0.00 0.45 1.75 2.50 1.75 1.29 0.72 0.57 0.45 0.31 0.12
4
2 Count 11 11 11 11 11 11 11 11 11 11 11
A-2

WSDOT HMA QA/QC Study
Contractor Test Data 19-mm
12.5-mm 9.5-mm
4.75-mm
2.36-mm
1.18-mm
600-mm 300-um 150-um 75-um Project
# Job Mix Formula
(3/4") (1/2") (3/8") (#4) (#8) (#16) (#30) (#50) (#100) (#200)
Asphalt Content
Average 100.00 97.50 86.00 56.25 37.75 24.50 17.00 11.00 7.00 4.75 5.70 Std. Dev 0.00 0.58 1.15 1.50 0.96 0.58 0.00 0.00 0.00 0.06 0.00 1
Count 4 4 4 4 4 4 4 4 4 4 4 Average 100.00 96.43 80.71 47.86 33.86 23.57 17.00 11.57 8.00 5.60 5.66 Std. Dev 0.00 0.98 1.50 7.78 2.04 1.81 1.41 1.13 1.00 0.77 0.17
1
2 Count 7 7 7 7 7 7 7 7 7 7 7
Average 100.00 93.43 83.10 54.67 36.14 22.67 15.86 11.81 8.38 6.04 5.20 Std. Dev 0.00 1.16 2.00 2.48 6.44 1.46 1.06 0.98 0.74 0.55 0.28 2 1
Count 21 21 21 21 21 21 21 21 21 21 21 Average 100.00 90.73 78.85 51.50 33.50 22.15 16.62 11.96 8.50 5.84 5.01 Std. Dev 0.00 0.78 1.16 1.30 0.99 0.67 0.57 0.82 0.58 0.28 0.13 3 1
Count 26 26 26 26 26 26 26 26 26 26 26 Average 100.00 97.00 84.90 56.40 36.30 23.10 15.60 9.90 6.80 4.50 5.64 Std. Dev 0.00 0.94 1.66 1.65 1.83 1.29 0.97 0.74 0.42 0.38 0.13 1
Count 10 10 10 10 10 10 10 10 10 10 10 Average 100.00 96.86 85.41 56.14 37.73 24.14 16.50 10.82 7.00 4.54 5.74 Std. Dev 0.00 0.83 1.53 2.40 1.42 0.71 0.51 0.39 0.00 0.67 0.14
4
2 Count 22 22 22 22 22 22 22 22 22 22 21
A-3

WSDOT HMA QA/QC Study
WSDOT Test Data 19-mm
12.5-mm 9.5-mm
4.75-mm
2.36-mm
1.18-mm
600-mm 300-um 150-um 75-um Project
# Job Mix Formula
(3/4") (1/2") (3/8") (#4) (#8) (#16) (#30) (#50) (#100) (#200)
Asphalt Content
Average 100.00 97.76 85.41 51.24 30.84 19.94 14.10 10.47 8.08 5.93 6.00 Std. Dev 0.00 0.79 1.86 2.07 1.38 1.69 1.08 0.84 0.67 0.57 0.19 5 1
Count 51 51 51 51 51 49 49 49 49 51 51 Average 100.00 94.92 78.16 42.24 29.80 22.96 16.24 10.16 6.76 4.40 4.90 Std. Dev 0.00 1.38 3.17 2.83 1.66 1.14 0.78 0.47 0.44 0.16 0.14 6 1
Count 25 25 25 25 25 25 25 25 25 25 25 Average 100.00 95.00 82.40 52.80 34.80 24.70 18.50 12.90 7.70 4.07 5.26 Std. Dev 0.00 1.56 2.32 3.43 3.01 1.70 1.27 0.88 0.67 0.32 0.31 1
Count 10 10 10 10 10 10 10 10 10 10 10 Average 100.00 94.78 82.00 50.44 32.00 22.11 16.22 11.44 6.89 3.84 5.32 Std. Dev 0.00 1.92 3.81 4.10 3.08 2.62 2.11 1.42 1.05 0.45 0.33
7
2 Count 9 9 9 9 9 9 9 9 9 9 9
A-4

WSDOT HMA QA/QC Study
Contractor Test Data 19-mm
12.5-mm 9.5-mm
4.75-mm
2.36-mm
1.18-mm
600-mm 300-um 150-um 75-um Project
# Job Mix Formula
(3/4") (1/2") (3/8") (#4) (#8) (#16) (#30) (#50) (#100) (#200)
Asphalt Content
Average 100.00 97.69 86.44 52.29 31.28 19.97 14.08 10.41 7.99 5.87 5.93 Std. Dev 0.00 0.86 1.77 1.72 1.37 1.26 1.07 0.93 0.75 0.54 0.16 5 1
Count 101 101 101 101 101 101 101 101 101 101 101 Average 100.00 93.98 78.41 42.35 29.94 22.63 16.29 9.96 6.69 4.54 4.93 Std. Dev 0.00 1.33 2.72 2.66 1.76 1.36 0.96 0.64 0.58 0.25 0.14 6 1
Count 49 48 48 48 48 48 48 48 48 48 48 Average 100.00 94.37 82.05 51.37 34.47 23.68 17.74 12.37 7.42 3.81 5.16 Std. Dev 0.00 1.30 2.17 2.48 1.98 0.95 0.81 1.01 0.61 0.30 0.25 1
Count 19 19 19 19 19 19 19 19 19 19 19 Average 100.00 94.76 82.82 51.06 32.18 22.06 16.47 11.53 7.00 3.78 5.34 Std. Dev 0.00 1.20 2.04 1.64 1.63 1.09 1.33 1.07 0.61 0.41 0.14
7
2 Count 17 17 17 17 17 17 17 17 17 17 17
A-5

B-1
Appendix B Texas Dot HMA QA/QC Study

Texas DOT HMA QA/QC Study Texas DOT Test Data
Mix Design
In-Place Air Voids
(%)
Molded Densities
(%)
Asphalt Contents
(%) Average 6.42 0.54 4.09 Std. Dev 1.34 0.37 0.20 A
Count 66 68 70 Average 6.77 0.57 4.56 Std. Dev 1.42 0.40 0.45 B
Count 699 699 645 Average 6.86 0.42 4.58 Std. Dev 1.22 0.34 0.33 C
Count 1531 1726 1632 Average 7.31 0.38 5.01 Std. Dev 1.23 0.30 0.39 D
Count 1635 1895 1490 Average 7.10 0.41 5.68 Std. Dev 0.81 0.31 0.27 F
Count 41 60 56
Texas DOT HMA QA/QC Study
Contractor Test Data
Mix Design
In-Place Air Voids
(%)
Molded Densities
(%)
Asphalt Contents
(%) Average 6.37 0.59 4.08 Std. Dev 1.34 0.34 0.19 A
Count 34 25 69 Average 6.16 0.49 4.49 Std. Dev 0.99 0.37 0.44 B
Count 33 356 706 Average 6.58 0.39 4.56 Std. Dev 1.20 0.33 0.33 C
Count 143 657 1780 Average 6.09 0.43 4.98 Std. Dev 1.16 0.34 0.32 D
Count 21 430 1934 Average - 0.38 5.59 Std. Dev - 0.32 0.31 F
Count 0 9 66
B-2

Appendix C
Caltrans HMA QA/QC Study
C-1

Caltrans HMA QA/QC Study Caltrans Test Data
Percentage Passing (Sieve Size) Other Parameters
19- or
12.5-mm 9.5-mm
4.75-mm
2.36-mm
600-um 75-um Asphalt
Project #
Lot #
(3/4" or
1/2") (3/8") (#4) (#8) (#30) (#200) Content
Sand Equivalent
Stability Value
Moisture Content
Relative Compaction
Average 99.00 72.00 51.00 39.50 19.00 5.85 5.40 Std Dev 0.00 1.41 1.41 0.71 0.00 0.21 0.00 1 Count 2 2 2 2 2 2 2
Average 97.67 85.00 58.67 43.00 20.00 6.27 5.60 Std Dev 0.58 1.73 0.58 1.00 1.00 0.40 0.00
1
2 Count 3 3 3 3 3 3 3
Average 96.20 71.80 49.20 38.00 21.40 5.52 5.20 0.00 42.20 0.00 97.08 Std Dev 0.84 2.39 1.30 1.41 0.89 0.19 0.19 0.00 0.84 0.00 1.05 1 Count 9 9 9 9 9 9 9 9 9 9 10
Average 97.13 72.38 51.50 39.25 22.25 6.00 4.91 0.00 44.00 97.61 Std Dev 0.99 1.30 1.93 2.05 1.67 0.76 0.22 0.00 2.65 1.02
2
2 Count 16 16 16 16 16 16 16 16 16 16
Average 99.00 75.50 53.00 35.50 16.75 6.08 5.93 95.60 Std Dev 0.00 2.89 1.83 1.00 0.96 0.43 0.10 0.00 1 Count 4 4 4 4 4 4 4 4
Average 98.81 71.56 51.69 33.75 15.81 4.91 6.17 97.14 Std Dev 0.40 1.67 1.70 1.77 1.28 0.55 0.09 0.59 2 Count 16 16 16 16 16 16 12 11
Average 98.80 74.60 52.80 37.40 17.00 5.90 6.04 Std Dev 0.45 1.14 1.10 0.89 0.71 0.19 0.15
3
3 Count 5 5 5 5 5 5 5
C-2

Caltrans HMA QA/QC Study
Contractor Test Data Percentage Passing (Sieve Size) Other Parameters
19- or
12.5-mm 9.5-mm
4.75-mm
2.36-mm
600-um 75-um Asphalt
Project #
Lot #
(3/4" or
1/2") (3/8") (#4) (#8) (#30) (#200) Content
Sand Equivalent
Stability Value
Moisture Content
Relative Compaction
Average 98.83 69.00 49.00 37.33 17.50 5.57 5.23 Std Dev 0.41 2.00 1.90 1.75 0.84 0.41 0.06 1 Count 6 6 6 6 6 6 6
Average 97.20 83.60 57.80 42.60 19.40 6.26 5.34 Std Dev 0.45 1.67 1.10 1.14 0.55 0.46 0.12
1 2
Count 5 5 5 5 5 5 5 Average 96.51 71.36 49.73 39.22 21.58 5.63 5.42 68.00 48.00 0.00 96.91 Std Dev 0.69 1.42 1.21 0.95 0.92 0.33 0.17 0.00 1.26 0.00 0.35 1 Count 50 50 50 50 50 50 50 50 50 50 47
Average 96.82 72.32 50.70 39.80 21.09 5.70 5.08 68.00 46.86 0.00 96.76 Std Dev 0.72 1.34 1.25 1.11 1.29 0.35 0.17 0.00 3.98 0.01 0.51
2 2
Count 56 56 56 56 56 56 56 56 56 56 56 Average 98.78 74.61 52.67 35.39 16.06 5.19 6.05 96.68 Std Dev 0.43 1.75 1.46 1.46 0.94 0.38 0.12 0.00 1 Count 18 18 18 18 18 18 18 18
Average 98.86 72.40 51.60 35.48 16.38 5.03 6.12 38.33 97.77 Std Dev 0.45 1.26 1.40 1.63 1.21 0.51 0.17 2.31 0.48 2 Count 50 50 50 50 50 50 50 3 49
Average 98.44 71.78 50.28 35.72 15.78 4.87 6.14 Std Dev 0.62 2.41 2.30 2.16 1.17 0.51 0.16
3
3 Count 18 18 18 18 18 18 18
C-3

Caltrans HMA QA/QC Study Caltrans Test Data
Percentage Passing (Sieve Size) Other Parameters
19- or
12.5-mm 9.5-mm
4.75-mm
2.36-mm
600-um 75-um Asphalt
Project #
Lot #
(3/4" or
1/2") (3/8") (#4) (#8) (#30) (#200) Content
Sand Equivalent
Stability Value
Moisture Content
Relative Compaction
Average 98.93 72.29 52.71 38.00 18.86 4.96 5.63 96.99 1 Std Dev 1.21 1.59 2.20 1.47 1.03 0.66 0.36 0.80 4 Count 15 15 15 15 15 15 15 15
Average 99.38 73.15 51.31 37.69 18.92 4.82 5.37 96.70 Std Dev 0.51 2.08 2.18 1.55 1.19 0.49 0.26 0.67 2 Count 18 18 18 18 18 18 18 18
Average 98.25 73.75 51.39 36.75 19.89 6.10 4.95 73.18 45.36 0.00 97.43 Std Dev 1.32 1.78 1.71 2.07 1.97 0.85 0.16 6.76 2.04 0.00 1.20 1 Count 28 28 28 28 28 28 28 11 28 8 28
Average 99.00 72.82 51.65 36.71 18.94 6.00 4.92 46.88 97.41 Std Dev 0.94 0.81 2.64 1.40 1.09 0.57 0.14 2.20 0.54 2 Count 17 17 17 17 17 17 17 17 17
Average 99.00 72.50 49.25 36.50 20.50 6.25 Std Dev 0.00 0.58 0.96 2.38 1.29 0.50 3 Count 4 4 4 4 4 4
Average 99.38 74.00 49.63 35.38 21.50 6.38 5.07 96.73 Std Dev 0.52 1.93 2.45 1.41 1.07 0.52 0.17 1.31
5
4 Count 8 8 8 8 8 8 8 8
Average 98.60 71.40 48.00 34.80 19.40 5.08 5.02 72.80 45.00 98.97 Std Dev 0.55 1.95 1.41 1.10 0.89 0.61 0.04 1.64 0.00 0.86 6 1 Count 5 5 5 5 5 5 5 5 1 6
Average 97.67 74.33 52.67 34.00 18.00 5.00 5.48 66.33 Std Dev 0.58 0.58 2.08 1.00 2.00 0.00 0.23 1.53 7 1 Count 3 3 3 3 3 3 3 3
Average 97.75 73.50 52.75 34.25 17.00 4.75 5.51 65.00 98.05 Std Dev 0.50 1.73 1.71 0.96 2.58 0.50 0.20 2.94 0.99 8 1 Count 4 4 4 4 4 4 4 4 4
C-4

Caltrans HMA QA/QC Study Contractor Test Data
Percentage Passing (Sieve Size) Other Parameters
19- or
12.5-mm 9.5-mm
4.75-mm
2.36-mm
600-um 75-um Asphalt
Project #
Lot #
(3/4" or
1/2") (3/8") (#4) (#8) (#30) (#200) Content
Sand Equivalent
Stability Value
Moisture Content
Relative Compaction
Average 99.18 72.45 52.44 37.96 17.76 4.84 5.66 97.71 1 Std Dev 0.51 1.05 1.03 0.77 0.90 0.34 0.15 0.66 4 Count 55 55 55 55 55 55 55 55
Average 99.04 72.91 51.67 38.05 18.01 4.70 5.35 97.03 Std Dev 0.19 1.31 1.08 0.95 0.99 0.43 0.10 0.39 2 Count 79 79 79 79 79 79 79 79
Average 98.75 73.59 51.34 37.35 21.16 6.26 4.94 66.91 40.91 0.00 97.50 Std Dev 0.56 1.77 1.64 1.79 1.16 0.50 0.12 5.85 2.39 0.00 0.36 1 Count 99 99 99 99 99 99 99 22 11 99 99
Average 99.71 72.85 50.37 37.28 21.34 6.10 4.84 73.35 39.60 0.00 97.29 Std Dev 0.46 1.09 1.05 1.56 1.56 0.52 0.10 3.50 2.07 0.00 0.48 2 Count 93 93 93 93 93 93 93 20 5 93 93
Average 98.80 73.20 50.00 35.80 20.40 5.86 4.92 95.34 Std Dev 0.45 0.45 0.71 1.79 1.52 0.49 0.19 1.08 3 Count 5 5 5 5 5 5 5 5
Average 99.44 73.90 50.08 36.58 22.14 6.38 4.88 96.96 Std Dev 0.50 1.79 2.45 1.74 1.49 0.52 0.14 0.33
5
4 Count 72 72 72 72 72 72 72 72
Average 98.96 71.80 49.84 37.60 21.46 5.32 4.79 72.08 39.86 0.01 97.98 Std Dev 0.35 1.74 1.28 1.51 1.15 0.32 0.16 2.43 1.68 0.01 0.50
6
1 Count 50 50 50 50 50 51 13 7 22 51
Average 97.31 74.15 53.54 35.00 17.62 4.60 5.61 58.31 39.50 0.20 Std Dev 0.75 1.99 1.98 1.73 2.33 0.41 0.33 4.61 0.55 0.04 7 1 Count 13 13 13 13 13 13 13 13 6 13
Average 97.33 71.13 53.54 36.67 18.38 3.69 5.69 63.25 40.36 0.16 98.32 Std Dev 0.70 1.65 1.86 2.43 2.52 0.62 0.28 5.01 0.50 0.04 0.53 8 1 Count 24 24 24 24 24 24 24 24 11 23 24
C-5
Caltrans HMA QA/QC Study
Caltrans Test Data Percentage Passing (Sieve Size) Other Parameters
19- or
12.5-mm 9.5-mm
4.75-mm
2.36-mm
600-um 75-um Asphalt
Project #
Lot #
(3/4" or 1/2") (3/8") (#4) (#8) (#30) (#200) Content
Sand Equivalent
Stability Value
Moisture Content
Relative Compaction
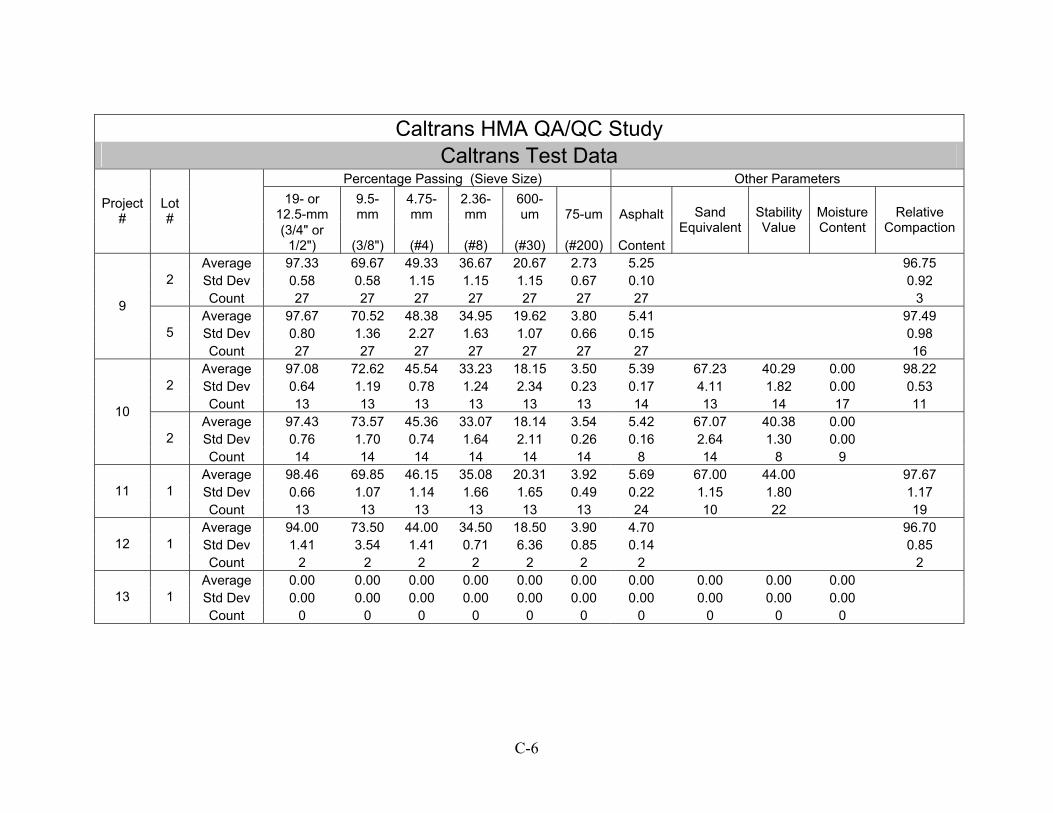
Average 97.33 69.67 49.33 36.67 20.67 2.73 5.25 96.75 Std Dev 0.58 0.58 1.15 1.15 1.15 0.67 0.10 0.92 2 Count 27 27 27 27 27 27 27 3
Average 97.67 70.52 48.38 34.95 19.62 3.80 5.41 97.49 Std Dev 0.80 1.36 2.27 1.63 1.07 0.66 0.15 0.98
9
5 Count 27 27 27 27 27 27 27 16
Average 97.08 72.62 45.54 33.23 18.15 3.50 5.39 67.23 40.29 0.00 98.22 Std Dev 0.64 1.19 0.78 1.24 2.34 0.23 0.17 4.11 1.82 0.00 0.53 2 Count 13 13 13 13 13 13 14 13 14 17 11
Average 97.43 73.57 45.36 33.07 18.14 3.54 5.42 67.07 40.38 0.00 10
Std Dev 0.76 1.70 0.74 1.64 2.11 0.26 0.16 2.64 1.30 0.00 2 Count 14 14 14 14 14 14 8 14 8 9
Average 98.46 69.85 46.15 35.08 20.31 3.92 5.69 67.00 44.00 97.67 Std Dev 0.66 1.07 1.14 1.66 1.65 0.49 0.22 1.15 1.80 1.17 11 1 Count 13 13 13 13 13 13 24 10 22 19
Average 94.00 73.50 44.00 34.50 18.50 3.90 4.70 96.70 Std Dev 1.41 3.54 1.41 0.71 6.36 0.85 0.14 0.85 12 1 Count 2 2 2 2 2 2 2 2
Average 0.00 0.00 0.00 0.00 0.00 0.00 0.00 0.00 0.00 0.00 Std Dev 0.00 0.00 0.00 0.00 0.00 0.00 0.00 0.00 0.00 0.00 13 1 Count 0 0 0 0 0 0 0 0 0 0
C-6

Caltrans HMA QA/QC Study
Contractor Test Data Percentage Passing (Sieve Size) Other Parameters
19- or
12.5-mm 9.5-mm
4.75-mm
2.36-mm
600-um 75-um Asphalt
Project #
Lot #
(3/4" or
1/2") (3/8") (#4) (#8) (#30) (#200) Content
Sand Equivalent
Stability Value
Moisture Content
Relative Compaction
Average 96.71 72.00 49.86 38.00 21.71 3.90 5.40 97.46 Std Dev 0.46 0.82 1.46 1.63 1.50 0.64 0.13 0.47 2 Count 27 27 27 27 27 27 27 22
Average 97.83 70.98 49.25 36.66 20.94 4.07 5.40 97.88 Std Dev 0.83 1.15 2.21 1.56 1.90 0.72 0.20 1.23
9 5
Count 115 115 115 115 115 115 115 144 Average 97.43 73.88 46.06 32.97 17.71 3.63 5.50 63.92 40.00 98.17 Std Dev 0.58 1.17 0.72 0.85 1.19 0.35 0.14 3.79 1.58 0.52 2 Count 90 90 90 90 90 90 90 26 9 87 90
Average 97.36 74.27 46.03 33.34 17.83 3.56 5.52 65.17 40.63 0.00 96.00 Std Dev 0.68 1.49 0.82 1.09 1.34 0.33 0.15 3.65 0.52 0.00 0.00
10 2
Count 64 64 64 64 64 64 64 18 8 64 64 Average 96.85 69.05 44.56 34.63 19.15 4.06 5.64 68.41 40.17 0.12 97.53 Std Dev 0.65 0.86 0.90 1.44 2.07 0.57 0.16 3.36 1.47 0.04 0.77 11 1 Count 41 41 41 41 41 41 41 17 6 41 41
Average 95.83 71.00 54.00 36.17 20.33 2.86 5.00 96.94 Std Dev 2.59 1.86 5.39 2.08 2.57 0.63 0.33 0.39 12 1 Count 12 12 12 12 12 12 12 12
Average 97.78 68.78 44.06 30.00 17.78 3.79 5.17 0.00 0.00 0.00 96.87 Std Dev 0.81 1.22 1.47 1.71 1.56 0.68 0.17 0.00 0.00 0.00 0.32 13 1 Count 18 18 18 18 18 18 18 0 0 0 18
C-7

Caltrans HMA QA/QC Study Caltrans Test Data
Percentage Passing (Sieve Size) Other Parameters
19- or
12.5-mm 9.5-mm
4.75-mm
2.36-mm
600-um 75-um Asphalt
Project #
Lot #
(3/4" or
1/2") (3/8") (#4) (#8) (#30) (#200) Content
Sand Equivalent
Stability Value
Moisture Content
Relative Compaction
Average 92.25 66.50 48.00 33.75 18.00 5.45 5.01 1 Std Dev 1.26 1.91 1.41 2.06 1.41 1.05 0.08 Count 4 4 4 4 4 4 4
Average 93.09 63.64 45.18 31.09 17.18 5.82 4.65 98.06 Std Dev 2.47 4.23 4.53 3.42 2.36 0.75 0.36 0.42 2 Count 11 11 11 11 11 11 9 7
Average 97.00 67.00 48.00 33.00 16.00 3.80 4.80 0.00 0.00 0.00 Std Dev 0.00 0.00 0.00 0.00 0.00 0.00 0.00 0.00 0.00 0.00 3 Count 1 1 1 1 1 1 1 0 0 0
Average 96.00 70.50 49.50 34.50 19.50 6.70 4.88 97.00 Std Dev 0.00 0.71 3.54 3.54 2.12 0.14 0.18 0.57
14
4 Count 2 2 2 2 2 2 2 2
Average 99.11 71.00 45.89 35.33 18.22 4.09 4.68 46.44 97.00 Std Dev 0.60 1.87 3.10 2.29 1.30 0.84 0.24 2.07 0.90 15 1 Count 9 9 9 9 9 9 9 9 9
Average 95.67 66.83 48.67 34.83 19.00 4.33 5.18 58.00 50.78 0.98 96.42 Std Dev 1.03 0.75 1.37 1.33 1.26 0.45 0.18 1.90 2.73 0.02 0.22 1 Count 6 6 6 6 6 6 6 6 9 3 8
Average 95.71 66.86 48.57 35.29 19.29 5.21 55.33 47.75 Std Dev 0.76 2.54 2.15 1.98 1.38 0.45 2.52 2.22
16
2 Count 7 7 7 7 7 7 3 7
Average 99.50 66.70 46.90 34.40 18.30 5.17 4.64 97.64 Std Dev 0.53 2.00 1.85 2.55 1.70 0.83 0.20 0.83 17 1 Count 10 10 10 10 10 10 10 10
Average 99.70 66.05 45.75 32.51 18.20 5.34 4.62 62.20 47.83 0.53 97.40 Std Dev 0.57 2.14 1.80 7.24 2.26 1.10 0.21 5.93 2.59 0.50 1.19 18 1 Count 20 20 20 20 20 20 30 20 30 4 27
C-8

Caltrans HMA QA/QC Study Contractor Test Data
Percentage Passing (Sieve Size) Other Parameters
19- or
12.5-mm 9.5-mm
4.75-mm
2.36-mm
600-um 75-um Asphalt
Project #
Lot #
(3/4" or
1/2") (3/8") (#4) (#8) (#30) (#200) Content
Sand Equivalent
Stability Value
Moisture Content
Relative Compaction
Average 94.32 68.11 46.64 32.96 17.89 5.29 4.80 1 Std Dev 1.56 1.85 1.93 1.48 1.10 0.48 0.24 Count 28 28 28 28 28 28 28
Average 95.13 68.19 47.64 32.96 18.09 5.32 4.86 97.11 Std Dev 1.13 1.33 1.25 1.12 0.97 0.40 0.20 0.62 2 Count 67 67 67 67 67 67 67 67
Average 94.17 67.75 46.58 32.67 18.00 5.48 4.66 0.00 0.00 0.00 97.18 Std Dev 0.72 1.36 1.88 1.78 1.35 0.46 0.19 0.00 0.00 0.00 0.65 3 Count 12 12 12 12 12 12 12 0 0 0 12
Average 95.36 68.27 46.73 33.36 18.55 5.79 4.75 97.74 Std Dev 1.43 1.95 1.62 1.21 1.04 0.43 0.13 0.89
14
4
Count 12 12 12 12 12 12 12 12 Average 99.20 71.20 45.02 35.05 17.51 4.28 5.00 70.56 39.76 0.00 96.91 Std Dev 0.60 1.52 1.19 1.50 1.10 0.50 0.10 5.15 1.43 0.00 0.55 15 1 Count 41 41 41 41 41 41 41 41 41 41 41
Average 96.20 68.68 49.07 35.23 19.34 4.93 5.28 55.10 39.02 0.97 96.69 Std Dev 1.02 2.11 1.77 1.82 1.43 0.61 0.20 2.79 0.01 0.02 0.50 1 Count 44 44 44 44 44 44 44 41 4 4 46
Average 96.53 67.72 49.00 34.84 19.16 4.93 5.25 54.03 40.80 Std Dev 1.11 1.87 1.61 1.53 1.25 0.41 0.24 1.77 1.10
16 2
Count 32 32 32 32 32 32 32 32 5 Average 99.13 66.64 47.22 33.23 17.05 4.76 4.60 97.95 Std Dev 0.54 2.34 1.70 2.11 1.50 0.51 0.14 0.84 17 1 Count 91 91 91 91 91 91 91 91
Average 99.64 67.62 46.21 32.36 17.28 4.76 4.65 62.44 48.17 0.53 97.48 Std Dev 0.51 1.92 1.80 1.51 1.27 0.44 0.13 5.03 2.93 0.48 0.65 18 1 Count 146 146 146 146 146 146 146 9 6 6 146
C-9

Caltrans HMA QA/QC Study
Caltrans Test Data Percentage Passing (Sieve Size) Other Parameters
19- or
12.5-mm 9.5-mm
4.75-mm
2.36-mm
600-um 75-um Asphalt
Project #
Lot #
(3/4" or
1/2") (3/8") (#4) (#8) (#30) (#200) Content
Sand Equivalent
Stability Value
Moisture Content
Relative Compaction
Average 99.72 65.61 45.61 34.39 19.06 6.04 4.86 68.00 47.60 97.89 Std Dev 0.46 2.17 1.91 1.61 1.06 0.42 0.37 0.00 4.28 0.74 19 1 Count 18 18 18 18 18 18 27 1 5 25
Average 99.79 62.16 41.53 31.63 17.32 5.75 5.00 56.78 44.67 98.15 Std Dev 0.42 1.80 1.43 1.46 1.11 0.80 0.33 7.92 5.50 0.99 20 1 Count 19 19 19 19 19 19 19 18 18 15
Average 100.00 72.00 45.14 31.29 17.43 4.50 5.05 79.71 46.67 97.27 Std Dev 0.00 0.82 0.69 1.50 0.98 0.45 0.24 3.09 1.51 0.58 1 Count 7 7 7 7 7 7 7 7 6 6
Average 100.00 71.13 47.63 33.13 18.75 4.21 4.47 79.00 48.38 0.10 97.39 Std Dev 0.00 2.23 2.07 2.70 2.82 0.27 0.19 0.00 1.60 0.01 0.57 2 Count 8 8 8 8 8 8 8 2 8 2 8
Average 100.00 73.18 47.18 32.84 18.00 4.38 4.91 80.67 Std Dev 0.00 1.43 1.70 2.29 1.48 0.51 0.24 1.53
21
3 Count 45 45 45 45 45 45 39 3
Average 98.50 62.75 45.75 33.75 17.50 4.58 4.73 95.90 Std Dev 0.58 0.50 2.06 2.22 1.29 0.38 0.06 1.32 22 1 Count 4 4 4 4 4 4 4 4
Average 95.67 70.67 49.00 34.67 18.67 5.37 4.82 57.00 49.67 Std Dev 0.58 0.58 1.73 0.58 1.53 0.71 0.20 5.57 2.08 23 1 Count 3 3 3 3 3 3 3 3 3
Average 98.75 78.25 47.50 36.50 21.00 2.88 4.88 96.25 Std Dev 0.50 1.26 1.29 1.29 2.45 0.15 0.15 0.50 24 1 Count 4 4 4 4 4 4 4 4
C-10

Caltrans HMA QA/QC Study
Contractor Test Data Percentage Passing (Sieve Size) Other Parameters
19- or
12.5-mm 9.5-mm
4.75-mm
2.36-mm
600-um 75-um Asphalt
Project #
Lot #
(3/4" or
1/2") (3/8") (#4) (#8) (#30) (#200) Content
Sand Equivalent
Stability Value
Moisture Content
Relative Compaction
Average 99.16 63.16 44.03 33.31 18.03 5.88 4.78 56.60 40.75 0.10 98.02 Std Dev 0.47 2.36 2.09 1.79 1.07 0.47 0.16 6.58 1.22 0.05 1.00 19 1 Count 128 128 128 128 128 128 128 5 12 128 128
Average 99.41 61.56 42.26 32.05 16.79 5.54 4.74 61.75 42.00 0.05 97.18 Std Dev 0.49 2.32 2.16 1.73 1.43 0.51 0.18 2.82 2.10 0.07 0.55 20 1 Count 121 121 121 121 121 121 121 8 11 121 121
Average 100.00 71.65 46.40 32.45 18.00 4.26 5.00 79.86 40.00 0.11 97.16 Std Dev 0.00 0.99 1.14 0.94 0.56 0.19 0.18 0.90 N/A 0.05 0.53 1 Count 20 20 20 20 20 20 20 7 1 20 20
Average 100.00 69.87 45.79 31.87 17.63 4.13 4.56 80.82 42.86 0.09 97.10 Std Dev 0.00 2.02 2.07 1.82 1.20 0.31 0.20 1.83 3.24 0.02 0.52 2 Count 38 38 38 38 38 38 38 11 7 38 38
Average 100.00 73.00 47.28 32.90 17.85 3.77 4.94 79.79 43.00 0.10 Std Dev 0.00 1.99 2.09 1.51 0.92 0.45 0.17 1.14 3.46 0.03
21
3 Count 71 71 71 71 71 71 71 24 6 71
Average 98.67 66.12 47.07 32.70 16.60 4.42 4.73 97.74 Std Dev 0.64 2.77 1.55 1.66 1.22 0.45 0.10 0.43 22 1 Count 43 43 43 43 43 43 43 43
Average 96.73 71.00 49.69 36.54 19.12 5.70 5.00 53.55 49.75 0.20 Std Dev 0.83 1.57 1.89 1.53 0.71 0.40 0.18 3.22 1.71 0.08 23 1 Count 26 26 26 26 26 26 26 20 4 4
Average 98.54 78.62 48.31 36.00 20.23 3.20 4.85 97.31 Std Dev 0.52 1.98 2.53 2.08 1.92 0.85 0.12 1.32 24 1 Count 13.00 13.00 13.00 13.00 13.00 13.00 13.00 13.00
C-11

Caltrans HMA QA/QC Study
Caltrans Test Data Percentage Passing (Sieve Size) Other Parameters
19- or
12.5-mm 9.5-mm
4.75-mm
2.36-mm
600-um 75-um Asphalt
Project #
Lot #
(3/4" or
1/2") (3/8") (#4) (#8) (#30) (#200) Content
Sand Equivalent
Stability Value
Moisture Content
Relative Compaction
Average 98.80 88.60 52.60 39.00 22.80 4.02 4.92 36.50 96.43 Std Dev 0.45 1.67 2.61 2.12 2.59 0.58 0.13 2.12 1.29 25 1 Count 5 5 5 5 5 5 5 2 4
Average 97.40 71.20 51.00 36.60 17.40 5.68 4.92 0.00 96.96 Std Dev 1.67 3.11 2.45 2.88 1.82 0.46 0.11 0.00 1.46 26 3 Count 5 5 5 5 5 5 5 5 5
Average 95.50 70.00 46.75 33.25 17.50 4.00 5.30 0.00 97.75 Std Dev 0.58 1.41 1.26 0.96 0.58 1.02 0.44 0.00 2.25 27 1 Count 4 4 4 4 4 4 4 4 4
Average 98.50 69.75 52.00 36.75 16.75 5.50 5.01 98.55 Std Dev 0.58 2.06 1.63 0.96 0.50 1.00 0.23 2.30 28 1 Count 4 4 4 4 4 4 4 4
Average 97.50 72.50 51.50 36.50 20.00 5.30 4.96 73.00 38.50 0.02 97.85 Std Dev 0.71 2.12 0.71 0.71 0.00 0.71 0.14 0.00 2.12 0.01 1.63 29 1 Count 2 2 2 2 2 2 2 1 2 2 2
C-12

Caltrans HMA QA/QC Study
Contractor Test Data Percentage Passing (Sieve Size) Other Parameters
19- or
12.5-mm 9.5-mm
4.75-mm
2.36-mm
600-um 75-um Asphalt
Project #
Lot #
(3/4" or
1/2") (3/8") (#4) (#8) (#30) (#200) Content
Sand Equivalent
Stability Value
Moisture Content
Relative Compaction
Average 97.95 87.56 52.41 39.74 24.03 3.77 5.07 68.69 42.08 0.00 96.97 Std Dev 0.69 1.57 1.90 1.19 1.46 0.45 0.16 2.25 4.10 0.01 0.54 25
1
Count 39 39 39 39 39 39 39 39 12 39 39 Average 97.68 70.77 50.52 36.59 17.07 5.53 5.19 97.78 Std Dev 1.19 3.00 2.40 1.93 1.25 0.67 0.22 0.77 26
3
Count 56 56 56 56 56 56 56 56 Average 96.08 69.54 46.71 33.33 17.75 3.84 5.43 98.02 Std Dev 1.06 1.32 1.99 1.05 1.62 0.70 0.15 1.16 27
1
Count 24 24 24 24 24 24 24 24 Average 98.24 69.97 51.62 36.93 17.10 5.36 5.15 98.11 Std Dev 0.74 1.76 1.35 1.71 1.40 0.61 0.18 1.00 28
1
Count 31 31 31 31 31 31 31 31 Average 97.70 72.25 51.60 36.95 20.85 4.38 5.02 65.14 41.00 0.08 96.95 Std Dev 1.26 1.89 2.66 1.28 2.13 0.86 0.14 2.73 4.36 0.04 0.76 29
1
Count 20 20 20 20 20 20 20 7 7 20 20
C-13

D-1
Appendix D
MINNESOTA DOT ASPHALT FILM THICKNESS STUDY
QA/QC TESTING RESULTS

2003 ASPHALT FILM THICKNESS STUDY MnDOT Test Data
(Based on Production Data) State TOTAL ACeff ACeff PERCENTAGE PASSING SIEVE SA AFT Project AC (By Mix) (By Agg) #200 #100 #50 #30 #16 #8 #4 (SF/Lb) (Microns) VMA
0901-72 Average 5.50 4.69 4.96 6.60 10.86 20.43 31.57 43.71 56.43 70.57 36.79 6.57 14.46 Std Dev 0.29 0.25 0.28 0.35 0.69 0.98 1.13 0.95 1.51 2.07 1.43 0.27 0.26 Count 7 7 7 7 7 7 7 7 7 7 7 7 7
3605-37 Average 5.20 4.70 4.96 7.35 9.50 12.50 17.00 21.00 27.00 38.50 29.12 8.31 14.40 Std Dev 0.00 0.14 0.15 0.78 0.71 0.71 1.41 1.41 1.41 2.12 2.29 0.40 0.42 Count 2 2 2 2 2 2 2 2 2 2 2 2 2
3605-37 Average 5.62 4.88 5.17 7.55 9.67 13.17 17.67 23.17 31.50 49.83 30.41 8.30 14.70 Std Dev 0.17 0.12 0.13 0.45 0.52 0.75 1.03 1.17 1.87 2.32 1.50 0.44 0.44 Count 6 6 6 6 6 6 6 6 6 6 6 6 6
D-2

2003 ASPHALT FILM THICKNESS STUDY Contractor Data
(Based on Production Data) State TOTAL ACeff ACeff PERCENTAGE PASSING SIEVE SA AFT Project AC (By Mix) (By Agg) #200 #100 #50 #30 #16 #8 #4 (SF/Lb) (Microns) VMA
0901-72 Average 5.68 4.96 5.26 5.81 9.67 19.58 31.00 42.92 54.67 68.75 34.30 7.51 14.50 Std Dev 0.23 0.21 0.24 0.52 0.98 1.98 2.37 2.97 3.45 3.82 2.64 0.73 0.22 Count 12 12 12 12 12 12 12 12 12 12 12 12 12 3605-37 Average 5.14 4.76 5.02 6.14 8.00 11.60 16.40 21.00 27.20 39.20 25.95 9.43 14.40 Std Dev 0.13 0.17 0.18 0.47 0.71 0.55 0.89 1.58 2.28 2.95 1.59 0.41 0.45 Count 5 5 5 5 5 5 5 5 5 5 5 5 5 3605-37 Average 5.45 4.85 5.13 6.62 8.36 12.00 17.09 22.64 30.73 47.64 27.59 9.06 14.67 Std Dev 0.22 0.25 0.28 0.52 0.67 0.77 1.14 1.50 2.24 2.73 1.78 0.43 0.41 Count 11 11 11 11 11 11 11 11 11 11 11 11 11
D-3

2003 ASPHALT FILM THICKNESS STUDY Mn/DOT Test Data
(Based on Production Data) State TOTAL ACeff ACeff PERCENTAGE PASSING SIEVE SA AFT Project AC (By Mix) (By Agg) #200 #100 #50 #30 #16 #8 #4 (SF/Lb) (Microns) VMA
0416-27 Average 4.83 4.33 4.54 5.95 8.75 16.50 29.00 40.50 54.50 72.00 32.64 6.84 13.90 Std Dev 0.17 0.15 0.16 1.25 1.71 1.00 0.82 1.91 2.38 2.94 3.08 0.82 1.50 Count 4 4 4 4 4 4 4 4 4 4 4 4 4
1102-59 Average 4.39 4.03 4.22 4.94 7.25 11.35 17.15 23.65 32.80 46.35 24.19 8.50 13.81 Std Dev 0.21 0.20 0.22 0.39 0.55 0.81 1.14 1.60 2.48 3.28 1.52 0.40 0.35 Count 20 20 20 20 20 20 20 20 20 20 20 20 20
1119-32 Average 5.25 4.28 4.52 5.85 8.67 15.00 27.83 40.17 54.33 70.33 31.75 7.07 14.02 Std Dev 0.15 0.22 0.24 1.08 1.63 2.37 2.99 3.82 5.35 3.78 4.38 1.26 0.29 Count 6 6 6 6 6 6 6 6 6 6 6 6 6
1504-10 Average 6.06 5.06 5.39 4.36 6.00 12.40 27.60 43.60 59.20 73.20 27.48 9.54 15.72 Std Dev 0.17 0.25 0.27 0.11 0.00 0.55 1.14 1.67 2.77 3.70 0.76 0.26 0.51 Count 5 5 5 5 5 5 5 5 5 5 5 5 5
3509-19 Average 6.10 5.32 5.67 4.69 9.00 28.10 40.00 48.80 58.70 68.90 36.56 7.57 15.26 Std Dev 0.09 0.16 0.18 0.33 1.63 2.92 1.56 1.32 1.42 2.02 2.30 0.43 0.26 Count 10 10 10 10 10 10 10 10 10 10 10 10 10
3509-19 Average 6.05 5.20 5.53 4.99 8.80 29.93 41.07 50.20 60.73 72.40 37.88 7.13 15.37 Std Dev 0.20 0.18 0.20 0.47 0.86 1.49 1.75 1.47 1.28 1.24 1.70 0.39 0.37 Count 15 15 15 15 15 15 15 15 15 15 15 15 15
4501-36 Average 4.77 4.20 4.41 5.83 8.33 19.00 30.00 40.33 53.33 67.67 32.95 6.53 13.90 Std Dev 0.21 0.10 0.11 0.32 0.58 1.73 2.65 4.04 4.93 5.51 2.37 0.33 0.78 Count 3 3 3 3 3 3 3 3 3 3 3 3 3
4508-23 Average 5.77 4.79 5.08 5.16 9.33 25.89 41.44 48.89 58.11 70.78 37.07 6.68 14.20 Std Dev 0.15 0.16 0.18 0.13 0.50 1.27 1.74 1.96 2.47 2.22 1.09 0.11 0.54 Count 9 9 9 9 9 9 9 9 9 9 9 9 9
D-4

2003 ASPHALT FILM THICKNESS STUDY Contractor Data
(Based on Production Data) State TOTAL ACeff ACeff PERCENTAGE PASSING SIEVE SA AFT Project AC (By Mix) (By Agg) #200 #100 #50 #30 #16 #8 #4 (SF/Lb) (Microns) VMA
0416-27 Average 5.00 4.28 4.51 5.67 8.67 15.83 28.00 40.17 53.50 71.33 31.72 6.99 13.78 Std Dev 0.17 0.13 0.15 1.24 1.51 1.47 1.10 1.17 1.52 2.16 3.39 0.75 1.19 Count 6 6 6 6 6 6 6 6 6 6 6 6 6
1102-59 Average 4.47 4.10 4.29 4.76 7.09 11.19 16.56 23.35 32.23 44.49 23.60 8.88 13.77 Std Dev 0.21 0.18 0.19 0.32 0.61 0.82 1.50 1.66 2.55 4.22 1.41 0.42 0.34 Count 43 43 43 43 43 43 43 43 43 43 43 43 43
1119-32 Average 5.13 4.20 4.43 5.42 8.61 14.96 27.22 41.22 55.00 71.04 31.05 7.04 14.00 Std Dev 0.20 0.24 0.26 0.83 1.27 2.16 2.71 4.10 3.84 3.28 3.51 0.94 0.20 Count 23 23 23 23 23 23 23 23 23 23 23 23 23
1504-10 Average 5.89 5.05 5.37 4.45 6.08 12.15 26.31 43.31 57.92 71.92 27.32 9.58 15.58 Std Dev 0.05 0.09 0.09 0.20 0.28 0.55 1.44 1.55 1.85 1.98 0.81 0.24 0.34 Count 13 13 13 13 13 13 13 13 13 13 13 13 13
3509-19 Average 6.10 5.20 5.54 4.88 7.79 28.16 39.32 49.00 58.79 69.84 36.11 7.48 15.38 Std Dev 0.08 0.11 0.12 0.38 0.79 1.89 2.00 1.70 1.47 1.83 1.52 0.30 0.29 Count 19 19 19 19 19 19 19 19 19 19 19 19 19
3509-19 Average 6.01 5.10 5.42 4.88 7.96 29.00 40.32 49.96 59.86 71.61 36.76 7.20 15.45 Std Dev 0.13 0.10 0.11 0.64 0.92 1.74 2.31 2.12 1.98 1.87 1.93 0.36 0.36 Count 28 28 28 28 28 28 28 28 28 28 28 28 28
4501-36 Average 4.80 4.40 4.62 5.35 8.33 18.50 29.83 41.33 54.33 69.00 32.15 7.00 13.97 Std Dev 0.09 0.14 0.15 0.21 0.52 0.55 1.33 1.86 2.50 2.90 0.81 0.26 0.45 Count 6 6 6 6 6 6 6 6 6 6 6 6 6
4508-23 Average 5.64 4.68 4.95 5.30 8.83 25.42 40.92 48.67 57.17 72.25 36.76 6.58 14.35 Std Dev 0.15 0.15 0.16 0.56 1.03 2.50 2.71 2.61 1.47 3.93 2.11 0.43 0.34 Count 12 12 12 12 12 12 12 12 12 12 12 12 12
D-5

2003 ASPHALT FILM THICKNESS STUDY Mn/DOT Test Data
(Based on Production Data) TOTAL ACeff ACeff PERCENTAGE PASSING SIEVE SA AFT
SP AC (By Mix) (By Agg) #200 #100 #50 #30 #16 #8 #4 (SF/Lb) (Microns) VMA 5401-30 Average 5.64 4.65 4.92 5.42 8.09 19.27 32.27 45.45 60.91 75.09 33.40 7.20 14.45
Std Dev 0.21 0.15 0.17 0.37 0.54 2.00 2.72 2.46 2.43 2.63 2.10 0.49 0.34 Count 11 11 11 11 11 11 11 11 11 11 11 11 11
5410-17 Average 5.26 4.72 4.98 4.75 8.40 17.70 31.10 43.00 55.60 69.80 31.36 7.75 13.85 Std Dev 0.18 0.08 0.09 0.30 0.52 0.95 1.60 1.94 1.90 2.04 1.26 0.34 0.58 Count 10 10 10 10 10 10 10 10 10 10 10 10 10
5703-39 Average 5.07 4.50 4.74 5.90 8.33 18.67 30.33 42.00 57.00 71.67 33.36 6.92 14.33 Std Dev 0.25 0.30 0.33 0.30 0.58 0.58 1.15 1.00 1.73 1.53 1.22 0.43 0.15 Count 3 3 3 3 3 3 3 3 3 3 3 3 3
6004-17 Average 5.03 4.36 4.59 5.67 7.26 10.17 14.13 18.43 24.83 36.39 23.65 9.49 13.38 Std Dev 0.19 0.18 0.20 0.46 0.62 0.98 1.39 1.78 2.52 3.41 1.82 0.63 0.69 Count 23 23 23 23 23 23 23 23 23 23 23 23 23
6004-17 Average 5.98 5.38 5.72 4.68 7.31 21.31 37.38 49.85 60.23 69.38 33.28 8.38 14.92 Std Dev 0.17 0.17 0.19 0.21 0.48 1.25 3.55 2.85 3.00 3.04 1.58 0.40 0.80 Count 13 13 13 13 13 13 13 13 13 13 13 13 13
6008-14 Average 4.89 4.20 4.42 6.05 8.95 15.90 25.81 38.81 55.05 69.33 32.13 6.70 12.31 Std Dev 0.31 0.25 0.28 0.53 0.67 1.04 1.89 3.06 4.58 3.90 1.61 0.42 4.14 Count 21 21 21 21 21 21 21 21 21 21 21 21 21
6013-12 Average 5.80 4.75 5.04 4.95 7.83 14.50 26.17 44.00 58.00 68.67 29.85 8.23 14.22 Std Dev 0.20 0.15 0.17 0.14 0.41 0.84 0.75 1.26 2.00 1.97 0.77 0.31 0.24 Count 6 6 6 6 6 6 6 6 6 6 6 6 6
15-603-10 Average 6.08 4.98 5.30 4.82 7.25 16.00 29.42 43.58 59.42 73.67 30.31 8.51 13.96 Std Dev 0.28 0.30 0.34 0.27 0.45 1.28 3.34 2.27 3.92 3.85 1.41 0.26 0.57 Count 12 12 12 12 12 12 12 12 12 12 12 12 12
D-6

2003 ASPHALT FILM THICKNESS STUDY Contractor Data
(Based on Production Data) State TOTAL ACeff ACeff PERCENTAGE PASSING SIEVE SA AFT Project AC (By Mix) (By Agg) #200 #100 #50 #30 #16 #8 #4 (SF/Lb) (Microns) VMA
5401-30 Average 5.62 4.66 4.94 5.48 7.72 19.04 31.84 46.32 61.36 75.68 33.24 7.27 14.64 Std Dev 0.17 0.12 0.14 0.36 0.84 2.01 2.54 3.15 2.29 2.63 1.93 0.51 0.32 Count 25 25 25 25 25 25 25 25 25 25 25 25 25
5410-17 Average 5.27 4.62 4.88 4.80 8.05 17.23 30.36 42.73 54.95 69.41 30.92 7.68 14.35 Std Dev 0.07 0.07 0.07 0.33 0.38 0.75 1.33 1.64 1.81 1.97 1.06 0.22 0.27 Count 22 22 22 22 22 22 22 22 22 22 22 22 22
5703-39 Average 4.93 4.60 4.84 5.47 8.17 17.83 29.67 42.17 56.17 71.67 32.20 7.33 14.27 Std Dev 0.27 0.13 0.14 0.34 0.41 0.75 1.21 2.14 1.94 2.88 1.33 0.28 0.34 Count 6 6 6 6 6 6 6 6 6 6 6 6 6
6004-17 Average 5.21 4.36 4.60 5.63 7.00 9.74 13.65 17.88 24.35 36.44 23.17 9.70 14.07 Std Dev 0.18 0.17 0.19 0.51 0.49 0.71 0.98 1.37 1.92 2.54 1.48 0.66 0.57 Count 34 34 34 34 34 34 34 34 34 34 34 34 34
6004-17 Average 6.08 5.31 5.66 4.96 7.35 20.47 36.88 49.41 59.41 68.59 33.35 8.29 15.38 Std Dev 0.21 0.16 0.18 0.65 0.70 1.37 2.37 2.40 2.55 2.79 1.93 0.60 0.56 Count 17 17 17 17 17 17 17 17 17 17 17 17 17
6008-14 Average 4.91 4.23 4.45 5.72 8.84 15.52 25.48 38.68 55.77 69.58 31.39 6.93 14.10 Std Dev 0.23 0.23 0.25 0.62 0.82 1.21 1.55 2.52 4.02 3.40 1.90 0.59 0.48 Count 31 31 31 31 31 31 31 31 31 31 31 31 31
6013-12 Average 5.74 4.68 4.96 4.76 7.35 14.24 26.06 44.41 59.24 70.12 29.27 8.26 14.71 Std Dev 0.12 0.13 0.14 0.34 0.49 0.83 1.14 1.28 1.68 2.26 1.15 0.34 0.19 Count 17 17 17 17 17 17 17 17 17 17 17 17 17
15-603-10 Average 5.90 4.92 5.23 4.89 7.45 15.40 29.80 44.50 59.30 73.20 30.48 8.37 14.25 Std Dev 0.13 0.16 0.18 0.38 0.60 1.19 1.77 2.78 3.45 3.75 1.76 0.37 0.45 Count 20 20 20 20 20 20 20 20 20 20 20 20 20
D-7

2003 ASPHALT FILM THICKNESS STUDY Mn/DOT Test Data
(Based on Production Data) State TOTAL ACeff ACeff PERCENTAGE PASSING SIEVE SA AFT Project AC (By Mix) (By Agg) #200 #100 #50 #30 #16 #8 #4 (SF/Lb) (Microns) VMA
35-612-04 Average 5.88 4.98 5.29 4.98 6.50 10.25 19.00 33.75 55.25 71.75 25.94 9.94 14.03 Std Dev 0.17 0.17 0.19 0.41 0.58 0.50 0.82 0.96 0.96 2.22 1.27 0.52 0.24 Count 4 4 4 4 4 4 4 4 4 4 4 4 4
63-612-06 Average 6.11 5.04 5.37 5.43 8.13 15.50 28.25 47.13 62.88 75.38 31.95 8.19 14.40 Std Dev 0.20 0.18 0.21 0.31 0.64 1.20 2.38 3.60 4.26 4.17 1.85 0.39 0.63 Count 8 8 8 8 8 8 8 8 8 8 8 8 8
68-606-09 Average 6.14 5.13 5.46 3.97 5.86 18.43 33.14 44.00 56.57 69.57 29.21 9.13 14.86 Std Dev 0.16 0.15 0.17 0.42 0.90 0.79 1.35 1.41 1.62 1.62 1.36 0.54 0.40 Count 7 7 7 7 7 7 7 7 7 7 7 7 7
2003 ASPHALT FILM THICKNESS STUDY Contractor Data
(Based on Production Data) State TOTAL ACeff ACeff PERCENTAGE PASSING SIEVE SA AFT Project AC (By Mix) (By Agg) #200 #100 #50 #30 #16 #8 #4 (SF/Lb) (Microns) VMA
35-612-04 Average 6.16 5.06 5.39 5.05 6.33 10.33 18.58 33.17 55.25 73.00 25.91 10.15 14.83 Std Dev 0.12 0.11 0.12 0.37 0.49 0.65 1.08 1.47 2.09 1.86 1.10 0.44 0.17 Count 12 12 12 12 12 12 12 12 12 12 12 12 12
63-612-06 Average 5.98 5.01 5.33 4.93 7.67 14.75 28.00 45.92 61.92 75.25 30.48 8.54 14.74 Std Dev 0.15 0.16 0.17 0.49 0.78 1.29 3.59 2.84 3.06 2.86 1.94 0.51 0.30 Count 12 12 12 12 12 12 12 12 12 12 12 12 12
68-606-09 Average 6.04 5.23 5.56 3.96 5.79 18.11 33.53 44.00 57.26 71.47 29.17 9.30 15.13 Std Dev 0.11 0.09 0.10 0.40 0.79 0.74 1.26 1.11 1.24 1.35 1.39 0.43 0.20 Count 19 19 19 19 19 19 19 19 19 19 19 19 19
D-8

2003 ASPHALT FILM THICKNESS STUDY Mn/DOT Test Data
(Based on Production Data) State TOTAL ACeff ACeff PERCENTAGE PASSING SIEVE SA AFT Project AC (By Mix) (By Agg) #200 #100 #50 #30 #16 #8 #4 (SF/Lb) (Microns) VMA
1805-63 Average 6.08 4.78 5.09 4.18 6.81 14.75 30.75 49.13 64.06 76.50 29.52 8.43 14.28 Std Dev 0.37 0.19 0.20 0.37 0.66 1.13 2.32 2.83 3.55 3.76 1.95 0.67 0.60 Count 16 16 16 16 16 16 16 16 16 16 16 16 16
1805-63 Average 4.88 4.19 4.41 7.08 10.85 18.92 30.92 44.77 59.31 76.46 37.32 5.76 14.06 Std Dev 0.16 0.13 0.15 0.29 0.55 0.95 1.04 1.59 1.89 2.03 1.26 0.25 0.39 Count 13 13 13 13 13 13 13 13 13 13 13 13 13
11-604-12 Average 5.58 4.78 5.06 4.44 7.00 13.80 28.80 43.80 55.00 64.80 28.48 8.66 14.46 Std Dev 0.08 0.13 0.14 0.21 0.00 0.45 0.84 0.84 1.00 1.10 0.53 0.37 0.47 Count 5 5 5 5 5 5 5 5 5 5 5 5 5
1118-119 Average 6.20 5.30 5.65 4.20 6.00 12.00 28.00 46.33 58.00 67.67 27.22 10.10 15.93 Std Dev 0.36 0.46 0.51 0.30 0.00 0.00 1.00 2.52 3.00 3.51 1.01 0.56 0.78 Count 3 3 3 3 3 3 3 3 3 3 3 3 3
1118-119 Average 5.58 4.93 5.23 5.03 7.33 12.67 27.67 45.17 57.83 70.83 29.47 8.65 15.35 Std Dev 0.19 0.23 0.25 0.64 0.82 1.21 1.21 2.23 2.86 2.40 2.03 0.37 0.59 Count 6 6 6 6 6 6 6 6 6 6 6 6 6
1809-55 Average 5.32 4.66 4.92 5.10 7.40 14.20 27.70 42.30 55.00 69.40 29.71 8.08 13.83 Std Dev 0.18 0.13 0.15 0.22 0.52 0.63 1.34 1.64 1.89 1.78 1.14 0.45 0.26 Count 10 10 10 10 10 10 10 10 10 10 10 10 10
1809-55 Average 5.26 4.44 4.69 5.56 8.44 15.89 27.67 40.78 55.67 71.44 31.51 7.27 14.56 Std Dev 0.19 0.19 0.21 0.39 0.53 1.27 2.35 3.11 2.96 2.60 1.61 0.53 0.92 Count 9 9 9 9 9 9 9 9 9 9 9 9 9
1809-55 Average 5.63 4.91 5.20 4.93 7.08 13.33 25.25 38.00 49.25 62.50 27.94 9.08 14.56 Std Dev 0.17 0.16 0.17 0.28 0.51 0.78 1.48 2.09 2.63 3.12 1.40 0.44 0.56 Count 12 12 12 12 12 12 12 12 12 12 12 12 12
D-9

2003 ASPHALT FILM THICKNESS STUDY Contractor Test Data (Based on Production Data)
State TOTAL ACeff ACeff PERCENTAGE PASSING SIEVE SA AFT Project AC (By Mix) (By Agg) #200 #100 #50 #30 #16 #8 #4 (SF/Lb) (Microns) VMA
1805-63 Average 6.04 4.81 5.12 4.08 6.47 14.29 30.24 48.18 62.24 74.59 28.77 8.70 14.12 Std Dev 0.19 0.17 0.19 0.44 0.80 1.26 2.22 3.17 3.07 3.50 2.08 0.69 0.55 Count 17 17 17 17 17 17 17 17 17 17 17 17 17 1805-63 Average 4.84 4.21 4.42 6.45 10.40 18.20 30.20 43.85 57.65 74.65 35.56 6.06 14.08 Std Dev 0.18 0.15 0.17 0.40 1.10 0.77 1.01 1.42 2.11 2.16 1.22 0.30 0.28 Count 20 20 20 20 20 20 20 20 20 20 20 20 20 11-604-12 Average 5.74 5.01 5.32 4.22 7.00 13.90 29.90 44.00 55.30 65.20 28.34 9.13 14.91 Std Dev 0.22 0.28 0.31 0.19 0.00 0.32 0.57 1.15 1.42 1.69 0.34 0.54 0.44 Count 10 10 10 10 10 10 10 10 10 10 10 10 10 1118-119 Average 6.03 5.46 5.81 3.80 5.29 11.00 26.71 45.43 56.43 66.14 25.51 11.09 16.01 Std Dev 0.19 0.24 0.26 0.18 0.49 0.58 1.11 1.27 1.72 2.04 0.99 0.44 0.47 Count 7 7 7 7 7 7 7 7 7 7 7 7 7 1118-119 Average 5.66 5.08 5.39 4.45 6.31 12.06 27.13 45.38 57.88 71.50 27.70 9.49 15.54 Std Dev 0.19 0.19 0.21 0.44 0.48 0.85 1.31 1.93 2.06 2.25 1.35 0.62 0.49 Count 16 16 16 16 16 16 16 16 16 16 16 16 16 1809-55 Average 5.49 4.78 5.05 5.60 7.33 13.86 27.48 41.24 54.00 67.76 30.18 8.17 14.11 Std Dev 0.21 0.17 0.19 0.56 0.48 0.85 1.66 1.81 2.24 2.55 1.66 0.46 0.30 Count 21 21 21 21 21 21 21 21 21 21 21 21 21 1809-55 Average 5.24 4.54 4.80 6.31 8.44 15.25 27.31 39.50 54.13 69.06 32.27 7.27 14.51 Std Dev 0.18 0.15 0.17 0.61 0.89 1.24 2.02 2.42 2.60 2.79 2.05 0.57 0.66 Count 16 16 16 16 16 16 16 16 16 16 16 16 16 1809-55 Average 5.51 4.90 5.19 5.70 7.37 13.37 25.95 38.26 49.79 63.00 29.50 8.58 14.68 Std Dev 0.18 0.20 0.22 0.54 0.76 0.90 1.31 2.05 2.62 3.51 1.78 0.42 0.37 Count 19 19 19 19 19 19 19 19 19 19 19 19 19
D-10
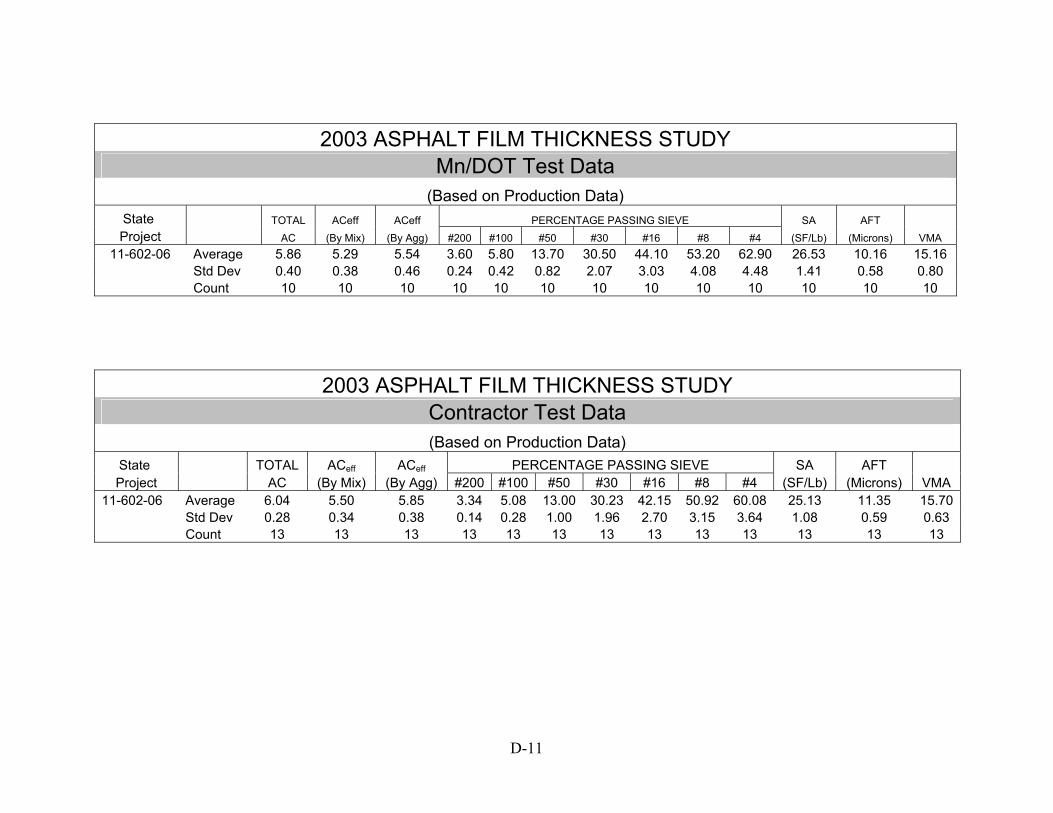
2003 ASPHALT FILM THICKNESS STUDY Mn/DOT Test Data
(Based on Production Data) State TOTAL ACeff ACeff PERCENTAGE PASSING SIEVE SA AFT Project AC (By Mix) (By Agg) #200 #100 #50 #30 #16 #8 #4 (SF/Lb) (Microns) VMA
11-602-06 Average 5.86 5.29 5.54 3.60 5.80 13.70 30.50 44.10 53.20 62.90 26.53 10.16 15.16 Std Dev 0.40 0.38 0.46 0.24 0.42 0.82 2.07 3.03 4.08 4.48 1.41 0.58 0.80 Count 10 10 10 10 10 10 10 10 10 10 10 10 10
2003 ASPHALT FILM THICKNESS STUDY Contractor Test Data (Based on Production Data)
State TOTAL ACeff ACeff PERCENTAGE PASSING SIEVE SA AFT Project AC (By Mix) (By Agg) #200 #100 #50 #30 #16 #8 #4 (SF/Lb) (Microns) VMA
11-602-06 Average 6.04 5.50 5.85 3.34 5.08 13.00 30.23 42.15 50.92 60.08 25.13 11.35 15.70 Std Dev 0.28 0.34 0.38 0.14 0.28 1.00 1.96 2.70 3.15 3.64 1.08 0.59 0.63 Count 13 13 13 13 13 13 13 13 13 13 13 13 13
D-11

2003 ASPHALT FILM THICKNESS STUDY Mn/DOT Test Data
(Based on Production Data) State TOTAL ACeff ACeff PERCENTAGE PASSING SIEVE SA AFT Project AC (By Mix) (By Agg) #200 #100 #50 #30 #16 #8 #4 (SF/Lb) (Microns) VMA
2610-10+ Average 6.01 4.81 5.12 5.64 7.75 13.50 27.63 43.50 59.63 72.88 30.91 8.14 14.05 Std Dev 0.17 0.12 0.14 0.70 0.89 1.60 2.83 4.00 4.69 4.19 2.97 0.88 0.67 Count 8 8 8 8 8 8 8 8 8 8 8 8 8
7503-31 Average 5.77 4.66 4.94 6.16 7.86 13.29 25.71 39.29 53.71 68.29 30.81 7.83 14.39 Std Dev 0.29 0.29 0.33 0.30 0.38 0.76 1.60 1.98 1.70 1.80 1.28 0.62 0.48 Count 7 7 7 7 7 7 7 7 7 7 7 7 7
2101-20 Average 5.65 4.71 4.99 6.82 9.67 18.87 35.07 47.93 61.40 72.73 37.03 6.57 14.67 Std Dev 0.16 0.22 0.24 0.44 0.62 0.74 1.67 2.43 2.92 3.01 1.60 0.30 0.73 Count 15 15 15 15 15 15 15 15 15 15 15 15 15
4401-16 Average 5.63 4.77 5.05 5.00 7.25 14.92 30.58 45.50 58.58 69.83 30.49 8.09 14.59 Std Dev 0.26 0.29 0.32 0.29 0.45 0.90 1.68 1.98 2.64 3.24 1.26 0.71 0.73 Count 12 12 12 12 12 12 12 12 12 12 12 12 12
4401-16 Average 5.36 4.50 4.76 5.63 8.17 16.25 31.33 44.92 57.50 69.08 32.44 7.15 14.12 Std Dev 0.23 0.23 0.26 0.45 0.72 1.14 1.97 2.43 2.43 2.84 1.84 0.44 0.36 Count 12 12 12 12 12 12 12 12 12 12 12 12 12
6111-21+ Average 5.90 4.68 4.98 5.78 7.67 14.00 28.00 42.83 57.33 71.00 31.11 7.85 14.33 Std Dev 0.28 0.25 0.28 0.80 1.21 1.26 1.41 1.47 1.21 2.00 2.55 0.92 0.76 Count 6 6 6 6 6 6 6 6 6 6 6 6 6
6111-21 Average 6.80 5.77 6.19 5.20 7.00 13.67 29.67 46.33 65.67 87.00 30.85 9.78 17.20 Std Dev 0.30 0.32 0.36 0.20 0.00 0.58 1.53 2.08 3.21 3.46 1.01 0.76 0.53 Count 3 3 3 3 3 3 3 3 3 3 3 3 3
7802-30 Average 5.85 4.64 4.93 6.71 9.08 16.62 28.85 43.00 59.00 71.38 34.43 6.98 14.47 Std Dev 0.44 0.25 0.27 0.47 0.64 1.45 1.63 1.47 1.96 2.02 1.67 0.52 0.49 Count 13 13 13 13 13 13 13 13 13 13 13 13 13
D-12

2003 ASPHALT FILM THICKNESS STUDY Contractor Test Data (Based on Production Data)
State TOTAL ACeff ACeff PERCENTAGE PASSING SIEVE SA AFT Project AC (By Mix) (By Agg) #200 #100 #50 #30 #16 #8 #4 (SF/Lb) (Microns) VMA
2610-10+ Average 6.02 4.83 5.14 4.62 6.65 12.15 24.80 41.80 57.60 71.30 27.57 9.14 14.25 Std Dev 0.15 0.17 0.19 0.61 0.93 1.35 1.99 2.76 3.36 4.58 2.32 0.85 0.38 Count 20 20 20 20 20 20 20 20 20 20 20 20 20 7503-31 Average 5.94 4.83 5.13 4.98 6.63 12.25 24.00 39.13 54.63 68.88 27.66 9.05 14.53 Std Dev 0.17 0.15 0.17 0.37 0.52 1.04 1.69 1.55 2.20 1.89 1.31 0.55 0.34 Count 8 8 8 8 8 8 8 8 8 8 8 8 8 2101-20 Average 5.78 4.78 5.08 5.85 8.06 17.06 33.18 47.82 61.18 74.18 33.71 7.34 14.84 Std Dev 0.21 0.22 0.24 0.53 0.56 1.20 1.51 2.19 2.65 2.96 1.55 0.41 0.66 Count 17 17 17 17 17 17 17 17 17 17 17 17 17 4401-16 Average 5.80 4.85 5.15 4.22 6.33 13.87 29.20 45.47 58.60 71.20 28.21 8.91 14.49 Std Dev 0.18 0.17 0.19 0.43 0.49 0.92 1.74 1.68 1.99 2.24 1.23 0.62 0.42 Count 15 15 15 15 15 15 15 15 15 15 15 15 15 4401-16 Average 5.64 4.63 4.91 4.08 6.50 14.19 29.44 44.81 58.00 70.94 28.13 8.51 14.48 Std Dev 0.15 0.15 0.17 0.26 0.52 0.98 1.46 1.56 1.67 1.73 1.19 0.41 0.27 Count 16 16 16 16 16 16 16 16 16 16 16 16 16 6111-21+ Average 5.97 4.89 5.20 4.90 6.71 12.93 25.21 40.71 56.00 70.29 28.18 9.03 14.63 Std Dev 0.14 0.23 0.25 0.49 0.61 1.73 1.76 2.43 2.48 2.13 1.91 0.76 0.49 Count 14 14 14 14 14 14 14 14 14 14 14 14 14 6111-21 Average 6.80 6.05 6.49 4.30 6.50 12.50 25.50 45.00 65.00 87.50 28.05 11.26 17.25 Std Dev 0.28 0.49 0.55 0.14 0.71 0.71 0.71 0.00 0.00 0.71 0.75 0.66 0.21 Count 2 2 2 2 2 2 2 2 2 2 2 2 2 7802-30 Average 6.01 4.82 5.13 5.32 7.41 15.35 27.82 43.29 59.00 72.53 30.74 8.15 14.71 Std Dev 0.29 0.25 0.28 0.46 0.71 1.87 2.01 2.08 2.32 2.43 2.12 0.48 0.45 Count 17 17 17 17 17 17 17 17 17 17 17 17 17
D-13

2003 ASPHALT FILM THICKNESS STUDY Mn/DOT Test Data
(Based on Production Data) State TOTAL ACeff ACeff PERCENTAGE PASSING SIEVE SA AFT Project AC (By Mix) (By Agg) #200 #100 #50 #30 #16 #8 #4 (SF/Lb) (Microns) VMA
7408-39 Average 6.00 5.15 5.48 6.75 11.00 20.50 34.00 47.00 61.00 74.50 38.00 7.03 13.65 Std Dev 0.71 0.07 0.12 0.49 0.00 0.71 1.41 1.41 1.41 2.12 1.41 0.41 0.21 Count 2 2 2 2 2 2 2 2 2 2 2 2 2
2401-36 Average 6.65 5.30 5.68 5.00 7.00 13.50 25.00 37.00 57.00 71.00 28.41 9.73 15.35 Std Dev 0.07 0.00 0.00 0.00 0.00 0.71 1.41 1.41 1.41 1.41 0.61 0.22 0.49 Count 2 2 2 2 2 2 2 2 2 2 2 2 2
2003 ASPHALT FILM THICKNESS STUDY Contractor Test Data (Based on Production Data)
State TOTAL ACeff ACeff PERCENTAGE PASSING SIEVE SA AFT Project AC (By Mix) (By Agg) #200 #100 #50 #30 #16 #8 #4 (SF/Lb) (Microns) VMA
7408-39 Average 5.98 4.90 5.21 5.90 10.40 20.40 34.20 48.40 61.40 74.40 36.40 7.00 14.38 Std Dev 0.25 0.10 0.12 0.91 0.89 0.89 1.30 1.82 2.07 2.70 2.25 0.49 1.06 Count 5 5 5 5 5 5 5 5 5 5 5 5 5 2401-36 Average 6.27 5.33 5.69 3.90 6.17 12.50 22.50 36.17 54.83 70.67 25.34 10.96 15.75 Std Dev 0.15 0.14 0.15 0.28 0.75 1.05 1.76 2.14 1.47 1.03 1.45 0.54 0.31 Count 6 6 6 6 6 6 6 6 6 6 6 6 6
D-14

2003 ASPHALT FILM THICKNESS STUDY Mn/DOT Test Data
(Based on Production Data) State TOTAL ACeff ACeff PERCENTAGE PASSING SIEVE SA AFT
Project AC (By Mix) (By Agg) #200 #100 #50 #30 #16 #8 #4 (SF/Lb) (Microns) VMA 4011-22 Average 5.58 4.67 4.94 5.28 7.67 13.33 27.00 42.33 55.33 70.00 29.83 8.08 14.70
Std Dev 0.25 0.25 0.28 0.41 0.52 0.82 0.89 0.82 1.03 1.10 1.32 0.58 0.41 Count 6 6 6 6 6 6 6 6 6 6 6 6 6
0703-16 Average 5.93 4.89 5.19 5.76 8.90 17.33 31.38 45.52 58.29 69.81 33.52 7.57 14.87 Std Dev 0.18 0.19 0.21 0.45 0.77 1.59 2.04 2.02 2.87 3.63 1.81 0.49 0.68 Count 21 21 21 21 21 21 21 21 21 21 21 21 21
8304-29 Average 6.70 5.25 5.63 3.50 5.00 10.00 21.00 32.00 50.00 66.00 22.42 12.22 15.00 Std Dev 0.28 0.35 0.40 0.00 0.00 0.00 0.00 0.00 0.00 0.00 0.00 0.86 0.14 Count 2 2 2 2 2 2 2 2 2 2 2 2 2
0801-30 Average 6.00 5.06 5.38 5.32 8.40 17.80 32.20 45.00 56.40 65.00 32.56 8.06 15.30 Std Dev 0.21 0.25 0.28 0.16 0.55 0.45 0.45 0.71 0.89 0.71 0.72 0.46 0.27 Count 5 5 5 5 5 5 5 5 5 5 5 5 5
1703-66 Average 6.45 5.50 5.88 5.40 8.50 18.50 33.00 45.50 57.00 65.00 33.13 8.65 15.30 Std Dev 0.07 0.00 0.00 0.00 0.71 0.71 1.41 2.12 1.41 1.41 1.09 0.29 0.85 Count 2 2 2 2 2 2 2 2 2 2 2 2 2
D-15
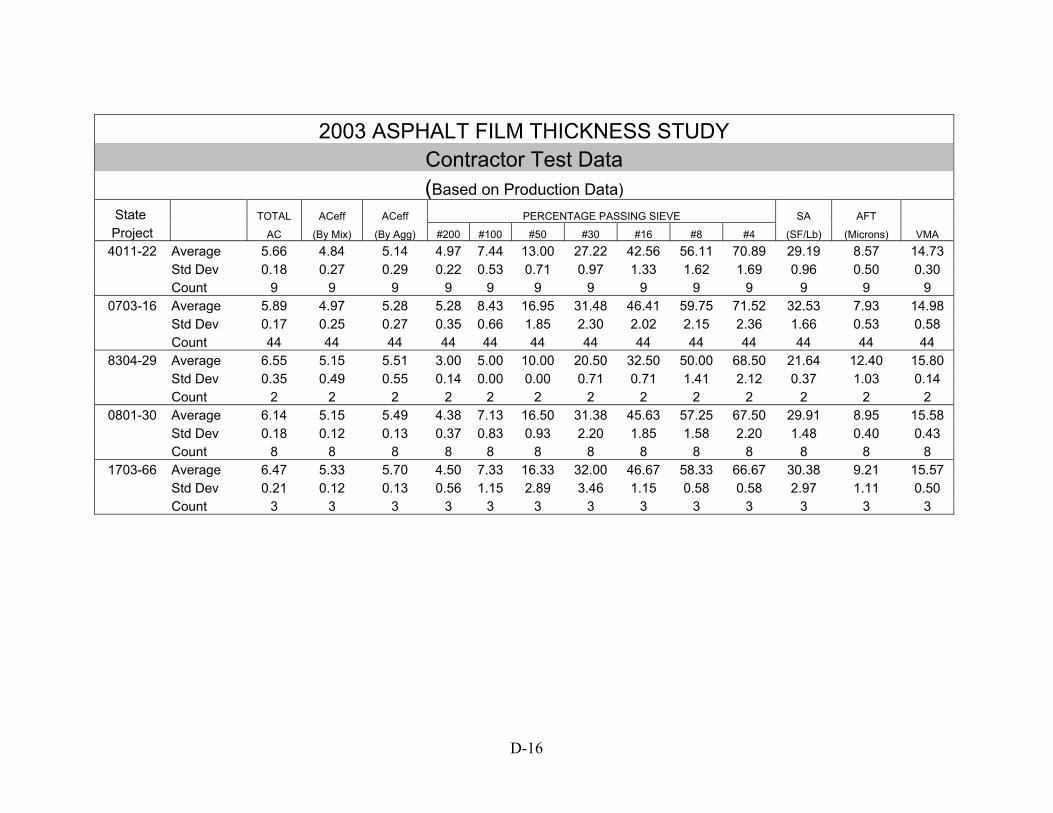
2003 ASPHALT FILM THICKNESS STUDY Contractor Test Data (Based on Production Data)
State TOTAL ACeff ACeff PERCENTAGE PASSING SIEVE SA AFT
Project AC (By Mix) (By Agg) #200 #100 #50 #30 #16 #8 #4 (SF/Lb) (Microns) VMA 4011-22 Average 5.66 4.84 5.14 4.97 7.44 13.00 27.22 42.56 56.11 70.89 29.19 8.57 14.73
Std Dev 0.18 0.27 0.29 0.22 0.53 0.71 0.97 1.33 1.62 1.69 0.96 0.50 0.30 Count 9 9 9 9 9 9 9 9 9 9 9 9 9
0703-16 Average 5.89 4.97 5.28 5.28 8.43 16.95 31.48 46.41 59.75 71.52 32.53 7.93 14.98 Std Dev 0.17 0.25 0.27 0.35 0.66 1.85 2.30 2.02 2.15 2.36 1.66 0.53 0.58 Count 44 44 44 44 44 44 44 44 44 44 44 44 44
8304-29 Average 6.55 5.15 5.51 3.00 5.00 10.00 20.50 32.50 50.00 68.50 21.64 12.40 15.80 Std Dev 0.35 0.49 0.55 0.14 0.00 0.00 0.71 0.71 1.41 2.12 0.37 1.03 0.14 Count 2 2 2 2 2 2 2 2 2 2 2 2 2
0801-30 Average 6.14 5.15 5.49 4.38 7.13 16.50 31.38 45.63 57.25 67.50 29.91 8.95 15.58 Std Dev 0.18 0.12 0.13 0.37 0.83 0.93 2.20 1.85 1.58 2.20 1.48 0.40 0.43 Count 8 8 8 8 8 8 8 8 8 8 8 8 8
1703-66 Average 6.47 5.33 5.70 4.50 7.33 16.33 32.00 46.67 58.33 66.67 30.38 9.21 15.57 Std Dev 0.21 0.12 0.13 0.56 1.15 2.89 3.46 1.15 0.58 0.58 2.97 1.11 0.50 Count 3 3 3 3 3 3 3 3 3 3 3 3 3
D-16

2004 ASPHALT FILM THICKNESS STUDY Mn/DOT Test Data
(Based on Production Data) State TOTAL ACeff ACeff PERCENTAGE PASSING SIEVE SA AFT Project AC (By Mix) (By Agg) #200 #100 #50 #30 #16 #8 #4 (SF/Lb) (Microns) VMA
0901-72 Average 5.45 4.67 4.94 6.53 10.67 21.20 32.87 44.53 56.40 69.67 37.03 6.49 14.91 Std Dev 0.26 0.18 0.20 0.47 0.62 1.82 2.85 2.83 2.75 3.09 1.37 0.19 0.86 Count 15 15 15 15 15 15 15 15 15 15 15 15 15
0901-73 Average 5.73 4.69 4.98 5.58 8.91 17.64 29.36 41.45 52.73 65.27 32.41 7.51 14.47 Std Dev 0.18 0.21 0.23 0.57 1.14 1.57 1.69 2.02 2.33 2.28 2.41 0.64 0.65 Count 11 11 11 11 11 11 11 11 11 11 11 11 11
0906-42 Average 5.14 4.27 4.50 6.70 9.33 15.00 23.67 37.67 55.67 73.00 31.96 6.86 14.03 Std Dev 0.05 0.06 0.06 0.17 0.58 1.00 1.15 1.15 2.08 1.73 1.22 0.35 0.46 Count 3 3 3 3 3 3 3 3 3 3 3 3 3
0906-42 Average 5.00 4.03 4.24 5.83 8.00 11.75 17.00 24.25 34.25 47.75 25.98 7.94 13.23 Std Dev 0.45 0.40 0.44 0.55 0.82 0.96 1.83 2.99 4.79 5.85 2.35 0.17 0.73 Count 4 4 4 4 4 4 4 4 4 4 4 4 4
3108-55 Average 4.75 4.24 4.45 4.94 7.00 11.00 18.00 26.75 36.63 50.00 24.53 8.85 13.94 Std Dev 0.21 0.17 0.18 0.39 0.53 0.53 0.76 1.16 1.51 2.51 1.22 0.48 0.23 Count 8 8 8 8 8 8 8 8 8 8 8 8 8
3108-55 Average 5.24 4.64 4.90 5.34 8.00 14.20 26.40 41.40 56.60 71.20 30.30 7.89 15.46 Std Dev 0.11 0.11 0.12 0.39 0.71 1.30 2.30 3.13 2.30 2.17 2.02 0.49 0.67 Count 5 5 5 5 5 5 5 5 5 5 5 5 5
6915-122 Average 4.99 4.24 4.47 6.82 9.33 15.06 23.28 34.39 48.44 64.28 29.58 7.38 14.94 Std Dev 0.30 0.39 0.42 0.61 0.59 1.11 1.49 2.28 3.40 3.59 1.78 0.79 0.81 Count 18 18 18 18 18 18 18 18 18 18 18 18 18
6920-37 Average 5.10 4.70 4.95 7.55 11.00 19.00 31.00 43.00 56.50 73.00 36.85 6.55 14.15 Std Dev 0.14 0.28 0.31 0.21 0.00 0.00 0.00 0.00 0.71 1.41 0.39 0.47 0.21 Count 2 2 2 2 2 2 2 2 2 2 2 2 2
D-17

2004 ASPHALT FILM THICKNESS STUDY Contractor Test Data (Based on Production Data)
State TOTAL ACeff ACeff PERCENTAGE PASSING SIEVE SA AFT
Project AC (By Mix) (By Agg) #200 #100 #50 #30 #16 #8 #4 (SF/Lb) (Microns) VMA 0901-72 Average 5.61 4.89 5.18 5.66 9.71 20.39 31.93 43.54 55.21 68.71 34.55 7.32 14.59
Std Dev 0.20 0.20 0.22 0.41 0.76 1.99 2.57 2.83 3.24 3.43 2.15 0.56 0.57 Count 28 28 28 28 28 28 28 28 28 28 28 28 28
0901-73 Average 5.44 4.65 4.92 5.46 8.73 17.55 29.36 41.00 52.36 64.36 32.01 7.53 14.54 Std Dev 0.21 0.26 0.28 0.73 0.90 1.63 2.01 2.28 2.62 3.01 2.64 0.68 0.45 Count 11 11 11 11 11 11 11 11 11 11 11 11 11
0906-42 Average 5.43 4.38 4.63 6.18 9.00 14.50 23.75 36.25 55.00 72.50 30.66 7.35 13.85 Std Dev 0.22 0.26 0.29 0.26 0.00 0.58 0.50 0.50 0.82 1.91 0.64 0.42 0.37 Count 4 4 4 4 4 4 4 4 4 4 4 4 4
0906-42 Average 4.89 3.89 4.09 4.77 6.71 10.57 16.00 22.14 31.57 43.86 22.72 8.88 13.86 Std Dev 0.28 0.26 0.29 0.75 0.95 1.51 2.45 3.63 5.19 6.47 3.18 1.17 1.21 Count 7 7 7 7 7 7 7 7 7 7 7 7 7
3108-55 Average 4.46 4.22 4.42 4.39 6.43 10.71 17.71 25.86 35.43 48.43 23.03 9.36 13.54 Std Dev 0.16 0.13 0.14 0.20 0.51 0.47 0.61 0.77 1.34 2.31 0.83 0.53 0.27 Count 14 14 14 14 14 14 14 14 14 14 14 14 14
3108-55 Average 5.33 4.77 5.04 4.98 7.70 14.00 26.20 40.40 56.10 70.80 29.35 8.38 15.19 Std Dev 0.15 0.22 0.24 0.37 0.48 1.15 2.20 2.41 2.23 2.10 1.68 0.49 0.38 Count 10 10 10 10 10 10 10 10 10 10 10 10 10
6915-122 Average 4.84 4.31 4.53 6.14 9.69 14.66 22.90 33.28 47.48 63.72 28.49 7.76 14.72 Std Dev 0.17 0.27 0.29 0.44 0.76 1.04 1.35 2.31 2.34 2.52 1.62 0.60 0.55 Count 29 29 29 29 29 29 29 29 29 29 29 29 29
6920-37 Average 5.40 4.90 5.18 6.87 12.00 18.33 30.00 42.67 56.00 72.00 35.98 7.01 14.93 Std Dev 0.10 0.10 0.11 0.06 0.00 0.58 0.00 0.58 1.00 1.00 0.25 0.16 0.21 Count 3 3 3 3 3 3 3 3 3 3 3 3 3
D-18

2004 ASPHALT FILM THICKNESS STUDY Mn/DOT Test Data
(Based on Production Data) State TOTAL ACeff ACeff PERCENTAGE PASSING SIEVE SA AFT Project AC (By Mix) (By Agg) #200 #100 #50 #30 #16 #8 #4 (SF/Lb) (Microns) VMA
36-646-02 Average 5.15 4.78 5.04 6.28 8.67 18.50 31.83 41.00 50.50 63.50 33.83 7.29 14.30 Std Dev 0.23 0.31 0.33 0.55 0.82 1.87 3.43 4.15 5.17 5.17 3.00 0.51 0.74 Count 6 6 6 6 6 6 6 6 6 6 6 6 6
38-602-24 Average 6.43 4.73 5.05 5.95 8.50 13.50 23.25 37.50 53.50 69.38 30.45 8.12 15.50 Std Dev 0.20 0.18 0.20 0.66 0.76 1.60 1.67 1.41 1.60 2.20 2.16 0.74 0.92 Count 8 8 8 8 8 8 8 8 8 8 8 8 8
0406-52 Average 4.61 3.87 4.06 5.98 7.80 11.10 14.90 18.50 23.60 32.30 24.73 8.01 13.58 Std Dev 0.27 0.30 0.32 0.46 0.63 0.99 1.10 1.35 2.01 3.13 1.78 0.61 0.82 Count 10 10 10 10 10 10 10 10 10 10 10 10 10
1411-16 Average 5.34 4.97 5.25 5.95 8.45 16.82 33.64 48.00 58.82 68.73 33.92 7.55 15.46 Std Dev 0.25 0.30 0.33 0.41 0.52 0.87 1.69 3.10 3.76 8.90 1.72 0.50 0.98 Count 11 11 11 11 11 11 11 11 11 11 11 11 11
0416-31 Average 5.68 4.92 5.22 4.44 6.60 15.80 32.60 49.00 63.80 76.80 30.38 8.45 15.62 Std Dev 0.58 0.64 0.71 0.61 1.14 2.77 2.07 2.35 3.56 4.44 3.06 1.58 0.86 Count 5 5 5 5 5 5 5 5 5 5 5 5 5
0416-39 Average 6.08 4.90 5.22 5.58 8.00 17.50 33.75 47.50 60.25 75.25 33.41 7.61 14.93 Std Dev 0.22 0.18 0.21 0.31 0.00 1.29 2.06 1.29 1.50 2.22 0.40 0.33 0.59 Count 4 4 4 4 4 4 4 4 4 4 4 4 4
1118-20 Average 6.36 5.48 5.85 4.98 7.00 16.80 35.80 51.80 63.00 72.40 32.33 8.81 16.42 Std Dev 0.26 0.34 0.38 0.26 0.00 0.45 1.48 2.77 3.08 3.05 0.75 0.47 1.22 Count 5 5 5 5 5 5 5 5 5 5 5 5 5
1118-20 Average 5.95 5.02 5.34 4.80 6.90 16.10 34.80 50.50 62.40 73.10 31.52 8.25 16.01 Std Dev 0.36 0.33 0.37 0.30 0.32 0.88 2.04 3.37 3.47 2.56 1.16 0.51 0.89 Count 10 10 10 10 10 10 10 10 10 10 10 10 10
D-19

2004 ASPHALT FILM THICKNESS STUDY
Contractor Test Data (Based on Production Data)
State TOTAL ACeff ACeff PERCENTAGE PASSING SIEVE SA AFT Project AC (By Mix) (By Agg) #200 #100 #50 #30 #16 #8 #4 (SF/Lb) (Microns) VMA
36-646-02 Average 5.06 4.67 4.92 5.46 7.78 17.22 31.89 41.22 50.33 62.67 31.59 7.61 14.53 Std Dev 0.05 0.09 0.09 0.49 0.67 1.48 2.89 3.53 4.00 4.06 2.31 0.48 0.32 Count 9 9 9 9 9 9 9 9 9 9 9 9 9
38-602-24 Average 6.62 5.02 5.38 5.15 7.48 12.67 22.86 36.62 52.71 68.19 28.12 9.36 15.35 Std Dev 0.19 0.18 0.20 0.48 0.75 1.46 2.15 2.38 1.74 2.02 2.01 0.79 0.63 Count 21 21 21 21 21 21 21 21 21 21 21 21 21
0406-52 Average 4.69 3.94 4.14 5.47 7.48 10.78 14.26 18.17 23.78 33.57 23.55 8.63 13.84 Std Dev 0.18 0.30 0.32 0.63 0.90 1.17 1.48 1.75 2.70 4.26 2.28 1.01 0.81 Count 23 23 23 23 23 23 23 23 23 23 23 23 23
1411-16 Average 5.19 4.92 5.18 5.74 8.25 16.35 33.80 48.35 58.95 71.15 33.41 7.57 15.82 Std Dev 0.23 0.27 0.30 0.54 0.64 1.04 1.82 2.78 3.91 4.87 1.98 0.45 0.86 Count 20 20 20 20 20 20 20 20 20 20 20 20 20
0416-31 Average 5.88 5.19 5.52 3.67 5.89 14.67 31.22 47.78 61.44 75.56 27.96 9.66 15.47 Std Dev 0.51 0.50 0.56 0.46 0.78 1.94 1.86 2.33 2.70 4.30 2.12 1.29 0.80 Count 9 9 9 9 9 9 9 9 9 9 9 9 9
0416-39 Average 6.05 5.02 5.34 4.68 7.17 16.00 33.00 46.50 58.83 74.00 30.77 8.48 15.30 Std Dev 0.14 0.13 0.15 0.71 0.98 1.55 3.03 2.43 1.83 2.97 2.11 0.60 0.43 Count 6 6 6 6 6 6 6 6 6 6 6 6 6
1118-20 Average 6.22 5.59 5.96 4.65 6.73 15.82 34.82 49.36 60.82 69.82 30.87 9.40 16.32 Std Dev 0.33 0.36 0.40 0.22 0.47 0.87 1.66 2.69 2.79 3.19 1.26 0.38 0.86 Count 11 11 11 11 11 11 11 11 11 11 11 11 11
1118-20 Average 5.93 5.16 5.48 4.68 6.86 15.77 34.32 49.45 61.91 72.41 31.02 8.63 15.90 Std Dev 0.29 0.30 0.34 0.34 0.56 0.97 3.48 3.14 3.44 3.50 1.60 0.65 0.83 Count 22 22 22 22 22 22 22 22 22 22 22 22 22
D-20

2004 ASPHALT FILM THICKNESS STUDY
Mn/DOT Test Data (Based on Production Data)
State TOTAL ACeff ACeff PERCENTAGE PASSING SIEVE SA AFT Project AC (By Mix) (By Agg) #200 #100 #50 #30 #16 #8 #4 (SF/Lb) (Microns) VMA
1507-23 Average 5.31 4.54 4.80 6.31 9.78 20.22 36.00 49.22 61.89 74.11 36.97 6.32 13.93 Std Dev 0.23 0.24 0.26 0.29 0.44 0.67 1.22 1.64 2.26 2.85 1.00 0.28 0.52 Count 9 9 9 9 9 9 9 9 9 9 9 9 9
3107-42 Average 5.33 4.42 4.67 6.21 10.94 21.88 36.75 50.44 60.75 69.94 38.06 5.97 14.58 Std Dev 0.15 0.17 0.19 0.32 0.44 1.15 1.95 2.66 2.54 2.41 1.10 0.24 0.68 Count 16 16 16 16 16 16 16 16 16 16 16 16 16
5702-42 Average 5.85 4.75 5.05 5.70 9.00 20.50 36.00 48.50 60.00 73.00 35.45 6.93 14.60 Std Dev 0.35 0.35 0.39 0.28 0.00 0.71 1.41 2.12 1.41 0.00 0.18 0.58 0.99 Count 2 2 2 2 2 2 2 2 2 2 2 2 2
6002-63 Average 5.67 4.90 5.19 2.90 6.00 23.33 34.67 45.00 58.00 70.67 29.43 8.61 15.97 Std Dev 0.12 0.10 0.11 0.17 0.00 1.15 3.21 3.61 3.00 1.15 0.94 0.46 0.85 Count 3 3 3 3 3 3 3 3 3 3 3 3 3
6005-53 Average 5.56 4.92 5.21 6.26 8.36 14.79 28.43 46.50 60.93 72.93 33.07 7.68 15.24 Std Dev 0.31 0.30 0.33 0.45 0.63 0.89 1.50 3.08 4.51 5.18 1.87 0.25 0.95 Count 14 14 14 14 14 14 14 14 14 14 14 14 14
6005-53 Average 5.80 5.03 5.34 6.19 7.86 13.14 27.00 45.14 59.57 72.57 31.78 8.19 15.16 Std Dev 0.39 0.35 0.40 0.33 0.38 0.69 1.00 1.86 2.64 3.36 1.33 0.66 0.45 Count 7 7 7 7 7 7 7 7 7 7 7 7 7
6006-21 Average 5.65 4.35 4.61 5.95 8.00 20.00 32.50 46.00 61.50 78.00 34.57 6.53 14.40 Std Dev 0.21 0.07 0.06 0.78 1.41 1.41 2.12 2.83 4.95 7.07 3.38 0.73 0.57 Count 2 2 2 2 2 2 2 2 2 2 2 2 2
6804-21 Average 5.56 4.72 5.00 4.07 5.89 16.07 30.50 41.89 53.39 64.68 27.92 8.72 15.24 Std Dev 0.17 0.20 0.21 0.17 0.31 0.90 1.11 1.29 1.73 2.07 0.65 0.28 0.47 Count 28 28 28 28 28 28 28 28 28 28 28 28 28
D-21

2004 ASPHALT FILM THICKNESS STUDY
Contractor Test Data (Based on Production Data)
State TOTAL ACeff ACeff PERCENTAGE PASSING SIEVE SA AFT Project AC (By Mix) (By Agg) #200 #100 #50 #30 #16 #8 #4 (SF/Lb) (Microns) VMA
1507-23 Average 5.33 4.58 4.84 5.67 8.67 18.78 35.04 48.11 60.93 73.44 34.56 6.82 14.42 Std Dev 0.17 0.16 0.18 0.28 0.55 0.80 0.85 1.22 1.24 1.40 1.01 0.27 0.34 Count 27 27 27 27 27 27 27 27 27 27 27 27 27
3107-42 Average 5.29 4.53 4.79 5.93 10.73 21.42 36.52 50.27 60.91 70.03 37.32 6.25 14.58 Std Dev 0.18 0.19 0.21 0.43 0.63 0.97 1.52 1.96 2.08 2.13 1.44 0.33 0.60 Count 33 33 33 33 33 33 33 33 33 33 33 33 33
5702-42 Average 5.60 4.83 5.11 5.65 8.50 21.00 36.50 49.75 61.50 74.50 35.48 7.02 14.85 Std Dev 0.29 0.26 0.29 0.19 0.58 0.82 1.73 1.89 1.73 1.29 0.83 0.49 0.64 Count 4 4 4 4 4 4 4 4 4 4 4 4 4
6002-63 Average 5.60 4.90 5.19 3.30 6.50 23.00 33.50 44.50 57.50 71.00 30.05 8.41 15.50 Std Dev 0.28 0.14 0.17 0.71 0.71 1.41 2.12 3.54 2.12 0.00 0.47 0.14 1.13 Count 2 2 2 2 2 2 2 2 2 2 2 2 2
6005-53 Average 5.57 4.92 5.21 6.07 8.29 14.29 27.66 46.03 59.57 71.29 32.34 7.85 15.27 Std Dev 0.20 0.24 0.26 0.40 0.52 0.75 1.21 2.39 3.20 3.50 1.48 0.37 0.70 Count 35 35 35 35 35 35 35 35 35 35 35 35 35
6005-53 Average 5.76 5.04 5.34 5.92 8.00 13.00 26.82 45.09 58.64 71.36 31.30 8.33 14.98 Std Dev 0.20 0.27 0.29 0.51 0.63 1.10 1.78 2.43 3.23 3.72 1.86 0.49 0.71 Count 11 11 11 11 11 11 11 11 11 11 11 11 11
6006-21 Average 5.30 4.17 4.40 6.27 8.67 20.33 33.00 46.67 62.00 78.67 35.73 6.01 13.73 Std Dev 0.10 0.06 0.06 0.49 0.58 0.58 1.00 1.53 2.65 4.04 1.67 0.34 0.25 Count 3 3 3 3 3 3 3 3 3 3 3 3 3
6804-21 Average 5.41 4.78 5.05 3.73 5.39 15.14 30.18 41.96 53.64 65.50 26.78 9.21 15.29 Std Dev 0.14 0.21 0.23 0.32 0.57 0.85 1.28 1.48 1.83 2.47 1.19 0.56 0.45 Count 28 28 28 28 28 28 28 28 28 28 28 28 28
D-22

2004 ASPHALT FILM THICKNESS STUDY
Mn/DOT Test Data (Based on Production Data)
State TOTAL ACeff ACeff PERCENTAGE PASSING SIEVE SA AFT Project AC (By Mix) (By Agg) #200 #100 #50 #30 #16 #8 #4 (SF/Lb) (Microns) VMA
44-601-18 Average 5.00 4.30 4.53 6.30 10.67 22.00 36.00 48.33 61.67 74.33 37.94 5.82 13.80 Std Dev 0.44 0.17 0.20 0.20 0.58 1.00 2.00 2.08 1.53 1.15 0.86 0.39 0.46 Count 3 3 3 3 3 3 3 3 3 3 3 3 3
57-610-09 Average 6.20 5.23 5.57 3.29 5.88 19.67 30.79 43.13 56.96 70.04 28.13 9.72 14.98 Std Dev 0.22 0.20 0.22 0.72 0.99 1.49 2.60 1.85 2.18 3.37 2.24 1.02 0.52 Count 24 24 24 24 24 24 24 24 24 24 24 24 24
57-625-03 Average 5.52 4.58 4.85 5.82 9.20 18.40 31.00 46.00 60.80 75.00 34.30 6.90 13.70 Std Dev 0.15 0.18 0.20 0.29 0.84 1.14 1.87 2.55 1.79 1.87 1.48 0.51 0.60 Count 5 5 5 5 5 5 5 5 5 5 5 5 5
60-601-53 Average 6.11 5.08 5.41 6.93 8.75 15.63 33.13 46.63 59.75 74.13 35.26 7.47 14.29 Std Dev 0.16 0.22 0.24 0.44 0.71 0.52 1.13 2.26 3.20 3.64 1.45 0.29 0.66 Count 8 8 8 8 8 8 8 8 8 8 8 8 8
60-609-19 Average 5.39 4.74 5.02 4.89 8.33 20.33 33.56 46.78 60.11 80.00 33.37 7.35 13.88 Std Dev 0.18 0.26 0.28 0.52 1.00 1.66 4.33 2.17 2.37 2.29 2.60 0.66 0.47 Count 9 9 9 9 9 9 9 9 9 9 9 9 9
60-609-19 Average 5.72 4.92 5.22 4.83 8.11 17.89 31.33 43.44 57.44 82.78 31.78 8.00 14.21 Std Dev 0.15 0.13 0.15 0.25 0.33 0.60 1.00 1.01 1.59 1.64 0.80 0.19 0.30 Count 9 9 9 9 9 9 9 9 9 9 9 9 9
60-609-20 Average 5.75 4.73 5.01 5.83 9.00 20.25 36.50 50.25 65.25 80.75 36.15 6.75 14.48 Std Dev 0.24 0.33 0.36 0.05 0.00 1.26 2.38 2.63 2.22 1.71 0.99 0.37 0.78 Count 4 4 4 4 4 4 4 4 4 4 4 4 4
60-609-20 Average 6.18 5.80 6.18 5.73 9.25 20.75 35.50 47.75 59.25 71.50 35.53 8.50 16.48 Std Dev 0.13 0.12 0.13 1.07 0.96 0.50 1.00 1.50 1.50 2.38 1.91 0.56 0.24 Count 4 4 4 4 4 4 4 4 4 4 4 4 4
D-23

2004 ASPHALT FILM THICKNESS STUDY
Contractor Test Data (Based on Production Data)
State TOTAL ACeff ACeff PERCENTAGE PASSING SIEVE SA AFT Project AC (By Mix) (By Agg) #200 #100 #50 #30 #16 #8 #4 (SF/Lb) (Microns) VMA
44-601-18 Average 5.14 4.49 4.73 5.59 10.33 22.11 35.78 47.89 60.67 73.89 36.52 6.33 14.08 Std Dev 0.13 0.18 0.19 0.38 0.71 1.62 2.54 2.85 2.50 2.52 1.80 0.41 0.49 Count 9 9 9 9 9 9 9 9 9 9 9 9 9
57-610-09 Average 6.05 5.16 5.49 3.65 6.48 19.94 31.64 44.15 57.88 70.73 29.40 9.17 14.98 Std Dev 0.17 0.18 0.20 0.68 1.09 1.62 1.93 1.87 2.12 3.47 2.26 0.91 0.50 Count 33 33 33 33 33 33 33 33 33 33 33 33 33
57-625-03 Average 5.50 4.69 4.96 5.11 8.30 17.10 29.50 44.40 59.40 73.40 31.81 7.62 13.81 Std Dev 0.18 0.20 0.22 0.61 0.67 1.10 1.65 1.84 1.58 1.07 1.90 0.58 0.26 Count 10 10 10 10 10 10 10 10 10 10 10 10 10
60-601-53 Average 6.19 5.19 5.53 6.37 8.42 14.74 32.74 46.63 59.26 73.79 33.82 7.98 14.96 Std Dev 0.25 0.24 0.26 0.61 0.77 0.87 1.63 2.69 3.43 3.87 1.91 0.38 0.45 Count 19 19 19 19 19 19 19 19 19 19 19 19 19
60-609-19 Average 5.42 4.84 5.12 4.77 8.77 20.08 34.46 46.46 59.15 79.08 33.40 7.48 14.15 Std Dev 0.13 0.24 0.26 0.54 1.09 1.80 1.90 1.71 1.82 1.71 2.31 0.48 0.23 Count 13 13 13 13 13 13 13 13 13 13 13 13 13
60-609-19 Average 5.83 5.02 5.33 4.55 8.13 17.60 30.93 43.53 56.87 82.47 31.18 8.34 14.39 Std Dev 0.07 0.08 0.09 0.33 0.52 1.12 1.16 1.30 1.55 1.60 1.25 0.37 0.20 Count 15 15 15 15 15 15 15 15 15 15 15 15 15
60-609-20 Average 6.03 5.01 5.33 5.40 8.00 19.56 34.67 48.78 63.22 79.78 34.19 7.61 14.54 Std Dev 0.18 0.16 0.18 0.25 0.00 1.51 2.50 3.15 3.03 2.49 1.28 0.39 0.41 Count 9 9 9 9 9 9 9 9 9 9 9 9 9
60-609-20 Average 6.48 6.08 6.50 5.94 9.13 21.00 35.25 48.63 60.63 74.38 36.01 8.79 16.79 Std Dev 0.29 0.26 0.30 0.28 0.35 1.07 1.98 2.33 2.20 1.85 1.39 0.37 0.61 Count 8 8 8 8 8 8 8 8 8 8 8 8 8
D-24

2004 ASPHALT FILM THICKNESS STUDY
Mn/DOT Test Data (Based on Production Data)
State TOTAL ACeff ACeff PERCENTAGE PASSING SIEVE SA AFT Project AC (By Mix) (By Agg) #200 #100 #50 #30 #16 #8 #4 (SF/Lb) (Microns) VMA
68-607-14 Average 6.00 5.02 5.34 2.49 4.30 26.50 35.90 42.60 52.70 64.10 28.34 9.21 15.14 Std Dev 0.17 0.17 0.19 0.38 0.67 1.78 2.28 2.72 2.95 3.41 1.96 0.64 0.58 Count 10 10 10 10 10 10 10 10 10 10 10 10 10
Fosston Average 5.24 4.24 4.47 6.14 9.60 19.20 31.80 46.20 62.60 77.80 35.55 6.13 14.02 Std Dev 0.25 0.23 0.25 0.35 0.55 0.84 1.10 1.48 2.51 2.77 1.14 0.25 0.43 Count 5 5 5 5 5 5 5 5 5 5 5 5 5
0206-49 Average 5.35 4.83 5.10 5.28 9.50 19.50 35.25 46.75 56.75 69.50 34.33 7.23 14.93 Std Dev 0.17 0.15 0.16 0.26 0.58 0.58 0.96 0.96 1.26 2.38 0.79 0.13 0.31 Count 4 4 4 4 4 4 4 4 4 4 4 4 4
1103-24 Average 5.28 4.28 4.51 5.39 9.42 18.75 32.83 45.08 56.17 68.58 33.72 6.53 13.78 Std Dev 0.22 0.26 0.28 0.48 0.67 1.22 1.95 2.84 3.81 4.93 2.16 0.45 0.70 Count 12 12 12 12 12 12 12 12 12 12 12 12 12
1113-15 Average 5.45 4.69 4.96 6.31 9.81 17.00 30.44 44.00 55.75 68.69 34.47 7.01 13.85 Std Dev 0.14 0.16 0.17 0.49 0.75 0.89 1.63 1.93 1.98 2.41 1.37 0.34 0.50 Count 16 16 16 16 16 16 16 16 16 16 16 16 16
1809-66 Average 5.48 4.74 5.02 5.30 8.11 15.56 28.22 44.00 58.22 72.33 31.26 7.87 15.32 Std Dev 0.20 0.17 0.19 0.52 0.93 1.67 2.17 2.74 3.73 3.74 2.45 0.70 0.90 Count 9 9 9 9 9 9 9 9 9 9 9 9 9
1810-88 Average 5.57 4.87 5.16 5.07 7.86 14.86 27.43 43.71 58.71 72.86 30.43 8.29 15.57 Std Dev 0.21 0.15 0.17 0.47 0.90 1.35 2.37 3.35 4.82 4.67 2.48 0.54 0.85 Count 7 7 7 7 7 7 7 7 7 7 7 7 7
3002-09 Average 5.65 4.65 4.93 5.00 7.75 15.75 29.50 41.75 52.75 64.50 30.25 7.94 14.85 Std Dev 0.13 0.19 0.21 0.16 0.50 0.96 1.91 2.75 3.50 4.20 1.16 0.31 0.81 Count 4 4 4 4 4 4 4 4 4 4 4 4 4
D-25

2004 ASPHALT FILM THICKNESS STUDY
Contractor Test Data (Based on Production Data)
State TOTAL ACeff ACeff PERCENTAGE PASSING SIEVE SA AFT Project AC (By Mix) (By Agg) #200 #100 #50 #30 #16 #8 #4 (SF/Lb) (Microns) VMA
68-607-14 Average 5.97 5.19 5.52 2.44 4.03 26.06 35.64 42.55 52.67 64.06 27.92 9.65 15.15 Std Dev 0.25 0.25 0.28 0.39 0.47 1.97 2.40 2.50 2.61 3.09 1.74 0.70 0.72 Count 33 33 33 33 33 33 33 33 33 33 33 33 33
Fosston Average 5.14 4.48 4.72 5.83 9.63 18.00 30.63 44.88 61.38 76.00 34.35 6.69 13.98 Std Dev 0.17 0.16 0.17 0.18 0.52 0.76 0.92 1.25 1.51 1.20 0.92 0.29 0.25 Count 8 8 8 8 8 8 8 8 8 8 8 8 8
0206-49 Average 5.30 5.00 5.28 5.20 9.00 18.00 34.00 45.50 55.50 69.50 33.13 7.76 14.90 Std Dev 0.28 0.42 0.46 0.14 0.00 0.00 0.00 0.71 0.71 0.71 0.33 0.61 0.14 Count 2 2 2 2 2 2 2 2 2 2 2 2 2
1103-24 Average 5.29 4.38 4.62 4.84 8.68 18.53 32.71 45.89 56.55 69.03 32.41 6.95 14.20 Std Dev 0.17 0.21 0.23 0.34 0.57 0.95 1.14 1.86 2.33 2.56 1.20 0.43 0.26 Count 38 38 38 38 38 38 38 38 38 38 38 38 38
1113-15 Average 5.42 4.74 5.01 5.75 8.90 17.00 30.38 44.10 55.41 67.97 33.00 7.40 13.95 Std Dev 0.13 0.15 0.16 0.34 0.49 1.00 1.72 1.90 1.97 2.29 1.04 0.29 0.48 Count 29 29 29 29 29 29 29 29 29 29 29 29 29
1809-66 Average 5.40 4.87 5.14 4.90 7.42 14.58 27.33 43.33 57.33 70.33 29.66 8.50 15.32 Std Dev 0.21 0.23 0.25 0.46 0.90 1.51 2.39 2.74 3.47 4.01 2.21 0.88 0.76 Count 12 12 12 12 12 12 12 12 12 12 12 12 12
1810-88 Average 5.50 4.89 5.18 4.76 7.31 14.38 26.00 41.62 56.38 69.54 28.93 8.81 15.27 Std Dev 0.16 0.23 0.25 0.91 1.03 1.85 2.52 3.25 4.09 4.91 3.28 0.98 0.55 Count 13 13 13 13 13 13 13 13 13 13 13 13 13
3002-09 Average 5.60 4.69 4.97 4.63 7.11 14.11 28.78 41.22 52.33 64.56 28.62 8.45 14.72 Std Dev 0.21 0.25 0.28 0.44 0.60 1.05 1.09 1.39 1.32 1.81 1.27 0.32 0.49 Count 9 9 9 9 9 9 9 9 9 9 9 9 9
D-26

2004 ASPHALT FILM THICKNESS STUDY
Mn/DOT Test Data (Based on Production Data)
State TOTAL ACeff ACeff PERCENTAGE PASSING SIEVE SA AFT Project AC (By Mix) (By Agg) #200 #100 #50 #30 #16 #8 #4 (SF/Lb) (Microns) VMA
3005-11 Average 5.15 4.28 4.51 5.68 9.00 17.82 31.32 43.50 54.95 69.41 33.28 6.61 14.30 Std Dev 0.22 0.24 0.26 0.33 0.62 0.91 1.49 2.22 2.63 2.58 1.31 0.45 0.73 Count 22 22 22 22 22 22 22 22 22 22 22 22 22
4319-19 Average 5.30 4.53 4.78 5.80 8.75 16.50 31.50 44.00 54.25 66.00 32.90 7.08 13.80 Std Dev 0.00 0.10 0.10 0.59 0.96 0.58 1.73 2.58 2.63 3.16 1.18 0.22 1.12 Count 4 4 4 4 4 4 4 4 4 4 4 4 4
4903-64 Average 5.05 4.30 4.53 5.82 9.69 17.77 29.15 40.08 52.85 69.38 33.25 6.64 13.64 Std Dev 0.18 0.20 0.21 0.28 0.48 0.83 0.99 1.38 1.57 2.18 1.02 0.41 0.39 Count 13 13 13 13 13 13 13 13 13 13 13 13 13
7305-86 Average 5.50 4.55 4.81 6.45 9.50 17.00 30.50 46.00 60.00 74.00 34.95 6.72 14.40 Std Dev 0.14 0.07 0.08 0.35 0.71 1.41 2.12 2.83 2.83 2.83 2.11 0.29 0.00 Count 2 2 2 2 2 2 2 2 2 2 2 2 2
7305-86 Average 5.08 4.53 4.77 5.75 8.75 16.25 29.25 43.25 58.25 73.00 32.67 7.12 13.75 Std Dev 0.34 0.33 0.36 0.19 0.50 0.96 1.71 1.50 2.63 2.00 1.01 0.66 0.47 Count 4 4 4 4 4 4 4 4 4 4 4 4 4
7305-86 Average 5.57 4.81 5.10 5.90 8.86 16.29 28.57 42.86 58.00 70.86 32.81 7.61 15.06 Std Dev 0.39 0.35 0.39 0.61 1.07 1.80 3.21 4.06 4.32 5.08 2.97 0.70 0.96 Count 7 7 7 7 7 7 7 7 7 7 7 7 7
7316-11 Average 5.54 4.82 5.10 5.26 7.20 11.80 22.20 36.80 49.80 63.20 27.58 9.03 14.50 Std Dev 0.18 0.18 0.20 0.40 0.84 0.84 1.30 2.28 3.77 4.21 1.35 0.60 0.96 Count 5 5 5 5 5 5 5 5 5 5 5 5 5
7316-11 Average 5.23 4.51 4.76 5.96 8.75 14.25 24.13 36.50 51.25 69.75 30.81 7.53 14.28 Std Dev 0.17 0.20 0.21 0.26 0.46 0.46 0.64 1.31 2.25 2.43 0.91 0.35 0.50 Count 8 8 8 8 8 8 8 8 8 8 8 8 8
D-27

2004 ASPHALT FILM THICKNESS STUDY Contractor Test Data (Based on Production Data)
State TOTAL ACeff ACeff PERCENTAGE PASSING SIEVE SA AFT Project AC (By Mix) (By Agg) #200 #100 #50 #30 #16 #8 #4 (SF/Lb) (Microns) VMA
3005-11 Average 5.15 4.39 4.63 4.79 7.66 15.91 30.69 42.43 53.77 68.57 30.24 7.47 14.34 Std Dev 0.26 0.25 0.27 0.41 0.59 1.15 1.83 2.20 2.57 2.38 1.57 0.55 0.64 Count 35 35 35 35 35 35 35 35 35 35 35 35 35
4319-19 Average 5.26 4.54 4.79 5.44 8.00 19.40 30.40 42.40 53.00 65.20 32.40 7.22 14.00 Std Dev 0.25 0.15 0.16 0.88 0.71 5.59 1.95 2.07 1.73 2.59 2.08 0.34 0.84 Count 5 5 5 5 5 5 5 5 5 5 5 5 5
4903-64 Average 5.26 4.43 4.67 5.96 9.14 17.40 29.49 40.09 52.69 68.77 33.05 6.94 14.28 Std Dev 0.14 0.20 0.21 0.83 1.24 1.42 1.70 2.24 3.01 3.37 2.61 0.73 0.39 Count 35 35 35 35 35 35 35 35 35 35 35 35 35
7305-86 Average 5.30 4.57 4.82 5.97 9.00 16.00 29.67 43.33 57.00 70.00 33.05 7.15 14.17 Std Dev 0.10 0.25 0.27 0.81 1.00 2.00 1.53 1.15 1.73 1.00 2.86 0.87 0.12 Count 3 3 3 3 3 3 3 3 3 3 3 3 3
7305-86 Average 5.31 4.76 5.03 4.79 7.29 14.71 28.57 42.57 56.29 70.71 29.51 8.29 13.86 Std Dev 0.41 0.42 0.46 0.48 0.76 1.38 1.72 2.07 3.04 3.30 1.97 0.38 0.39 Count 7 7 7 7 7 7 7 7 7 7 7 7 7
7305-86 Average 5.54 4.83 5.12 5.16 7.75 14.67 27.25 40.75 55.67 68.67 29.98 8.36 14.84 Std Dev 0.38 0.35 0.40 0.66 0.87 1.44 2.22 2.73 3.23 4.44 2.47 0.87 0.79 Count 12 12 12 12 12 12 12 12 12 12 12 12 12
7316-11 Average 5.52 4.77 5.05 4.57 6.22 10.44 21.67 36.44 51.78 65.11 25.50 9.72 14.69 Std Dev 0.19 0.28 0.30 0.66 0.67 1.01 1.73 2.51 3.11 3.41 2.04 1.24 0.84 Count 9 9 9 9 9 9 9 9 9 9 9 9 9
7316-11 Average 5.15 4.55 4.80 5.36 7.69 12.88 22.75 35.06 50.75 68.63 28.44 8.23 14.39 Std Dev 0.22 0.17 0.19 0.34 0.70 0.89 1.29 1.73 2.52 2.66 1.51 0.41 0.42 Count 16 16 16 16 16 16 16 16 16 16 16 16 16
D-28

2004 ASPHALT FILM THICKNESS STUDY
Mn/DOT Test Data (Based on Production Data)
State TOTAL ACeff ACeff PERCENTAGE PASSING SIEVE SA AFT Project AC (By Mix) (By Agg) #200 #100 #50 #30 #16 #8 #4 (SF/Lb) (Microns) VMA
7701-34 Average 5.79 4.81 5.11 5.53 8.29 17.43 33.43 46.86 59.71 73.43 33.33 7.47 14.76 Std Dev 0.20 0.22 0.23 0.27 0.49 0.53 0.53 0.69 0.76 1.40 0.95 0.46 0.28 Count 7 7 7 7 7 7 7 7 7 7 7 7 7
01-602-12 Average 6.43 5.00 5.34 4.37 6.14 11.00 23.14 44.57 60.00 71.71 26.62 9.79 15.13 Std Dev 0.18 0.18 0.20 0.45 0.38 1.15 1.21 1.62 2.16 2.69 1.47 0.49 0.39 Count 7 7 7 7 7 7 7 7 7 7 7 7 7
01-602-12 Average 6.50 5.00 5.35 4.54 6.40 10.80 23.80 44.40 60.00 72.40 27.08 9.62 14.82 Std Dev 0.21 0.19 0.21 0.15 0.55 0.45 0.84 1.14 1.58 1.52 0.55 0.43 0.75 Count 5 5 5 5 5 5 5 5 5 5 5 5 5
05-604-20 Average 5.65 5.10 5.41 5.60 8.00 16.00 33.00 49.50 60.00 69.50 32.93 7.99 14.35 Std Dev 0.21 0.28 0.31 0.14 0.00 0.00 1.41 2.12 2.83 3.54 0.78 0.27 0.64 Count 2 2 2 2 2 2 2 2 2 2 2 2 2
11-596-02 Average 5.57 4.90 5.19 4.87 8.67 18.00 33.67 46.33 58.00 71.00 32.55 7.78 14.83 Std Dev 0.12 0.17 0.19 0.45 0.58 1.00 0.58 1.15 1.00 1.73 1.57 0.51 0.21 Count 3 3 3 3 3 3 3 3 3 3 3 3 3
11-606-07 Average 5.94 5.39 5.73 4.57 7.14 14.29 29.57 45.57 58.14 70.43 29.41 9.50 16.50 Std Dev 0.28 0.24 0.27 0.22 0.38 0.76 1.90 3.41 4.26 4.47 1.37 0.63 0.90 Count 7 7 7 7 7 7 7 7 7 7 7 7 7
11-613-02 Average 5.80 5.09 5.41 3.98 6.42 13.33 29.33 45.75 57.00 67.00 27.60 9.54 15.50 Std Dev 0.26 0.33 0.36 0.35 0.51 0.78 1.61 2.77 3.52 3.88 1.26 0.55 0.72 Count 12 12 12 12 12 12 12 12 12 12 12 12 12
18-601-16 Average 5.92 5.00 5.31 5.72 10.33 21.50 37.00 49.67 60.33 72.67 36.82 7.04 15.27 Std Dev 0.08 0.06 0.07 0.45 0.52 0.84 1.26 1.75 2.42 3.27 1.70 0.29 0.37 Count 6 6 6 6 6 6 6 6 6 6 6 6 6
D-29

2004 ASPHALT FILM THICKNESS STUDY
Contractor Test Data (Based on Production Data)
State TOTAL ACeff ACeff PERCENTAGE PASSING SIEVE SA AFT Project AC (By Mix) (By Agg) #200 #100 #50 #30 #16 #8 #4 (SF/Lb) (Microns) VMA
7701-34 Average 5.51 4.89 5.17 5.01 7.29 16.57 32.29 46.00 58.00 71.57 31.32 8.06 15.04 Std Dev 0.17 0.23 0.25 0.38 0.49 1.13 1.11 1.91 2.45 2.23 1.32 0.58 0.46 Count 7 7 7 7 7 7 7 7 7 7 7 7 7
01-602-12 Average 6.26 5.08 5.42 4.45 5.94 10.71 23.06 44.35 59.12 71.76 26.48 9.98 14.94 Std Dev 0.14 0.15 0.16 0.33 0.43 0.92 0.97 1.58 1.69 1.99 1.12 0.38 0.38 Count 17 17 17 17 17 17 17 17 17 17 17 17 17
01-602-12 Average 6.29 5.13 5.48 4.35 5.92 10.85 24.31 45.54 60.54 73.15 26.70 9.99 15.17 Std Dev 0.18 0.19 0.21 0.25 0.28 0.38 1.25 1.45 1.56 1.63 0.89 0.40 0.39 Count 13 13 13 13 13 13 13 13 13 13 13 13 13
05-604-20 Average 5.80 5.36 5.69 5.03 7.71 15.43 32.86 49.29 60.14 70.29 31.66 8.78 15.00 Std Dev 0.24 0.24 0.27 0.65 0.95 0.79 1.21 1.89 2.19 2.36 2.01 0.77 0.46 Count 7 7 7 7 7 7 7 7 7 7 7 7 7
11-596-02 Average 5.63 4.88 5.17 4.48 7.63 17.00 32.75 45.88 56.88 69.25 30.75 8.22 15.01 Std Dev 0.30 0.29 0.32 0.70 1.06 1.31 1.67 2.17 2.03 2.38 2.49 0.70 0.45 Count 8 8 8 8 8 8 8 8 8 8 8 8 8
11-606-07 Average 5.77 5.40 5.73 4.25 6.45 13.91 29.64 44.18 56.36 67.55 28.14 9.96 16.11 Std Dev 0.20 0.27 0.30 0.25 0.69 1.58 2.20 2.79 5.46 3.80 1.78 0.85 0.70 Count 11 11 11 11 11 11 11 11 11 11 11 11 11
11-613-02 Average 5.77 5.21 5.53 3.81 5.81 13.31 29.88 45.31 56.69 66.38 26.97 9.99 15.47 Std Dev 0.31 0.31 0.34 0.29 0.40 0.60 1.41 2.44 3.09 3.30 1.12 0.57 0.63 Count 16 16 16 16 16 16 16 16 16 16 16 16 16
18-601-16 Average 6.05 5.03 5.36 5.24 10.06 22.00 37.38 50.69 61.44 73.44 36.24 7.21 15.59 Std Dev 0.13 0.12 0.13 0.42 0.68 0.73 1.02 1.54 2.03 2.19 1.36 0.35 0.33 Count 16 16 16 16 16 16 16 16 16 16 16 16 16
D-30

2004 ASPHALT FILM THICKNESS STUDY
Mn/DOT Test Data (Based on Production Data)
State TOTAL ACeff ACeff PERCENTAGE PASSING SIEVE SA AFT Project AC (By Mix) (By Agg) #200 #100 #50 #30 #16 #8 #4 (SF/Lb) (Microns) VMA
18-620-08 Average 5.90 5.03 5.34 4.60 8.00 17.25 31.50 47.50 60.25 72.50 31.41 8.34 15.63 Std Dev 0.24 0.17 0.19 0.85 1.41 3.10 3.87 4.20 4.27 5.20 3.66 0.71 0.46 Count 4 4 4 4 4 4 4 4 4 4 4 4 4
18-620-08 Average 5.43 4.60 4.86 5.47 8.67 16.33 32.00 46.00 56.67 67.67 32.63 7.27 14.73 Std Dev 0.06 0.20 0.21 0.21 0.58 0.58 1.73 2.65 3.21 4.04 1.33 0.41 0.76 Count 3 3 3 3 3 3 3 3 3 3 3 3 3
30-604-17 Average 5.64 4.68 4.95 4.91 7.88 16.38 31.88 45.00 56.00 67.75 31.16 7.80 14.09 Std Dev 0.32 0.17 0.18 0.64 1.36 2.26 3.76 3.25 2.39 2.38 2.89 0.76 0.45 Count 8 8 8 8 8 8 8 8 8 8 8 8 8
33-606-20 Average 5.13 4.33 4.56 6.05 9.50 18.25 31.50 43.50 55.00 68.25 34.31 6.47 14.28 Std Dev 0.30 0.35 0.38 0.66 1.00 0.50 0.58 1.29 1.83 2.06 1.89 0.38 0.69 Count 4 4 4 4 4 4 4 4 4 4 4 4 4
33-608-13 Average 5.40 4.80 5.07 5.64 8.60 16.60 30.00 43.60 56.20 68.00 32.46 7.62 13.66 Std Dev 0.16 0.12 0.14 0.55 0.55 0.55 1.58 1.82 1.92 1.87 0.94 0.35 0.59 Count 5 5 5 5 5 5 5 5 5 5 5 5 5
33-617-08 Average 5.43 4.75 5.02 5.73 9.00 17.50 31.00 43.00 54.25 67.25 33.11 7.39 14.23 Std Dev 0.22 0.24 0.26 0.29 0.00 0.58 0.82 1.41 1.71 2.50 0.82 0.48 0.61 Count 4 4 4 4 4 4 4 4 4 4 4 4 4
33-617-08 Average 5.23 4.40 4.64 6.33 9.67 18.33 31.33 42.67 54.00 67.67 34.75 6.51 13.53 Std Dev 0.12 0.10 0.11 0.25 0.58 0.58 0.58 0.58 1.00 1.53 0.96 0.33 0.35 Count 3 3 3 3 3 3 3 3 3 3 3 3 3
49-649-06 Average 5.86 5.13 5.45 5.32 8.47 16.07 31.07 45.93 59.07 71.60 32.23 8.25 14.79 Std Dev 0.27 0.35 0.39 0.43 0.74 1.79 2.52 2.94 4.18 5.69 1.98 0.61 0.88 Count 15 15 15 15 15 15 15 15 15 15 15 15 15
D-31

2004 ASPHALT FILM THICKNESS STUDY
Contractor Test Data (Based on Production Data)
State TOTAL ACeff ACeff PERCENTAGE PASSING SIEVE SA AFT Project AC (By Mix) (By Agg) #200 #100 #50 #30 #16 #8 #4 (SF/Lb) (Microns) VMA
18-620-08 Average 5.77 5.12 5.44 4.60 7.89 18.22 32.78 48.22 61.44 73.22 31.93 8.36 15.69 Std Dev 0.26 0.19 0.21 0.67 1.17 2.77 3.80 3.93 3.68 4.06 3.21 0.75 0.46 Count 9 9 9 9 9 9 9 9 9 9 9 9 9
18-620-08 Average 5.34 4.67 4.94 5.19 7.86 16.57 31.86 45.86 56.43 67.57 31.72 7.58 14.76 Std Dev 0.17 0.27 0.29 0.25 0.38 0.98 1.46 2.19 2.64 2.37 1.25 0.36 0.49 Count 7 7 7 7 7 7 7 7 7 7 7 7 7
30-604-17 Average 5.38 4.70 4.97 5.23 8.50 16.00 29.50 41.50 53.75 67.75 31.22 7.77 14.20 Std Dev 0.38 0.56 0.61 0.31 0.58 0.82 0.58 0.58 0.50 1.26 1.01 1.08 0.41 Count 4 4 4 4 4 4 4 4 4 4 4 4 4
33-606-20 Average 5.26 4.63 4.88 5.81 9.63 18.13 32.00 43.38 54.38 67.75 33.99 7.03 14.44 Std Dev 0.30 0.28 0.30 0.44 2.26 1.64 1.31 1.30 1.19 1.58 2.23 0.70 0.20 Count 8 8 8 8 8 8 8 8 8 8 8 8 8
33-608-13 Average 5.68 4.94 5.24 5.68 8.00 16.60 30.80 44.20 57.40 69.20 32.40 7.89 14.60 Std Dev 0.13 0.09 0.10 0.83 0.71 0.55 1.10 0.84 1.14 1.10 1.62 0.47 0.67 Count 5 5 5 5 5 5 5 5 5 5 5 5 5
33-617-08 Average 5.62 5.05 5.36 5.43 8.55 17.09 31.27 43.09 54.18 67.09 32.27 8.09 14.89 Std Dev 0.17 0.27 0.30 0.40 0.69 0.83 0.65 1.14 1.40 1.70 1.31 0.56 0.40 Count 11 11 11 11 11 11 11 11 11 11 11 11 11
33-617-08 Average 5.21 4.60 4.85 5.64 9.40 17.90 31.20 42.50 53.30 66.60 33.27 7.14 14.16 Std Dev 0.27 0.26 0.29 0.47 2.07 1.60 1.75 1.84 2.11 2.46 2.41 0.74 0.39 Count 10 10 10 10 10 10 10 10 10 10 10 10 10
49-649-06 Average 5.94 5.18 5.50 5.08 7.69 16.06 30.44 44.94 57.56 69.38 31.11 8.64 15.14 Std Dev 0.21 0.30 0.34 0.77 0.79 1.81 2.78 1.98 3.65 6.96 2.24 0.63 0.87 Count 16 16 16 16 16 16 16 16 16 16 16 16 16
D-32

2004 ASPHALT FILM THICKNESS STUDY
Mn/DOT Test Data (Based on Production Data)
State TOTAL ACeff ACeff PERCENTAGE PASSING SIEVE SA AFT Project AC (By Mix) (By Agg) #200 #100 #50 #30 #16 #8 #4 (SF/Lb) (Microns) VMA
73-601-41 Average 5.52 4.82 5.10 5.80 8.60 15.40 30.40 44.00 55.40 68.40 32.42 7.70 14.08 Std Dev 0.28 0.19 0.21 0.60 0.89 1.34 1.52 2.92 3.29 3.97 2.18 0.74 0.74 Count 5 5 5 5 5 5 5 5 5 5 5 5 5
73-607-27 Average 5.57 4.93 5.22 4.97 7.67 15.00 31.33 46.67 58.00 67.67 30.84 8.25 15.30 Std Dev 0.32 0.21 0.24 0.23 0.58 1.00 1.53 1.53 2.65 3.21 1.47 0.17 0.40 Count 3 3 3 3 3 3 3 3 3 3 3 3 3
73-617-30 Average 5.28 4.67 4.93 5.38 7.83 12.17 22.33 34.50 48.83 64.17 28.09 8.59 14.08 Std Dev 0.04 0.18 0.19 0.52 0.75 1.17 1.51 2.26 3.97 5.19 1.95 0.81 0.88 Count 6 6 6 6 6 6 6 6 6 6 6 6 6
73-617-30 Average 5.40 4.73 5.00 4.93 7.00 10.33 17.50 27.83 40.50 56.33 24.62 9.93 14.05 Std Dev 0.23 0.26 0.28 0.34 0.63 1.03 1.05 1.72 3.02 4.50 1.35 0.90 0.55 Count 6 6 6 6 6 6 6 6 6 6 6 6 6
86-603-15 Average 6.26 5.09 5.43 5.35 7.38 12.50 25.00 41.38 59.25 77.38 29.46 8.98 14.81 Std Dev 0.18 0.16 0.17 0.43 0.52 0.76 1.41 2.39 3.11 3.89 1.29 0.32 0.68 Count 8 8 8 8 8 8 8 8 8 8 8 8 8
86-603-15 Average 5.79 4.71 5.00 4.97 6.89 12.00 26.22 42.33 58.11 73.11 28.52 8.53 14.20 Std Dev 0.27 0.28 0.31 0.23 0.33 0.50 1.48 2.29 2.26 2.15 1.00 0.33 0.42 Count 9 9 9 9 9 9 9 9 9 9 9 9 9
80-609-17 Average 5.65 4.85 5.14 6.00 9.25 18.00 32.75 45.50 56.00 65.50 34.33 7.30 13.25 Std Dev 0.13 0.19 0.20 0.42 0.50 0.00 1.26 1.29 1.63 1.00 1.04 0.43 0.26 Count 4 4 4 4 4 4 4 4 4 4 4 4 4
86-103-04 Average 6.18 5.55 5.92 5.75 9.00 18.00 33.75 47.00 58.25 68.50 34.19 8.46 15.00 Std Dev 0.22 0.13 0.15 0.50 0.82 1.41 2.22 2.45 2.63 2.89 2.17 0.66 0.57 Count 4 4 4 4 4 4 4 4 4 4 4 4 4
D-33

2004 ASPHALT FILM THICKNESS STUDY
Contractor Test Data (Based on Production Data)
State TOTAL ACeff ACeff PERCENTAGE PASSING SIEVE SA AFT Project AC (By Mix) (By Agg) #200 #100 #50 #30 #16 #8 #4 (SF/Lb) (Microns) VMA
73-601-41 Average 5.68 4.92 5.21 5.42 7.83 15.17 30.17 43.67 54.33 67.50 31.16 8.19 14.65 Std Dev 0.27 0.17 0.19 0.73 1.17 1.47 1.17 2.07 2.42 2.66 2.33 0.76 0.62 Count 6 6 6 6 6 6 6 6 6 6 6 6 6
73-607-27 Average 5.56 5.30 5.61 4.60 7.20 14.20 31.60 47.00 58.60 68.60 29.84 9.18 15.38 Std Dev 0.11 0.21 0.23 0.48 0.45 1.10 2.19 3.08 3.36 2.97 1.93 0.61 0.43 Count 5 5 5 5 5 5 5 5 5 5 5 5 5
73-617-30 Average 5.50 4.76 5.04 4.85 6.91 11.27 21.64 33.82 47.27 62.27 26.17 9.43 14.43 Std Dev 0.24 0.28 0.31 0.56 0.70 1.10 1.57 1.66 2.24 2.69 2.00 0.88 0.51 Count 11 11 11 11 11 11 11 11 11 11 11 11 11
73-617-30 Average 5.35 4.82 5.09 4.23 6.33 9.67 17.83 28.33 41.83 58.00 23.07 10.78 14.80 Std Dev 0.26 0.22 0.25 0.38 0.52 0.82 1.94 3.14 3.66 4.52 1.40 0.84 0.68 Count 6 6 6 6 6 6 6 6 6 6 6 6 6
86-603-15 Average 6.19 5.17 5.52 5.08 6.91 11.83 24.61 41.17 57.74 74.91 28.37 9.48 15.00 Std Dev 0.14 0.15 0.16 0.34 0.51 0.72 1.47 2.53 3.36 3.67 1.32 0.41 0.55 Count 23 23 23 23 23 23 23 23 23 23 23 23 23
86-603-15 Average 5.72 4.86 5.15 4.45 5.96 11.27 25.58 42.12 56.73 71.23 26.72 9.42 14.51 Std Dev 0.19 0.17 0.19 0.38 0.45 0.83 2.06 2.88 3.48 3.46 1.58 0.56 0.49 Count 26 26 26 26 26 26 26 26 26 26 26 26 26
80-609-17 Average 5.73 4.76 5.05 6.28 8.40 17.10 32.70 44.80 55.40 65.40 33.90 7.27 14.03 Std Dev 0.11 0.12 0.12 0.68 0.70 0.74 1.34 1.62 1.51 1.71 1.47 0.38 0.25 Count 10 10 10 10 10 10 10 10 10 10 10 10 10
86-103-04 Average 5.96 5.34 5.68 5.57 8.29 17.29 32.57 45.29 56.29 66.86 32.84 8.43 15.27 Std Dev 0.23 0.13 0.15 0.34 0.49 0.95 1.51 1.50 1.80 1.68 1.43 0.26 0.42 Count 7 7 7 7 7 7 7 7 7 7 7 7 7
D-34

2004 ASPHALT FILM THICKNESS STUDY
Mn/DOT Test Data (Based on Production Data)
State TOTAL ACeff ACeff PERCENTAGE PASSING SIEVE SA AFT Project AC (By Mix) (By Agg) #200 #100 #50 #30 #16 #8 #4 (SF/Lb) (Microns) VMA
86-103-04 Average 6.55 5.73 6.13 5.88 9.00 18.25 34.75 49.50 61.75 74.75 35.07 8.51 15.95 Std Dev 0.19 0.22 0.25 0.15 0.00 0.50 1.71 3.11 3.59 3.10 0.72 0.40 0.93 Count 4 4 4 4 4 4 4 4 4 4 4 4 4
86-134-043 Average 6.03 5.20 5.53 5.68 9.00 18.00 35.00 50.25 63.00 73.75 34.80 7.74 15.30 Std Dev 0.21 0.16 0.18 0.15 0.00 0.00 0.82 1.26 1.63 1.71 0.39 0.23 0.57 Count 4 4 4 4 4 4 4 4 4 4 4 4 4
86-134-043 Average 6.27 5.50 5.87 5.97 9.67 17.67 32.33 47.33 62.00 75.00 34.94 8.18 15.70 Std Dev 0.23 0.26 0.30 0.15 0.58 0.58 2.08 3.06 4.58 5.57 1.55 0.06 1.22 Count 3 3 3 3 3 3 3 3 3 3 3 3 3
86-630-19 Average 5.90 5.10 5.42 5.53 8.67 18.00 34.00 48.67 61.00 71.67 33.98 7.78 15.37 Std Dev 0.00 0.17 0.18 0.21 0.58 0.00 1.00 2.08 2.65 2.89 0.94 0.46 0.55 Count 3 3 3 3 3 3 3 3 3 3 3 3 3
86-630-19 Average 6.08 5.28 5.62 5.60 9.00 17.00 30.75 44.75 59.50 72.50 33.18 8.24 15.35 Std Dev 0.15 0.10 0.11 0.22 0.00 0.00 0.96 1.50 2.52 2.52 0.13 0.16 0.78 Count 4 4 4 4 4 4 4 4 4 4 4 4 4
141-03-28 Average 5.73 4.87 5.16 5.87 8.00 14.00 28.33 40.67 53.67 66.67 31.09 8.13 13.50 Std Dev 0.06 0.12 0.13 0.65 1.00 1.00 1.15 1.53 2.52 3.06 2.36 0.82 0.26 Count 3 3 3 3 3 3 3 3 3 3 3 3 3
141-03-28 Average 5.68 4.60 4.88 6.30 8.75 15.00 29.00 41.75 55.50 70.00 32.85 7.23 13.68 Std Dev 0.29 0.32 0.35 0.41 0.96 0.82 1.41 1.26 1.73 1.41 1.73 0.34 0.35 Count 4 4 4 4 4 4 4 4 4 4 4 4 4
0303-60 Average 5.36 4.25 4.50 5.85 8.23 15.31 29.31 43.23 56.92 69.23 32.11 6.84 13.99 Std Dev 0.25 0.26 0.28 0.71 1.17 1.11 2.06 3.11 3.73 3.61 2.12 0.53 1.30 Count 13 13 13 13 13 13 13 13 13 13 13 13 13
D-35

2004 ASPHALT FILM THICKNESS STUDY
Contractor Test Data (Based on Production Data)
State TOTAL ACeff ACeff PERCENTAGE PASSING SIEVE SA AFT Project AC (By Mix) (By Agg) #200 #100 #50 #30 #16 #8 #4 (SF/Lb) (Microns) VMA
86-103-04 Average 6.31 5.56 5.94 5.84 8.88 17.75 34.25 48.50 61.00 73.63 34.58 8.37 16.36 Std Dev 0.17 0.11 0.12 0.31 0.35 0.46 1.39 1.77 2.51 1.92 1.02 0.27 0.51 Count 8 8 8 8 8 8 8 8 8 8 8 8 8
86-134-043 Average 5.86 5.31 5.64 5.73 8.25 17.50 34.13 48.63 61.13 71.63 33.91 8.11 15.44 Std Dev 0.17 0.15 0.16 0.38 0.46 0.53 0.83 1.06 1.46 1.41 0.90 0.32 0.41 Count 8 8 8 8 8 8 8 8 8 8 8 8 8
86-134-043 Average 6.08 5.43 5.78 6.18 9.00 17.75 31.75 45.75 59.50 72.50 34.54 8.14 15.95 Std Dev 0.22 0.22 0.25 0.15 0.00 0.50 1.89 3.30 4.51 5.92 0.90 0.16 0.98 Count 4 4 4 4 4 4 4 4 4 4 4 4 4
86-630-19 Average 5.67 5.03 5.34 5.40 8.00 16.83 32.83 46.17 57.83 68.50 32.46 8.01 15.17 Std Dev 0.16 0.10 0.12 0.27 0.00 0.75 1.33 2.40 3.25 3.67 1.00 0.15 0.74 Count 6 6 6 6 6 6 6 6 6 6 6 6 6
86-630-19 Average 6.02 5.45 5.80 5.92 8.75 17.33 31.08 45.00 59.67 73.08 33.72 8.38 16.18 Std Dev 0.17 0.12 0.14 0.33 0.45 0.89 1.51 2.13 2.96 3.78 1.34 0.30 0.64 Count 12 12 12 12 12 12 12 12 12 12 12 12 12
141-03-28 Average 5.54 4.78 5.06 6.20 7.88 13.63 28.38 41.50 55.13 67.88 31.59 7.83 14.34 Std Dev 0.11 0.17 0.18 0.80 0.64 1.06 1.60 2.88 3.18 3.60 2.13 0.71 0.59 Count 8 8 8 8 8 8 8 8 8 8 8 8 8
141-03-28 Average 5.71 4.76 5.05 6.04 8.09 14.91 30.45 42.09 55.00 69.45 32.21 7.65 14.30 Std Dev 0.27 0.21 0.23 0.60 0.70 1.22 2.21 1.87 1.95 2.02 1.76 0.45 0.54 Count 11 11 11 11 11 11 11 11 11 11 11 11 11
0303-60 Average 5.53 4.47 4.74 4.45 6.63 13.37 27.42 42.89 56.68 70.37 28.06 8.29 14.39 Std Dev 0.22 0.19 0.21 0.78 1.07 1.61 2.76 4.20 3.51 3.29 2.84 0.85 0.84 Count 19 19 19 19 19 19 19 19 19 19 19 19 19
D-36

2004 ASPHALT FILM THICKNESS STUDY
Mn/DOT Test Data (Based on Production Data)
State TOTAL ACeff ACeff PERCENTAGE PASSING SIEVE SA AFT Project AC (By Mix) (By Agg) #200 #100 #50 #30 #16 #8 #4 (SF/Lb) (Microns) VMA
2102-50 Average 6.16 4.90 5.22 5.34 7.40 14.00 29.20 44.20 59.80 73.20 30.66 8.30 15.18 Std Dev 0.18 0.25 0.28 0.44 0.55 1.22 1.79 1.92 2.28 3.56 1.80 0.41 0.37 Count 5 5 5 5 5 5 5 5 5 5 5 5 5
2108-04 Average 5.76 5.09 5.40 5.44 8.39 16.09 30.70 45.87 58.22 69.78 32.25 8.17 15.21 Std Dev 0.19 0.19 0.21 0.39 0.66 1.08 3.34 3.32 3.07 3.34 1.94 0.36 0.53 Count 23 23 23 23 23 23 23 23 23 23 23 23 23
2180-92 Average 5.68 4.71 4.99 7.35 10.38 16.75 26.63 37.19 53.44 70.75 35.27 6.90 14.28 Std Dev 0.18 0.16 0.17 0.38 0.50 0.68 1.50 2.17 2.87 2.77 1.34 0.27 0.36 Count 16 16 16 16 16 16 16 16 16 16 16 16 16
2609-30 Average 6.20 4.93 5.25 5.50 7.57 14.43 28.86 43.86 59.43 73.14 31.06 8.25 14.91 Std Dev 0.23 0.20 0.22 0.37 0.53 1.40 2.04 1.68 1.51 1.86 1.57 0.37 0.52 Count 7 7 7 7 7 7 7 7 7 7 7 7 7
5617-28 Average 5.41 4.43 4.69 5.88 8.42 17.21 33.21 47.32 60.42 72.05 33.91 6.74 14.55 Std Dev 0.18 0.19 0.21 0.42 0.51 1.03 1.58 2.00 2.12 2.76 1.41 0.36 0.51 Count 19 19 19 19 19 19 19 19 19 19 19 19 19
5617-28 Average 6.09 5.01 5.34 5.55 8.00 16.38 32.00 46.13 59.50 70.88 32.56 8.01 14.14 Std Dev 0.34 0.48 0.53 0.58 0.76 1.51 3.12 4.05 3.82 4.02 1.99 0.86 1.30 Count 8 8 8 8 8 8 8 8 8 8 8 8 8
2509-19 Average 5.80 4.43 4.71 4.43 7.00 14.00 29.00 41.00 50.33 62.33 28.09 8.15 13.63 Std Dev 0.26 0.45 0.49 0.21 0.00 0.00 1.00 2.65 3.21 2.31 0.82 0.61 0.35 Count 3 3 3 3 3 3 3 3 3 3 3 3 3
2801-64 Average 5.77 4.50 4.78 5.20 8.33 20.00 38.67 45.33 51.00 62.00 33.64 6.95 14.50 Std Dev 0.47 0.26 0.31 0.75 1.53 2.00 1.53 2.08 2.65 2.65 3.21 0.71 0.62 Count 3 3 3 3 3 3 3 3 3 3 3 3 3
D-37

2004 ASPHALT FILM THICKNESS STUDY Contractor Test Data (Based on Production Data)
State TOTAL ACeff ACeff PERCENTAGE PASSING SIEVE SA AFT Project AC (By Mix) (By Agg) #200 #100 #50 #30 #16 #8 #4 (SF/Lb) (Microns) VMA
2102-50 Average 6.13 4.87 5.19 4.23 6.17 12.83 26.83 42.83 57.67 71.67 27.25 9.28 15.02 Std Dev 0.23 0.30 0.33 0.25 0.41 0.41 1.47 1.72 3.01 3.39 0.77 0.69 0.46 Count 6 6 6 6 6 6 6 6 6 6 6 6 6
2108-04 Average 5.79 5.18 5.49 4.70 7.13 14.53 28.82 44.03 56.68 69.95 29.38 9.14 15.62 Std Dev 0.08 0.09 0.10 0.44 0.66 0.98 1.56 1.94 2.24 2.16 1.72 0.53 0.26 Count 38 38 38 38 38 38 38 38 38 38 38 38 38
2180-92 Average 5.45 4.63 4.89 6.24 9.05 15.21 24.42 35.95 51.79 72.53 31.79 7.50 14.29 Std Dev 0.20 0.17 0.19 0.26 0.40 0.79 1.57 2.37 3.10 3.29 1.07 0.37 0.30 Count 19 19 19 19 19 19 19 19 19 19 19 19 19
2609-30 Average 6.00 4.91 5.22 4.71 6.82 13.27 26.27 42.36 57.55 72.36 28.42 8.96 14.95 Std Dev 0.13 0.22 0.24 0.36 0.60 0.90 1.19 1.29 1.81 2.01 1.35 0.47 0.40 Count 11 11 11 11 11 11 11 11 11 11 11 11 11
5617-28 Average 5.55 4.56 4.82 5.13 7.70 16.13 31.65 46.78 59.30 72.48 31.65 7.44 14.60 Std Dev 0.13 0.15 0.16 0.54 0.70 0.97 1.43 1.65 1.55 1.81 1.54 0.45 0.37 Count 23 23 23 23 23 23 23 23 23 23 23 23 23
5617-28 Average 6.13 5.09 5.42 5.02 7.56 15.67 31.00 46.11 60.56 72.11 31.16 8.51 14.86 Std Dev 0.29 0.40 0.44 0.77 1.51 1.50 2.06 2.52 3.43 2.80 2.16 0.91 0.98 Count 9 9 9 9 9 9 9 9 9 9 9 9 9
2509-19 Average 5.70 4.61 4.89 4.77 7.10 14.70 31.00 44.00 54.30 66.80 29.67 8.03 14.11 Std Dev 0.25 0.28 0.31 0.26 0.32 0.67 2.00 2.75 3.56 3.99 1.36 0.50 0.61 Count 10 10 10 10 10 10 10 10 10 10 10 10 10
2801-64 Average 5.71 4.75 5.04 4.86 7.60 18.30 37.80 44.70 50.40 61.70 31.94 7.72 14.37 Std Dev 0.13 0.15 0.17 0.85 1.07 1.42 1.14 1.34 1.43 1.57 2.69 0.61 0.34 Count 10 10 10 10 10 10 10 10 10 10 10 10 10
D-38
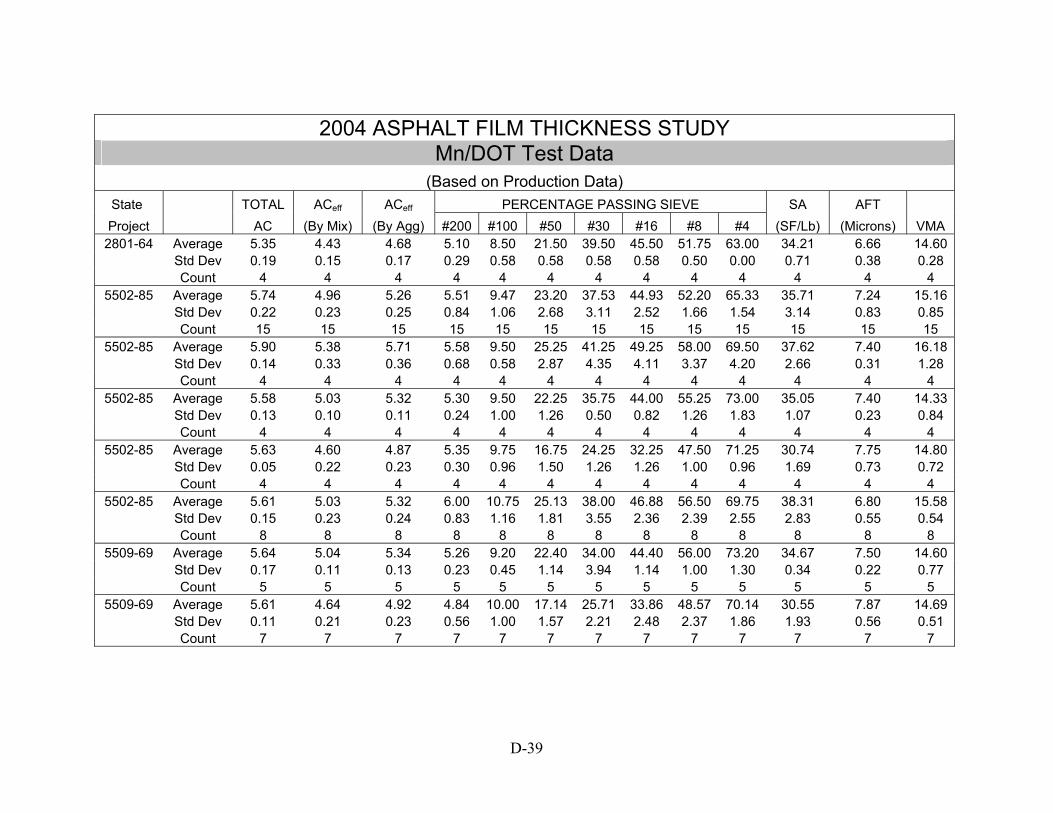
2004 ASPHALT FILM THICKNESS STUDY
Mn/DOT Test Data (Based on Production Data)
State TOTAL ACeff ACeff PERCENTAGE PASSING SIEVE SA AFT Project AC (By Mix) (By Agg) #200 #100 #50 #30 #16 #8 #4 (SF/Lb) (Microns) VMA
2801-64 Average 5.35 4.43 4.68 5.10 8.50 21.50 39.50 45.50 51.75 63.00 34.21 6.66 14.60 Std Dev 0.19 0.15 0.17 0.29 0.58 0.58 0.58 0.58 0.50 0.00 0.71 0.38 0.28 Count 4 4 4 4 4 4 4 4 4 4 4 4 4
5502-85 Average 5.74 4.96 5.26 5.51 9.47 23.20 37.53 44.93 52.20 65.33 35.71 7.24 15.16 Std Dev 0.22 0.23 0.25 0.84 1.06 2.68 3.11 2.52 1.66 1.54 3.14 0.83 0.85 Count 15 15 15 15 15 15 15 15 15 15 15 15 15
5502-85 Average 5.90 5.38 5.71 5.58 9.50 25.25 41.25 49.25 58.00 69.50 37.62 7.40 16.18 Std Dev 0.14 0.33 0.36 0.68 0.58 2.87 4.35 4.11 3.37 4.20 2.66 0.31 1.28 Count 4 4 4 4 4 4 4 4 4 4 4 4 4
5502-85 Average 5.58 5.03 5.32 5.30 9.50 22.25 35.75 44.00 55.25 73.00 35.05 7.40 14.33 Std Dev 0.13 0.10 0.11 0.24 1.00 1.26 0.50 0.82 1.26 1.83 1.07 0.23 0.84 Count 4 4 4 4 4 4 4 4 4 4 4 4 4
5502-85 Average 5.63 4.60 4.87 5.35 9.75 16.75 24.25 32.25 47.50 71.25 30.74 7.75 14.80 Std Dev 0.05 0.22 0.23 0.30 0.96 1.50 1.26 1.26 1.00 0.96 1.69 0.73 0.72 Count 4 4 4 4 4 4 4 4 4 4 4 4 4
5502-85 Average 5.61 5.03 5.32 6.00 10.75 25.13 38.00 46.88 56.50 69.75 38.31 6.80 15.58 Std Dev 0.15 0.23 0.24 0.83 1.16 1.81 3.55 2.36 2.39 2.55 2.83 0.55 0.54 Count 8 8 8 8 8 8 8 8 8 8 8 8 8
5509-69 Average 5.64 5.04 5.34 5.26 9.20 22.40 34.00 44.40 56.00 73.20 34.67 7.50 14.60 Std Dev 0.17 0.11 0.13 0.23 0.45 1.14 3.94 1.14 1.00 1.30 0.34 0.22 0.77 Count 5 5 5 5 5 5 5 5 5 5 5 5 5
5509-69 Average 5.61 4.64 4.92 4.84 10.00 17.14 25.71 33.86 48.57 70.14 30.55 7.87 14.69 Std Dev 0.11 0.21 0.23 0.56 1.00 1.57 2.21 2.48 2.37 1.86 1.93 0.56 0.51 Count 7 7 7 7 7 7 7 7 7 7 7 7 7
D-39
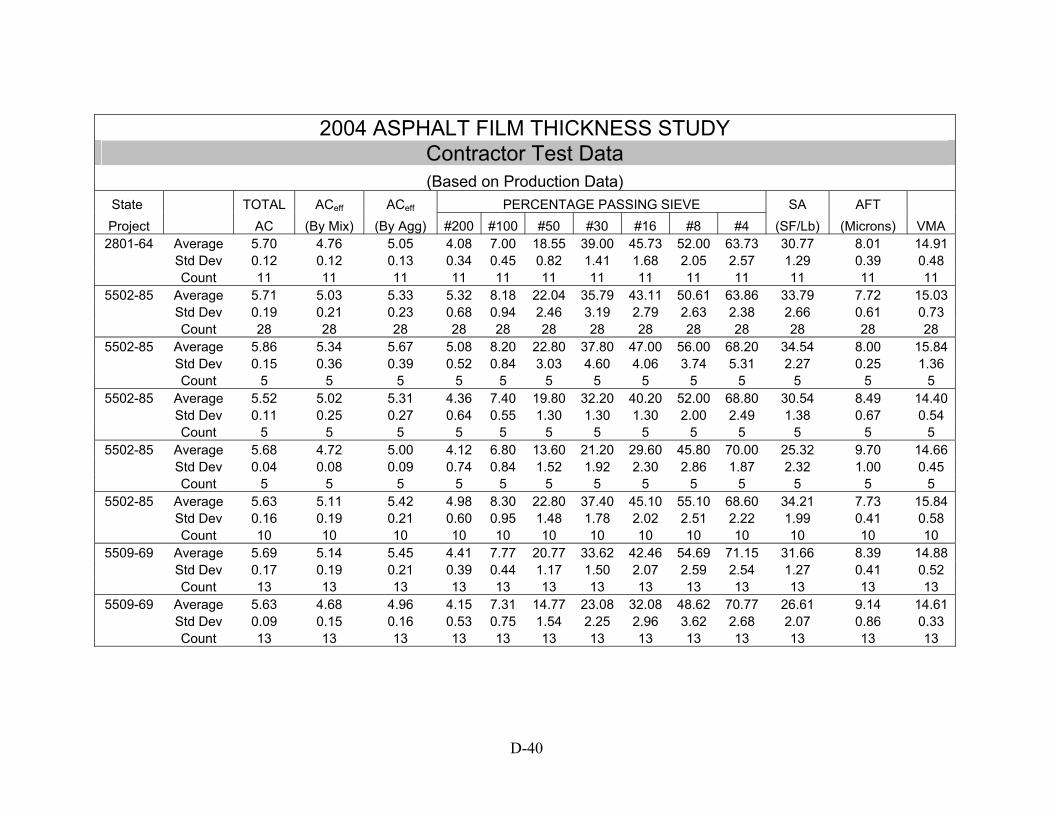
2004 ASPHALT FILM THICKNESS STUDY
Contractor Test Data (Based on Production Data)
State TOTAL ACeff ACeff PERCENTAGE PASSING SIEVE SA AFT Project AC (By Mix) (By Agg) #200 #100 #50 #30 #16 #8 #4 (SF/Lb) (Microns) VMA
2801-64 Average 5.70 4.76 5.05 4.08 7.00 18.55 39.00 45.73 52.00 63.73 30.77 8.01 14.91 Std Dev 0.12 0.12 0.13 0.34 0.45 0.82 1.41 1.68 2.05 2.57 1.29 0.39 0.48 Count 11 11 11 11 11 11 11 11 11 11 11 11 11
5502-85 Average 5.71 5.03 5.33 5.32 8.18 22.04 35.79 43.11 50.61 63.86 33.79 7.72 15.03 Std Dev 0.19 0.21 0.23 0.68 0.94 2.46 3.19 2.79 2.63 2.38 2.66 0.61 0.73 Count 28 28 28 28 28 28 28 28 28 28 28 28 28
5502-85 Average 5.86 5.34 5.67 5.08 8.20 22.80 37.80 47.00 56.00 68.20 34.54 8.00 15.84 Std Dev 0.15 0.36 0.39 0.52 0.84 3.03 4.60 4.06 3.74 5.31 2.27 0.25 1.36 Count 5 5 5 5 5 5 5 5 5 5 5 5 5
5502-85 Average 5.52 5.02 5.31 4.36 7.40 19.80 32.20 40.20 52.00 68.80 30.54 8.49 14.40 Std Dev 0.11 0.25 0.27 0.64 0.55 1.30 1.30 1.30 2.00 2.49 1.38 0.67 0.54 Count 5 5 5 5 5 5 5 5 5 5 5 5 5
5502-85 Average 5.68 4.72 5.00 4.12 6.80 13.60 21.20 29.60 45.80 70.00 25.32 9.70 14.66 Std Dev 0.04 0.08 0.09 0.74 0.84 1.52 1.92 2.30 2.86 1.87 2.32 1.00 0.45 Count 5 5 5 5 5 5 5 5 5 5 5 5 5
5502-85 Average 5.63 5.11 5.42 4.98 8.30 22.80 37.40 45.10 55.10 68.60 34.21 7.73 15.84 Std Dev 0.16 0.19 0.21 0.60 0.95 1.48 1.78 2.02 2.51 2.22 1.99 0.41 0.58 Count 10 10 10 10 10 10 10 10 10 10 10 10 10
5509-69 Average 5.69 5.14 5.45 4.41 7.77 20.77 33.62 42.46 54.69 71.15 31.66 8.39 14.88 Std Dev 0.17 0.19 0.21 0.39 0.44 1.17 1.50 2.07 2.59 2.54 1.27 0.41 0.52 Count 13 13 13 13 13 13 13 13 13 13 13 13 13
5509-69 Average 5.63 4.68 4.96 4.15 7.31 14.77 23.08 32.08 48.62 70.77 26.61 9.14 14.61 Std Dev 0.09 0.15 0.16 0.53 0.75 1.54 2.25 2.96 3.62 2.68 2.07 0.86 0.33 Count 13 13 13 13 13 13 13 13 13 13 13 13 13
D-40
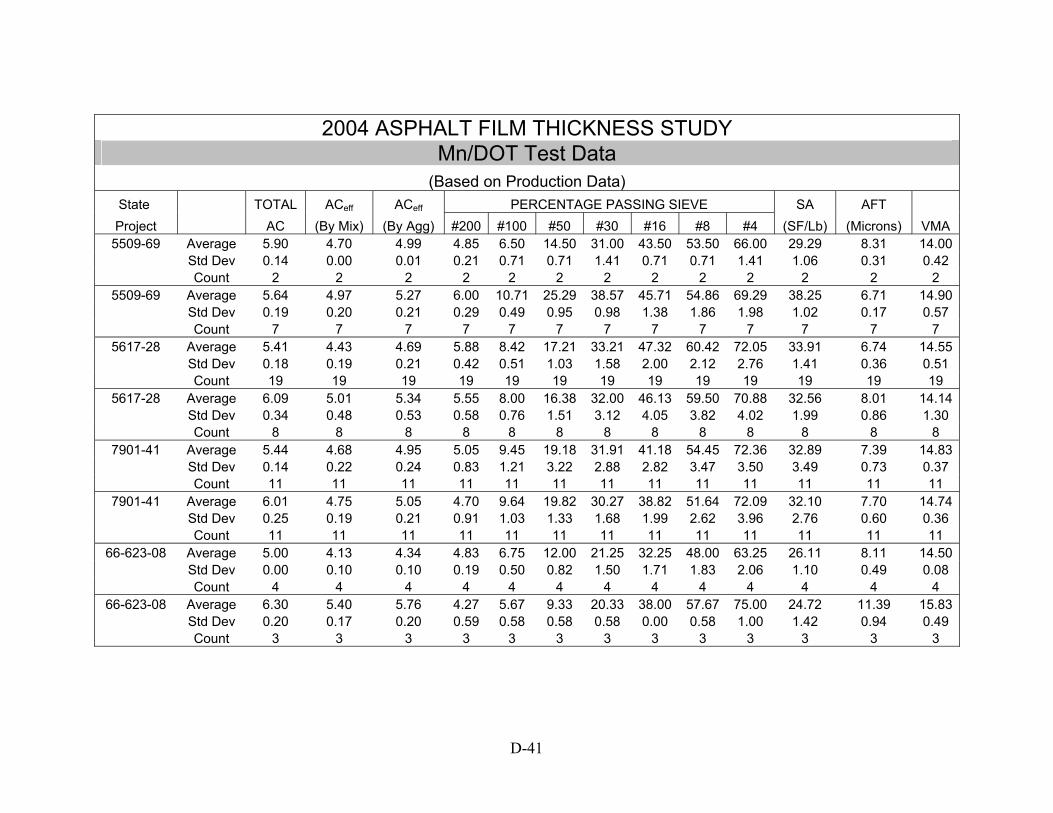
2004 ASPHALT FILM THICKNESS STUDY
Mn/DOT Test Data (Based on Production Data)
State TOTAL ACeff ACeff PERCENTAGE PASSING SIEVE SA AFT Project AC (By Mix) (By Agg) #200 #100 #50 #30 #16 #8 #4 (SF/Lb) (Microns) VMA
5509-69 Average 5.90 4.70 4.99 4.85 6.50 14.50 31.00 43.50 53.50 66.00 29.29 8.31 14.00 Std Dev 0.14 0.00 0.01 0.21 0.71 0.71 1.41 0.71 0.71 1.41 1.06 0.31 0.42 Count 2 2 2 2 2 2 2 2 2 2 2 2 2
5509-69 Average 5.64 4.97 5.27 6.00 10.71 25.29 38.57 45.71 54.86 69.29 38.25 6.71 14.90 Std Dev 0.19 0.20 0.21 0.29 0.49 0.95 0.98 1.38 1.86 1.98 1.02 0.17 0.57 Count 7 7 7 7 7 7 7 7 7 7 7 7 7
5617-28 Average 5.41 4.43 4.69 5.88 8.42 17.21 33.21 47.32 60.42 72.05 33.91 6.74 14.55 Std Dev 0.18 0.19 0.21 0.42 0.51 1.03 1.58 2.00 2.12 2.76 1.41 0.36 0.51 Count 19 19 19 19 19 19 19 19 19 19 19 19 19
5617-28 Average 6.09 5.01 5.34 5.55 8.00 16.38 32.00 46.13 59.50 70.88 32.56 8.01 14.14 Std Dev 0.34 0.48 0.53 0.58 0.76 1.51 3.12 4.05 3.82 4.02 1.99 0.86 1.30 Count 8 8 8 8 8 8 8 8 8 8 8 8 8
7901-41 Average 5.44 4.68 4.95 5.05 9.45 19.18 31.91 41.18 54.45 72.36 32.89 7.39 14.83 Std Dev 0.14 0.22 0.24 0.83 1.21 3.22 2.88 2.82 3.47 3.50 3.49 0.73 0.37 Count 11 11 11 11 11 11 11 11 11 11 11 11 11
7901-41 Average 6.01 4.75 5.05 4.70 9.64 19.82 30.27 38.82 51.64 72.09 32.10 7.70 14.74 Std Dev 0.25 0.19 0.21 0.91 1.03 1.33 1.68 1.99 2.62 3.96 2.76 0.60 0.36 Count 11 11 11 11 11 11 11 11 11 11 11 11 11
66-623-08 Average 5.00 4.13 4.34 4.83 6.75 12.00 21.25 32.25 48.00 63.25 26.11 8.11 14.50 Std Dev 0.00 0.10 0.10 0.19 0.50 0.82 1.50 1.71 1.83 2.06 1.10 0.49 0.08 Count 4 4 4 4 4 4 4 4 4 4 4 4 4
66-623-08 Average 6.30 5.40 5.76 4.27 5.67 9.33 20.33 38.00 57.67 75.00 24.72 11.39 15.83 Std Dev 0.20 0.17 0.20 0.59 0.58 0.58 0.58 0.00 0.58 1.00 1.42 0.94 0.49 Count 3 3 3 3 3 3 3 3 3 3 3 3 3
D-41

2004 ASPHALT FILM THICKNESS STUDY
Contractor Test Data (Based on Production Data)
State TOTAL ACeff ACeff PERCENTAGE PASSING SIEVE SA AFT Project AC (By Mix) (By Agg) #200 #100 #50 #30 #16 #8 #4 (SF/Lb) (Microns) VMA
5509-69 Average 6.00 4.87 5.18 4.39 6.14 13.86 30.43 43.00 53.29 66.00 28.01 9.02 14.54 Std Dev 0.32 0.14 0.16 0.49 0.69 0.69 0.98 1.83 2.21 2.38 1.33 0.29 0.55 Count 7 7 7 7 7 7 7 7 7 7 7 7 7
5509-69 Average 5.69 5.13 5.44 5.02 8.47 23.07 36.87 45.20 54.33 67.93 34.34 7.74 15.56 Std Dev 0.07 0.17 0.18 0.49 0.64 1.49 1.25 1.42 1.45 2.94 1.80 0.45 0.25 Count 15 15 15 15 15 15 15 15 15 15 15 15 15
5617-28 Average 5.55 4.56 4.82 5.13 7.70 16.13 31.65 46.78 59.30 72.48 31.65 7.44 14.60 Std Dev 0.13 0.15 0.16 0.54 0.70 0.97 1.43 1.65 1.55 1.81 1.54 0.45 0.37 Count 23 23 23 23 23 23 23 23 23 23 23 23 23
5617-28 Average 6.13 5.09 5.42 5.02 7.56 15.67 31.00 46.11 60.56 72.11 31.16 8.51 14.86 Std Dev 0.29 0.40 0.44 0.77 1.51 1.50 2.06 2.52 3.43 2.80 2.16 0.91 0.98 Count 9 9 9 9 9 9 9 9 9 9 9 9 9
7901-41 Average 5.47 4.71 4.99 4.27 7.50 16.94 29.81 39.81 52.88 71.75 29.32 8.33 14.83 Std Dev 0.12 0.17 0.18 0.87 0.89 1.57 1.60 2.14 2.68 3.02 2.59 0.70 0.37 Count 16 16 16 16 16 16 16 16 16 16 16 16 16
7901-41 Average 5.99 4.69 4.99 3.85 7.33 17.00 28.47 37.63 50.73 72.73 28.13 8.72 14.66 Std Dev 0.39 0.28 0.32 0.79 1.09 1.51 1.87 2.03 2.60 3.73 2.73 0.94 0.57 Count 30 30 30 30 30 30 30 30 30 30 30 30 30
66-623-08 Average 5.03 4.27 4.50 4.85 6.45 11.36 19.91 32.91 48.18 63.73 25.66 8.57 14.15 Std Dev 0.09 0.18 0.20 0.37 0.52 0.81 1.45 1.70 2.23 2.69 1.33 0.69 0.28 Count 11 11 11 11 11 11 11 11 11 11 11 11 11
66-623-08 Average 6.27 5.41 5.77 3.72 4.84 9.53 20.32 38.74 57.89 74.05 23.45 12.02 15.94 Std Dev 0.21 0.18 0.20 0.37 0.50 0.96 1.73 1.66 2.31 2.50 1.10 0.74 0.52 Count 19 19 19 19 19 19 19 19 19 19 19 19 19
D-42

2004 ASPHALT FILM THICKNESS STUDY
Mn/DOT Test Data (Based on Production Data)
State TOTAL ACeff ACeff PERCENTAGE PASSING SIEVE SA AFT Project AC (By Mix) (By Agg) #200 #100 #50 #30 #16 #8 #4 (SF/Lb) (Microns) VMA
Dodge Co. Average 5.67 5.10 5.41 5.83 9.67 24.00 38.67 47.00 56.33 71.33 37.19 7.09 14.73 Std Dev 0.06 0.20 0.21 0.40 0.58 1.00 1.53 2.00 2.08 2.52 1.67 0.41 0.15 Count 3 3 3 3 3 3 3 3 3 3 3 3 3
Dodge Co. Average 6.00 5.30 5.64 6.00 10.50 26.00 43.00 51.50 58.50 71.00 39.60 6.94 15.50 Std Dev 0.14 0.14 0.14 0.14 0.71 1.41 0.00 0.71 2.12 1.41 0.91 0.33 0.42 Count 2 2 2 2 2 2 2 2 2 2 2 2 2
Fillmore Co. Average 5.85 5.10 5.42 2.50 5.00 18.00 36.00 45.50 52.50 64.00 26.46 9.99 16.25 Std Dev 0.07 0.00 0.00 0.57 0.00 0.00 1.41 3.54 2.12 0.00 1.47 0.56 0.49 Count 2 2 2 2 2 2 2 2 2 2 2 2 2
Goodhue Co. Average 5.25 4.50 4.75 4.60 7.50 12.50 21.50 32.00 47.50 67.00 26.42 8.75 14.55 Std Dev 0.07 0.00 0.00 0.57 0.71 0.71 0.71 1.41 0.71 0.00 0.03 0.00 0.07 Count 2 2 2 2 2 2 2 2 2 2 2 2 2
Goodhue Co. Average 5.58 4.93 5.22 5.14 8.13 14.63 25.50 37.50 53.38 71.88 29.63 8.61 14.93 Std Dev 0.26 0.28 0.31 0.68 0.83 0.74 1.31 1.93 2.72 3.27 1.92 0.79 0.55 Count 8 8 8 8 8 8 8 8 8 8 8 8 8
Goodhue Co. Average 5.33 4.67 4.93 4.37 7.00 15.33 29.67 41.67 53.33 67.00 28.75 8.35 14.47 Std Dev 0.12 0.12 0.13 0.31 0.00 0.58 1.15 1.15 1.53 2.65 0.33 0.19 0.35 Count 3 3 3 3 3 3 3 3 3 3 3 3 3
Houston Co. Average 5.78 4.63 4.92 3.58 7.00 20.83 32.83 37.67 46.17 70.17 29.04 8.37 13.70 Std Dev 0.15 0.16 0.18 0.93 1.41 2.56 2.64 2.88 2.71 1.83 3.30 1.33 0.42 Count 6 6 6 6 6 6 6 6 6 6 6 6 6
Houston Co. Average 5.60 4.37 4.63 4.23 7.43 19.71 30.00 33.29 39.71 58.00 28.75 7.99 12.46 Std Dev 0.32 0.30 0.33 1.11 1.40 3.20 3.37 2.75 2.50 2.00 4.21 1.35 0.51 Count 7 7 7 7 7 7 7 7 7 7 7 7 7
D-43

2004 ASPHALT FILM THICKNESS STUDY
Contractor Test Data (Based on Production Data)
State TOTAL ACeff ACeff PERCENTAGE PASSING SIEVE SA AFT Project AC (By Mix) (By Agg) #200 #100 #50 #30 #16 #8 #4 (SF/Lb) (Microns) VMA
Dodge Co. Average 5.71 5.14 5.45 4.80 7.91 22.00 36.64 45.55 55.00 71.45 33.43 7.95 15.65 Std Dev 0.05 0.09 0.10 0.49 0.54 1.41 1.43 1.51 3.22 1.37 1.76 0.39 0.22 Count 11 11 11 11 11 11 11 11 11 11 11 11 11
Dodge Co. Average 5.90 5.33 5.66 5.17 8.43 25.29 42.71 51.71 59.29 71.29 36.83 7.50 15.80 Std Dev 0.12 0.13 0.14 0.35 0.79 1.70 0.95 1.38 2.06 1.70 1.45 0.39 0.52 Count 7 7 7 7 7 7 7 7 7 7 7 7 7
Fillmore Co. Average 5.83 5.20 5.52 3.48 5.25 17.75 34.00 44.00 51.00 63.25 27.62 9.74 15.90 Std Dev 0.15 0.23 0.25 0.26 0.50 0.50 1.41 2.00 2.00 1.89 0.51 0.48 0.47 Count 4 4 4 4 4 4 4 4 4 4 4 4 4
Goodhue Co. Average 5.26 4.67 4.93 4.52 6.15 10.92 19.23 30.85 46.54 67.92 24.59 9.85 14.67 Std Dev 0.09 0.12 0.13 0.63 0.99 1.44 2.24 2.58 3.15 3.66 2.43 1.01 0.44 Count 13 13 13 13 13 13 13 13 13 13 13 13 13
Goodhue Co. Average 5.53 4.93 5.22 4.49 6.63 13.63 24.11 36.42 52.26 72.11 27.07 9.47 15.21 Std Dev 0.19 0.29 0.31 0.76 1.07 1.16 1.70 2.61 2.75 2.98 2.51 1.11 0.69 Count 19 19 19 19 19 19 19 19 19 19 19 19 19
Goodhue Co. Average 5.52 4.68 4.95 4.01 6.33 14.56 29.11 41.67 53.11 67.00 27.46 8.79 14.37 Std Dev 0.32 0.26 0.29 0.25 0.50 0.73 1.17 1.00 1.27 1.50 0.66 0.61 0.37 Count 9 9 9 9 9 9 9 9 9 9 9 9 9
Houston Co. Average 5.85 4.85 5.15 2.91 5.29 18.86 31.14 35.71 44.64 68.93 25.87 9.79 14.93 Std Dev 0.11 0.18 0.19 0.51 0.99 1.75 2.57 2.87 3.05 3.27 2.38 1.17 0.42 Count 14 14 14 14 14 14 14 14 14 14 14 14 14
Houston Co. Average 5.52 4.54 4.80 3.28 5.89 17.74 28.11 31.63 39.05 57.68 25.29 9.37 13.44 Std Dev 0.28 0.22 0.25 0.63 1.05 2.56 2.62 2.81 3.08 3.09 2.75 1.23 0.47 Count 19 19 19 19 19 19 19 19 19 19 19 19 19
D-44

2004 ASPHALT FILM THICKNESS STUDY
Mn/DOT Test Data (Based on Production Data)
State TOTAL ACeff ACeff PERCENTAGE PASSING SIEVE SA AFT Project AC (By Mix) (By Agg) #200 #100 #50 #30 #16 #8 #4 (SF/Lb) (Microns) VMA
Winona Co. Average 5.53 4.47 4.73 3.77 6.00 12.67 31.00 42.33 49.67 63.00 26.40 8.73 13.53 Std Dev 0.06 0.12 0.12 0.06 0.00 0.58 2.65 3.79 3.21 1.00 1.08 0.30 0.72 Count 3 3 3 3 3 3 3 3 3 3 3 3 3
Winona Co. Average 6.00 4.98 5.30 4.52 7.20 12.00 35.00 49.60 54.80 65.80 29.53 8.76 15.44 Std Dev 0.25 0.28 0.31 0.78 1.10 1.00 2.24 3.21 4.76 4.21 2.36 0.56 0.83 Count 5 5 5 5 5 5 5 5 5 5 5 5 5
0804-73 Average 5.87 5.03 5.34 5.39 8.57 18.00 35.00 44.29 50.00 56.14 32.73 7.96 14.57 Std Dev 0.36 0.23 0.26 0.64 0.98 0.58 1.91 2.21 3.27 4.02 2.26 0.27 0.45 Count 7 7 7 7 7 7 7 7 7 7 7 7 7
0804-73 Average 5.75 5.22 5.54 6.15 9.17 19.50 35.83 47.50 54.67 61.50 35.42 7.63 15.55 Std Dev 0.24 0.22 0.25 0.48 0.98 1.38 2.14 2.43 2.34 5.47 2.31 0.45 0.53 Count 6 6 6 6 6 6 6 6 6 6 6 6 6
0804-73 Average 6.00 5.23 5.57 5.40 8.67 17.67 33.00 42.67 48.00 55.00 32.19 8.43 14.30 Std Dev 0.26 0.15 0.18 0.75 0.58 0.58 1.00 0.58 1.00 1.00 1.50 0.23 0.66 Count 3 3 3 3 3 3 3 3 3 3 3 3 3
0804-73 Average 5.88 5.26 5.58 6.02 8.78 18.44 34.11 45.78 53.22 62.33 34.25 7.95 14.70 Std Dev 0.19 0.15 0.17 0.29 0.44 0.73 1.69 1.09 1.56 2.00 1.10 0.40 0.47 Count 9 9 9 9 9 9 9 9 9 9 9 9 9
3280-107 Average 5.43 4.97 5.25 4.82 6.83 11.50 17.50 23.33 30.50 48.50 23.76 10.77 14.88 Std Dev 0.20 0.16 0.18 0.23 0.41 0.55 0.55 0.52 1.22 1.64 0.80 0.52 0.55 Count 6 6 6 6 6 6 6 6 6 6 6 6 6
4604-29 Average 6.25 5.35 5.71 5.20 8.00 17.00 32.50 44.00 52.00 61.50 31.60 8.80 16.10 Std Dev 0.21 0.21 0.24 0.28 0.00 1.41 0.71 1.41 1.41 2.12 0.76 0.58 0.28 Count 2 2 2 2 2 2 2 2 2 2 2 2 2
D-45

2004 ASPHALT FILM THICKNESS STUDY
Contractor Test Data (Based on Production Data)
State TOTAL ACeff ACeff PERCENTAGE PASSING SIEVE SA AFT Project AC (By Mix) (By Agg) #200 #100 #50 #30 #16 #8 #4 (SF/Lb) (Microns) VMA
Winona Co. Average 5.89 4.61 4.90 3.37 5.00 11.29 30.43 41.43 49.14 63.00 24.58 9.74 14.07 Std Dev 0.23 0.23 0.25 0.66 1.00 0.76 1.90 2.64 2.27 2.38 1.65 0.61 0.60 Count 7 7 7 7 7 7 7 7 7 7 7 7 7
Winona Co. Average 5.85 5.11 5.43 3.93 5.91 10.18 34.27 47.64 53.09 64.55 26.91 9.87 15.36 Std Dev 0.09 0.18 0.19 0.55 0.83 0.98 1.74 2.54 2.84 2.50 1.99 0.77 0.56 Count 11 11 11 11 11 11 11 11 11 11 11 11 11
0804-73 Average 5.88 5.00 5.31 4.34 7.33 16.67 35.22 45.22 51.67 58.67 30.14 8.61 14.97 Std Dev 0.15 0.22 0.24 0.63 0.71 1.12 2.54 2.73 3.12 3.61 2.21 0.50 0.47 Count 9 9 9 9 9 9 9 9 9 9 9 9 9
0804-73 Average 5.66 5.15 5.46 6.02 9.40 19.00 36.10 48.20 55.90 64.40 35.41 7.51 15.43 Std Dev 0.22 0.18 0.20 0.23 0.52 0.94 2.08 2.39 2.51 2.55 1.43 0.24 0.49 Count 10 10 10 10 10 10 10 10 10 10 10 10 10
0804-73 Average 6.27 4.93 5.26 4.43 7.17 15.50 32.00 42.00 48.00 54.33 28.89 8.94 14.53 Std Dev 0.10 0.22 0.23 0.98 1.17 1.05 1.79 2.10 2.37 2.66 2.76 0.91 0.45 Count 6 6 6 6 6 6 6 6 6 6 6 6 6
0804-73 Average 5.60 5.16 5.47 6.03 9.00 18.20 34.75 46.75 54.55 64.45 34.58 7.71 14.81 Std Dev 0.18 0.17 0.19 0.45 0.65 1.01 1.37 1.71 1.99 2.63 1.54 0.38 0.41 Count 20 20 20 20 20 20 20 20 20 20 20 20 20
3280-107 Average 5.29 4.94 5.22 4.84 6.80 11.20 17.50 23.10 30.60 49.40 23.69 10.74 14.87 Std Dev 0.26 0.19 0.21 0.30 0.42 0.42 0.53 0.57 0.52 1.17 0.82 0.73 0.49 Count 10 10 10 10 10 10 10 10 10 10 10 10 10
4604-29 Average 5.71 5.17 5.48 5.82 8.67 17.89 34.56 47.11 55.33 65.33 34.01 7.85 15.53 Std Dev 0.20 0.14 0.16 0.37 0.71 1.05 1.42 1.36 1.32 1.73 1.41 0.26 0.36 Count 9 9 9 9 9 9 9 9 9 9 9 9 9
D-46

2004 ASPHALT FILM THICKNESS STUDY
Mn/DOT Test Data (Based on Production Data)
State TOTAL ACeff ACeff PERCENTAGE PASSING SIEVE SA AFT Project AC (By Mix) (By Agg) #200 #100 #50 #30 #16 #8 #4 (SF/Lb) (Microns) VMA
5202-44 Average 6.23 5.63 6.00 6.43 9.75 19.50 35.25 46.50 55.50 66.50 36.19 8.08 15.98 Std Dev 0.15 0.05 0.06 0.21 0.50 0.58 0.50 0.58 0.58 0.58 0.70 0.18 0.40 Count 4 4 4 4 4 4 4 4 4 4 4 4 4
5202-44 Average 5.66 5.08 5.38 5.95 9.14 18.79 34.57 46.14 54.57 64.36 34.64 7.58 15.09 Std Dev 0.16 0.14 0.15 0.33 0.53 0.97 1.45 1.66 1.91 2.13 1.43 0.26 0.34 Count 14 14 14 14 14 14 14 14 14 14 14 14 14
5212-24 Average 5.93 4.85 5.16 5.65 8.75 21.00 35.25 49.00 62.75 74.25 35.44 7.12 15.58 Std Dev 0.19 0.25 0.28 0.51 0.96 1.41 2.22 2.58 3.10 3.59 2.49 0.80 0.68 Count 4 4 4 4 4 4 4 4 4 4 4 4 4
5212-24 Average 5.57 4.70 4.98 5.25 9.17 19.33 30.00 41.33 55.33 66.83 32.76 7.40 14.25 Std Dev 0.27 0.28 0.31 0.23 0.75 1.03 1.26 1.75 1.75 2.93 1.44 0.40 0.38 Count 6 6 6 6 6 6 6 6 6 6 6 6 6
5380-88 Average 5.54 5.04 5.34 5.33 10.00 25.00 36.86 45.86 55.71 64.57 36.37 7.17 15.43 Std Dev 0.18 0.19 0.21 0.38 0.82 2.38 2.61 3.24 3.25 3.91 2.52 0.37 0.57 Count 7 7 7 7 7 7 7 7 7 7 7 7 7
8301-24 Average 6.10 5.30 5.64 5.66 8.40 17.80 33.00 44.40 52.40 62.20 32.95 8.35 15.60 Std Dev 0.20 0.17 0.20 0.15 0.55 0.84 1.22 2.07 2.41 2.95 1.07 0.38 0.63 Count 5 5 5 5 5 5 5 5 5 5 5 5 5
8304-28 Average 6.16 5.58 5.94 6.63 9.88 19.13 34.00 46.13 54.50 64.50 36.18 8.01 15.61 Std Dev 0.26 0.18 0.21 0.45 0.64 0.64 1.20 1.55 1.85 2.45 1.41 0.49 0.45 Count 8 8 8 8 8 8 8 8 8 8 8 8 8
8304-28 Average 5.83 5.22 5.54 5.88 9.00 18.33 34.67 46.33 54.83 65.33 34.37 7.86 15.40 Std Dev 0.33 0.31 0.34 0.54 0.89 1.21 2.07 2.80 3.37 4.03 2.34 0.35 0.68 Count 6 6 6 6 6 6 6 6 6 6 6 6 6
D-47

2004 ASPHALT FILM THICKNESS STUDY Contractor Test Data (Based on Production Data)
State TOTAL ACeff ACeff PERCENTAGE PASSING SIEVE SA AFT Project AC (By Mix) (By Agg) #200 #100 #50 #30 #16 #8 #4 (SF/Lb) (Microns) VMA
5202-44 Average 5.88 5.50 5.84 6.20 9.50 18.67 34.33 46.67 55.33 66.00 35.29 8.07 15.83 Std Dev 0.18 0.11 0.13 0.18 0.55 0.52 0.52 0.82 1.03 0.89 0.63 0.22 0.38 Count 6 6 6 6 6 6 6 6 6 6 6 6 6
5202-44 Average 5.50 5.08 5.37 5.89 9.06 18.06 34.25 46.25 54.66 64.88 34.26 7.66 15.29 Std Dev 0.14 0.14 0.15 0.49 0.72 1.22 1.68 1.87 2.13 2.12 1.93 0.44 0.39 Count 32 32 32 32 32 32 32 32 32 32 32 32 32
5212-24 Average 5.79 4.80 5.10 5.89 9.56 21.44 34.56 47.22 59.78 70.67 36.01 6.91 15.12 Std Dev 0.20 0.21 0.23 0.31 0.53 1.24 2.65 3.99 5.24 5.57 1.93 0.45 0.87 Count 9 9 9 9 9 9 9 9 9 9 9 9 9
5212-24 Average 5.19 4.45 4.70 5.56 10.50 20.47 31.47 42.60 55.63 66.40 34.71 6.61 14.33 Std Dev 0.15 0.19 0.20 0.45 0.94 1.17 1.63 2.13 2.80 2.95 1.88 0.43 0.52 Count 30 30 30 30 30 30 30 30 30 30 30 30 30
5380-88 Average 5.66 5.09 5.40 6.07 11.00 24.29 36.14 44.50 55.14 63.71 37.70 7.03 15.36 Std Dev 0.14 0.13 0.15 0.45 1.71 2.79 3.18 2.98 3.11 3.36 3.29 0.67 0.57 Count 14 14 14 14 14 14 14 14 14 14 14 14 14
8301-24 Average 5.60 5.03 5.33 5.69 8.81 17.69 33.75 46.25 54.75 64.94 33.62 7.73 15.40 Std Dev 0.19 0.19 0.21 0.26 0.40 0.95 1.69 1.95 2.29 2.14 1.28 0.30 0.43 Count 16 16 16 16 16 16 16 16 16 16 16 16 16
8304-28 Average 5.93 5.53 5.87 6.28 9.67 18.33 33.67 46.00 54.58 64.67 35.21 8.13 15.67 Std Dev 0.21 0.22 0.25 0.34 0.49 0.78 1.44 1.65 1.93 1.92 1.21 0.46 0.48 Count 12 12 12 12 12 12 12 12 12 12 12 12 12
8304-28 Average 5.69 5.15 5.46 5.55 8.54 17.54 33.85 46.15 54.54 64.85 33.18 8.02 15.45 Std Dev 0.35 0.26 0.30 0.54 0.78 1.05 1.41 2.23 2.60 2.91 1.90 0.46 0.72 Count 13 13 13 13 13 13 13 13 13 13 13 13 13
D-48

2004 ASPHALT FILM THICKNESS STUDY
Mn/DOT Test Data (Based on Production Data)
State TOTAL ACeff ACeff PERCENTAGE PASSING SIEVE SA AFT Project AC (By Mix) (By Agg) #200 #100 #50 #30 #16 #8 #4 (SF/Lb) (Microns) VMA
3408-14 Average 6.10 5.21 5.55 5.72 9.50 20.27 34.50 48.05 62.09 73.82 35.57 7.62 15.11 Std Dev 0.25 0.22 0.25 0.34 1.34 1.80 1.97 2.42 2.64 2.72 2.11 0.41 0.46 Count 22 22 22 22 22 22 22 22 22 22 22 22 22
3408-14 Average 6.21 5.31 5.66 5.64 9.82 21.94 36.41 49.71 61.82 73.29 36.51 7.57 14.84 Std Dev 0.31 0.19 0.21 0.40 0.95 1.71 2.00 2.31 2.51 2.47 2.06 0.48 0.39 Count 17 17 17 17 17 17 17 17 17 17 17 17 17
3408-14 Average 6.18 5.25 5.60 5.05 8.88 20.50 36.25 49.25 61.38 73.13 34.49 7.91 16.09 Std Dev 0.21 0.21 0.23 0.31 0.83 1.41 1.58 1.49 1.69 1.73 1.35 0.39 0.65 Count 8 8 8 8 8 8 8 8 8 8 8 8 8
3408-14 Average 5.91 5.18 5.50 5.39 9.75 20.21 34.71 48.33 62.08 73.63 35.22 7.63 15.54 Std Dev 0.22 0.22 0.24 0.51 1.42 1.84 1.94 2.12 2.38 2.46 2.18 0.45 0.62 Count 24 24 24 24 24 24 24 24 24 24 24 24 24
3408-14 Average 5.91 5.16 5.49 5.39 9.29 20.29 35.00 47.93 60.21 71.79 34.85 7.70 14.51 Std Dev 0.24 0.26 0.29 0.48 1.14 2.67 2.99 3.32 3.60 3.33 2.89 0.48 0.81 Count 14 14 14 14 14 14 14 14 14 14 14 14 14
3708-13 Average 5.91 4.84 5.14 6.45 8.63 15.63 28.75 42.63 56.25 70.63 33.28 7.54 15.48 Std Dev 0.23 0.25 0.28 0.47 0.52 0.52 0.89 1.41 2.05 1.30 1.12 0.55 0.67 Count 8 8 8 8 8 8 8 8 8 8 8 8 8
5107-12 Average 5.91 4.97 5.28 5.21 7.00 12.57 27.00 40.57 54.57 70.00 28.92 8.91 15.10 Std Dev 0.27 0.24 0.26 0.54 0.58 0.79 1.29 1.40 1.90 1.91 1.53 0.45 0.65 Count 7 7 7 7 7 7 7 7 7 7 7 7 7
26-621-07 Average 6.00 4.60 4.90 5.55 8.00 16.00 29.50 44.50 64.00 77.00 32.27 7.37 13.35 Std Dev 0.42 0.57 0.62 0.21 0.00 1.41 3.54 4.95 1.41 0.00 1.60 0.58 1.34 Count 2 2 2 2 2 2 2 2 2 2 2 2 2
D-49

2004 ASPHALT FILM THICKNESS STUDY
Contractor Test Data (Based on Production Data)
State TOTAL ACeff ACeff PERCENTAGE PASSING SIEVE SA AFT Project AC (By Mix) (By Agg) #200 #100 #50 #30 #16 #8 #4 (SF/Lb) (Microns) VMA
3408-14 Average 5.92 5.18 5.50 5.22 8.47 18.43 33.30 47.27 60.60 72.53 33.28 8.07 15.04 Std Dev 0.18 0.20 0.22 0.36 0.57 1.04 1.62 1.95 2.28 2.65 1.51 0.44 0.36 Count 30 30 30 30 30 30 30 30 30 30 30 30 30
3408-14 Average 6.22 5.32 5.67 5.00 8.50 19.38 34.91 48.85 60.65 72.26 33.59 8.25 14.89 Std Dev 0.26 0.27 0.30 0.52 0.93 1.99 2.43 2.55 2.63 2.59 2.32 0.56 0.47 Count 34 34 34 34 34 34 34 34 34 34 34 34 34
3408-14 Average 6.19 5.29 5.64 4.58 8.00 18.50 35.20 48.50 60.50 71.90 32.34 8.51 15.91 Std Dev 0.22 0.23 0.26 0.32 0.67 1.78 2.49 3.21 3.78 3.73 1.87 0.44 0.59 Count 10 10 10 10 10 10 10 10 10 10 10 10 10
3408-14 Average 5.91 5.21 5.54 4.89 8.23 18.69 34.10 48.21 61.18 72.54 32.89 8.23 15.47 Std Dev 0.28 0.30 0.33 0.55 0.93 2.04 2.43 2.86 3.43 3.50 2.50 0.63 0.74 Count 39 39 39 39 39 39 39 39 39 39 39 39 39
3408-14 Average 5.87 5.11 5.43 5.00 8.30 18.48 34.15 47.85 59.52 71.22 32.94 8.05 14.50 Std Dev 0.21 0.25 0.28 0.44 0.87 2.12 2.67 2.74 2.74 2.79 2.14 0.54 0.59 Count 27 27 27 27 27 27 27 27 27 27 27 27 27
3708-13 Average 5.97 5.02 5.33 5.81 7.58 14.68 28.63 42.42 57.37 71.63 31.38 8.31 15.47 Std Dev 0.10 0.17 0.18 0.44 0.84 1.11 1.30 1.80 1.61 2.27 1.58 0.64 0.59 Count 19 19 19 19 19 19 19 19 19 19 19 19 19
5107-12 Average 5.65 4.88 5.17 4.65 5.92 12.31 25.15 40.00 54.62 69.77 26.98 9.35 14.90 Std Dev 0.15 0.16 0.18 0.44 0.49 1.03 1.46 1.68 1.56 1.96 1.40 0.57 0.45 Count 13 13 13 13 13 13 13 13 13 13 13 13 13
26-621-07 Average 6.20 5.20 5.54 5.30 7.43 14.14 28.57 45.43 59.14 73.14 30.64 8.84 14.69 Std Dev 0.12 0.22 0.24 0.47 0.79 0.90 1.27 0.79 1.07 1.07 1.65 0.74 0.53 Count 7 7 7 7 7 7 7 7 7 7 7 7 7
D-50

2004 ASPHALT FILM THICKNESS STUDY
Mn/DOT Test Data (Based on Production Data)
State TOTAL ACeff ACeff PERCENTAGE PASSING SIEVE SA AFT Project AC (By Mix) (By Agg) #200 #100 #50 #30 #16 #8 #4 (SF/Lb) (Microns) VMA
26-621-07 Average 7.00 5.67 6.09 4.73 7.00 15.33 29.67 47.33 63.33 76.67 30.38 9.77 15.07 Std Dev 0.26 0.23 0.26 0.51 1.00 0.58 0.58 1.15 1.53 2.08 1.42 0.39 1.31 Count 3 3 3 3 3 3 3 3 3 3 3 3 3
37-600-02 Average 6.05 5.15 5.48 6.20 9.50 14.00 27.50 43.50 55.50 68.50 32.74 8.16 13.90 Std Dev 0.21 0.07 0.06 0.42 0.71 0.00 2.12 3.54 3.54 3.54 0.54 0.23 0.71 Count 2 2 2 2 2 2 2 2 2 2 2 2 2
37-600-02 Average 6.15 5.00 5.33 6.00 9.00 14.50 28.50 43.50 55.50 70.00 32.44 8.00 13.55 Std Dev 0.07 0.00 0.00 0.14 0.00 0.71 0.71 0.71 2.12 1.41 0.25 0.07 0.35 Count 2 2 2 2 2 2 2 2 2 2 2 2 2
37-612-13 Average 6.23 4.88 5.20 5.60 9.25 18.25 30.00 40.25 53.25 69.00 34.18 7.43 13.53 Std Dev 0.10 0.10 0.10 0.37 0.50 1.50 1.83 1.26 1.26 1.63 1.71 0.49 0.22 Count 4 4 4 4 4 4 4 4 4 4 4 4 4
37-612-13 Average 6.54 4.74 5.07 5.20 8.60 20.40 33.80 44.80 58.20 74.40 35.51 6.97 13.54 Std Dev 0.13 0.18 0.20 0.32 0.55 1.34 0.84 1.10 1.30 1.14 1.53 0.55 0.42 Count 5 5 5 5 5 5 5 5 5 5 5 5 5
42-606-09 Average 6.19 5.16 5.50 6.48 8.67 13.83 28.00 44.92 58.92 71.33 33.01 8.15 15.86 Std Dev 0.22 0.12 0.13 0.78 0.89 1.11 2.52 2.39 2.23 1.72 2.40 0.59 0.66 Count 12 12 12 12 12 12 12 12 12 12 12 12 12
42-613-23 Average 5.95 5.00 5.32 6.70 9.17 14.67 28.00 44.17 59.83 73.17 33.93 7.64 15.25 Std Dev 0.25 0.18 0.20 0.51 0.75 0.82 1.67 3.06 1.94 1.33 1.22 0.34 0.88 Count 6 6 6 6 6 6 6 6 6 6 6 6 6
51-603-15 Average 6.08 4.88 5.19 5.00 7.18 13.39 20.86 32.82 54.46 73.43 27.52 9.23 14.29 Std Dev 0.17 0.16 0.18 0.38 0.77 1.75 2.19 2.37 3.33 3.37 2.03 0.63 0.67 Count 28 28 28 28 28 28 28 28 28 28 28 28 28
D-51

2004 ASPHALT FILM THICKNESS STUDY
Contractor Test Data (Based on Production Data)
State TOTAL ACeff ACeff PERCENTAGE PASSING SIEVE SA AFT Project AC (By Mix) (By Agg) #200 #100 #50 #30 #16 #8 #4 (SF/Lb) (Microns) VMA
26-621-07 Average 6.86 5.68 6.10 4.56 6.60 13.60 29.00 48.60 63.80 76.40 29.36 10.18 16.02 Std Dev 0.17 0.28 0.31 0.92 1.52 1.52 1.73 3.05 1.92 2.30 3.17 0.94 0.51 Count 5 5 5 5 5 5 5 5 5 5 5 5 5
37-600-02 Average 5.98 5.08 5.40 6.48 8.00 13.00 27.20 43.60 55.80 67.80 31.95 8.24 14.62 Std Dev 0.13 0.16 0.18 0.18 0.71 0.71 2.05 2.51 3.27 3.77 0.93 0.32 0.60 Count 5 5 5 5 5 5 5 5 5 5 5 5 5
37-600-02 Average 6.10 4.85 5.17 7.03 8.25 13.75 28.50 44.25 56.75 71.25 33.54 7.50 14.50 Std Dev 0.14 0.10 0.11 0.36 0.50 0.50 0.58 0.96 0.96 0.50 1.08 0.27 0.28 Count 4 4 4 4 4 4 4 4 4 4 4 4 4
37-612-13 Average 6.18 4.85 5.17 5.75 7.87 15.33 28.40 38.40 51.67 67.47 32.18 7.85 14.05 Std Dev 0.20 0.27 0.29 0.61 0.83 1.18 1.30 1.80 2.44 2.90 2.08 0.64 0.36 Count 15 15 15 15 15 15 15 15 15 15 15 15 15
37-612-13 Average 6.49 4.75 5.08 5.26 7.47 17.53 32.40 42.60 55.40 70.73 33.38 7.42 14.11 Std Dev 0.11 0.16 0.17 0.55 0.64 1.19 1.80 2.06 2.44 2.89 1.59 0.34 0.37 Count 15 15 15 15 15 15 15 15 15 15 15 15 15
42-606-09 Average 6.12 5.18 5.52 5.58 7.41 13.09 27.14 45.50 59.14 70.91 30.53 8.82 15.55 Std Dev 0.18 0.15 0.17 0.52 0.67 0.87 2.32 2.43 2.27 2.39 1.65 0.56 0.80 Count 22 22 22 22 22 22 22 22 22 22 22 22 22
42-613-23 Average 6.09 5.11 5.44 6.01 8.10 13.90 25.80 43.10 58.60 71.40 31.48 8.42 14.84 Std Dev 0.23 0.19 0.22 0.25 0.32 0.57 1.81 3.00 2.88 2.50 0.52 0.33 0.88 Count 10 10 10 10 10 10 10 10 10 10 10 10 10
51-603-15 Average 5.99 4.99 5.31 4.40 6.41 12.48 19.95 32.24 53.32 71.36 25.57 10.16 14.37 Std Dev 0.12 0.13 0.14 0.40 0.68 1.50 1.93 2.37 2.88 3.28 1.88 0.72 0.43 Count 66 66 66 66 66 66 66 66 66 66 66 66 66
D-52

2004 ASPHALT FILM THICKNESS STUDY
Mn/DOT Test Data (Based on Production Data)
State TOTAL ACeff ACeff PERCENTAGE PASSING SIEVE SA AFT Project AC (By Mix) (By Agg) #200 #100 #50 #30 #16 #8 #4 (SF/Lb) (Microns) VMA
65-608-11 Average 5.67 4.77 5.05 6.00 9.33 18.00 31.33 43.67 56.00 67.67 34.07 7.23 13.50 Std Dev 0.12 0.06 0.06 0.20 0.58 1.00 1.53 2.08 2.65 2.89 1.48 0.30 0.26 Count 3 3 3 3 3 3 3 3 3 3 3 3 3
76-617-08 Average 6.29 5.20 5.55 5.58 7.38 13.25 29.63 44.38 57.63 72.13 30.77 8.79 14.88 Std Dev 0.24 0.19 0.21 0.21 0.52 0.71 1.19 1.77 2.26 2.80 1.09 0.29 0.37 Count 8 8 8 8 8 8 8 8 8 8 8 8 8
76-617-08 Average 6.63 5.50 5.89 3.88 5.25 10.50 26.25 42.00 55.00 68.00 25.10 11.43 16.20 Std Dev 0.15 0.18 0.20 0.33 0.50 0.58 0.96 2.16 3.56 5.48 0.82 0.35 0.59 Count 4 4 4 4 4 4 4 4 4 4 4 4 4
Com'l #2 Average 5.40 5.01 5.30 4.00 6.13 11.00 19.75 29.50 41.50 56.75 23.30 11.16 15.63 Std Dev 0.35 0.34 0.38 0.56 0.83 1.31 3.28 4.99 4.84 3.49 2.60 1.02 1.03 Count 8 8 8 8 8 8 8 8 8 8 8 8 8
Com'l #2 Average 5.50 4.63 4.90 5.00 7.57 12.71 20.86 30.00 42.14 55.43 26.47 9.03 14.41 Std Dev 0.22 0.28 0.30 0.67 0.79 0.49 2.73 3.96 4.60 5.19 1.60 0.63 0.84 Count 7 7 7 7 7 7 7 7 7 7 7 7 7
Com'l #2 Average 5.34 4.69 4.95 4.90 7.86 13.29 21.29 32.14 47.14 64.43 27.27 8.86 14.61 Std Dev 0.33 0.32 0.35 0.34 0.69 0.49 2.87 3.18 4.22 4.24 1.23 0.79 1.11 Count 7 7 7 7 7 7 7 7 7 7 7 7 7
Com'l #2 Average 5.93 5.19 5.52 5.06 7.13 13.00 26.63 39.00 49.50 59.38 28.29 9.50 14.60 Std Dev 0.32 0.33 0.37 0.27 0.64 0.76 2.39 3.51 4.66 5.42 1.29 0.52 0.91 Count 8 8 8 8 8 8 8 8 8 8 8 8 8
Com'l #2 Average 5.30 4.65 4.91 4.80 8.00 14.00 27.50 39.50 51.00 63.00 28.99 8.24 14.60 Std Dev 0.57 0.49 0.55 0.00 0.00 1.41 4.95 6.36 5.66 2.83 1.91 0.38 0.42 Count 2 2 2 2 2 2 2 2 2 2 2 2 2
D-53
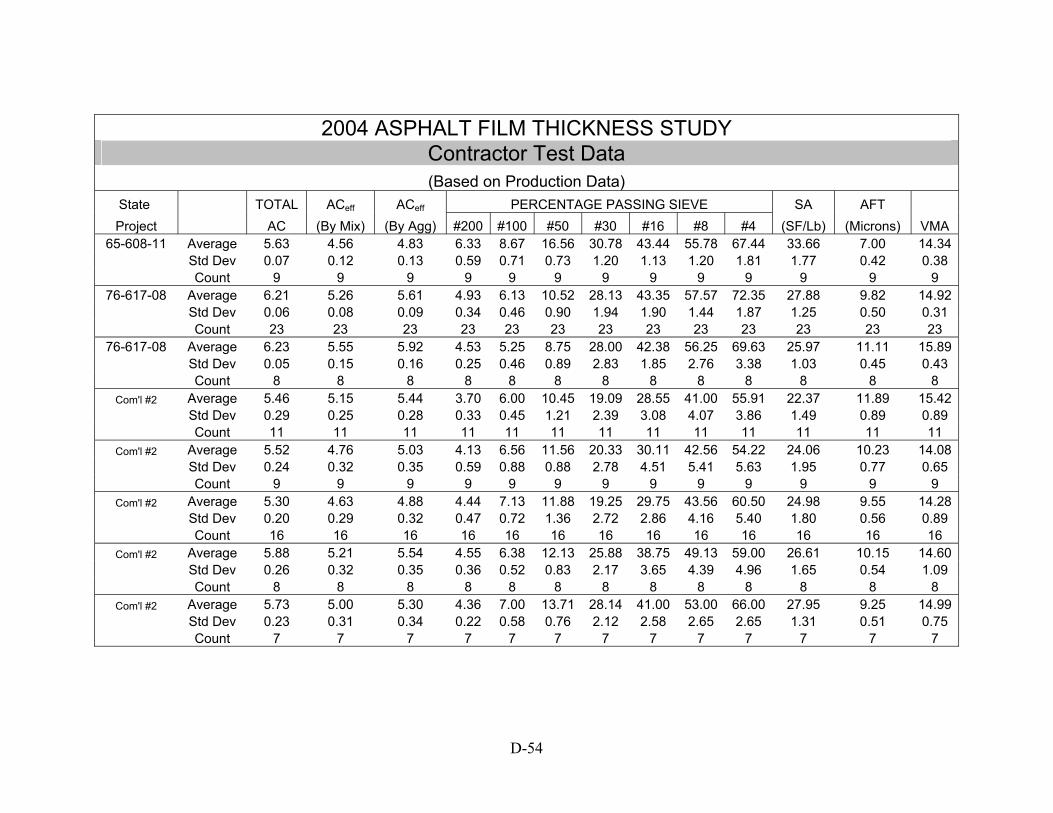
2004 ASPHALT FILM THICKNESS STUDY
Contractor Test Data (Based on Production Data)
State TOTAL ACeff ACeff PERCENTAGE PASSING SIEVE SA AFT Project AC (By Mix) (By Agg) #200 #100 #50 #30 #16 #8 #4 (SF/Lb) (Microns) VMA
65-608-11 Average 5.63 4.56 4.83 6.33 8.67 16.56 30.78 43.44 55.78 67.44 33.66 7.00 14.34 Std Dev 0.07 0.12 0.13 0.59 0.71 0.73 1.20 1.13 1.20 1.81 1.77 0.42 0.38 Count 9 9 9 9 9 9 9 9 9 9 9 9 9
76-617-08 Average 6.21 5.26 5.61 4.93 6.13 10.52 28.13 43.35 57.57 72.35 27.88 9.82 14.92 Std Dev 0.06 0.08 0.09 0.34 0.46 0.90 1.94 1.90 1.44 1.87 1.25 0.50 0.31 Count 23 23 23 23 23 23 23 23 23 23 23 23 23
76-617-08 Average 6.23 5.55 5.92 4.53 5.25 8.75 28.00 42.38 56.25 69.63 25.97 11.11 15.89 Std Dev 0.05 0.15 0.16 0.25 0.46 0.89 2.83 1.85 2.76 3.38 1.03 0.45 0.43 Count 8 8 8 8 8 8 8 8 8 8 8 8 8
Com'l #2 Average 5.46 5.15 5.44 3.70 6.00 10.45 19.09 28.55 41.00 55.91 22.37 11.89 15.42 Std Dev 0.29 0.25 0.28 0.33 0.45 1.21 2.39 3.08 4.07 3.86 1.49 0.89 0.89 Count 11 11 11 11 11 11 11 11 11 11 11 11 11
Com'l #2 Average 5.52 4.76 5.03 4.13 6.56 11.56 20.33 30.11 42.56 54.22 24.06 10.23 14.08 Std Dev 0.24 0.32 0.35 0.59 0.88 0.88 2.78 4.51 5.41 5.63 1.95 0.77 0.65 Count 9 9 9 9 9 9 9 9 9 9 9 9 9
Com'l #2 Average 5.30 4.63 4.88 4.44 7.13 11.88 19.25 29.75 43.56 60.50 24.98 9.55 14.28 Std Dev 0.20 0.29 0.32 0.47 0.72 1.36 2.72 2.86 4.16 5.40 1.80 0.56 0.89 Count 16 16 16 16 16 16 16 16 16 16 16 16 16
Com'l #2 Average 5.88 5.21 5.54 4.55 6.38 12.13 25.88 38.75 49.13 59.00 26.61 10.15 14.60 Std Dev 0.26 0.32 0.35 0.36 0.52 0.83 2.17 3.65 4.39 4.96 1.65 0.54 1.09 Count 8 8 8 8 8 8 8 8 8 8 8 8 8
Com'l #2 Average 5.73 5.00 5.30 4.36 7.00 13.71 28.14 41.00 53.00 66.00 27.95 9.25 14.99 Std Dev 0.23 0.31 0.34 0.22 0.58 0.76 2.12 2.58 2.65 2.65 1.31 0.51 0.75 Count 7 7 7 7 7 7 7 7 7 7 7 7 7
D-54

2004 ASPHALT FILM THICKNESS STUDY
Mn/DOT Test Data (Based on Production Data)
State TOTAL ACeff ACeff PERCENTAGE PASSING SIEVE SA AFT Project AC (By Mix) (By Agg) #200 #100 #50 #30 #16 #8 #4 (SF/Lb) (Microns) VMA
Com'l #2 Average 5.40 4.60 4.86 5.40 9.00 14.00 23.00 33.00 46.00 58.00 29.10 8.14 13.70 Std Dev 0.00 0.00 0.00 0.00 0.00 0.00 0.00 0.00 0.00 0.00 0.00 0.00 0.00 Count 1 1 1 1 1 1 1 1 1 1 1 1 1
Com'l #2 Average 5.68 4.72 5.00 4.68 7.40 14.00 28.80 41.60 53.00 65.00 28.91 8.46 15.36 Std Dev 0.22 0.23 0.25 0.80 1.14 1.00 1.92 3.78 4.85 4.80 1.66 0.72 1.19 Count 5 5 5 5 5 5 5 5 5 5 5 5 5
Com'l #2 Average 5.74 4.83 5.12 4.36 6.38 13.13 28.50 41.25 52.63 64.00 27.42 9.13 14.93 Std Dev 0.31 0.18 0.20 0.40 0.74 0.99 2.73 3.58 3.85 4.44 1.82 0.78 1.07 Count 8 8 8 8 8 8 8 8 8 8 8 8 8
Com'l #3 Average 5.58 5.05 5.35 5.13 7.33 13.83 28.67 42.33 53.33 63.67 29.57 8.82 15.20 Std Dev 0.12 0.10 0.12 0.43 0.52 0.75 1.03 1.37 1.37 1.75 1.34 0.46 0.35 Count 6 6 6 6 6 6 6 6 6 6 6 6 6
Com'l #3 Average 5.22 4.72 4.98 4.84 7.60 14.00 23.80 33.60 46.40 64.60 27.67 8.76 15.02 Std Dev 0.18 0.35 0.38 0.13 0.55 0.71 4.09 5.27 4.83 1.95 1.10 0.39 0.33 Count 5 5 5 5 5 5 5 5 5 5 5 5 5
Com'l #3 Average 5.52 4.68 4.95 4.56 7.00 14.20 28.60 40.40 51.00 65.60 28.34 8.54 15.42 Std Dev 0.31 0.36 0.39 0.60 0.71 0.84 2.07 2.61 3.46 3.65 1.26 0.90 0.50 Count 5 5 5 5 5 5 5 5 5 5 5 5 5
Com'l #3 Average 5.50 4.73 5.01 4.97 7.33 14.33 28.33 39.00 49.67 62.33 28.97 8.43 15.07 Std Dev 0.10 0.12 0.12 0.40 0.58 0.58 1.53 2.00 3.51 4.04 1.64 0.40 0.87 Count 3 3 3 3 3 3 3 3 3 3 3 3 3
Com'l #4 Average 5.20 4.53 4.78 4.83 8.67 15.67 27.00 37.33 49.00 62.33 29.61 7.87 13.47 Std Dev 0.26 0.21 0.23 0.40 0.58 1.15 2.65 3.21 3.46 4.16 1.99 0.25 0.57 Count 3 3 3 3 3 3 3 3 3 3 3 3 3
D-55

2004 ASPHALT FILM THICKNESS STUDY
Contractor Test Data (Based on Production Data)
State TOTAL ACeff ACeff PERCENTAGE PASSING SIEVE SA AFT Project AC (By Mix) (By Agg) #200 #100 #50 #30 #16 #8 #4 (SF/Lb) (Microns) VMA
Com'l #2 Average 5.65 4.80 5.09 5.20 8.00 14.00 24.50 37.00 49.00 62.00 28.91 8.57 13.30 Std Dev 0.07 0.00 0.00 0.14 0.00 0.00 0.71 1.41 0.00 1.41 0.41 0.13 0.71 Count 2 2 2 2 2 2 2 2 2 2 2 2 2
Com'l #2 Average 5.55 4.72 5.00 4.18 6.71 13.21 28.43 42.21 54.07 67.07 27.54 8.89 14.76 Std Dev 0.24 0.19 0.21 0.65 0.91 1.05 1.22 1.89 2.46 2.62 1.91 0.90 0.66 Count 14 14 14 14 14 14 14 14 14 14 14 14 14
Com'l #2 Average 5.50 4.76 5.04 4.11 6.05 12.71 28.57 41.76 52.57 63.33 26.74 9.26 14.33 Std Dev 0.34 0.24 0.27 0.62 1.12 1.31 2.68 3.78 3.85 3.89 2.39 1.03 0.64 Count 21 21 21 21 21 21 21 21 21 21 21 21 21
Com'l #3 Average 5.83 5.21 5.53 4.69 6.50 13.00 27.88 42.63 53.75 63.38 28.03 9.64 15.56 Std Dev 0.18 0.16 0.17 0.53 0.53 0.76 1.55 1.51 2.49 2.88 1.68 0.50 0.37 Count 8 8 8 8 8 8 8 8 8 8 8 8 8
Com'l #3 Average 5.32 4.92 5.20 4.34 7.00 14.40 23.80 34.40 46.00 64.00 26.67 9.50 14.80 Std Dev 0.16 0.23 0.24 0.27 0.00 3.21 3.56 4.51 3.39 1.22 1.41 0.48 0.36 Count 5 5 5 5 5 5 5 5 5 5 5 5 5
Com'l #3 Average 5.58 4.82 5.10 3.97 6.00 13.17 27.50 39.83 51.83 64.17 26.29 9.45 15.22 Std Dev 0.15 0.26 0.28 0.21 0.00 0.75 1.64 1.94 3.06 3.06 0.72 0.41 0.50 Count 6 6 6 6 6 6 6 6 6 6 6 6 6
Com'l #3 Average 5.35 4.66 4.92 4.04 6.08 13.00 26.67 38.50 49.08 61.75 26.03 9.23 14.16 Std Dev 0.27 0.27 0.30 0.43 0.67 1.04 2.06 3.09 4.06 4.27 1.96 0.45 0.52 Count 12 12 12 12 12 12 12 12 12 12 12 12 12
Com'l #4 Average 5.11 4.61 4.86 3.25 6.00 12.38 23.88 34.75 46.25 59.25 23.67 10.05 13.80 Std Dev 0.11 0.25 0.27 0.43 0.76 1.30 1.73 2.71 3.96 6.16 2.15 0.72 0.29 Count 8 8 8 8 8 8 8 8 8 8 8 8 8
D-56

2004 ASPHALT FILM THICKNESS STUDY
Mn/DOT Test Data (Based on Production Data)
State TOTAL ACeff ACeff PERCENTAGE PASSING SIEVE SA AFT Project AC (By Mix) (By Agg) #200 #100 #50 #30 #16 #8 #4 (SF/Lb) (Microns) VMA
Com'l #4 Average 5.74 5.02 5.33 5.38 8.00 16.40 32.20 43.60 54.00 65.80 31.80 8.17 14.64 Std Dev 0.15 0.13 0.14 0.46 0.71 0.89 0.45 0.55 1.00 1.10 1.45 0.34 0.40 Count 5 5 5 5 5 5 5 5 5 5 5 5 5
Com'l #4 Average 5.30 4.57 4.82 3.93 6.33 11.33 20.33 30.00 42.33 56.00 23.55 9.99 14.53 Std Dev 0.20 0.25 0.28 0.42 0.58 0.58 2.31 2.65 2.52 2.00 1.83 0.44 0.60 Count 3 3 3 3 3 3 3 3 3 3 3 3 3
Com'l #4 Average 5.51 4.76 5.04 4.83 8.00 16.10 30.40 41.20 52.10 66.60 30.33 8.09 15.25 Std Dev 0.32 0.24 0.27 0.23 0.47 0.57 1.35 1.69 2.18 2.63 1.06 0.37 0.45 Count 10 10 10 10 10 10 10 10 10 10 10 10 10
Com'l #4 Average 5.39 4.75 5.02 4.05 6.54 12.08 21.54 31.54 44.46 54.46 24.43 10.02 14.19 Std Dev 0.25 0.26 0.28 0.28 0.52 0.76 0.97 0.97 1.27 2.50 1.11 0.72 0.39 Count 13 13 13 13 13 13 13 13 13 13 13 13 13
Com'l #4 Average 5.15 4.63 4.88 4.64 7.70 13.60 22.40 32.25 46.25 63.85 26.96 8.83 14.98 Std Dev 0.15 0.20 0.22 0.22 0.47 0.60 1.47 1.94 2.02 2.32 1.07 0.41 0.47 Count 20 20 20 20 20 20 20 20 20 20 20 20 20
Com'l #4 Average 5.10 4.44 4.68 4.58 7.71 13.57 22.00 31.50 46.00 64.50 26.76 8.54 14.78 Std Dev 0.22 0.20 0.22 0.25 0.47 0.65 1.30 1.65 2.57 3.11 1.10 0.60 0.57 Count 14 14 14 14 14 14 14 14 14 14 14 14 14
Com'l #5 Average 5.35 4.47 4.72 4.11 6.60 12.60 22.73 33.13 46.40 59.40 25.20 9.13 14.73 Std Dev 0.28 0.27 0.30 0.19 0.51 0.51 1.03 1.73 2.75 3.20 1.00 0.68 0.53 Count 15 15 15 15 15 15 15 15 15 15 15 15 15
Com'l #5 Average 5.40 4.60 4.86 4.96 7.90 15.20 26.50 36.40 48.10 62.60 29.03 8.15 14.01 Std Dev 0.33 0.37 0.40 0.30 0.57 0.79 1.72 2.67 3.45 4.30 1.50 0.44 0.53 Count 10 10 10 10 10 10 10 10 10 10 10 10 10
D-57

2004 ASPHALT FILM THICKNESS STUDY Contractor Test Data (Based on Production Data)
State TOTAL ACeff ACeff PERCENTAGE PASSING SIEVE SA AFT Project AC (By Mix) (By Agg) #200 #100 #50 #30 #16 #8 #4 (SF/Lb) (Microns) VMA Com'l #4 Average 5.49 4.91 5.20 4.25 6.65 14.94 30.59 43.00 53.47 65.35 28.44 8.91 14.26
Std Dev 0.21 0.25 0.27 0.33 0.49 0.75 1.18 1.54 1.87 2.06 1.13 0.52 0.47 Count 17 17 17 17 17 17 17 17 17 17 17 17 17
Com'l #4 Average 5.20 4.62 4.87 3.65 5.67 11.00 20.67 30.67 43.67 57.83 22.79 10.43 14.40 Std Dev 0.15 0.22 0.24 0.35 0.52 0.89 1.63 2.66 2.94 2.86 1.58 0.46 0.37 Count 6 6 6 6 6 6 6 6 6 6 6 6 6
Com'l #4 Average 5.43 4.83 5.11 4.06 6.75 14.91 29.28 40.84 52.00 65.94 27.78 8.97 14.82 Std Dev 0.23 0.24 0.26 0.37 0.67 0.96 1.69 2.29 2.79 2.75 1.59 0.57 0.48 Count 32 32 32 32 32 32 32 32 32 32 32 32 32
Com'l #4 Average 5.08 4.77 5.03 3.38 5.47 10.76 20.24 30.65 43.29 52.82 22.00 11.15 14.06 Std Dev 0.26 0.23 0.25 0.28 0.51 0.66 1.03 1.46 1.83 2.53 1.11 0.63 0.45 Count 17 17 17 17 17 17 17 17 17 17 17 17 17
Com'l #4 Average 5.26 4.80 5.06 4.07 6.96 12.81 21.67 32.07 46.37 63.74 25.26 9.78 15.13 Std Dev 0.19 0.22 0.24 0.29 0.52 0.74 1.39 1.96 2.36 2.86 1.26 0.52 0.49 Count 27 27 27 27 27 27 27 27 27 27 27 27 27
Com'l #4 Average 5.20 4.63 4.89 4.19 7.00 12.74 21.30 31.56 45.85 64.07 25.35 9.45 14.78 Std Dev 0.19 0.21 0.23 0.71 0.92 1.10 1.49 2.01 2.89 3.41 2.44 0.76 0.44 Count 27 27 27 27 27 27 27 27 27 27 27 27 27
Com'l #5 Average 5.20 4.55 4.80 3.59 6.00 11.85 22.15 33.33 47.19 59.04 23.74 9.86 14.36 Std Dev 0.27 0.23 0.25 0.28 0.78 0.86 1.32 2.25 3.00 3.67 1.43 0.64 0.57 Count 27 27 27 27 27 27 27 27 27 27 27 27 27
Com'l #5 Average 5.60 4.82 5.11 3.80 6.15 13.15 24.15 33.77 45.23 57.62 24.76 10.10 14.13 Std Dev 0.20 0.30 0.33 0.49 0.99 1.46 1.99 2.71 3.63 3.66 2.35 0.78 0.52 Count 13 13 13 13 13 13 13 13 13 13 13 13 13
D-58

2004 ASPHALT FILM THICKNESS STUDY
Mn/DOT Test Data (Based on Production Data)
State TOTAL ACeff ACeff PERCENTAGE PASSING SIEVE SA AFT Project AC (By Mix) (By Agg) #200 #100 #50 #30 #16 #8 #4 (SF/Lb) (Microns) VMA Com'l #5 Average 5.60 4.68 4.96 4.67 7.83 14.33 24.17 33.50 45.83 64.67 27.66 8.73 15.17
Std Dev 0.38 0.34 0.38 0.26 0.41 1.03 1.83 2.51 3.25 4.63 0.99 0.50 0.41 Count 6 6 6 6 6 6 6 6 6 6 6 6 6
Com'l #5 Average 5.07 4.37 4.60 4.60 7.85 14.05 23.20 33.10 47.35 64.95 27.37 8.20 14.68 Std Dev 0.20 0.22 0.24 0.31 0.49 0.76 1.24 1.92 2.83 3.90 1.28 0.40 0.65 Count 20 20 20 20 20 20 20 20 20 20 20 20 20
Com'l #5 Average 5.83 4.84 5.14 4.96 8.14 15.43 26.43 37.43 51.43 64.86 29.49 8.49 14.90 Std Dev 0.30 0.26 0.29 0.19 0.38 0.53 0.53 1.40 3.10 3.80 0.76 0.42 0.73 Count 7 7 7 7 7 7 7 7 7 7 7 7 7
Com'l #5 Average 5.80 4.77 5.06 4.50 7.11 12.67 21.67 32.00 46.00 58.11 25.86 9.53 15.72 Std Dev 0.19 0.27 0.29 0.27 0.33 0.71 1.00 1.94 2.92 3.48 1.01 0.54 0.59 Count 9 9 9 9 9 9 9 9 9 9 9 9 9
Com'l #5 Average 5.77 4.77 5.06 4.96 8.57 15.29 24.86 35.43 49.00 67.86 29.29 8.43 15.33 Std Dev 0.37 0.24 0.27 0.43 0.79 0.95 2.48 1.62 2.45 4.49 1.52 0.39 1.01 Count 7 7 7 7 7 7 7 7 7 7 7 7 7
Com'l #5 Average 5.13 4.37 4.60 5.70 10.33 18.67 28.33 38.00 51.33 67.33 33.33 6.74 14.13 Std Dev 0.15 0.06 0.07 0.36 0.58 1.15 1.53 1.73 2.52 3.06 1.73 0.29 0.50 Count 3 3 3 3 3 3 3 3 3 3 3 3 3
Com'l #5 Average 5.55 4.95 5.24 4.70 8.00 18.50 32.50 43.50 55.00 71.00 31.52 8.10 15.35 Std Dev 0.21 0.21 0.24 0.00 0.00 0.71 0.71 2.12 2.83 4.24 0.68 0.19 0.78 Count 2 2 2 2 2 2 2 2 2 2 2 2 2
Com'l #5 Average 5.40 4.73 5.00 4.67 7.33 17.00 33.33 45.67 57.00 69.67 30.96 7.88 14.63 Std Dev 0.20 0.25 0.28 0.12 0.58 1.00 0.58 0.58 1.00 2.08 0.50 0.57 0.40 Count 3 3 3 3 3 3 3 3 3 3 3 3 3
D-59

2004 ASPHALT FILM THICKNESS STUDY
Contractor Test Data (Based on Production Data)
State TOTAL ACeff ACeff PERCENTAGE PASSING SIEVE SA AFT Project AC (By Mix) (By Agg) #200 #100 #50 #30 #16 #8 #4 (SF/Lb) (Microns) VMA
Com'l #5 Average 5.92 5.05 5.37 3.68 6.50 13.00 22.83 32.00 45.00 63.00 24.51 10.67 15.03 Std Dev 0.38 0.36 0.40 0.27 0.55 0.89 1.60 2.19 3.16 4.82 1.18 0.71 0.58 Count 6 6 6 6 6 6 6 6 6 6 6 6 6
Com'l #5 Average 5.12 4.45 4.69 3.87 6.74 12.87 21.84 32.00 46.68 63.10 24.85 9.21 14.17 Std Dev 0.24 0.21 0.23 0.27 0.51 0.67 0.97 1.46 2.44 3.51 1.09 0.54 0.45 Count 31 31 31 31 31 31 31 31 31 31 31 31 31
Com'l #5 Average 5.55 4.85 5.14 3.93 6.80 13.80 24.50 35.60 49.30 62.10 26.00 9.63 14.28 Std Dev 0.23 0.21 0.23 0.30 0.42 0.79 1.08 1.58 2.71 3.41 1.17 0.39 0.43 Count 10 10 10 10 10 10 10 10 10 10 10 10 10
Com'l #5 Average 5.82 4.93 5.23 3.84 6.14 11.57 20.64 31.36 45.00 55.14 23.61 10.82 15.07 Std Dev 0.34 0.26 0.29 0.36 0.53 0.65 1.39 2.06 3.35 3.30 1.43 0.60 0.50 Count 14 14 14 14 14 14 14 14 14 14 14 14 14
Com'l #5 Average 5.69 4.97 5.27 3.69 6.60 13.10 22.90 32.90 45.70 62.70 24.71 10.40 15.13 Std Dev 0.26 0.20 0.22 0.49 0.70 0.74 1.10 1.85 2.91 4.37 1.26 0.54 0.98 Count 10 10 10 10 10 10 10 10 10 10 10 10 10
Com'l #5 Average 5.40 4.66 4.93 4.56 8.40 17.60 27.60 38.20 52.80 68.00 30.01 8.00 14.38 Std Dev 0.16 0.09 0.10 0.19 0.55 0.55 0.55 0.45 0.84 1.41 0.76 0.17 0.33 Count 5 5 5 5 5 5 5 5 5 5 5 5 5
Com'l #5 Average 6.00 5.32 5.66 3.72 6.80 16.40 30.00 41.40 53.20 68.80 27.97 9.86 15.48 Std Dev 0.10 0.08 0.09 0.19 0.45 0.89 0.71 0.89 1.79 1.64 0.88 0.17 0.28 Count 5 5 5 5 5 5 5 5 5 5 5 5 5
Com'l #5 Average 5.62 5.01 5.31 4.02 6.44 15.33 31.56 44.56 55.78 66.44 28.44 9.10 14.83 Std Dev 0.23 0.19 0.21 0.19 0.53 0.87 1.33 1.33 1.48 1.74 0.71 0.44 0.29 Count 9 9 9 9 9 9 9 9 9 9 9 9 9
D-60

2004 ASPHALT FILM THICKNESS STUDY
Mn/DOT Test Data (Based on Production Data)
State TOTAL ACeff ACeff PERCENTAGE PASSING SIEVE SA AFT Project AC (By Mix) (By Agg) #200 #100 #50 #30 #16 #8 #4 (SF/Lb) (Microns) VMA Com'l #5 Average 5.55 4.75 5.03 4.47 7.23 15.00 29.69 41.69 52.23 65.23 28.88 8.48 15.25
Std Dev 0.36 0.33 0.37 0.25 0.44 1.00 1.44 1.97 2.49 1.92 1.15 0.50 0.58 Count 13 13 13 13 13 13 13 13 13 13 13 13 13
Com'l #6 Average 5.25 4.67 4.93 5.04 8.36 16.91 30.73 41.45 52.45 69.36 31.25 7.69 14.95 Std Dev 0.29 0.21 0.23 0.40 0.67 0.83 1.10 1.86 2.34 2.77 1.30 0.36 0.44 Count 11 11 11 11 11 11 11 11 11 11 11 11 11
Com'l #6 Average 6.03 4.93 5.25 5.40 9.33 18.33 33.00 43.67 54.33 68.33 33.39 7.66 15.20 Std Dev 0.23 0.21 0.21 0.61 0.58 0.58 1.73 3.21 4.73 5.51 0.70 0.46 1.22 Count 3 3 3 3 3 3 3 3 3 3 3 3 3
Com'l #7 Average 6.07 5.17 5.50 4.80 8.33 16.67 30.33 42.00 53.00 70.33 30.81 8.71 15.50 Std Dev 0.12 0.15 0.16 0.53 1.15 1.53 1.53 1.73 2.00 2.08 2.21 0.42 1.04 Count 3 3 3 3 3 3 3 3 3 3 3 3 3
Com'l #7 Average 5.35 4.50 4.75 4.43 6.50 12.00 21.75 31.50 44.50 59.25 25.11 9.24 14.48 Std Dev 0.17 0.14 0.16 0.30 0.58 1.15 0.96 1.73 2.38 2.06 1.51 0.54 0.19 Count 4 4 4 4 4 4 4 4 4 4 4 4 4
Com'l #7 Average 5.27 4.51 4.77 4.33 8.43 18.86 31.57 41.43 50.57 63.29 30.66 7.60 14.63 Std Dev 0.20 0.24 0.25 0.18 0.53 2.48 2.23 2.30 2.23 2.75 1.56 0.76 0.76 Count 7 7 7 7 7 7 7 7 7 7 7 7 7
Com'l #7 Average 5.51 4.73 5.01 3.82 7.11 17.11 32.78 44.00 53.56 63.33 29.03 8.41 14.26 Std Dev 0.28 0.45 0.49 0.22 0.60 0.78 1.48 2.40 2.46 1.73 0.98 0.77 0.42 Count 9 9 9 9 9 9 9 9 9 9 9 9 9
Com'l #9 Average 5.00 4.40 4.63 3.77 6.00 12.33 22.00 32.00 44.33 57.00 23.88 9.45 14.63 Std Dev 0.10 0.10 0.11 0.06 0.00 1.15 1.00 2.00 2.52 4.00 0.78 0.24 0.32 Count 3 3 3 3 3 3 3 3 3 3 3 3 3
D-61

2004 ASPHALT FILM THICKNESS STUDY
Contractor Test Data (Based on Production Data)
State TOTAL ACeff ACeff PERCENTAGE PASSING SIEVE SA AFT Project AC (By Mix) (By Agg) #200 #100 #50 #30 #16 #8 #4 (SF/Lb) (Microns) VMA
Com'l #5 Average 5.49 4.89 5.17 3.67 6.03 13.31 28.03 40.17 50.56 63.06 25.90 9.74 15.11 Std Dev 0.23 0.22 0.24 0.30 0.56 0.82 2.09 2.68 3.48 3.90 1.41 0.38 0.51 Count 36 36 36 36 36 36 36 36 36 36 36 36 36
Com'l #6 Average 5.46 4.90 5.19 4.33 7.37 16.26 30.56 42.48 53.85 71.26 29.48 8.59 14.84 Std Dev 0.20 0.17 0.18 0.49 0.79 1.13 1.69 2.21 2.80 3.01 1.83 0.49 0.57 Count 27 27 27 27 27 27 27 27 27 27 27 27 27
Com'l #6 Average 6.19 5.13 5.47 4.54 8.00 17.43 32.43 44.57 55.71 70.00 31.03 8.59 15.16 Std Dev 0.41 0.41 0.46 0.57 0.82 0.79 2.51 4.28 5.68 5.86 1.72 0.59 1.21 Count 7 7 7 7 7 7 7 7 7 7 7 7 7
Com'l #7 Average 6.08 5.30 5.64 4.10 7.25 16.00 30.75 43.00 54.25 71.75 29.06 9.47 15.65 Std Dev 0.21 0.14 0.15 0.50 0.96 1.15 1.26 1.83 2.22 2.06 1.69 0.38 0.62 Count 4 4 4 4 4 4 4 4 4 4 4 4 4
Com'l #7 Average 5.35 4.58 4.84 3.47 5.08 10.75 20.75 31.50 45.42 60.25 22.27 10.60 15.13 Std Dev 0.12 0.12 0.13 0.23 0.29 0.45 0.62 0.80 1.44 2.05 0.68 0.52 0.35 Count 12 12 12 12 12 12 12 12 12 12 12 12 12
Com'l #7 Average 5.35 4.73 4.99 3.64 7.00 17.52 31.37 40.93 49.96 62.22 28.18 8.68 14.29 Std Dev 0.38 0.26 0.29 0.29 0.62 1.97 2.13 2.04 2.10 2.61 1.73 0.89 0.49 Count 27 27 27 27 27 27 27 27 27 27 27 27 27
Com'l #7 Average 5.61 4.91 5.20 3.35 6.29 16.00 31.74 43.71 52.77 62.03 27.23 9.31 14.31 Std Dev 0.29 0.31 0.34 0.43 0.64 0.97 1.55 2.36 2.67 2.85 1.58 0.56 0.44 Count 31 31 31 31 31 31 31 31 31 31 31 31 31
Com'l #9 Average 5.20 4.78 5.04 3.28 5.40 11.80 22.40 33.00 46.00 60.00 22.84 10.78 14.60 Std Dev 0.31 0.33 0.36 0.51 0.55 0.84 1.34 1.87 2.92 3.74 1.60 0.81 0.43 Count 5 5 5 5 5 5 5 5 5 5 5 5 5
D-62

2004 ASPHALT FILM THICKNESS STUDY
Mn/DOT Test Data (Based on Production Data)
State TOTAL ACeff ACeff PERCENTAGE PASSING SIEVE SA AFT Project AC (By Mix) (By Agg) #200 #100 #50 #30 #16 #8 #4 (SF/Lb) (Microns) VMA
Com'l #10 Average 5.70 4.85 5.14 4.20 6.50 12.50 23.50 35.00 49.00 59.00 25.60 9.80 14.95 Std Dev 0.14 0.21 0.23 0.00 0.71 0.71 0.71 1.41 1.41 1.41 0.93 0.80 0.21 Count 2 2 2 2 2 2 2 2 2 2 2 2 2
Com'l #11 Average 5.20 4.70 4.96 4.15 7.00 12.50 21.50 31.00 47.50 63.50 25.25 9.57 16.10 Std Dev 0.14 0.14 0.16 0.21 0.00 0.71 0.71 0.00 2.12 0.71 0.35 0.44 0.71 Count 2 2 2 2 2 2 2 2 2 2 2 2 2
Com'l #11 Average 5.55 4.55 4.82 4.75 8.00 14.00 24.00 36.00 50.00 62.50 28.09 8.36 14.65 Std Dev 0.21 0.07 0.09 0.21 0.00 0.00 1.41 2.83 4.24 6.36 1.06 0.17 1.06 Count 2 2 2 2 2 2 2 2 2 2 2 2 2
CSM #2 Average 5.34 4.61 4.87 5.76 9.00 17.11 31.33 45.00 58.33 70.89 33.48 7.09 13.84 Std Dev 0.32 0.33 0.36 0.37 0.71 1.27 2.40 2.96 2.60 2.57 1.69 0.35 0.42 Count 9 9 9 9 9 9 9 9 9 9 9 9 9
CSM #2 Average 5.58 4.74 5.02 6.14 9.90 16.10 25.20 35.70 50.80 65.80 32.33 7.56 14.47 Std Dev 0.23 0.36 0.40 0.29 0.57 0.99 1.03 1.16 1.48 2.04 1.30 0.52 0.44 Count 10 10 10 10 10 10 10 10 10 10 10 10 10
CSM #2 Average 5.39 4.61 4.87 6.53 10.50 17.58 29.73 41.92 56.46 72.62 35.24 6.76 14.32 Std Dev 0.25 0.26 0.29 0.79 0.99 1.42 2.41 3.12 3.67 4.10 2.79 0.47 0.57 Count 26 26 26 26 26 26 26 26 26 26 26 26 26
CSM #2 Average 5.26 4.45 4.69 5.30 8.53 13.93 21.73 30.60 44.40 60.40 28.25 8.11 13.69 Std Dev 0.19 0.16 0.17 0.32 0.52 0.80 1.62 2.67 3.79 4.34 1.41 0.47 0.56 Count 15 15 15 15 15 15 15 15 15 15 15 15 15
CSM #2 Average 5.29 4.58 4.83 5.42 8.75 15.00 24.38 35.63 52.00 67.56 30.11 7.82 14.28 Std Dev 0.32 0.28 0.31 0.28 0.58 0.52 1.02 1.75 2.80 3.83 1.09 0.55 0.82 Count 16 16 16 16 16 16 16 16 16 16 16 16 16
D-63
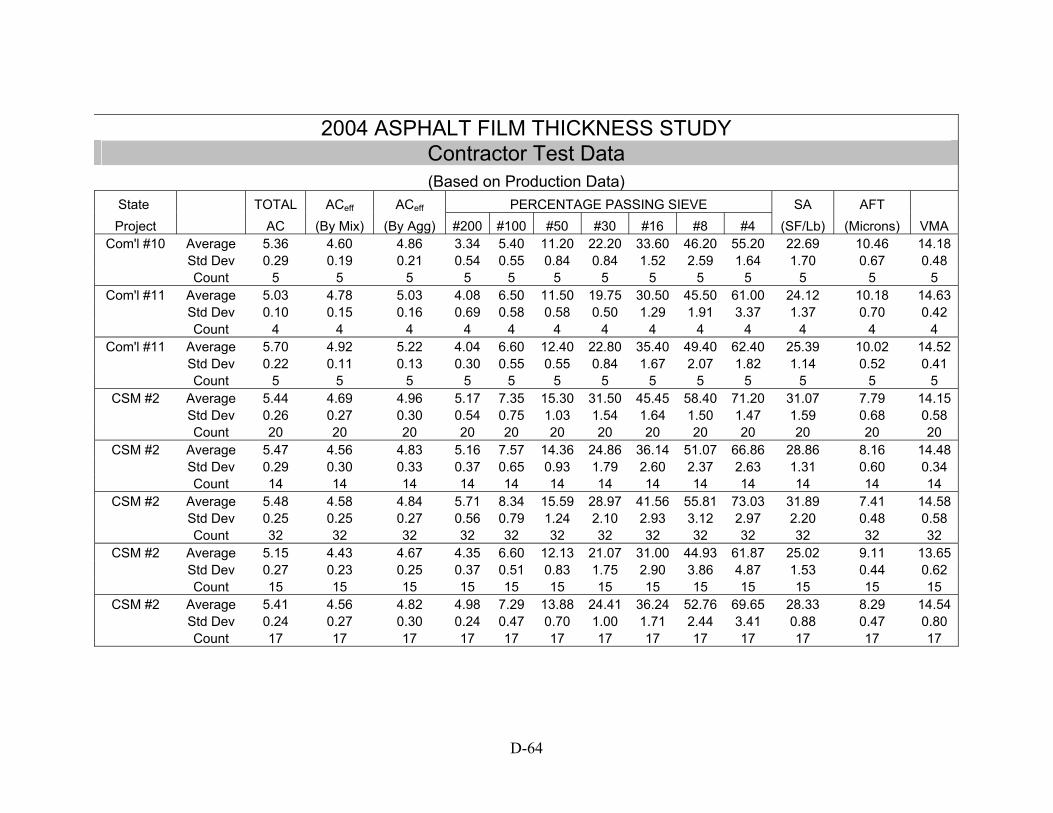
2004 ASPHALT FILM THICKNESS STUDY
Contractor Test Data (Based on Production Data)
State TOTAL ACeff ACeff PERCENTAGE PASSING SIEVE SA AFT Project AC (By Mix) (By Agg) #200 #100 #50 #30 #16 #8 #4 (SF/Lb) (Microns) VMA
Com'l #10 Average 5.36 4.60 4.86 3.34 5.40 11.20 22.20 33.60 46.20 55.20 22.69 10.46 14.18 Std Dev 0.29 0.19 0.21 0.54 0.55 0.84 0.84 1.52 2.59 1.64 1.70 0.67 0.48 Count 5 5 5 5 5 5 5 5 5 5 5 5 5
Com'l #11 Average 5.03 4.78 5.03 4.08 6.50 11.50 19.75 30.50 45.50 61.00 24.12 10.18 14.63 Std Dev 0.10 0.15 0.16 0.69 0.58 0.58 0.50 1.29 1.91 3.37 1.37 0.70 0.42 Count 4 4 4 4 4 4 4 4 4 4 4 4 4
Com'l #11 Average 5.70 4.92 5.22 4.04 6.60 12.40 22.80 35.40 49.40 62.40 25.39 10.02 14.52 Std Dev 0.22 0.11 0.13 0.30 0.55 0.55 0.84 1.67 2.07 1.82 1.14 0.52 0.41 Count 5 5 5 5 5 5 5 5 5 5 5 5 5
CSM #2 Average 5.44 4.69 4.96 5.17 7.35 15.30 31.50 45.45 58.40 71.20 31.07 7.79 14.15 Std Dev 0.26 0.27 0.30 0.54 0.75 1.03 1.54 1.64 1.50 1.47 1.59 0.68 0.58 Count 20 20 20 20 20 20 20 20 20 20 20 20 20
CSM #2 Average 5.47 4.56 4.83 5.16 7.57 14.36 24.86 36.14 51.07 66.86 28.86 8.16 14.48 Std Dev 0.29 0.30 0.33 0.37 0.65 0.93 1.79 2.60 2.37 2.63 1.31 0.60 0.34 Count 14 14 14 14 14 14 14 14 14 14 14 14 14
CSM #2 Average 5.48 4.58 4.84 5.71 8.34 15.59 28.97 41.56 55.81 73.03 31.89 7.41 14.58 Std Dev 0.25 0.25 0.27 0.56 0.79 1.24 2.10 2.93 3.12 2.97 2.20 0.48 0.58 Count 32 32 32 32 32 32 32 32 32 32 32 32 32
CSM #2 Average 5.15 4.43 4.67 4.35 6.60 12.13 21.07 31.00 44.93 61.87 25.02 9.11 13.65 Std Dev 0.27 0.23 0.25 0.37 0.51 0.83 1.75 2.90 3.86 4.87 1.53 0.44 0.62 Count 15 15 15 15 15 15 15 15 15 15 15 15 15
CSM #2 Average 5.41 4.56 4.82 4.98 7.29 13.88 24.41 36.24 52.76 69.65 28.33 8.29 14.54 Std Dev 0.24 0.27 0.30 0.24 0.47 0.70 1.00 1.71 2.44 3.41 0.88 0.47 0.80 Count 17 17 17 17 17 17 17 17 17 17 17 17 17
D-64

2004 ASPHALT FILM THICKNESS STUDY
Mn/DOT Test Data (Based on Production Data)
State TOTAL ACeff ACeff PERCENTAGE PASSING SIEVE SA AFT Project AC (By Mix) (By Agg) #200 #100 #50 #30 #16 #8 #4 (SF/Lb) (Microns) VMA CSM #2 Average 5.81 4.94 5.24 5.65 9.00 15.13 24.56 35.75 51.63 65.56 30.65 8.33 14.27
Std Dev 0.21 0.17 0.19 0.21 0.37 0.50 0.81 1.13 1.54 2.03 0.71 0.37 0.33 Count 16 16 16 16 16 16 16 16 16 16 16 16 16
Bauerly #4 Average 5.54 4.84 5.12 7.04 11.40 23.60 41.20 51.80 60.40 70.00 40.91 6.10 14.34 Std Dev 0.23 0.13 0.15 0.44 0.55 1.34 2.28 2.68 2.79 3.32 1.74 0.17 0.83 Count 5 5 5 5 5 5 5 5 5 5 5 5 5
Bauerly #4 Average 4.79 4.27 4.48 5.49 9.33 18.22 30.56 41.78 55.11 71.00 33.09 6.60 14.73 Std Dev 0.18 0.23 0.25 0.28 0.50 0.83 1.42 1.99 2.80 2.45 1.21 0.38 0.57 Count 9 9 9 9 9 9 9 9 9 9 9 9 9
Bauerly #4 Average 5.18 4.63 4.89 5.50 9.33 18.83 34.17 45.83 56.17 67.50 34.10 6.98 14.02 Std Dev 0.35 0.42 0.46 0.44 1.03 1.72 2.99 3.97 4.62 4.42 2.75 0.30 0.91 Count 6 6 6 6 6 6 6 6 6 6 6 6 6
Bit Rdwys #2 Average 5.58 4.50 4.77 5.64 8.50 17.00 30.13 40.50 51.63 65.75 32.06 7.26 14.51 Std Dev 0.31 0.24 0.27 0.49 0.93 1.31 2.70 3.96 4.53 4.98 1.89 0.54 0.82 Count 8 8 8 8 8 8 8 8 8 8 8 8 8
Bit Rdwys #2 Average 5.76 4.76 5.05 4.49 7.33 15.07 27.27 36.67 48.40 66.07 28.11 8.77 14.64 Std Dev 0.29 0.29 0.32 0.45 0.62 1.39 2.60 3.52 4.12 5.43 1.70 0.63 0.74 Count 15 15 15 15 15 15 15 15 15 15 15 15 15
Bit Rdwys #2 Average 5.30 4.47 4.72 5.05 7.50 15.50 29.50 40.83 50.50 62.17 29.89 7.69 14.35 Std Dev 0.25 0.24 0.27 0.43 0.55 0.55 2.07 2.71 3.02 2.48 1.33 0.26 0.61 Count 6 6 6 6 6 6 6 6 6 6 6 6 6
Bit Rdwys #2 Average 5.22 4.42 4.66 5.07 8.38 14.38 20.85 28.69 41.69 63.77 27.61 8.23 14.91 Std Dev 0.22 0.32 0.35 0.39 0.65 0.65 1.34 1.49 2.06 3.92 0.95 0.76 0.66 Count 13 13 13 13 13 13 13 13 13 13 13 13 13
D-65

2004 ASPHALT FILM THICKNESS STUDY
Contractor Test Data (Based on Production Data)
State TOTAL ACeff ACeff PERCENTAGE PASSING SIEVE SA AFT Project AC (By Mix) (By Agg) #200 #100 #50 #30 #16 #8 #4 (SF/Lb) (Microns) VMA CSM #2 Average 5.93 5.00 5.31 4.97 7.52 13.83 24.26 35.96 51.91 67.26 28.30 9.16 14.45
Std Dev 0.27 0.27 0.30 0.39 0.90 1.07 1.05 1.30 1.78 2.58 1.57 0.61 0.41 Count 23 23 23 23 23 23 23 23 23 23 23 23 23
Bauerly #4 Average 5.41 4.94 5.22 6.05 10.36 21.29 41.36 52.57 60.93 70.71 38.13 6.68 14.26 Std Dev 0.18 0.19 0.21 0.41 0.74 2.40 3.00 2.50 2.27 2.20 2.27 0.43 0.70 Count 14 14 14 14 14 14 14 14 14 14 14 14 14
Bauerly #4 Average 4.95 4.43 4.66 5.21 8.80 17.20 30.50 41.90 54.30 70.20 31.97 7.13 14.45 Std Dev 0.22 0.22 0.24 0.53 0.92 1.55 2.27 2.69 3.02 3.49 2.43 0.56 0.60 Count 10 10 10 10 10 10 10 10 10 10 10 10 10
Bauerly #4 Average 5.33 4.94 5.22 4.83 7.89 16.67 32.89 44.78 54.56 65.22 31.14 8.19 14.23 Std Dev 0.23 0.36 0.39 0.50 0.78 1.58 2.47 3.07 3.54 3.60 2.46 0.60 0.66 Count 9 9 9 9 9 9 9 9 9 9 9 9 9
Bit Rdwys #2 Average 5.44 4.61 4.83 4.65 6.80 13.51 24.68 33.19 42.41 54.24 24.63 7.62 12.67 Std Dev 2.01 1.94 1.94 1.92 2.15 4.50 9.72 13.93 18.33 24.19 9.60 2.43 4.35 Count 11 11 11 11 11 11 11 11 11 11 11 11 11
Bit Rdwys #2 Average 5.76 4.84 5.13 3.60 6.20 13.80 26.10 35.50 46.85 63.75 25.26 9.92 14.43 Std Dev 0.31 0.29 0.32 0.50 0.70 0.95 2.38 3.12 3.69 4.25 1.79 0.75 0.68 Count 20 20 20 20 20 20 20 20 20 20 20 20 20
Bit Rdwys #2 Average 5.28 4.53 4.79 4.03 6.00 13.67 28.17 39.17 48.83 60.00 26.38 8.86 14.27 Std Dev 0.25 0.20 0.22 0.44 0.63 1.21 2.48 3.49 3.76 3.85 1.94 0.60 0.73 Count 6 6 6 6 6 6 6 6 6 6 6 6 6
Bit Rdwys #2 Average 5.39 4.51 4.76 4.16 7.12 13.29 20.59 28.12 41.24 62.65 24.96 9.31 14.46 Std Dev 0.25 0.33 0.36 0.44 0.60 0.69 1.66 2.12 2.95 4.01 1.45 0.74 0.53 Count 17 17 17 17 17 17 17 17 17 17 17 17 17
D-66

2004 ASPHALT FILM THICKNESS STUDY
Mn/DOT Test Data (Based on Production Data)
State TOTAL ACeff ACeff PERCENTAGE PASSING SIEVE SA AFT Project AC (By Mix) (By Agg) #200 #100 #50 #30 #16 #8 #4 (SF/Lb) (Microns) VMA
Bit Rdwys #2 Average 6.16 5.71 6.09 9.11 11.43 12.86 14.00 15.00 18.14 29.29 31.77 9.49 17.17 Std Dev 0.13 0.13 0.15 1.37 1.72 1.68 1.83 1.83 2.12 2.43 4.20 1.35 1.63 Count 7 7 7 7 7 7 7 7 7 7 7 7 7
Bit Rdwys #2 Average 5.80 4.72 5.01 5.75 8.83 18.50 33.83 44.83 55.83 70.17 34.01 7.18 14.37 Std Dev 0.23 0.27 0.30 0.42 0.41 0.55 1.17 1.33 1.17 1.83 1.02 0.58 0.82 Count 6 6 6 6 6 6 6 6 6 6 6 6 6
McNamara Average 5.13 4.47 4.71 4.70 7.33 13.67 23.67 34.33 49.67 65.00 27.37 8.39 15.50 Std Dev 0.21 0.15 0.17 0.26 0.58 0.58 1.15 2.31 4.73 6.56 0.87 0.45 1.77 Count 3 3 3 3 3 3 3 3 3 3 3 3 3
McNamara Average 5.79 4.98 5.28 5.42 8.33 14.67 25.33 37.44 53.89 69.00 30.15 8.55 15.60 Std Dev 0.23 0.31 0.34 0.38 0.50 1.00 1.41 2.65 4.04 3.67 1.68 0.63 0.55 Count 9 9 9 9 9 9 9 9 9 9 9 9 9
McNamara Average 5.93 5.07 5.39 5.47 7.00 14.00 29.00 42.67 55.67 68.33 30.21 8.68 15.03 Std Dev 0.06 0.06 0.06 0.25 0.00 0.00 1.00 1.53 2.31 2.89 0.36 0.19 0.45 Count 3 3 3 3 3 3 3 3 3 3 3 3 3
Midwest #1 Average 6.37 5.23 5.59 5.68 10.00 21.00 37.33 48.83 60.50 76.67 36.48 7.48 15.82 Std Dev 0.16 0.27 0.30 0.57 0.89 1.10 2.07 2.14 1.87 1.21 1.90 0.62 0.90 Count 6 6 6 6 6 6 6 6 6 6 6 6 6
Midwest #1 Average 6.18 5.10 5.44 5.90 9.44 20.33 36.56 48.22 58.67 70.33 35.94 7.38 14.67 Std Dev 0.18 0.18 0.20 0.58 0.73 1.12 1.94 1.86 1.58 2.40 1.82 0.42 0.81 Count 9 9 9 9 9 9 9 9 9 9 9 9 9
Midwest #1 Average 5.92 4.84 5.14 5.86 9.20 20.40 37.20 48.60 58.80 70.00 35.86 6.99 14.48 Std Dev 0.11 0.15 0.16 0.36 0.45 0.55 0.45 1.14 1.48 1.58 0.89 0.30 0.61 Count 5 5 5 5 5 5 5 5 5 5 5 5 5
D-67

2004 ASPHALT FILM THICKNESS STUDY Contractor Test Data (Based on Production Data)
State TOTAL ACeff ACeff PERCENTAGE PASSING SIEVE SA AFT Project AC (By Mix) (By Agg) #200 #100 #50 #30 #16 #8 #4 (SF/Lb) (Microns) VMA
Bit Rdwys #2 Average 6.24 5.73 6.11 8.49 10.71 12.57 13.57 15.00 17.86 28.29 30.16 10.06 17.13 Std Dev 0.28 0.29 0.33 1.20 1.70 1.90 2.30 2.31 2.19 2.21 4.10 1.69 1.36 Count 7 7 7 7 7 7 7 7 7 7 7 7 7
Bit Rdwys #2 Average 6.04 4.91 5.23 4.88 7.88 17.00 33.50 44.88 56.50 71.25 31.59 8.08 14.35 Std Dev 0.34 0.32 0.36 0.56 0.64 0.76 2.07 2.23 2.27 2.66 1.36 0.67 0.85 Count 8 8 8 8 8 8 8 8 8 8 8 8 8
McNamara Average 5.20 4.43 4.68 4.38 6.67 12.17 22.00 34.17 49.17 64.00 25.72 8.86 14.68 Std Dev 0.21 0.25 0.27 0.25 0.52 0.75 1.26 1.83 2.64 4.00 1.30 0.51 1.12 Count 6 6 6 6 6 6 6 6 6 6 6 6 6
McNamara Average 5.54 4.71 4.99 4.95 7.25 12.88 23.19 36.44 52.56 68.00 27.76 8.78 14.98 Std Dev 0.21 0.21 0.23 0.51 0.68 0.89 1.17 1.41 1.90 2.73 1.64 0.69 0.62 Count 16 16 16 16 16 16 16 16 16 16 16 16 16
McNamara Average 5.82 5.10 5.42 4.88 6.33 11.67 26.67 41.50 54.83 67.17 27.70 9.52 15.00 Std Dev 0.12 0.14 0.16 0.12 0.52 0.52 0.52 1.22 0.75 1.17 0.33 0.36 0.23 Count 6 6 6 6 6 6 6 6 6 6 6 6 6
Midwest #1 Average 6.10 5.30 5.64 4.20 8.44 18.56 35.11 48.11 59.44 74.89 31.99 8.61 15.82 Std Dev 0.14 0.21 0.22 0.40 1.01 1.24 1.96 2.15 1.59 1.54 1.62 0.58 0.61 Count 9 9 9 9 9 9 9 9 9 9 9 9 9
Midwest #1 Average 6.01 5.17 5.50 4.14 7.28 17.33 34.50 47.00 57.44 68.89 30.45 8.82 15.01 Std Dev 0.17 0.20 0.21 0.51 0.67 0.91 1.42 1.78 1.69 1.81 1.31 0.54 0.51 Count 18 18 18 18 18 18 18 18 18 18 18 18 18
Midwest #1 Average 5.80 4.95 5.25 4.41 7.83 17.92 34.58 47.08 57.83 70.17 31.45 8.16 14.79 Std Dev 0.10 0.20 0.21 0.44 0.72 0.90 1.62 1.73 1.40 2.12 1.40 0.68 0.50 Count 12 12 12 12 12 12 12 12 12 12 12 12 12
D-68

2004 ASPHALT FILM THICKNESS STUDY
Mn/DOT Test Data (Based on Production Data)
State TOTAL ACeff ACeff PERCENTAGE PASSING SIEVE SA AFT Project AC (By Mix) (By Agg) #200 #100 #50 #30 #16 #8 #4 (SF/Lb) (Microns) VMA Tower Average 5.38 4.45 4.70 6.80 9.50 14.75 23.75 33.00 48.00 71.25 30.95 7.40 14.75
Std Dev 0.21 0.19 0.21 0.26 0.58 0.96 1.71 1.63 1.63 1.26 1.39 0.08 0.72 Count 4 4 4 4 4 4 4 4 4 4 4 4 4
Tower Average 5.20 4.52 4.77 5.92 8.89 15.67 26.33 36.00 50.00 70.89 30.27 7.68 15.54 Std Dev 0.25 0.30 0.32 0.53 0.60 1.22 2.29 2.65 3.00 3.89 1.35 0.45 0.83 Count 9 9 9 9 9 9 9 9 9 9 9 9 9
Tower Average 5.81 5.21 5.53 6.15 10.13 22.30 39.52 51.48 61.43 71.57 37.38 7.21 16.08 Std Dev 0.26 0.28 0.31 0.37 0.63 1.02 1.81 2.17 2.57 2.89 1.62 0.34 0.52 Count 23 23 23 23 23 23 23 23 23 23 23 23 23
Tower Average 5.42 4.79 5.07 6.85 11.00 21.84 37.42 48.95 61.05 75.79 39.23 6.30 15.28 Std Dev 0.22 0.23 0.25 0.27 0.47 0.90 1.61 2.30 2.59 3.17 1.25 0.28 0.64 Count 19 19 19 19 19 19 19 19 19 19 19 19 19
Tower Average 5.27 4.63 4.89 6.37 10.00 20.00 34.67 45.67 57.33 72.33 36.43 6.54 14.37 Std Dev 0.25 0.29 0.32 0.86 1.00 1.00 1.53 3.06 4.16 4.04 1.98 0.39 1.42 Count 3 3 3 3 3 3 3 3 3 3 3 3 3
Tower Average 5.70 4.90 5.20 6.07 8.67 12.00 18.33 26.00 38.33 60.33 26.65 9.55 15.53 Std Dev 0.17 0.17 0.19 0.68 0.58 1.00 2.31 4.36 5.86 7.51 2.14 1.07 0.75 Count 3 3 3 3 3 3 3 3 3 3 3 3 3
RiverCity #3 Average 5.83 5.08 5.39 4.85 7.00 13.75 24.75 39.50 50.25 61.50 27.95 9.47 15.28 Std Dev 0.22 0.17 0.18 0.31 0.82 3.77 7.27 4.43 3.40 3.11 3.43 0.86 0.46 Count 4 4 4 4 4 4 4 4 4 4 4 4 4
RiverCity #3 Average 5.52 4.51 4.78 5.18 7.63 14.81 28.00 40.13 51.13 64.31 29.76 7.89 13.96 Std Dev 0.42 0.44 0.49 0.64 0.89 1.42 2.31 2.33 3.07 2.96 2.50 1.21 0.71 Count 16 16 16 16 16 16 16 16 16 16 16 16 16
D-69

2004 ASPHALT FILM THICKNESS STUDY
Contractor Test Data (Based on Production Data)
State TOTAL ACeff ACeff PERCENTAGE PASSING SIEVE SA AFT Project AC (By Mix) (By Agg) #200 #100 #50 #30 #16 #8 #4 (SF/Lb) (Microns) VMA Tower Average 5.43 4.48 4.73 5.63 8.25 13.75 21.75 32.00 47.25 72.00 27.78 8.31 14.60
Std Dev 0.26 0.17 0.19 0.43 0.96 0.96 2.06 2.31 3.20 3.56 2.05 0.37 0.36 Count 4 4 4 4 4 4 4 4 4 4 4 4 4
Tower Average 5.29 4.64 4.90 5.52 8.39 15.06 24.89 35.00 48.67 69.78 28.85 8.30 15.05 Std Dev 0.28 0.24 0.26 0.50 0.61 1.00 1.60 2.03 2.22 2.84 1.36 0.59 0.60 Count 18 18 18 18 18 18 18 18 18 18 18 18 18
Tower Average 5.67 5.29 5.61 5.75 9.62 22.18 39.13 50.87 60.95 71.03 36.28 7.53 16.01 Std Dev 0.19 0.22 0.23 0.35 0.63 1.00 1.52 1.76 1.92 2.31 1.41 0.37 0.45 Count 39 39 39 39 39 39 39 39 39 39 39 39 39
Tower Average 5.44 4.90 5.18 6.30 10.33 21.48 36.25 48.03 59.90 74.35 37.52 6.73 15.31 Std Dev 0.17 0.14 0.16 0.29 0.47 0.64 1.32 1.86 2.15 2.38 1.04 0.26 0.47 Count 40 40 40 40 40 40 40 40 40 40 40 40 40
Tower Average 5.30 4.72 4.98 5.82 9.33 19.50 33.50 44.17 55.83 70.17 34.62 7.02 14.25 Std Dev 0.23 0.19 0.21 0.58 1.03 1.05 1.87 2.71 3.43 4.40 2.00 0.37 0.64 Count 6 6 6 6 6 6 6 6 6 6 6 6 6
Tower Average 5.57 4.80 5.08 5.81 8.18 12.73 19.09 27.18 40.82 64.09 26.54 9.35 15.42 Std Dev 0.21 0.13 0.14 0.30 0.60 0.79 1.22 2.04 3.06 4.44 1.17 0.59 0.50 Count 11 11 11 11 11 11 11 11 11 11 11 11 11
RiverCity #3 Average 5.90 5.18 5.51 4.57 6.67 13.33 24.33 39.67 50.67 62.50 27.16 10.00 14.97 Std Dev 0.37 0.24 0.27 0.39 0.82 3.67 6.25 3.61 2.73 3.08 3.20 1.40 0.64 Count 6 6 6 6 6 6 6 6 6 6 6 6 6
RiverCity #3 Average 5.56 4.72 5.00 4.39 6.60 13.83 28.07 40.90 52.33 65.10 27.73 8.81 14.44 Std Dev 0.35 0.37 0.41 0.37 0.72 1.05 1.86 2.20 2.72 2.92 1.55 0.95 0.61 Count 30 30 30 30 30 30 30 30 30 30 30 30 30
D-70

2004 ASPHALT FILM THICKNESS STUDY
Mn/DOT Test Data (Based on Production Data)
State TOTAL ACeff ACeff PERCENTAGE PASSING SIEVE SA AFT
Project AC (By Mix) (By Agg) #200 #100 #50 #30 #16 #8 #4 (SF/Lb) (Microns) VMA RiverCity #3 Average 5.80 4.30 4.57 4.83 8.00 13.67 22.00 31.00 47.00 72.33 27.52 8.13 15.50
Std Dev 0.35 0.36 0.40 0.42 1.00 1.53 2.00 2.00 2.00 1.53 2.24 1.12 0.56 Count 3 3 3 3 3 3 3 3 3 3 3 3 3
RiverCity #3 Average 5.93 4.55 4.84 5.37 8.17 14.83 22.17 31.33 47.00 72.50 28.88 8.22 15.02 Std Dev 0.15 0.14 0.15 0.75 1.33 1.17 1.17 1.37 1.90 3.27 2.46 0.92 0.88 Count 6 6 6 6 6 6 6 6 6 6 6 6 6
RiverCity #3 Average 5.83 4.90 5.20 4.75 7.75 15.75 30.75 43.50 56.75 72.25 30.48 8.31 14.90 Std Dev 0.29 0.26 0.29 0.30 0.50 0.50 1.26 2.65 2.87 3.77 1.04 0.28 0.55 Count 4 4 4 4 4 4 4 4 4 4 4 4 4
RiverCity #3 Average 5.50 5.02 5.31 5.68 10.08 19.58 30.73 40.46 54.23 75.27 34.22 7.58 16.08 Std Dev 0.20 0.31 0.33 0.46 0.80 1.30 1.80 2.00 1.88 3.28 1.70 0.70 0.64 Count 26 26 26 26 26 26 26 26 26 26 26 26 26
RiverCity #3 Average 5.93 5.42 5.76 5.60 8.17 19.50 35.83 47.67 57.67 68.33 34.21 8.21 16.18 Std Dev 0.26 0.29 0.33 0.85 0.75 2.07 2.93 2.58 3.39 3.50 2.32 0.35 0.44 Count 6 6 6 6 6 6 6 6 6 6 6 6 6
RiverCity #3 Average 5.67 5.15 5.46 5.25 8.09 18.36 34.45 47.00 58.27 70.73 33.09 8.03 15.94 Std Dev 0.33 0.39 0.43 0.38 0.54 1.57 2.62 3.49 4.24 4.45 1.99 0.47 0.80 Count 11 11 11 11 11 11 11 11 11 11 11 11 11
D-71

2004 ASPHALT FILM THICKNESS STUDY
Contractor Test Data (Based on Production Data)
State TOTAL ACeff ACeff PERCENTAGE PASSING SIEVE SA AFT
Project AC (By Mix) (By Agg) #200 #100 #50 #30 #16 #8 #4 (SF/Lb) (Microns) VMA RiverCity #3 Average 5.88 4.58 4.87 4.40 7.17 13.00 21.00 30.83 46.50 71.83 25.94 9.19 14.95
Std Dev 0.24 0.15 0.17 0.36 0.98 1.55 1.55 1.47 1.22 1.83 1.90 0.84 0.53 Count 6 6 6 6 6 6 6 6 6 6 6 6 6
RiverCity #3 Average 5.78 4.61 4.89 4.48 7.22 13.33 20.67 29.89 44.44 68.89 25.94 9.24 14.90 Std Dev 0.25 0.19 0.21 0.75 0.97 0.87 0.87 0.78 1.67 2.37 2.15 0.78 0.69 Count 9 9 9 9 9 9 9 9 9 9 9 9 9
RiverCity #3 Average 5.70 4.90 5.20 3.88 6.40 14.80 30.00 44.00 57.20 72.60 27.95 9.06 14.60 Std Dev 0.16 0.19 0.20 0.29 0.55 0.45 0.71 1.22 1.30 1.67 0.75 0.50 0.41 Count 5 5 5 5 5 5 5 5 5 5 5 5 5
RiverCity #3 Average 5.61 5.15 5.46 4.94 8.81 17.73 29.17 39.65 53.88 74.79 31.41 8.48 16.08 Std Dev 0.22 0.36 0.39 0.34 0.73 1.36 1.88 1.88 1.73 2.74 1.52 0.75 0.71 Count 48 48 48 48 48 48 48 48 48 48 48 48 48
RiverCity #3 Average 5.78 5.50 5.84 4.81 7.33 18.33 34.33 46.44 55.00 65.33 31.63 9.01 15.99 Std Dev 0.22 0.28 0.31 0.28 0.50 2.45 3.35 2.55 2.55 2.92 1.98 0.62 0.43 Count 9 9 9 9 9 9 9 9 9 9 9 9 9
RiverCity #3 Average 5.68 5.24 5.56 4.96 7.56 17.67 33.67 46.72 57.83 69.83 31.92 8.50 16.01 Std Dev 0.33 0.34 0.37 0.18 0.62 1.85 2.33 2.08 2.23 2.48 1.52 0.62 0.73 Count 18 18 18 18 18 18 18 18 18 18 18 18 18
Note: Additional data provided by MnDOT was used in the main body of this report. That data is about comparisons of agency and contractor cores and tests on split samples. The amount of data is quite large and, as such, the detailed data is not
included in an appendix. The report authors can be contacted if interested.
D-72

E-1
APPENDIX E Code of Federal Regulations (CFR): 23 CFR 637
“Construction Inspection and Approval” “Subpart B: Quality Assurance Procedures for
Construction”
637.201 Purpose.
To prescribe policies, procedures, and guidelines to assure the quality of materials and
construction in all Federal-aid highway projects on the National Highway System.
637.203 Definitions.
Acceptance program. All factors that comprise the State transportation department's
(STD) determination of the quality of the product as specified in the contract
requirements. These factors include verification sampling, testing, and inspection and
may include results of quality control sampling and testing.
Independent assurance program. Activities that are an unbiased and independent evaluation of all the sampling and testing procedures used in the acceptance program. Test procedures used in the acceptance program which are performed in the STD's central laboratory would not be covered by an independent assurance program.
Proficiency samples. Homogeneous samples that are distributed and tested by two or more laboratories. The test results are compared to assure that the laboratories are obtaining the same results.
Qualified laboratories. Laboratories that are capable as defined by appropriate programs established by each STD. As a minimum, the qualification program shall include provisions for checking test equipment and the laboratory shall keep records of calibration checks.
Qualified sampling and testing personnel. Personnel who are capable as defined by appropriate programs established by each STD.
Quality assurance. All those planned and systematic actions necessary to provide confidence that a product or service will satisfy given requirements for quality.

Quality control. All contractor/vendor operational techniques and activities that are performed or conducted to fulfill the contract requirements.
Random sample. A sample drawn from a lot in which each increment in the lot has an equal probability of being chosen.
Vendor. A supplier of project-produced material that is not the contractor.
Verification sampling and testing. Sampling and testing performed to validate the quality of the product.
637.205 Policy. (a) Quality assurance program. Each STD shall develop a quality assurance program which will assure that the materials and workmanship incorporated into each Federal-aid highway construction project on the NHS are in conformity with the requirements of the approved plans and specifications, including approved changes. The program must meet the criteria in §637.207 and be approved by the FHWA.
(b) STD capabilities. The STD shall maintain an adequate, qualified staff to administer its quality assurance program. The State shall also maintain a central laboratory. The State's central laboratory shall meet the requirements in §637.209(a)(2).
(c) Independent assurance program. Independent assurance samples and tests or other procedures shall be performed by qualified sampling and testing personnel employed by the STD or its designated agent.
(d) Verification sampling and testing. The verification sampling and testing are to be performed by qualified testing personnel employed by the STD or its designated agent, excluding the contractor and vendor.
(e) Random samples. All samples used for quality control and verification sampling and testing shall be random samples.
637.207 Quality assurance program.
(a) Each STD's quality assurance program shall provide for an acceptance program and
an independent assurance (IA) program consisting of the following:
(1) Acceptance program.
(i) Each STD's acceptance program shall consist of the following:
(A) Frequency guide schedules for verification sampling and testing which will give general guidance to personnel responsible for the program and allow adaptation to specific project conditions and needs.
E-2

(B) Identification of the specific location in the construction or production operation at which verification sampling and testing is to be accomplished.
(C) Identification of the specific attributes to be inspected which reflect the quality of the finished product.
(ii) Quality control sampling and testing results may be used as part of the acceptance decision provided that:
(A) The sampling and testing has been performed by qualified laboratories and qualified sampling and testing personnel.
(B) The quality of the material has been validated by the verification sampling and testing. The verification testing shall be performed on samples that are taken independently of the quality control samples.
(C) The quality control sampling and testing is evaluated by an IA program.
(iii) If the results from the quality control sampling and testing are used in the acceptance program, the STD shall establish a dispute resolution system. The dispute resolution system shall address the resolution of discrepancies occurring between the verification sampling and testing and the quality control sampling and testing. The dispute resolution system may be administered entirely within the STD.
(iv) In the case of a design-build project on the National Highway System, warranties may be used where appropriate. See 23 CFR 635.413(e) for specific requirements.
(2) The IA program shall evaluate the qualified sampling and testing personnel and the testing equipment. The program shall cover sampling procedures, testing procedures, and testing equipment. Each IA program shall include a schedule of frequency for IA evaluation. The schedule may be established based on either a project basis or a system basis. The frequency can be based on either a unit of production or on a unit of time.
(i) The testing equipment shall be evaluated by using one or more of the following: Calibration checks, split samples, or proficiency samples.
(ii) Testing personnel shall be evaluated by observations and split samples or proficiency samples.
(iii) A prompt comparison and documentation shall be made of test results obtained by the tester being evaluated and the IA tester. The STD shall develop guidelines including tolerance limits for the comparison of test results.
(iv) If the STD uses the system approach to the IA program, the STD shall provide an annual report to the FHWA summarizing the results of the IA program.
E-3

(3) The preparation of a materials certification, conforming in substance to Appendix A of this subpart, shall be submitted to the FHWA Division Administrator for each construction project which is subject to FHWA construction oversight activities.
(b) In the case of a design-build project funded under title 23, U.S. Code, the STD's quality assurance program should consider the specific contractual needs of the design-build project. All provisions of paragraph (a) of this section are applicable to design-build projects. In addition, the quality assurance program may include the following:
(1) Reliance on a combination of contractual provisions and acceptance methods;
(2) Reliance on quality control sampling and testing as part of the acceptance decision, provided that adequate verification of the design-builder's quality control sampling and testing is performed to ensure that the design-builder is providing the quality of materials and construction required by the contract documents.
(3) Contractual provisions which require the operation of the completed facility for a specific time period.
[60 FR 33717, June 29, 1995, as amended at 67 FR 75934, Dec. 10, 2002]
637.209 Laboratory and sampling and testing personnel qualifications.
(a) Laboratories.
(1) After June 29, 2000, all contractor, vendor, and STD testing used in the acceptance decision shall be performed by qualified laboratories.
(2) After June 30, 1997, each STD shall have its central laboratory accredited by the AASHTO Accreditation Program or a comparable laboratory accreditation program approved by the FHWA.
(3) After June 29, 2000, any non-STD designated laboratory which performs IA sampling and testing shall be accredited in the testing to be performed by the AASHTO Accreditation Program or a comparable laboratory accreditation program approved by the FHWA.
(4) After June 29, 2000, any non-STD laboratory that is used in dispute resolution sampling and testing shall be accredited in the testing to be performed by the AASHTO Accreditation Program or a comparable laboratory accreditation program approved by the FHWA.
(5) After September 24, 2009, laboratories that perform crash testing for acceptance of roadside hardware by the FHWA shall be accredited by a laboratory accreditation body that is recognized by the National Cooperation for Laboratory Accreditation (NACLA), is a signatory to the Asia Pacific Laboratory Accreditation Cooperation (APLAC) Mutual
E-4

Recognition Arrangement (MRA), is a signatory to the International Laboratory Accreditation Cooperation (ILAC) Mutual Recognition Arrangement (MRA), or another accreditation body acceptable to FHWA.
(b) Sampling and testing personnel. After June 29, 2000, all sampling and testing data to be used in the acceptance decision or the IA program shall be executed by qualified sampling and testing personnel.
(c) Conflict of interest. In order to avoid an appearance of a conflict of interest, any qualified non-STD laboratory shall perform only one of the following types of testing on the same project: Verification testing, quality control testing, IA testing, or dispute resolution testing.
[60 FR 33717, June 29, 1995, as amended at 72 FR 54212, Sept. 24, 2007]
[Source for 23 CFR 637: http://ecfr.gpoaccess.gov/cgi/t/text/text-idx?c=ecfr;sid=b64f282660e0a323b33aab7067e97f6f;rgn=div5;view=text;node=23%3A1.0.1.7.25;idno=23;cc=ecfr]
E-5

F-1
APPENDIX F Terminology Associated with Precision Statements
Precision statements for various hot mix tests are of interest in this study and report. Thus, a few definitions are in order (from American Society for Testing and Materials (ASTM) C 670 and E 177): • “The precision of a measurement process…is a generic concept related to the
closeness of agreement between tests results obtained under prescribed like conditions from the measurement process being evaluated. … The greater the dispersion or scatter of the test results, the poorer the precision.”
• “One-sigma limit (1S)—the fundamental statistic underlying all indexes of precision is the standard deviation of the population of measurements characteristic of the method when the latter is applied under specifically prescribed conditions (a given system of causes). The terminology ‘one-sigma limit’ is used in Recommended Practice E 177 to denote the estimate of the standard deviation or sigma that is characteristic of the total statistical population.”
• “Single operator one-sigma limit—the one-sigma limit for single operator precision is a quantitative estimate of the variability of a large group of individual test results when the tests have been made on the same material by a single operator using the same apparatus in the same laboratory over a relatively short period of time.”
• “Multi-laboratory one-sigma limit—the one-sigma limit for multi-laboratory precision is a quantitative estimate of the variability of a large group of individual test results when each test has been made to make the test portions of the material as nearly identical as possible. Under normal circumstances the estimates of one-sigma limit for multi-laboratory precision are larger than those for single operator precision, because different operators and different apparatus are being used in different laboratories for which the environment may be different.”
• “Field versus laboratory tests—precision indexes for ASTM methods are normally based on results obtained in laboratories by competent operators using well-controlled equipment on test portions of materials for which precautions have been taken to assure that they are as nearly alike as possible. Such precautions and the same level of competence may not be practicable for the usual quality control or routine acceptance testing. Therefore, the normal testing variation among laboratories engaged in quality control and acceptance testing of commercial materials may be larger than indicated by the relationship derived from the one-sigma limit for multilaboratory precision. In this case it is recommended that studies be made to determine the one-sigma limit for tests made under field conditions and realistic adjustments in specification tolerances be made accordingly.”

• “Two Standard Deviation Limits (2s) – Approximately 95% of individual test results from laboratories similar to those in an interlaboratory study can be expected to differ in absolute value from their average value by less than 1.960 s (about 2 s). [This index is known as repeatability.]” • “Difference Two Standard Deviation Limit (d2s) – Approximately 95% of all pairs of test results from laboratories similar to those in the study can be expected to differ in absolute value by less than 1.960√2 s (about 2√2 s) = 2.77 s (or about 2.8 s). This index is also known as the 95% limit on the difference between two test results [or reproducibility].”
F-2