Embed Size (px)
Citation preview

\ ! c . l l ) cc r \ N lak lng' ! 1 , 1 . . 1 . \ o : , 1 9 l t {
Statistical Approachesto the Analysisof Receiver OperatingCharacteristic (ROC) CurvesBqrburu .1. Mcm"eil, M.D., Ph.D.,anrJ James A. Hanlev, Ph.D.
tn this article we review published and st.rn'e unpubiished work in statistical analyses
of ROC curves. We describe both single and jgint indices and indicate the
approaches that have been taken to consider between-reader variations and correla-
tions, within-reader variations, and variations and correlations between cases'We then discuss in detail a single index. the IP ratio at a fixed FP ratio (desig-
nated ZPr"), or the FP ratio at a fixed IP ratio (designated FPTp). We show how to
caiculate confidence limits around cnv point on the curve; we further show, using the
conventional Dorl 'man and Ail program and the jackknifing technique, how to cal-
culate these confidence limits for multiple curves derived from the same sample of
patients. (Med Decis Making 4:137-150' 1984)
Over the past 20 years investigators have proposed a number of indices to
describe receiver operating characteristic (ROC) curves' and have developed
statistical techniques to compare two or nlore curves [l-3]. In this article we
will briefly review past work in this field and wil l indicate an approach to
dealing with the problem of comparing differences between two or more
ROC curves at a single operating point in either the true positive ( IP) or
false positive (FP) dimelsion. We shall f irst review commonly used indices
and discuss their statistical evaiuation for experiments with unpaired and
with paired designs.
Indices to Describe ROC Curves
Anre-RErerro MresunEMENTS. Much recent work has involved the
This u 'ork was supported in part b,v a grant f ronl the Hart ford Foundat ion and the
Nat ional Cancer Inst i tute (CA 28847).
From the DepzLrtmenrs of Radiology and Preventive Medicine and Clinical Epidemiology,
Harvard Medical School and the Br igham and Women's Hospi ta l , and the Department of Epi-
demiology and Heal th, McGi l l Univers i ty . Please address requests for repr ints to Dr. McNei l ,
Department of Radiology, Harvard Medical School , 25 Shattuck Street , Boston, Massachu-
set ts 02115. USA.

138 McNEIT exo HaNLPY
area under the ROC curve. When discrete rating dat-a are used (e.g., 5-point
or 6-point rating scales for radiology imaging exr-leriments), and when ROC
curves are assumed to be based on two underlying Caussiarr distributions, a
maximum likelihood estimation program b-v Dorfrnan and A1f [4] can be
used to fit data points to a smooth curve and to derive thereby (along with
other indices) the area under this fitted curve and its associated standard
error. This area is designated A- and ranges in value from 0.0 to 1.0.
If the ROC curve is drawn by connecting the pairs of observed TP and
.FP ratios, and if the trapezoidal areas are summed, the resulting non-parametric area is designated P(A).The common availabil ity of the Dorf-man and Alf program, underestimation of the area, and undue dependenceon extreme points have decreased the use of the P(,4 ) index for rating data.
When continuous dala are available (as from chemistry laboratory tests,white cell counts, individualized predictions from logistic regression or dis-
criminant analysis) and ROC curves are created, no assumptions on under-
lying distributions need be made to obtain area measurements. Instead,
Bamber's recognition of the equivalence between the area under the ROC
curve and the Wilcoxon statistic Zallows immediate and direct calculation
of W and hence the area [5]. Hanley and McNeil 's [6] derivation of a closed
form approximate expression for the standard error associated with the
Wilcoxon statistic can be used to approximate the standard error of the
area.
SropE-RrrerED AND INrrRcspr-RELATED INorces. When ROC curves
are assumed to be based on underlying Gaussian distributions, the expected
ROC points should follow a straight line when plotted on binormal coordi-
nate paper t2l . This assumption has led to the development of a series of
indices related to the slope and intercept of the straight line fit to the
observed ROC points. In general, these are derived after observed data are
fitted with the Dorfman and Alf program. The true slope of the l ine is desig-
nated b and its true intercept a (estimates of these are designated d and b;
however, for simplicity, throughout this manuscript the estimate sign will
be omitted and all symbols a and b will designate estimates); a divided by b
is called Am, an index commonly used in radiology phantom studies. Con-
ceptually, Am is a form of a standardized difference between the means oftwo normal distributions (which may have different variances). Otherderived indices are also available (see [2] for a complete summary). The
Dorfman and Alf maximum likelihood program provides estimates for a
and b,var(a) , var(b) , and covar(4, b) . E i ther of the above pai rs of ind ices(e.g., Am and the slope or a and b), or any other pair derived from them, is
sufficient to describe fully a binormal ROC curve.
Statistical Tieatment: Area Index
UNpnrnrp Dara. When the area index is used and we have only one
rea(variing
andTheDorstatbether
Irvhiexprelacovingsistfearareiculiqua
Coris t lcandenequoperatiuncbycorhor
Allinvancmacur

serlrl€poru SurEurut o,rl oql JoJ seeJe aqt q8noqtle puu 'ssoJJ lqElru sa^JnJ
lou o/ru 'alduexe ro; 'sasel auos ul 'Ja^a,4Aoq 'es€3 aql oq sfeatp tou,(eruqJnS 'a^JnJ altlua eql go uoudt:rsap E ut to 'a^JnJ
JOU alllue aql JoJ alue-urrograd Jo xepur ieuorsueulp-auo IIulaAo u€ uI palselelul sI roleEtlsanutaql t"qt eunsse senbruqcel IeJrlsrlels Eurllnser pue saJIpuI a^oqe eql Jo I1y
xapuJ tulod dJ
'JeAe,^(\oq
'ayqepe,re .{lproua8 la,{ lou st stqt i[91] sired ldocralut-edols pelelaJroJ
o,4^i aleuusa o1 qreordde JIV pu€ UPLUJJoC (.leuolsuatulp-o,{\1,, u Sutsn fq
{ro^\ srqt pepuelxe sPI{ zlaIAI 'etep perred rod '[6'8] e^rnJ 3Od 3ut,{papunotues aql uoJJ a^Irap (sacrpur ,(ruruurns tlaql oJuaq pue) elep alecs Eutler
Jo slas o^u oql Jr uorlnqlrtstp arunbs-rqc e s,^ olloJ leqt Jllsllsls tsal u pado-la^ap seq z1a;41 'srted tdactatui-adols Jo uoslJudruoc partedun toC ('1enba
aq ol slueluaJnseatu Eete JoJ ',,nolaq pal€Jlpul s€ ',{r€sseJau lou sl sJuep-rJuroJ srql) 'sa,rrnc eql Jo eJuaptcutor alaldruoJ € sl eJaql JI {1uo Tsva uet
saAJnJ o,r1 uae,rleq flrluapr teql uI qreorddu I€JIlsItels snoro8tr lsou aql sI
sldacratur puu sadols Jlaql qloq uo {lsnoauellnuls selrnJ 3gy Eutreduo3
xepul 1dacra1u1-adopg
'ss;sse ol llnJrJJrp asr,$leqlo st lEql ,{lttuenb
E 'ses€J erues aql 8urfpn1s.{q paonpur sueJs uaa,ln}aq uolle{arJoo aql Eutlelnc-l"J Jo poqlau elqlseal arotu B Pelse8Ens [t] tlaruclt pue ,{a1ueg 'xaput eale
aql Jod '[1] (,(cualstsuoJ JapEeJ-uea,,rrtaq) sesut Jo las etues aql peeJ sJapEaJ
a1dr1lnur Sur,req , q pacnpur s3tuEIJe^oJ pue seJuelJs^ oql pue i(.{rualsts-uoJ rapeaJ-urqlr,u) aJuo ueql aJotu saseJ Jo les etues eql pBeJ :apear e 8ut-,r,uq ,(q peJnpur eJuBueA eql isasec aues aql Sutsn .{q peJnpul saJu€lJE^oJpue saJu?rJ€^ eql :uoslJuduroc perted u ut luasard aq .{utu leql (suotlelar-roJ pel€rJosse pue) seJueIJ€A 3o sad,{1 eeJql lunoJJe olul al€l o1 uotssardxapraua8 e papr,tord a,ruq san8ualloJ pu" sle,\\S 'pasn xapul aql Ja^eleq^\'lynl;;rp eJoru eJe suostredruol parted toJ slsel IEJllsll€lS
'vlvc aaursd
'ra,u.od pue ezrs aldues atetullsa ot fqaJeqlpue roJJO pJupuels aql JoJ uotssardxa tuJOJ pJSolJ e opt,ro:d ol posn eqoslu ueJ Jrlsrluls uoxorli[ eql '[9] sluaueJnsuatu Jo lstsuof, etup JI 3l]sllels
uoxoJlri6 aqt uroJJ ro 's8utler Jo lslsuoJ Bl€p JI urerSord JIV pue uutuJJo(l
aql uoJJ .{ltrarrp peululqo aq u€J sJoJJa pJupuets pal€tJossu pue seeJ€ aql'uorlnqrJlsrp
IEIuJou Jql Jo elqel oq1 qlltt oIIBJ IeJIIIJI aql Eutreduoo pue
(zeery - rea:y)gg
zeory Ieary= ollel [eJl]tlJ
€lnuloJ oqt Sutsn aJUaIJJJIp :taql 8ut-isat dq aperu eq ueo s€are ol.rl uaa,^Alaq suostrudruoc IPJI1SIluls
'(suotletru,t
repueJ-uae,rtaq alqt8tpau lnq Jap€el euo u€qt eroul a^eq 3,t\ JI Jo) Japeal
(r)
sl "ru
s0crp, JOJ
eqrr3q(Jo su-uoJq ̂q.ilP\ Iiq pt-Ersalar? P3q1 (
Jo se-IPIO
pelJasaAJrl
eql Jaql rpesoluorlE
JOU'Peal
-Jepr-slp I'slsa:'ulBp
aJual-JJO(-uou
PUE r
PJBPqll,l^3q ure 'su
JOdluroc
6tlsEAxnJ lod Jo srs,{'rvNv rYlu-srjvrs

l4O McNrrr eNp HeNtrv
may be allnost the same, in the clinical range of interest one may be superior Thto the other. In addition, even if two curves do not cross, one could imaginE Zr,that differences would exist at one point (the clinically relevant one, per- ch<haps) on the curve but would not be detected in any global test. In either of mathese two situations raw rating scale data may not ailow direct comparisons shcto be made, since it is unusuai for indentical interpretive critera (i.e., identi- (Mcal FP ratios) to exist in different experiments. In particular, this means that reathe observed TP ratio on one curve at a particular criterion cannot be cordirectly compared with that on another curve, because the associated FP an(ratios observed may be different. cor
CSF
Methods
In this section we elaborate an approach to comparing differences between thetwo ROC curves at one point (either TP or FP). This is also part of a com- (fr,prehensive computer package being prepared by Metz [0] . Our approach is Zrbased on fitted ?"P and FP ratios, obtained from fitted parameters from the meDorfman and Alf maximum likelihood estimation program for rating-based onROC curves [,4] . The method yields confidence intervals around true posi- bettive ratios at a fixed faise positive ratio (designated TPpp) or around false thepositive ratios at a fixed true positive ratio (designated FP7). Illustrative
examples are presented.The maximum likelihood estimation program of Dorfman and Alf pro-
vides parameters that aliow calculation of IP ratios at any FP ratio and anlthus provides the basis for comparing two ROC curves at either the same ratTP ratio or the same .FP ratio. ln brief, the relevant outputs for this purpose ateare: (1) a, the normai deviate value of the intercept of the ROC curve with se!the 7 axis; and (2) D, the slope of the ROC curve obtained from ROC curves ierplotted on normal deviate axes. The equation for this purpose in normal gldeviate space (Z) for the ZP ratio is:
Zr, - bZpp- a. (2) Pleval
The quantity Z7p on the Z scale can be converted to irP on the 0-10090 scale sol
by determining what percentage of the normal probabil ity distribution l ies ret
above (i.e., to the right oD Zrp. val
The Dorfman and Alf output also provides the variance and covarianceterms var(c) , var(b) , and covar(4, b) . These can be used to calculate the f ro
sampling variance or uncertainty of Z7p and thus of TP itself. This is done pu
in two steps. First we calculate a confidence interval for Z7p (in the Z scale),and second we transform the confidence interval back into the usual
0-10090 scale. The relevant equation for calculating the variance around aZ7p ratio is:
var(bZnr- o) : Zfnvar(b) + var(a) - 2Zepcovar(a, b). (3)

:sarlrluepr Euuno1lo; el{l asn a,tr sluauodtuoJ a^oq€ aql ulelqo oI (t)
'r,rl(z-t7)lr-nl: (zz- 'z) aS(c) (:n - to ' zq - tql n,.ot d IZZ -
(in _ to) nt + (.q _ tq)nt d !7 = (t7, r7) n,t(zo -tn) -d{Z(.q - 'ql = rZ, rZ
luql os '7p -d-472q:27 pue to -d.tZrq:r7 allJ,.'r a,{'\ asodrnd
srql JoJ '[61] urerSord gpy pue u€uJJoC 3.leuolsu3lrrlp-o,ll1,, s(zlal4l luoJJ
lndlno se ua,rrE sturet aJu€IJE^oJ pu€ aJuEIrE^ eql sasn poqlaru ttrJjrlult n^
(paJnpar) slqt alslnJlel ol sfe,tr o^\l are aJeql 'sluallud 3o saldures paleadar
uo pelplaJJoc eq 01 puet III^^ 7Z pue IZ 'seldur€s parrcd 8ut,t1oa.ut suos-r:edruoc rod '(€) uollunba uI s€ pal€lnrl€l qJea an (27)nt pue (r7)nt'
araqar 'rr,[(72)n^+(t7):r-r] ,{ldrurs sI seJuareJJlp aql Jo gg aqt 'sa1d
-rues (parrcdun 'luapuadapur) aleredes 3ut.t1o.tut s,dJ Jo suoslJedluoJ uI
Epr
IBns'(elr
auolaqlaJul
SsIIalEJ
Q\
'\il l€ru,
uorlenba Jo JolBulluouap 3q1 uI UOIIBIJPA JO SOJJnOS O^\1 Ja1l€l eql eroudl sa^ta,t\ luaruoru aql rod 'JepEOJ euo ulqll/t\ SEUtpeerar l€Je^es Jo sJap€eJ IuJaAos qlldaJe eJaql reqlaq^\ uo pue sluatled;o aldrues luaJeJJtp € Jo sluus aql uo pe1€ aso(-nlu^a serlrlepolu o,t\l luo{ aJB zZ pue t7 eq1 raqtaq,tl uo puadap III^\ oIIEJ ar.u'
I€JrlrJJ aql Jo rol"ulIuouep eql 'uollnqlJlslp IsIuJou aql o1 paJ"duoJ puB puE.
-olc
(r) "';?,f,tt : ,"eAIlr
palelnJpc st otteJ JEJIIIJJ Eut,to11o; aql aslg.'(sorler
drlr etues eql tE qloq 'zdJ pue r41 ''E'a) s.dJ paltlJ o,ttl uas,rttleq -ISo(
eJuaJeJJrp luectstuEts ,{1pct1st1e1s e sI aJeql Jal{leq/t\ lsel oI 'aleJs slql uo paslslsel uJoJJad ol eleudordde arour st 1t 'a1ecs
7 (papua-uado) aq1 uI sIJlaIu eql-ur,,(s aroru eq 01 pual suollnqltlslp Sutldures eql aJuls 'al"3s
dJ aW Jo dJZ sl t{:aql reqtlo uo pa:eduoc .{fiectlstlels eq uet (sluauuadxa luaJaJJIp omt ruor;) -uo
s.dJ palllJ olru 'Jlaslr dJ pue dJ7 uaanlaq uolleleJ auo-ol-auo e sI aJeql uaa/
asnsJag alr NoI U {OJ V rV S.dJ OiA,I CNIUVdI IOJ UOC SrSqI AJNVJIJINCIS
'luacrad 0S ruoJJ ,{e,rne a,totu senl€^ aql se flletcadsa
'rrrlauur,{se eq ilI1t\ soItBJ (dlr osl" pu?) dJ eql punoJe IB^JaluI aJuaplJuoJ
aq] ',{lpraueD 'salqet ,{lqtqeqord IeIuJou eql Eutsn 'dJ toJ sllull ra,e\ol pue dlraddn aql Sutlelsuerl Jo Jalleu eldruts E sr r'at, JoJ IP^JaluI sJuaplJuoJ aq lB pourplqo seq euo aou6 ('gE se ,trol s€ 1r JoJ ua^e IeIuJou ruau .{lqeuosea: luqlsuortnqrrtslp e^"q q puu t luql [g] ,(lpcrrtdure u^\oqs s"q zlal l 'ra'toarotr41) -llui'slepotu Eur.{yrapun eql Jo ssalpreEar 'suotlnqtrlstp u€Issn€D e^eq pFot{s suolfaql a8re1 sr aldues eql JI
'satelullsa pooqllslll tunrulxeru eJ€ q puz , saletu Jo lr-rlse reloru"J?d aql arurs :uollnqulslp lPtulou eql Jo selqel eql luorJ uasoqJ -rad
eq uur,.a1dr11nut,, et4l'grz),,?gglj!11 3o eldrlpru atuos + "a'\'drz autE
Jo AS aql yo aldr11nur ewos +dJZ sauloleq dJZ to! Ie^JeluI eJueplJuoJ aqJ JoIJ
lrl sa^un] Jod co sIsrTVNv lYJILsIrvJS

142 McNrrr eNo HeNrry
var (b ' - b ) = var (b r )+var (b . ) -2covar (b t , b . )v a r ( a r - a r ) : v a r ( a r ) + v a r ( a " ) - 2 c o v a r ( a , , a . )
covar ( t r , -b2 , ay-a) = covar (b , , a , ) -covar (b , , o r ) -covar (br , a r )+ covar(br, ar)
The second method is useful i f Metz's program is unavailable. We canapproximate var (21 - Z) by the method of jackknif ing (see Fleiss [ l l ] for ageneral introduction to jackknifing, and Efron [12], equations 6.11 and 6.17 ,for the jackknife variance in two-sample problems). When the rating datacome from n" normals and na abnormals, the jackknife method consists ofobtaining nN+ nA different estimates of Zr- 22 and using the quantity
E I ( Z t - Z ) - 1 z , i - z . l ) 2
as the jackknife variance of (Zy- Zr). The quantity (Zr- Z) is obtainedfrom the entire data set. The i th jackknife estimate (Zi- Zil is obtained byfitt ing two separate ROC curves to the data set (of n1,,+na-1 subjects) Ctformed by deleting the paired ratings of the i th subject from the original Aldata set. Although this may sound computer-intensive, the numbers of pairsof ROC curves to be fitted depend on the number of rating categories andnot on the number of patients. For example, data on a five-point ratingscale wil l involve at most l0 distinct values for each modality; the nn+n1,quantities being summed in equation (6) will occur in multiples.
Eq
ExrENsroN oF THE Mrrnoo ro Murrrprr Rr,tnrns. As we have done so va.
far, we still base the analysis on equation (4), but now need to include sid
between-reader (56r) and within-reader (Srr) variances. For this purpose we 5q
use equation (5) (Chapter 4) from Swets [], as shown here: 1.6
SEroi rn: 2" ' I s !** ,11 - t , * , ) * t i ' : * '
( l - ro, * , ) -51, , l t ' ' , (7)
L 'rb, ,r: the observable correlation between the Z7p's obtained when a set
of readers reads the same cases in the two settings
rc,wr:the observable correlation between the Z7p's obtained when asingle reader reads the same set of cases in two settings
S.2*,,:53+Si., the observable variance in Z7p that would be found byhaving one reader read once each of a set of different case samples
S3**,: Sj,+ S|,, the observable variance in Z7p that would be found byhaving one case sample read once by each of a set of different readers
S],:the observable variance in Z7p that would be found by having onereader read one case sample on two or more independent occasions
/ : the number of indeoendent readers
1 5 t
TheqttalcalO Z ,
whcalspith(we
(6)
Thdis
NcDir
nol

'[eluJou
flartuuap ol S Jo rnt?^ E pue Ierurouq€ .(larlulJep Jo sultur e11'1"dl11]j:j111
IS8S
IBIOI
z9
z9 fc
CF
zI
pasEesICpaseesrpuoN
su(euo
sJap,(q P
SAI,(q P
eu0
0*tu;1ug
oprg Eupra tulod-ealg B uo peululqo a^rnJ JOU 'I alqul
'8t'0 - anl€^ aql ;o lq8rr aql 01 .{llllqeqord aql sluasardar puu 'uollnqulslp
Ierrrrou Jo alqel aqr or Euu.ri;ar .{q iuaorad ?t'89 sauooeq 8t'0 - enp^ aqJ las €
'8r'0 - =LSg't-Gw'lDil'o : dtz
seluoraq (7) uotlunbg Pue St9'lslenbe (uortnqrrlsrp PtuJou eqlJo 0/oS saII qJIq^A a^oqe anl?^ at]J) dt7'01n9 e^\a
Jo orluJ dg ue ly 'sasodrnd a^I1€rlsnlll JoJ uoIIEInJIEJ pallulep euo rapls apnl
-uo)'ob11pue'0691 '0bg Jo sanle^drC WZelqej- uI u,rt\ol{s are,(aql lsanpn os al
4g Aue roJ soller dtdJ pue drz Jo uollulnrlss,tolle (6) pue (Z) suotlunbg
grno.0 : (q ,D)re^6 Nu )
Lg1o'o:(g)r'^ €lt'o=q Eull'
vL6O'0:\D)rE^ LS9'l:'� ou"SJIE(
:e1ep Sut,uolloJ eql saprzrord [7] uurSord poot{lle{Il tunrulx€lu JIV l,€ul:
pue uEtuJJoC aql 'I alqel uI €l€p e^Jnr JOU aldrues aql raplsuoC 'alun3 (s1c:
f,ou f{v No rNlod arcNIS v uo{ 'TIIII-I iIcNac[JNoJ Jo NoIrv-InJfYJ '{q ppeul
sllnsau
('seJns€eu Jeqro ot IIa^A (9)
,{lpnba ,(1dde feqt 'saJnseaur eoJe uo peseq er€ [1] ur saldruexa oql qEnoql
ua^a leql elou p1not{s repeal aq1) 'aceds dg-dJ aql uI uuql raqle: areds I
z ewurapsr.u 3rE setBrurlse sesEJ IIp ur lsluauodruoc Jer{lo 3t{1 Jo uoIIBInJIPJ JO S1
ro3 [1] ot peJJeJOJ sr JapBaJ oqJ 'al?Js dJz pepua-uado aqt .raJa:d ar'r sseJaq,{\ 31Ep
'alEJS drJ papua-pasolJ aql uI lro,rA l1e{Jld pue sla,lns 'oslv 'zq pue "q "o 'Ll't
'1, srelaure:ed lueuodtuoJ aql Jo saJuulJe^or Eutsn '.(lltctldrut ]I salelnlpJ E Jo
elnuJoJ eJueIJE^ Jno allq,tr "'-'.t uotl€larJoJ 3q1 Jo sulJal ur ,(ltnr1dxa >1pt uBc
]la{Jld pue sta,{\S (Z) pue lsluauoduroc eerql eql Jo qJeo ro3 sacuetren lenbaarunsse lte{3ld puu sl3.l.rs (1) :suotleueldxa o,trl seq uolle}ou luaJaJJIp eqJ'127-17)rc sE peqrJJsap a^Bq e^\ suollelnJl€3 osoq,^l,(ttluenb atues aql sI
(s1a1curq arenbs aql epISuI z^Z eW 3ur1et) (ril - ) r - I)'^
* iSZ fltluznb aql
wI sa^unJ Jod co srsrlYNv lYrlrsrrYrs
(t)

144 McNrtr,c.No HeNrry
Table 2. Predicted Thue-Positive Values at Fixed False-Positive Values,Using Equation (2)
FP f, u/0 l09o 20Vo
2,,TPSE of Zrc9590 CI on Z*95Vo Cl on TP
- 0.4868.440.26
( - 1.03, 0.07)(84V0,49Vo)
- 0.7477.U0.23
( - r . l e , - 0 . 2 8 )(8890 ,3990 )
- 1.068 5 . 5 4 -0 .35
( -1 .16 , -0 .36 )(96V0, 36Vo)
Rea
\\ irH i r
\t a:est r l
c l t rda t rAnla r (shovalr
The 95 percent confidence interval for Z7p is thus -0.48+ 1.96(0.2579), .,or ( - 0.99 to 0.03). Using the same merhod used to transform Z: - 0.48 to u^' '
a rounded ?"P value of 68 percent, we can transform the Z= -0.99 and ",.'
0.03 back to upper and lower ?"P limits of 84 percent and 49 percent. ;t-Table 2 summarizes the standard errors obtained in this wav for three
points on the above ROC curve. - 'De
Equation (3) gives confidence limits about this value as follows:
v ar ( Z 7) : (1.645)'� (0.04 6'7) + 0.097 4 - 2(1.645) (0.M78): 0.0665
SE(Zrp) = 0.25'79.
CoMp,lRrNc Ttvo Cunvss (UNrenEo Dnm) er ONr ?"Ppp. Table 3 dis-plays two sets of rating data for previously published results on gallium
Table 3. Ranking Data For an Unpaired Experiment [13]
Rating*-BWH3
NondiseasedDiseased
4l 9
I
A
I
Rating* -JHH
3
r36
4
125
s
tB'*'7
i'.
NondiseasedDiseased
J
l 8
BWH
a : 0.6665b : 0.4316
var(a) = 0.07234var(b) : 0 .03639covar(c, b) = 0.0163
J
J
JHH
a
b
var \o )var (b )covar(a, b)
1 l (r 2
T\\ C
graThct i r c0 . i 'l n t
26
0.76310.6969
0.18220.20210.125'7
i l = definitely abnormal; 5 - definitely normal
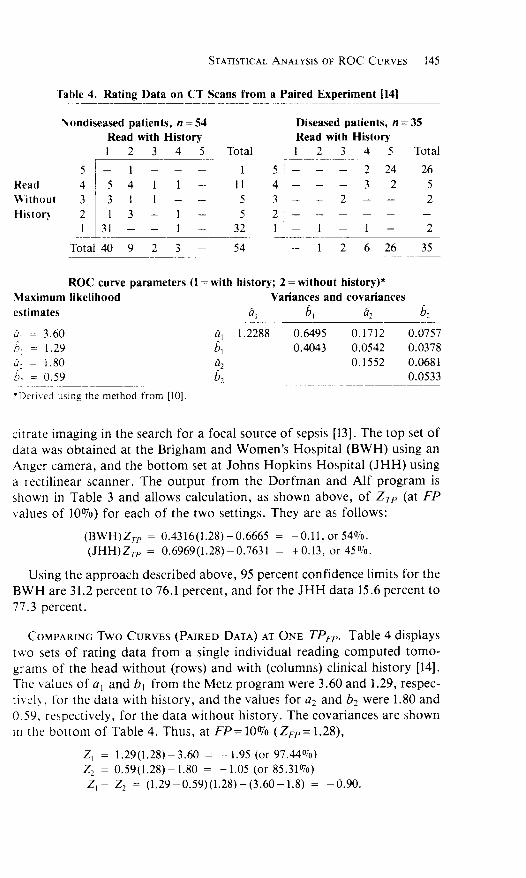
'06'0- = (e'r-os'E)-(sz't)(os'o- 6z'0 = 'z -'z(0ott'98 ro) 90't - = 08't -$z'1169'0 = zz
(onw'6 ro) S6'I - : 09't - (gZ't)AZ't = 'z
'(97'1:att1 o/t1l:d.:I lp 'snql 't alq€I Jo tuouoq aql uru,roqs ere saJusrJenoJ oql',{-rotsrq lnoqtt,r Etep aql roy'.{ya,ttlradsa:'69'gpue 08'I era,u z? pue e o JoJ sanl€^ eql puu ',{:o1srq qlr,r ulup aqt lo.1 '.i1a rtt-radsar '62'l pue 09'E aJa,r ruerSord zlehtr aqt urorg lq pue Ir Jo senl€,\ aqI'[y1] ,(rolsrq I€JrurlJ (surunloc) qtl^\ pue (s.tor) lnoqllt\ pear{ eql;o sruerB-oruol patnduroJ EuIp€eJ IEnpI^Iput a18uts u ruoJJ etep Eutler ;o slas o,\\lsfeldsrp t alq€I 'al6r; aNO rv (vrvq caurv4) siIAdnJ o,,rrJ cNI)rvdI IoJ
'tuaclad g'14
ol luacrad 9'gl €lpp HHf eql roJ pue'luatrad I'9L ol luaorod Z'Ie ar€ HlAgeql JoJ sluurl eJueprJuoc luac:ad 96
'a,toqu paqltJsap qreordde aql Sutsn
'0k9, ro'fl'0+ - tEgL'0- (sz't)osog'o - drz(HHt)'0/4vs ro 'll'0- : s999'0-(82'l)91€t'0 - drz(H,^Ng)
:s/r\olloJ se are feql 'sSutuas o^u eql Jo qJ"e loJ (01001 Jo senle.\
d.l ft) at7 Jo'anoqe u,toqs sP 'uoIlBInJIPs s,{\olp pue t elqul ul u,/r\oqssr urerEord JIV pue ueluJloq eql uoJJ lndlno eql 'teuu€os JeeuIIIlJal eEursn (gg1) ptrdsog surldog suqof tB las uolloq oqt pue '€retu€c ra8uy
ue Sursn (HAfg) p1rdso11 s.uatuol1 pue rueq8trg aql le paulelqo s3,{\ EtBp
;o tas dot aqJ '[gl] stsdas yo aornos IEJoJ 3 JoJ qtJeas aql ut EutEutul olsllll
[0t] ruo:J poqrau aqt Sutsn pa\uaqr
zlII
s
s7l
s
IUn-SIT
e Es0'0I890'08tE0'0LSL0'0
z99r'0zn90'0 Evon'jzrLr'0 96v9'0 88zz'r
tq.D
'gtD
6E'0 -
08'r -
67'�1 =
09't =
saf Brurlsapooqrla{!l urnurJxEl^l
'q'a,.q'D
eeJ
puloll'(6,
zg tg ,g
seJuaFBAoJ puB saJuBFuA
*(,{.rolsrq lnoqlr^{: Z :,ftols;q qlpr: I) sralautured aarnJ JOU
s€929
I-I
z-
plorsttzl.{.ro1sr11 qfFr pBaU
Sg: t/ 'stuallBd Peseaslq
E6 0t leloJ_
I
Ih
I
IBroJsnt.ZIf,.ro1sr11 qllar pBaU
tE : u'sluallBd PasuostPuol
v>
(0
(e€'liis
7C
IIIII
li lz€
),ls
1,7 7
zs97,
.i.ro1sr11
Inoqtr t\PBJU
[ttl tueuFadxg parEd u uorJ suBrs IJ uo BIB(I Eupuy 'p alqu1
sil sa^'dnJ 3ou Jo srsrlvNv 'rvcr.rsrlvt.s
t-I_
III

146 McNrtl aNo Haxrrv
The three subcomponents, calculated as for equation (5), yield values of0.3820, 1"0416, and 0.5877, so that equat ion (5) y ie lds
var (2, Zr t = ( t .28)) 0.3820 + 1.0416 - 2(1.28) 0.5811= 0.1630
SE(Zr- Z) - \0 .1630 = 0.40.
Thus the crit ical ratio is -0.90/0.40, or 2.25, indicating that at FP:l}qoZP's obtained with history are statistically higher.
With the jackknife technique, the paired ratings of successive patientswere eliminated, as described in the Appendix, to create 54 + 35 :89 differ-ent data sets, each with 88 patients. Using the steps in the Appendix, weobta ined the jackkni fe est imate of SE(.Z1 - Z) :V0.1966:0.44, which isonly l0 percent higher than the more parametric SE of 0.40 calculated bythe "paired binormal" model of Metz.
Discussion
The work was motivated by two concerns with the use of area indices forcomparing two ROC curves: (1) That two curves might cross and in suchcases similar areas might result; and (2) that even in the absence of crossingcurves similar areas might result when, in fact, statistical differences couldexist in the region of clinical interest. These concerns pointed to the need tomake comparisons at single points on either the TP or the FP axis. In theprocess of developing the analysis discussed here we realized that there wasa need to provide a brief overview of commonly used indices for ROC anal-ysis, whether paired or unpaired experimental designs were used.
The major point of our review and analysis is this: Once we assumebinormal distributions of an ROC curve, all statistical properties are deter-mined by the parameters s and b of the maximum likelihood fit to the data.This paper has emphasized the use of these parameters for calculating confi-dence limits around single ?"P or FP points onywhere along the ROC curve.Others, particularly Swets and Pickett [], have discussed confidence limitsexplicit ly in relationship to area measurements and IP points correspond-ing to observed ?"P-FP pairs.
To put this work in perspective it is worthwhile to summarize previouswork in the general area of statistical analyses of ROC curves. The workfalls along two lines: (l) the use of a single index (for example, the area or?"Ppp) versus joint indices (for example, slope and intercept); and (2) con-sideration of between-reader variations and correlations, within-readervariations, and variations and correlations between cases.
Swets and Pickett [] give formulas for single indices that cover all possi- NDble experimental designs. Hanley and McNeil [6] elaborated on statistical Dconsiderations relating to a specific single index, namely the area; becauseof the unique relationship of the area to the Wilcoxon statistic it is possible De
to calculate explicitly the associated standard error due to case sampling. histol
The sROCworkent inexpliccurvewerethe ja
tiple rMt
of coro n l y '
Orthis pspacetributnaturpriatethrou
To olfrom
(1)modahere iwhertjointl
differ
NDD
(2)De
withc

'sluarled r.{Jns a^rJ eJp eJeql :,{Jolslq
lnoqll{\ g pue f:o1srq ql!t\ 1 go s8urler qll,t stuatlsd po$aslpuou aloleq
s0sr.0_ ez.nr_ ez s-. t ^ !^ 8z16.r_ er2 ! t^ _ c- II S 9 Ze - t. Z 8 0V CIN
'z - tz ,'z lz',{rolsrq lnoq}r^\
E pue .ftolsrq qlp\ Z go sSutlur pa^IeJaJ oq,t luatlud paseaslpuou elalag'sluerlud a^rsseJf,ns 1no Surneal .(q pautulqo eJ? sles El€p ,lneu aqJ (Z)
'Eu11d
alqrss(asneJ:
IUJrlsr-rssod
Japsaj-uor (ro ?aJ
IJO,'r\SNOIA;
-puod
s1IluII'a^Jn3
-rJuoJ'ulep :-relep
e[unss
-lEuE:
S€1r\ AJ
3q1 ulol paerplno3SurssoqJns uroJ sa:
{q Patsr qJrr.a,t\ 'xI
-IAJJIP
stuarlr
6588.0_ S8Z0,t_ 9Zs Z -Z
I II S 9 ZE'z-tz 'z 9 , t z I
Eurtuy.{.ro1srq fnoqllA{
wt6t_ 9Z9Z I --E 7 6 0n
tz gr,zr3ut1ug
f,.ro1srq q1;tr1
CCN
'luarOJJIp
,(1tq8r1s are ,(aql 'snq1 'urerSord 21a61 aqi Jo unr a18uts E LUoJJ .{llutotpal€urlsa eJan t elq€I qlr,^A uorlJeuuos ur JeIlJea u,toqs asoql s€eJeqnA'ur?r3ord
JIV pue UEnIJJoC eql Jo sunJ aleredas o,{u Iuor; pe^IJop aJP eJOq
sanle^ zZ pue t7 at4t wqt e1o51 '(paseaslp: CI :pa$aslpuou: AN) .{lqepou
qJBe JoJ se^JnJ 369 aleredas tIJ ot pesn ere t elqel urorS eleq (1)'sarlrppou o.,\nt ,{q pelenp^a sluatled Jo les elues aql uoJJ
paurclqo sdJT om1 aql ot JeJaJ zZ pue t7 anql'l' '127-t7)n^ ul€1qo oI
anbpqra; aJlu)plJsf Jo uolluJlsnll :x;puaddy
'lsaJetur Jo sortur d,4 pue dJ le lnoq8norqt
cr't]aruur.{s aq o1 ,{1a1r1 eJou eJE suorlnqrrlsrp aldues oqt asneJaq oleud-ordde arotu suaas 'papua-uado arou Eutaq 'elels
Z eql '31BJS eqt Jo eJnteupesolc oqt Jo asnecaq 'luaJJad
0Ol punoJe puu luacrad 0 punoJe suollnqlJl-srp Eurldrues rrrlauru.{su Eurzreq ;o a8etue,rpesrp eql seq JetlEI aq1 'aoeds
d.:I-dJ Jeeurl eql ur ueql raqlu.r acuds Z aql u auop uaeq a,ruq raded stqlur apetu suosrreduror er{l Jo 11y
'Sutztseqdua qlro,u st lutod Jaqlo auo'Sutldurus asuo ol anp suoll€IJerr ,{1uo
reprsuoJ suerEord srH 'uaql uoJJ pe^IJap eq uec xaput a18uts fue asrnoc;oqEnoqtp '(ldacralur pue adols) saf,Ipul lutof paztseqdrua seq [Ot-g] ztaW
'lle{Jld pup sta,{,\S 3o qceordde leraua8 oql Sursn ,{q srapeat aldtt-lnu ot qreorddu srql puelxa ,(lsnotnqo plnoJ al6 'anbtuqcal Sutytu>11cet aqtqllm paldnoc uerSord JIV pu€ upruJJoq leuoltua^uoJ eqt asn o1 alqe eJa,^A 0-o0l =e,r 'sluarled
Jo slas etups at{l IUo{ paAIJap sdJ6r7 or*1 Eutreduor JoC 'a^lnf,
3ga ayEurs e uo turod .{ue lu sl€^ratul eJueplJuoJ JoJ s€lnurJoy ltrtldxosa,trE pue 'dtdJ ewlq srql 'xapur al8urs raqloue qlr,r sleap uotle8llsa^ut iue-serd aqa 'hl ttalctd pue sle,/r\S .{q patsaSSns sulnuloJ praua8 pus Jo lro,taql sluaualduot snqi U
'saseJ Jo las eruus aql uoJJ pa^lJep seArnJ JOH
roJ lnq 'seara qlr/r\ sl€3p osF [t] ilaxrlnl pue falueg ;o raded puoJes aqf .Io san
LVI S:r,\un] lou Jo slsA'IYNv lYlrrsrrYrs

I48 McNErr ,cNo HaNLr r
N D 3D
Dehistorlast fSimilvious
N D 4D
Dttory;
N D 4D
Dthisto
N D ID
Drtory
N D I
D
C(
The z
1 . ST
t q
\ O n t n O . € - $ C n $ - t . { $ o . . | ^ . 1 - t f , O- O c l o l cO @ ca. . . l O r O - . ] .O \O O $ - < f , €o \O 6 € @ O\ O O\ t <) - \O O\ -.-l \O \O \O O ro c . l - O r € O r € O \ C C \ C \ C $ r ^ r - O $ S6 . . t n o o 6 o r o o o . € @ o - r o . . l o o \ o€ . . I C . O O O O r O - O 5 - . O
= s = = S g E s E g S = S E s 3 g g s s .,- :..{.- ' .- -i - ' ^ -i - i .-r - ' -: ; ^' ^' -: ; .: ; ;
q)
z
N
N
I
\:'l
Ni
N
E N
.? N'
.ii,,ia
, N
v -
r . E
z z
o : "q 9 5
o . r. > q 2
a . a
a!
JI
t i
N
I
r.)
n € 6 r+ \O n O - O\ $ F- € \O cC oO O C 6 € -O :f, s. o F- t 6 <. r- r- O O o - a.l rO r- n € 6n \O r- @ a! r- € a- r- @ t € t O\ O. $ d r al or- @ oO O, O cO @ C\ cC € C) € O € cO € cO @ - t-o o o d - j d o d c j o - j o - : c l c l c l o o J o
l l l r l l l i l6 n n n n € € € $ $ $ h h o c € € r r a rcl € € cO € r- r F- h n 6 cl ot O\ O\.+ S 6l F l--.o 91 9! t! 6..{ q! 9! ^! Ol Cl Cl Cl Q a !a I o \o \o- O O O a a a O O O O O O O O O C - - -__i -_i _ -i __i - _ i -i - - --i J J i J J - J --il l l l i l l l
@ 6 € o \ - O € o \ O € - 6 - @ @ A @ a . l n 6o.l o al - \O o ol - o 6l @ o \O O - O - € \O O- O - O \ o O - O O - \ O O \ o O O O O r - o \ Oo, o\ o\ o o o. o. o o o. o 5 o o\ o. o. o. c\ 6r o\J - : - : ^ i ^ i - j - j ^ i - j - j 6 i - : ^ i , j - j - j - j - j ^ i - j
l l l l ! l
- n d - * * 6 o - - F o l 9 o 6 l c l - -- N
" 1 a n a a . 1 - 1 . 1 . ' 1 . ' l c ' I 1 a " 1 " 1 - f " n d j 1 aal * cl o $ * 6l o - a.l $ - <t $ n :l n o 6.1 S
A A N A A A A A A
z z z z z z z z z z z z z n3 . N4 , L
A

6961 '96r-L8n:9
loqr,{sd qtut t '"tep
poqleu Surteg 's1u,r:otur eJuoprJuoc Jo uorleurturalep pue .(:oeql uorlJolopleu8rs go sralarue.lud Jo uorterurtso pooqllalrl unurx?t\l :rf E JIV 'CC uetuJroq 't
BL6l'862-t8Z:8 pehl IrnN uruas 'srs,{yeue JOd Jo saldnur:d rrseg :EJ ztet\l '€
6L6l' lZI-60IitI Iolped 1sa.tu1'sanbtu-qro1 Sur8eu:r leJrpour Jo uort€nle^a eqt ol parldde srs,{1eue JOU :Vf sla,rs 'Z
Z86l ')rurapeJv :IroA ,na51 ',{:oaq1 uortrote6l
pu8rg ruo:j spoqtohl 'suats,{5 crlsou8er6 Jo uorlenlp^a :NU }telcrd 'Vt sle,$S 'I
saJuaJalau
'stuaururor 1n1d1aq srq roJ zlet\l 'E selreqJ 'rC ol patqepur ere sroqln€ aql
luaurEpal.noulry
S alq€I ur u,roqs sl (zZ -t7):ct' 3o uorretnduo3
wtL.o_ LLgr.r_ 9Z S Z - r groe.r 9ZS Z I - Cr rrI9 zt -tz 60rcN
'(l alqet ur ,(rtua tsel) ,{ro1-srq tnoqllr\ 1 pue frolstq ql!,!\ t Jo sSutlu: qtt..t,r sluatlud paseeslp alale6l
ii
8268'0- 0600't- 97s z -z
I II I 9 Zt
8168,0_ 0600.t_ sz9 z -z
I II S I Zt
€rr8.0, s8t0.I_ 9ZS Z -Z 8zt6.r_
r Ors s zE
8t06.t_ sz9 z I - c-t z 6 OtcN
'sluerled qJns tZ aJ€ aJaql 1,,(rolstq
lnoqll!\ a^IJ pu€ .{rolstq qll.{\ a^IJ Jo s8utler qtt,,'r sluatled pasueslp alela(I
8006.r_ 929 Z I - CI-t z 6 OtcIN
'sluarlud qJns o^u are araql !.{ro1-srq lnoqlr^\ E pue ,{rolsrq qll,r\ t;o s8utler qltm sluatled pas?aslp alalacl
i:
9Z9ZI-CI-E (.8 OtcN
'sluarled a^U snol^-ard aql roJ senle^ z7 aql ol pnba are JnoJ aseql JoJ sanlu^ z7 aqt '.{peltrutg
'luarted 1srr3 ,{ral aql JoJ anler' t7 aql ol lunba qf,Be aJE sluatled JnoJ lsEIaseql roJ sanle^ t7 nol eql leql oJIloN 'sluartud qJns lnoJ ar€ aleql :,fuolslq
lnoqtrlrt 7 pue .{rolsrq qll,\ z Jo sflurle: qlt,u sluatled pesseslpuou el3lac
t'.
ll
;o,
8198'0 -
,z _,2s8e0.r_ 9Zs Z -Z
I OtI 9 Zt,Z
t€06.r_ 929 Z I - C-t z 6 6€cN
,Z
6Vrsa^dnJ )ou {o srslrvNv'rvJrJ.srJvrs

150 McNrn eNn HeNrrv
5. Bamber D: The area above the ordinal dominance graph and the area below thereceiver operating characterist ic graph. J Math Psychol l2:38i-415,1975
6. Hanley JA, McNeil BJ: The meaning and use of the area under a receiver operat-ing characteristic (ROC) curve. Radiology 143:29-36, 1982
7. Hanley JA, McNeil BJ: Method for comparing the area under iwo ROC curvesderived from the same cases. Radiology 148:839-843, 1983
E. Metz CE, Kronman HB: Stat ist ical signif icance tests ior binormal ROC curves.J Math Psychol 22:218-243,1980
9. Metz CE, Kronman HB: A test for the statistical significance of differencesbetween ROC curves. Inserm 88:647-6ffi, 19'79
10. Metz CE, Wang P-L, and Kronman HB: A new approach for testing the signifi-cance of differences between ROC curves measured from correlated data. In,Deconick F, ed: Information Processing in Medical Imaging VIIL The Hague:Mart inus Nijhof, 1984
ll . Fleiss J, Davis M: Jackknif ing functions of mult inomial frequencies, with anapplication to a measure of concordance. Am J Epidemiol 115:841-845, 1982
12. Efron B: Bootstrap methods. Another look at the jackknife. Ann Stat j : l -26,
t9'7913. McNeil BJ, Sanders R, Alderson PO, et al: A prospective study of computed
tomography, ultrasound and gallium imaging in patients with fever. Radiology139:647-653, 1981
14. McNeil BJ, Hanley JA, Funkenstein HH, Wallman J: The use of paired ROCcurves in studying the impact of history on radiography interpretation. CT ofthe head as a case study. Radiology 149:75-77, 1983