Embed Size (px)
Citation preview
Statistical and analytical guidance on crime and policing statistics For analysts working for Police and Crime Commissioners May 2013

2
Statistical and analytical guidance on crime and policing statistics for analysts working for Police and Crime Commissioners
Contents
Foreword .................................................................................................................... 5
Introduction ................................................................................................................ 6
Purpose of this guidance: Making statistics work for you ........................................ 6
Benefits of statistics ................................................................................................ 6
UK Statistics Authority ................................................................................................ 7
Official statistics ...................................................................................................... 7
What are official statistics? ..................................................................................... 7
What makes official statistics different to other statistics ........................................ 8
Treating own statistics as official ............................................................................ 8
Code of Practice: Overview .................................................................................... 8
National Statistics ................................................................................................. 10
Crime and policing statistics outputs ........................................................................ 11
Overview ............................................................................................................... 11
Explanation of the Annual Data Requirement ....................................................... 11
Outline of outputs available .................................................................................. 11
Crime Survey for England and Wales ................................................................... 14
Limitations: ........................................................................................................ 14
Police recorded crime ........................................................................................... 15

3
Limitations: ........................................................................................................ 16
Police force level data ........................................................................................... 20
Police recorded crime published by the Office for National Statistics and Home Office Open Data tables .................................................................................... 20
Her Majesty’s Inspectorate of Constabulary Crime and Policing Comparator ... 20
police.uk ............................................................................................................ 21
Limitations of crime map data ........................................................................... 21
iQuanta ............................................................................................................. 22
Fraud and forgery data ......................................................................................... 23
Commercial Victimisation Survey ......................................................................... 23
Anti-social behaviour data .................................................................................... 24
Police Personnel - Home Office ............................................................................ 25
User satisfaction surveys ...................................................................................... 25
Value for money profiles ....................................................................................... 25
Independent Police Complaints Commission ....................................................... 26
Criminal justice statistics ....................................................................................... 27
Other useful data available for crime statistics analysis ........................................ 29
Using data publicly ................................................................................................... 30
Overview ............................................................................................................... 30
Making data available – transparency .................................................................. 30
Presentation and commentary .............................................................................. 31
Confidentiality ....................................................................................................... 31
Presenting a balanced picture and drawing on other data sources where necessary ............................................................................................................. 32
Data quality and reliability ..................................................................................... 32
Six guidelines with examples ................................................................................ 32
Examples of good and bad use of stats ................................................................ 34
Ensuring the integrity of data .................................................................................... 35

4
Importance of public trust in statistics ................................................................... 35
Pre-release access - what it is .............................................................................. 35
Breaches and the consequences of them ............................................................. 35
Collecting your own data .......................................................................................... 37
Is the data already available? ............................................................................... 37
Survey, census and administrative data ............................................................... 37
How to collect the data ......................................................................................... 38
Provide consistent guidance to those providing you with data .......................... 38
Survey questionnaire design ............................................................................. 38
Data collection techniques ................................................................................ 39
Sample surveys .................................................................................................... 39
How many to survey .......................................................................................... 39
Who to survey and how ..................................................................................... 40
Variability .......................................................................................................... 41
Confidence intervals ............................................................................................. 41
Response rates..................................................................................................... 41
Quality assurance ................................................................................................. 42
Validating and checking best practice ................................................................... 42
Providing indication of quality of statistics ............................................................. 43
Getting statistics checked by others ..................................................................... 44
Analysing Data ......................................................................................................... 45
Relationships and correlations .............................................................................. 45
Limitations / caveats ............................................................................................. 45
Seasonal effects ................................................................................................... 46
Statistical significance for survey data .................................................................. 46
Who to contact for further guidance ......................................................................... 46
Annex A: Annual Data Requirement 2013/14 ........................................................... 47
5
Foreword
Professor Stephen Shute
Chair of the Crime Statistics Advisory Committee
Appropriate use of crime and policing statistics is essential if public trust and confidence in those statistics and in the police service is to be maintained. As the Chair of the Crime Statistics Advisory Committee (CSAC), I welcome the publication of this guidance which aims to provide assistance to you on best practice of using crime and policing statistics in accordance with the principles outlined by the UK Statistics Authority. I also strongly support the commitment to ensure that crime statistics are accurate, clearly presented, comprehensive, transparent, and trustworthy, and endorse the work that is already underway on improving public trust in statistics. You can play an important role in ensuring that the good work continues and I hope you will find this guidance a useful and practical tool.
The guidance is divided into three main parts: an overview of the importance of statistics, advice for using data publicly and the main crime and policing outputs available; more detailed technical descriptions; and recommendations on management of data and guidelines for presenting data.
This guidance was developed with the support of the Committee and I would like to thank colleagues in the Home Office for leading on the production and development of this guidance. I am also grateful to colleagues in the Ministry of Justice (MoJ), the Office for National Statistics (ONS), Her Majesty’s Inspectorate of Constabulary (HMIC) and the College of Policing for their contributions.
6
Introduction Purpose of this guidance: Making statistics work for you This document is designed to provide guidance on best practice for using crime and policing statistics to improve understanding and interpretation of the data and to help build and maintain public trust in official information. The guidance presents recommended best practice in accordance with the UK Statistics Authority framework1 and its Code of Practice2
. Statistics on crime and policing are available from different sources; are produced in a number of different outputs; and have differing strengths and limitations so being able to ‘unlock’ and accurately interpret the data is vital. These statistics can help in holding your Chief Constable to account when:
• reviewing force performance management and setting priorities; • communicating with the public and informing public debate; • developing evidence based decisions. The guidance brings together information on the collection, presentation and management of data as well as the sources of statistics available into a comprehensive toolkit for you. This is the second of three documents available and provides detail on the sources of crime and policing statistics and technical descriptions. The first part of the series offers advice to Police and Crime Commissioners (PCCs) on using data publicly and an overview of the crime and policing outputs available. The third gives a summary for communication teams on presenting data. Benefits of statistics Statistical analysis can make an important contribution to the delivery of an effective and efficient police service and to how police and their partners tackle crime. It can be used to identify the nature of a crime problem, understand the most cost-effective ways of addressing the problem, and monitor and evaluate any initiatives implemented to address the problem. An analysis of the nature of a crime problem is usually a critical first step to ensure that community needs are being met, and there are wide ranges of statistics that can be used to help with this. To monitor and assess force performance and to demonstrate to the public how forces are performing you will likely to be using, interpreting and reporting on statistics generated nationally and locally. However, not all statistical evidence is robust and evidence of effectiveness in one context may not translate easily to another. There is growing interest in making greater use of statistics and data analysis within policing and making good use of them can be hugely beneficial.
1 http://www.statisticsauthority.gov.uk/about-the-authority/index.html 2 http://www.statisticsauthority.gov.uk/assessment/code-of-practice/index.html

7
UK Statistics Authority The UK Statistics Authority3
The Authority has two main functions:
was established in 2008 by the Statistics and Registration Service Act 2007 and is an independent body operating at arm's length from the government as a non-ministerial department, directly accountable to Parliament.
• oversight of the Office for National Statistics (ONS) - its executive office • independent scrutiny (monitoring and assessment) of all official statistics
produced in the UK. The Authority's statutory objective is to promote and safeguard the production and publication of official statistics that serve the public good. It is also required to promote and protect the quality and comprehensiveness of official statistics, and ensure good practice in relation to official statistics. Official statistics An enormous amount of information about the UK is recorded through the medium of official statistics and produced largely by statisticians operating under the umbrella of the Government Statistical Service (GSS) within public bodies. The statistics provide valuable information fundamental to: • both efficient management and the democratic process; • promoting transparency and enabling the public to hold to account all
organisations that spend public money; and • internal management decisions and policy making. A system for governing production and use of official statistics was created by the Authority. This was in order to enhance trust in the statistical system in terms of quality and impartiality by ensuring the right range of statistics is produced, high and consistent professional standards are maintained, and official statistics are well explained, leading to better decision-making in the public interest.
What are official statistics? The National Statistician4 has issued guidance on the principles that government bodies should consider when deciding whether or not a particular set of data should be treated as official statistics5
3
. The Statistics Authority places particular weight on the following two considerations:-
http://www.statisticsauthority.gov.uk/about-the-authority/index.html 4 The National Statistician is a Crown appointment as the Statistics Authority's and the Government's principal adviser on official statistics, head of the Government Statistical Service, and is also the Authority's Chief Executive and Permanent Secretary. 5http://www.statisticsauthority.gov.uk/national-statistician/ns-reports--reviews-and-guidance/national-statistician-s-guidance/index.html
8
• the data are used publicly by the organisation in support of major decisions on
policy, resource allocation or other topics of public interest, or • the data attract public controversy when published and the Authority takes the
view that public debate would be better informed if the figures are, in future, handled as official statistics.
What makes official statistics different to other statistics
The following points can be used to explain the differences between official and other statistics. Official statistics being those that:
• are used in big decision- making and policy evaluation • inform government • inform the public about government • are produced within legislative framework and follow international standards • are candidates for the National Statistics kite mark Treating own statistics as official As producers of information, in accordance with the requirements that Parliament has placed on PCCs about the publication and provision of information to the public6
, the next section outlines the principles of good practice for official statistics but it is encouraged that these be viewed as a benchmark when producing and publishing any set of statistical information.
Code of Practice: Overview The Code of Practice7
for official statistics, produced and published by the UK Statistics Authority, provides a common standard for good practice to all bodies producing official statistics in the UK and by so doing, helps to ensure a coherent and trustworthy service to users.
The Code of Practice for Official Statistics comprises eight high level principles (see box below). 6 The Elected Local Policing Bodies (Specified Information) Order 2011 (2011 No. 3050), as amended by The Elected Local Policing Bodies (Specified Information) (Amendment) Order 2012 (2012 No. 2479) 7 http://www.statisticsauthority.gov.uk/assessment/code-of-practice/index.html

9
These principles are supplemented by 74 specific practices. In most cases these practices are not prescriptive, in recognition of the fact that there are often a number of different ways of complying with them, and that these will vary according to the specific context in which the statistics are produced. In relation to the eight principles and supplementary practices the Code also contains three more detailed protocols (see box below).
• Principle 1: Meeting user needs
The production, management and dissemination of official statistics should meet the requirements of informed decision-making by government, public services, business, researchers and the public.
• Principle 2: Impartiality and objectivity Official statistics, and information about statistical processes, should be managed impartially and objectively.
• Principle 3: Integrity At all stages in the production, management and dissemination of official statistics, the public interest should prevail over organisational, political or personal interests.
• Principle 4: Sound methods and assured quality Statistical methods should be consistent with scientific principles and internationally recognised best practices, and be fully documented. Quality should be monitored and assured taking account of internationally agreed practices.
• Principle 5: Confidentiality Private information about individual persons (including bodies corporate) compiled in the production of official statistics is confidential, and should be used for statistical purposes only.
• Principle 6: Proportionate burden The cost burden on data suppliers should not be excessive and should be assessed relative to the benefits arising from the use of the statistics.
• Principle 7: Resources The resources made available for statistical activities should be sufficient to meet the requirements of this Code and should be used efficiently and effectively
• Principle 8: Frankness and accessibility Official statistics, accompanied by full and frank commentary, should be readily accessible to all users.
• Protocol 1: User engagement-Effective user engagement is fundamental both to trust in statistics and securing maximum public value. This Protocol draws together the relevant practices set out elsewhere in the Code and expands on the requirements in relation to consultation.
• Protocol 2: Release practices-Statistical reports should be released into the public domain in an orderly manner that promotes public confidence and gives equal access to all, subject to relevant legislation.
• Protocol 3: The use of administrative sources for statistical Purposes-Administrative sources should be fully exploited for statistical purposes, subject to adherence to appropriate safeguards.

10
Compliance with the Code is a statutory requirement for National Statistics and good practice for all official statistics, although the Authority reserves the right to comment on the use of official statistics.
National Statistics
National Statistics are a subset of official statistics that have been certified by the UK Statistics Authority as compliant with its Code of Practice for Official Statistics.
Accredited 'National Statistics' are identified by the following quality mark:
It is important to note the provision of the UK National Statistics Publication Hub which is a website bringing together information about releases from across the UK statistical system. It is a central point of access for National Statistics in the UK.

11
Crime and policing statistics outputs
Overview Statistics are extremely valuable as they can help to measure performance through monitoring and evaluation, and thus help to hold officials to account. There are various sources of crime statistics that can be used to assess force progress and these can be used in different circumstances. However, it is often unclear which is the most appropriate to use in different circumstances. This section provides a summary of the statistics produced on crime and policing and when it is appropriate to use them. Explanation of the Annual Data Requirement The Annual Data Requirement (ADR) is a statutory requirement8
National Statistics
that sets out the data that police forces in England and Wales must collect and return centrally, at what frequency and in what format. It is a robust process that brings requests for police data together, thereby reducing uncoordinated or duplicate requests for information. The ADR is the main way in which data are collected to the required standard and on a comparative basis and is reviewed annually, with changes being subject to Ministerial agreement. Some of the 26 data series (for more detail see Annex A) collected through the ADR form that are subject to stringent reporting and validation standards, as well as being used to provide important management information used by both the Home Office and other stakeholders such as Her Majesty’s Inspectorate of Constabulary (HMIC) and the Ministry of Justice (MoJ). Outline of outputs available The two main sources of national crime statistics are the Crime Survey for England and Wales (CSEW) and police recorded crime (PRC). The table below highlights the main differences between the two sources.
8 The statutory basis for the ADR is set by the 1996 Police Act and was further strengthened in the 2011 Police and Social Responsibility Act.

12
CSEW (England and Wales only)
PRC (England and Wales only)
Source of data
Large, nationally representative, sample survey of households in England and Wales.
However, estimates are subject to a degree of uncertainty associated with sampling (i.e. not possible to ask everybody about their crime experiences so a representative selection of people are asked and their responses are used to represent everybody) and respondents recalling past events.
Data from forces’ crime systems - either the data comes via the Data Hub9
or forces not yet on the Data Hub complete a monthly return (these forces will migrate onto the hub during 2013/14). This source provides whole counts rather than survey estimates.
Coverage of crimes
Includes some crimes that may not have been reported to, or recorded by, the police.
Only those crimes reported to, and recorded by, the police, therefore does not provide complete coverage. From April 2013, will no longer cover fraud as these incidences will be recorded by Action Fraud10 Home Office Counting Rules
. may prevent some
crimes being recorded e.g. in some cases only the ‘principle’ crime is recorded.
Crime victims covered
A survey of people resident in households therefore excludes crimes against businesses and those not resident in households.
Coverage extended in 2009 to include children aged 10 to15 resident in households.
Covers crimes against all types of victims, including both public and private sector organisations (e.g. shoplifting).
This data also includes crimes committed against people not resident in the UK (e.g. tourists) which the CSEW does not.
Crime types covered
Survey is based on victim’s experience of crimes and so does not include crimes that have no victim who can subsequently be interviewed, e.g. homicides and drug possession offences.
Only notifiable crime types covered including ‘victimless’ crimes (e.g. drugs possession) and homicides (both of which the CSEW does not cover). The latter are well covered as nearly all homicides come to the attention of the
9 The Data Hub is a data warehouse which holds data for individual offences. It is designed to align with management information systems used in many police forces, allowing for the creation of automated extracts from one system to the other without the need for the completion of aggregate data collection forms. This should deliver long-term cost reductions in data collection processes and offers new and improved ways of analysing data. 10 During the latter half of 2012/13, the responsibility for recording fraud offences has been gradually transferring away from police forces such that, from April 2013, all fraud offences will be recorded by Action Fraud.

13
Resulting headline figures also exclude offences difficult to estimate from a relatively small sample, e.g. sexual offences. Self-completion modules cover sexual and domestic violence and use of illicit drugs.
police.
Long term trend analysis
Survey is designed to provide a reliable and consistent measure of trends/patterns of victimisation so is a good measure of long term crime trends as not affected by changes in police recording practices.
Subject to changes in recording practices11
Sub-regional data
so not suitable for long term trend analysis. In the past, the UK Statistics Authority has criticised inappropriate comparisons made by politicians using this series. Most crime comparisons since 2002/03 can be made on a consistent basis.
Not appropriate to use for crime statistics in areas lower the police force due to low and/or non-representative samples at this level.
Is the primary source of local area crime statistics and for lower-volume crimes, e.g. homicides.
Time period covered
Respondents are asked about their experience of crimes in the 12 months preceding the interview. For example, the 2011/12 survey is based on interviews between April 2011 and March 2012 and so the reference period for estimates includes incidents experienced by respondents between April 2010 and February 2012. This results in a degree of time lag, and a smoothing of the estimates compared with PRC figures.
Based on the date that the crime is recorded by the police. For example, estimates for ‘the year ending September 2012’ will include all crimes recorded by the police between October 2011 and September 2012, i.e. regardless if the incident took place before this period. The Savile incidents highlight this – although some of these took place as far back as the 1960s, these incidents would actually show up in the PRC statistics in 2012 when they were recorded by the police.
Limitations CSEW is not appropriate for sub-regional data due to low/non-representative sample sizes at these levels.
The CSEW is based on victim’s experience of crimes and so does not include crimes that have no victim who can subsequently be interviewed, e.g. homicides and drug possession offences.
The CSEW only covers people living in
PRC statistics are affected by the rules governing the recording of data, systems in place and operational decisions in respect of the allocation of resources. More proactive policing in a given area could lead to an increase in crimes recorded without any real change in underlying crime trends. Some crime types are also more influenced by police activity than others (e.g. drug offences).
PRC is not suitable for long term
11 E.g. with the introduction of National Crime Recording Standard (NCRS) in April 2002.

14
private households and therefore excludes crimes against individuals living in institutions and businesses. A separate survey, the Commercial Victimisation Survey, covers businesses.
Although the CSEW covers children aged 10 to 15, but the figures are not directly comparable with those from the adult survey and should not be combined.
analyses that go back beyond 2002 (pre National Crime Recording Standard-NCRS) making data incomparable. It is however the most appropriate source for short term trends (preferably used alongside the CSEW data to give as full a picture as possible).
Crime Survey for England and Wales The Crime Survey for England and Wales (CSEW), formerly known as the British Crime Survey (BCS), is a face-to-face victimisation survey in which people aged 16 and over resident in households in England and Wales are asked about their experiences of a range of crimes in the 12 months prior to the interview. Respondents to the survey are also asked about their attitudes towards different crime-related issues, such as the police and the criminal justice system and perceptions of crime and anti-social behaviour. Since January 2009, the CSEW has also asked children aged 10 to 15 about their experience of crime in the previous 12 months.
The CSEW is carried out by the Office for National Statistics (ONS).
CSEW is the most appropriate data source for looking at long term trends, especially if going back beyond 2002 (as this was when the NCRS was introduced therefore making PRC data from 2002 onwards incomparable with pre-2002 PRC data). It is also appropriate for short term trends (preferably used alongside the PRC data to give a full a picture as possible), although, given that these are based on a sample, small changes should be treated with caution as they may not represent a real underlying change. (See section on collecting your own data , sample surveys and variability)
More information is given in the User Guide.
Users can download CSEW datasets from the CSEW section of the UK Data Archive
Limitations:
CSEW is NOT appropriate for sub-regional data due to low/non-representative sample sizes at these levels. The CSEW is based on victim’s experience of crimes and so does not include crimes that have no victim who can subsequently be interviewed, e.g. homicides and drug possession offences.
15
The CSEW only covers people living in private households and therefore excludes crimes against individuals living in institutions and businesses. (But see section on Commercial Victimisation Survey). The CSEW covers children aged 10 to 15, but the figures are not directly comparable with those from the adult survey and should not be combined. Police recorded crime Crime statistics would become meaningless without integrity in recording of crime. All recorded crime data comes from police force recording systems. Police crime recording practice is governed by the National Crime Recording Standard (NCRS). The NCRS was introduced in April 2002 to promote greater consistency and transparency of crime recording between forces. Crime data are collected from each police force for all crimes within the Notifiable Offence List and according to Home Office Counting Rules. The guidance notes to the counting rules provide a good background as to how PRC figures are recorded and the circumstances under which crimes are included in or omitted from the figures. NCRS was originally proposed by the Association of Chief Police Officers after a highly critical review of forces’ crime recording procedures by HMIC and was adopted in 2002. This standard has been very important in maintaining the credibility and comparability of crime recording. The general principle of NCRS is that where a victim makes a report of crime it will be recorded where there is no credible evidence to the contrary. For the public to have confidence in the police there is a minimum expectation that police will accurately record crimes and it is important that victim reports are not discounted without good reason. There have been a number of reports and reviews on crime recording in recent years by both HMIC and the National Statistician (amongst others) and they have all concluded that NCRS remains relevant and fit for purpose. Concerns have been expressed about the possible erosion of compliance by some forces with NCRS leading to some crimes reported to the police not being recorded accurately.
The effect of changes to the HOCR can be seen in the bar chart below.

16
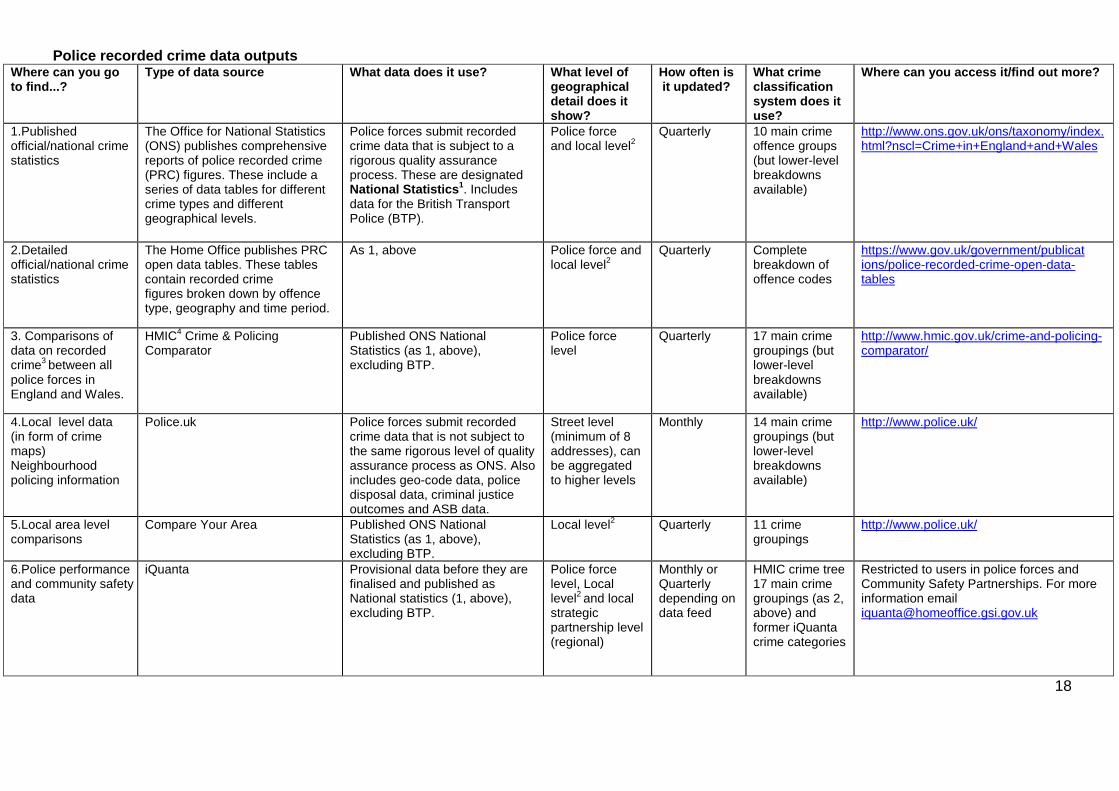
The chart shows that police recorded crime increased during most of the 1980s, reaching a peak in 1992, and then fell each year until 1998/99 when the expanded coverage and changes in the HOCR resulted in an increase in recorded offences. This was followed by the introduction of the NCRS in April 2002 which led to a rise in recording in 2002/03 and 2003/04. Following the bedding in of these changes, trends have been generally more consistent between the two series since 2003/04, with the exception of some short term fluctuations in recent years. PRC data are used to produce a number of different data outputs that can be used by police forces, government departments and the public alike. Although all are based on data from police forces, the coverage and presentation of the outputs differ as shown in the table below. PRC is the most appropriate data source for sub-regional analysis. It is the only available data source for certain crimes such as homicide and victimless crimes (e.g. drug possession offences).
Limitations:
PRC statistics, like any administrative data, are affected by the rules governing the recording of data, systems in place and operational decisions in respect of the allocation of resources. More proactive policing in a given area could lead to an increase in crimes recorded without any real change in underlying crime trends.
0
2,000
4,000
6,000
8,000
10,000
12,000
14,000
16,000
18,000
20,000 19
81
1982
19
83
1984
19
85
1986
19
87
1988
19
89
1990
19
91
1992
19
93
1994
19
95
1996
19
97
1998
/99
1999
/00
2000
/01
2001
/02
2002
/03
2003
/04
2004
/05
2005
/06
2006
/07
2007
/08
2008
/09
2009
/10
Yr e
nd S
ept 1
1 Yr
end
Sep
t 12
Number of offences (000s)
Police recorded crime - old counting rules Police recorded crime - new counting rules Police recorded crime - post NCRS

17
Some crime types are also more influenced by police activity than others (e.g. drug offences). These issues need to be taken into account when using these data. You should also note the possibility of under-reporting/recording. HMIC carries out inspections and reviews into the police recording of crime. As incidents are categorised based on a balance of probabilities, there is a degree of discretion in how some crimes are counted which can lead to a loss of confidence in some PRC figures. PRC is NOT suitable for long -term analysis that goes back beyond 2002 (pre NCRS) as data are incomparable. It is however the most appropriate source for short-term trends (preferably used alongside CSEW data to give as full a picture as possible). Further details of crime statistics available in National Statistics, on police force area, local area and neighbourhood data can be found in the table below.
18
Police recorded crime data outputs Where can you go to find...?
Type of data source
What data does it use? What level of geographical detail does it show?
How often is it updated?
What crime classification system does it use?
Where can you access it/find out more?
1.Published official/national crime statistics
The Office for National Statistics (ONS) publishes comprehensive reports of police recorded crime (PRC) figures. These include a series of data tables for different crime types and different geographical levels.
Police forces submit recorded crime data that is subject to a rigorous quality assurance process. These are designated National Statistics1. Includes data for the British Transport Police (BTP).
Police force and local level2
Quarterly 10 main crime offence groups (but lower-level breakdowns available)
http://www.ons.gov.uk/ons/taxonomy/index.html?nscl=Crime+in+England+and+Wales
2.Detailed official/national crime statistics
The Home Office publishes PRC open data tables. These tables contain recorded crime figures broken down by offence type, geography and time period.
As 1, above
Police force and local level2
Quarterly Complete breakdown of offence codes
https://www.gov.uk/government/publications/police-recorded-crime-open-data-tables
3. Comparisons of data on recorded crime3
between all police forces in England and Wales.
HMIC4 Crime & Policing Comparator
Published ONS National Statistics (as 1, above), excluding BTP.
Police force level
Quarterly 17 main crime groupings (but lower-level breakdowns available)
http://www.hmic.gov.uk/crime-and-policing-comparator/
4.Local level data (in form of crime maps) Neighbourhood policing information
Police.uk
Police forces submit recorded crime data that is not subject to the same rigorous level of quality assurance process as ONS. Also includes geo-code data, police disposal data, criminal justice outcomes and ASB data.
Street level (minimum of 8 addresses), can be aggregated to higher levels
Monthly 14 main crime groupings (but lower-level breakdowns available)
http://www.police.uk/
5.Local area level comparisons
Compare Your Area Published ONS National Statistics (as 1, above), excluding BTP.
Local level2 Quarterly 11 crime groupings
http://www.police.uk/
6.Police performance and community safety data
iQuanta Provisional data before they are finalised and published as National statistics (1, above), excluding BTP.
Police force level, Local level2 and local strategic partnership level (regional)
Monthly or Quarterly depending on data feed
HMIC crime tree 17 main crime groupings (as 2, above) and former iQuanta crime categories
Restricted to users in police forces and Community Safety Partnerships. For more information email [email protected]
19
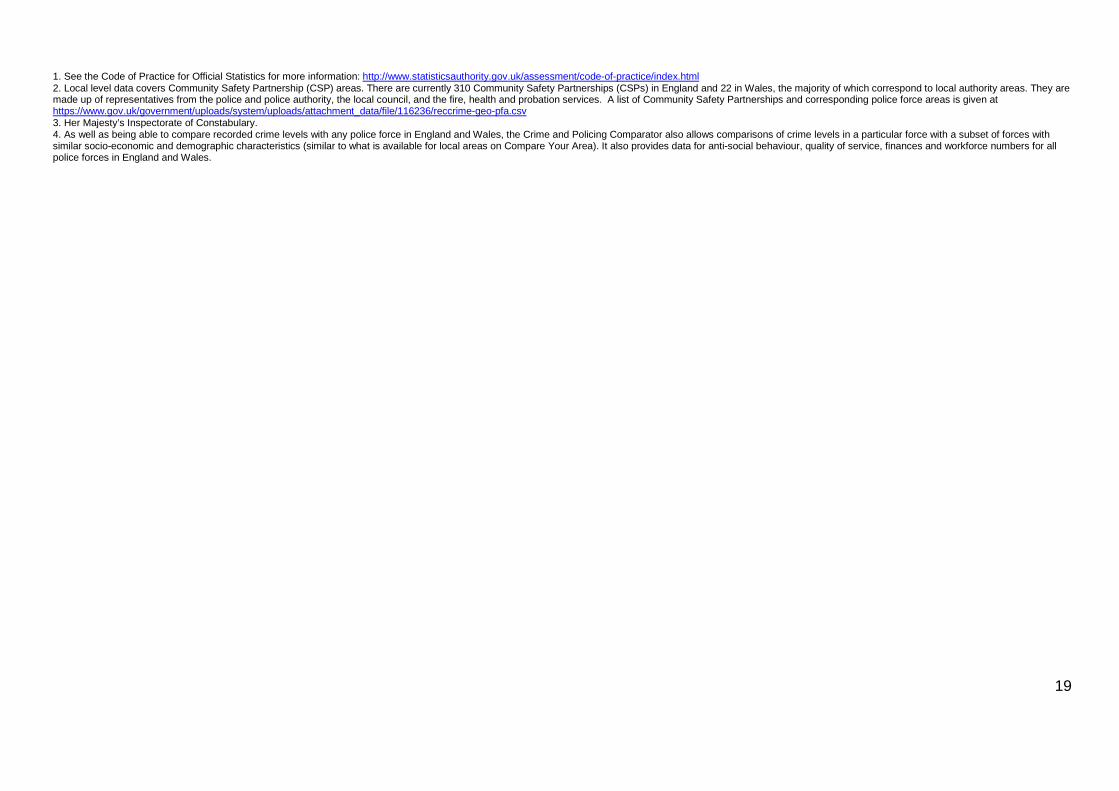
1. See the Code of Practice for Official Statistics for more information: http://www.statisticsauthority.gov.uk/assessment/code-of-practice/index.html 2. Local level data covers Community Safety Partnership (CSP) areas. There are currently 310 Community Safety Partnerships (CSPs) in England and 22 in Wales, the majority of which correspond to local authority areas. They are made up of representatives from the police and police authority, the local council, and the fire, health and probation services. A list of Community Safety Partnerships and corresponding police force areas is given at
3. Her Majesty’s Inspectorate of Constabulary. https://www.gov.uk/government/uploads/system/uploads/attachment_data/file/116236/reccrime-geo-pfa.csv
4. As well as being able to compare recorded crime levels with any police force in England and Wales, the Crime and Policing Comparator also allows comparisons of crime levels in a particular force with a subset of forces with similar socio-economic and demographic characteristics (similar to what is available for local areas on Compare Your Area). It also provides data for anti-social behaviour, quality of service, finances and workforce numbers for all police forces in England and Wales.

20
Police force level data Police recorded crime is available at force level from several different sources:
• ONS/Home Office open data tables
• HMIC Crime and policing comparator
• Police.uk
• iquanta
The uses and limitations of these sources are detailed below. It should be noted that it is not always appropriate to compare forces as they vary in terms of population and geographical size and composition. Using Compare Your Area may be more appropriate. Data quoted from police force’s own websites should be referred to as ‘provisional figures’ as they have not been quality assured by the Home Office.
Police recorded crime published by the Office for National Statistics and Home Office Open Data tables PRC data are supplied to the ONS by the Home Office, which is responsible for the collation of recorded crime data supplied by the 43 territorial police forces of England and Wales, plus the British Transport Police (BTP). These data are supplied to the Home Office on a monthly basis in an aggregated return for each crime within the notifiable offence list and are quality assured by the Home Office Statistics Unit on a quarterly basis before being supplied to ONS for final preparation and publication as National Statistics. Notifiable offences include all offences that could possibly be tried by jury (these include some less serious offences, such as minor theft that would not usually be dealt with this way) plus a few additional closely-related summary offences dealt with by magistrates, such as assault without injury. However, in some cases only the principal offence will be recorded.
Users can download open data tables from the Home Office pages on gov.uk
More information is given in the User Guide.
Her Majesty’s Inspectorate of Constabulary Crime and Policing Comparator
The Crime and Policing Comparator is HMIC’s online tool that brings together data from all 43 police forces across England and Wales for the past three years. Users can use the four interactive charts to choose the forces and data they are interested in and then generate their own graphs. It displays the police recorded crime statistics

21
as published as National Statistics. It also allows users to compare forces over time, or make comparisons between forces.
The Crime and Policing Comparator provides a comparison of data on:
• recorded crime • anti-social behaviour (ASB) • quality of service • finances and workforce
The data are published quarterly and the most recent data available are for 2011 and 2012. The data are from the Chartered Institute of Public Finance and Accountancy (CIPFA), Police Objective Analysis financial estimates and the Annual Data Requirements ( ADRs) provided by forces.
police.uk
This is a publicly available website that provides street level crime counts in 2 formats: maps and charts (Compare Your Area).
Map
The crime map provides information on crimes, ASB and justice outcomes in a local area (a ‘justice outcome’ is a crime that has been resolved by the police or a court) for England, Wales and Northern Ireland displayed on a map. It is possible to physically draw an area on a map, although as it is not saved it is difficult to re-create it.
Limitations of crime map data
The crime counts are based on data submitted by the police separately from the PRC data used in the National Statistics. These data are not subject to the same rigorous quality assurance process as the National Statistics data published by ONS (and used for the HMIC Crime and Policing Comparator and Compare Your Area tools). The data only map those crimes with geographical location information, i.e. crimes without this information are excluded from the map, but an indication of the number of crimes that fall into this category at force level is provided. It is difficult to aggregate the street level data to larger geographical areas (e.g. from Community Safety Partnerships to regional level) due to boundary issues (as a street may lie across two distinct geographical areas), although currently data are aggregated to neighbourhood and force level. The data are not fully quality assured before being put on the website and therefore may be prone to errors. Errors identified in previous months may not be corrected.
22
A process known as ‘no-criming’ results in crimes being removed if after initial recording it is determined that no crime was actually committed (e.g. an offence of criminal damage was found to be the result of natural causes – high winds blew down a fence). Because the crime mapper data are collated monthly, there will be differences in the levels of ‘no-criming’ compared with National Statistics data (which cover a three-month period).
Compare Your Area
The charts on this page let users compare levels of crime in a local area with areas that have similar socio-economic characteristics (taken together, these areas are known as your area's 'Most Similar Group', or MSG12
). They can also compare levels of crime in the local area with other areas in the police force. The charts help users to understand more about:
• how crime in ‘city/town’ compares with crime in other similar areas • how crime in ‘city/town’ compares with crime in the police force area • how crime has changed over time in ‘city/town’ and in the police force area.
iQuanta iQuanta is a web-based service provided to operational staff in police forces, Community Safety Partnerships (CSPs) and HMIC. iQuanta makes available analyses of crime, policing performance and community safety data. The analyses are provided in a range of graphical charts and tables and allow users to compare their area against peers, identify significant changes and track progress. Analyses are available at Force, Local Strategic Partnership (LSP) and CSP level. The iQuanta service’s aim is primarily to support local performance management through regular and timely analysis. iQuanta allows users to access provisional data before finalised National Statistics are published. Accordingly, the service is accessible only to accredited users and has clear terms and conditions set out limiting public use of the data before the statistics are officially published. iQuanta contains some unpublished police recorded crime data as they are received on a monthly basis (whereas the National Statistics are only published quarterly). However, unlike the quarterly statistics, the data is not reconciled and so may be different from final published figures. The figures should therefore only be used for informal indications of trends. 12 Most Similar Groups (MSGs) are groups of police force areas that have been found to be the most similar to each other based on an analysis of demographic, social and economic characteristics which relate to crime. MSGs are designed to help make fair and meaningful comparisons between forces. Forces operate in very different environments and face different challenges. It can be more meaningful to compare a force with other forces which share similar social and economic characteristics, than, for example, a neighbouring force.

23
More information is available from [email protected] Fraud and forgery data The measurement of fraud is challenging as it is a deceptive crime which is difficult to detect accurately and is often targeted at organisations rather than individuals. It is known to be under-reported to the police and difficult to measure using a household survey. Fraud data from a range of sources are presented in the ONS quarterly statistical bulletins on crime in England and Wales to provide a more complete picture.
These include:
• Police recorded crime; • National Fraud Intelligence Bureau (NFIB); • National Fraud Authority; • CSEW plastic card fraud module; and • UK Cards Association. For further information on sources of fraud data and the nature, extent and economic impact of fraud in the UK see ONS quarterly releases and the User Guide. Commercial Victimisation Survey This is a survey of crimes against businesses in four industry sectors (manufacturing, wholesale and retail, transportation and storage, and accommodation and food), i.e. not the whole of the business population. Available statistics currently include the number of incidents, incidence rates, and prevalence rates for a variety of crimes by sector and business size. The first of three surveys was carried out in 2012 and headline results were published in January 2013. . More detailed findings are due to be published in July 2013. Statistical time trends are not currently available. Future surveys may rotate some sectors to provide an insight to crime in other sectors. Results are only available at the national level.

24
Anti-social behaviour data The term ‘anti-social behaviour’ (ASB) was formalised in the late 1990s to describe a wide range of the nuisance, disorder and crime that adversely affect people’s daily lives. The Crime and Disorder Act 1998 defined ASB in law as ‘acting in a manner that caused or was likely to cause harassment, alarm or distress to one or more persons not of the same household’. In many cases these ASB incidents may still be crimes in law, such as littering or dog fouling, but they are not of a level of severity that would result in the recording of a notifiable offence. Thus, they are not included in the main police recorded crime collection. While incidents are recorded by the police under the National Standards for Incident Recording (NSIR) in accordance with the same ‘victim focused’ approach that applies for police recorded crime, the figures are not accredited National Statistics and are not subject to the same level of quality assurance as the main recorded crime collection. A recent report HMIC (HMIC, 2012) raised some concerns over the recording of ASB incidents. From the small number of ASB incidents reviewed (around 1,000 across England and Wales): • some incidents recorded by the police as ASB should have instead been recorded as notifiable crimes – findings show that these varied in number between police forces; and • there was poor identification of repeat, vulnerable and intimidated victims of ASB at the first point of contact. It is known that a small number of police forces are erroneously duplicating some occurrences of a singular ASB incident where multiple calls have been made. The variation in the type of ASB incident recorded into the three new strands of ‘Personal’, ‘Nuisance’ and ‘Environmental’ (from 2011/12 onwards) across police forces suggests that there are some discrepancies in how police forces are categorising incidents. ASB incident data recorded by the police are published within the ONS’ Annual release; and data on anti-social behaviour orders (ASBOs) issued by courts and proved to have been breached in court are compiled by the Ministry of Justice and published by the Home Office. In April 2013, ONS published a Short Story on Anti-Social Behaviour, 2011/12, which presents findings on perceptions and experience of ASB from the 2011/12 CSEW and findings on experience of ASB reported by businesses from the 2012 CVS, ASB incident data recorded by the police and data on anti-social behaviour orders (ASBOs) issued by courts and proved to have been breached in court.
25
Police Personnel - Home Office Forces submit a variety of data to the Home Office relating to police personnel. These include police numbers in post; by force; by rank; by gender and ethnicity breakdowns. In general these are sourced from the forces human resource systems. They are published by the Home Office and used particularly by HMIC for:
• value for money profiles and adapting to austerity reports for police number projections; and
• monitoring police performance and frontline policing. Police personnel statistics have also been used to review pay negotiations.
The Home Office releases a six-monthly bulletin, ‘Police service strength’.
User satisfaction surveys It is a requirement of the Home Office, (under the ADR) for police forces to conduct victim (user) satisfaction surveys with specified victim groups and return data on a quarterly basis. The purpose of returning data from force surveys to the Home Office is to enable the calculation of victim satisfaction measures for dissemination via iQuanta, as well as being published on the HMIC Crime and Policing Comparator. Victim satisfaction surveys are structured around a number of core questions, exploring satisfaction responses across four stages of interaction: initial contact, actions, follow-up, treatment, plus the whole experience. The four groups of victims considered are: domestic burglary, violent crime, vehicle crime, and racist incidents.
Victim satisfaction surveys aim to:
• take account of the experience of victims not just at the initial stage of police action, but in the subsequent activity.
• provide information about victim experience which can be actioned by forces and authorities to improve service delivery.
• standardise the ways in which victim feedback is gathered and reported.
Guidance on conducting victim satisfaction surveys across the service is available on the POLKA website and on iQuanta, which includes instruction on the survey process, sampling and using the data survey process. Value for money profiles These profiles provide comparative information on costs, funding, council tax, staffing levels, sickness, and staff turnover. They also contain information on how satisfied victims are with the service they receive. The information comes from the CIPFA and Police Objective Analysis financial estimates and from the ADR provided by forces.

26
A profile is produced for each force. These are compared with averages – either the average of forces within England and Wales or other similar forces. The profiles are primarily designed for management teams in forces (i.e. command team / heads of department), but are also useful for exploring where to ask questions about value for money.
Variables covered:
• analysis of cost and workforce data, including the different police functions • workforce (by rank, joiners/leavers, length of service) • call volumes and incident data • crime detections data for each category of crime • detections by type of data • “no crime data” • satisfaction data
It should be noted that the workforce data within the profiles published annually in the autumn is based on the latest data provided by forces. It therefore includes any revisions to data submitted by forces since the release of the Home Office publication ‘Police Service Strength England and Wales’ in the previous July and in some cases figures within the profiles will not align directly to published National Statistics.
More information and the latest profiles for 2011 and 2012 are available at http://www.hmic.gov.uk/data/value-for-money-data/
Independent Police Complaints Commission Since April 2009, the Independent Police Complaints Commission (IPCC) has collected data from police forces after the end of every quarter, and used it to produce a report, called a ‘Police Complaints Information Bulletin’. These bulletins show the force data against a number of indicators that have previously been agreed and tested with forces and policing organisations. At the end of each year, the IPCC also uses the data collected to produce an Annual Police Complaints Statistics report for England and Wales. This report assesses how well the police complaints system is working overall. Forces have a statutory duty to refer all deaths following police contact, including those that occur in or following police custody, to the IPCC. The IPCC reports on these deaths as part of their annual statistics into deaths during or following police contact.

27
Criminal justice statistics Forces collect and make available to the MoJ and the Home Office a range of crime outcome information including:
• police cautions (reprimand or warnings for juveniles); • penalty notice for disorder (PNDs); • cannabis warnings; and • offences taken into consideration (TiCs).
These are published regularly by MoJ and the Home Office. MoJ also collects and publishes data on court outcomes and sentencing, prison and probation data, proven re-offending and criminal histories. In addition Anti Social Behaviour Orders data is collected by MoJ and published by the Home Office.
The table below gives a summary of the publications produced by MoJ. It should be noted that Home Office statistics tend to present numbers of offences, whereas MoJ statistics are based on the number of offenders. As one offender can commit one or more offences, and one offence can be committed by one or more offender, these figures cannot be directly linked or compared.
Title Coverage Web link
Criminal Justice System Statistics
A quarterly National Statistics publication, covering offenders dealt with by formal police cautions, reprimands or warning, or criminal court proceedings in England and Wales. Detailed data for the calendar year covered are published separately in six volumes of supplementary tables. It presents long term trends in out of court disposals, convictions and sentencing.
https://www.gov.uk/government/publications/criminal-justice-statistics--2
Knife possession sentencing quarterly brief
Contains key statistics describing trends in cautioning and sentencing, probation supervision and the prison population for offences involving the possession of a knife or offensive weapon in England and Wales.
https://www.gov.uk/government/publications/knife-possession-sentencing-quarterly-brief--2
Offender Management Statistics Quarterly Bulletin
A National Statistics publication providing key statistics relating to offenders who are in prison or under Probation Service supervision. It covers flows into these services (receptions into prison or probation starts) and flows out (discharges from prison or probation terminations) as well as the caseload of both services at specific points in time.
https://www.gov.uk/government/publications/offender-management-statistics-quarterly--2
Proven Re-offending Statistics Quarterly
Gives proven re-offending figures for offenders, who were released from custody, received a non-custodial conviction at court, received a caution, reprimand,
https://www.gov.uk/government/publications/proven-re-
28
Bulletin warning or tested positive for opiates or cocaine. Proven re-offending is defined as any offence committed in a one year follow-up period and receiving a court conviction, caution, reprimand or warning in the one year follow-up or within a further six month waiting period.
offending--2
Local Adult Re-offending
Contains re-offending data at the following geographic levels: Regions within England and Wales; Probation Trusts; Local Authorities. It is used as a performance measure to assess Probation Trust performance through the probation trust rating system.
Unlike proven re-offending statistics this measure uses four caseload snapshots of all offenders under probation supervision in the community at the end of a quarter and captures any re-offending in the three months following these snapshots which is proved by court conviction or caution in the three month follow up or within a further three months waiting period.
https://www.gov.uk/government/publications/local-adult-reoffending
Youth Justice Statistics
These statistics concentrate on the flow of young people through the Youth Justice System using information published by the Home Office, MoJ, ONS, Youth Offending Teams and youth secure estate providers.
https://www.gov.uk/government/publications/youth-justice-statistics
Anti-Social Behaviour Order (ASBO) Statistics England and Wales
Covers ASBOs issued and breached, based on ASBOs issued after application by a relevant body to magistrates' courts (acting in their civil capacity) or to county courts and ASBOs issued following conviction for a criminal offence either by magistrates' courts (acting in their criminal capacity) or the Crown Court.
https://www.gov.uk/government/publications/anti-social-behaviour-order-statistics-england-and-wales-2011--2

29
Other useful data available for crime statistics analysis
Title Use Web link
Population estimates
Population estimates calculated by the Office for National Statistics for the periods and geographic areas covered by the crime data sets.
These are used to produce estimates of crime rates per 1000 population.
https://www.gov.uk/government/publications/population-estimates
Geographical reference table
A list of Community Safety Partnerships and corresponding police force areas
https://www.gov.uk/government/uploads/system/uploads/attachment_data/file/116236/reccrime-geo-pfa.csv
Offence reference table
A list of all police recorded crime offence codes https://www.gov.uk/government/uploads/system/uploads/attachment_data/file/116237/reccrime-pfa-offence.csv
Neighbourhood statistics
Various data are available for wards, output areas, parishes/communities and parliamentary constituencies via the Neighborhood Statistics service, e.g. Index of Multiple Deprivation, Density data, Unemployment rates, etc.
http://www.ons.gov.uk/ons/rel/census/2011-census/key-statistics-and-quick-statistics-for-wards-and-output-areas-in-england-and-wales/STB-2011-census--quick-statistics-for-england-and-wales--march-2011.html
Mapping info Mappings of community safety partnerships to police force areas can be found within the crime data downloadable spreadsheet which is available on the new version of iQuanta (these mappings can be found in the population worksheets).
Ihttps://iquanta.projectfusion.com/share/
Further information or account access is available from [email protected]
For advice on how to use mapping info you can contact Professor Allan J. Brimicombe [email protected] Tel: +44 (0) 20 8223 2352

30
Using data publicly Overview Statistics are tools that can turn data into useful information that can then be used to raise awareness, influence behaviour and voters, and help to drive local accountability and transparency. Good and accurate use of statistics can help to establish credibility, increase influence and contribute over time to enhanced reputation. Poor use of statistics can lead to loss of trust and reduced authority. You, therefore, have a critical role in presenting data clearly to ensure that your communities and partners understand the data you make available to them. The way statistical data are summarised or presented can lead to wrong conclusions being drawn even if the statistics are correct. It is important, therefore, to ensure that they are quoted accurately using reliable (published) sources that are properly referenced and caveated where necessary. Statistics are a hugely important and influential resource, but if they are not understood then they are not doing as much good as they could, and run the risk of being misinterpreted. If you intend to publish any data you should ensure that you have the right/appropriate permission to publish it and it would be advisable to follow the code of practice for official statistics where appropriate. It is advisable to provide contact details to which the users can direct any comments/questions regarding the release. Making data available – transparency It is best practice to make the data presentable, accessible and easy to use/interpret. Data should be released in a format that is accessible to everyone and for this reason html based publications are recommended. It is also important that the data contained or referred to in the release are also made available to as wide an audience as possible. This can be achieved via open source data formats such as an open document spreadsheet (ODS)13 or comma –separated value (CSV)14
. It is also best practice to provide the data used to make any charts or figures.
This allows users to conduct their own further analysis and understand where claimed results or statements came from.
13 An ODS file format is the default format for spreadsheets that are created and saved using the Open Office office suite. 14 A CSV file stores tabular data (numbers and text) in plain-text form.

31
Making data available/transparent can also be helpful to the data suppliers as it may reduce the number of Freedom of Information requests or other queries that have to be answered. Statistics should be written in a neutral unbiased style with factual analysis and no assumptions. Data must be properly managed and fit for purpose. Doing too much with data may lead users to be confused and may lose focus. Data may be misinterpreted and this also risks the loss of key messages. Presentation and commentary A release of any data should include clear, easy to read/use tables and charts where appropriate. The data should also be accompanied by explanatory commentary in order to aid user interpretation. Any data supplied should be accompanied by the appropriate limitations and caveats. It is important to ensure that there are explanations of all methods, calculations and conclusions derived from the data. It is also important that users are made aware of which changes are statistically significant and which are not. Charts and figures are a good way of giving a clear pictorial story but they should be drawn in an accurate and impartial way. Care should be taken when choosing scales, axes and labels and data points. The source of the data should be referred to in the table or chart, and the title should explain what is being shown. More guidance is given on the Government Statistical Service website and at the DataUnitWales website. Confidentiality It is essential to ensure that you comply with all legislation surrounding confidentiality. In particular it is important to ensure that you do not release data that are disclosive. This entails not only ensuring that statistical releases do not reveal the identity of an individual but also that any data you release cannot be combined with any other publicly available data set in order to do so. It is also important to keep any confidential information secure. It is advisable to allow only the necessary staff access to confidential data and to ensure that those staff are aware of their responsibility to protect this data and the regulations surrounding the release of it. Some further guidance on statistical disclosure control can be found on the ONS website as well as the Scottish government’s website.
32
Presenting a balanced picture and drawing on other data sources where necessary Statistics ought to be presented objectively, impartially and removed from political messages. It increases trust if you present an un-biased view of the data. In order to present a balanced picture, it is useful to use other data sources to complement your own data, e.g. data from other forces, the CSEW, other government departments, other nations, academic research etc. Drawing on data from multiple sources helps to provide the wider context for your data and allows users to see how your data fits in to the bigger picture. Mentioning other data sources in any release also gives you the opportunity to provide reasons and explain discrepancies with other data sources on your own terms, which can reduce confusion amongst the user community. It is important always to cite the source of any data you use and to provide the user with a link to the data. It is also important when using other data sources to provide the user with an awareness of the limitations and caveats of that data source. Data quality and reliability It is important to provide the users with an idea of the quality and reliability of the data being provided and to make the user aware of any issues surrounding the quality. If data are provisional, i.e. subject to change, then this should be communicated and made clear to the user. If any data are found to be incorrect or inaccurate it is important to address this promptly. The offending data should be corrected or removed with an accompanying note to explain the changes made. It is recommended that users are alerted to these errata as quickly as possible. Six guidelines with examples The following are some general tips to ensure the best presentation.
1. Show the full picture
When writing about statistics do not just pick out the successes, show a balance of results. Do not just say there was a change (e.g. a fall in crime), always also say either what it fell from or what it fell to.

33
2. Don’t claim too much Be cautious about saying that you can “prove” or “show” that policies have worked using statistics. It is often better to say that they “indicate” or “suggest”. For example: “There was a 27 per cent fall in knife homicides in areas piloting my knife crime initiatives, from 199 in 2011/12 to 145 in 2012/13, compared with a 13 per cent increase in areas where these initiatives have not yet been implemented (55 to 62, respectively). These data suggest that my initiatives may be contributing to a fall in knife-related deaths.”
3. Compare similar data It is usually best to compare changes year-on-year using identical time periods. For example: “Crime in September to December 2012 is down 40 per cent compared with the same period the year before.” This ensures seasonal factors are not mis-interpreted. It should be noted that it is not always appropriate to compare forces as they vary in terms of population and geographical size and composition.
4. Be clear where the statistics are from State the data source(s) that the statistics come from. For example: “There was a fall of x% in police recorded crime...” or “According to the Crime Survey for England and Wales...” If applicable, include web links and table or chapter references to allow readers to see the underlying data for themselves.
5. When numbers are small (e.g. less than 100) beware of percentages Small numbers are better quoted directly. For example: “There were 11 homicides recorded by Barsetshire Police in 2011/12, down from 19 the previous year.” If you must use percentages always include the actual numbers so that readers don’t over-interpret accuracy. For example: “Homicides in Barsetshire were down 42 per cent (from 19 in 2010/11 to 11 in 2011/12)”. For small numbers, also consider using simple proportions. For example: “Attempted murders recorded by Barsetshire Police were down by a fifth” – rather than “fell 20 per cent”. But still quote exact numbers.
6. Be clear about limitations or quality issues affecting the data Explain how big the survey or study sample sizes were, response rates, whether the results were nationally representative, whether there were changes to the way data were collected / recorded and (if appropriate) whether results are statistically significant. If these details are too technical, consider using footnotes or notes to editors.

34
Examples of good and bad use of stats
Example 1
Good: “Police recorded crime fell by 5 per cent in the year to September 2012 compared with a year earlier.”
Bad: “Crime is down by 5 per cent.” – What is the source? Down 5 per cent compared to when?
Example 2
Good: “There was one homicide recorded by Barsetshire Police in 2011/12, compared with two recorded the previous year.”(Percentage changes are not appropriate when presenting small numbers).
Bad: “There was a 50 per cent fall in homicides between 2010/11 and 2011/12.”
Example 3
Good: “According to the 2011/12 Crime Survey for England and Wales , crime x fell by 13 per cent in the last year, however the trend has been relatively flat since 2002/03.”
– i.e. don’t just focus on the most recent quarter/year, put it into context.
Bad: “Crime x fell by 13 per cent in the year to 2011/12”
0
5
10
15
20
25
Number of incidents of crime x (thousands)

35
Ensuring the integrity of data Importance of public trust in statistics The Government, the UK Statistics Authority and CSAC are committed to enhancing the integrity, both actual and perceived, of official statistics and place great importance in ensuring the public have ready access to information and trust what they see. Statistics therefore need to be of assured quality, and be compiled and presented in a transparent way that does not expose producers to suggestions of misuse. In accordance with the Code of Practice principles, the release of official reports into the public domain in an orderly manner promotes public confidence, trust and gives equal access to all, subject to relevant legislation. It helps to avoid the perception that the release has been delayed or withheld or that figures have been open to political ‘spin’ ahead of their release. Pre-release access - what it is Pre-release access (PRA) is the practice of making official statistics, and the written commentary that accompanies them, available in advance of their publication to specified individuals only on a ‘need to know’ basis. PRA is restricted and legislated by the Pre-release access to Official Statistics Order 2008. Procedures and compliance are strict and are overseen in the UK by the UK Statistics Authority. In England and Northern Ireland, PRA is granted for a period of 24 hours before the official time of release and differs from regulations in Wales and Scotland. Supplementary guidance relating to PRA has also been issued to accompany the Code of Practice. The relevant principles and practices aligned to the Code of Practice are below:
Breaches and the consequences of them A breach of the Code of Practice for Official Statistics occurs where one or more provisions of the Code are not followed. The UK Statistics Authority may investigate possible breaches. Examples of breaches include the following:
Protocol 2, Practice 7: Subject to compliance with the rules and principles on pre-release access set out in legislation, limit access before public release to those people essential for production and publication, and for quality assurance and operational purposes. Publish records of those who have access prior to release. Protocol 2, Practice 8: Ensure that no indication of the substance of a statistical report is made public, or given to the media or any other party not recorded as eligible for access before publication.

36
A real life example of the Home Office coming under criticism for practices inconsistent with the Code, which made headline national news, involved a press release on knife crimes issued on 11 December 2008. This included early information on hospital admissions for knife related injuries against the advice of Department of Health statisticians. It resulted in an apology having to be made in the House of Commons for the premature use of a figure. Subsequently, the UK Statistics Authority, when it launched its Code of Practice on 6 January 2009, also referred to the same press release for its selective comparisons, lack of contextual information, and drawing of inappropriate conclusions (amongst other things). The report can be accessed here.
• leaks - giving an indication of the content or direction of change e.g. if results were favourable.
• sharing statistics with colleagues not granted pre-release access such as line managers.
• leaving statistics unattended on desks or printers • saving statistics in shared work areas
Breaches must be reported immediately to the body producing the statistics. A breach;
• may lead to organisations/persons involved in breaches being excluded from future pre-release access
• damages the reputation of the recipient organisation • undermines public trust in statistics
Though a breach may undermine public trust in statistics, being open about the occurrence of breaches offers a level of public accountability of the statistical service. It enhances transparency, and therefore helps to build trust in it.

37
Collecting your own data Is the data already available? An essential first step in planning the collection of data is to determine what is already available by reviewing existing data. This is important for many reasons. There may already be sufficient information to understand/address the issue so further data collection is unnecessary. By considering and reviewing what data is available the burden on police forces, and other relevant organisations, can be significantly reduced. There may be no valid, reliable and relevant data available. Existing evidence or data may be inconclusive, poor quality or may not be relevant to the specific circumstances of the local crime problem. In addition, any single source may be sample specific, time specific, or context specific, so may not be comparable or applicable to other sources. Before embarking on data collection, review existing data from a range of sources on crime and policing to understand what is available. Data is collected on crime and policing in a number of ways, including from police forces in police recorded crime data or in victimisation surveys, such as the Crime Survey for England and Wales (see section Crime and policing statistics outputs). Survey, census and administrative data
There are three main types of quantitative data collection: • census • administrative data • sample survey
A census refers to data collection about every unit in a group or population. A census is expensive to run and time consuming. Administrative data are collected as a result of an organisation's day-to-day operations. The response burden is low as the data is already collected, but data items may be limited to essential administrative information, giving less detail than a survey. Human resource records for police staff is an example of administrative data. In a sample survey, only part of the total population is approached for data. This is cheaper than a census and less time-consuming. Using a sample survey would mean that the data will be more relevant than administrative data. CSEW is an example of a sample survey. A census aims to collect information from every individual in the population. However, in reality the census figures are still estimates due to non-response to the census. The Office for National Statistics (ONS) adjusts their census estimates for non-response so that it is representative of the entire population.

38
The key advantages of a census are accuracy and reliable statistics for small sub-groups and small geographies. The main disadvantages are cost and the time it takes to make results available. In a survey only a sample of the total population is selected to complete the survey. The results of the survey are then used to make assumptions about the whole population. The key advantages of a survey over a census are the speed of producing results (as there are less data to process) and that it is much cheaper which allows for more questions and more detailed questions to be asked. The burden on the public is considered much lower as only a sample of the population is selected to respond. The disadvantages of a survey are around accuracy, as it is only possible to produce an estimate as a result of only using a sample (although steps are taken to reduce this where possible and large samples can produce very precise estimates). The sampling technique also means that it may not be possible to produce estimates for small groups or small areas if there are not enough people selected in these groups to make appropriate inferences. You can find more information about sampling strategies and the way error is introduced through the survey process on the ONS methodology pages. How to collect the data
Provide consistent guidance to those providing you with data
When requesting data, make sure the guidance provided is consistent with clear and comprehensive instructions. Be clear about the intended use of the data by explaining why the data is being collected and how it will be used. Reassure data providers about data protection practices, including how the data will be anonymised, if necessary. Police recorded crime data is an example of a Home Office data collection that has specific, consistent guidance associated with it. To ensure consistency, police recording practice is governed by Home Office Counting Rules and the National Crime Recording Standard (NCRS).These rules provide a national standard for the recording and classifying of notifiable offences by police forces in England and Wales.
Survey questionnaire design
There is a lot to consider when designing a questionnaire. A well-designed questionnaire efficiently collects the required data with a minimum number of errors. It facilitates the coding and capture of data and it leads to an overall reduction in the cost and time associated with data collection and processing. Before you can design the questionnaire, you must identify the objectives, data needs and analysis. There is a lot to consider when developing a questionnaire. The following is a list of some key points to think about:

39
• Does the question elicit the information required? • Are the words simple, direct and familiar to all respondents? • Do the questions read well? Does the overall questionnaire flow well? • Are the questions clear and as specific as possible? • Does the questionnaire begin with easy and interesting questions? • Is there a specific time reference? • Are any of the questions double-barrelled? i.e. does it ask about more than one concept in the same question? • Are any questions leading or loaded? These will undermine confidence in your results and invalidate your findings • Should the questions be open- or close-ended? • Are the questions applicable to all respondents?
Once the questionnaire is designed, it must be tested before you can proceed with the data collection.
For more detailed guidance on questionnaire design, see ONS teaching resources Section D: Questionnaire Design.
In addition, Chapter 4 of Marketing Research and Information Systems gives a good overview of questionnaire design.
Data collection techniques
Data collection techniques include interviewer-administered methods carried out in person or over the telephone, or self-completion questionnaires via e-mail, post, in person or electronically over the internet. The choice of method depends on various factors, such as complexity and length of questionnaire, sensitivity of requested information, geographical dispersion of survey population, cost and time frame. The differences between face-to-face, telephone and postal surveys, in terms of these factors, are outlined in The Magenta Book. Sample surveys
How many to survey
It is cheaper, quicker and more practical to choose a suitable representative sample to provide estimates instead of looking at every case. However, there are a number of points to consider before sampling and a calculator to determine an appropriate sample size:
• What are the key estimates for the study?

40
• How precise do those estimates need to be? (i.e. what size of standard error or confidence interval can be tolerated?)
• Are there key sub-groups for which separate estimates will be needed? • Does the survey need to be large enough to detect change over time
between surveys, or differences between key sub-groups?
The basic formula that survey statisticians use to determine the sample size (n) is:
where Z is the z-score associated with the confidence level required, E is the required precision, and p is the occurrence rate within the population. More detailed guidance on sample sizes is available from the National Audit Office in A Practical Guide to Sampling
Who to survey and how
There are many different ways to select a sample. Popular methods of sampling are listed below:
• Simple random - ensures every member of the population has an equal chance of selection.
• Stratified - the population is sub-divided into homogenous groups, for example regions, size or type of establishment.
• Quota - the aim is to obtain a sample that is representative of the population. The population is stratified by important variables and the required quota is obtained from each stratum. However, if the sample is non-random, findings cannot be generalised to the population.
• Cluster - units in the population can often be found in geographical groups or clusters e.g. schools, households. A random sample of clusters is taken, then all units within those clusters are examined.
• Systematic - after randomly selecting a starting point in the population between 1 and n, every nth unit is selected, where n equals the population size divided by the sample size.
• Convenience - using those who are willing to volunteer, or cases which are presented to you as a sample.
There are advantages and limitations associated with each method. In order to decide which method is right for your data collection exercise it is important to consider the following:
• Is generalisability needed? If yes, consider using simple random, systematic or convenience sampling.
41
• Are sub-groups required? If yes, consider using quota, cluster, stratified or systematic sampling methods.
• Are population estimates required, rather than just estimates of respondents to the survey? If yes, consider using a random sample.
More detailed guidance on sampling methodologies is available from the National Audit Office in A Practical Guide to Sampling
Variability
For a survey the aim is to select a sample which gives an estimate as close to the real answer as possible. However, if you were to repeat a survey and sample different people, you would probably get a different answer. A confidence interval provides a way of assessing the precision and reliability of the survey estimate of the true population value. This process also means that changes over time must be carefully assessed to ensure that the difference is due to a real change and is not just the result of chance due to the estimates coming from a survey. Whether the change is significant or not should be formally calculated before any claim of change is made. Confidence intervals A confidence interval is an indicator of uncertainty, i.e. the extent to which the estimate may differ from the true population value. The larger the confidence interval, the less precise the estimate. Usually 95 per cent confidence intervals are reported on. A 95% confidence interval can be interpreted as the interval within which 95 times out of 100 the true value will lie if the sample were repeated 100 times. Most basic statistics text books provide instructions on calculating confidence intervals. There are also a number of on-line calculators that can be employed or statistical software can be used. Response rates A response rate is the number who responded to the survey divided by the number in the original sample. It is usually expressed as a percentage. The type of response rate will depend on the sampling method – it may be the household response rate or the person response rate. A low response rate means that there are fewer people in the sample to use to estimate the whole population. This is likely to introduce some errors. A low response rate can be an indicator that bias has been introduced into the estimates if the response rates vary for individuals/households by characteristics relevant to the

42
survey or characteristics that might effect the concept that the survey is trying to measure.
There are two main aspects to non-response:
• refusals i.e. respondents who decline to take part in the survey and • non-contacts i.e. respondents who could not be contacted during the survey
period.
Respondents who refuse to take part in a survey tend to have different characteristics to those who took part and to those who could not be contacted. ONS are carrying out some work to look at the characteristics of non-responders to the CSEW by linking their survey records with Census records. Quality assurance Quality assurance processes should not be an afterthought. Ideally plans for quality assurance processes and standards should be included throughout the work. It is important to complete validation checks on record/source data before it is used to create output. This prevents the need to repeat analysis if errors are found and need to be corrected. Quality is often thought about in terms of whether the statistics or data are fit for purpose. However, there is no universal definition of quality as it often means something different to different people. Quality assurance covers the procedures focused on providing confidence that quality requirements have been met. The aim of quality assurance is to prevent, reduce or limit the occurrence of errors in a statistical product. Quality is sometimes thought about simply in terms of accuracy. The European Statistical Service outlines six different dimensions of quality. Details of these can be found on Eurostat’s website. The wider dimensions consider aspects like timeliness and relevance of the output. Further advice can also be found from the ONS quality centre and from the Government Statistical Service. Validating and checking best practice The types of checks carried out will depend on the data being used. Checks should be included at each stage of the process from data collection through to publication. For example, validation checks can be included for the record level data that has been collected:

43
• Are there any missing data fields where the values can be identified and added?
• Are there any ‘future dates’ for events which have occurred and therefore are clearly incorrect?
• Are there any individuals with an unrealistic birth date – age 180
It may be decided to do more detailed validation on all records with extreme values as part of the quality assurance process. Checks can also be carried out on aggregate data or the statistical outputs that have been calculated. These checks may be only around the accuracy of the calculations but should consider incorporated wider checks of the data. For example:
• Check that the total for each force sums to the overall total • Check that percentages sum to 100% • Try to use different forms of calculating statistics to check you get the same
answer • Compare the monthly value to 12 months before and look for sharp or
significant changes • Look for unusual patterns in the overall trend or for outliers
Providing indication of quality of statistics It is important to provide information to users on the quality of published statistics. Metadata should be provided to explain the data, for example:
• how the data was collected • the time period it covers • any cleaning that has been done before processing the data • any definitions • any caveats on how the data can be used
Indicators of quality can also be provided around the statistics such as confidence intervals around estimates derived from survey results (see detail below). Similarly analysis can be conducted to decide whether a change is statistically significant and this can also be highlighted in the output. It is important to recognise that changes that are not statistically significant could be the result of chance and therefore cannot inform conclusions. For administrative data indicators are more likely to be around coverage and estimate of completeness.

44
Getting statistics checked by others It is good practice to ensure appropriate and proportionate quality assurance processes are carried out by different people to those who have produced the statistics. It is important to ensure that those asked to complete quality assurance checks have the technical skills and knowledge so that errors can be identified. It is important to track the checks that have been carried out on an output and who has completed these checks. If any errors found are noted then when the analysis is next completed steps can be added to try and avoid these errors in the first place. Tracking the quality assurance process in a spreadsheet or document gives an audit trail.

45
Analysing Data Relationships and correlations When comparing two data sets it is important that any underlying differences are understood. An example would be comparing two police forces crime figures and thinking that the one with the highest number of crimes meant that you were more likely to be a victim of crime in that area, when in reality it’s just because it has a larger population. Likewise, when taking crimes from a survey and comparing with police recorded crime its important to understand the differences in the way the crimes were defined, recorded and any limitations in terms of who is covered by both data sets. This enables the user to rule out known causes of differences in the figures before claiming any kind of result. It is also important to realise that even when all known differences in data sets are taken into account the fact that two numbers are statistically different does not suggest a cause. It merely suggests the numbers are unlikely to be different purely by chance. The user can speculate at a cause for the difference but the statistics can not back that up unless additional data is used which either favours or rules out the chosen interpretation. Likewise, a correlation does not imply causation. What this means is that just because two parameters are correlated does not imply the two are linked or that one causes the other. It is instead statistical evidence for a connection but not for a direct cause. The famous example of this is if a graph is plotted of shoe size vs. reading age there is a striking correlation. However, this does not imply that the size of people’s feet controls how good at reading they are. Instead the hidden third parameter here is age which is linked to both the size of people’s feet and their reading age. Limitations / caveats When using any kind of data it is important to read and understand any caveats and limitations associated with that data. It is also important to think about any additional limitations that may or may not have been thought about or mentioned. The user will be unable to claim any kind of result unless they are aware of the limitations of the data because without that knowledge its possible the result you have found is actually just a known caveat of the data. Common limitations to consider would be the geographical location covered, population surveyed, how measurements were made or recorded, time periods covered, changes to definitions of the terms used, changes to recorded practices / survey questions or sample sizes. This list is not by any means comprehensive.

46
Seasonal effects One particular effect to be aware of with any data set collected over a period of time is whether there is any seasonal effect. If there is likely to be, then comparisons should only be made using the comparable periods of time, for example, complete years or the same months / quarters. For example, the number of drink driving related offences is known to be higher in December than other months. Therefore to look at the number of drink driving offences over the last three years you would not compare December to January, but you could compare January to January, December to December, December and January to December and January or compare complete years. Statistical significance for survey data The user of data should understand what results are statistically significant and what things are just down to random variation. With any data set there will be a degree of random variation and these need to be taken into account. Statistics gives us the ability to test how likely our results are to be down to that random variation alone by using a statistical test and therefore statistically significant results are those which are unlikely to be down to random variation alone. What this means in practice is that for example just because there were X% more crimes recorded by a force in year one than year two does not necessarily mean that you are more likely to be a victim of crime in that year or that year one was a particularly bad year for crimes. Neither of these statements can be shown to be true with a statistical test as they are speculated causes of the difference that could not be ruled out or confirmed without additional data. However, a statistical test can rule out the converse hypothesis or null hypothesis which in this example would be that a person is equally likely to be a victim of crime in each year. There are also tests which identify statistically significant correlations and a range of other results. It’s important to use an appropriate test and understand the caveats and limitations of each test which thus whether they can be applied in this particular situation.
Who to contact for further guidance
The following may be contacted for guidance or support with statistical queries:

47
Annex A: Annual Data Requirement 2013/14
Data series that are collected from police forces in England and Wales during 2013/14:
Homicide Recorded crime, detections & outcomes Recorded crime – hate crime Recorded crime – date of birth and gender collections for victims of sexual and violent crime Recorded crime-metal theft Arrests Offences involving the use of firearms Use of PACE powers Use of knives & other sharp instruments Motoring Offences Penalty notices for disorder Breath tests Issue of firearm certificates Deaths in police custody Setting up of cordons under the Terrorism Act Road traffic accidents: casualties Number of incidents recorded through NSIR Drug seizures Performance Information and HMIC data User satisfaction: performance measure Forensic Support Warrants (failure to appear) Prolific and other priority offenders Police personnel Complaints and related conduct statistics Chartered Institute of Public Finance and Accounting (CIPFA) Cyber crime (voluntary collection)