Embed Size (px)
Citation preview
NCT03426345
Study ID: RLM-MD-02
Title: A 12-week, Randomized, Double-blind, Placebo-controlled, Phase 3 Study to Evaluate the Safety and Efficacy of Relamorelin in Patients with Diabetic Gastroparesis
Statistical Analysis Plan Amendment 2 Date: 17Nov2020
Allergan PLC Page 1Relamorelin
RLM-MD-01/02 Statistical Analysis Plan (Amendment 2) 11/17/2020
1.0 Title Page
RLM-MD-01
A 12-week, Randomized, Double-blind, Placebo-controlled, Phase 3 Study to Evaluate the Safety and Efficacy of Relamorelin in Patients with Diabetic Gastroparesis
RLM-MD-02
A 12-week, Randomized, Double-blind, Placebo-controlled, Phase 3 Study to Evaluate the Safety and Efficacy of Relamorelin in Patients with Diabetic Gastroparesis
STATISTICAL ANALYSIS PLAN - Clinical Study Report
Final: 06 December 2018Amendment 1: 29 September 2020Amendment 2: 17 November 2020
Allergan PLC Page 2Relamorelin
RLM-MD-01/02 Statistical Analysis Plan (Amendment 2) 11/17/2020
2.0 Table of Contents
1.0 Title Page ........................................................................................................................................................1
2.0 Table of Contents ............................................................................................................................................22.1 List of Tables ....................................................................................................................................32.2 List of Figures ...................................................................................................................................4
3.0 List of Abbreviations.......................................................................................................................................5
4.0 Introduction .....................................................................................................................................................74.1 Study Design.....................................................................................................................................7
5.0 Objectives......................................................................................................................................................13
6.0 Populations for Analyses...............................................................................................................................146.1 Screened Population........................................................................................................................146.2 Intent-to-Treat Population...............................................................................................................146.3 Modified Intent-to-Treat Population ...............................................................................................146.4 Safety Population ............................................................................................................................14
7.0 Participant Disposition ..................................................................................................................................15
8.0 Demographics and Other Baseline Characteristics........................................................................................16
9.0 Extent of Exposure and Treatment Compliance............................................................................................179.1 Extent of Exposure..........................................................................................................................179.2 Measurement of Treatment Compliance .........................................................................................17
10.0 Efficacy Analyses..........................................................................................................................................1810.1 Primary Efficacy Parameters...........................................................................................................18
10.1.1 Primary Analysis ..............................................................................................................1910.1.2 Sensitivity Analysis for Missing data ...............................................................................19
10.2 Secondary Efficacy Parameters.......................................................................................................2110.3 Multiple Comparisons Procedure....................................................................................................22
10.5 Subgroup Analyses .........................................................................................................................2610.6 Rescue Medication..........................................................................................................................27
11.0 Safety Analyses .............................................................................................................................................2811.1 Adverse Events ...............................................................................................................................28
11.1.1 AEs of Special Interest .....................................................................................................2911.1.2 Medical Device Incidents (Including Malfunctions) ........................................................29
11.2 Clinical Laboratory Parameters.......................................................................................................3011.3 Vital Signs.......................................................................................................................................3211.4 Electrocardiogram...........................................................................................................................3311.5 Study Specific Assessments............................................................................................................34
Allergan PLC Page 3Relamorelin
RLM-MD-01/02 Statistical Analysis Plan (Amendment 2) 11/17/2020
11.6 Other Safety Parameters..................................................................................................................3411.6.1 Physical Examination .......................................................................................................3411.6.2 Potential Hy’s Law ...........................................................................................................34
11.7 Subgroup Analyses .........................................................................................................................34
13.0 Interim Analysis ............................................................................................................................................37
14.0 Determination of Sample Size.......................................................................................................................38
15.0 Statistical Software........................................................................................................................................39
16.0 Data Handling Conventions ..........................................................................................................................4016.1 Visit Time Windows .......................................................................................................................4016.2 Analysis Weeks and Visit Time Windows for Efficacy Analysis...................................................40
16.2.1 Analysis Weeks for Efficacy Analysis .............................................................................4016.2.2 Visit Windows for Efficacy Analysis ...............................................................................41
16.4 Repeated or Unscheduled Assessments of Safety Parameters ........................................................4316.5 Missing Date of the Last Dose of Study Treatment ........................................................................4316.6 Missing Severity Assessment for Adverse Events ..........................................................................4316.7 Missing Causal Relationship to Study Treatment for Adverse Events ...........................................4416.8 Missing Date Information for Adverse Events................................................................................4416.9 Missing Date Information for Prior or Concomitant Medications ..................................................45
16.9.1 Incomplete Start Date .......................................................................................................4516.9.2 Incomplete Stop Date .......................................................................................................46
16.10 Character Values of Clinical Laboratory Parameters......................................................................4716.11 Definition of Regions and Pooling..................................................................................................47
17.0 Changes to Analyses Specified in Protocol...................................................................................................48
18.0 References .....................................................................................................................................................49
2.1 List of Tables
Table 4.1–1. Schedule of Activities: Study RLM-MD-01/RLM-MD-02 .......................................................9
Table 11.1.1–1. AEs of Special Interest.............................................................................................................29
Table 11.2–1. Criteria for Potentially Clinically Significant Laboratory Tests ..............................................31
Table 11.3–1. Criteria for Potentially Clinically Significant Vital Signs........................................................33
Table 11.4–1. Criteria for Potentially Clinically Significant Electrocardiographic Values ............................34
Table 16.1–1. Visit Time Windows for Safety Analysis ................................................................................40
Table 16.2.1–1. Analysis Time Windows for Efficacy Analysis .......................................................................41
Allergan PLC Page 4Relamorelin
RLM-MD-01/02 Statistical Analysis Plan (Amendment 2) 11/17/2020
Table 16.10–1. Examples for Coding of Special Character Values for Clinical Laboratory Parameters .........47
2.2 List of Figures
Figure 4.1–1. RLM-MD-01 / RLM-MD-02 Study Schematic .........................................................................8
Allergan PLC Page 5Relamorelin
RLM-MD-01/02 Statistical Analysis Plan (Amendment 2) 11/17/2020
3.0 List of Abbreviations
aCSR abbreviated clinical study report
AE adverse event
AESI adverse event of special interest
ALT alanine aminotransferase
ALP alkaline phosphatase
ANCOVA analysis of covariance
ANOVA analysis of variance
AST aspartate aminotransferase
CFB change from baseline
CI confidence interval
CMH Cochran-Mantel-Haenszel
DG diabetic gastroparesis
DGSSD Diabetic Gastroparesis Symptom Severity Diary
DGSSS Diabetic Gastroparesis Symptom Severity Score
DGSSS-SR DGSSS Study Responder
GEBT gastric emptying breath test
eCRF electronic case report form
ECG electrocardiogram, electrocardiographic
eDiary electronic diary
EOT end of trial
ITT intent to treat
IP investigational product
LSMs Least squares means
MAR missing at random
MCMC Monte-Carlo Markov chain
MI multiple imputation
mITT modified intent to treat
MMRM mixed-effects model with repeated measures
MNAR missing not at random
OC observed cases
OR odds ratio
PCS potentially clinically significant
QTc QT interval corrected for heart rate
Allergan PLC Page 6Relamorelin
RLM-MD-01/02 Statistical Analysis Plan (Amendment 2) 11/17/2020
QTcB QT interval corrected for heart rate using the Bazett formula (QTcB = QT/(RR)½)
QTcF QT interval corrected for heart rate using the Fridericia formula (QTcF = QT/(RR)⅓)
RM rescue medication
RLM Relamorelin
SAE serious adverse event
SAP statistical analysis plan
SE standard error
SI Le Système International d’Unités (International System of Units)
SOC system organ class
TBL total bilirubin
TEAE treatment-emergent adverse event
TESAE treatment-emergent serious adverse event
TFLs Tables/Figures/Listings
V-SR vomiting study responder
Allergan PLC Page 7Relamorelin
RLM-MD-01/02 Statistical Analysis Plan (Amendment 2) 11/17/2020
4.0 Introduction
This statistical analysis plan (SAP) provides a more technical and detailed elaboration of the statistical analyses of the efficacy and safety data that will be performed for Study RLM-MD-01 and separately for study RLM-MD-02 as outlined and/or specified in their respective protocols:
RLM-MD-01: Final protocol (version dated 13 Jul 2017) and the most recent amendment (Amendment 4 dated 08 Feb 2019).
RLM-MD-02: Final protocol (version dated 3 Oct 2017) and the most recent amendment (Amendment 3 dated 05 March 2019).
Specifications of tables, figures, and data listings for each study are contained in a separate document.
The study was early/prematurely terminated on 04 September 2020 when the letter explaining termination activities was sent to all investigators. As a result, the original planned full analyses for the study are no longer applicable for the terminated study. Only abbreviated clinical study report (aCSR) for RLM-MD-01 and RLM-MD-02 will be developed.
The statistical analysis plan (SAP) amendment 2 is based on the amendment #1 SAP dated 29 Sep 2020. The major change to the amendment #1 SAP is to add descriptive analyses for the primary and secondary efficacy endpoints for the results posting on ClinicalTrials.gov and EudraCT (European Union Drug Regulating Authorities Clinical Trials Database) and add the COVID-19 data listing. Please refer to Section 19.2 Appendix 2 for details of the outlined analyses for the aCSR.
4.1 Study Design
Studies RLM-MD-01 and RLM-MD-02 are identical, designed as global, multicenter, randomized, double-blind, placebo-controlled, parallel-group in participants with diabetic gastroparesis.
In each study, approximately 600 eligible participants will be randomly assigned in a ratio of 1:1 to 1 of 2 treatment groups as follows:
Treatment Group 1: Relamorelin (RLM) 10 μg BID (n=300)
Treatment Group 2: Placebo BID (n=300)
The duration of each study is 18 weeks, including a 4-week Screening Period, a 2-week single blind Run-in Period, and a 12-week Treatment Period:
Allergan PLC Page 8Relamorelin
RLM-MD-01/02 Statistical Analysis Plan (Amendment 2) 11/17/2020
○ Run-in Period: Participants who meet initial study entry criteria during the Screening Period will enter a 2-week Run-in Period, during which they will self-administer single-blind placebo twice daily subcutaneously. Using an electronic hand-held device, participants will report their daily symptoms via the Diabetic Gastroparesis Symptom Severity Diary (DGSSD) as well as their overall global impression of status, treatment satisfaction, treatment compliance, and use of rescue medication.
○ 12-week Treatment Period: Participants who meet study entry criteria at the end of the Run-in Period, will be randomized 1:1 to blinded treatment with relamorelin 10 µg or placebo, and will continue to use the electronic hand-held device for reporting of their symptoms via the DGSSD as well as their overall global impression of status and change, treatment satisfaction, compliance, and use of rescue medication.
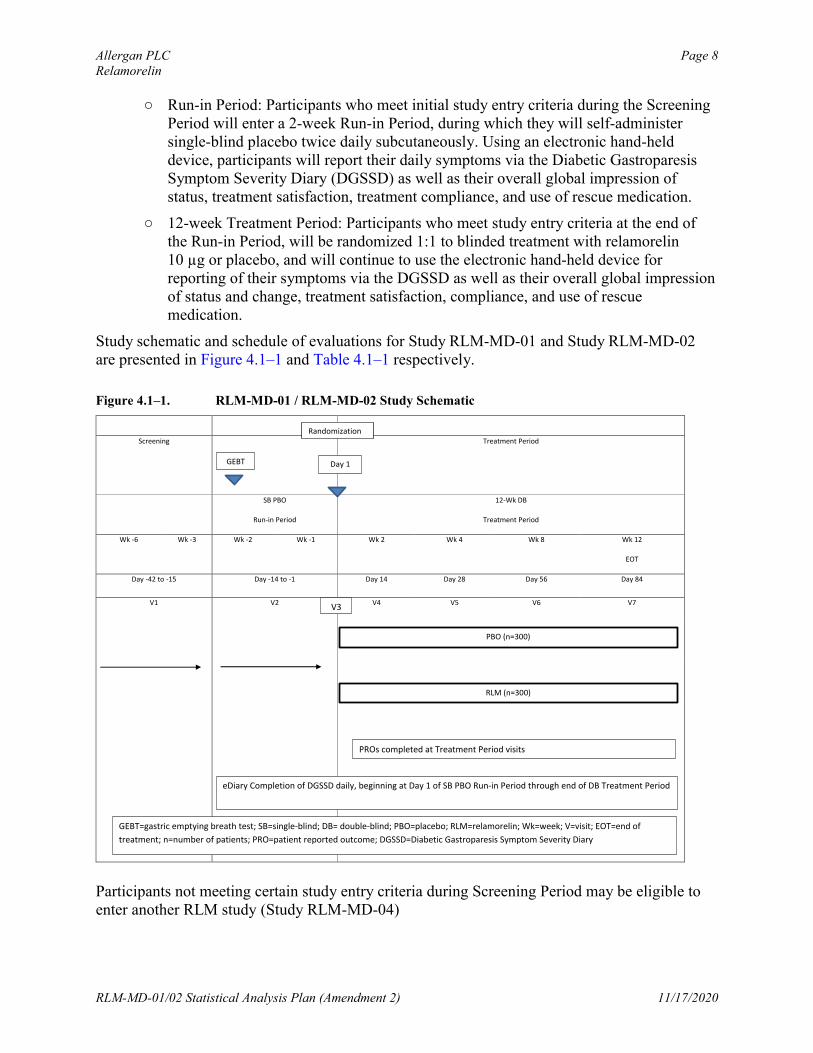
Study schematic and schedule of evaluations for Study RLM-MD-01 and Study RLM-MD-02 are presented in Figure 4.1–1 and Table 4.1–1 respectively.
Figure 4.1–1. RLM-MD-01 / RLM-MD-02 Study Schematic
Participants not meeting certain study entry criteria during Screening Period may be eligible toenter another RLM study (Study RLM-MD-04)
Screening Treatment Period
SB PBO
Run-in Period
12-Wk DB
Treatment Period
Wk -6 Wk -3 Wk -2 Wk -1 Wk 2 Wk 4 Wk 8 Wk 12
EOT
Day -42 to -15 Day -14 to -1 Day 14 Day 28 Day 56 Day 84
V1 V2 V4 V5 V6 V7
Day 1GEBT
PBO (n=300)
RLM (n=300)
PROs completed at Treatment Period visits
eDiary Completion of DGSSD daily, beginning at Day 1 of SB PBO Run-in Period through end of DB Treatment Period
GEBT=gastric emptying breath test; SB=single-blind; DB= double-blind; PBO=placebo; RLM=relamorelin; Wk=week; V=visit; EOT=end of
treatment; n=number of patients; PRO=patient reported outcome; DGSSD=Diabetic Gastroparesis Symptom Severity Diary
V3
Randomization
Allergan PLC Page 9Relamorelin
RLM-MD-01/02 Statistical Analysis Plan (Amendment 2) 11/17/2020
Allergan PLC Page 10Relamorelin
RLM-MD-01/02 Statistical Analysis Plan (Amendment 2) 11/17/2020
Allergan PLC Page 11Relamorelin
RLM-MD-01/02 Statistical Analysis Plan (Amendment 2) 11/17/2020
Allergan PLC Page 12Relamorelin
RLM-MD-01/02 Statistical Analysis Plan (Amendment 2) 11/17/2020
Allergan PLC Page 13Relamorelin
RLM-MD-01/02 Statistical Analysis Plan (Amendment 2) 11/17/2020
5.0 Objectives
For each study, the primary objectives are:
To compare the efficacy of relamorelin with placebo in participants with DG with respect to a composite of the following core signs and symptoms of DG:
○ Nausea
○ Abdominal Pain
○ Bloating
○ Postprandial fullness
To compare the efficacy of relamorelin with placebo in participants with DG with respect to vomiting frequency
For each study, the secondary objectives are:
To compare the efficacy of relamorelin with placebo in participants with DG with respect to the following individual symptoms of the DGSSS:
○ Nausea
○ Abdominal Pain
○ Bloating
○ Postprandial fullness
To compare the safety of relamorelin with placebo in participants with DG
Allergan PLC Page 14Relamorelin
RLM-MD-01/02 Statistical Analysis Plan (Amendment 2) 11/17/2020
6.0 Populations for Analyses
6.1 Screened Population
The Screened Population will consist of all participants who sign informed consent.
6.2 Intent-to-Treat Population
The Intent-to-Treat (ITT) Population will consist of all randomized participants (i.e. participants in the Screened Population who are randomized to a treatment group in the study).
6.3 Modified Intent-to-Treat Population
The Modified Intent-to-Treat (mITT) Population will consist of all randomized participants who had at least 1 post-baseline assessment of the DGSSD.
The mITT population will be used for all efficacy analyses. In efficacy analyses, participants will be included in the treatment group based on the treatment they were randomized to (i.e. regardless of the treatment they actually received).
6.4 Safety Population
The Safety Population will consist of all participants who received at least 1 dose of double-blind study treatment.
The Safety population will be used for all safety analyses. In safety summaries, participants will be included in the treatment group based on the treatment they actually received regardless of the treatment they were randomized to. In case a participant receives relamorelin 10 μg and placebo alternatively during the study, the participant will be included in the relamorelin 10 μg group for purpose of safety analyses.
Allergan PLC Page 15Relamorelin
RLM-MD-01/02 Statistical Analysis Plan (Amendment 2) 11/17/2020
7.0 Participant Disposition
The number and percentage of participants in each of the 3 study populations (Safety and ITT and mITT) will be summarized by treatment group and study center; the number of participants screened will be summarized overall only by study center.
Screen-failure participants (ie, participant who consent to participate in the clinical study but not randomized) and the associated reasons for failure to randomize will be tabulated for the screening period, the run-in period and overall for the Screened Population. The number and percentage of participants rolled over to study RLM-MD-04 will be also be tabulated for all the participants in the Screened Population who were screen-failed during the run-in period.
The number and percentage of participants who complete the double-blind treatment period and of participants who prematurely discontinue during the same period will be presented for each treatment group and pooled across treatment groups for the ITT Population. The reasons for premature discontinuation from the double-blind treatment period as recorded on the termination pages of the electronic case report forms will be summarized (number and percentage) by treatment group for the ITT Population. All participants who prematurely discontinue during thedouble-blind period will be listed by discontinuation reason for the ITT Population.
Allergan PLC Page 16Relamorelin
RLM-MD-01/02 Statistical Analysis Plan (Amendment 2) 11/17/2020
8.0 Demographics and Other Baseline Characteristics
Demographic parameters (eg, age, race, ethnicity, sex) and other baseline characteristics (weight, BMI) will be summarized in total and by treatment group for the Safety and ITT Populations.
Abnormalities in participants’ medical and surgical histories will be coded using the Medical Dictionary for Regulatory Activities, version 21.1 or newer. The number and percentage of participants with abnormalities in medical and surgical histories in each system organ class and preferred term will be summarized by treatment group for the Safety Population. Diabetic gastroparesis and diabetes mellitus history and history of diabetes gastroparesis symptoms will also be summarized by treatment group for the Safety Population.
Prior medication is defined as any medication started before the date of the first dose of double-blind study treatment. Concomitant medication is defined as any medication taken on or after the date of the first dose of double-blind study treatment. Any prior medications started more than 30 days before the date of the first dose of double-blind study treatment and any concomitant medications started after the date of the last dose of double-blind study treatment will not be presented in the summary tables, but will be included in the participant data listings.
Both prior and concomitant medication use will be summarized by the number and proportion of participants in each treatment group for the Safety Population. The WHO Drug Dictionary, Version B2 March 2017 or newer, will be used to classify prior and concomitant medications byWHO Drug Anatomical/Therapeutic/Chemical category and drug preferred name. Multiple medications used by a participant will only be counted once for the coded drug preferred name or therapeutic class.
Allergan PLC Page 17Relamorelin
RLM-MD-01/02 Statistical Analysis Plan (Amendment 2) 11/17/2020
9.0 Extent of Exposure and Treatment Compliance
9.1 Extent of Exposure
Exposure to the study treatment for the Safety Population during the double-blind treatment period will be summarized for treatment duration, calculated from the eDiary as the number of days from the date of the first dose of study treatment to the date of the last dose of study treatment, inclusive. Descriptive statistics (number of participants, mean, SD, median, Q1, Q3, minimum, and maximum) will be presented by treatment group. The date of first dose is the date of randomization(date of baseline visit).
Patient-years, defined as duration of exposure to the study treatment in years, will be summarized by treatment for the Safety Population.
9.2 Measurement of Treatment Compliance
Dosing compliance for a specified period is defined as the number of injections actually taken by a participant during that period divided by the number of injections expected for the same period multiplied by 100. The number of injections actually taken is obtained from the participants’ responses in the item of ‘How many injections of study medication have you administered today?’ from the electronic hand-held device. The number of injections expected during a period is the number of days in the period multiplied by 2.
Descriptive statistics for study drug compliance will be presented by treatment group for each treatment week, for the last 6-week treatment period (i.e., Week 7-12) and for the whole double-blind treatment period (ie, Week 1-12), based on the Safety Population. Weeks are defined relative to randomization day as described in Section 16.0.

Allergan PLC Page 18Relamorelin
RLM-MD-01/02 Statistical Analysis Plan (Amendment 2) 11/17/2020
10.0 Efficacy Analyses
The efficacy analyses will be based on the mITT Population.
Most efficacy parameters will be derived from the DGSSD, a 7-item, patient-reported daily diary designed to assess the severity of 6 core signs and symptoms of DG—nausea, abdominal pain, postprandial fullness, bloating, vomiting, and early satiety—and the frequency of vomiting episodes (Appendix 1). For purposes of the analyses, weekly values will be calculated from the daily e-diary data as described in Section 16.3 of this SAP. For weeks with less than 4 days of available DGSSD data, weekly values will be set to missing.
Baseline values for parameters are derived from the DGSSD collected in the Run-in period,(ie, Diabetic Gastroparesis Symptom Severity Score (DGSSS: sum of nausea, abdominal pain, postprandial fullness, and bloating), nausea, abdominal pain, postprandial fullness, bloating, early satiety, vomiting frequency and vomiting severity) following the steps below:
Weekly value for Week -2 and Week -1 will be the average value of DGSSD in the week (See the analysis week definition for Week -2 and Week -1 in Section 16.2.1);
Baseline will be the average of the two weekly values of Week -2 and Week -1.
All statistical tests will be 2-sided hypothesis tests performed at the 5% level of significance for main effects. All confidence intervals will be 2-sided 95% confidence interval, unless stated otherwise.
10.1 Primary Efficacy Parameters
There are two primary efficacy parameters in each study as follows:
a) Change from Baseline to Week 12 in the weekly DGSSS: Baseline is the average of the 2 weekly DGSSS from the 2-week, placebo Run-in Period.
b) Vomiting Study Responder (V-SR): A Vomiting Study Responder is defined as a participant with zero weekly vomiting episodes during each of the last 6 weeks of the 12-week Treatment Period.
In this study, the primary efficacy analysis (see Section 10.1.1 below) is said to have achieved the primary study objective if it indicates that relamorelin is superior to placebo for testing on at least one of the two primary efficacy parameters (following the specified multiplicity testing procedure as described in Section 10.3).
Allergan PLC Page 19Relamorelin
RLM-MD-01/02 Statistical Analysis Plan (Amendment 2) 11/17/2020
10.1.1 Primary Analysis
10.1.1.1 Change from Baseline to Week 12 in the Weekly DGSSS
The primary efficacy parameter, the change from baseline to Week 12 in the weekly DGSSS, will be analyzed using a longitudinal, mixed-effects model with repeated measures (MMRM) approach.
The MMRM model will include fixed effects for geographic region, treatment, week, treatment-by-week interaction, as well as baseline and baseline-by-week interaction values as the covariates with unstructured variance-covariance matrix being common to all participants for the repeated measures over weeks. In case the model will not converge with the unstructured covariance structure, the Toeplitz structure (TOEP) will be used instead. Least square (LS) mean changes from baseline for each treatment group, and LS mean difference between RLM group and placebo group, and the associated 95% confidence interval for the difference will be provided, along with the reported p-values (two-sided).
In addition, cumulative distribution function plot will be presented for the change from baseline to Week 12 in the Weekly DGSSS for each treatment group.
10.1.1.2 Vomiting Study Responder (V-SR)
For the primary efficacy responder parameter V-SR, the proportion of responders in the RLM group and the placebo group will be analyzed by the Cochran-Mantel-Haenszel (CMH) test controlling for geographic region. The number, percentage, and the 95% confidence interval for the percentage of Responders by treatment group, the difference in responder rates between the RLM and the placebo group and its corresponding 95% confidence interval, and the 2-sided p-value associated with the above CMH test will be presented. The Mantel-Haenszel estimate of odds ratio (RLM divided by Placebo) - controlling for geographic region- and the corresponding 95% confidence interval will also be provided.
A participant will be considered a vomiting study non-Responder (ie not a V-SR) if the weekly number of vomiting episodes is missing for any of the last 6 weeks of the 12-week Treatment Period.
10.1.2 Sensitivity Analysis for Missing data
Missing weekly DGSSS and missing number of weekly vomiting episodes will be imputed using multiple imputation (MI) approaches. MI will be performed under Missing at Random (MAR) and Missing not at random (MNAR) assumptions using the SAS/STAT procedures PROC MI and PROC MIANALYZE.
10.1.2.1 Sensitivity Analysis for Missing Data of Vomiting Study Responder
MI for V-SR will be performed under both MAR and MNAR assumptions. We will follow the steps below to generate datasets and analyze the data:
Allergan PLC Page 20Relamorelin
RLM-MD-01/02 Statistical Analysis Plan (Amendment 2) 11/17/2020
1. Imputed datasets generation
a) Missing at Random (MAR): The imputation of post baseline weekly values will be based on a multivariate normal distribution. In each imputation, a Monte-Carlo Markov chain (MCMC) method will be used to impute the missing values of post baseline weekly values from the observed data of the same group. The initial mean vector and covariance matrix for the MCMC will be obtained using an expectation–maximization algorithm.
b) Missing not at random (MNAR): The implementation of the pattern-mixture model with control-based pattern imputation of Ratitch and O’Kelly (2011) will be used to impute missing data under the MNAR assumption.
o Intermittent (non-monotone) missing data in both treatment groups are imputed using the MCMC method under the MAR assumption as described in Step 1- a.
o remaining monotone missing data are imputed using a pattern-mixture model approach using a sequential regression imputation model estimated based on data from the placebo arm only.
Imputed values for the number of weekly vomiting episodes will be restricted to ≥ 0 post imputation. 50 imputed datasets will be generated.
2. Calculate V-SR rate in the imputed datasets.
3. Model-based key estimates (odds ratio and standard error) will be obtained for V-SR foreach imputed dataset using the same method as described in Section 10.1.1.2.
4. Take the log transformation for odds ratio (log(OR)) and calculate standard error of transformed estimate (SE(log(OR))) in each imputed dataset. SE(log(OR)) is obtainedfrom the log-transformed lower and upper confidence limits for the odds ratio estimate.
5. Output the combined log(OR), SE(log(OR)), and p-values for all imputed datasets using PROC MIANALYZE.
6. Back transform the combined results of OR and SE and calculate 95% CI, by taking the exponentiation of the point estimates for log(OR) and for the lower and upper CI limits for log(OR) (Ratittch et al. ,2013).
Allergan PLC Page 21Relamorelin
RLM-MD-01/02 Statistical Analysis Plan (Amendment 2) 11/17/2020
10.1.2.2 Sensitivity Analysis for Missing Data of Change from Baseline in the Weekly DGSSS
MMRM analysis of change from baseline in the weekly DGSSS is based on the assumption of MAR and this approach uses available data including data from participants with partial data to estimate the mean treatment effect without filling in the missing data (Mallinchrod et al., 2008). Thus, MI for change from baseline in the weekly DGSSS will be performed only under MNAR assumption. The following steps will be followed to generate datasets and analyze the data:
1. Imputed datasets generation: Use the method as described in Step 1 Part b) in
Section 10.1.2.1 to generate 50 datasets. Imputed values for change from baseline in the
weekly DGSSS will be restricted to ≥ -40 and <=40.
2. Model based key estimates (LSMean difference between treatment group and standard
error) will be obtained for the change from baseline to week 12 in the weekly DGSSS for
each imputed dataset using the same method as described in Section 10.1.1.1.
3. Calculation of the combined mean difference, 95% CI, and p-value for the change from
baseline to week 12 in the weekly DGSSS will be done using the method proposed by
Rubin (1987) via PROC MIANALYZE.
10.2 Secondary Efficacy Parameters
There are four secondary efficacy parameters, which are all defined for the last 6 weeks of the 12-week Treatment Period, as follows:
Nausea responder: a study participant is considered a nausea responder for the study if he/she has an improvement of ≥ 2-points in the weekly nausea symptom score for each of the last 6 weeks during the 12-week Treatment Period.
Abdominal pain responder: a study participant is considered an abdominal pain responder for the study if he/she has an improvement of ≥ 2-points in the weekly abdominal pain symptom score for each of the last 6 weeks during the 12-week Treatment Period.
Bloating responder: a study participant is considered a bloating responder for the study if he/she has an improvement of ≥ 2-points in the weekly bloating symptom score for each of the last 6 weeks during the 12-week Treatment Period.
Postprandial fullness responder: a study participant is considered a postprandial fullness responder for the study if he/she has improvement of ≥ 2-points in the weekly postprandial fullness symptom score for each of the last 6 weeks during the 12-week Treatment Period.
Allergan PLC Page 22Relamorelin
RLM-MD-01/02 Statistical Analysis Plan (Amendment 2) 11/17/2020
If a participant does not have individual item data for a particular symptom during any of the last 6 weeks of the 12-week Treatment Period, then the participant will not be considered a study responder for that symptom.
The proportion of responders in the RLM treatment group and placebo group for each secondary efficacy parameter will be analyzed using the analysis method as described for the V-RS primary parameter (Section 10.1.1.2).
10.3 Multiple Comparisons Procedure
The overall study Type 1 error will be controlled for the 6 efficacy parameters, 2 primary and 4 secondary parameters, as defined above (Sections 10.1 and 10.2). To control the overall type-1 error rate of the study, the hypotheses of interest will be grouped into the following two families:
Family 1:
○ Hypothesis H1: Comparison of relamorelin vs. placebo in change from baseline to Week 12 in the Weekly DGSSS
○ Hypothesis H2: Comparison of relamorelin vs. placebo in proportion of participants who achieved responder status for V-SR
Family 2:
○ Hypotheses H3-H6: Comparison of relamorelin vs. placebo in the response rates of the individual symptoms comprising DGSSS (ie, nausea, abdominal pain, bloating and postprandial fullness)
Then, multiple testing will be performed in two steps (Dmitrienko et. al., 2008) as follows:
Step 1: Treatment comparisons to placebo in change from baseline to Week 12 in the Weekly DGSSS and vomiting response rates will be performed using the truncated Holm test at alpha=0.05. A truncation parameter of 0.5 will be used. According to this procedure, the smallest and largest p-values will be compared to the critical values of 0.025 and 0.0375 respectively in a step-down manner (i.e. starting with the smallest p-value and stopping the testing with the first non-rejected hypothesis).
Step 2: If any of the comparisons at Step 1 is significant, the treatment comparisons to placebo in the individual symptoms response rates will be performed using the regular Holm test at a level alpha that depends on the unused alpha from Step 1 as follows:
1) If both H1 and H2 are both rejected in Step 1, H3-H6 will be tested using an overall alpha=0.05
2) If only one of H1 and H2 is rejected in Step 1, H3-H6 will be tested using an overall alpha=0.0125
3) If none of H1 and H2 is rejected, the testing procedure will be stopped and H3-H6 are not tested
Allergan PLC Page 23Relamorelin
RLM-MD-01/02 Statistical Analysis Plan (Amendment 2) 11/17/2020
According to the above procedure, the k-th ordered p-value in 1) and 2) in Step 2 will be compared to the critical values of alpha/(4-k+1), k=1, , 4, in a step-down manner (i.e. starting with the smallest p-value and stopping the testing with the first non-rejected hypothesis), where alpha is the significance level from Step 2.
Allergan PLC Page 24Relamorelin
RLM-MD-01/02 Statistical Analysis Plan (Amendment 2) 11/17/2020
Allergan PLC Page 25Relamorelin
RLM-MD-01/02 Statistical Analysis Plan (Amendment 2) 11/17/2020
Allergan PLC Page 26Relamorelin
RLM-MD-01/02 Statistical Analysis Plan (Amendment 2) 11/17/2020
10.5 Subgroup Analyses
The analyses of the primary parameters will be presented by selected subgroups as below:
Diabetes type (Type I / Type II)
Baseline HbA1c (<9% vs >=9%)
Gender
These subgroup analyses will be contingent on the presence of an adequate number of participants in each subgroup. Only descriptive summary in the study level will be provided.Statistical comparisons within subgroups based on the pooled data will be performed separatelyin the integrated efficacy analysis.
Allergan PLC Page 27Relamorelin
RLM-MD-01/02 Statistical Analysis Plan (Amendment 2) 11/17/2020
For the analyses of diabetes subgroups, participants will be classified as having Type I Diabetes Mellitus if “Type 1 Diabetes Mellitus” is selected as their answer on the Diabetic Gastroparesis and Diabetes Mellitus History eCRF page and/or if the results of T1DM antibody tests at the baseline visit (V3) include at least one positive result for the 3 T1DM antibodies being tested (Anti-GAD Antibody ≥ 5.00 U/mL = positive, IA2 Autoantibody ≥ 7.50 U/mL = positive, Zn-T8 Antibody ≥ 15 U/mL = positive). Participants with history of Type 2 Diabetes Mellitus and no positive result on any the 3 different T1DM antibodies will be classified as Type II Diabetes Mellitus.
10.6 Rescue Medication
The proportion of participants who took any rescue medication (RM) will be presented by week and treatment, and by treatment for the entire duration of the 12-week double-blind treatment period. Rescue medication use will also be summarized as percent of days with RM use, calculated for each participant as the number of days with RM over the number of days in the entire double-blind treatment period.
To assess the impact of rescue medication use on the assessment of effectiveness, the analyses for the primary parameters will be repeated but with the weekly DGSSS and vomiting frequency values considered missing following use of RM for two days or more during a week. As a result, participants with two or more than two days of RM use during a week for one or more weeks during the last 6 weeks of treatment will not be considered as Vomiting Study Responders.
Allergan PLC Page 28Relamorelin
RLM-MD-01/02 Statistical Analysis Plan (Amendment 2) 11/17/2020
11.0 Safety Analyses
The safety analysis will be performed using the Safety Population. The safety parameters will include adverse events (AEs), clinical laboratory, electrocardiogram, and vital sign parameters.
For each safety parameter of the clinical laboratory, electrocardiogram, and vital sign parameters, the last nonmissing safety assessment before the first dose of double-blind investigational product will be used as the baseline for all analyses of that safety parameter. Continuous variables will be summarized by number of participants and mean, SD, median, Q1, Q3, minimum, and maximum values. Categorical variables will be summarized by number and percentage of participants.
11.1 Adverse Events
Adverse events will be coded by system organ class and preferred term using the Medical Dictionary for Regulatory Activities (MedDRA), version 21.1 or newer.
An AE will be considered a treatment-emergent adverse event (TEAE) if the AE began orworsened (increased in severity or became serious) on or after the date of the first dose of double-blind study intervention. However, an AE that occurs more than 30 days after the last dose of study intervention will not be counted as a TEAE. Per case report form instructions, a new AE record will be created with a new AE onset date for any AE that worsens. Therefore,TEAEs can simply be identified as those AEs with recorded onset date on or after the date of the first dose of double-blind study intervention and within 30 days of the last dose of double-blind study intervention.
An AE will be considered a treatment-emergent SAE (TESAE) if it is a TEAE that also meets SAE criteria. The number and percent of participants with TEAEs, TEAEs leading to discontinuation, Deaths, and TESAEs will be presented by treatment.
The number and percentage of participants reporting TEAEs in each treatment group will be tabulated by descending percentage in the RLM group, by system organ class (SOC) and preferred term and by system organ class, preferred term, and severity.
The number and percentage of participants reporting treatment related TEAEs will be tabulated by system organ class and preferred term.
If more than 1 AE is coded to the same preferred term for the same participant, the participantwill be counted only once for that preferred term using the greatest severity for the summarization by severity.
The number and percentage of participants in the Safety Population who have TEAEs leading to premature discontinuation of the study treatment will be summarized by SOC/ preferred term and treatment.
The incidence of common (≥ 2% of participants in any treatment group) TEAEs will be summarized by system organ class, preferred term, and treatment group.
Allergan PLC Page 29Relamorelin
RLM-MD-01/02 Statistical Analysis Plan (Amendment 2) 11/17/2020
The number and percentage of participants who have TESAE will be summarized by SOC/preferred term and treatment group.
In addition, separate tabular displays for participants who died, participants with SAEs, participants with TEAEs leading to premature discontinuation will be presented.
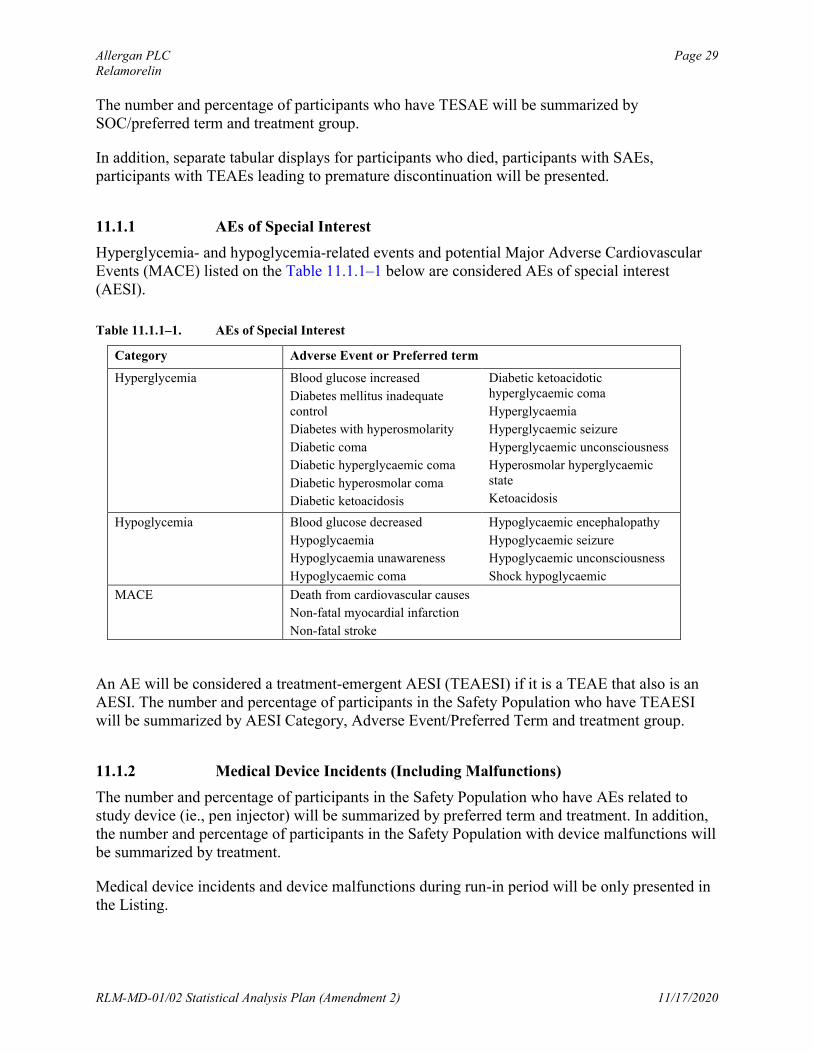
11.1.1 AEs of Special Interest
Hyperglycemia- and hypoglycemia-related events and potential Major Adverse Cardiovascular Events (MACE) listed on the Table 11.1.1–1 below are considered AEs of special interest (AESI).
Table 11.1.1–1. AEs of Special Interest
Category Adverse Event or Preferred term
Hyperglycemia Blood glucose increased
Diabetes mellitus inadequate control
Diabetes with hyperosmolarity
Diabetic coma
Diabetic hyperglycaemic coma
Diabetic hyperosmolar coma
Diabetic ketoacidosis
Diabetic ketoacidotic hyperglycaemic coma
Hyperglycaemia
Hyperglycaemic seizure
Hyperglycaemic unconsciousness
Hyperosmolar hyperglycaemic state
Ketoacidosis
Hypoglycemia Blood glucose decreased
Hypoglycaemia
Hypoglycaemia unawareness
Hypoglycaemic coma
Hypoglycaemic encephalopathy
Hypoglycaemic seizure
Hypoglycaemic unconsciousness
Shock hypoglycaemic
MACE Death from cardiovascular causes
Non-fatal myocardial infarction
Non-fatal stroke
An AE will be considered a treatment-emergent AESI (TEAESI) if it is a TEAE that also is an AESI. The number and percentage of participants in the Safety Population who have TEAESI will be summarized by AESI Category, Adverse Event/Preferred Term and treatment group.
11.1.2 Medical Device Incidents (Including Malfunctions)
The number and percentage of participants in the Safety Population who have AEs related to study device (ie., pen injector) will be summarized by preferred term and treatment. In addition, the number and percentage of participants in the Safety Population with device malfunctions will be summarized by treatment.
Medical device incidents and device malfunctions during run-in period will be only presented in the Listing.
Allergan PLC Page 30Relamorelin
RLM-MD-01/02 Statistical Analysis Plan (Amendment 2) 11/17/2020
11.2 Clinical Laboratory Parameters
Descriptive statistics for clinical laboratory values (in SI units) and changes from the baseline values at each assessment time point will be presented by treatment group for the following laboratory parameters:
Hematology Platelet count RBC count Hemoglobin Hematocrit% Reticulocytes WBC count Neutrophils LymphocytesMonocytes Eosinophils Basophils
Clinical BUN Creatinine Fasting blood glucose Hemoglobin A1c Chemistry Potassium Chloride Bicarbonate Sodium
Calcium Phosphorus Uric acid Aspartate aminotransferase Alanine aminotransferase Alkaline phosphatase Total bilirubin Direct bilirubin Total proteinAlbumin cholesterol triglycerides HDL cholesterol LDL cholesterol
Other Laboratory C-peptide
Assessments
Urinalysis pH Specific gravity
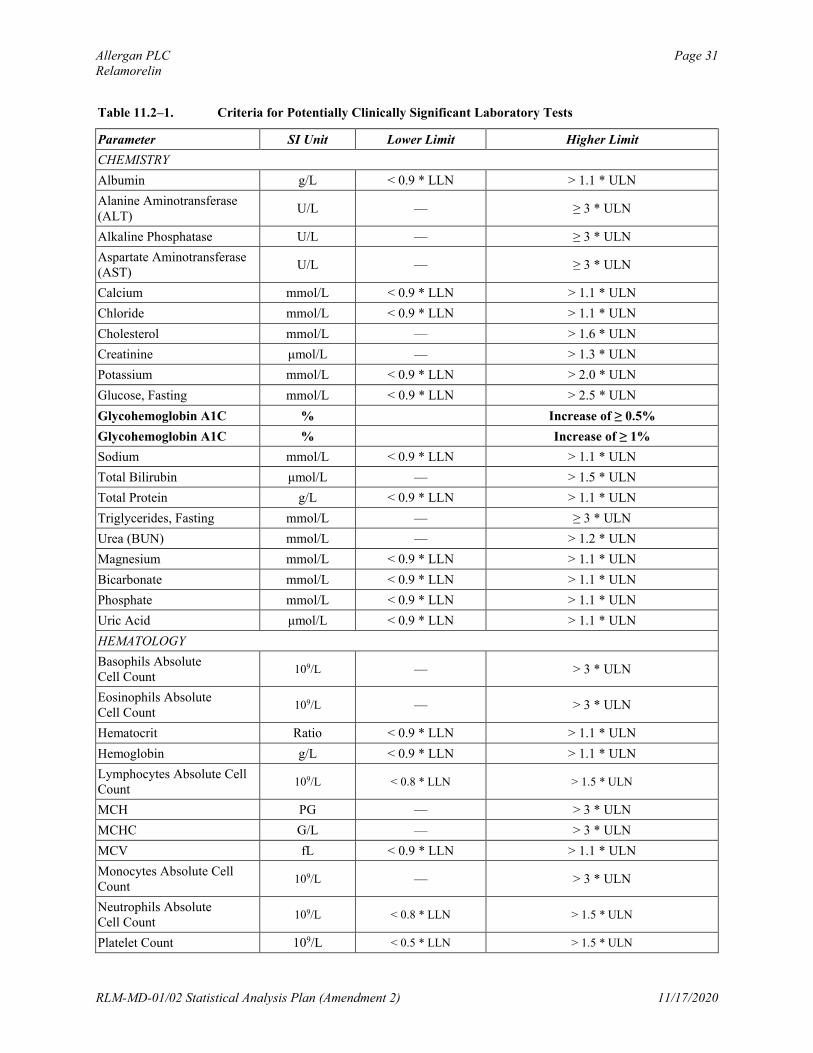
Clinical laboratory test values will be considered potentially clinically significant (PCS) if they meet either the lower-limit or higher-limit PCS criteria listed in Table 11.2–1. The number and percentage of participants who have PCS postbaseline clinical laboratory values will be tabulated by treatment group for the double-blind Treatment Period. The percentages will be calculated relative to the number of participants with available non-PCS baseline values and at least 1 postbaseline assessment for the double-blind treatment period. The numerator will be the total number of participants with available non-PCS baseline values and at least 1 PCS postbaseline value for the double-blind Treatment Period. A supportive tabular display of participants with PCS postbaseline values will be provided, including the PID number, trial center number, and baseline and all postbaseline (including non-PCS) values.
In addition, tabular displays showing all AEs that occurred in participants who had PCS postbaseline clinical laboratory values will be provided.
Shift tables from baseline to end of trial (EOT) for clinical laboratory parameters will be presented by treatment group for the following categories: low, normal, and high.
Allergan PLC Page 31Relamorelin
RLM-MD-01/02 Statistical Analysis Plan (Amendment 2) 11/17/2020
Table 11.2–1. Criteria for Potentially Clinically Significant Laboratory Tests
Parameter SI Unit Lower Limit Higher Limit
CHEMISTRY
Albumin g/L < 0.9 * LLN > 1.1 * ULN
Alanine Aminotransferase (ALT)
U/L — ≥ 3 * ULN
Alkaline Phosphatase U/L — ≥ 3 * ULN
Aspartate Aminotransferase (AST)
U/L — ≥ 3 * ULN
Calcium mmol/L < 0.9 * LLN > 1.1 * ULN
Chloride mmol/L < 0.9 * LLN > 1.1 * ULN
Cholesterol mmol/L — > 1.6 * ULN
Creatinine μmol/L — > 1.3 * ULN
Potassium mmol/L < 0.9 * LLN > 2.0 * ULN
Glucose, Fasting mmol/L < 0.9 * LLN > 2.5 * ULN
Glycohemoglobin A1C % Increase of ≥ 0.5%
Glycohemoglobin A1C % Increase of ≥ 1%
Sodium mmol/L < 0.9 * LLN > 1.1 * ULN
Total Bilirubin μmol/L — > 1.5 * ULN
Total Protein g/L < 0.9 * LLN > 1.1 * ULN
Triglycerides, Fasting mmol/L — ≥ 3 * ULN
Urea (BUN) mmol/L — > 1.2 * ULN
Magnesium mmol/L < 0.9 * LLN > 1.1 * ULN
Bicarbonate mmol/L < 0.9 * LLN > 1.1 * ULN
Phosphate mmol/L < 0.9 * LLN > 1.1 * ULN
Uric Acid μmol/L < 0.9 * LLN > 1.1 * ULN
HEMATOLOGY
Basophils Absolute Cell Count
109/L — > 3 * ULN
Eosinophils Absolute Cell Count
109/L — > 3 * ULN
Hematocrit Ratio < 0.9 * LLN > 1.1 * ULN
Hemoglobin g/L < 0.9 * LLN > 1.1 * ULN
Lymphocytes Absolute Cell Count
109/L < 0.8 * LLN > 1.5 * ULN
MCH PG — > 3 * ULN
MCHC G/L — > 3 * ULN
MCV fL < 0.9 * LLN > 1.1 * ULN
Monocytes Absolute Cell Count
109/L — > 3 * ULN
Neutrophils Absolute Cell Count
109/L < 0.8 * LLN > 1.5 * ULN
Platelet Count 109/L < 0.5 * LLN > 1.5 * ULN
Allergan PLC Page 32Relamorelin
RLM-MD-01/02 Statistical Analysis Plan (Amendment 2) 11/17/2020
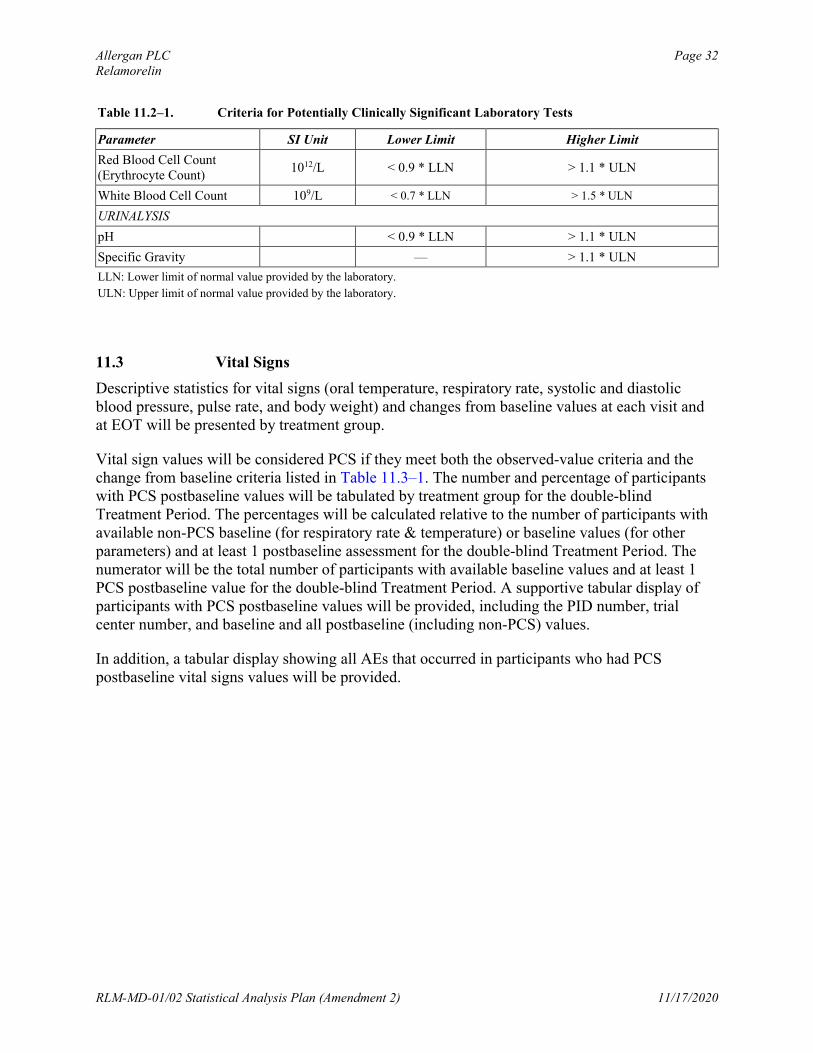
Table 11.2–1. Criteria for Potentially Clinically Significant Laboratory Tests
Parameter SI Unit Lower Limit Higher Limit
Red Blood Cell Count(Erythrocyte Count)
1012/L < 0.9 * LLN > 1.1 * ULN
White Blood Cell Count 109/L < 0.7 * LLN > 1.5 * ULN
URINALYSIS
pH < 0.9 * LLN > 1.1 * ULN
Specific Gravity — > 1.1 * ULN
LLN: Lower limit of normal value provided by the laboratory.
ULN: Upper limit of normal value provided by the laboratory.
11.3 Vital Signs
Descriptive statistics for vital signs (oral temperature, respiratory rate, systolic and diastolic blood pressure, pulse rate, and body weight) and changes from baseline values at each visit and at EOT will be presented by treatment group.
Vital sign values will be considered PCS if they meet both the observed-value criteria and the change from baseline criteria listed in Table 11.3–1. The number and percentage of participants with PCS postbaseline values will be tabulated by treatment group for the double-blind Treatment Period. The percentages will be calculated relative to the number of participants with available non-PCS baseline (for respiratory rate & temperature) or baseline values (for other parameters) and at least 1 postbaseline assessment for the double-blind Treatment Period. The numerator will be the total number of participants with available baseline values and at least 1 PCS postbaseline value for the double-blind Treatment Period. A supportive tabular display of participants with PCS postbaseline values will be provided, including the PID number, trialcenter number, and baseline and all postbaseline (including non-PCS) values.
In addition, a tabular display showing all AEs that occurred in participants who had PCS postbaseline vital signs values will be provided.
Allergan PLC Page 33Relamorelin
RLM-MD-01/02 Statistical Analysis Plan (Amendment 2) 11/17/2020
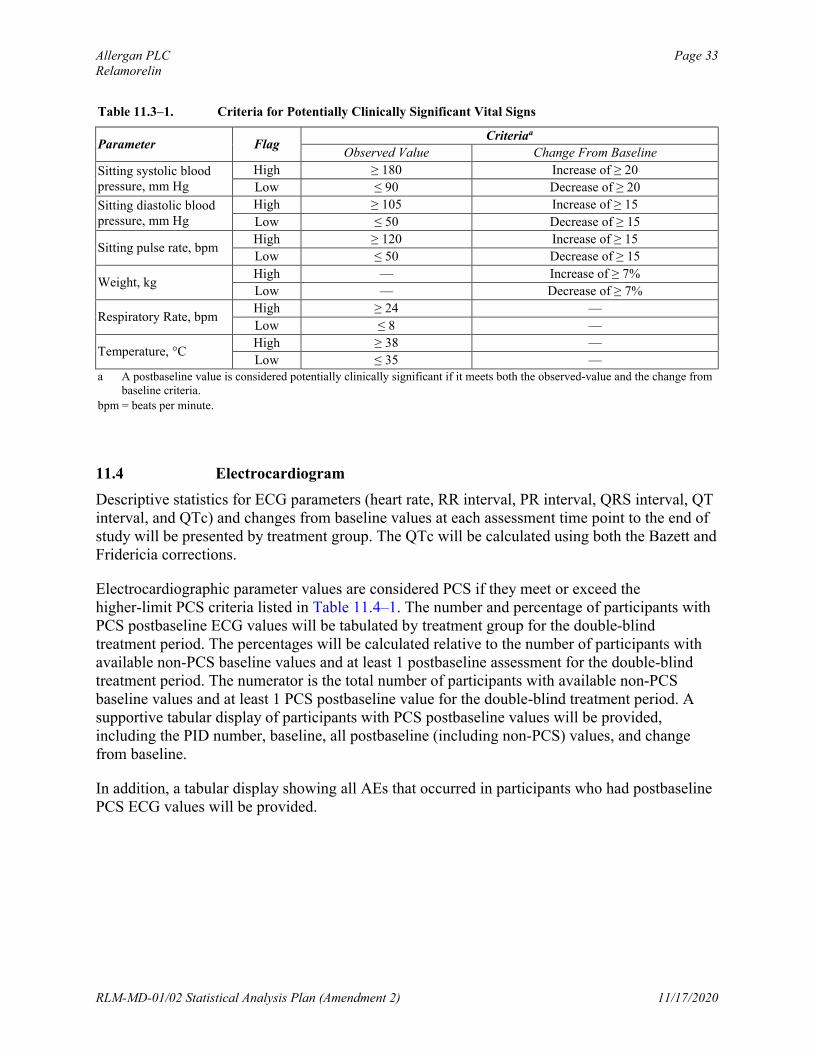
Table 11.3–1. Criteria for Potentially Clinically Significant Vital Signs
Parameter FlagCriteriaa
Observed Value Change From Baseline
Sitting systolic blood pressure, mm Hg
High ≥ 180 Increase of ≥ 20
Low ≤ 90 Decrease of ≥ 20
Sitting diastolic blood pressure, mm Hg
High ≥ 105 Increase of ≥ 15
Low ≤ 50 Decrease of ≥ 15
Sitting pulse rate, bpmHigh ≥ 120 Increase of ≥ 15
Low ≤ 50 Decrease of ≥ 15
Weight, kgHigh — Increase of ≥ 7%
Low — Decrease of ≥ 7%
Respiratory Rate, bpmHigh ≥ 24 —
Low ≤ 8 —
Temperature, °CHigh ≥ 38 —
Low ≤ 35 —a A postbaseline value is considered potentially clinically significant if it meets both the observed-value and the change from
baseline criteria.
bpm = beats per minute.
11.4 Electrocardiogram
Descriptive statistics for ECG parameters (heart rate, RR interval, PR interval, QRS interval, QT interval, and QTc) and changes from baseline values at each assessment time point to the end of study will be presented by treatment group. The QTc will be calculated using both the Bazett and Fridericia corrections.
Electrocardiographic parameter values are considered PCS if they meet or exceed the higher-limit PCS criteria listed in Table 11.4–1. The number and percentage of participants with PCS postbaseline ECG values will be tabulated by treatment group for the double-blind treatment period. The percentages will be calculated relative to the number of participants with available non-PCS baseline values and at least 1 postbaseline assessment for the double-blind treatment period. The numerator is the total number of participants with available non-PCS baseline values and at least 1 PCS postbaseline value for the double-blind treatment period. A supportive tabular display of participants with PCS postbaseline values will be provided, including the PID number, baseline, all postbaseline (including non-PCS) values, and change from baseline.
In addition, a tabular display showing all AEs that occurred in participants who had postbaseline PCS ECG values will be provided.
Allergan PLC Page 34Relamorelin
RLM-MD-01/02 Statistical Analysis Plan (Amendment 2) 11/17/2020
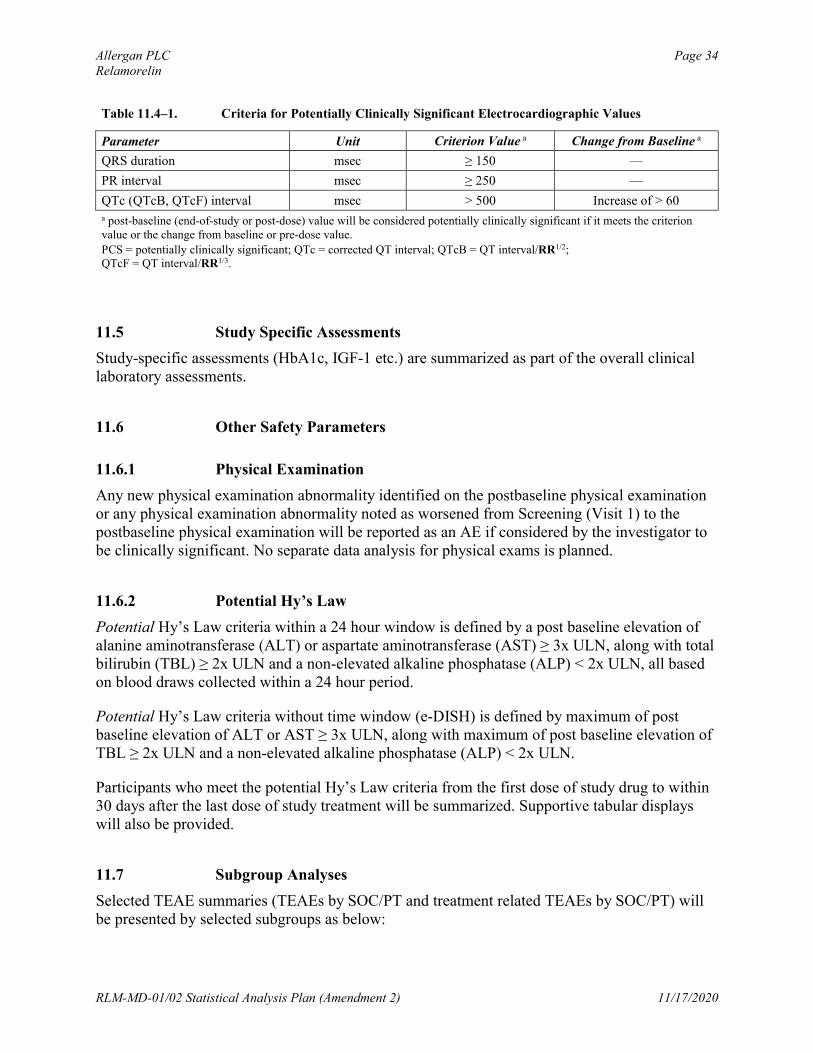
Table 11.4–1. Criteria for Potentially Clinically Significant Electrocardiographic Values
Parameter Unit Criterion Value a Change from Baseline a
QRS duration msec ≥ 150 —
PR interval msec ≥ 250 —
QTc (QTcB, QTcF) interval msec > 500 Increase of > 60a post-baseline (end-of-study or post-dose) value will be considered potentially clinically significant if it meets the criterion value or the change from baseline or pre-dose value.
PCS = potentially clinically significant; QTc = corrected QT interval; QTcB = QT interval/RR1/2;QTcF = QT interval/RR1/3.
11.5 Study Specific Assessments
Study-specific assessments (HbA1c, IGF-1 etc.) are summarized as part of the overall clinical laboratory assessments.
11.6 Other Safety Parameters
11.6.1 Physical Examination
Any new physical examination abnormality identified on the postbaseline physical examination or any physical examination abnormality noted as worsened from Screening (Visit 1) to the postbaseline physical examination will be reported as an AE if considered by the investigator to be clinically significant. No separate data analysis for physical exams is planned.
11.6.2 Potential Hy’s Law
Potential Hy’s Law criteria within a 24 hour window is defined by a post baseline elevation of alanine aminotransferase (ALT) or aspartate aminotransferase (AST) ≥ 3x ULN, along with total bilirubin (TBL) ≥ 2x ULN and a non-elevated alkaline phosphatase (ALP) < 2x ULN, all based on blood draws collected within a 24 hour period.
Potential Hy’s Law criteria without time window (e-DISH) is defined by maximum of post baseline elevation of ALT or AST ≥ 3x ULN, along with maximum of post baseline elevation of TBL ≥ 2x ULN and a non-elevated alkaline phosphatase (ALP) < 2x ULN.
Participants who meet the potential Hy’s Law criteria from the first dose of study drug to within 30 days after the last dose of study treatment will be summarized. Supportive tabular displays will also be provided.
11.7 Subgroup Analyses
Selected TEAE summaries (TEAEs by SOC/PT and treatment related TEAEs by SOC/PT) will be presented by selected subgroups as below:
Allergan PLC Page 35Relamorelin
RLM-MD-01/02 Statistical Analysis Plan (Amendment 2) 11/17/2020
Diabetes type (Type I / Type II)
Baseline HbA1c (<9% vs >=9%)
Gender
Allergan PLC Page 36Relamorelin
RLM-MD-01/02 Statistical Analysis Plan (Amendment 2) 11/17/2020
Allergan PLC Page 37Relamorelin
RLM-MD-01/02 Statistical Analysis Plan (Amendment 2) 11/17/2020
13.0 Interim Analysis
No interim analysis is planned for this study.
Allergan PLC Page 38Relamorelin
RLM-MD-01/02 Statistical Analysis Plan (Amendment 2) 11/17/2020
14.0 Determination of Sample Size
The sample size and statistical power for the DGSSSS endpoint was assessed by simulation. Data were simulated for the DGSSS over time under the assumption of a multivariate normal distribution and based on mean responses in Study RM-131-009 variance -covariance structure (Table 14–1). A missing completely at random (MCAR) dropout rate of 20% by Week 12 was assumed for each treatment.
Vomiting response rates were assumed to be those observed in Study RM-131-009 (26% and 11% for treatment and placebo respectively). Sample size was assessed using the POWER procedure in SAS.
The sample size of approximately 300 participants per arm will provide more than 90% power to reject at least one of the primary null hypotheses using the multiplicity approach described in Section 10.3.
Allergan PLC Page 39Relamorelin
RLM-MD-01/02 Statistical Analysis Plan (Amendment 2) 11/17/2020
15.0 Statistical Software
Statistical analyses will be performed using SAS on a Linux operating system.
Allergan PLC Page 40Relamorelin
RLM-MD-01/02 Statistical Analysis Plan (Amendment 2) 11/17/2020
16.0 Data Handling Conventions
16.1 Visit Time Windows
Table 16.1–1 presents the visits assigned for safety analyses and the corresponding range of treatment days (window) during which an actual visit may occur.
Table 16.1–1. Visit Time Windows for Safety Analysis
Derived Visit Scheduled Test / Visit Daya Window
Baseline Day 1 Days ≤ 1
Visit 4 Day 14 Days [2, 21]
Visit 5 Day 28 Days [22, 43]
Visit 6 Day 56 Days [44, 71]
Visit 7 Day 84 Days ≥ 72
End of Studyb Final or termination visit during the double-blind Treatment Period
a Relative to the date of the first dose; Day 1 = the day of the first dose.
b “End of Trial” will be presented in analysis tables for safety parameters, including clinical laboratory and vital signs.
If the visit date is on or after the date of the first dose of double-blind study treatment, the study day is calculated by visit date – date of the first dose of double-blind investigational product + 1. If the visit date is before the date of the first dose of double-blind investigational product, the study day is calculated by visit date – date of the first dose of double-blind investigational product. Therefore, a negative day indicates a day before the start of the double-blind investigational product.
If a participant has 2 or more visits within the same window, the last visit with a nonmissing value will be used for analysis.
16.2 Analysis Weeks and Visit Time Windows for Efficacy Analysis
16.2.1 Analysis Weeks for Efficacy Analysis
Table 16.2.1–1 below presents the analysis weeks assigned for the efficacy analysis of the participant daily diary data related to DGSSD. These analysis weeks will be used in the calculations for all week-based endpoints (eg, weekly DGSSS, weekly vomiting frequency, individual symptoms weekly scores etc.).
Allergan PLC Page 41Relamorelin
RLM-MD-01/02 Statistical Analysis Plan (Amendment 2) 11/17/2020
Table 16.2.1–1. Analysis Time Windows for Efficacy Analysis
Period Analysis Week Beginsa Endsa
Pretreatment (Baselineb)
Week -2 Day -14 Day -8
Week -1 Day -7 Day -1
Treatment
Week 1 Day 1, day of randomization Day 7
Week 2 Day 8 Day 14
Week 3 Day 15 Day 21
Week 4 Day 22 Day 28
Week 5 Day 29 Day 35
Week 6 Day 36 Day 42
Week 7 Day 43 Day 49
Week 8 Day 50 Day 56
Week 9 Day 57 Day 63
Week 10 Day 64 Day 70
Week 11 Day 71 Day 77
Week 12 Day 78 Day 84
a Relative to the date of randomization; Day 1 = the day of randomization.
b Baseline values for efficacy parameters will be derived as average of the two pretreatment weeks.
For the Treatment Period, diary day is calculated as (diary date - date of randomization + 1). For the Pretreatment Period, diary day is calculated as (diary date - date of randomization).
16.2.2 Visit Windows for Efficacy Analysis
Visit windows as defined in Section 16.1 will be used for the analysis by visit
Allergan PLC Page 42Relamorelin
RLM-MD-01/02 Statistical Analysis Plan (Amendment 2) 11/17/2020
Allergan PLC Page 43Relamorelin
RLM-MD-01/02 Statistical Analysis Plan (Amendment 2) 11/17/2020
16.4 Repeated or Unscheduled Assessments of Safety Parameters
If a participant has repeated assessments before the start of double-blind treatment with investigational product, the results from the final assessment made before the date of the first dose will be used as baseline. If EOT assessments are repeated or unscheduled, the last postbaseline assessment will be used as the EOT assessment for generating summary statistics.
However, all postbaseline assessments will be used for PCS value determination, and all assessments will be presented in the data listings.
16.5 Missing Date of the Last Dose of Study Treatment
When the date of the last dose of the double-blind investigational product is missing, all effortsshould be made to obtain the date from the Investigator. If it is still missing after all efforts have been made, the last diary date will be used as the last dose date.
16.6 Missing Severity Assessment for Adverse Events
If severity is missing for an AE that started before the date of the first dose of double-blind investigational product, an intensity of mild will be assigned. If severity is missing for an AE thatstarted on or after the date of the first dose of double-blind investigational product, an intensity of severe will be assigned. The imputed values for severity assessment will be used for the incidence summary; the values will be shown as missing in the data listings.
Allergan PLC Page 44Relamorelin
RLM-MD-01/02 Statistical Analysis Plan (Amendment 2) 11/17/2020
16.7 Missing Causal Relationship to Study Treatment for Adverse Events
If the causal relationship to the investigational product is missing for an AE that started on or after the date of the first dose of double-blind investigational product, a causality of yes will be assigned. The imputed values for causal relationship to double-blind treatment will be used for the incidence summary; the values will be shown as missing in the data listings.
16.8 Missing Date Information for Adverse Events
The following imputation rules apply to cases in which the start date is incomplete (ie, partial missing) for AEs.
Missing day and month If the year is the same as the year of the date of the first dose of double-blind
investigational product, then the day and month of the date of the first dose of double-blind investigational product will be assigned to the missing fields.
If the year is prior to the year of the date of the first dose of double-blind investigational product, then December 31 will be assigned to the missing fields.
If the year is after the year of the date of the first dose of double-blind investigational product, then January 1 will be assigned to the missing fields.
Missing month only The day will be treated as missing and both month and day will be replaced according to
the above procedure.
Missing day only If the month and year are the same as the month and year of the date of the first dose of
double-blind investigational product, then the date of the first dose of double-blind investigational product will be assigned to the missing day.
If either the year is before the year of the date of the first dose of double-blind investigational product or if both years are the same but the month is before the month of the date of the first dose of double-blind investigational product, then the last day of the month will be assigned to the missing day.
If either the year is after the year of the date of the first dose of double-blind investigational product or if both years are the same but the month is after the month of the date of the first dose of double-blind investigational product, then the first day of the month will be assigned to the missing day.
If the stop date is complete and the imputed start date as above is after the stop date, the start date will be imputed by the stop date.
Allergan PLC Page 45Relamorelin
RLM-MD-01/02 Statistical Analysis Plan (Amendment 2) 11/17/2020
If the start date is completely missing and the stop date is complete, then the following algorithm is used to impute the start date:
If the stop date is on or after the date of the first dose of double-blind investigational product, the date of the first dose of double-blind investigational product will be assigned to the missing start date.
If the stop date is before the date of the first dose of double-blind investigational product, the stop date will be assigned to the missing start date.
16.9 Missing Date Information for Prior or Concomitant Medications
For prior or concomitant medications, excluding rescue medications, incomplete (ie, partly missing) start dates and/or stop dates will be imputed. When the start date and the stop date are both incomplete for a participant, the start date will be imputed first.
16.9.1 Incomplete Start Date
The following rules will be applied to impute the missing numeric fields for an incomplete prior or concomitant medication start date. If the stop date is complete (or imputed) and the imputed start date is after the stop date, the start date will be imputed using the stop date.
Missing month and day If the year of the incomplete start date is the same as the year of the first dose of study
treatment, the month and day of the first dose of study treatment will be assigned to the missing fields
If the year of the incomplete start date is before the year of the first dose of study treatment, December 31 will be assigned to the missing fields
If the year of the incomplete start date is after the year of the first dose of study treatment, January 1 will be assigned to the missing fields
Missing month only If only the month is missing, the day will be treated as missing and both the month and
the day will be replaced according to the above procedure
Missing day only If the month and year of the incomplete start date are the same as the month and year of
the first dose of study treatment, the day of the first dose of study treatment will be assigned to the missing day
Allergan PLC Page 46Relamorelin
RLM-MD-01/02 Statistical Analysis Plan (Amendment 2) 11/17/2020
If either the year of the incomplete start date is before the year of the date of the first dose of study treatment or if both years are the same but the month of the incomplete start date is before the month of the date of the first dose of study treatment, the last day of the month will be assigned to the missing day.
If either the year of the incomplete start date is after the year of the date of the first dose of study treatment or if both years are the same but the month of the incomplete start date is after the month of the date of the first dose of study treatment, the first day of the month will be assigned to the missing day
16.9.2 Incomplete Stop Date
The following rules will be applied to impute the missing numeric fields for an incomplete prior or concomitant medication stop date. If the date of the last dose of study treatment is missing, impute it as descripted in Section 16.4. If the imputed stop date is before the start date (imputed or nonimputed start date), the imputed stop date will be equal to the start date.
Missing month and day If the year of the incomplete stop date is the same as the year of the last dose of study
treatment, the month and day of the last dose of study treatment will be assigned to the missing fields
If the year of the incomplete stop date is before the year of the last dose of study treatment, December 31 will be assigned to the missing fields
If the year of the incomplete stop date is after the year of the last dose of study treatment, January 1 will be assigned to the missing fields
Missing month only If only the month is missing, the day will be treated as missing and both the month and
the day will be replaced according to the above procedure
Missing day only If the month and year of the incomplete stop date are the same as the month and year of
the last dose of study treatment, the day of the last dose of study treatment will be assigned to the missing day
If either the year of the incomplete stop date is before the year of the date of the last dose of study treatment or if both years are the same but the month of the incomplete stop date is before the month of the date of the last dose of study treatment, the last day of the month will be assigned to the missing day
Allergan PLC Page 47Relamorelin
RLM-MD-01/02 Statistical Analysis Plan (Amendment 2) 11/17/2020
If either the year of the incomplete stop date is after the year of the date of the last dose of study treatment or if both years are the same but the month of the incomplete stop date is after the month of the date of the last dose of study treatment, the first day of the month will be assigned to the missing day.
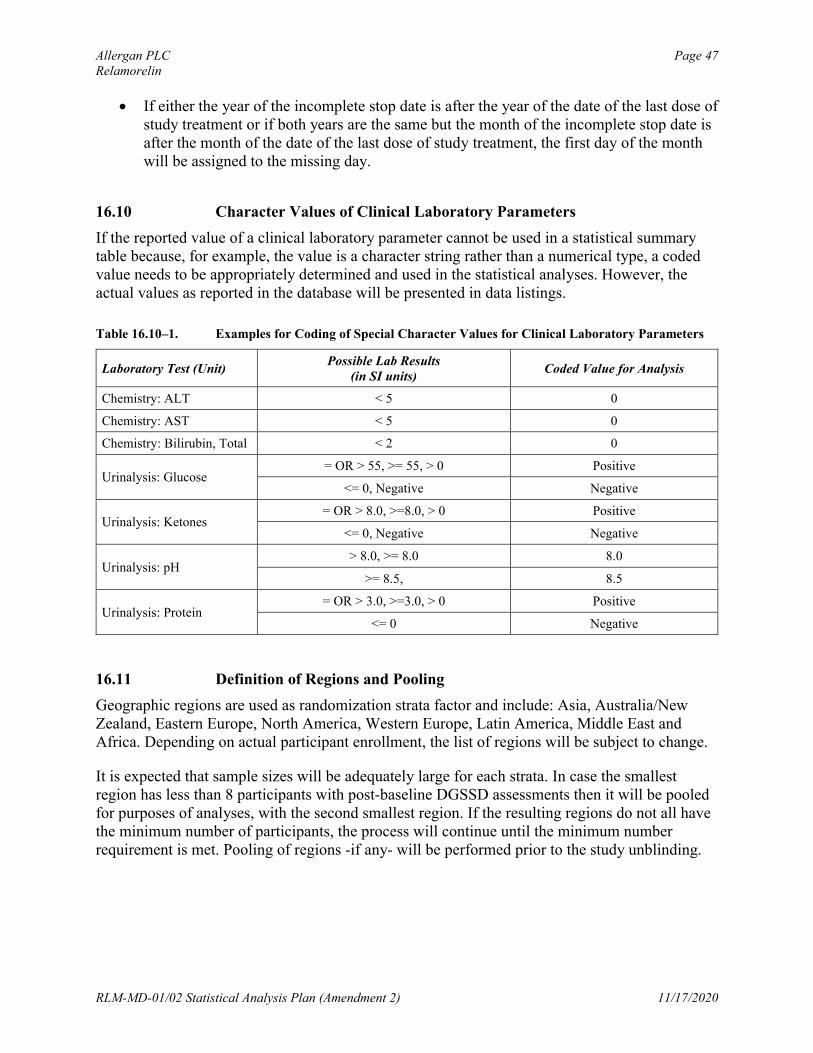
16.10 Character Values of Clinical Laboratory Parameters
If the reported value of a clinical laboratory parameter cannot be used in a statistical summary table because, for example, the value is a character string rather than a numerical type, a coded value needs to be appropriately determined and used in the statistical analyses. However, the actual values as reported in the database will be presented in data listings.
Table 16.10–1. Examples for Coding of Special Character Values for Clinical Laboratory Parameters
Laboratory Test (Unit)Possible Lab Results
(in SI units)Coded Value for Analysis
Chemistry: ALT < 5 0
Chemistry: AST < 5 0
Chemistry: Bilirubin, Total < 2 0
Urinalysis: Glucose= OR > 55, >= 55, > 0 Positive
<= 0, Negative Negative
Urinalysis: Ketones= OR > 8.0, >=8.0, > 0 Positive
<= 0, Negative Negative
Urinalysis: pH> 8.0, >= 8.0 8.0
>= 8.5, 8.5
Urinalysis: Protein= OR > 3.0, >=3.0, > 0 Positive
<= 0 Negative
16.11 Definition of Regions and Pooling
Geographic regions are used as randomization strata factor and include: Asia, Australia/New Zealand, Eastern Europe, North America, Western Europe, Latin America, Middle East and Africa. Depending on actual participant enrollment, the list of regions will be subject to change.
It is expected that sample sizes will be adequately large for each strata. In case the smallest region has less than 8 participants with post-baseline DGSSD assessments then it will be pooled for purposes of analyses, with the second smallest region. If the resulting regions do not all have the minimum number of participants, the process will continue until the minimum number requirement is met. Pooling of regions -if any- will be performed prior to the study unblinding.
Allergan PLC Page 48Relamorelin
RLM-MD-01/02 Statistical Analysis Plan (Amendment 2) 11/17/2020
17.0 Changes to Analyses Specified in Protocol
None.
Allergan PLC Page 49Relamorelin
RLM-MD-01/02 Statistical Analysis Plan (Amendment 2) 11/17/2020
18.0 References
Dmitrienko A, Tamhane A.C., Wiens, B. (2008). General multistage gate-keeping procedures. Biometrical Journal. 50: 667-677.
Knoke J (1991). Nonparametric Analysis of Covariance for Comparing Change in Randomized Studies with Baseline Values Subject to Error. Biometrics, 47(2):523-533.
Mallinckrod C., Lane P., Schnell D., Peng Y., and Mancuse J. (2008). Recommendations for the Primary Analysis of Continuous Endpoints in Longitudinal Clinical Trials. 42:303-319.
Ratitch B, and O’Kelly M. (2011). Implementation of Pattern-Mixture Models Using Standard SAS/STAT Procedures.. In Proceedings of PharmaSUG 2011 (Pharmaceutical Industry SAS Users Group). Paper SP04. Nashville.
Ratittch B., Lipkovich I., O’Kelly M. (2013). Combining Analysis Results from Multiple Imputed Categorical Data. In Proceedings of PharmaSUG 2013 (Pharmaceutical Industry SAS Users Group). Paper SP03. Chicago.
Rubin, D.B. Multiple Imputation for Nonresponse in Surveys. New York: John Wiley & Sons.1987;75-77:169-170.
Electronic Signatures
User Date Justification
17-Nov-202016:45:21(GMT)
Manager Approval
17-Nov-202014:24:09(GMT)
Subject Matter Expert Approval
17-Nov-202015:15:40(GMT)
Subject Matter Expert Approval
17-Nov-202014:00:10(GMT)
Document Originator Approval
17-Nov-202014:39:05(GMT)
Subject Matter Expert Approval


![CONFIDENTIAL PPD 116194 [DTPA-IPV (INFANRIX …...CONFIDENTIAL 116194 [DTPA-IPV (INFANRIX-IPV)-061] Statistical Analysis Plan Amendment 2Final 14-DEC-2017 Page 1of 51 Statistical Analysis](https://img.pdfslide.us/doc/110x75/5e37e6a6e0360d6c676e60da/confidential-ppd-116194-dtpa-ipv-infanrix-confidential-116194-dtpa-ipv-infanrix-ipv-061.jpg)