Embed Size (px)
Citation preview

Statistical Analysis of Fraud in the Florida Food Assistance Program
Prepared for
The Florida Strike Force on Medicaid & Public Assistance Fraud
Prepared by:
Charles J. Mullin, Ph.D. ERS Group
Tallahassee, FL
November 28, 2012

1
ERS Group was requested by The Florida Strike Force on Medicaid & Public Assistance
Fraud (the Strike Force) to 1) review information on metrics and methodologies used to measure
fraud, waste, and abuse in government food and nutrition or other public assistance programs,
and 2) to design and implement a methodology to provide the Strike Force with an estimate of
the amount of fraud, waste and abuse leading to overpayments in the Florida Food Assistance
Program, also known as the Supplemental Nutrition Assistance Program (SNAP). In the interest
of brevity, throughout this report we often refer to “fraud, waste and abuse” simply as “fraud.”
ERS Group staff worked closely with Strike Force staff, the Department of Children and
Families (DCF), and the Department of Financial Services’ Division of Public Assistance Fraud
(DPAF). ERS Group would like to thank the Strike Force members for the opportunity to
contribute to their efforts to reduce fraud in the State of Florida, and to thank the numerous
individuals within these agencies for their cooperation and assistance, without whom this project
could not have been completed.1
Executive Summary
• The estimate of fraud incidence in the Florida SNAP program is 7.5 percent. For the
purpose of this estimate, fraud includes any potential overpayment of benefits due to a
misrepresentation of information, regardless of size. Therefore, this estimate indicates
1 ERS Group would like to thank Jeri Flora, Yameche Madry and Peter Bull of DCF’s Economic Self Sufficiency Division; Amanda Huston, Director of the Office of Public Benefits Integrity; Randy Burkhalter, Director of Florida’s Division of Public Assistance Fraud; and Chuck Faircloth, Executive Director of the Strike Force. Special thanks are due to Strike Force staff member Cynthia Godbey, Department of Children and Families ACCESS Integrity Chief Fred Young, and Florida Department of Financial Services’ Financial Crimes Investigator Kim Harrison.

2
that 7.5 percent of the discrete payments were potentially larger than justified under the
program rules.
• In addition to calculating a rate of fraud incidence, we employed two methodologies to
estimate the overall overpayment rate in dollar terms. One method, based on the benefit
payments received by those in our sample who committed fraud, yields an estimated
dollar overpayment rate of approximately 2.75 percent.
• The second method, based on historical fraud overpayment calculations provided by
DPAF, yields an estimated dollar overpayment rate of approximately 3.7 percent.
• These estimates do not include vendor trafficking (purchase of SNAP electronic benefit
transfer (EBT) cards by vendors at a fraction of their value), which cannot be detected by
the methodologies employed in this study. A recent U.S. Department of Agriculture
(USDA) report estimates the dollar cost of SNAP vendor trafficking at one percent.
• Fraud was detected by four of the nine distinct fraud detection methodologies that were
employed by investigators during the study. The most effective methods of detection
were income verification, site visits, and desk reviews.
• Over 70 percent of the fraud that was detected in our sample was related to non-reporting
or under-reporting of income. Florida’s SNAP system would benefit from routine
computer comparisons of recipient income (as reported on applications) vs. earned
income as reported to the Department of Economic Opportunity, along with follow-up on
identified discrepancies. Similarly, routine verification of household composition
through available data may help to prevent fraud.
• Logistic regression analysis of the sample revealed one statistically significant difference
in the characteristics of those who committed fraud and those who did not: As the

3
number of adults in the household increased, the likelihood of fraud increased, after
controlling for other factors.
• Current policy requires SNAP recipients to report changes in income (and other living
conditions) every six months (or every year in certain cases). The USDA’s Food and
Nutrition Service (FNS) allows states several choices with regards to how often recipients
are required to report changes. We recommend DCF review the current six-month
change reporting policy to determine if a shorter time threshold is in the best interest of
the State of Florida.
• Per the SNAP State Activity Report for FY 2010, 87 percent of pre-certification fraud
investigations in Florida result in a positive finding, while only 12 percent of post-
certification investigations result in a positive finding. However, only 32 percent of
investigations are done on a pre-certification basis. Florida would benefit from moving
further away from a post-certification, “pay-and–chase” system and towards a more
rigorous pre-payment fraud detection system.
I Background
The Supplemental Nutrition Assistance Program is implemented by the Food and Nutrition
Service, a division of the United States Department of Agriculture. SNAP provided nearly $65
billion in benefits to American families in fiscal year 2010, and as of September, 2011 provided
assistance to 46 million people per month.2,3
2 SNAP Quality Control Annual Report, September 2011, page i.
While the program’s funds are provided by the
3 State Fraud Detection Efforts for the Supplemental Nutrition Assistance Program, Audit Report 27703-0002-HY, January 2012, page 4.

4
federal government, the program is administered by each state. Within the State of Florida, the
program is administered by DCF. In fiscal year 2010, Florida’s share of SNAP funds totaled
over $4.4 billion, the fourth highest amount in the nation.4 It is worth noting that Florida’s
SNAP issuance increased from almost $1.8 billion in 2008 to $4.4 billion in 2010, a growth rate
of almost 150 percent, the second highest in the nation (only Idaho had a higher growth rate).5
In consultation with Strike Force staff, we first endeavored to define the phrase “fraud,
waste and abuse”. While similarities in definitions exist across federal and state entities, it does
not appear that any two units of government use exactly the same definition. For example, the
Texas health care claims studies described later in this report, which were pilot studies for the
Federal Payment Error Rate Measurement Program (PERM) used for Medicare and Medicaid,
define fraud as “…an intentional deception or misrepresentation made by a person with the
knowledge that the deception could result in some unauthorized benefit…” The studies defined
abuse as “…provider practices that are inconsistent with sound fiscal, business or medical
practices and result in an unnecessary cost to the Medicaid program…”
With sums of this magnitude, even a relatively low rate of fraud can represent significant
monetary loss.
6
In contrast, the current definition of fraud on the Federal Government’s FNS website is as
follows:
4 SNAP Quality Control Annual Report, September 2011, page 11.
5 Supplemental Nutrition Assistance Program (SNAP) State Activity Report: Federal Fiscal Year 2010. U.S. Department of Agriculture, Food and Nutrition Service, Program Accountability and Administration Division, December 2011, page 55.
6 Texas Health Care Claims Study, January 2001, Section II, page 15. Texas Health Care Claims Study, March 2003, Section I, page 16. Texas Health Care Claims Study, March 2005, Section I, page 17.

5
• “SNAP fraud is when SNAP benefits are exchanged for cash. This is called
trafficking and it is against the law.
• SNAP fraud also happens when someone lies on their application to get benefits or to
get more benefits than they are supposed to get.
• SNAP fraud also happens when a retailer has been disqualified from the program for
past abuse and lies on the application to get in the program again.”7
The above is roughly consistent with the FNS’s December, 2011 statement on the USDA’s
efforts to reduce waste, fraud and abuse. That document suggests a definition that includes
elements related to providing false information connected to eligibility and benefits, trafficking,
and reducing improper payments and errors.
8
Lastly, The Florida Department of Children and Families indicates that “fraud means to
commit an intentional violation of law or a deliberate misrepresentation or concealment so as to
secure unfair or unlawful financial or personal gain”.
9
We have chosen throughout this report to focus first and foremost on fraud. Within the
SNAP universe and Florida DCF, this encompasses primarily at least one of two elements. The
first is trafficking, or the exchange of benefits for cash. While direct investigation of vendor
trafficking was outside the scope of this report, we did research this issue and have provided
information related to estimates of vendor trafficking. The second element is an intentional or
unintentional material misrepresentation provided by a SNAP applicant (or re-applicant) that
7 http://www.fns.usda.gov/snap/fraud/fraud_2.htm
8“USDA Efforts to Reduce, Waste, Fraud and Abuse in the Supplemental Nutrition Assistance Program (SNAP), December 2011, http://www.fns.usda.gov/cga/FactSheets/Integrity.pdf
9 See for example, Cf Operating Procedure No. 180-4, Florida Department of Children and Families December 13, 2011.

6
could result in the receipt of unauthorized benefits. While other criteria, such as agency error or
a misapplication of rules, could also result in a finding of fraud, waste or abuse, for the purposes
of this report we have defined fraud in terms of such material misrepresentation. It is important
to note that we did not attempt to differentiate between the distinct terms (fraud, waste, abuse)
but rather treated them as a single phrase which encompasses the full range of activity associated
with the receipt of improper benefit amounts due to material misrepresentation of information.
Identifying fraud, waste and abuse as separate and distinct items would require a measurement of
intent, which was beyond the scope of these investigations.
Fraud is an ongoing and pervasive problem within the SNAP program, both nationwide
and within Florida. Of the nearly 800,000 fraud investigations conducted nationwide during
(Federal) fiscal year 2010, the state of Florida conducted over 51,000, approximately 16,000 of
which were pre-certification investigations and 35,000 of which were post-certification
investigations. Of those 51,000 investigations, 18,000 resulted in a positive determination of
fraud (a 35 percent rate compared to the national average of 27 percent). Of those,
approximately 4,100 were post-certification instances involving approximately $5.7 million in
disbursements.10 The investigations resulted in 291 prosecutions which led to 283 convictions
and eight acquittals.11 These 283 convictions involved over $900,000 of fraudulent activity.12
10 Supplemental Nutrition Assistance Program (SNAP) State Activity Report: Federal Fiscal Year 2010. U.S. Department of Agriculture, Food and Nutrition Service, Program Accountability and Administration Division, December 2011, page 25.
The State of Florida also conducted 2,856 administrative disqualification hearings resulting in
2,811 waivers or convictions and only 45 acquittals. These administrative disqualifications
11 Ibid., page 27.
12 Ibid., page 27-28.

7
involved approximately $1.8 million of fraudulent activity13. In fiscal year 2010, Florida
collected nearly $2.4 million in fraudulent SNAP claims, about 54 percent of which was
collected through recoupment from ongoing recipients.14
II Review of Literature and Previous Government Fraud Measures
Academic Studies
We reviewed a variety of academic literature to obtain an understanding of how
economists and statisticians (or experts in other fields) have previously conducted studies to
measure fraud rates. There exists very limited academic literature addressing the actual rates of
fraud in programs such as SNAP. There is however a considerable body of literature on the
current methodologies used to detect such fraud. Not unexpectedly, most academic efforts in
this arena are designed to determine the factors (demographic characteristics, education, income,
etc.) that are correlated with fraud, rather than to directly measure incidence.
One such methodology is regression analysis. Regression is a mathematical technique
used to estimate the statistical relationship between a dependent variable and a set of explanatory
variables. This estimate can then be used to predict the dependant, or outcome variable, given
the values of the explanatory variables. Regression models for fraud detection are most
commonly discussed in the literature concerning automobile insurance fraud. In contrast, efforts
to detect credit card fraud and fraud in health care have favored a variety of machine learning
methods. Machine learning involves the use of computer algorithms that improve automatically
through experience. Applications of machine learning range from data-mining programs that
13 Ibid., pages 29-30.
14 Ibid., pages 42-43.

8
discern general rules in large data sets, to information filtering systems that automatically learn
users' interests.15
Machine learning in the context of fraud takes primarily two forms. One
methodology involves having the computer learn to identify potential fraud using a training data
set where instances of fraud are first identified by human subject matter experts. The second
involves the use of computers that learn to identify suspicious transactions based on a more
general set of rules and/or identification of anomalous values in selected data fields. These
methods are worthwhile and certainly aid in the detection of fraud; however, as noted, they do
not actually measure the rate of fraud, but rather identify transactions that are more likely to be
fraudulent.
Government Studies
In addition to researching the academic literature, we reviewed a number of government
studies, both state and federal, that do measure fraud rates. In August 1998, the State of Illinois
completed what was then believed to be “the first ever payment accuracy review of any state
Medical Assistance Program.”16
15 Mitchell, Tom, Machine Learning McGraw Hill, 1997
For purposes of the review, state investigators selected a
random sample of 599 records of payment for medical services, stratified by category (physician
and pharmacy services, inpatient hospital and hospice services, and all other types of services).
Investigators found 96 instances in which payments had been made in error. The study did not
estimate a fraud rate, nor, according to the authors, was it intended to do so. The authors state
however that 54.7 percent of the inaccurate payments were the result of “questionable” errors,
16 “Payment Accuracy Review of the Illinois Medical Assistance Program: A Blueprint for Continued Improvement”. Illinois Department of Public Aid, August 1998, page 3.

9
meaning “the provider’s intention to bill correctly is very doubtful, but no intent was proven.”17
In 2001, 2003 and 2005, the State of Texas conducted studies of potential overpayments
in the state Medicaid program using random samples of patients and associated payments.
Twenty-nine of the payments were judged to be so serious that they were referred for additional
reviews.
18 In
each case where such a determination was made, a relatively small portion of the overpayment
errors were found to represent fraud or “abuse”. The 2001 Texas Health Care Claims Study, for
example, presented results of an examination of a sample of 1,609 Medicaid Fee-for-Service
(FFS) Claims. Investigators found 269 potential overpayment errors, including 14 that were
classified as representing potential fraud or abuse.19 The 2003 Texas Health Care Claims Report
was expanded to encompass a separate study of potential overpayments in the Medicaid Vendor
Drug Program (VDP). The amount of fraud in the Medicaid VDP is not addressed in the 2003
report; however, the authors of the report found 29 instances of potential overpayments due to
fraud or abuse in the Medicaid FFS sample of 2,122 paid claims.20
The 2005 Texas Health Care Claims Report included a Medicaid FFS study based on a
review of 2,202 medical services’ payments.
21 The review indicated that 28 (about seven
percent) of 387 potential overpayment errors represented potential “fraud or abuse”.22
17 Ibid., page 4.
For
18 They also examined the extent of overpayment in the state employees’ workers’ compensation program.
19 Texas Health Care Claims Study, January 2001, Section II, pages 29-30.
20 Texas Health Care Claims Study, March 2003, page 2, Section I, page 31.
21 Texas Health Care Claims Study, March 2005, page, 2, Section I, page 25.
22 Ibid.

10
purposes of the Medicaid VDP study a sample of 4,036 prescriptions were randomly selected for
audit. After review, 916 were found to have potential overpayment errors.23
The Texas state studies discussed above were pilots for the federal Payment Error Rate
Measurement Program (PERM). The pilot programs were overseen by the Centers for Medicare
and Medicaid Services and covered the period from 2002-2005. The PERM program was
designed to measure payment error rates in Medicaid and the Children’s Health Insurance
Program (CHIP) in response to the requirements of the (federal) Improper Payments Information
Act of 2002 (IPIA).
24,25 The IPIA required federal agencies overseeing programs susceptible to
“significant” erroneous payments (as defined by the Office of Management and Budget (OMB))
to estimate the amount of improper payments each year and to report on measures taken to
reduce them.26 An overpayment is defined as a payment for a service that is not in accordance
with the policies of the Medicaid program, and may include fraud and abuse.27 Under the plan,
17 states (including DC as a state) are reviewed each year, so that all are reviewed on a rotating
basis every three years.28
Each fiscal quarter the states provide to a statistical contractor the universe of claims data
for Medicaid, CHIP FFS and managed care that were paid by the federal government.
The first wave of states was reviewed in fiscal year 2006.
29
23 Ibid., section II, page 79.
The
statistical contractor then draws random samples from the claims. After receiving supporting
24 The IPIA was subsequently amended by the Improper Payments Elimination and Recovery Act (IPERA) of 2010.
25 Payment Error Rate Measurement Manual, Centers for Medicare and Medicaid Services, 2010.
26 Ibid
27 Texas Health Care Claims Study, March 2005, page I-17.
28 Payment Error Rate Measurement Manual, Centers for Medicare and Medicaid Services, 2010, page 12
29 Payment Error Rate Measurement Manual, Centers for Medicare and Medicaid Services, 2010, page 10-12.

11
data for the samples from the states, the statistical contractor forwards the data to a review
contractor who sends records requests to medical service providers represented in the sample.30
The review contractor employs medical personnel who review the medical records for accuracy
and consistency with the claims submitted to the states. The statistical contractor then calculates
state specific error rates and a national error rate for FFS transactions and managed care. These
rates are calculated overall, as well as by program and by type of error.31 The estimated overall
Medicaid error rate for the nation for fiscal year 2008 was 8.71 percent. The estimated overall
Medicaid error rate for Florida for fiscal year 2008 was 14.63 percent.32
III Supplemental Nutritional Assistance Program (SNAP)
Similarly to Medicaid, SNAP, formerly known as the food stamp program,33 was also
identified by the OMB as a “high error program”.34 The USDA first reported on improper
payments in the SNAP program in the 2004 Performance and Accountability Report (PAR),
which covered outlays for fiscal year 2003.35
30 Ibid.
The most recent (2011) PAR covered improper
payments in fiscal year 2010. The improper payment error rate for the U.S. was 3.8 percent in
fiscal year 2010 (consisting of an overpayment error rate of 3.05 percent and an underpayment
31 Ibid.
32 Fiscal year 2008 PERM Medicaid Corrective Action Plan Executive Summary, page 1.
33 Analysis of Florida’s Supplemental Nutrition Assistance Program (SNAP) Eligibility Data, Audit Report 27002-0002-13, November 2011, page 1. 34 Improper Payments: Recent Efforts to Address Improper Payments and Remaining Challenges, GAO-11-575T, April 15, 2011. Footnote 14, page 8.
35 2011 Performance and Accountability Report, U. S. Department of Agriculture, page 27.

12
error rate of 0.75 percent).36 For the State of Florida the reported SNAP improper payment rate
was 0.72 percent for fiscal year 2010 (consisting of a 0.68 percent overpayment rate and a 0.04
percent underpayment rate).37
Each month, states select a statistically random sample of cases from a universe of all
households receiving SNAP benefits that month and perform a quality control review to measure
the accuracy of eligibility and benefit determinations for each sampled case against SNAP
standards. State agencies are required to report to FNS the findings for each case selected for
review. FNS then sub-samples the completed state quality control reviews and re-reviews
selected individual case findings for accuracy. Based on this sub-sample, FNS determines each
state agency’s official error rate using a regression formula. The national payment error rate is
computed by averaging the error rate of the active cases for each state weighted by the amount of
issuance in the state.
The process of calculating the improper payment rate for SNAP is
described below.
38
According to the FNS document which provides the guidelines for the quality control
audit process, the quality control review should consist of “a face-to-face interview for active
cases subject to review to determine the identity of the applicant and whether the household did
exist and to explore household circumstances affecting the sample month’s eligibility and
allotment”.
39 The FNS guidelines also require income verification.40
36 Supplemental Nutritional Assistance Program Quality Control Annual Report Fiscal Year 2010, page 4.
These are just two of
37 Ibid., page 5.
38 2011Performance and Accountability Report, U. S. Department of Agriculture, pp. 218-219.
39 SNAP Quality Control Review Handbook (FNS Handbook 310), U. S. Department of Agriculture, Food and Nutrition Services, October, 2011, section 420 – Household Interview.
40 FNS Handbook 310, section 1021 – Wages and Salaries.

13
several ways in which the quality control audit process is similar to our methodology. However,
there are several exceptions to the process which differentiate the quality control audit process
from our methodology and may be the source of the contrast in our results, which are detailed
later in this report.
First, there are several case types that are not to be included in the quality control sample
per the FNS guidelines.41
• Cases pending a hearing appealing an adverse action,
Examples include but are not limited to:
• Cases already referred for investigation,
• Cases under active investigation or pending an intentional program violation hearing,
• Cases where household members have moved out of state,
• Cases in which the household members could not be interviewed after all reasonable
efforts to do so have been made and documented.
In several instances, these types of cases are ones in which there is a heightened
likelihood of fraudulent activity. Since these cases are not subject to review and are removed
from the FNS sampling process, it may serve to reduce the subsequent error estimate. Second,
the quality control process is designed to determine allotment errors, not to detect fraud per se.
Accordingly, although incorrect applications of policy, or deviations between the information
that was used and what should have been used to determine eligibility/allotment, may exist, they
do not result in a finding unless they result in an allotment error. Lastly, the allotment error must
reach a specific monetary threshold before it is included as an error ($25 per the FNS handbook;
$50 according to quality control personnel at DCF). There may be a significant number of
41 FNS Handbook 310, sections 330 – 338, section 442.

14
instances where the threshold requirement could reduce the overall error rate reported through
the quality control process.
The USDA Office of Inspector General (OIG) also conducts audits of the SNAP
eligibility data for selected states. The most recent OIG audit report of SNAP in Florida found
that 2,689 of the 2.6 million average monthly recipients, or 0.1 percent, either (1) were deceased,
(2) had invalid Social Security Numbers (SSNs), (3) were receiving duplicate benefits in Florida
and in one or more nearby states, or (4) were listed in the Electronic Disqualified Recipient
System (eDRS) and had therefore been disqualified from receiving benefits because of
intentional program violations.42 Similar audits of Alabama and Louisiana found that 0.2
percent and 0.3 percent respectively of the recipients were ineligible for benefits for one or more
of the four reasons above.43,44
The OIG also reviewed state and FNS SNAP fraud control efforts in Colorado, New
York, Florida and New Jersey.
45
42 Analysis of Florida’s Supplemental Nutrition Assistance Program (SNAP) Eligibility Data, Audit Report 27002-0002-13, November 2011, page 1.
A common recommendation is that states make better use of
Electronic Benefits Transfer (EBT) Management Reports. Recipients of SNAP assistance
receive debit cards that can be used to purchase food from approved vendors. The funds are
transferred from an account monitored by a database manager to the vendors. Anomalous
transactions could suggest fraud. Using the available EBT Management Reports, OIG identified
2,600 questionable transactions during a three-month period in New Jersey and Florida that had
43 Analysis of Alabama’s Supplemental Nutrition Assistance Program (SNAP) Eligibility Data, Audit Report 27002-0004-13, January 2012, page 1.
44 Analysis of Louisiana’s Supplemental Nutrition Assistance Program (SNAP) Eligibility Data, Audit Report 27002-0003-13, January 2012, page 1.
45 State Fraud Detection Efforts for the Supplemental Nutrition Assistance Program, Audit Report 27703-0002-HY, January 2012, pp. 1-21.

15
not previously been found.46 The transactions could represent up to $181,700 in fraudulent
activity.47
Instances in which retailers excessively manually enter the benefits card numbers may
also represent fraud. Using one of the EBT Management Reports, the Manual Transaction
Report, the OIG found 122 retailers in New Jersey who processed more than 400 manual
transactions each during the review month. They note that these transactions totaled over $4.4
million and represented 49 percent of the retailers’ total SNAP transactions during the month.
These included out of state transactions that could indicate recipients who are
receiving benefits in more than one state. They also include cases with unusual numbers of
whole-dollar transactions at a retail location and instances involving excessive refunds by
retailers to SNAP recipients. The latter may indicate instances in which recipients are trading
SNAP benefits for cash.
48
The OIG also found 15 retailers in Florida whose manual SNAP transactions totaled over
$155,000 during the month of the review.49 Nationwide, the USDA estimates retailer fraud in
the SNAP program occurs in 8.2 percent of stores and diverts “about one cent of each SNAP
dollar”.50
We also reviewed the ACCESS Florida Food, Medical Assistance and Cash program
policy manual. The manual, which is available online, contains 23 sections and 1,096 pages.
46 State Fraud Detection Efforts for the Supplemental Nutrition Assistance Program, Audit Report 27703-0002-HY, January 2012, page 7.
47 Ibid.
48 State Fraud Detection Efforts for the Supplemental Nutrition Assistance Program, Audit Report 27703-0002-HY, January 2012, page 8-9.
49 Ibid.
50 See the March, 2011 USDA FNS report entitled “The Extent of Trafficking in the Supplemental Nutrition Assistance Program (SNAP): 2006 – 2008”. See http://www.fns.usda.gov/ora/menu/Published/SNAP/FILES/ ProgramIntegrity/Trafficking2006Summary.pdf

16
The glossary alone is 27 pages. While a complete review of the entire manual was neither
practical nor necessary, we did find one critical area of policy which may lead to waste and
abuse within the SNAP program. The FNS guidelines provide states the freedom to choose
SNAP recipient reporting requirements, that is, when recipients must report changes to their
income, expenses or living conditions that determine their benefit levels. Choices include time
requirements (which include monthly, quarterly or semi-annually) and threshold requirements,
which require recipients to report changes above a certain amount as soon as they occur.51 The
DCF policy manual indicates that Florida SNAP recipients are required to report changes semi-
annually, with certain categories of recipients subject to annual reporting.52
So, for example, if a
recipient were to receive an increase in income such that they were no longer even eligible for
food stamp assistance, they would not be required to report that change for as much as six
months. Under these rules, a recipient could continue to receive benefits for six months (or
possibly a year) and not be in violation of reporting requirements. While there is technically no
fraud, the potential for waste under these reporting requirements is significant. It is our
recommendation that DCF and other stakeholders review this policy to determine if it is in the
best interest of the State of Florida.
IV Our Methodology
While not all of the studies noted above included an analysis of random samples, use of
sample data sets was a common methodology, particularly among the analyses conducted by
government entities attempting to either investigate fraud or to measure payment error rates.
51 FNS Handbook 310, section 223.1-223.6.
52 Access Florida Food, Medical Assistance and Cash Program Policy Manual , l., Chapter 0800, section 0810-0200 to 0810-0400. http://www.dcf.state.fl.us/programs/access/esspolicymanual.shtml
17
Random sampling is a common technique used to measure incidence rates of various types in
large data sets where examination of all observations is simply not economically practicable, as
is the case here (Florida’s SNAP program provided assistance to roughly 2.6 million recipients
per month in fiscal year 2010).53
This information was then provided to Florida’s DPAF, where in conjunction with DCF,
investigators conducted the following investigations to determine whether or not the sampled
payments involved any fraud, waste or abuse.
At ERS Group’s request, DCF selected a random sample of
545 payments from the universe of all payments made during the three month period from May,
2011 through July, 2011. The sample data provided information on the recipient, including but
not limited to personally identifying information, residence, income, expenses and that month’s
benefit amount. We also received information on household composition, including but not
limited to personally identifying information on all individuals listed as being in the household,
their relationship to the recipient, their employment status as of the last eligibility review, and
recorded income contributions.
54
Household Composition/Site Visits
One of the primary factors in determining benefit eligibility and benefit levels is the
composition of the household. According to DPAF investigators and DCF personnel, one of the
common means by which fraud occurs is through over-reporting of individuals within the
household (or conversely, by not reporting a household member who is earning income).
53 Analysis of Florida’s Supplemental Nutrition Assistance Program (SNAP) Eligibility Data, Audit Report 27002-0002-13, November 2011, page 1.
54 The investigative work was overseen by Randy Burkhalter. Mr. Burkhalter is the Director of DPAF and has been investigating fraud for the State of Florida in some capacity for over 35 years.

18
Verification of household composition and residency is best done through site visits.
Unfortunately, this is a very time consuming element of fraud investigation, and it was
prohibitively time consuming to perform site visits for all of the recipients in the full sample.
Accordingly, ERS Group selected a random sub-sample of 100 recipients from our sample
population of 545 SNAP recipients and DCF personnel conducted site visits on the sub-sample.
In addition to determining which, if any, of the recipients in the sub-sample had a household
composition that was different than what was reported at the time they received benefits,
investigators also found program violations of other types during these visits. With regard to
household composition, violations could have consisted of either 1) over-reporting of individuals
in the household, 2) under-reporting of income earning members in the household or 3)
residency issues. Any of these constitutes fraud, waste or abuse in that such misrepresentation
could (and likely would) materially affect SNAP benefits.
Income Verification
The other primary factor in determining both benefit eligibility and benefit amount is
household income. DPAF investigators have access to a variety of sources for income
verification purposes, including the Florida Retirement System, Unemployment Compensation
Benefits, Interstate Unemployment Compensation Benefits, Worker’s Compensation Benefits,
and earned wage information reported to the Department of Economic Opportunity (DEO),
which receives quarterly information from Florida employers documenting income earned within
the state (with the exception of self-employment income). Each household member’s income (or
absence of income) was compared to information from these various sources to determine if
there was any un-reported or under-reported income. Any discrepancies were followed up and

19
verified independently. In the case of verified material differences, these generally resulted in a
determination that fraud, waste or abuse had occurred.
Identity Verification
One of the ways in which fraud can occur within SNAP is if an individual’s identity has
been stolen. Investigators and computer programmers at ERS Group, DPAF and DCF compared
each recipient’s identity against a variety of databases to determine that both the recipient’s
identity appeared valid and they were eligible for SNAP benefits. The data sources for these
comparisons included the U.S. Social Security Administration’s Master Death File, the Florida
Bureau of Vital Statistics database and the Stop Inmate Fraud database. Instances in which a
recipient was identified as ineligible through these comparisons and subsequently verified were
counted as fraudulent.
Electronic Disqualified Recipient System
We also requested that programmers at DCF compare the recipient sample against the
Electronic Disqualified Recipient System. The eDRS is a national internet-based program that
tracks and identifies SNAP recipients who are found guilty of violations in other states and
therefore disqualified from receiving benefits. This is often the only way in which violators from
other states can be identified.
PARIS Match
We also requested that DCF conduct a search using the Public Assistance Reporting
Information System (PARIS) to determine if any of the recipients in our sample were receiving

20
SNAP benefits from any other states. The PARIS database is an information exchange system
administered by the U.S. Administration for Children and Families and is designed to provide
state public assistance agencies with appropriate data as a result of a Federal computer matching
initiative.55
This database enables agencies to determine if a recipient is receiving funds from
multiple states under a variety of public assistance programs, including SNAP.
Address Matches
In addition to the computer matches to external databases, we also requested that DCF
determine for each of the recipients in our sample, how many SNAP payments are going to the
recipient’s address. One way in which fraud or abuse can manifest itself is if many recipients
receive SNAP funds at the same address. This may indicate that a recipient is using false
information. While some multiple recipient locations are legitimate (churches, homeless
shelters, etc.), many are not. For each recipient address, DCF determined the number of
payments going to that address during the sample month. For those addresses that were
receiving three or more SNAP payments, DCF personnel conducted follow-up investigations to
determine if the multiple payments were the result of program violations.
Desk Reviews
Despite each of the above procedures, it is entirely possible to commit fraud or abuse of
the SNAP system which is undetectable either by computer match or home visit. Accordingly,
DPAF investigators also conducted what is referred to as a desk review. A desk review consists
of an overall review of the benefit recipient’s case file in an attempt to identify irregularities
55 http://www.acf.hhs.gov/programs/paris/state

21
which are undetectable by any of the means noted above. For example, an investigator might
conduct a comparison of expenses to income over time. An investigator might also conduct a
review of Department of Motor Vehicle records and vehicle registration, driving history,
insurance information or employment records to determine who is living at the address listed.56
Investigators also review information from the Clerk of Courts, as well as birth records and
property records. While there is no specific manual or checklist that is followed as part of a desk
review, investigators report that it is an invaluable tool in the investigation of fraud, waste and
abuse of public assistance programs. DPAF investigators conducted desk reviews on all 545
files in our sample and conducted follow-up investigations as necessary as part of the overall
fraud investigation effort. The results of these reviews, as well as all of the aforementioned
procedures are discussed in detail in the next section.
V Results
On the basis of the investigations discussed above, DPAF/DCF investigators determined
the existence of fraud, waste or abuse in 28 cases from our random sample of 545. Table 1
below details the investigator’s findings by fraud type. In several instances, multiple types of
fraud were detected on a single case, and therefore the total incidence of fraud is not equal to the
sum by type.
56 Most of this information is available through DAVID, the Florida Driver And Vehicle Information Database.

22
Table 1
Fraud Type Number of Cases
Household Composition 4
Residency 1
Non-Reporting of Income 21
Under-Reporting of Income 1
False Reporting of Expenses 2
Identity Theft 1
Several of the investigation methods described above resulted in some detection of fraud.
However, the PARIS database match, the SSN Death Master File match and the match to the
eDRS failed to detect any fraud within our sample of 545 records. This is not unexpected given
the results reported in the November 2011 Audit Report of the Florida SNAP conducted by the
OIG. That report notes finding 883 instances of multi-state beneficiaries through PARIS, 807
Death Master File matches and 160 previously ineligible recipients through the eDRS database.57
These matches were conducted on over 2.6 million recipients and consequently represent a fraud
detection rate of 0.07 percent for those three methods combined.58
Table 2 summarizes detected cases of fraud, waste and abuse by detection method. As
detailed in Table 2, the income matches detected a large number of cases of fraud (20). While
most of these 20 cases were identified through comparisons to the earned wage information
reported to the DEO, matches to the Florida Retirement System also detected fraud. Site visits to
Given this low rate of
detection, it is not surprising that those methods did not detect any fraud within our sample.
57 Analysis of Florida’s Supplemental Nutrition Assistance Program (SNAP) Eligibility Data, Audit Report 27002-0002-13, November 2011, page 5-7.
58 Ibid., page 1.

23
verify household composition and residency also detected six instances of fraud. Desk reviews
led to detection of five instances of fraudulent activity, ranging from residency issues, to un-
reported or under-reported income, to identity theft. It is also worth noting that in several cases,
fraudulent activity was discovered through multiple detection methods, which were implemented
concurrently.
Table 2
Detection Method Number of Cases
Site Visit* 6
Desk Reviews 5
Income Verification – Wages 19
Income Verification – Unemployment 0
Income Verification – Florida Retirement 1
Address Matches 0
Death Master File Match 0
PARIS Match 0
eDRS Match 0 * Site visits conducted on sub-sample of 100 only.
As noted, investigators detected 28 instances of fraud in our sample of 545 households.59
Three of those cases were found solely through the site visits conducted on the sub-sample. The
remaining 25 cases were found in the course of investigations conducted on the entire sample of
545.60
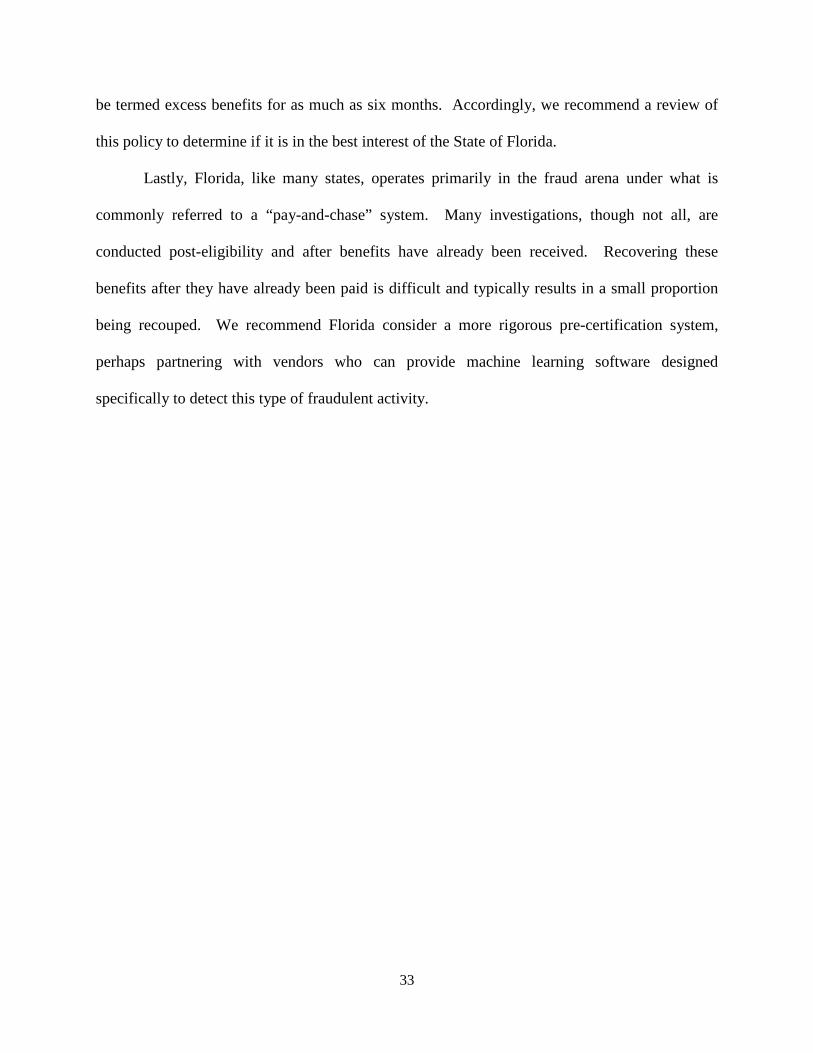
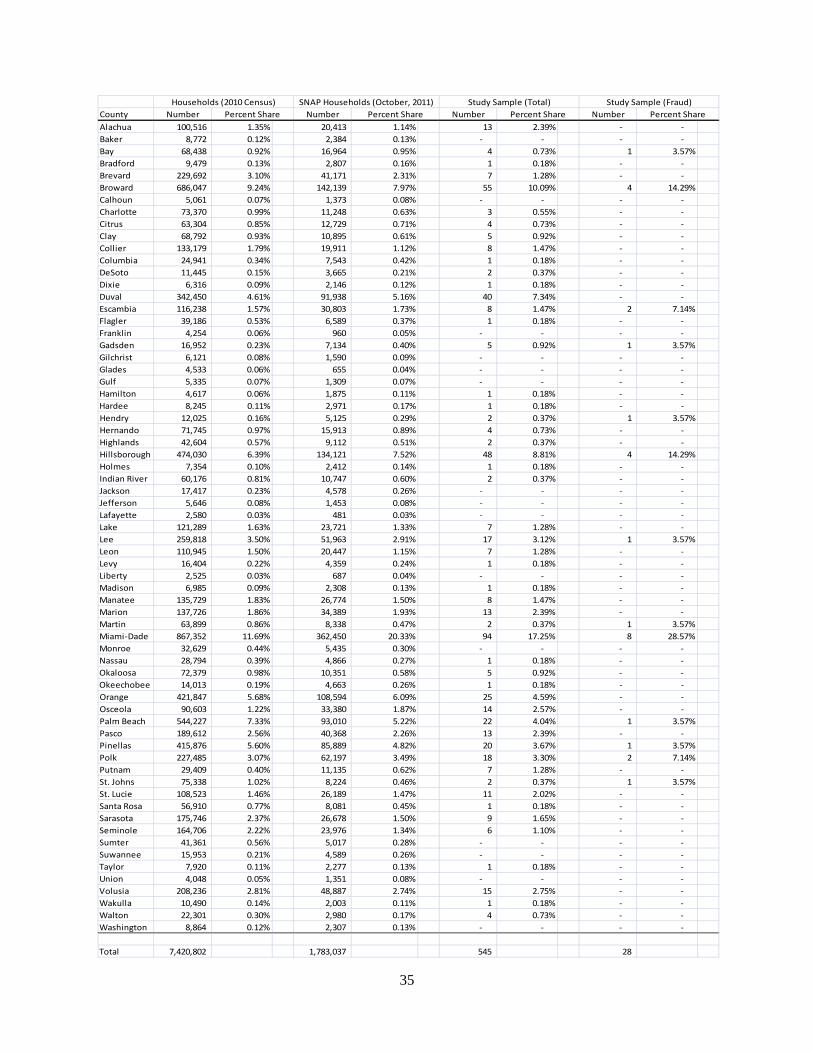
59 Information detailing the sample by county can be found in the Appendix.
The overall fraud rate is based on a combination of the results from both the original
60 Several of the instances of fraud were detected by both the site visits and other methodologies.

24
sample and the sub-sample. We estimate the overall rate of fraud incidence in the Florida SNAP
system to be 7.5 percent.61
In addition to the 28 cases of fraud noted above, we have been asked to note that there
were an additional six recipients identified through the desk review process which DPAF
investigators believe have a high likelihood of having fraudulently received excess SNAP funds.
DPAF has opened additional investigations into those cases and the results are pending.
However, as of the date of this report, investigators have not yet categorized those cases as
fraudulent. If some or all of those cases are eventually revealed to have been fraudulent, we
would supplement this report at the Strike Force’s request to update the calculations. If all six
cases are found to have involved fraudulent activity, the fraud rate estimate would rise from 7.5
percent to 8.6 percent.
Sampling Error
Because our estimate is based on a sample, we cannot expect it to be perfectly accurate.
The situation is akin to flipping a coin some number of times (the sample size) to determine if it
is a fair coin. Different samples give different estimates, and few of the samples are likely to
result in exactly 50 percent heads, so each estimate comes with a likely error due to sampling.
The sampling error is determined primarily by the size of the sample. Thus, if we flipped a coin
10 times and the results were 60% heads, we would not be concerned about its fairness because
the sample is so small. However, if we flipped a coin 1,000 times and the results were 60%
heads, we would conclude that the coin is not fair because 60% is “too far away” from 50% for a
61 This is calculated using the 25 cases detected in the overall sample and the 3 cases identified in the sub-sample (out of 97 remaining from the sub-sample that had no fraud detection prior to the site visits). The resulting fraud rate calculation is [((3/97)*(545-25)) + 25]/545.

25
sample of that size. More precise estimates (that is, ones with smaller sampling error and
narrower confidence intervals) require larger samples. However, they also typically incur greater
time and expense in performing the estimation.
When we allow for the likely error from sampling, we estimate that the fraud rate for the
population of all payments is between 4.2 percent and 11.7 percent with 95% confidence. The
“95% confidence” means that, applying our methods to many different samples of this size, the
fraud rate would lie within the calculated interval 95% of the time.62
Descriptive Statistics
We have detailed below a comparison of the characteristics of those within the sample
who were found to have committed fraud to those who did not. Such a comparison may reveal
differences between the two groups. However, we caution the reader regarding any attempt to
use applicant characteristics to profile individuals regarding their likelihood to commit fraud.
The use of averages to draw conclusions about specific individuals or groups has any number of
unforeseen complications. Table 3 below highlights a variety of descriptive statistics for the
households in our study sample. In each case, we show the average or proportion for the
households, grouped by those whom investigators concluded committed fraud and those they
concluded did not. We performed commonly used statistical tests (t-tests or Chi-square tests) to
determine if the averages between the two groups were statistically significantly different.
Statistically significantly differences are those that are large enough that one is not able to
attribute them to random chance. For most characteristics, the groups were not different. Those
62 Note that the estimated range of the 95 percent confidence level is not precisely centered around our estimate of 7.5 percent. This is a standard statistical effect that occurs the further away one gets from an estimate of 50 percent.

26
characteristics that were statistically significantly different relate to the size of the household,
including both the number of children and the number of adults in the household.
Characteristics of SNAP Recipients by Fraud Status
Characteristic
Household Composition
Number in Household (Reported) * 2.79 1.87 Number in Household (Computed) * 2.93 2.02 Number of Adults * 1.71 1.28 Number of Children (17 and under) * 1.21 0.74 Number of Adult Males 0.82 0.55 Percent of Households with at least 2 Adults * 0.50 0.25 Age of Head of Household (HHH) 40.21 44.21 Age of Adults 37.70 43.63 Age of Children * 9.73 7.11 Percent of Households where HHH is Female 0.75 0.63 Percent of Households where HHH is US Citizen 0.82 0.87
Monthly Income & Expenses
Gross Income $725.75 $638.82 Shelter $406.68 $339.29 Disposable Income 1 $319.07 $299.53 Utilities $219.82 $200.69
SNAP related
Percent of Households with Expedited Application 0.14 0.15 Percent of Households with Simplified Eligibility 0.75 0.66
*Statistically significantly different at 5% probability. 1 Defined as (Gross Income - Shelter Expense)
Table 3 Study Sample Statistics
Means
Study Sample (n=545) No Fraud (n=517) Fraud (n=28)

27
In order to further determine whether or not these variables appear to be statistically
significantly related to fraud, we conducted additional statistical analyses. Logistic regression
analysis is a commonly used technique in which one can control for a variety of factors to
determine whether or not they are correlated with a categorical dependent variable, in this case
committing fraud or not. We ran regressions controlling for characteristics of the head of
household (age, gender, etc.), the number of minors, number of adults, income and expense
variables, as well as eligibility characteristics (simplified or expedited). In each of our models,
the sole variable that was statistically significantly correlated with fraud was the number of
adults present in the household. More precisely, the greater the number of adults, the more likely
that household was to have committed fraud.
Estimated Overpayment Rate
It is important to note that the 7.5 percent figure is a rate of fraud incidence and not a
measure of the proportion of total dollars overpaid to fraudulent recipients. In the vast majority
of instances, the elimination of fraudulent activity would likely result in a lower payment for
recipients, but not complete ineligibility and elimination of all benefits. Only if 100 percent of
the dollars associated with these incidents are fraudulent, or alternatively, if these incidents are
for disproportionately larger dollar figures than the average SNAP payment, could the
overpayment rate in dollar terms be 7.5 percent (or more). While we were not able to directly
calculate the reduction in payments that would occur in the absence of the fraud that was
detected in our sample, we provide here an estimated overpayment rate in dollars using two
separate calculation methods.

28
The first methodology involves comparing the average monthly payment amount
received by recipients who were identified as having misrepresented information to the average
monthly payment amount in the entire SNAP universe. It is important to recognize that these 28
cases represent a very small sample of recipients and thus the corresponding estimate has a
potentially large sampling error. It is also important to note that we did not compare the
characteristics of those who committed fraud to the characteristics of all individuals within the
SNAP universe. Ideally, one would want to determine if these individuals would have been
entitled to greater benefits, even in the absence of fraud, because they possessed more of the
characteristics that correlate with higher benefits than those in the SNAP universe on the whole.
If it is the case that the individuals committing fraud are different than the average SNAP
recipient (aside from the fact they have misrepresented information), then the estimate may
suffer from sample bias. Sample bias can occur when an estimate is based on a sample that is
not representative. While our sample of recipients used to determine the fraud incidence rate
was randomly drawn and very likely to be representative, it may not be the case that those who
committed fraud are representative of the average recipient. Unfortunately, that determination
was beyond the scope of this study.
The recipients in this study who were identified as having committed fraud received an
average benefit in the month they were sampled of $389.14. The average Florida SNAP
recipient received a monthly benefit of $247.30 during the months from which our sample was
drawn. If we assume the difference of $141.84 is due to fraud, we would estimate the
overpayment rate among those who commit fraud to be 36.4 percent. In order to estimate the
overpayment rate for the SNAP program, we multiply the estimated rate of fraud incidence (7.5
percent) times the estimated rate of overpayment among those who commit fraud (36.4 percent).

29
This yields an estimated dollar overpayment rate for the SNAP program of approximately 2.75
percent.
The second methodology involves the use of historical information regarding fraud loss
that was provided to ERS Group by the Division of Public Assistance Fraud. At ERS Group’s
request, DPAF was able to provide average overpayment amounts based on fraud cases within
the SNAP program during the three year period from March, 2009 to March, 2012. During that
time, DPAF was involved in the investigation of over 6,000 cases in which fraudulent activity
was found. According to DPAF, those cases resulted in an average monthly overpayment of
$241.88. In contrast, as noted above, the average monthly SNAP payment during our sample
period was $247.30. Under the assumption that those who commit fraud are similar to other
SNAP recipients in terms of the characteristics that define eligibility and benefits (such as
income, expenses, household composition, etc.), this represents an overpayment rate on
fraudulent cases of 49.4 percent.63
63 $241.88/($241.88 + $247.30) = 49.4 percent.
As above, the estimated overpayment rate for the SNAP
program would be the estimated rate of fraud incidence (7.5 percent) multiplied by the historical
fraud case overpayment rate (49.4 percent). That resulting dollar overpayment estimate is 3.7
percent. However, as above, there are concerns regarding this second overpayment rate
estimation as well. First, as noted above, this estimate is dependent upon the assumption that
those who commit fraud have similar characteristics to those who do not. In addition, this
estimate is also dependent upon the assumption that the fraud cases that have been investigated
by DPAF are similar to fraud cases on average with regard to the resulting overpayment. In most
instances, the cases that are discovered, referred to and investigated by DPAF and subsequently
result in a finding of fraud are likely to be biased toward larger overpayment amounts. This is

30
because DCF and DPAF are more likely to discover, refer and investigate cases where the
potential loss due to fraud is higher than the average loss due to fraud (discovered and not
discovered). Thus, there is some likelihood that one or both of these assumptions are violated,
either of which would lead to bias. Accordingly, it is more likely that the 3.7 percent estimate
represents an upper bound on the dollar overpayment rate.
It is also important to note that one type of fraudulent activity, trafficking, was not
examined by our study. Trafficking of SNAP benefits occurs when a vendor (grocery store, mini
mart, etc.) purchases the monthly SNAP benefit from a recipient for a fraction of its worth. The
recipient receives cash, which can be spent as he or she wishes, while the vendor is reimbursed
for the entire amount of monthly benefit. This form of fraud is not detectable by any
methodology we could readily employ. In addition, it is not entirely clear that the SNAP benefits
paid to these recipients would change based on this type of fraud, and so it may not directly
impact the overall overpayment rate to recipients. However, it is clearly a type of fraud and it is
therefore noteworthy as part of this effort. A recent study by the USDA indicated that
approximately 8.2 percent of stores trafficked in this manner and estimates SNAP trafficking (in
dollar terms) at approximately one percent.64
VI Concluding Remarks
The Florida Medicaid & Public Assistance Fraud Strike Force contracted ERS Group to
review information on metrics and methodologies used to measure waste, fraud, and abuse in
public assistance programs. The Strike Force also requested we estimate the amount of fraud,
64 See the March, 2011 USDA FNS report entitled “The Extent of Trafficking in the Supplemental Nutrition Assistance Program (SNAP): 2006 – 2008”. See http://www.fns.usda.gov/ora/menu/Published/SNAP/FILES/ ProgramIntegrity/Trafficking2006Summary.pdf

31
waste or abuse leading to overpayments in the Florida Food Assistance Program. There are a
number of ways in which fraud is examined in academic studies and government programs.
However, the most useful methodology for estimating fraud within Florida’s SNAP was to draw
a random sample of payments and have Florida’s professional fraud investigators examine those
cases for any misrepresentation of information, (i.e., fraud). The investigators for DPAF and
DCF discovered 28 instances of fraud within the randomly drawn sample of 545 cases. Based on
the various investigative methodologies employed on the entire sample, as well as the site visits
employed on a sub-sample of 100 cases, we estimate fraud incidence within SNAP to be 7.5
percent. There were an additional six cases with pending investigations, which could raise that
estimate to as much as 8.6 percent.
Further, we employed two methodologies to estimate the dollar overpayment rate within
SNAP, both based in part on the fraud incidence rate estimate. First, we compared the average
monthly payment amount received by recipients who were identified as having committed fraud
to the average monthly payment amount in the entire SNAP universe. Multiplying this average
overpayment rate of 36.4 percent by the fraud incidence rate of 7.5 percent yields an estimated
dollar overpayment rate of approximately 2.75 percent.
The second method utilized historical information, provided by DPAF, regarding average
monthly overpayment amounts on cases involving fraud. Multiplying the average overpayment
rate indicated by the DPAF data, 49.4 percent, by the fraud incidence rate of 7.5 percent yields
an estimated dollar overpayment rate of approximately 3.7 percent. Additionally, a recent
USDA report estimates national vendor trafficking in dollar terms at approximately one percent.
It is critical to recognize that with both of these methodologies, the dollar overpayment
estimates have the potential to be unreliable due to the relatively small number of fraud cases

32
identified in the sample (28), or biased by the nature of the information on fraud overpayment
provided by DPAF. Further study of the 28 identified cases and recalculation of their monthly
benefit based on additional information would provide a more accurate estimate of the dollar
overpayment rate in Florida’s Food Assistance Program.
The two most common mechanisms by which fraud was perpetrated in the sample were
through false reporting of income and/or household composition. While investigators employed
nine different methods of fraud detection, the vast majority of the fraud uncovered in the sample
was related to one of these two reasons. Accordingly, we recommend that DCF, the agency
tasked with administering the SNAP program, institute computer comparison of applicant’s (or
re-applicant’s) reported income to that found in other state databases, including Florida wage
income reported to the Department of Economic Opportunity. We also recommend
implementation of a system in which household composition and residency are more routinely
checked. This may include partnering with a vendor who can perform these types of checks
using publicly available or privately held databases.
We also ran regression analyses to determine if there were any characteristics correlated
with a higher likelihood of committing fraud. While an increased number of adults in the
recipient household was correlated with an increased likelihood of fraud, we caution
stakeholders against using this information proactively.
Further, it is our understanding that households are not required to report changes in
income (or other characteristics) that have occurred within six months of application (or re-
application). While we did not identify any fraud based on that criteria since that is the rule
under which the system operates, the potential for waste due to that rule may be significant.
Households with meaningful changes in financial or other circumstances can receive what could
33
be termed excess benefits for as much as six months. Accordingly, we recommend a review of
this policy to determine if it is in the best interest of the State of Florida.
Lastly, Florida, like many states, operates primarily in the fraud arena under what is
commonly referred to a “pay-and-chase” system. Many investigations, though not all, are
conducted post-eligibility and after benefits have already been received. Recovering these
benefits after they have already been paid is difficult and typically results in a small proportion
being recouped. We recommend Florida consider a more rigorous pre-certification system,
perhaps partnering with vendors who can provide machine learning software designed
specifically to detect this type of fraudulent activity.

APPENDIX
Results by County
35
County Number Number Number NumberAlachua 100,516 1.35% 20,413 1.14% 13 2.39% - -Baker 8,772 0.12% 2,384 0.13% - - - -Bay 68,438 0.92% 16,964 0.95% 4 0.73% 1 3.57%Bradford 9,479 0.13% 2,807 0.16% 1 0.18% - -Brevard 229,692 3.10% 41,171 2.31% 7 1.28% - -Broward 686,047 9.24% 142,139 7.97% 55 10.09% 4 14.29%Calhoun 5,061 0.07% 1,373 0.08% - - - -Charlotte 73,370 0.99% 11,248 0.63% 3 0.55% - -Citrus 63,304 0.85% 12,729 0.71% 4 0.73% - -Clay 68,792 0.93% 10,895 0.61% 5 0.92% - -Collier 133,179 1.79% 19,911 1.12% 8 1.47% - -Columbia 24,941 0.34% 7,543 0.42% 1 0.18% - -DeSoto 11,445 0.15% 3,665 0.21% 2 0.37% - -Dixie 6,316 0.09% 2,146 0.12% 1 0.18% - -Duval 342,450 4.61% 91,938 5.16% 40 7.34% - -Escambia 116,238 1.57% 30,803 1.73% 8 1.47% 2 7.14%Flagler 39,186 0.53% 6,589 0.37% 1 0.18% - -Franklin 4,254 0.06% 960 0.05% - - - -Gadsden 16,952 0.23% 7,134 0.40% 5 0.92% 1 3.57%Gilchrist 6,121 0.08% 1,590 0.09% - - - -Glades 4,533 0.06% 655 0.04% - - - -Gulf 5,335 0.07% 1,309 0.07% - - - -Hamilton 4,617 0.06% 1,875 0.11% 1 0.18% - -Hardee 8,245 0.11% 2,971 0.17% 1 0.18% - -Hendry 12,025 0.16% 5,125 0.29% 2 0.37% 1 3.57%Hernando 71,745 0.97% 15,913 0.89% 4 0.73% - -Highlands 42,604 0.57% 9,112 0.51% 2 0.37% - -Hillsborough 474,030 6.39% 134,121 7.52% 48 8.81% 4 14.29%Holmes 7,354 0.10% 2,412 0.14% 1 0.18% - -Indian River 60,176 0.81% 10,747 0.60% 2 0.37% - -Jackson 17,417 0.23% 4,578 0.26% - - - -Jefferson 5,646 0.08% 1,453 0.08% - - - -Lafayette 2,580 0.03% 481 0.03% - - - -Lake 121,289 1.63% 23,721 1.33% 7 1.28% - -Lee 259,818 3.50% 51,963 2.91% 17 3.12% 1 3.57%Leon 110,945 1.50% 20,447 1.15% 7 1.28% - -Levy 16,404 0.22% 4,359 0.24% 1 0.18% - -Liberty 2,525 0.03% 687 0.04% - - - -Madison 6,985 0.09% 2,308 0.13% 1 0.18% - -Manatee 135,729 1.83% 26,774 1.50% 8 1.47% - -Marion 137,726 1.86% 34,389 1.93% 13 2.39% - -Martin 63,899 0.86% 8,338 0.47% 2 0.37% 1 3.57%Miami-Dade 867,352 11.69% 362,450 20.33% 94 17.25% 8 28.57%Monroe 32,629 0.44% 5,435 0.30% - - - -Nassau 28,794 0.39% 4,866 0.27% 1 0.18% - -Okaloosa 72,379 0.98% 10,351 0.58% 5 0.92% - -Okeechobee 14,013 0.19% 4,663 0.26% 1 0.18% - -Orange 421,847 5.68% 108,594 6.09% 25 4.59% - -Osceola 90,603 1.22% 33,380 1.87% 14 2.57% - -Palm Beach 544,227 7.33% 93,010 5.22% 22 4.04% 1 3.57%Pasco 189,612 2.56% 40,368 2.26% 13 2.39% - -Pinellas 415,876 5.60% 85,889 4.82% 20 3.67% 1 3.57%Polk 227,485 3.07% 62,197 3.49% 18 3.30% 2 7.14%Putnam 29,409 0.40% 11,135 0.62% 7 1.28% - -St. Johns 75,338 1.02% 8,224 0.46% 2 0.37% 1 3.57%St. Lucie 108,523 1.46% 26,189 1.47% 11 2.02% - -Santa Rosa 56,910 0.77% 8,081 0.45% 1 0.18% - -Sarasota 175,746 2.37% 26,678 1.50% 9 1.65% - -Seminole 164,706 2.22% 23,976 1.34% 6 1.10% - -Sumter 41,361 0.56% 5,017 0.28% - - - -Suwannee 15,953 0.21% 4,589 0.26% - - - -Taylor 7,920 0.11% 2,277 0.13% 1 0.18% - -Union 4,048 0.05% 1,351 0.08% - - - -Volusia 208,236 2.81% 48,887 2.74% 15 2.75% - -Wakulla 10,490 0.14% 2,003 0.11% 1 0.18% - -Walton 22,301 0.30% 2,980 0.17% 4 0.73% - -Washington 8,864 0.12% 2,307 0.13% - - - -
Total 7,420,802 1,783,037 545 28
Study Sample (Total)Percent Share
Study Sample (Fraud)Percent Share
Households (2010 Census)Percent Share
SNAP Households (October, 2011)Percent Share