Embed Size (px)
Citation preview
FLASH-Seminar 26.2.2008 Norbert Pchalek 1
Statistical Analysis of FLASH-uptime- and downtime-durations
University/DESY-Hamburg Norbert Pchalek
FLASH-Seminar 26.2.2008 Norbert Pchalek 2
Contents
1. Motivation
2. Descriptive Analysis and Results
3. Mathematical Analysis and Results
4. Conclusion and Outlook
FLASH-Seminar 26.2.2008 Norbert Pchalek 3
1.Motivation
- Objective judgement of
actual FLASH-uptime and downtime-data
- Adaquate treatment of reliability and availability
- Projection from FLASH on XFEL and ILC
FLASH-Seminar 26.2.2008 Norbert Pchalek 4
2. Descriptive Analysis and Results
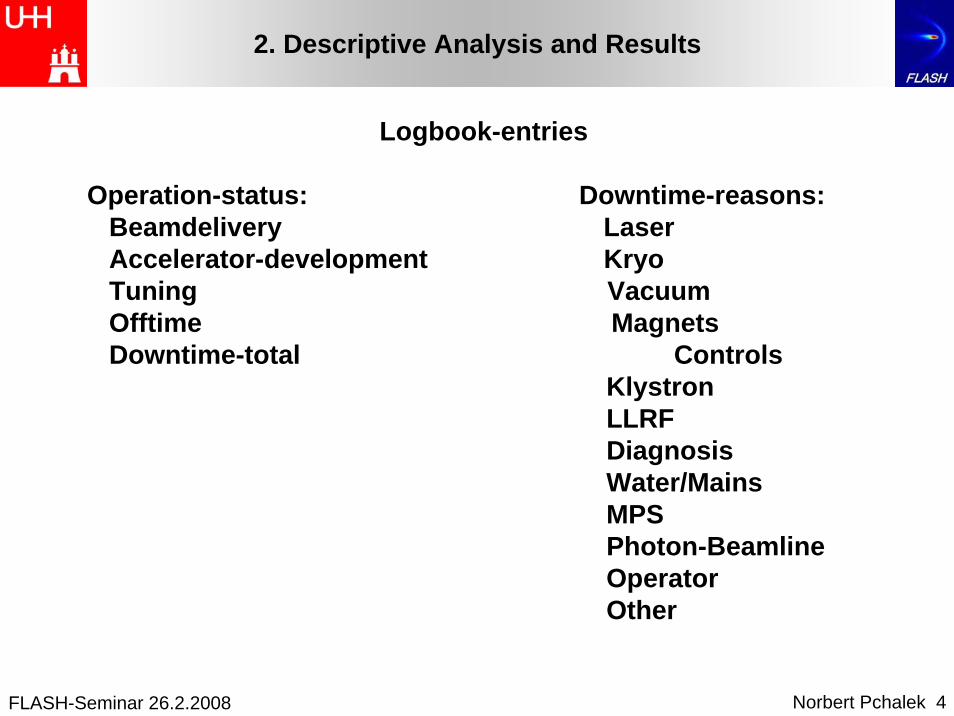
Logbook-entries
Operation-status: Downtime-reasons: Beamdelivery Laser Accelerator-development KryoTuning Vacuum Offtime Magnets Downtime-total Controls
Klystron LLRFDiagnosis Water/Mains MPS Photon-BeamlineOperator Other
FLASH-Seminar 26.2.2008 Norbert Pchalek 5
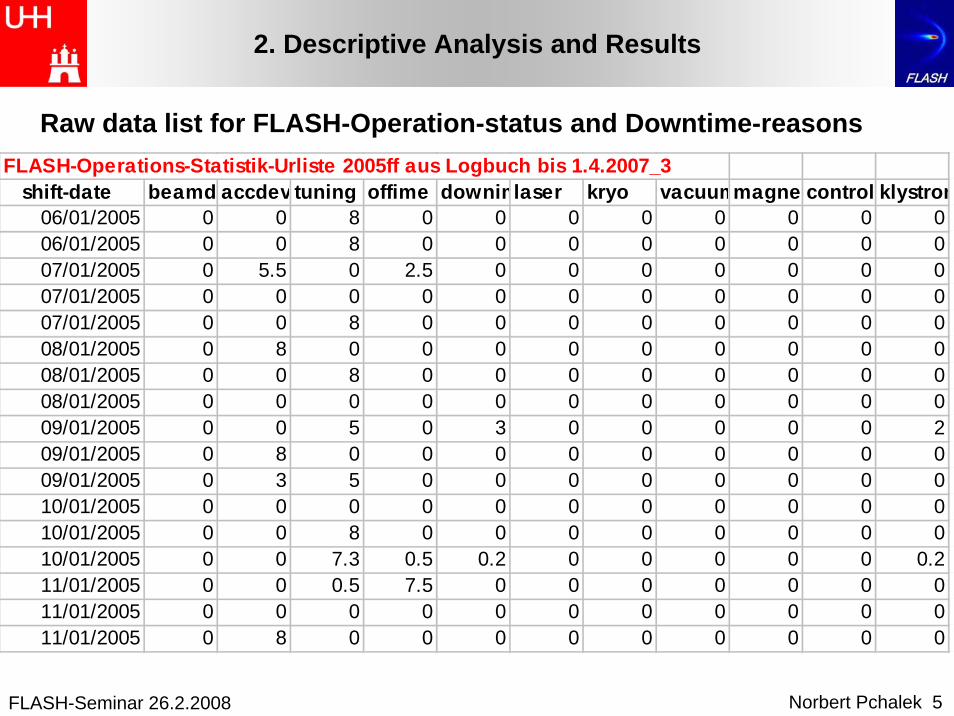
FLASH-Operations-Statistik-Urliste 2005ff aus Logbuch bis 1.4.2007_3 shift-date beamd accdev tuning offime downimlaser kryo vacuummagne control klystron
06/01/2005 0 0 8 0 0 0 0 0 0 0 006/01/2005 0 0 8 0 0 0 0 0 0 0 007/01/2005 0 5.5 0 2.5 0 0 0 0 0 0 007/01/2005 0 0 0 0 0 0 0 0 0 0 007/01/2005 0 0 8 0 0 0 0 0 0 0 008/01/2005 0 8 0 0 0 0 0 0 0 0 008/01/2005 0 0 8 0 0 0 0 0 0 0 008/01/2005 0 0 0 0 0 0 0 0 0 0 009/01/2005 0 0 5 0 3 0 0 0 0 0 209/01/2005 0 8 0 0 0 0 0 0 0 0 009/01/2005 0 3 5 0 0 0 0 0 0 0 010/01/2005 0 0 0 0 0 0 0 0 0 0 010/01/2005 0 0 8 0 0 0 0 0 0 0 010/01/2005 0 0 7.3 0.5 0.2 0 0 0 0 0 0.211/01/2005 0 0 0.5 7.5 0 0 0 0 0 0 011/01/2005 0 0 0 0 0 0 0 0 0 0 011/01/2005 0 8 0 0 0 0 0 0 0 0 0
2. Descriptive Analysis and Results
Raw data list for FLASH-Operation-status and Downtime-reasons
FLASH-Seminar 26.2.2008 Norbert Pchalek 6
2. Descriptive Analysis and Results
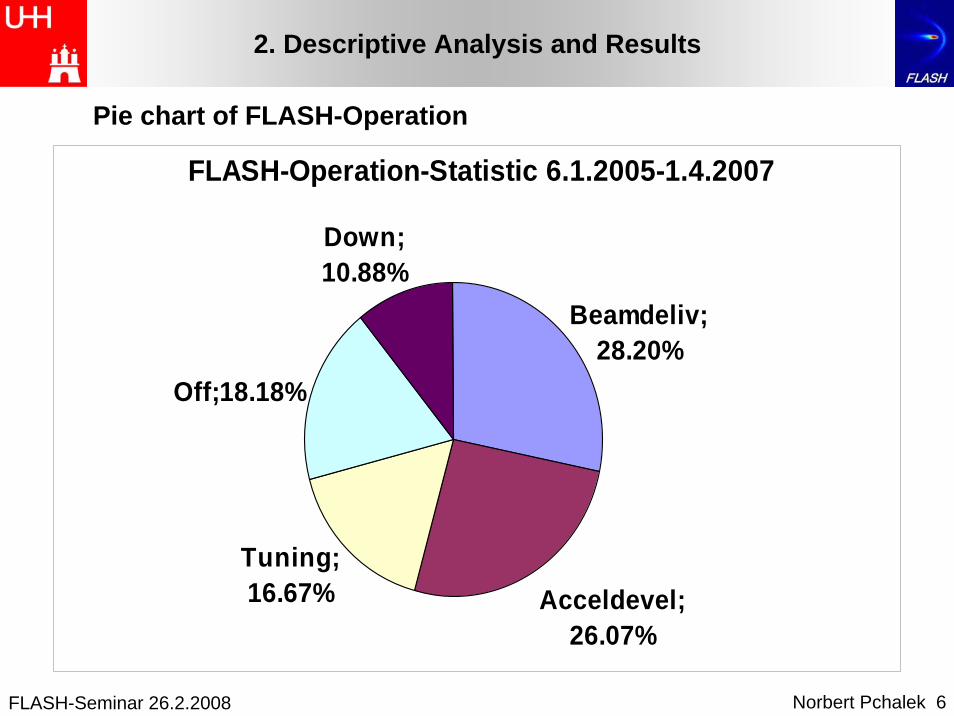
Pie chart of FLASH-Operation
FLASH-Operation-Statistic 6.1.2005-1.4.2007
Beamdeliv;28.20%
Acceldevel; 26.07%
Tuning; 16.67%
Off;18.18%
Down; 10.88%
FLASH-Seminar 26.2.2008 Norbert Pchalek 7
2. Descriptive Analysis and Results
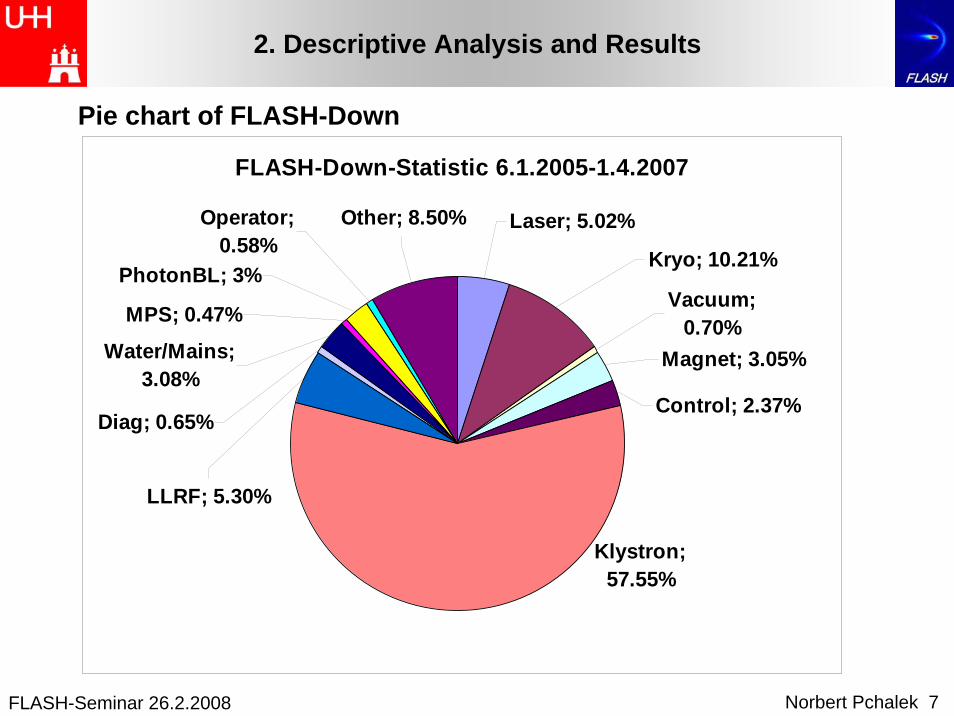
Pie chart of FLASH-Down
FLASH-Down-Statistic 6.1.2005-1.4.2007
MPS; 0.47%
PhotonBL; 3%
Operator; 0.58%
Water/Mains; 3.08%
Diag; 0.65%
LLRF; 5.30%
Klystron;57.55%
Other; 8.50%
Control; 2.37%
Magnet; 3.05%
Vacuum; 0.70%
Kryo; 10.21%
Laser; 5.02%
FLASH-Seminar 26.2.2008 Norbert Pchalek 8
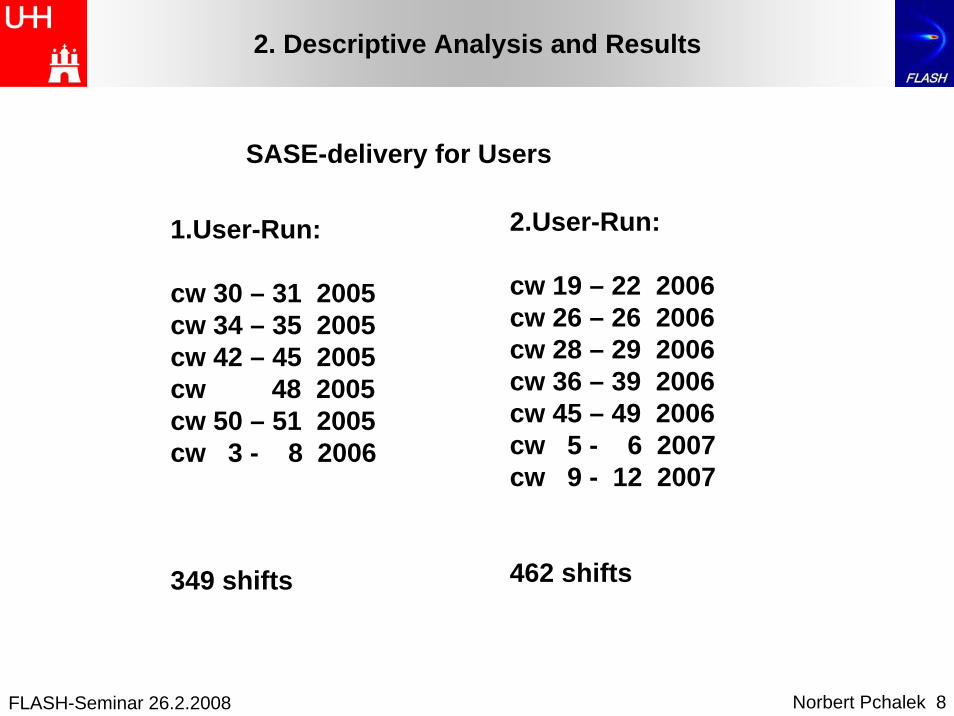
SASE-delivery for Users
2. Descriptive Analysis and Results
1.User-Run:
cw 30 – 31 2005 cw 34 – 35 2005 cw 42 – 45 2005 cw 48 2005 cw 50 – 51 2005 cw 3 - 8 2006
349 shifts
2.User-Run:
cw 19 – 22 2006 cw 26 – 26 2006 cw 28 – 29 2006 cw 36 – 39 2006cw 45 – 49 2006 cw 5 - 6 2007 cw 9 - 12 2007
462 shifts
FLASH-Seminar 26.2.2008 Norbert Pchalek 9
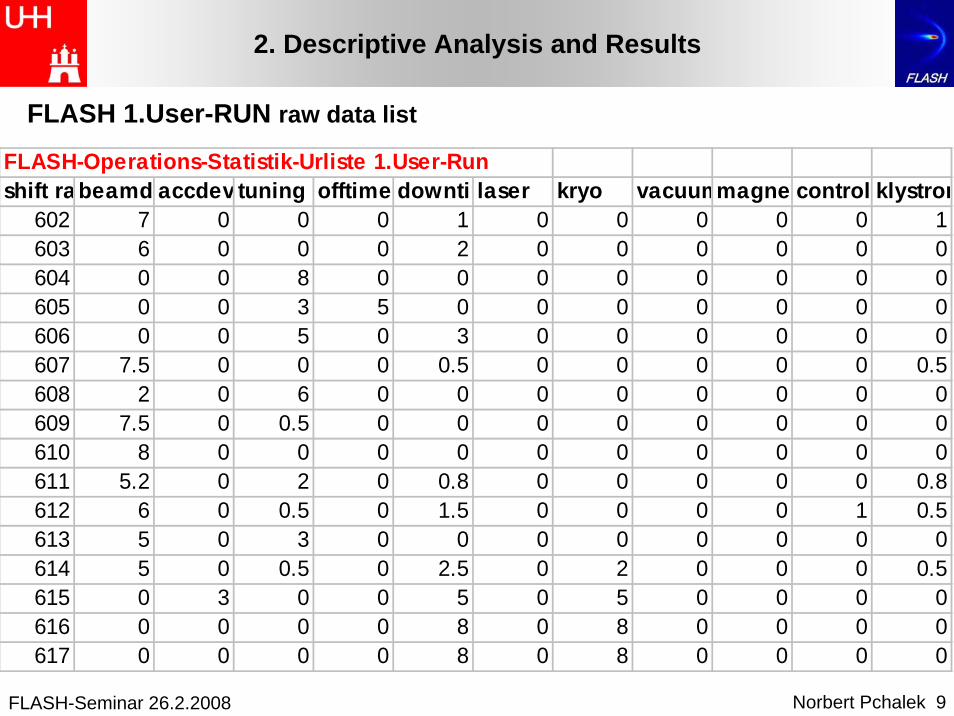
FLASH 1.User-RUN raw data list
FLASH-Operations-Statistik-Urliste 1.User-Runshift ra beamd accdev tuning offtime downtimlaser kryo vacuummagne control klystron
602 7 0 0 0 1 0 0 0 0 0 1603 6 0 0 0 2 0 0 0 0 0 0604 0 0 8 0 0 0 0 0 0 0 0605 0 0 3 5 0 0 0 0 0 0 0606 0 0 5 0 3 0 0 0 0 0 0607 7.5 0 0 0 0.5 0 0 0 0 0 0.5608 2 0 6 0 0 0 0 0 0 0 0609 7.5 0 0.5 0 0 0 0 0 0 0 0610 8 0 0 0 0 0 0 0 0 0 0611 5.2 0 2 0 0.8 0 0 0 0 0 0.8612 6 0 0.5 0 1.5 0 0 0 0 1 0.5613 5 0 3 0 0 0 0 0 0 0 0614 5 0 0.5 0 2.5 0 2 0 0 0 0.5615 0 3 0 0 5 0 5 0 0 0 0616 0 0 0 0 8 0 8 0 0 0 0617 0 0 0 0 8 0 8 0 0 0 0
2. Descriptive Analysis and Results
FLASH-Seminar 26.2.2008 Norbert Pchalek 10
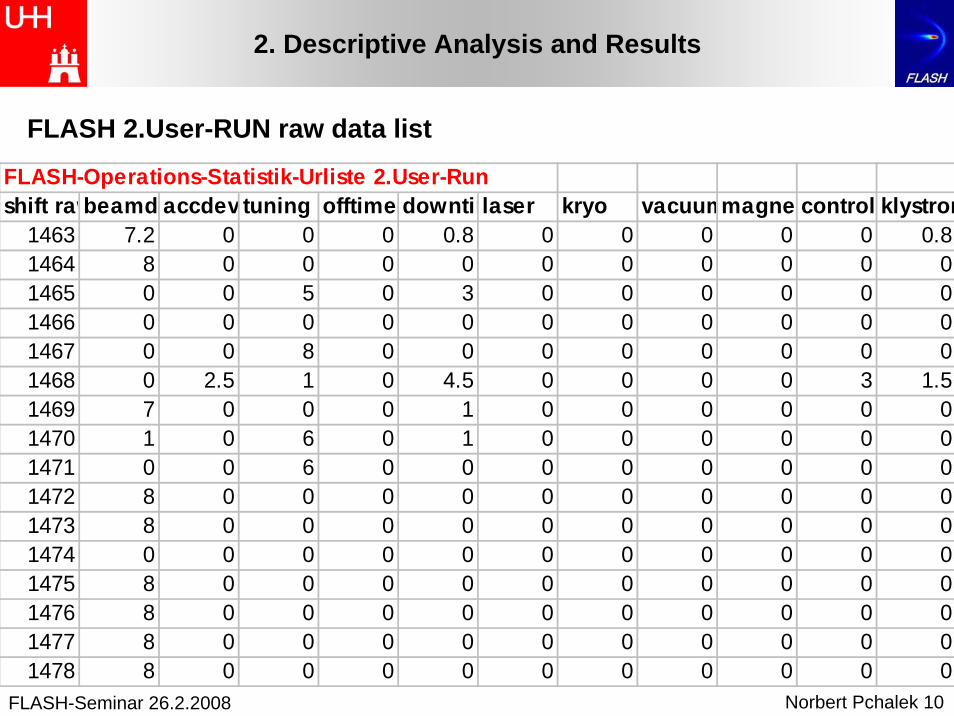
FLASH-Operations-Statistik-Urliste 2.User-Run shift rawbeamd accdev tuning offtime downtimlaser kryo vacuummagne control klystron
1463 7.2 0 0 0 0.8 0 0 0 0 0 0.81464 8 0 0 0 0 0 0 0 0 0 01465 0 0 5 0 3 0 0 0 0 0 01466 0 0 0 0 0 0 0 0 0 0 01467 0 0 8 0 0 0 0 0 0 0 01468 0 2.5 1 0 4.5 0 0 0 0 3 1.51469 7 0 0 0 1 0 0 0 0 0 01470 1 0 6 0 1 0 0 0 0 0 01471 0 0 6 0 0 0 0 0 0 0 01472 8 0 0 0 0 0 0 0 0 0 01473 8 0 0 0 0 0 0 0 0 0 01474 0 0 0 0 0 0 0 0 0 0 01475 8 0 0 0 0 0 0 0 0 0 01476 8 0 0 0 0 0 0 0 0 0 01477 8 0 0 0 0 0 0 0 0 0 01478 8 0 0 0 0 0 0 0 0 0 0
2. Descriptive Analysis and Results
FLASH 2.User-RUN raw data list
FLASH-Seminar 26.2.2008 Norbert Pchalek 11
2. Descriptive Analysis and Results
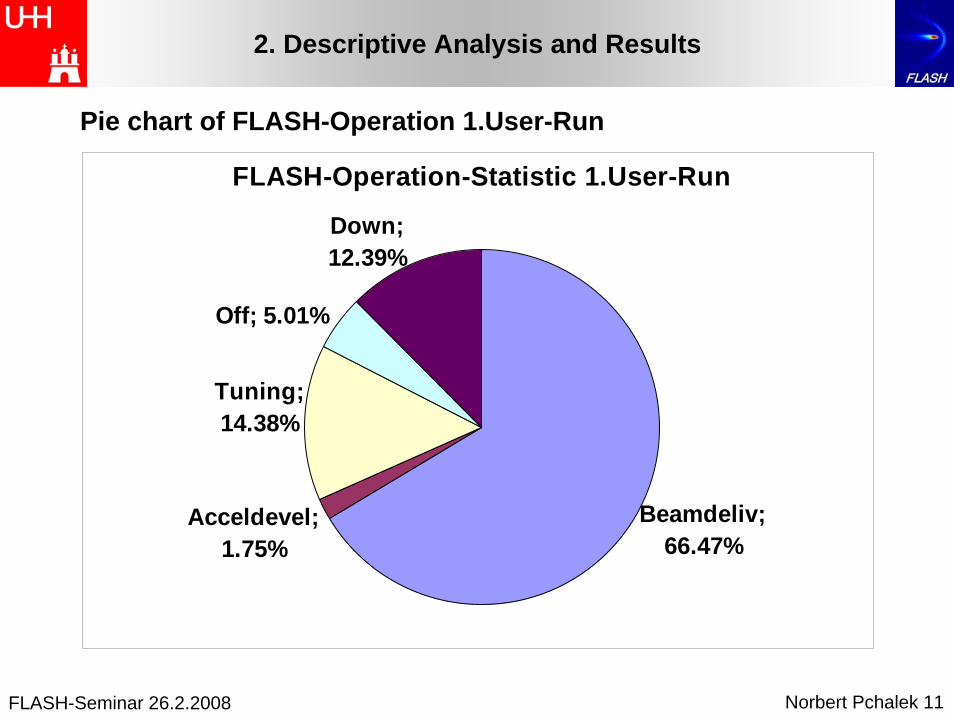
Pie chart of FLASH-Operation 1.User-Run
FLASH-Operation-Statistic 1.User-Run
Down; 12.39%
Off; 5.01%
Tuning; 14.38%
Acceldevel; 1.75%
Beamdeliv; 66.47%
FLASH-Seminar 26.2.2008 Norbert Pchalek 12
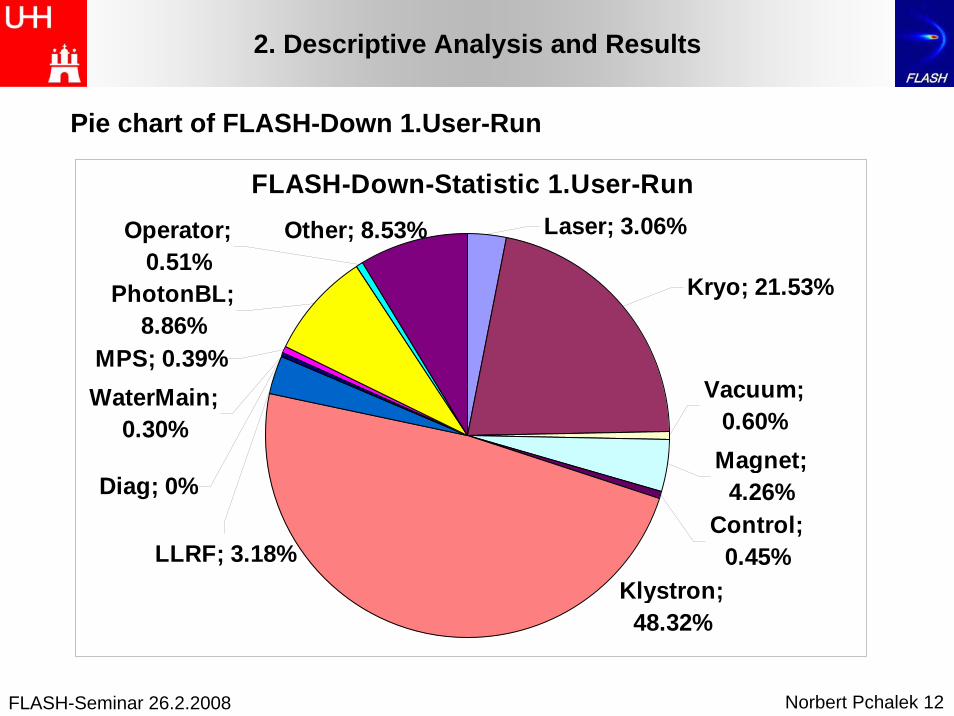
2. Descriptive Analysis and Results
Pie chart of FLASH-Down 1.User-Run
FLASH-Down-Statistic 1.User-RunLaser; 3.06%
Kryo; 21.53%
Vacuum;0.60%
Magnet; 4.26%
Control;0.45%
Other; 8.53%
Klystron; 48.32%
LLRF; 3.18%
Diag; 0%
WaterMain; 0.30%
Operator; 0.51%
PhotonBL; 8.86%
MPS; 0.39%
FLASH-Seminar 26.2.2008 Norbert Pchalek 13
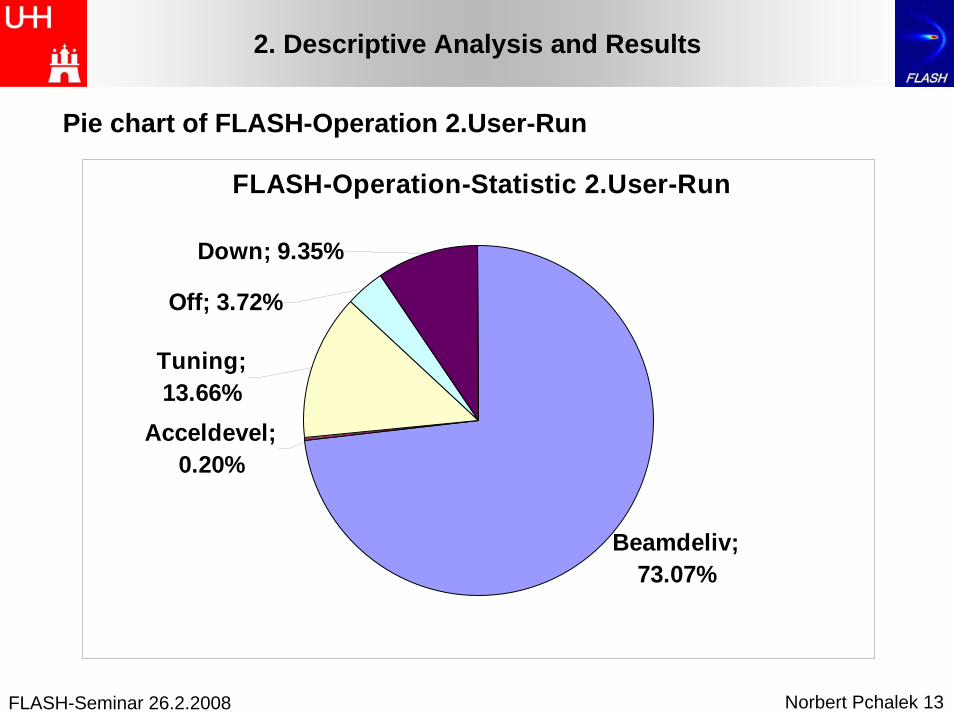
2. Descriptive Analysis and Results
Pie chart of FLASH-Operation 2.User-Run
FLASH-Operation-Statistic 2.User-Run
Beamdeliv; 73.07%
Acceldevel; 0.20%
Tuning; 13.66%
Off; 3.72%
Down; 9.35%
FLASH-Seminar 26.2.2008 Norbert Pchalek 14
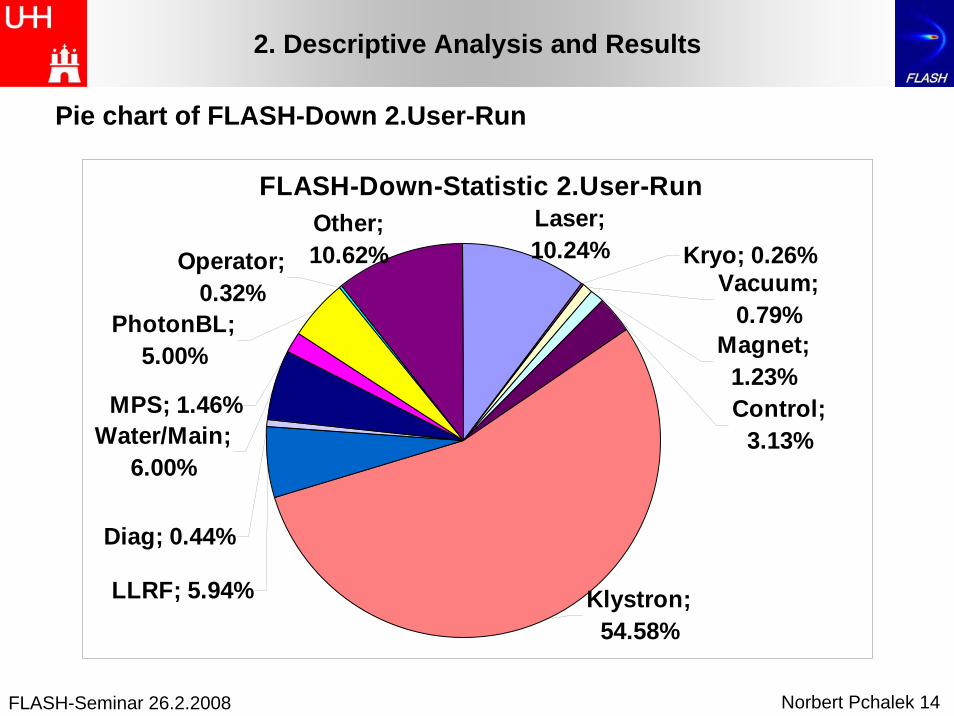
2. Descriptive Analysis and Results
Pie chart of FLASH-Down 2.User-Run
FLASH-Down-Statistic 2.User-Run
MPS; 1.46%
PhotonBL; 5.00%
Operator; 0.32%
Water/Main; 6.00%
Diag; 0.44%
LLRF; 5.94% Klystron; 54.58%
Other; 10.62%
Control; 3.13%
Magnet; 1.23%
Vacuum; 0.79%
Kryo; 0.26%Laser; 10.24%
FLASH-Seminar 26.2.2008 Norbert Pchalek 15
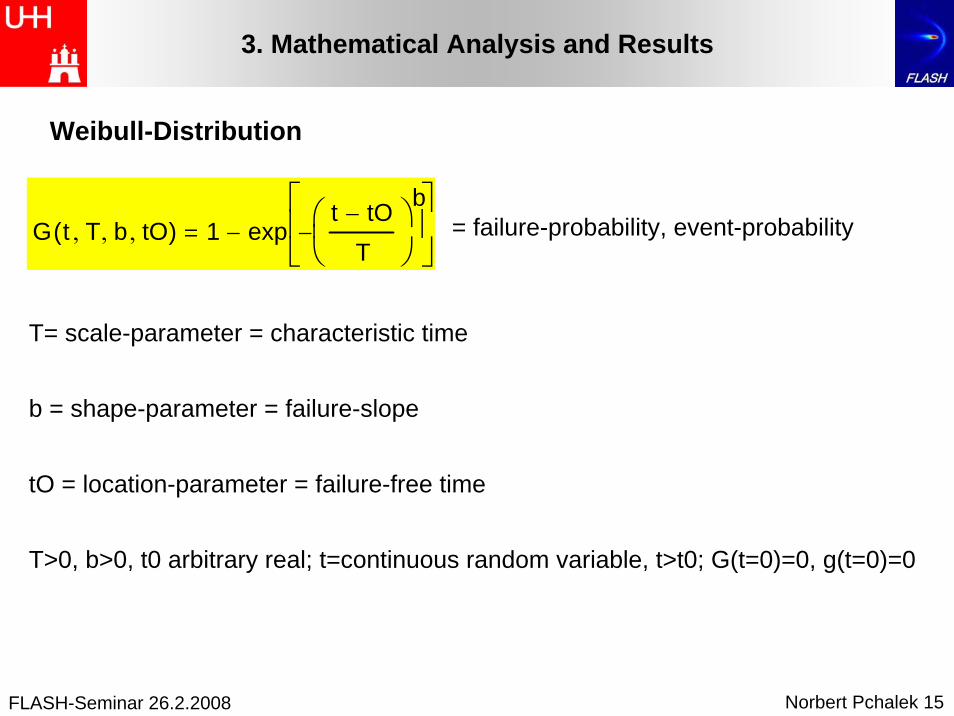
Weibull-Distribution
3. Mathematical Analysis and Results
G t T, b, tO,( ) 1 expt tO−
T⎛⎜⎝
⎞⎟⎠
b−⎡⎢⎣
⎤⎥⎦
− = failure-probability, event-probability
T= scale-parameter = characteristic time
b = shape-parameter = failure-slope
tO = location-parameter = failure-free time
T>0, b>0, t0 arbitrary real; t=continuous random variable, t>t0; G(t=0)=0, g(t=0)=0
FLASH-Seminar 26.2.2008 Norbert Pchalek 16
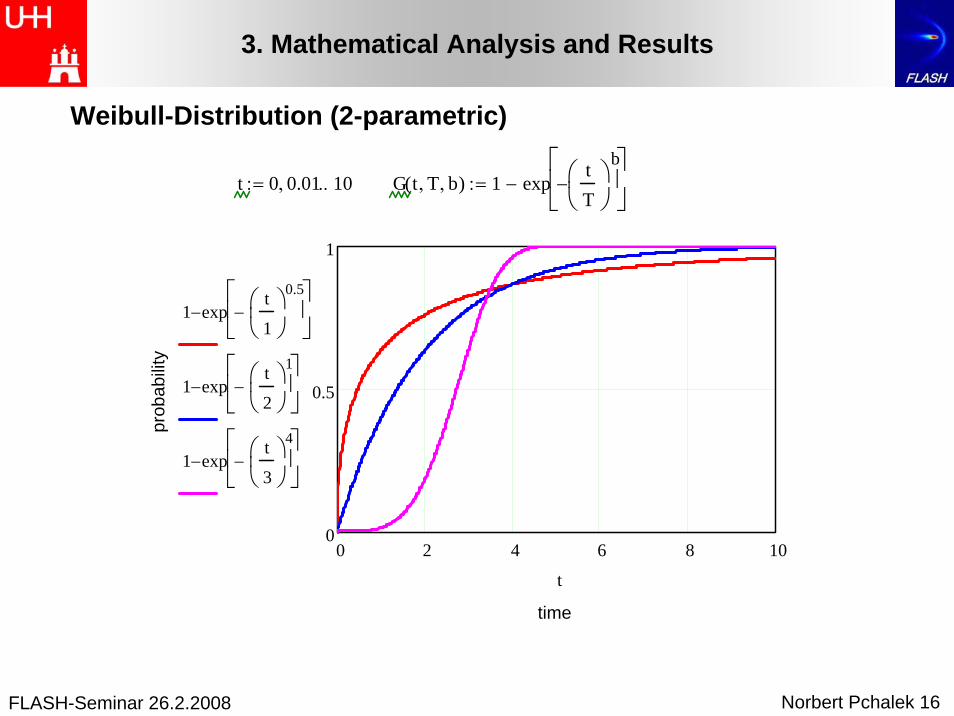
t 0 0.01, 10..:= G t T, b,( ) 1 exptT
⎛⎜⎝
⎞⎟⎠
b−⎡⎢⎣
⎤⎥⎦
−:=
0 2 4 6 8 100
0.5
1
time
prob
abili
ty
1 expt
1⎛⎜⎝
⎞⎟⎠
0.5−⎡⎢⎣
⎤⎥⎦
−
1 expt
2⎛⎜⎝
⎞⎟⎠
1−⎡⎢⎣
⎤⎥⎦
−
1 expt
3⎛⎜⎝
⎞⎟⎠
4−⎡⎢⎣
⎤⎥⎦
−
t
3. Mathematical Analysis and Results
Weibull-Distribution (2-parametric)
FLASH-Seminar 26.2.2008 Norbert Pchalek 17
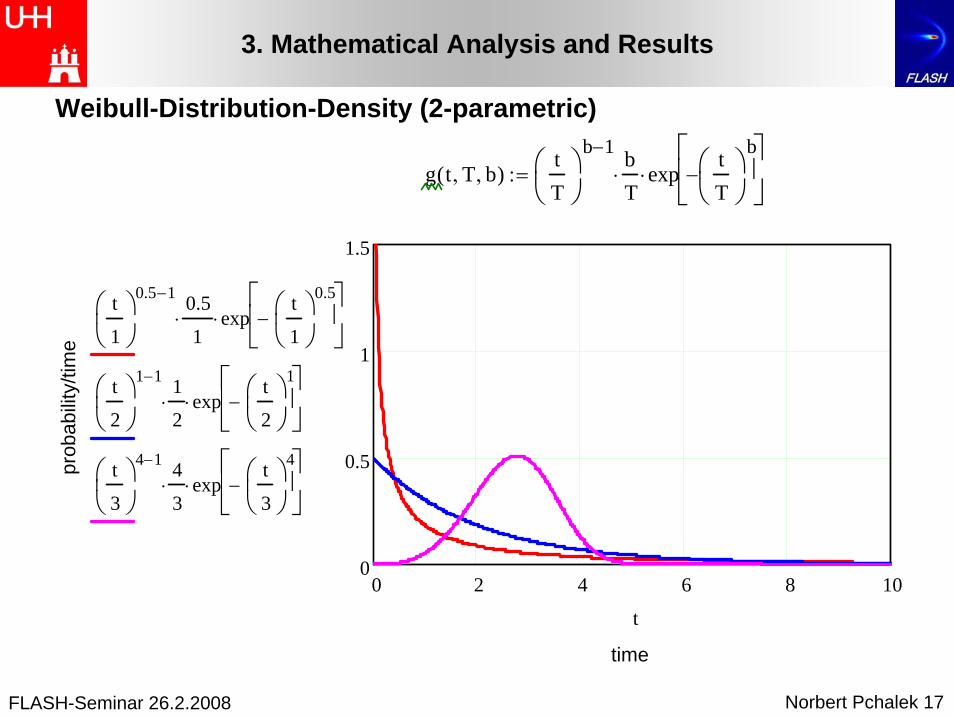
g t T, b,( )tT
⎛⎜⎝
⎞⎟⎠
b 1− bT⋅ exp
tT
⎛⎜⎝
⎞⎟⎠
b−⎡⎢⎣
⎤⎥⎦
⋅:=
0 2 4 6 8 100
0.5
1
1.5
time
prob
abili
ty/ti
me
t
1⎛⎜⎝
⎞⎟⎠
0.5 1− 0.5
1⋅ exp
t
1⎛⎜⎝
⎞⎟⎠
0.5−⎡⎢⎣
⎤⎥⎦
⋅
t
2⎛⎜⎝
⎞⎟⎠
1 1− 1
2⋅ exp
t
2⎛⎜⎝
⎞⎟⎠
1−⎡⎢⎣
⎤⎥⎦
⋅
t
3⎛⎜⎝
⎞⎟⎠
4 1− 4
3⋅ exp
t
3⎛⎜⎝
⎞⎟⎠
4−⎡⎢⎣
⎤⎥⎦
⋅
t
3. Mathematical Analysis and Results
Weibull-Distribution-Density (2-parametric)
FLASH-Seminar 26.2.2008 Norbert Pchalek 18
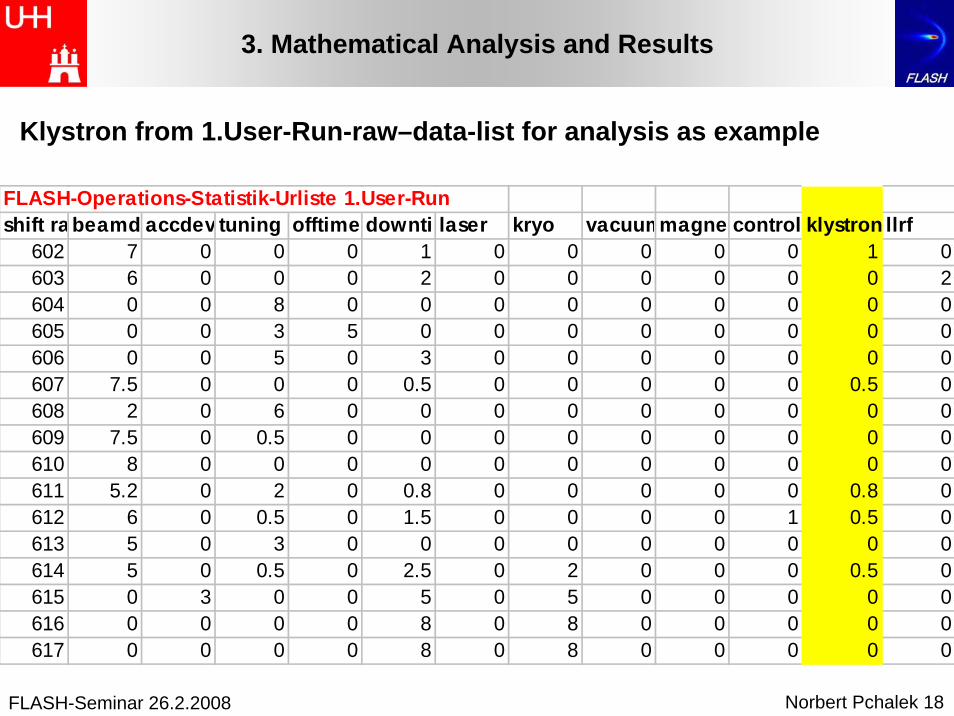
FLASH-Operations-Statistik-Urliste 1.User-Runshift ra beamd accdev tuning offtime downtimlaser kryo vacuummagne control klystron llrf
602 7 0 0 0 1 0 0 0 0 0 1 0603 6 0 0 0 2 0 0 0 0 0 0 2604 0 0 8 0 0 0 0 0 0 0 0 0605 0 0 3 5 0 0 0 0 0 0 0 0606 0 0 5 0 3 0 0 0 0 0 0 0607 7.5 0 0 0 0.5 0 0 0 0 0 0.5 0608 2 0 6 0 0 0 0 0 0 0 0 0609 7.5 0 0.5 0 0 0 0 0 0 0 0 0610 8 0 0 0 0 0 0 0 0 0 0 0611 5.2 0 2 0 0.8 0 0 0 0 0 0.8 0612 6 0 0.5 0 1.5 0 0 0 0 1 0.5 0613 5 0 3 0 0 0 0 0 0 0 0 0614 5 0 0.5 0 2.5 0 2 0 0 0 0.5 0615 0 3 0 0 5 0 5 0 0 0 0 0616 0 0 0 0 8 0 8 0 0 0 0 0617 0 0 0 0 8 0 8 0 0 0 0 0
3. Mathematical Analysis and Results
Klystron from 1.User-Run-raw–data-list for analysis as example
FLASH-Seminar 26.2.2008 Norbert Pchalek 19
3. Mathematical Analysis and Results
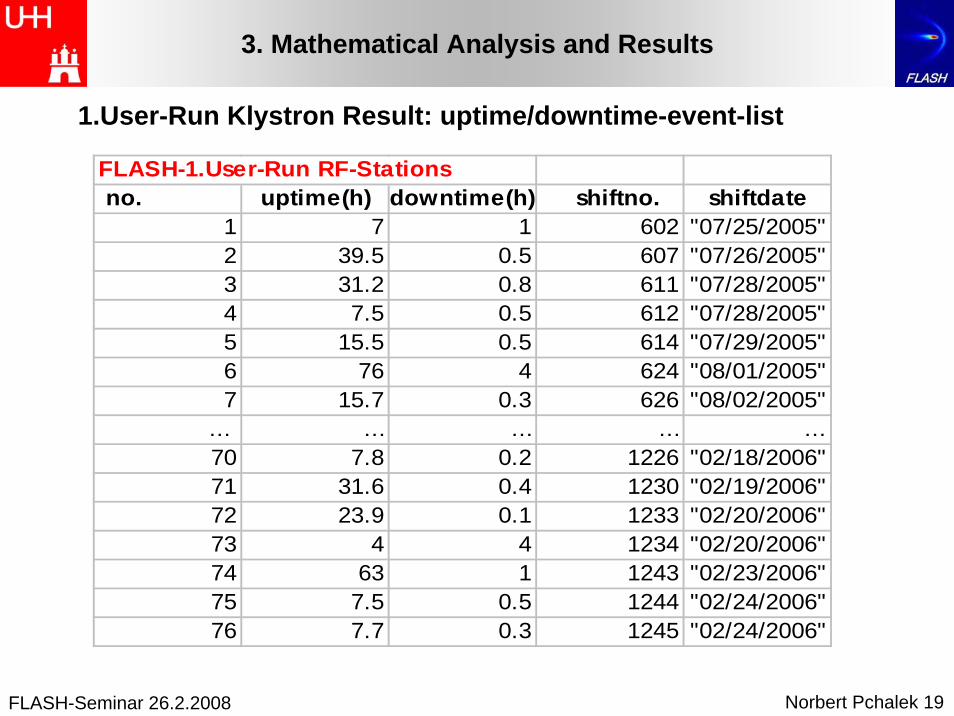
1.User-Run Klystron Result: uptime/downtime-event-list
FLASH-1.User-Run RF-Stations no. uptime(h) downtime(h) shiftno. shiftdate
1 7 1 602 "07/25/2005"2 39.5 0.5 607 "07/26/2005"3 31.2 0.8 611 "07/28/2005"4 7.5 0.5 612 "07/28/2005"5 15.5 0.5 614 "07/29/2005"6 76 4 624 "08/01/2005"7 15.7 0.3 626 "08/02/2005"
... ... ... ... ...70 7.8 0.2 1226 "02/18/2006"71 31.6 0.4 1230 "02/19/2006"72 23.9 0.1 1233 "02/20/2006"73 4 4 1234 "02/20/2006"74 63 1 1243 "02/23/2006"75 7.5 0.5 1244 "02/24/2006"76 7.7 0.3 1245 "02/24/2006"
FLASH-Seminar 26.2.2008 Norbert Pchalek 20
3. Mathematical Analysis and Results
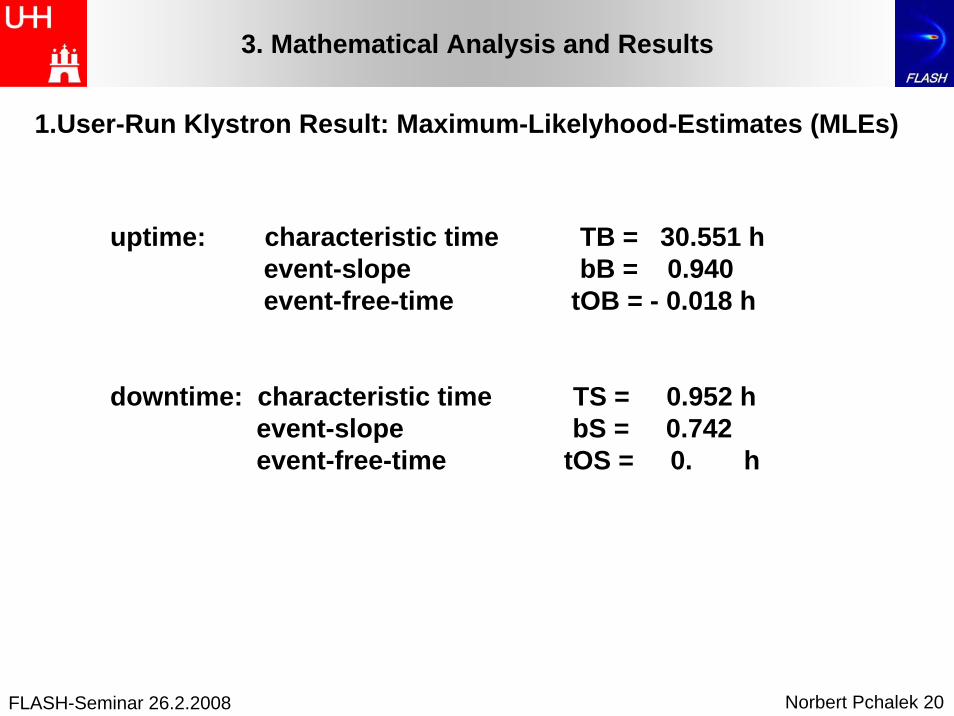
1.User-Run Klystron Result: Maximum-Likelyhood-Estimates (MLEs)
uptime: characteristic time TB = 30.551 h event-slope bB = 0.940 event-free-time tOB = - 0.018 h
downtime: characteristic time TS = 0.952 h event-slope bS = 0.742 event-free-time tOS = 0. h
FLASH-Seminar 26.2.2008 Norbert Pchalek 21
3. Mathematical Analysis and Results
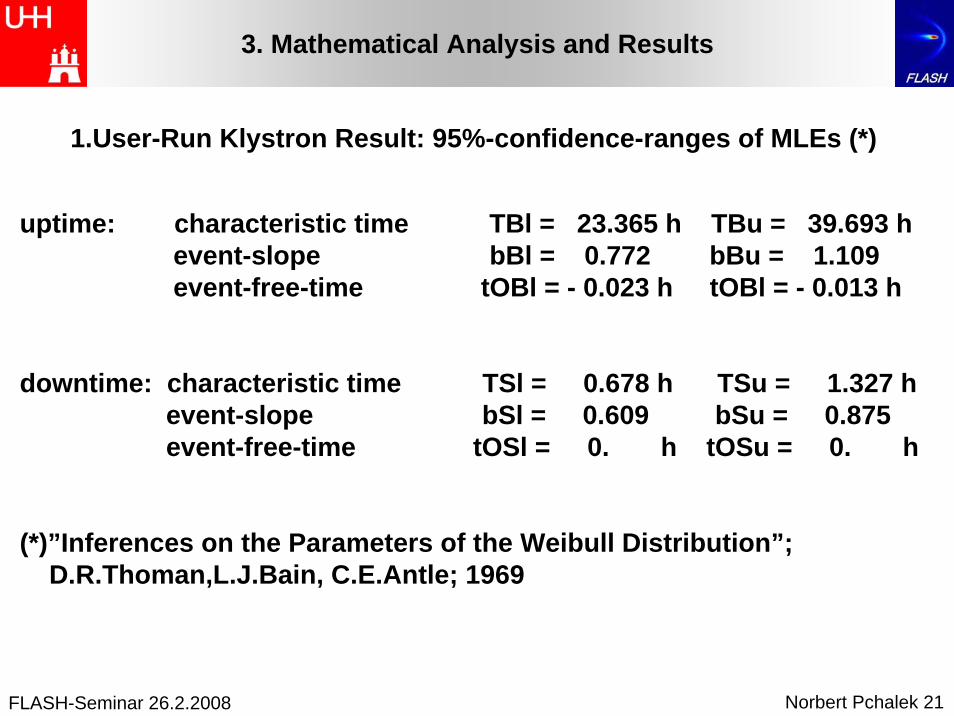
1.User-Run Klystron Result: 95%-confidence-ranges of MLEs (*)
uptime: characteristic time TBl = 23.365 h TBu = 39.693 h event-slope bBl = 0.772 bBu = 1.109 event-free-time tOBl = - 0.023 h tOBl = - 0.013 h
downtime: characteristic time TSl = 0.678 h TSu = 1.327 h event-slope bSl = 0.609 bSu = 0.875 event-free-time tOSl = 0. h tOSu = 0. h
(*)”Inferences on the Parameters of the Weibull Distribution”; D.R.Thoman,L.J.Bain, C.E.Antle; 1969
FLASH-Seminar 26.2.2008 Norbert Pchalek 22
3. Mathematical Analysis and Results
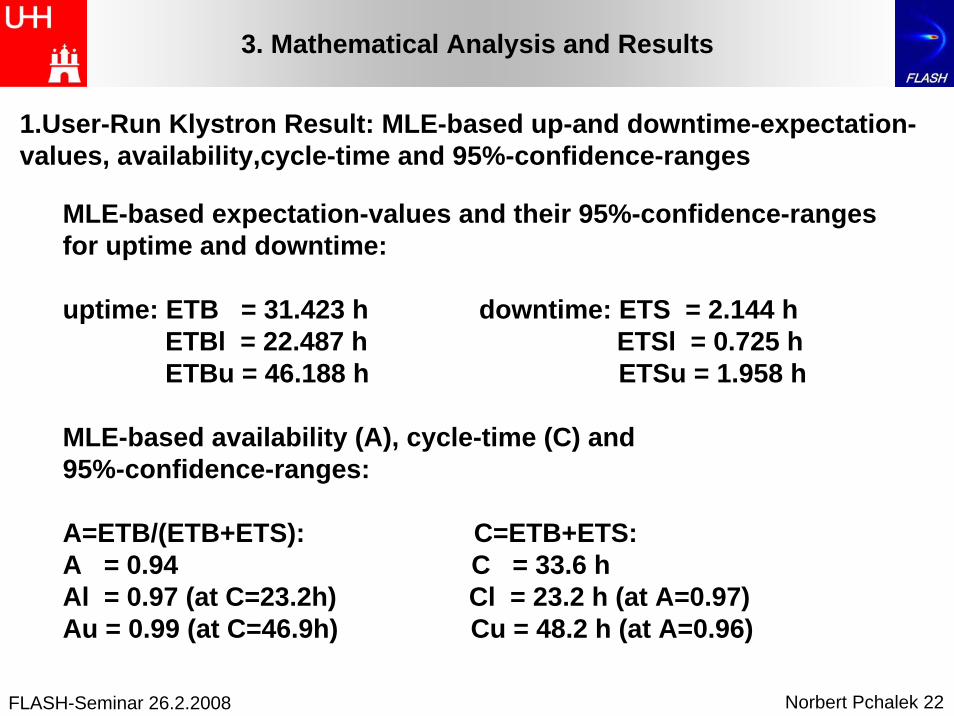
1.User-Run Klystron Result: MLE-based up-and downtime-expectation-values, availability,cycle-time and 95%-confidence-ranges
MLE-based expectation-values and their 95%-confidence-ranges for uptime and downtime:
uptime: ETB = 31.423 h downtime: ETS = 2.144 h ETBl = 22.487 h ETSl = 0.725 h ETBu = 46.188 h ETSu = 1.958 h
MLE-based availability (A), cycle-time (C) and 95%-confidence-ranges:
A=ETB/(ETB+ETS): C=ETB+ETS:A = 0.94 C = 33.6 hAl = 0.97 (at C=23.2h) Cl = 23.2 h (at A=0.97) Au = 0.99 (at C=46.9h) Cu = 48.2 h (at A=0.96)
FLASH-Seminar 26.2.2008 Norbert Pchalek 23
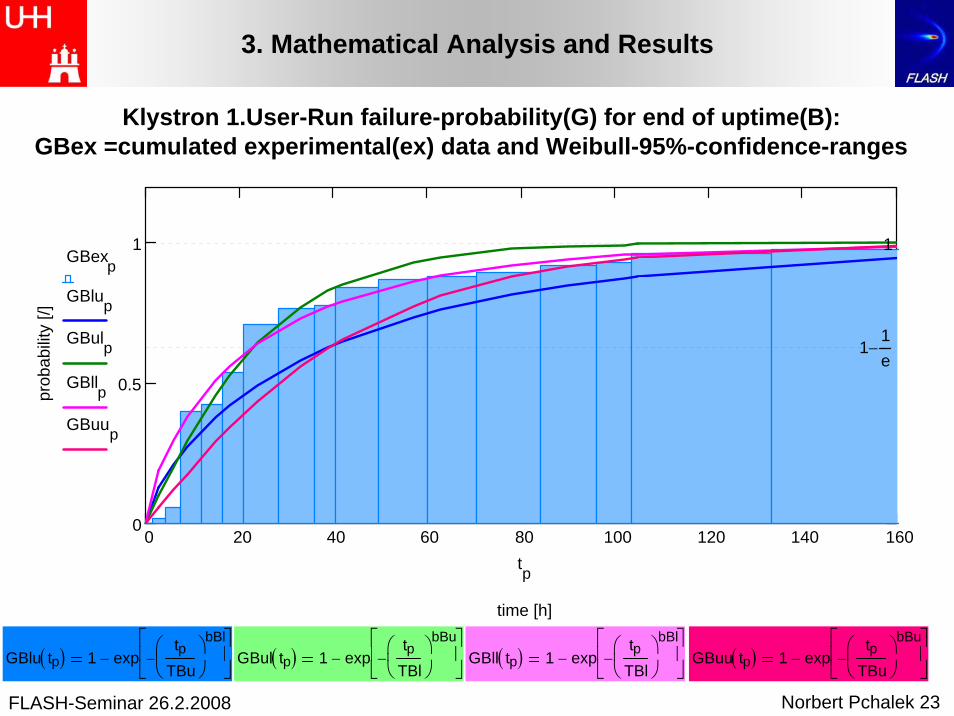
Klystron 1.User-Run failure-probability(G) for end of uptime(B): GBex =cumulated experimental(ex) data and Weibull-95%-confidence-ranges
3. Mathematical Analysis and Results
0 20 40 60 80 100 120 140 1600
0.5
1
time [h]
prob
abili
ty [/
]
11e
−
1GBexp
GBlup
GBulp
GBllp
GBuup
tp
GBlu tp( ) 1 exptp
TBu⎛⎜⎝
⎞⎟⎠
bBl−⎡⎢⎣
⎤⎥⎦
− GBul tp( ) 1 exptp
TBl⎛⎜⎝
⎞⎟⎠
bBu−⎡⎢⎣
⎤⎥⎦
− GBll tp( ) 1 exptp
TBl⎛⎜⎝
⎞⎟⎠
bBl−⎡⎢⎣
⎤⎥⎦
− GBuu tp( ) 1 exptp
TBu⎛⎜⎝
⎞⎟⎠
bBu−⎡⎢⎣
⎤⎥⎦
−
FLASH-Seminar 26.2.2008 Norbert Pchalek 24
3. Mathematical Analysis and Results
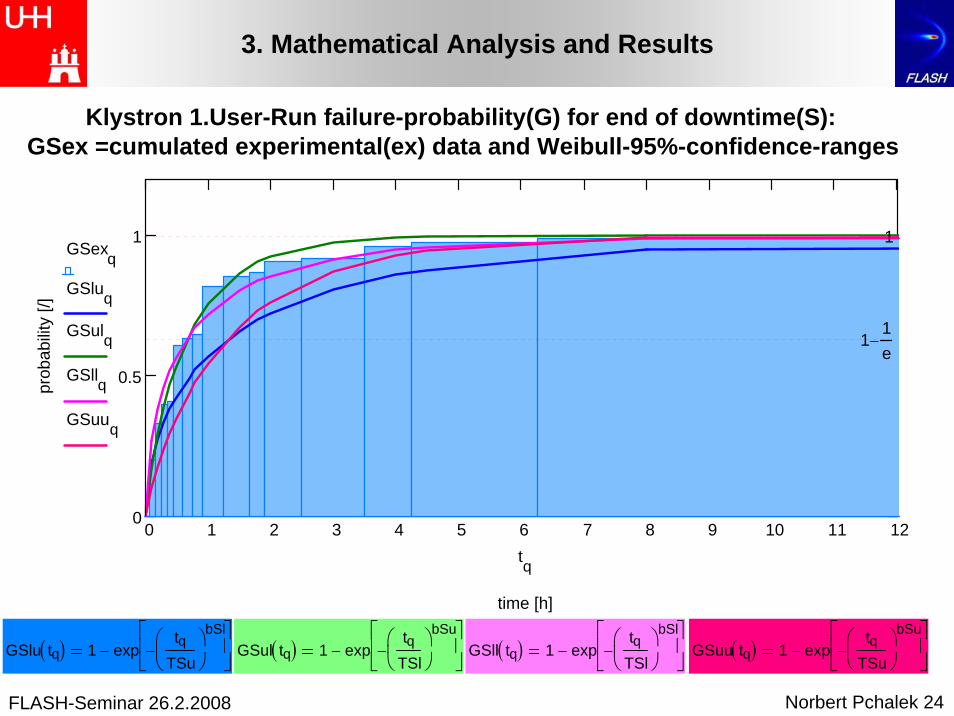
0 1 2 3 4 5 6 7 8 9 10 11 120
0.5
1
time [h]
prob
abili
ty [/
]
11e
−
1GSexq
GSluq
GSulq
GSllq
GSuuq
tq
GSlu tq( ) 1 exptq
TSu⎛⎜⎝
⎞⎟⎠
bSl−⎡⎢⎣
⎤⎥⎦
− GSul tq( ) 1 exptq
TSl⎛⎜⎝
⎞⎟⎠
bSu−⎡⎢⎣
⎤⎥⎦
− GSll tq( ) 1 exptq
TSl⎛⎜⎝
⎞⎟⎠
bSl−⎡⎢⎣
⎤⎥⎦
− GSuu tq( ) 1 exptq
TSu⎛⎜⎝
⎞⎟⎠
bSu−⎡⎢⎣
⎤⎥⎦
−
Klystron 1.User-Run failure-probability(G) for end of downtime(S): GSex =cumulated experimental(ex) data and Weibull-95%-confidence-ranges
FLASH-Seminar 26.2.2008 Norbert Pchalek 25
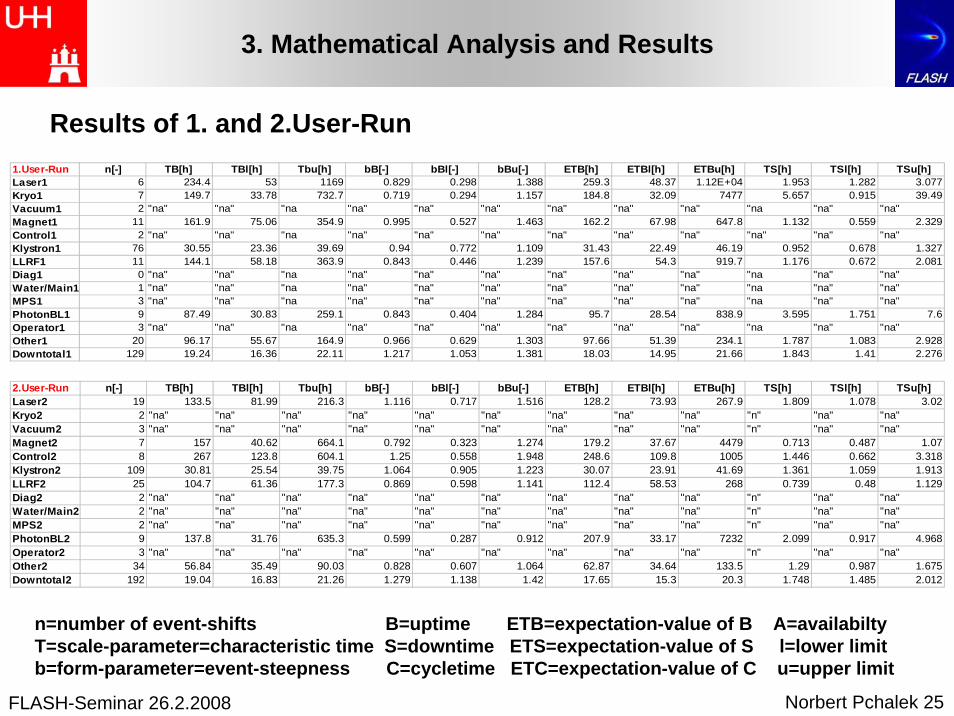
Results of 1. and 2.User-Run
n=number of event-shifts B=uptime ETB=expectation-value of B A=availabiltyT=scale-parameter=characteristic time S=downtime ETS=expectation-value of S l=lower limitb=form-parameter=event-steepness C=cycletime ETC=expectation-value of C u=upper limit
3. Mathematical Analysis and Results
1.User-Run n[-] TB[h] TBl[h] Tbu[h] bB[-] bBl[-] bBu[-] ETB[h] ETBl[h] ETBu[h] TS[h] TSl[h] TSu[h]Laser1 6 234.4 53 1169 0.829 0.298 1.388 259.3 48.37 1.12E+04 1.953 1.282 3.077Kryo1 7 149.7 33.78 732.7 0.719 0.294 1.157 184.8 32.09 7477 5.657 0.915 39.49Vacuum1 2 "na" "na" "na "na" "na" "na" "na" "na" "na" "na "na" "na"Magnet1 11 161.9 75.06 354.9 0.995 0.527 1.463 162.2 67.98 647.8 1.132 0.559 2.329Control1 2 "na" "na" "na "na" "na" "na" "na" "na" "na" "na" "na" "na"Klystron1 76 30.55 23.36 39.69 0.94 0.772 1.109 31.43 22.49 46.19 0.952 0.678 1.327LLRF1 11 144.1 58.18 363.9 0.843 0.446 1.239 157.6 54.3 919.7 1.176 0.672 2.081Diag1 0 "na" "na" "na "na" "na" "na" "na" "na" "na" "na "na" "na"Water/Main1 1 "na" "na" "na "na" "na" "na" "na" "na" "na" "na "na" "na"MPS1 3 "na" "na" "na "na" "na" "na" "na" "na" "na" "na "na" "na"PhotonBL1 9 87.49 30.83 259.1 0.843 0.404 1.284 95.7 28.54 838.9 3.595 1.751 7.6Operator1 3 "na" "na" "na "na" "na" "na" "na" "na" "na" "na "na" "na"Other1 20 96.17 55.67 164.9 0.966 0.629 1.303 97.66 51.39 234.1 1.787 1.083 2.928Downtotal1 129 19.24 16.36 22.11 1.217 1.053 1.381 18.03 14.95 21.66 1.843 1.41 2.276
2.User-Run n[-] TB[h] TBl[h] Tbu[h] bB[-] bBl[-] bBu[-] ETB[h] ETBl[h] ETBu[h] TS[h] TSl[h] TSu[h]Laser2 19 133.5 81.99 216.3 1.116 0.717 1.516 128.2 73.93 267.9 1.809 1.078 3.02Kryo2 2 "na" "na" "na" "na" "na" "na" "na" "na" "na" "n" "na" "na"Vacuum2 3 "na" "na" "na" "na" "na" "na" "na" "na" "na" "n" "na" "na"Magnet2 7 157 40.62 664.1 0.792 0.323 1.274 179.2 37.67 4479 0.713 0.487 1.07Control2 8 267 123.8 604.1 1.25 0.558 1.948 248.6 109.8 1005 1.446 0.662 3.318Klystron2 109 30.81 25.54 39.75 1.064 0.905 1.223 30.07 23.91 41.69 1.361 1.059 1.913LLRF2 25 104.7 61.36 177.3 0.869 0.598 1.141 112.4 58.53 268 0.739 0.48 1.129Diag2 2 "na" "na" "na" "na" "na" "na" "na" "na" "na" "n" "na" "na"Water/Main2 2 "na" "na" "na" "na" "na" "na" "na" "na" "na" "n" "na" "na"MPS2 2 "na" "na" "na" "na" "na" "na" "na" "na" "na" "n" "na" "na"PhotonBL2 9 137.8 31.76 635.3 0.599 0.287 0.912 207.9 33.17 7232 2.099 0.917 4.968Operator2 3 "na" "na" "na" "na" "na" "na" "na" "na" "na" "n" "na" "na"Other2 34 56.84 35.49 90.03 0.828 0.607 1.064 62.87 34.64 133.5 1.29 0.987 1.675Downtotal2 192 19.04 16.83 21.26 1.279 1.138 1.42 17.65 15.3 20.3 1.748 1.485 2.012
FLASH-Seminar 26.2.2008 Norbert Pchalek 26
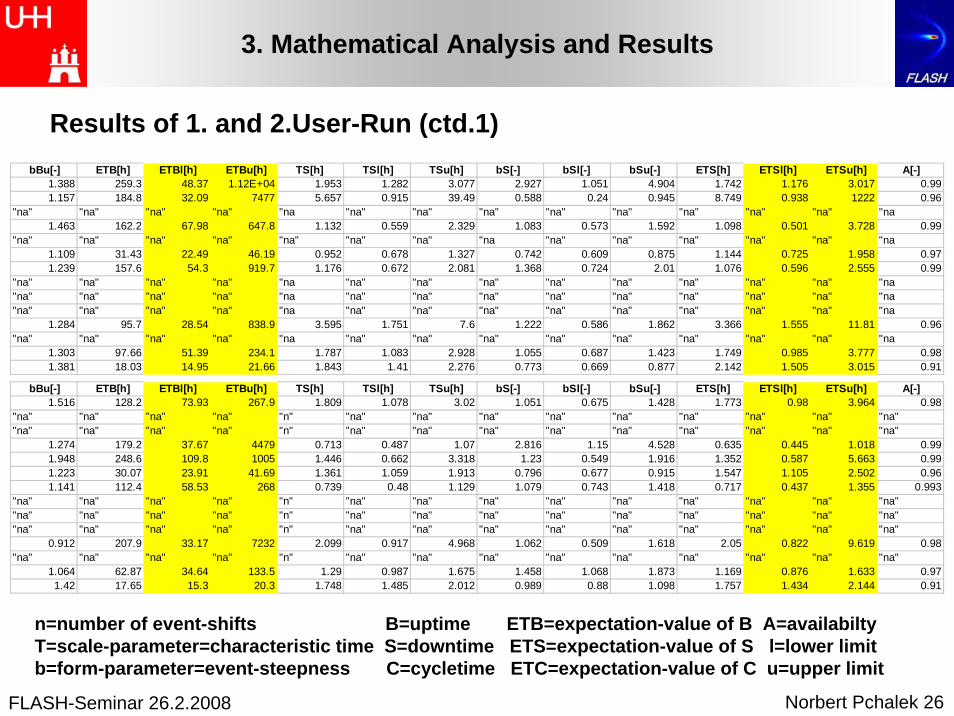
Results of 1. and 2.User-Run (ctd.1)
n=number of event-shifts B=uptime ETB=expectation-value of B A=availabiltyT=scale-parameter=characteristic time S=downtime ETS=expectation-value of S l=lower limitb=form-parameter=event-steepness C=cycletime ETC=expectation-value of C u=upper limit
3. Mathematical Analysis and Results
bBu[-] ETB[h] ETBl[h] ETBu[h] TS[h] TSl[h] TSu[h] bS[-] bSl[-] bSu[-] ETS[h] ETSl[h] ETSu[h] A[-]1.388 259.3 48.37 1.12E+04 1.953 1.282 3.077 2.927 1.051 4.904 1.742 1.176 3.017 0.991.157 184.8 32.09 7477 5.657 0.915 39.49 0.588 0.24 0.945 8.749 0.938 1222 0.96
"na" "na" "na" "na" "na "na" "na" "na" "na" "na" "na" "na" "na" "na1.463 162.2 67.98 647.8 1.132 0.559 2.329 1.083 0.573 1.592 1.098 0.501 3.728 0.99
"na" "na" "na" "na" "na" "na" "na" "na "na" "na" "na" "na" "na" "na1.109 31.43 22.49 46.19 0.952 0.678 1.327 0.742 0.609 0.875 1.144 0.725 1.958 0.971.239 157.6 54.3 919.7 1.176 0.672 2.081 1.368 0.724 2.01 1.076 0.596 2.555 0.99
"na" "na" "na" "na" "na "na" "na" "na" "na" "na" "na" "na" "na" "na"na" "na" "na" "na" "na "na" "na" "na" "na" "na" "na" "na" "na" "na"na" "na" "na" "na" "na "na" "na" "na" "na" "na" "na" "na" "na" "na
1.284 95.7 28.54 838.9 3.595 1.751 7.6 1.222 0.586 1.862 3.366 1.555 11.81 0.96"na" "na" "na" "na" "na "na" "na" "na" "na" "na" "na" "na" "na" "na
1.303 97.66 51.39 234.1 1.787 1.083 2.928 1.055 0.687 1.423 1.749 0.985 3.777 0.981.381 18.03 14.95 21.66 1.843 1.41 2.276 0.773 0.669 0.877 2.142 1.505 3.015 0.91
bBu[-] ETB[h] ETBl[h] ETBu[h] TS[h] TSl[h] TSu[h] bS[-] bSl[-] bSu[-] ETS[h] ETSl[h] ETSu[h] A[-]1.516 128.2 73.93 267.9 1.809 1.078 3.02 1.051 0.675 1.428 1.773 0.98 3.964 0.98
"na" "na" "na" "na" "n" "na" "na" "na" "na" "na" "na" "na" "na" "na" "na" "na" "na" "na" "n" "na" "na" "na" "na" "na" "na" "na" "na" "na"
1.274 179.2 37.67 4479 0.713 0.487 1.07 2.816 1.15 4.528 0.635 0.445 1.018 0.991.948 248.6 109.8 1005 1.446 0.662 3.318 1.23 0.549 1.916 1.352 0.587 5.663 0.991.223 30.07 23.91 41.69 1.361 1.059 1.913 0.796 0.677 0.915 1.547 1.105 2.502 0.961.141 112.4 58.53 268 0.739 0.48 1.129 1.079 0.743 1.418 0.717 0.437 1.355 0.993
"na" "na" "na" "na" "n" "na" "na" "na" "na" "na" "na" "na" "na" "na" "na" "na" "na" "na" "n" "na" "na" "na" "na" "na" "na" "na" "na" "na" "na" "na" "na" "na" "n" "na" "na" "na" "na" "na" "na" "na" "na" "na"
0.912 207.9 33.17 7232 2.099 0.917 4.968 1.062 0.509 1.618 2.05 0.822 9.619 0.98"na" "na" "na" "na" "n" "na" "na" "na" "na" "na" "na" "na" "na" "na"
1.064 62.87 34.64 133.5 1.29 0.987 1.675 1.458 1.068 1.873 1.169 0.876 1.633 0.971.42 17.65 15.3 20.3 1.748 1.485 2.012 0.989 0.88 1.098 1.757 1.434 2.144 0.91
FLASH-Seminar 26.2.2008 Norbert Pchalek 27
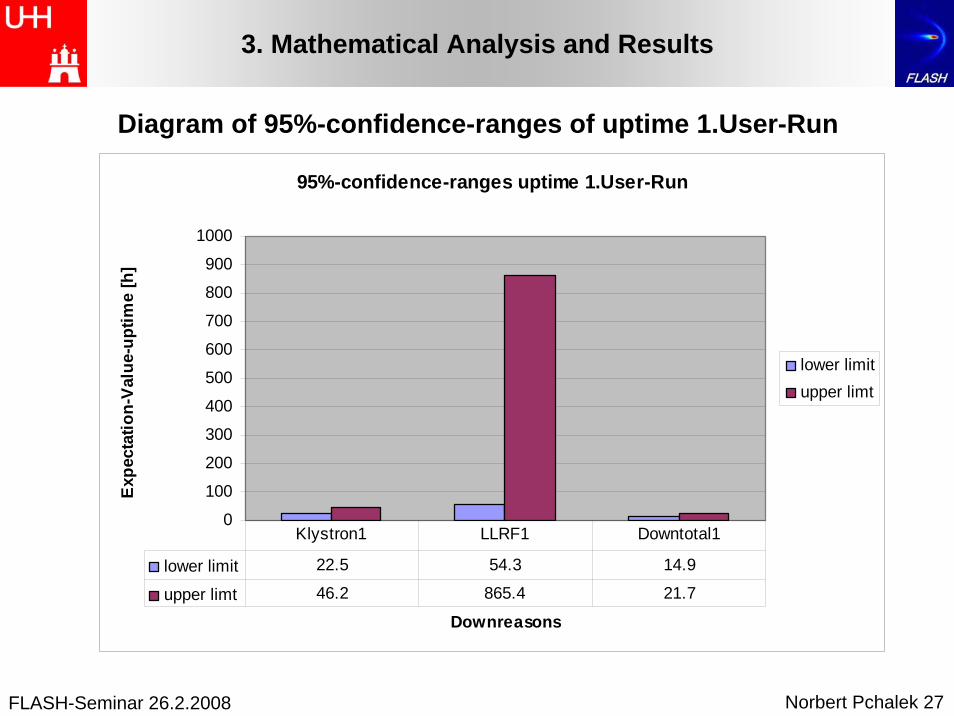
3. Mathematical Analysis and Results
Diagram of 95%-confidence-ranges of uptime 1.User-Run
95%-confidence-ranges uptime 1.User-Run
0
100
200
300
400
500
600
700
800
900
1000
Downreasons
Exp
ecta
tion-
Val
ue-u
ptim
e [h
]
lower limitupper limt
lower limit 22.5 54.3 14.9
upper limt 46.2 865.4 21.7
Klystron1 LLRF1 Downtotal1
FLASH-Seminar 26.2.2008 Norbert Pchalek 28
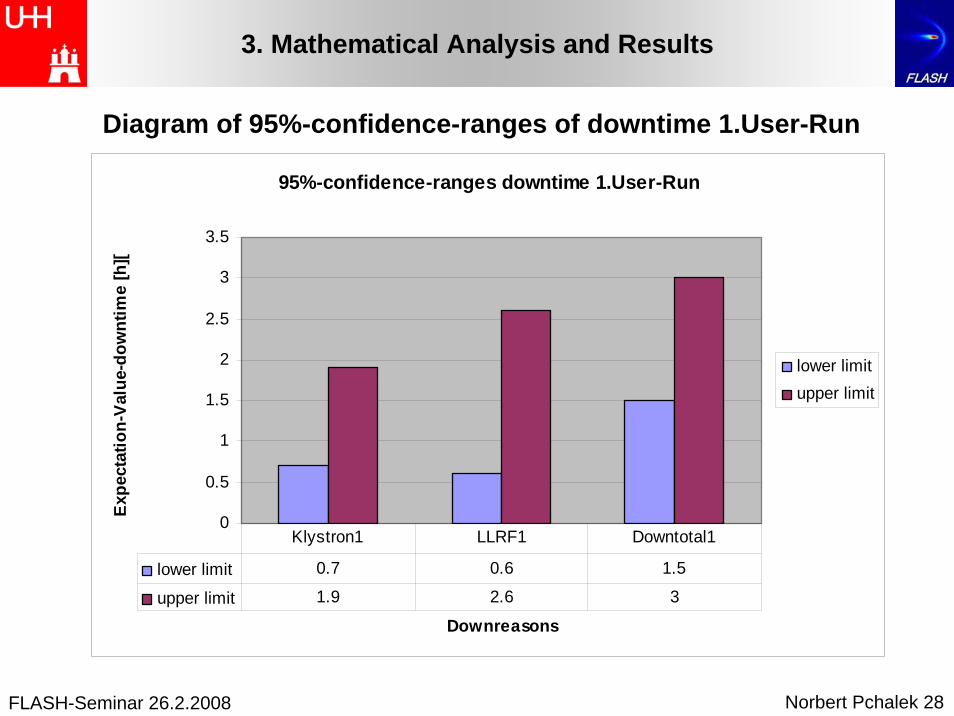
3. Mathematical Analysis and Results
Diagram of 95%-confidence-ranges of downtime 1.User-Run
95%-confidence-ranges downtime 1.User-Run
0
0.5
1
1.5
2
2.5
3
3.5
Downreasons
Expe
ctat
ion-
Val
ue-d
ownt
ime
[h][
lower limitupper limit
lower limit 0.7 0.6 1.5
upper limit 1.9 2.6 3
Klystron1 LLRF1 Downtotal1
FLASH-Seminar 26.2.2008 Norbert Pchalek 29
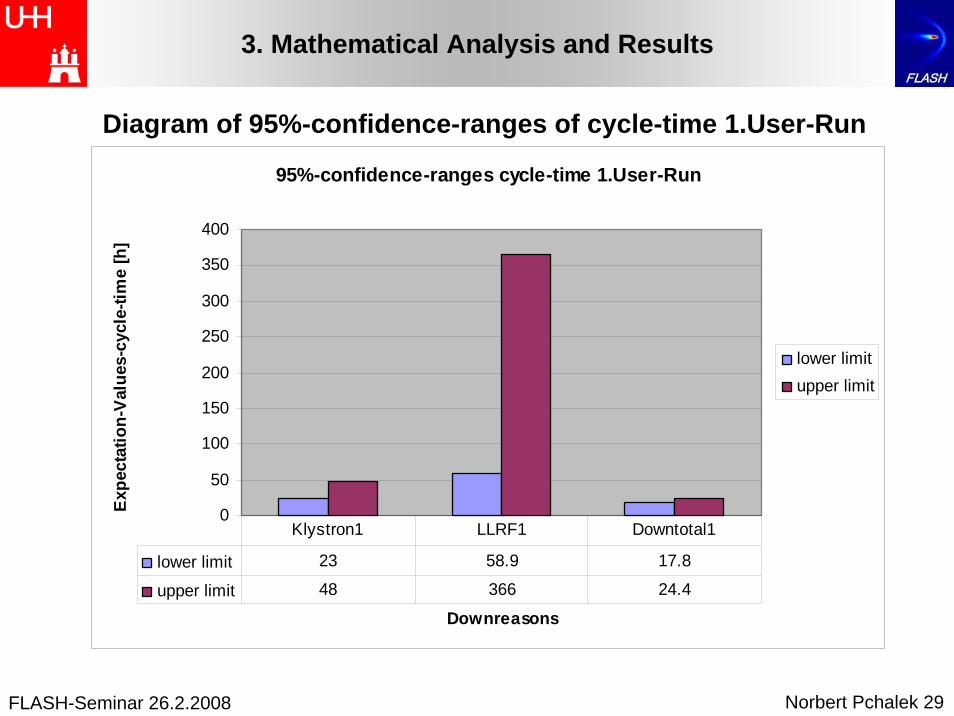
3. Mathematical Analysis and Results
Diagram of 95%-confidence-ranges of cycle-time 1.User-Run
95%-confidence-ranges cycle-time 1.User-Run
0
50
100
150
200
250
300
350
400
Downreasons
Expe
ctat
ion-
Valu
es-c
ycle
-tim
e [h
]
lower limitupper limit
lower limit 23 58.9 17.8
upper limit 48 366 24.4
Klystron1 LLRF1 Downtotal1
FLASH-Seminar 26.2.2008 Norbert Pchalek 30
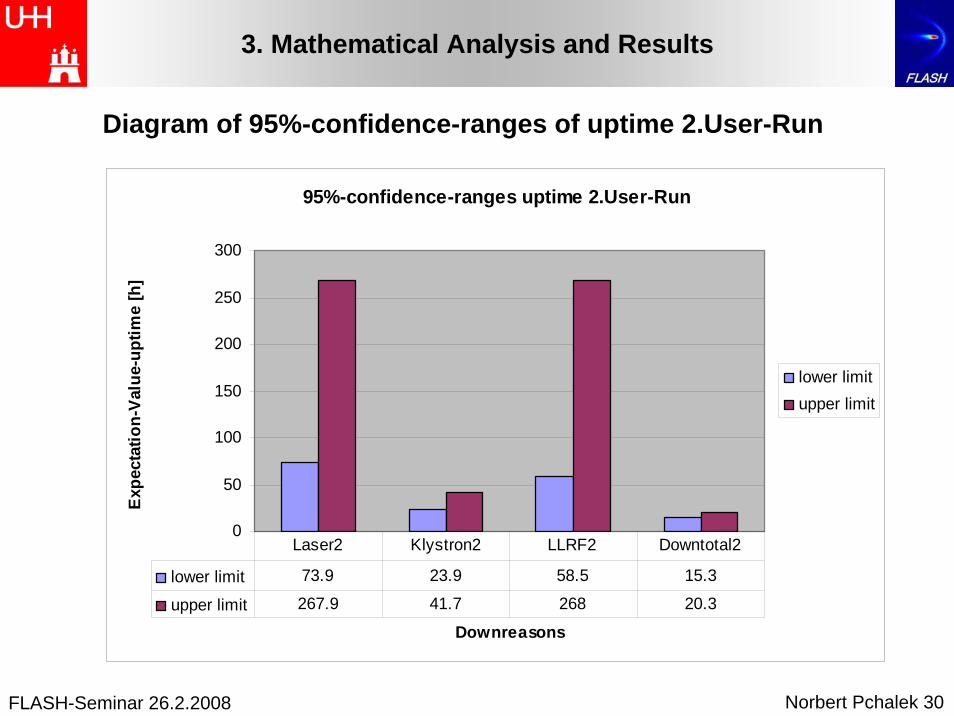
3. Mathematical Analysis and Results
Diagram of 95%-confidence-ranges of uptime 2.User-Run
95%-confidence-ranges uptime 2.User-Run
0
50
100
150
200
250
300
Downreasons
Exp
ecta
tion-
Valu
e-up
time
[h]
lower limitupper limit
lower limit 73.9 23.9 58.5 15.3
upper limit 267.9 41.7 268 20.3
Laser2 Klystron2 LLRF2 Downtotal2
FLASH-Seminar 26.2.2008 Norbert Pchalek 31
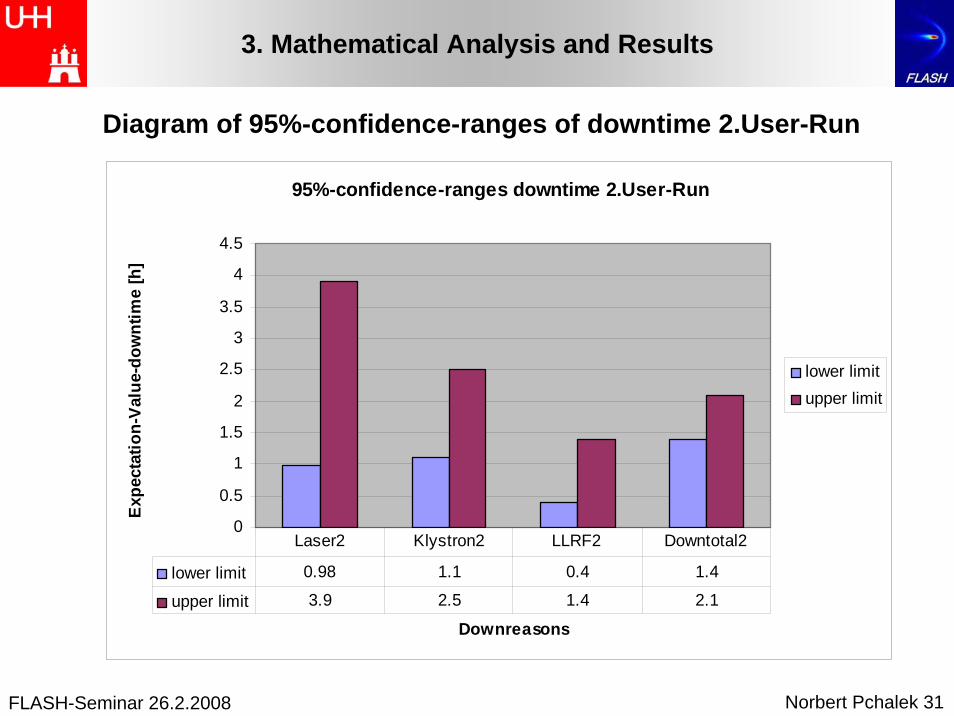
3. Mathematical Analysis and Results
Diagram of 95%-confidence-ranges of downtime 2.User-Run
95%-confidence-ranges downtime 2.User-Run
0
0.5
1
1.5
2
2.5
3
3.5
4
4.5
Downreasons
Exp
ecta
tion-
Val
ue-d
ownt
ime
[h]
lower limitupper limit
lower limit 0.98 1.1 0.4 1.4
upper limit 3.9 2.5 1.4 2.1
Laser2 Klystron2 LLRF2 Downtotal2
FLASH-Seminar 26.2.2008 Norbert Pchalek 32
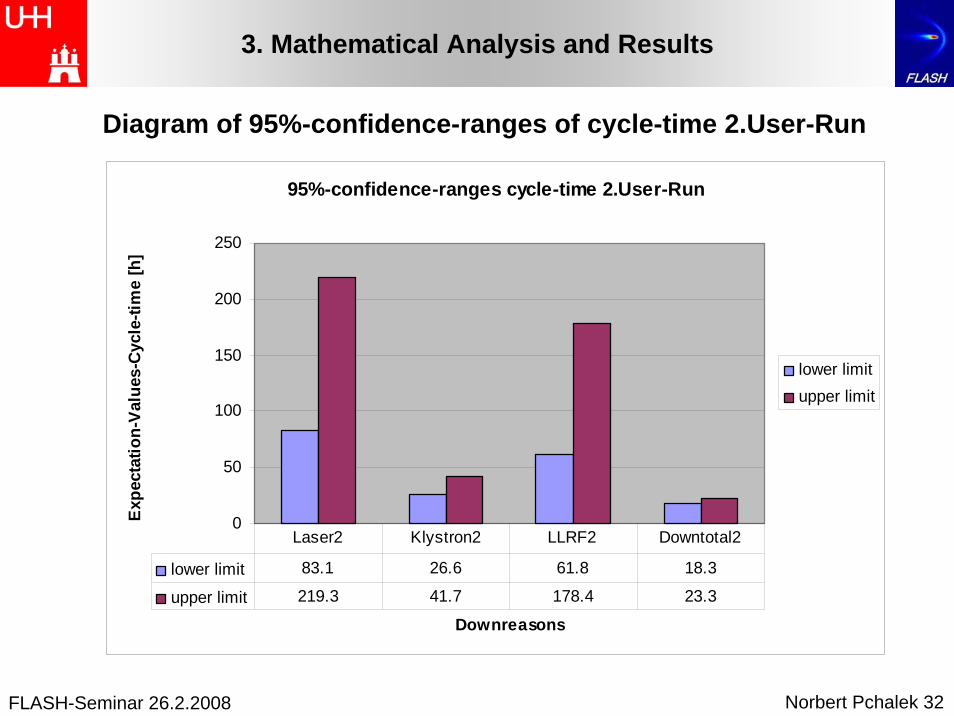
3. Mathematical Analysis and Results
Diagram of 95%-confidence-ranges of cycle-time 2.User-Run
95%-confidence-ranges cycle-time 2.User-Run
0
50
100
150
200
250
Downreasons
Exp
ecta
tion-
Valu
es-C
ycle
-tim
e [h
]
lower limitupper limit
lower limit 83.1 26.6 61.8 18.3
upper limit 219.3 41.7 178.4 23.3
Laser2 Klystron2 LLRF2 Downtotal2
FLASH-Seminar 26.2.2008 Norbert Pchalek 33
4. Conclusion and Outlook
- Weibull-Statistic-Analysis appears adaquate for FLASH-reliabilityavailability
- Confidence-ranges for expectation-values are determinedfor all FLASH-downreasons with regard to their
uptime downtime cycletime
- FLASH-state-of-the-art is described by these results
- Data-collection to be adapted due to FLASH-findings and experience
- Application of FLASH-results for projection towards XFEL and ILC need further studies