Embed Size (px)
Citation preview

Statistical Analysis and Optimization of Ammonia Nitrogen Removal from
Aqueous Solutions and Landfill Leachate by Ultrasound Irradiation
By
Andrew Tobalt
A thesis submitted under the supervision of
Dr. Kevin Kennedy and Dr. Majid Sartaj
A thesis submitted in partial fulfillment of the requirements for the degree of
Master of Applied Science
In
Environmental Engineering
Department of Civil Engineering
University of Ottawa
Ottawa-Carleton Institute for Environmental Engineering
Ottawa, Ontario, Canada
August, 2017
© Andrew Tobalt, Ottawa, Canada, 2017

ii
ABSTRACT
The application of Ultrasound (US) irradiation to remove ammonia nitrogen from
aqueous solutions, including synthetic solution and landfill leachate, at 20 kHz was
investigated in this thesis. Batch experiments were carried out using two synthetic
solutions with initial ammonia concentrations of 3000 and 5000 mg TAN/L in
addition to two leachates from new and old landfills. The results of testing showed
that US irradiation is an effective treatment technology for the removal of aqueous
ammonia. More specifically, it was found that increasing sonication time and pH
increased ammonia removal. The maximum observed removal of ammonia was 87.4%
at a pH of 11 and sonication time of 25 minutes. Also, it was found that volatilization of
ammonia to the atmosphere accounted for 0-7% of removal, the thermal effect of US
accounted for 21.1-52.7%, and the non-thermal effect of US accounted for 44.5-78.8%
(depending on pH and sonication time). Results of factorial design and response
surface methodology showed that pH, energy output (kJ), and the interaction between
the two were significant parameters. The predicted two factor interaction (2FI) model
was in close agreement to the observed data (R2 = 0.94) and produced an optimum
ammonia removal of 87% at a pH of 10.9 and energy output of 94.8 kJ. Analysis of
variance tests showed that there were no significant differences in the percent
removal of ammonia due to the non-thermal effects of US across all four solutions
(synthetic and leachate) indicating that US irradiation is a non-selective treatment
method for ammonia removal.

iii
ACKNOWLEDGEMENTS
Firstly, I would like to thank my supervisors, Dr. Kennedy and Dr. Sartaj, without
whom I would never have had the opportunity to complete this Thesis. I would like to
thank Dr. Kennedy for his encouragement in my final year of undergraduate studies to
continue my education and for the funding he graciously offered. I would like to thank
Dr. Sartaj for his tireless encouragement, patience, and guidance throughout this
thesis process; there is no doubt in my mind that I would not be in the position I am
today without his efforts. Thank you.
Secondly, I gratefully acknowledge the financial support from the University of
Ottawa, Dr. Kennedy, and Dr. Sartaj. These research grants and teaching assistant
positions allowed me to have fiscally worry-free graduate studies.
Finally, I would like to thank my family and friends for their love and support. Above
and beyond, I would like to thank my wife, Dan-Tam, who would always listen to my
academic ramblings regardless of her own interest in them – your love, patience, and
support during my (long) Master of Applied Science journey is greatly appreciated.

iv
Table of Contents
ABSTRACT ---------------------------------------------------------------------------------------- iii
ACKNOWLEDGEMENTS ----------------------------------------------------------------------- iiii
List of Figures ------------------------------------------------------------------------------------vii
List of Tables ------------------------------------------------------------------------------------- ixx
List of Abbreviations ---------------------------------------------------------------------------- xii
CHAPTER I - Introduction ---------------------------------------------------------------------- 1
1.1 General ------------------------------------------------------------------------------------- 1
1.2 Research Objective and Scope -------------------------------------------------------- 3
1.3 Thesis Structure ------------------------------------------------------------------------- 3
References ---------------------------------------------------------------------------------------- 5
CHAPTER II - Literature Review --------------------------------------------------------------- 6
2.1 Ammonia ---------------------------------------------------------------------------------- 6
2.2 Issues of the excess ammonia --------------------------------------------------------- 8
2.3 Ammonia toxicity ------------------------------------------------------------------------ 8
2.4 Ammonia inhibition --------------------------------------------------------------------- 9
2.5 Ammonia concentrations ------------------------------------------------------------ 11
2.6 Treatments for high concentration ammonia removal ------------------------ 13
2.6.1 Biological treatment ---------------------------------------------------------- 14
2.6.2 Chemical precipitation ------------------------------------------------------- 17
2.6.3 Sorption ------------------------------------------------------------------------- 18
2.6.3.1 Adsorption ----------------------------------------------------------------- 18
2.6.3.2 Ion-exchange --------------------------------------------------------------- 19
2.6.4 Air stripping -------------------------------------------------------------------- 21
2.6.5 Membrane filtration ---------------------------------------------------------- 23
2.6.6 Microwave ---------------------------------------------------------------------- 24
2.6.7 Ultrasound ---------------------------------------------------------------------- 26
2.7 Summary and Research Gap -------------------------------------------------------- 32
References -------------------------------------------------------------------------------------- 33
CHAPTER III - Materials & Methodology -------------------------------------------------- 45
3.1 Experimental Materials -------------------------------------------------------------- 45

v
3.2 Experimental Setup ------------------------------------------------------------------- 46
3.3 Experimental Procedure ------------------------------------------------------------- 47
3.3.1 pH Adjustment ----------------------------------------------------------------- 47
3.3.2 Ammonia Concentration Testing ------------------------------------------- 48
3.3.3 Synthetic Solution Tests ------------------------------------------------------ 49
3.3.3.1 Test Design ----------------------------------------------------------------- 50
3.3.3.2 Ammonia Solution Fabrication----------------------------------------- 51
3.3.3.3 Ultrasonic Testing -------------------------------------------------------- 52
3.3.3.4 Heat Volatilization Testing ---------------------------------------------- 52
3.3.3.5 Atmospheric Volatilization Testing ----------------------------------- 53
3.3.4 Leachate Tests ------------------------------------------------------------------ 54
3.3.4.1 Test Design ----------------------------------------------------------------- 54
3.3.4.2 Ultrasonic Testing -------------------------------------------------------- 55
3.3.4.3 Heat Volatilization Testing ---------------------------------------------- 55
3.3.4.4 Atmospheric Volatilization Testing ----------------------------------- 55
References -------------------------------------------------------------------------------------- 56
CHAPTER IV - Technical Paper I ------------------------------------------------------------- 57
Abstract ------------------------------------------------------------------------------------------ 57
4.1 Introduction ---------------------------------------------------------------------------- 59
4.2 Materials and Methods --------------------------------------------------------------- 65
4.3 Results and Discussion --------------------------------------------------------------- 68
4.4 Conclusions ----------------------------------------------------------------------------- 76
Acknowledgements --------------------------------------------------------------------------- 76
References -------------------------------------------------------------------------------------- 77
CHAPTER V - Technical Paper II ------------------------------------------------------------- 81
Abstract ------------------------------------------------------------------------------------------ 81
5.1 Introduction ---------------------------------------------------------------------------- 83
5.2 Materials and Methods --------------------------------------------------------------- 89
5.2.1 Materials and Equipment ---------------------------------------------------- 89
5.2.2 Analytical Method ------------------------------------------------------------- 90
5.2.3 Experimental Design ---------------------------------------------------------- 91
5.2.4 Statistical method and data analysis -------------------------------------- 92
5.3 Results and Discussion --------------------------------------------------------------- 94
vi
5.3.1 Statistical Analysis and Modelling ----------------------------------------- 94
5.3.2 Response Surface Methodology -------------------------------------------- 98
5.4 Conclusion ----------------------------------------------------------------------------- 104
Acknowledgements -------------------------------------------------------------------------- 105
References ------------------------------------------------------------------------------------- 106
CHAPTER VI - Additional Tests ------------------------------------------------------------- 109
6.1 Introduction --------------------------------------------------------------------------- 109
6.2 Results and Discussion -------------------------------------------------------------- 109
6.3 Conclusions ---------------------------------------------------------------------------- 117
References ------------------------------------------------------------------------------------- 118
CHAPTER VII - Conclusions and Recommendations ----------------------------------- 119
7.1 Conclusions ---------------------------------------------------------------------------- 119
7.2 Future Work --------------------------------------------------------------------------- 120

vii
List of Figures
Figure 2.1 Free ammonia and ammonium percentages present in solution at 20, 35 and 55 °C and varying pH (Fernandes et al., 2012) ....................................................................... 7
Figure 2.2 Liquid jet (a) on a surface (b) close to a surface (Mason & Tiehm, 2001) .... 27
Figure 2.3 the three reaction zones of the cavitation process (Adewuyi, 2001) ............. 28
Figure 2.4 Schematic of the ultrasound set-up (Wang et al., 2008) ....................................... 31
Figure 3.1 [left] Schematic of experimental setup. (1) NH3 solution or leachate (2) disruptor horn and tip (3) ultrasonic converter (4) protective case (5) adjustable stand (6) 500 ml PP container. [right] photograph of experimental setup ....................... 47
Figure 3.2 TNTplus 832 testing method (Hach Company, 2012) .......................................... 49
Figure 4.1 Experimental Flow-chart.................................................................................................. 67
Figure 4.2 [left] Schematic of experimental setup. (1) NH3 solution (2) disruptor horn and tip (3) ultrasonic converter (4) case (5) stand. [right] Photograph of experimental setup ............................................................................................................................................................... 68
Figure 4.3 Average TAN removal by ultrasound using 100% output power at different pH and durations ...................................................................................................................................... 70
Figure 4.4 Average TAN removal by non-thermal (US), thermal (WB), volatilization (Volat.) at 5 min (top), 15 min (middle) and 25 min (bottom) ............................................... 74
Figure 4.5 Percentage of TAN removal by non-thermal (US), thermal (WB), and volatilization (Volat.) at different pH and time duration .......................................................... 75
Figure 5.1 Experimental flow chart ................................................................................................... 92
Figure 5.2 Correlation of predicted and actual values with respect to ammonia nitrogen removal for the linear model ............................................................................................. 99
Figure 5.3 External residuals versus predicted values diagnostic plot for ammonia nitrogen removal for the linear model .......................................................................................... 100
Figure 5.4 External residuals versus runs diagnostic plot for ammonia nitrogen removal for the linear model ............................................................................................................. 101
Figure 5.5 Normal probability plot of external residuals for ammonia nitrogen removal for the linear model............................................................................................................................... 102
viii
Figure 5.6 Two-dimensional surface contour plot of ammonia removal efficiency by RSM for the linear model .................................................................................................................... 103
Figure 5.7 Three-dimensional surface contour plot of ammonia removal efficiency by RSM for the linear model .................................................................................................................... 104
Figure 6.1 TOTAL, non-thermal (US), thermal (WB), and volatilization to air (Volat.) TAN removals for 4 high concentration ammonia solutions at a pH of 10, duration of 25 mins, and power output level of 100% ................................................................................... 111

ix
List of Tables
Table 2.1 Ammonia concentrations in landfill sites (Adapted from Renou et al., 2008) .......................................................................................................................................................................... 12
Table 2.2 Air Stripping Process Efficiency Comparison ............................................................. 22
Table 3.1 3000 mg TAN/L synthetic solution experimental test design ............................. 50
Table 3.2 5000 mg TAN/L synthetic solution experimental test design ............................. 51
Table 3.3 3000 mg TAN/L synthetic ammonia solution hot water bath temperature settings .......................................................................................................................................................... 53
Table 3.4 5000 mg TAN/L synthetic ammonia solution hot water bath temperature settings .......................................................................................................................................................... 53
Table 3.5 Leachate Experimental Factorial Design @ pH 10 ................................................... 54
Table 3.6 Leachates 1 & 2 hot water bath temperature settings ........................................... 55
Table 4.1 Ammonia concentrations in landfill sites .................................................................... 61
Table 4.2 Two-way ANOVA for TAN removal ................................................................................ 71
Table 4.3 t-test for TAN removal for paired combination of pH and US duration time 72
Table 5.1 Experimental design for the removal of ammonia nitrogen from a synthetic solution using US ....................................................................................................................................... 91
Table 5.2 Experimental design and coded levels of independent variables used in RSM .......................................................................................................................................................................... 93
Table 5.3 ANOVA for (a) quadratic and (b) linear (2FI) response surfaces....................... 97
Table 6.1 Characteristics of leachates used to assess ammonia nitrogen removal by ultrasound irradiation. ........................................................................................................................ 110
Table 6.2 One-way ANOVA tests comparing total TAN removal efficiencies of (a) 3000 and 5000 mg TAN/L synthetic solutions, (b) leachates 1 and 2, and (c) all 4 solutions ....................................................................................................................................................................... 113
Table 6.3 One-way ANOVA tests with regards to TAN removal efficiencies between all 4 solutions from the effects of (a) non-thermal effects of US, and (b) thermal effects of US ................................................................................................................................................................. 114

x
Table 6.4 One-way ANOVA tests comparing TAN removal efficiencies due to the thermal effects of US for (a) 3000 and 5000 mg TAN/L synthetic solutions, (b) leachates 1 and 2 .................................................................................................................................... 115

xi
List of Abbreviations
AD: anaerobic digestion;
Anammox: anaerobic ammonia oxidation;
ANOVA: analysis of variance
AOX: adsorbable organic halogens;
AS: activated sludge;
BOD: biochemical oxygen demand;
COD: chemical oxygen demand;
DF: degree of freedom;
DW: distilled water
IER: ion-exchange resin;
MAP: magnesium ammonium phosphate;
MF: microfiltration;
MLSS: mixed liquor suspended solids;
MS: mean square
NF: nanofiltration;
NMDA: N-methyl-D-aspartate;
PAC: powdered activated carbon;
PAH: polyarmatic hydrocarbons;
PCB: polychlorinated biphenyls
RO: reverse osmosis;
RSM: response surface methodology;

xii
SBR: sequencing batch reactor;
TAN: total ammonia nitrogen;
TKN: total Kjeldahl nitrogen;
TSS: total suspended solids;
UASB: up-flow anaerobic sludge blanket;
VOC: volatile organic compound;
VSS: volatile suspended solid;
WWTP: wastewater treatment plant.
1
1 CHAPTER I Introduction
1.1 General
Landfills, for most of post-industrial history, have been the environmental and
economic choice for the disposal of solid wastes. Landfill leachate is an inevitable by-
product of solid waste disposal generated by water percolating through decomposing
waste, extracting both biological and chemical dissolved or suspended materials. The
end product of leachate is an extremely toxic, and variable, aqueous mix of organics,
heavy metals, chlorides, and NH3/NH4 (Zhang et al., 2009). Ontario government
regulation 232/98, section 12 states, “a person shall not establish a new landfilling site
or increase the total waste disposal volume of an existing landfilling site unless a
written report containing plans, specifications and descriptions for the management
and disposal of any leachate collected at the site has been prepared”. Leachate may be
discharged into a sewage collection system which is then treated at a wastewater
treatment facility or treated on-site and discharged into a surface water body;
however, leachate may need to be pre-treated before discharge (Government of
Ontario, 2012).
Landfill leachate can contain anywhere from a few hundred to upwards of 13000 mg
N-NH3/L, depending on the source and age of the waste (Dong & Sartaj, 2016). In
addition to its deleterious effects on water bodies – dissolved ammonia is on the
Canadian EPA (1999) toxic substance list - ammonia has also been reported to inhibit

2
anaerobic bacterial activity in doses as low as 1500 N-NH3/L (Ding & Sartaj, 2015).
This loss in bacterial activity leads to lower biogas yields from the wastewater
treatment plant’s anaerobic digesters or bioreactor landfills, which equates to a loss of
energy and/or revenue or increased maintenance and monitoring costs. Methods of
NH3/NH4 removal from contaminated water and leachate include biological
denitrification, air-stripping, chemical precipitation, electrochemical conversion, and
microwave radiation (Lin et al., 2009). In the last 15 years, ultrasound technology has
been explored as an alternative NH3/NH4 removal technique due to the need for
environmentally-clean technology that yields minimal waste (Matouq & Al-Anber,
2006).
Ultrasound (US) technology involves the use of higher frequency (above 16 kHz)
sound waves to disrupt matter. Sonication, in an aqueous solution, generates
cavitation bubbles, inside of which are extremely high temperatures and pressures,
which rapidly form and collapse. Sonochemical transformation is due to pyrolytic
decomposition inside the cavitation bubbles or reduction and oxidation by H+ and OH-
radicals (Adewuyi, 2001). Wang et al. (2008) performed laboratory tests on leachate
with high NH3 concentrations in order to find the mechanism of NH3 removal by
ultrasound irradiation. It was found that the removal of NH3 by ultrasound is almost
entirely by pyrolysis within the cavitation bubbles and produces predominantly N2
and H2 gas with trace amounts of NO2 and NO3 gas being produced (perhaps by
oxidation).
3
1.2 Research Objective and Scope
The main objective of this thesis was to investigate the feasibility and efficiency of
NH3/NH4 removal using US irradiation at anaerobically inhibitory concentrations of
N-NH3, measured in landfill leachates. Furthermore, both synthetic and actual
leachates were used in testing under similar conditions to provide comparisons in
NH3/NH4 ultrasonic removal between ideal and working conditions. In addition, a
statistical analysis using a full factorial design was done in order to mathematically
classify the relevance of the independent variables (pH, power input, and sonication
time) with respect to ammonia removal. Furthermore, the contribution of thermal and
non-thermal effects of US irradiation and volatilization of ammonia to the atmosphere,
were explored. Finally, an assessment of the selectivity and implementation of
ultrasound technology used for the removal of NH3/NH4 from landfill leachate will be
made.
1.3 Thesis Structure
This thesis will consist of five main sections:
Chapter 1: Introduces the thesis and the research objective and scope.
Chapter 2: Presents a literature review on the thesis subject matter, including a
review of landfill leachate, ammonia chemistry, known ammonia removal
techniques, ultrasonic chemistry and physics, and ammonia removal by
ultrasound.

4
Chapter 3: Presents the materials and methodology used to perform the tests
and analysis of data.
Chapters 4 & 5: Presents the findings comprising two papers, authored by the
candidate (both submitted for publication). The research was designed to study
the feasibility, efficiency, and mechanisms of NH3/NH4 removal using
ultrasound irradiation.
Chapter 6: Presents the findings of all additional testing that was not discussed
in the previous chapters.
Chapter 7: Summary of concluding remarks and recommendations for future
work.
5
References
Adewuyi, Y.G. (2001). Sonochemistry: Environmental Science and Engineering Applications. Industrial & Engineering Chemistry Research, 40, 4681-4715.
Canadian Environmental Protection Act. 1999. Schedule 1, Item 53, pp. 219. Ding, Y. and Sartaj, M. (2015). Statistical analysis and optimization of ammonia removal
from aqueous solution by zeolite using factorial design and response surface methodology. Journal of Environmental Chemical Engineering, 3, 807-814.
Dong, S. and Sartaj, M. (2016). Statistical analysis of thermal and non-thermal effects of
sequential microwave/aeration process for the removal of ammonia from aqueous solution. Desalination and Water Treatment, 57, 20005-20015.
Government of Ontario (1998). Ontario Regulation 232/98: Landfilling Sites. Queen’s
Printer for Ontario. Government of Ontario (2012). Landfill Standards: A Guideline on the Regulatory and
Approval Requirements for New or Expanding Landfilling Sites. Queen’s Printer for Ontario.
Lin, L., Yuan, S., Chen, J., Xu, Z., and Lu, X. (2009). Removal of ammonia nitrogen in
wastewater by microwave radiation. Journal of Hazardous Materials. 161, 1063-1068.
Matouq, M.A.D. and Al-Anber, Z.A. (2006). The application of high frequency ultrasound
waves to remove ammonia from simulated industrial wastewater. Ultrasonics Sonochemistry, 14, 393-397.
Wang, S., Wu, X., Wang, Y., Li, Q., and Tao, M. (2008). Removal of organic matter and
ammonia nitrogen from landfill leachate by ultrasound. Ultrasonics Sonochemistry, 15, 933-937.
Zhang, T., Ding, L., and Ren, H. (2009). Pretreatment of ammonium removal from
landfill leachate by chemical precipitation. Journal of Hazardous Materials, 166, 911-915.

6
2 CHAPTER II Literature Review
2.1 Ammonia
Ammonia (NH3) is classified as a Brønsted and Lewis base due to its capacity to accept
a hydrogen ion (H+) and donate a pair of electrons. More specifically, NH3 is a weak
electrolyte/base owed to the fact that only a small percentage of dissolved NH3 reacts
with water (H2O) to form ammonium (NH4+) and hydroxide ion (OH-); this reaction is
shown by Equation 2.1 (Chang & Cruickshank, 2005).
NH3(aq) + H2O(l) NH4+(aq) + OH-(aq) (2.1)
NH3 is a volatile compound with a boiling point of -33.4C and, like other volatile
compounds, is sensitive to pressure and temperature changes (Chang & Cruickshank,
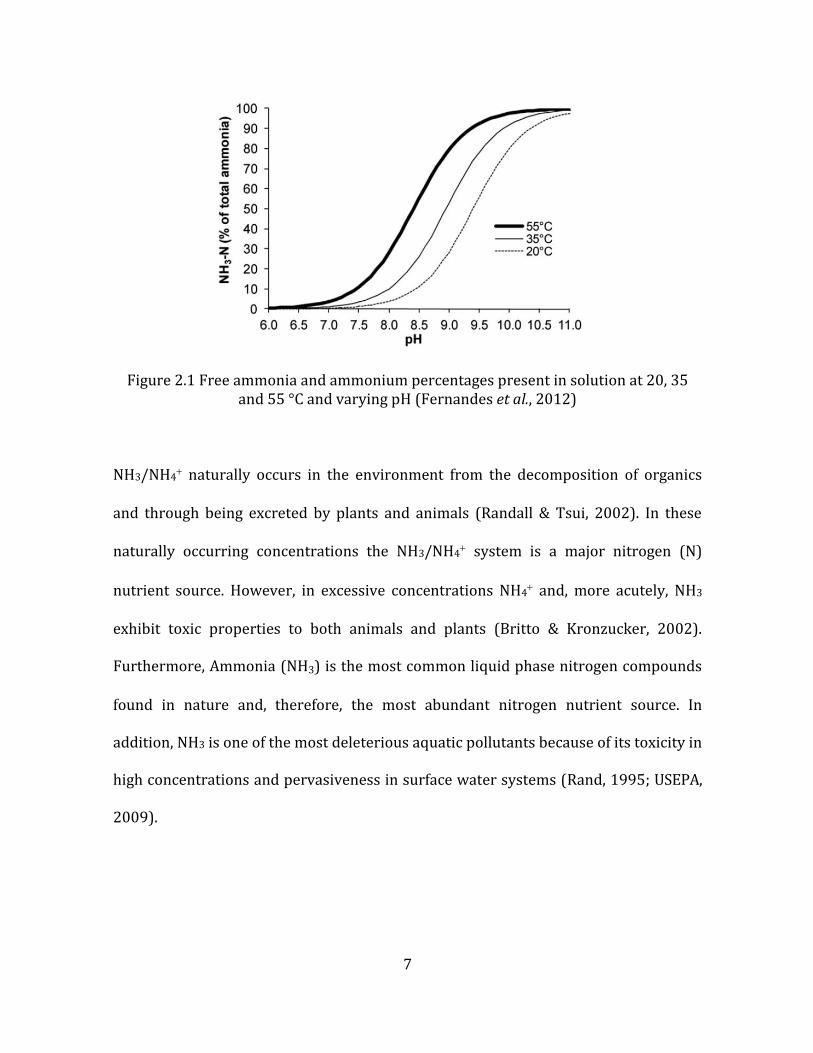
2005). Equation 2.1 also shows the sensitivity of the NH3/NH4 equilibrium to pH; the
higher the pH of a solution, or more basic, the higher the concentration ratio of NH3
versus NH4. The pKa of NH4
is 9.25 at standard conditions, this translates into a pH
of 9.25 being the condition where NH3 and NH4+ exist in equal molar concentrations in
an aqueous solution (Benjamin, 2002); Figure 2.1 illustrates this relationship.
7
Figure 2.1 Free ammonia and ammonium percentages present in solution at 20, 35 and 55 °C and varying pH (Fernandes et al., 2012)
NH3/NH4 naturally occurs in the environment from the decomposition of organics
and through being excreted by plants and animals (Randall & Tsui, 2002). In these
naturally occurring concentrations the NH3/NH4 system is a major nitrogen (N)
nutrient source. However, in excessive concentrations NH4 and, more acutely, NH3
exhibit toxic properties to both animals and plants (Britto & Kronzucker, 2002).
Furthermore, Ammonia (NH3) is the most common liquid phase nitrogen compounds
found in nature and, therefore, the most abundant nitrogen nutrient source. In
addition, NH3 is one of the most deleterious aquatic pollutants because of its toxicity in
high concentrations and pervasiveness in surface water systems (Rand, 1995; USEPA,
2009).
8
2.2 Issues of the excess ammonia
Unfortunately, human industrial activities, including the synthesis of NH3 for cleaning
products and fertilizer as well as biological waste treatment that produces NH3, have
introduced high concentrations of ammonia into the environment. The main concern
is NH3 in aquatic systems, as terrestrial ammonia is quickly volatilized and almost all
atmospheric ammonia rapidly rises and is destroyed by photolytic reactions (Randall
& Tsui, 2002). An excess of ammonia in a body of water can present the following
negative impacts: toxicity towards aquatic systems (fauna and flora), an increase in
the abundancy of phytoplankton, and increase the oxygen demand in a receiving body
of water (Beutel, 2006). Reducing the introduction of excess ammonia into all aquatic
ecosystems is vital to both reduce eutrophication (the proliferation of algal blooms
resulting in dead zones) and protect our drinking water sources (Conley et al., 2009).
2.3 Ammonia toxicity
Free ammonia (NH3) can traverse most biological membranes while ionized ammonia
(NH4+) cannot; this is the reason NH3 is much more toxic than NH4+. Furthermore, as
temperature and pH increase so does the percentage of N-NH3 versus N-NH4+ in liquid
phase; this in turn increases the toxic effects of ammonia on organisms (Randall &
Tsui, 2002). In aquatic chemistry, it is common to express the sum of the N-NH3 and N-
NH4+ as ammonia or total ammonia nitrogen (TAN) (Ding & Sartaj, 2016). Both
freshwater and seawater aquatic species are intolerant to ammonia to a similar
degree. Freshwater species have a tolerance limit of 2.79 mg TAN/L while seawater

9
species possess a tolerance limit of 1.86 mg-TAN/L (USEPA, 2009).
While the amounts of ammonia tolerance differ, the nature of ammonia toxicity is
similar in fish and mammals (Shingles et al., 2001). High levels of ammonia in the body
can produce many harmful effects mainly on the central nervous system of
vertebrates, acute ammonia intoxication, and convulsion (Ip & Chew, 2010; Rao et al.,
1992). Some studies have indicated that the presence of high ammonia levels in the
brain may cause higher levels of extracellular glutamate through stimulating
glutamate release while lowering glutamate synaptic reuptake (Randall & Tsui, 2002).
Also, it is known that ammonium ion displaces potassium and depolarizes neurons
which, in excess, cause abnormally high activation of N-methyl-D-aspartate (NMDA)
type glutamate receptors; this leads to cell death in the central nervous system due to
the influx of excess calcium (Ip & Chew, 2001).
Due to an increase in knowledge and concern, the Canadian Environmental protection
agency (CEPA) added ammonia to the toxic substance list in 1999 (Environment
Canada, 2001). Furthermore, in 2012, the federal government regulated the maximum
allowable effluent concentration of ammonia, from a WWTP with an average daily
discharge greater than 100 m3, to 1.25 mg N-NH3/L at 15°C (Canada Gazette, 2012).
2.4 Ammonia inhibition
Compounding the aforementioned toxic effects is the fact that ammonia has the
10
potential to inhibit anaerobic digestion (AD), activated sludge (AS), and other
biological treatment processes (Yenigün & Demirel, 2013). Ammonia has been
reported to inhibit AD and AS processes at concentrations from 1500 to 3000 mg
TAN/L which renders traditional biological treatment methods far less efficient and
useful (Liu et al., 2012). Specifically, ammonia inhibition affects microbial activity in
bioreactors which are often evaluated by looking at dehydrogenase activity, methane
production rate, and volatile suspended solid (VSS) concentration (Krylova et al.,
1997).
Li and Zhao (1999) found that progressively increasing ammonia concentrations from
50 to 800 mg NH4+-N/L caused chemical oxygen demand (COD) removal in landfill
leachate to decline from 95.1 to 79.1% along with a decrease in the dehydrogenase
activity of the sludge from 11.04 to 4.22 μg TF/mg MLSS. Also, Lee et al. (2000) found
that when ammonia concentrations rose above 5000 mg TAN/L dehydrogenase
microbial activity decreased more than 70% for both heterotrophs and nitrifiers.
Furthermore, Lee et al. (2000) reported that nitrifying bacteria are more sensitive to
high ammonia concentrations than heterotrophic bacteria.
Akindele and Sartaj (2017) examined the effect of high concentrations of TAN on the
process of anaerobic digestion of the organic fraction of municipal solid wastes. A first
study was done using two shock loads of TAN and a second study examined the
possibility of acclimatizing mesophilic bacteria to high ammonia concentrations by
gradually increasing TAN loading over time. Both studies were done at varying pH and

11
showed a reduction in cumulative biogas production from 32%-87% in reactors
containing 7500 and 10000 mg TAN/L at pH of 7.5, 8, and 8.5. However, cumulative
biogas production for a gradual increase in TAN loading vs shock loading were
consistently higher.
Bioreactor landfill AD is similarly influenced by increased ammonia levels as leachate
recirculation causes ammonia accumulation from the ammonification process of
biodegradation (Yenigün et al., 2013). Because landfill leachate is so diverse and
complex in composition, high concentrations of ammonia in recirculated leachate can
inhibit anaerobic bacterial activity in doses as low as 1100 mg NH3-N/L at a pH of 8
(Hansen et al., 1998).
2.5 Ammonia concentrations
Landfill leachate can contain a wide range of ammonia concentrations because of the
variability in landfilled waste, landfill age, and climate (precipitation and evaporation).
Landfill leachate has been reported to contain from 0.2 to 13000 mg NH3-N/L (Renou
et al., 2008). Table 2.1 summarizes the range of TAN concentration from different
landfill sites. As previously stated in section 2.4, ammonia is mainly produced from the
ammonification process during the biodegradation of solid waste. The only removal
path for ammonia in a landfill is leaching, which produces leachate, as there is no
mechanism for its degradation under methanogenic conditions (Burton & Watson-
Craik, 1998). A German study was conducted using 50 landfills; the results show no

12
significant decrease of ammonia concentrations up to 30 years after a landfill’s closure
(Ehrig, 1989). With this in mind, coupled with potentially high concentrations, it
should be no surprise that ammonia is considered to be the most significant long-term
pollutant found in landfill leachate (Belevi & Baccini, 1989; Robinson et al., 1995).
Table 2.1 Ammonia concentrations in landfill sites (Adapted from Renou et al., 2008)
Age Landfill Site TAN (mg/L) Reference
Y Canada 42 (Henry et al., 1987)
Y China, Hong Kong 2260 (Lau et al., 2001)
Y 3000 (Lo, 1996)
Y China, Mainland 630-1800 (Wang & Shen, 2000)
Y Greece 3100 (Tatsi et al., 2003)
Y Italy 3917 (Di Palma et al., 2002)
Y 5210 (Lopez et al., 2004)
Y South Korea 1682 (Im et al., 2001)
Y Turkey 1120-2500 (Timur & Özturk, 1999)
Y 2020 (Ozturk et al., 2003)
Y 1946-2002 (Çeçen & Aktaş, 2004)
MA Germany 884 (Baumgarten & Seyfried, 1996)
MA 800 (van Dijk & Roncken, 1997)
MA Greece 940 (Tatsi et al., 2003)
MA Italy 1330 (Frascari et al., 2004)
MA Poland 743 (Bohdziewicz et al., 2001)
MA Taiwan 5500 (Wu et al., 2004)
MA Turkey 1270 (Kargi & Pamukoglu, 2003a)
O Brazil 800 (Silva et al., 2004)
O Finland 159 (Hoilijoki et al., 2000)
O 330-560 (Marttinen et al., 2002)
O France 430 (Trebouet et al., 1999)
O 0.2 (Tabet et al., 2002)
O 295 (Gourdon et al., 1989)
O South Korea 1522 (Cho et al., 2002)
O Turkey 1590 (Uygur & Kargi, 2004)
Y: young MA: mature O: old
13
2.6 Treatments for high concentration ammonia removal
Landfill leachate’s high concentration mixture of toxins and contaminants necessitates
treatment before it can be discharged into sewer or surface water systems.
Regrettably, a universal treatment solution covering all of the toxins and contaminants
found in leachate has not yet been found. At present, a combination of different
techniques must be used to mediate all of the potentially ill effects associated with
landfill leachate (Wiszniowski et al., 2006).
High concentration ammonia removal from an aqueous solution can be classified into
four main groups (Renou et al., 2008):
1) liquid transfer: mix contaminated sewage with municipal sewage to treat at a
WWTP
2) biological treatments: aerobic and anaerobic processes
3) chemical methods: chemical precipitation, sorption (adsorption and ion-
exchange), and ultrasound*
4) Physical methods: air stripping, microwave, and ultrasound*
*ultrasound has both chemical (oxidation) and physical (pyrolysis) removal pathways but for the purpose of
this thesis will be presented under physical methods.
14
Historically, the preferred method has been to mix landfill leachate with municipal
sewage and treat them together at a WWTP. This preference can be attributed to
either a low ammonia concentration in the landfill leachate or a bias towards lowering
operating and maintenance costs (Ahn et al., 2002). Diamadopoulos et al. (1997)
found the optimal ratio of leachate to total wastewater to be 1 to 9. This ratio was
found using a sequencing batch reactor (SBR) which has filling, anoxic, aerobic, and
settling phases. The results indicated a maximum of 95% BOD and 50% ammonia
removal. A different study performed by Çeçen and Aktaş (2001) found that COD and
ammonia removal decreased with an increase of the leachate to sewage ratio. Liquid
transfer suffers from a lack of pre-treatment and thus does not mitigate the ill-effects
of heavy metals and high ammonia concentrations. This leads to the inhibition of
microorganisms critical to a properly functioning WWTP (Çeçen & Aktaş, 2004).
2.6.1 Biological treatment
Biological treatments (aerobic or anaerobic) are broadly used when leachate contains
ammonia concentrations in low to mid ranges. Biological treatments are favourable,
with the right toxin levels, because of its comparatively simple operation and high
cost-effectiveness. Because of their wide use, biological processes have been
thoroughly studied and it is known that a high BOD:COD (>0.5) is needed to effectively
remove ammonia from an aqueous solution (Renou et al., 2008). Biological nitrogen
removal includes three main processes: ammonification, nitrification/denitrification
(aerobic), and anammox (anaerobic) (Metcalf & Eddy, 2014).

15
Ammonification occurs early in the biodegradation process and is a precursor to
nitrification/denitrification and anammox. Ammonification is the enzymatic
transformation of organic nitrogen into ammonia nitrogen by way of breaking down
larger organic nitrogen-containing molecules into inorganic ammonia.
Nitrification begins when ammonia is oxidized in the presence of Nitrosomonas
bacteria to produce nitrite, then, in the presence of Nitrobacter, nitrite is oxidized to
produce nitrate. Eq. (2.2) shows the conversion of ammonia to nitrate under aerobic
conditions. Denitrification is the next step of the nitrification/denitrification process.
The complete process is shown in Eq. (2.3) (Metcalf & Eddy, 2014).
NH4+ + 2O2 → NO3- + 2H+ + H2O [ΔG’0 = -350 kJ/mol] (2.2)
NO3- → NO2- → NO → N2 (2.3)
Nitrate is reduced to nitrogen gas by an assortment of denitrifying bacteria, including:
Lactobacillus, Pseudomonas, Acinetobacter, Alcaligenes, Thiobacillus,
Hyphomicrobium, and Spirillum (anoxic conditions) (Metcalf & Eddy, 2014).
Biological nitrification/denitrification is undoubtedly the most cost-effective process
to remove ammonia nitrogen from an aqueous solution. However, this cost-
effectiveness is only under optimal conditions, which is rarely the case when dealing
with landfill leachate. The presence of high concentrations of TAN and its inhibitory
effects, AOXs (adsorbable organic halogens), PCBs (polychlorinated biphenyls), PAHs
16
(polyarmatic hydrocarbons), and biorefractory organics (humic substances) severely
limits the performance of this process. Furthermore, microbial inhibition from high
ammonia concentrations is always a factor (Lema et al., 1988). In addition,
heterotrophic bacteria, which consume organic matter in aqueous solution
(ammonification), inhibit the activity and growth of nitrifying bacteria (Jorgensen &
Weatherley, 2003). The issue of poor removal efficiency is further compounded when
dealing with leachate generated from mature landfills because of its low BOD:COD
(Wiszniowski et al., 2006).
Anaerobic ammonium oxidation (anammox) process is a new and potentially cost-
effective alternative to aerobic nitrification/denitrification. The advantage of using an
anaerobic method is the elimination of the need to aerate, which accounts for the bulk
of operational costs associated with aerobic nitrification/denitrification (Van de Graaf
et al., 1995). Eq. (2.4) shows the conversion of ammonium to nitrogen gas under
anaerobic conditions (Metcalf & Eddy, 2014).
NH4+ + NO2- → N2 + 2H2O [ΔG’0 = -357 kJ/mol] (2.4)
Strous et al. (1997) successfully removed ammonia from digestion effluent sludge
using an anammox process in a fluidized-bed reactor. They found that 82% of
ammonia was removed along with 99% of nitrite with a maximum nitrogen
conversion rate of 0.7 kg/(m3·day) during a 150-day operational cycle.
17
Unfortunately, the biochemistry of anammox bacteria is not fully understood and the
main drawback of this process is slow and variable bacteria growth rates – anywhere
from a few months to a couple of years is needed for an anammox reactor to reach its
maximum design capacity (Trigo et al., 2006; Kuenen, 2008).
2.6.2 Chemical precipitation
For some time, chemical precipitation has been the industry standard being used to
treat both ammonia and heavy metal contaminated wastewater. A wide range of
industrial applications exist spanning from tannery effluent to WWTP sludge liquor
(Tünay et al., 1997). For highly contaminated wastewater, like landfill leachate,
chemical precipitation can be used in conjunction with biological methods as a
pretreatment method (Renou et al., 2008). The basic chemical reaction that forms
magnesium ammonium phosphate (MAP) is shown below in Eq. (5).
MgCl2·6H2O + Na2HPO4·12H2O + NH4+ → MgNH4PO4·6H2O↓+ 2NaCl (2.5)
A 2001 study by Li and Zhao found that the addition of MgCl2·6H2O and
Na2HPO4·12H2O with a Mg:NH4:PO4 of 1:1:1 at a pH of 8.5-9 reduced the NH4+-N
concentration from 5600 to 110 mg/L within 15 minutes. Yangin et al. (2002) found a
maximum NH4+-N reduction of 66% at a pH of 9.3 at the stoichiometric ratio compared
to 86% when using the same pH above the stoichiometric ratio; this study used MAP
precipitation after the wastewater and landfill leachate mixture (2% and 3% leachate)

18
had been anaerobically treated in an up-flow sludge blanket reactor (UASB). Also,
Ozturk et al. (2003) researched the application of struvite precipitation to remove
ammonia from anaerobically treated effluents using a Mg:NH4:PO4 of 1:1:1. They
found NH4+-N removal rates of 85% at a pH of 9.2, 20% at a pH of 10 to11, and
72% at a pH of 12.
While chemical precipitation is an effective means of removing ammonia from
wastewater and leachate it requires a constant input of chemicals, which can be costly.
Also, chemical precipitation produces large amounts of solid waste (sludge) and the
precipitate formed has high concentrations of ammonia.
2.6.3 Sorption
Sorption is used here as a catch-all term referring to the removal of a compound from
one phase (gas, solid, or liquid) to another (Sposito, 2008) including absorption,
adsorption, and ion-exchange; the latter two will be discussed in the following
sections.
2.6.3.1 Adsorption
Adsorption is a mass transfer operation that targets certain liquid constituents and
transfers them to a solid phase (Metcalf & Eddy, 2014). More specifically, adsorption
can capture dissolved organic and inorganic substances to a solid surface through
physical or chemical bonds. Many pollutants can be adsorbed including, but not
19
limited to: heavy metals, COD, and ammonia (Li et al., 2008).
Activated carbon (AC) is the most widely used adsorbent as it has a complex pore
structure with an inner surface area greater than 400 m2/g (Li et al, 2008). AC is
commonly used as an advanced stage in an integrated chemical, physical, and
biological method (Foo and Hameed, 2009). Aziz et al. (2012) researched the
equilibrium adsorption capacity (Qe) of powdered activated carbon (PAC) for COD and
ammonia removal from semi-aerobic landfill leachate and found it to be 15.41 mg/g
and 6 mg/g, respectively. Similarly, Halim et al. (2010) found the solid phase
concentrations of COD and ammonia were 37.88 mg/g and 6.08 mg/g, respectively.
PAC is considered to be more efficient for organics removal due to its non-polar
surface area but suffers when trying to remove ammonia, a highly polar molecule.
2.6.3.2 Ion-exchange
Ion-exchange is commonly applied in water softening and water purification
processes and involves a reversible exchange of ions between liquid and solid phase.
More specifically, the mobile ions of an ion-exchange resin (IER) can be replaced by
similarly charged ions from the surrounding aqueous solution (Bashir et al., 2010).
Cation and anion resins are the most common with cation resins attracting positively
charged ions (Ca2+, Mg2+, NH4+, etc.) and anion resins attracting negatively charged
ions (Cl-, NO3-, etc.) (Hendershot et al., 2007).
20
Solid ion-exchangers can be categorized as natural-inorganic particles (ex: zeolite) and
synthetic-organic resins (ex: Amberlite IR120 H). Synthetic-organic resins are
produced with high-molecular weight polyelectrolytes and contain a cross-linked
polymer matrix attached by covalent bonds (Cheremisinoff, 2001). Synthetic ion-
exchange resins (SIER) can be customized allowing several advantages over natural
zeolite including faster exchange rate, longer life, and higher ion exchange capacity
(Letterman, 1999).
IERs can be further classified in to the following four groups (Hendershot et al., 2007):
• Strongly basic, typically featuring quaternary amino groups
• Weakly basic, typically featuring primary, secondary, and/or ternary amino
groups
• Strongly acidic, typically featuring sulfonic acid groups
• Weakly acidic, typically featuring carboxylic acid groups.
Bashir et al. (2010a) compared the ammonia removal performance of different mobile
cation forms using a SIER (INDION 225 Na). It was found that the H+ form had a
higher removal efficiency than the Na+ form (92.8% and 72%, respectively).
Furthermore, a 94.2% removal of ammonia was accomplished in 6 minutes by INDION
225 Na strong acid cation exchanger from a synthetic ammonia solution with an initial
concentration of 1000 mg/L.
21
Ding and Sartaj (2015; 2016) researched the use of zeolite, a popular adsorbent with
ion-exchange properties, and Amberlite IR120 H, a synthetic ion-exchange resin, in the
removal of aqueous ammonia. For zeolite, an ammonia removal of up to 87% was seen
at neutral pH, dose of 150 g/L, and an initial ammonia concentration of 1000 mg
TAN/L. For Amberlite IR120 H, an ammonia removal of up to 84% was seen at neutral
pH, dose of 100 g/L, and an initial ammonia concentration of 1000 mg TAN/L. The
optimum adsorption capacities of zeolite and Amberlite IR120 H were 22.90 mg/g at
pH 7 and 28.78 mg/g at pH 6, respectively, with an initial ammonia concentration of
3000 mg TAN/L.
An advantage that IERs have over chemical precipitation is that they can be
regenerated by acid, base, or salt solutions at certain concentrations. The equilibrium
exchange capacity decreases less than 2.5% with each regeneration, which extends the
functional lifespan of SIER (Lin & Wu, 1996). However, the reuse of IERs within a
WWTP still poses a logistical problem with regards to their removal from the system
for regeneration.
2.6.4 Air stripping
Air stripping is one of the most common approaches for eliminating high
concentration of ammonia existing in wastewater (Marttinen et al., 2002). The
principle of the air stripping process is relatively simple; it transfers free ammonia,
which is a volatile component in liquid phase, into an air stream (Hasar et al., 2009;

22
Metcalf & Eddy, 2003). The air stripping process is generally operated in one of the
following ways (Hasar et al., 2009):
1) Free stripping
Uses a magnetic stirrer to introduce air into an aqueous solution
2) Forced stripping
Uses an air diffuser to introduce air into an aqueous solution
3) Combination of both free and forced stripping
The efficacy of this process is highly dependent on the retention time of the liquid
being stripped and the pH. Table 2.2 summarizes the efficiency of air stripping i n
r e m o v i n g ammonia from landfill leachate based on previous studies done by
Cheung et al. (1997), Marttinen et al. (2002), Ozturk et al., (2003), and Silva et al.
(2004).
Table 2.2 Air Stripping Process Efficiency Comparison
TAN (mg/L)
Stripping time (hrs)
TAN Removal (%)
Reference
556-705 24 76-93 (Cheung et al., 1997)
72-220 24 89 (Marttinen et al., 2002)
1025 24 85 (Ozturk et al., 2003)
750-800 96 99.5 (Silva et al., 2004)

23
A removal of 89% TAN was achieved by Marttinen et al. (2002) at a pH of 11, a
temperature of 20°C, stripping time of 24 hours, and an aeration rate of 10 L/hr.
Cheung et al. (1997) reported up to 93% TAN removal with a higher initial ammonia
concentration and same stripping time. Silva et al. (2004) reported 99.5% TAN
removal with a similar high initial concentration using a 96 hour stripping time.
Ozturk et al. (2003) accomplished 85% ammonia-nitrogen removal at a pH of 12 and
24-hour retention time, although no significant removal occurred after 17 hours.
The major drawbacks of ammonia air stripping are the energy cost associated with
running the air pumps and the production of air-born ammonia, which is a known
irritant.
2.6.5 Membrane filtration
Membrane filtration is classified by pore size, as follows: microfiltration (0.1-10μm),
ultrafiltration (2-100 nm), nanofiltration (1-2 nm), and reverse osmosis (<1 nm)
(Laitinen et al., 2006). Regardless of pore size, all membrane filtration uses increased
pressure to force wastewater through a membrane.
Nanofiltration (NF) membranes can remove multiple pollutants (organic, inorganic,
and microbial) with a high rejection of sulfate ions and dissolved organic matter and a
low rejection of chloride and sodium (Peters, 1998). Using different membrane
geometries (flat, spiral wound, and tubular), pressures ranging from 6 to 30 bar, and
24
an average velocity of 3 m/s yielded comparable ammonia removals of approximately
50% (Rautenbach & Mellis, 1994; Trebouet et al., 1999; Trebouet et al., 2001).
Unfortunately, the variability of wastewater can lead to membrane fouling from
dissolved organic and inorganic molecules along with colloidal and suspended
particles (Braghetta et al., 1998; Trebouet et al., 2001).
Reverse Osmosis (RO) membranes show the most promise due to their extremely
small pore size and capability to completely remove salt from aqueous solutions
(Bilstad & Madland, 1992; Linde et al., 1995). Di Palma et al. (2002) reported ammonia
reductions greater than 97% at a pH of 6.4 using two different RO membranes.
Moreover, RO membranes can be cleaned more easily and efficiently due to their
surface characteristic, which lessens the impact of membrane fouling (Peters, 1998).
In order to use membrane filtration, extensive pretreatment and chemical cleaning is
required. If not vigilantly monitored and maintained, the lifecycle of the membrane
and process productivity decrease significantly. Furthermore, large amounts of
unusable concentrate are generated and must be disposed (Rautenbach et al., 2000).
2.6.6 Microwave
Microwaves (MW) are electromagnetic waves whose frequency lies somewhere
between 300 MHz and 300 GHz. MW aligns polar chains of molecules to the direction
of the electronic field which causes rapid dipole orientation changes in phase with the
25
oscillating electromagnetic wave. This dipole movement is resisted by intermolecular
bonds producing heat (Coelho, 2012). MW molecular-level heating leads to
homogeneous and rapid thermal reactions, which is desirable in wastewater
treatment (Menendez et al., 2002). Also, due to the electromagnetic properties of MW,
selective heating of materials with higher dielectric factors is possible (Remya & Lin,
2011).
Lin et al. (2009b) found that there are two general removal mechanisms when
removing ammonia with MW: thermal and non-thermal. Thermal removal occurs due
to volatilization, while non-thermal removal occurs due to the breakdown of
molecular bonds between NH3+ and H2O; both removal mechanisms are tied to the
rapid dipole movement that MW produces.
Lin et al. (2009a) reported that pH and radiation time are important parameters
affecting ammonia removal from wastewater by MW. These findings are consistent with
literature regarding the increasing fraction of NH3+, which is the more volatile form of
ammonia, with a rise in temperature and pH. A maximum ammonia removal of 98% was
recorded at pH 11, duration of 3 minutes, and power output of 650 W. Also, a
comparative test was done comparing the contribution of thermal and non-thermal
mechanisms; using a pH of 11 conventional heating removed around 25% ammonia, while
MW, operating at a power output of 350 W, removed 45%.
Dong and Sartaj (2016a; 2016b) reported an ammonia removal of 81.7% and 70% at pH

26
10.5, power output 650 W, duration of 120s, and 10 minutes of aeration for synthetic and
actual leachate, respectively. Furthermore, it was concluded that, with the aforementioned
conditions, thermal mechanisms contributed 39% of the total removal, non-thermal 28%,
and aeration 33%.
Recently, MW enhanced oxidation has been investigated as a way to break down complex
pollutants with great success (Qi et al., 2014; Yang et al.,2009; Ju et al., 2009). MW
increases the formation of free radicals from oxidants (ex: H2O2, S2O82-, etc.) and yields
higher reaction temperatures in less time, increasing removal efficiency (Zhang et al.,
2007; Remya & Lin, 2011). Unfortunately, there is yet to be targeted research as to the
efficiency of ammonia removal using this method.
2.6.7 Ultrasound
The effects of ultrasound were first discovered during SONAR testing, where it was
observed to be deadly to various fish populations. Research in the 1960s brought
more clarity to ultrasonic mechanisms involving microbial cells, namely cavitation and
the corresponding physical, sheer forces and localized heating, and chemical, free
radical formation, effects (Mason & Tiehm, 2001).
Ultrasound is sound waves that oscillate at frequencies above 16 kHz or 16000 cycles
per second. As these sound waves pass through a liquid with high enough energy (> 1
3
W/cm3) they create a cycle of alternating adiabatic compression and rarefaction.
During rarefaction, there is adequate negative pressure to produce

27
cavitation/microbubbles which encapsulate dissolved liquid vapor or gas. Once these
microbubbles reach a critical size, which is dependent on the liquid and sound
frequency applied, they collapse violently releasing the sonic energy as extremely high
localized pressure and temperature, up to 1000 atm and 5000K, respectively
(Adewuyi, 2001).
Cavitation in a liquid, along with pressure and temperature increase, results in the
generation of free radicals (sonolysis). Furthermore, in the presence of oxygen,
sonolysis produces hydroperoxyl radicals (HO2∙) which acts as an oxidizing agent.
The formation of free radicals and hydrogen peroxide (H2O2) combined with the
physical violence of cavitation allows ultrasound to be used as an effective industrial
disinfectant method (Mason & Tiehm, 2001). Figure 2.2 shows how cavitation on a
solid surface results in a liquid jet stream.
Figure 2.2 Liquid jet (a) on a surface (b) close to a surface (Mason & Tiehm, 2001)
28
The local liquid jet stream produced can have a velocity of up to 300 m/s which can
damage nearby microorganisms, solids, and surfaces. Also, away from the bubble
collapse, acoustic shockwaves, microsteaming, and sonoluminescence can occur; all of
these effects contribute to ultrasonic disinfection (Gibson et al., 2008).
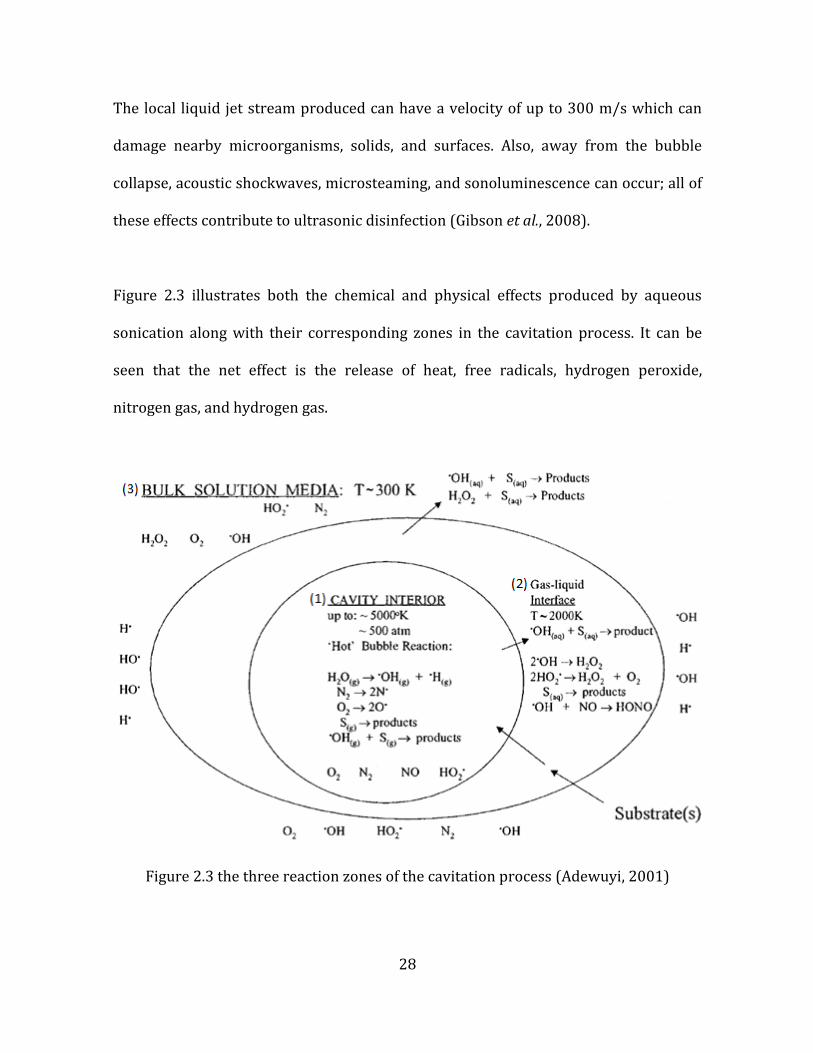
Figure 2.3 illustrates both the chemical and physical effects produced by aqueous
sonication along with their corresponding zones in the cavitation process. It can be
seen that the net effect is the release of heat, free radicals, hydrogen peroxide,
nitrogen gas, and hydrogen gas.
Figure 2.3 the three reaction zones of the cavitation process (Adewuyi, 2001)

29
Adewuyi (2001) describes the three reaction zones as follows: (1) hot, gaseous
nucleus; (2) interfacial region with radial temperature gradient and local radical
density; (3) bulk solution at ambient temperature.
1) In the nucleus, the extreme conditions generated by a bubble collapse cause
bonds to break and dissociation as the activation energy for bond cleavage is
reached. Also, the free radicals produced react with one another and form new
radicals and/or diffuse into the bulk solution as oxidants.
2) In the gas-liquid interface, both free radical induced reactions and pyrolysis
occur. At high solute concentrations pyrolysis dominates and at low solute
concentrations free radical reactions dominate.
• At the interface between the bubble and bulk liquid the species
produced in the cavitation bubble react with the chemicals in the liquid
for the first time. This zone is estimated to extend approximately 200
nm from the bubble’s surface and lasts less than 2 µs.
3) In the bulk solution, the diffused free radicals react with the substrate
available. Molecules close to the cavitation bubble may be volatilized,
depending on the molecules present in the solution and their associated
properties.

30
There is a plethora of research regarding the use of ultrasound as a disinfectant but far
less on the use of ultrasound as a wastewater pretreatment. However, in recent years
several studies have been published applying ultrasonic treatment to eliminate high
concentrations of organic matter and ammonia nitrogen from wastewater and landfill
leachate (Gogate, 2008).
Wang et al. (2008) found that up to 96% of ammonia could be removed from filtered
landfill leachate after 180 minutes of US irradiation coupled with aeration at an initial
pH of 11, power input of 200 W, and initial ammonia concentration of 680 mg/L; the
experiments were carried out under a constant temperature of 30°C. The ultrasonic
process was proven to be input power and pH dependent with ammonia removal rates
increasing with the increase of power input and pH. The removal efficiency at pH 11
was approximately eight times as high as that of pH 3. This could be explained by the
fact that at pH 11, almost all the ammonia is unionized ammonia rather than ionized
ammonia which does not vaporize into the cavitation bubbles. In molecular state,
unionized ammonia can react inside by thermal cleavage after transforming into
cavitation bubbles due to ultrasound irradiation. The main mechanism of ammonia
nitrogen reduction from aqueous solutions by ultrasound appears to be the entry of
ammonia molecules into the cavitation bubbles and the transformation into nitrogen
molecules and hydrogen molecules via pyrolysis. This was tested by adding n-butyl
alcohol (a scavenger of hydroxyl radicals) to the leachate in order to effectively nullify
the removal of ammonia by oxidation (Wang et al., 2008). However, Ozturk and Bal
(2015) concluded that the main mechanism of ammonia removal was advanced

31
oxidation of ammonia–nitrogen by hydroxyl radical generation from US.
The experimental set-up used by Wang et al., (2008) is relatively simple, as shown in
Fig. 2.4.
Figure 2.4 Schematic of the ultrasound set-up (Wang et al., 2008)
The reactor design plays an important role in the ultrasonic irradiation process. Due
to the limited penetration ability of ultrasound, as the height of liquid increases, the
ammonia removal efficiency decreases. Matouq & Al-Anber (2007) reported that an
optimum liquid height of 16.5 mm from the ultrasonic tip. This liquid height yielded
approximately 31% ammonia removal after 90 minutes of US irradiation at an
ultrasonic frequency of 2.4 MHz.

32
2.7 Summary and Research Gap
A wide variety of methods exist to remove high concentrations of ammonia from
aqueous solutions, including landfill leachate. These methods include conventional
biological nitrification/denitrification, physical adsorption, air stripping, chemical
precipitation, ion-exchange, membrane filtration, microwave radiation, and
ultrasound irradiation. All methods have their drawbacks: biological processes do not
respond well to high ammonia levels and shock loads; air stripping, ultrasound, and
microwave technologies require pH adjustment and the input of energy; Membrane
fouling issue are inevitable; the costs for adsorption chemical precipitation and ion-
exchange processes are relatively high and produce residuals that must be disposed
of. Consequently, no single solution exists for the removal of ammonia nitrogen from
highly concentrated aqueous ammonia solutions. Methods capable of reducing high
levels of ammonia nitrogen from aqueous solutions, including landfill leachate, with
high efficiency, relatively low cost, and minimal residuals production are highly
desired.
Ultrasonic irradiation has been widely studied in industrial settings for disinfection
and use as a catalyst for chemical reactions. However, few studies have been done
regarding the application of US in removing ammonia nitrogen. Furthermore, there is
a lack of systematic studies supported by statistical analysis. The studies that have
been published show promising results. The following research is meant to build on
this knowledge and provide insight into optimization through using a response
surface methodology and factorial design.

33
References
Abbas, A. A., Jingsong, G., Ping, L. Z., Pan, Y. Y., and Al-Rekabi, W. S. (2009). Review on Landfill Leachate Treatments. American Journal of Applied Sciences, 6(4), 672-684.
Adewuyi, Y. G. (2001). Sonochemistry: environmental science and engineering applications.
Industrial & Engineering Chemistry Research, 40(22), 4681-4715. Ahn, W. Y., Kang, M. S., Yim, S. K., and Choi, K. H. (2002). Advanced landfill leachate treatment
using an integrated membrane process. Desalination, 149(1–3), 109-114. Akindele, A.A. and Sartaj, M. (2017). The toxicity effects of ammonia on anaerobic digestion
of the organic fraction of municipal solid waste. Waste Management, article in press. Aziz, S. Q., Aziz, D., Abdul, H., Yusoff, M. S., Mojiri, A., and Amr, S. S. A. (2012). Adsorption
isotherms in landfill leachate treatment using powdered activated carbon augmented sequencing batch reactor technique: Statistical analysis by response surface methodology. International Journal of Chemical Reactor Engineering, 10(1).
Bashir, M. J., Aziz, H. A., Yusoff, M. S., Huqe, A. A., and Mohajeri, S. (2010a). Effects of ion
exchange resins in different mobile ion forms on semi-aerobic landfill leachate treatment. Water Science and Technology, 61(3), 641-649.
Bashir, M. J. K., Aziz, H. A., Yusoff, M. S., and Adlan, M. N. (2010b). Application of response
surface methodology (RSM) for optimization of ammoniacal nitrogen removal from semi-aerobic landfill leachate using ion exchange resin. Desalination, 254(1-3), 154-161.
Baumgarten, G. and Seyfried, C. (1996). Experiences and new developments in biological
pretreatment and physical posttreatment of landfill leachate. Water Science and Technology, 34(7), 445-453.
Belevi, H. and Baccini, P. (1989). Long-term behavior of municipal solid waste landfills. Waste
Management and Research, 7(1), 43-56. Benjamin, M.M. 2002. Water Chemistry, 1st ed., McGraw-Hill, New York, NY, USA. Beutel, M. W. (2006). Inhibition of ammonia release from anoxic profundal sediments in lakes
using hypolimnetic oxygenation. Ecological Engineering, 28(3), 271-279. Bilstad, T. and Madland, M. (1992). Leachate minimization by reverse osmosis. Water
Science & Technology, 25(3), 117-120.

34
Bohdziewicz, J., Bodzek, M., and Górska, J. (2001). Application of pressure-driven membrane techniques to biological treatment of landfill leachate. Process Biochemistry, 36(7), 641-46.
Booker, N., Cooney, E., and Priestley, A. (1996). Ammonia removal from sewage using
natural Australian zeolite. Water Science and Technology, 34(9), 17-24. Braghetta, A., DiGiano, F. A., and Ball, W. P. (1998). NOM accumulation at NF membrane
surface: impact of chemistry and shear. Journal of Environmental Engineering, 124(11), 1087-1098.
Britto, D.T. and Kronzucker, H.J (2002). NH4+ toxicity in higher plants: a critical review.
Journal of Plant Physiology, 159, 567-584. Burton, S. A. Q. and Watson-Craik, I. A. (1998). Ammonia and nitrogen fluxes in landfill sites:
applicability to sustainable landfilling. Waste Management and Research, 16(1), 41-3. Canada Gazette (2012). Wastewater Systems Effluent Regulations. Canada Gazette, Part II,
July 18, 1634-1727. Çeçen, F. and Aktaş, Ö. (2001). Effect of PAC addition in combined treatment of landfill
leachate and domestic wastewater in semi-continuously fed batch and continuous-flow reactors. Water SA, 27(2).
Çeçen, F. and Aktaş, Ö. (2004). Aerobic Co-Treatment of Landfill Leachate with Domestic
Wastewater. Environmental Engineering Science, 21(3), 303-312. Chang, R. and Cruickshank, B. 2005. Chemistry. 8th ed., McGraw-Hill, New York, NY, USA. Cheremisinoff, N. P. (2001). Handbook of water and wastewater treatment technologies,
Butterworth-Heinemann, Michigan. Cheung, K., Chu, L., and Wong, M. (1997). Ammonia stripping as a pretreatment for landfill
leachate. Water, Air, and Soil Pollution, 94(1-2), 209-221. Chianese, A., Ranauro, R., and Verdone, N. (1999). Treatment of landfill leachate by reverse
osmosis. Water Research, 33(3), 647-652. Coelho, N. M. G. (2012). Application of Microwaves and Thermophilic Anaerobic Digestion to
Wastewater Sludge Treatment. PhD Thesis, University of Ottawa, Canada. Cho, S. P., Hong, S. C., and Hong, S.-I. (2002). Photocatalytic degradation of the landfill
leachate containing refractory matters and nitrogen compounds. Applied Catalysis B: Environmental, 39(2), 125-133.
35
Conley, D. J., Paerl, H. W., Howarth, R. W., Boesch, D. F., Seitzinger, S. P., Havens, K. E., Lancelot, C., and Likens, G. E. (2009). Controlling eutrophication: nitrogen and phosphorus. Science, 323(5917), 1014-1015.
Demir, A., Gunay, A., and Debik, E. (2002). Ammonium removal from aqueous solution by ion
exchange using packed bed natural zeolite. Water SA, 28(3), 329-336. Di Palma, L., Ferrantelli, P., Merli, C., and Petrucci, E. (2002). Treatment of industrial landfill
leachate by means of evaporation and reverse osmosis. Waste Management, 22(8), 951-55.
Diamadopoulos, E., Samaras, P., Dabou, X., and Sakellaropoulos, G. P. (1997). Combined
treatment of landfill leachate and domestic sewage in a sequencing batch reactor. Water Science and Technology, 36(2–3), 61-68.
Ding, Y. and Sartaj, M. (2015). Statistical analysis and optimization of ammonia removal
from aqueous solution by zeolite using factorial design and response surface methodology. Journal of Environmnetal Chemical Engineering, 3(2), 807-814.
Ding, Y. and Sartaj, M. (2016). Optimization of ammonia removal by ion-exchange resin using
response surface methodology. International Journal of Environmental Science and Technology, 13(4), 985-994.
Dixon, J. B. and Weed, S. B. (1989). Minerals in soil environments, Soil Science Society of
America Inc. (SSSA), Madison, WL. Dong, S. and Sartaj, M. (2016a). Statistical analysis of thermal and nonthermal effects of
sequential microwave/aeration process for the removal of ammonia from aqueous solution. Desalination and Water Treatment, 57(42), 20005-20015.
Dong, S. and Sartaj, M. (2016b). Statistical analysis and optimization of ammonia removal
from landfill leachate by sequential microwave/aeration process using factorial design and response surface methodology. Journal of Environmental Chemical Engineering, 4(1), 10-108.
Du, Q., Liu, S., Cao, Z., and Wang, Y. (2005). Ammonia removal from aqueous solution using
natural Chinese clinoptilolite. Separation and Purification Technology, 44(3), 229-234. Ehrig, H. J. (1989). Water and element balances of landfills. The Landfill. P. Baccini (ed.),
Springer Berlin Heidelberg. Emerson, K., Russo, R. C., Lund, R. E. and Thurston, R. V. (1975). Aqueous ammonia
equilibrium calculations: effect of pH and temperature. Journal of the Fisheries Board of Canada, 32(12), 2379-2383.

36
Englert, A. and Rubio, J. (2005). Characterization and environmental application of a Chilean natural zeolite. International Journal of Mineral Processing, 75(1), 21-29.
Environment Canada and Health Canada (2001). PSL Assessment Report – Ammonia in the
Aquatic Environment. Canadian Environmental Protection Act 1999. Fernandes, T.V., Keesman, K.J., Zeeman, G., and van Lier, J.B. (2012). Effect of ammonia on
the anaerobic hydrolysis of cellulose and tributyrin. Biomass and Bioenergy, 47, 316-323.
Foo, K. and Hameed, B. (2009). An overview of landfill leachate treatment via activated
carbon adsorption process. Journal of Hazardous Materials, 171(1), 54-60. Frascari, D., Bronzini, F., Giordano, G., Tedioli, G., and Nocentini, M. (2004). Long-term
characterization, lagoon treatment and migration potential of landfill leachate: a case study in an active Italian landfill. Chemosphere, 54(3), 335-343.
Gan, Q. (2000). A case study of microwave processing of metal hydroxide sediment sludge
from printed circuit board manufacturing wash water. Waste Management, 20(8), 695-701.
Gibson, J. H., Young, D. H. N., Farnood, R. R., and Seto, P. (2008). A Literature Review of
Ultrasound Technology and Its Application in Wastewater Disinfection. Water Quality Research Journal of Canada, 43(1), 23-25.
Gogate, P. R. (2008). Treatment of wastewater streams containing phenolic compounds using
hybrid techniques based on cavitation: a review of the current status and the way forward. Ultrasonics Sonochemistry, 15(1), 1-15.
Gourdon, R., Comel, C., Vermande, P., and Veron, J. (1989). Fractionation of the organic
matter of a landfill leachate before and after aerobic or anaerobic biological treatment. Water Research, 23(2), 167-173.
Haggerty, G. M. and Bowman, R. S. (1994). Sorption of chromate and other inorganic anions
by organo-zeolite. Environmental Science and Technology, 28(3), 452-458. Halim, A. A., Aziz, H. A., Johari, M. A. M., and Ariffin, K. S. (2010). Comparison study of
ammonia and COD adsorption on zeolite, activated carbon and composite materials in landfill leachate treatment. Desalination, 262(1), 31-35.
Hansen, K. H., Angelidaki, I., and Ahring, B. K. (1998). Anaerobic digestion of swine Manure:
inhibition of ammonia. Water Research, 32(1), 5-12. Hasar, H.,Unsal, S. A., Ipek, U., Karates, S.,Cinar, O., Yaman, C., and Kinaci, C. (2009).
Stripping/flocculation/membrane bioreactor/reverse osmosis treatment of municipal landfill leachate. Journal of Hazardous Materials, 171(1), 309-317.

37
Henry, J. G., Prasad, D., and Young, H. (1987). Removal of organics from leachates by
anaerobic filter. Water Research, 21(11), 1395-1399. Hlavay, J., Vigh, G., Olaszi, V., and Inczedy, J. (1982). Investigations on natural Hungarian
zeolite for ammonia removal. Water Research, 16(4), 417-420. Ho, Y. S. and McKay, G. (1999). Pseudo-second order model for sorption processes. Process
Biochemistry, 34(5), 451-465. Hoilijoki, T. H., Kettunen, R. H., and Rintala, J. A. (2000). Nitrification of anaerobically
pretreated municipal landfill leachate at low temperature. Water Research, 34(5), 1435-446.
Hong, S. and Elimelech, M. (1997). Chemical and physical aspects of natural organic matter
(NOM) fouling of nanofiltration membranes. Journal of Membrane Science, 132(2), 159-81.
Im, J. H., Woo, H. J., Choi, M. W., Han, K. B., and Kim, C. W. (2001). Simultaneous organic and
nitrogen removal from municipal landfill leachate using an anaerobic-aerobic system. Water Research, 35(10), 2403-2410.
Ip, Y. K. and Chew, S. F. (2010). Ammonia production, excretion, toxicity, and defense in fish: a
review. Frontiers in Physiology, 1. Ip, Y. K., Chew, S. F., and Randall, D. J. (2001). Ammonia toxicity, tolerance, and excretion. Fish
Physiology, 20, 109-148. Jha, V. K. and Hayashi, S. (2009). Modification on natural clinoptilolite zeolite for its NH4+
retention capacity. Journal of Hazardous Materials, 169(1), 29-35.
Jorgensen, T. C. and Weatherley, L. R. (2003). Ammonia removal from wastewater by ion exchange in the presence of organic contaminants. Water Research, 37(8), 1723-1728.
Ju, Y., Yang, S., Ding, Y., Sun, C., Gu, C., He, Z., and Xu, B. (2009). Microwave-enhanced H2O2-
based process for treating aqueous malachite green solutions: intermediates and degradation mechanisms. Journal of Hazardous Materials, 171(1), 123-132.
Karadag, D., Koc, Y., Turan, M., and Armagan, B. (2006). Removal of ammonium ion from
aqueous solution using natural Turkish clinoptilolite. Journal of Hazardous Materials, 136(3): 604-609.
Kargi, F. and Pamukoglu, M. Y. (2003a). Aerobic biological treatment of pre-treated landfill
leachate by fed-batch operation. Enzyme and Microbial Technology, 33(5), 588-595.

38
Kargi, F. and Pamukoglu, M. Y. (2003b). Simultaneous adsorption and biological treatment of
pre-treated landfill leachate by fed-batch operation. Process Biochemistry, 38(10), 1413-1420.
Koon, J. H. and Kaufman, W. J. (1975). Ammonia removal from municipal wastewaters by ion
exchange. Journal of Water Pollution Control Federation, 448-465. Krylova, N. I., Khabiboulline, R. E., Naumova, R. P., and Nagel, M. A. (1997). The influence of
ammonium and methods for removal during the anaerobic treatment of poultry manure. Journal of Chemical Technology and Biotechnology, 70(1), 99-105.
Kuenen, J. G. (2008). Anammox Bacteria: from Discovery to Application. Nature Reviews
Microbiology, 6, 320-326. Laitinen, N., Luonsi, A., and Vilen, J. (2006). Landfill leachate treatment with sequencing
batch reactor and membrane bioreactor. Desalination, 191(1), 86-91. Lau, I. W. C., Wang, P., and Fang, H. H. P. (2001). Organic Removal of Anaerobically Treated
Leachate by Fenton Coagulation. Journal of Environmental Engineering, 127(7), 666-69.
Lee, S. M., Jung, J. Y., and Chung, Y. C. (2000). Measurement of ammonia inhibition of microbial
activity in biological wastewater treatment process using dehydrogenase assay. Biotechnology Letters, 22(12), 991-994.
Lei, L., Li, X., and Zhang, X. (2008). Ammonium removal from aqueous solutions using
microwave-treated natural Chinese zeolite. Separation and Purification Technology, 58(3), 359-366.
Lema, J., Mendez, R., and Blazquez, R. (1988). Characteristics of landfill leachates and
alternatives for their treatment: a review. Water, Air, and Soil Pollution, 40(3-4), 223-50.
Letterman, R. D. (1999). Water quality and treatment: a handbook of community water
supplies, fifth edition, McGraw-Hill, New York, NY. Li, W., Zhang, L. B., Peng, J. H., Li, N., and Zhu, X. Y. (2008). Preparation of high surface area
activated carbons from tobacco stems with K2CO3 activation using microwave radiation. Industrial crops and products, 27(3), 341-347.
Li, X. and Zhao, Q. (1999). Inhibition of microbial activity of activated sludge by ammonia in
leachate. Environment International, 25(8), 961-968.

39
Li, X. and Zhao, Q. (2001). Efficiency of biological treatment affected by high strength of ammonium-nitrogen in leachate and chemical precipitation of ammonium-nitrogen as pretreatment. Chemosphere, 44(1), 37-43.
Li, X., Zhao, Q., and Hao, X. (1999). Ammonium removal from landfill leachate by chemical
precipitation. Waste Management, 19(6), 409-415. Lin, L., Chen, J., Xu, Z., Yuan, S., Cao, M. Liu, H., and Lu, X. (2009b). Removal of ammonia
nitrogen in wastewater by microwave radiation: A pilot-scale study. Journal of Hazardous Materials, 168(2), 862-867.
Lin, L., Yuan, S., Chen, J., Xu, Z., and Lu, X. (2009a). Removal of ammonia nitrogen in
wastewater by microwave radiation. Journal of Hazardous Materials, 161(2), 1063-1068.
Lin, S. H. and Wu, C. L. (1996). Ammonia removal from aqueous solution by ion exchange.
Industrial and Engineering Chemistry Research, 35(2), 553-558. Linde, K., Jönsson, A. S., and Wimmerstedt, R. (1995). Treatment of three types of landfill
leachate with reverse osmosis. Desalination, 101(1), 21-30. Liu, J., Luo, J., Zhou, J., Liu, Q., Qian, G., and Xu, Z. P. (2012). Inhibitory effect of high-strength
ammonia nitrogen on bio-treatment of landfill leachate using EGSB reactor under mesophilic and atmospheric conditions. Bioresource Technology, 113, 239-243.
Lo, I. M. C. (1996). Characteristics and treatment of leachates from domestic landfills.
Environment International, 22(4), 433-442. Lopez, A., Pagano, M., Volpe, A., and Claudio Di Pinto, A. (2004). Fenton’s pre-treatment of
mature landfill leachate. Chemosphere, 54(7), 1005-1010. Malekian, R., Abedi-Koupai, J., Eslamian, S. S., Mousavi, S. F., Abbaspour, K. C., and Afyuni, M.
(2011). Ion-exchange process for ammonium removal and release using natural Iranian zeolite. Applied Clay Science, 51(3), 323-329.
Marttinen, S. K., Kettunen, R. H., Sormunen, K. M., Soimasuo, R. M., and Rintala, J. A. (2002).
Screening of physical–chemical methods for removal of organic material, nitrogen and toxicity from low strength landfill leachates. Chemosphere, 46(6), 851-858.
Maschmeyer, T. and van de Water, L. (2006). An overview of zeolite, zeotype and mesoporous
solids chemistry: Design, synthesis and catalytic properties. Catalysts for Fine Chemical Synthesis, 4(1).
Mason, T. J. and Tiehm, A. (2001). Ultrasound in environmental protection. Advances in
sonochemistry, Volume 6, JAI Press.

40
Matouq, M. A.-D. and Z. A. Al-Anber (2007). The application of high frequency ultrasound waves to remove ammonia from simulated industrial wastewater. Ultrasonics Sonochemistry, 14(3), 393-397.
Menendez, J., Inguanzo, M., and Pis, J. (2002). Microwave-induced pyrolysis of sewage sludge.
Water Research, 36(13), 3261-3264. Metcalf, L. and Eddy, H. P. (2014). Wastewater engineering: Treatment, disposal, and reuse.
Fifth ed., McGraw-Hill Inc., New York. Nair, A., Sartaj, M., Kennedy, K., and Coelho, N. M. (2014). Enhancing biogas production from
anaerobic biodegradation of the organic fraction of municipal solid waste through leachate blending and recirculation. Waste Management and Research, 32(10), 939-946.
Nguyen, M. and C. Tanner (1998). Ammonium removal from wastewaters using natural New
Zealand zeolites. New Zealand Journal of Agricultural Research, 41(3), 427-446. Ozturk, I., Altinbas, M., Koyuncu, I., Arikan, O., and Gomec-Yangin, C. (2003). Advanced
physico-chemical treatment experiences on young municipal landfill leachates. Waste Management, 23(5), 441-446.
Ozturk, E. and Bal, N. (2015). Evaluation of ammonia–nitrogen removal efficiency from
aqueous solutions by ultrasonic irradiation in short sonication periods. Ultrasonics Sonochemistry, 26, 422-427.
Park, S. J. and Kim, B. J. (2005). Ammonia removal of activated carbon fibers produced by
oxyfluorination. Journal of colloid and interface science, 291(2), 597-599. Peters, T. A. (1998). Purification of landfill leachate with membrane filtration. Filtration and
Separation, 35(1), 33-36. Petersen, R. J. (1993). Composite reverse osmosis and nanofiltration membranes. Journal of
Membrane Science, 83(1), 81-150. Piatkiewicz, W., Biemacka, E., and Suchecka, T. (2001). A Polish study: treating landfill
leachate with membranes. Filtration and Separation, 38(6), 22-26. Pirbazari, M., Ravindran, V., Badriyha, B. N., and Kim, S. H. (1996). Hybrid membrane
filtration process for leachate treatment. Water Research, 30(11), 2691-2706. Qi, C., Liu, X., Lin, C., Zhang, X., Ma, J., Tan, H., and Ye, W. (2014). Degradation of
sulfamethoxazole by microwave-activated persulfate: kinetics, mechanics and acute toxicity. Chemical Engineering Journal, 249, 6-14.
41
Quan, X., Liu, X., Bo, L., Chen, S., Zhao, Y., and Cui, X. (2004). Regeneration of acid orange 7 exhausted granular activated carbons with microwave irradiation. Water Research, 38(20), 4484-4490.
Rand, G. M. (1995). Fundamentals of aquatic toxicology: effects, environmental fate and risk
assessment. CRC Press, Baca Raton, FL. Randall, D. and Tsui, T. (2002). Ammonia toxicity in fish. Marine Pollution Bulletin, 45(1),
17-23. Rao, V. R., Murthy, C. R., and Butterworth, R. F. (1992). Glutamatergic synaptic dysfunction in
hyperammonemic syndromes. Metabolic Brain Disease, 7(1), 1-20. Rautenbach, R., Linn, T., and Eilers, L. (2000). Treatment of severely contaminated waste
water by a combination of RO, high-pressure RO and NF-potential and limits of the process. Journal of Membrane Science, 174(2), 231-241.
Rautenbach, R. and Mellis, R. (1994). Waste water treatment by a combination of bioreactor
and nanofiltration. Desalination, 95(2), 171-188. Remya, N. and Lin, J. G. (2011). Current status of microwave application in
wastewatertreatment – a review. Chemical Engineering Journal, 166(3), 797-813. Renou, S., Givaudan, J. G., Poulain, S., Dirassouyan, F., and Moulin, P. (2008). Landfill leachate
treatment: Review and opportunity. Journal of Hazardous Materials, 150(3), 468-93. Robinson, H. D. and Great Britain. Department of the Environment Wastes Technical Division
(1995). A Review of the Composition of Leachates from Domestic Wastes in Landfill Sites: Report Prepared for the UK Department of the Environment. Wastes Technical Division, Department of the Environment, UK.
Saltalı, K., Sarı, A., and Aydın, M. (2007). Removal of ammonium ion from aqueous solution by
natural Turkish (Yıldızeli) zeolite for environmental quality. Journal of Hazardous Materials, 141(1), 258-263.
Sarioglu, M. (2005). Removal of ammonium from municipal wastewater using natural
Turkish (Dogantepe) zeolite. Separation and Purification Technology, 41(1), 1-11. Shingles, A., McKenzie, D., Taylor, E., Moretti, A., Butler, P. and Ceradini, S. (2001). Effects of
sublethal ammonia exposure on swimming performance in rainbow trout (Oncorhynchus mykiss). Journal of Experimental Biology, 204(15), 2691-2698.
Silva, A. C., Dezotti, M., and Sant’Anna Jr., G. L. (2004). Treatment and detoxification of a
sanitary landfill leachate. Chemosphere, 55(2), 207-214. Sposito, G. (2008). The Chemistry Soils. 2nd ed., Oxford University Press, New York.

42
Strous, M., Van Gerven, E., Zheng, P., Kuenen, J. G., and Jetten, M. S. (1997). Ammonium removal from concentrated waste streams with the anaerobic ammonium oxidation (anammox) process in different reactor configurations. Water Research, 31(8), 1955-962.
Structure Commission of the International Zeolite Association (2001). Database of Zeolite
Structures. IZA Structure Commission. Syzdek, A. C. and Ahlert, R. C. (1984). Separation of landfill leachate with polymeric
ultrafiltration membranes. Journal of Hazardous Materials, 9(2), 209-220. Tabet, K., Moulin, P., Vilomet, J. D., Amberto, A., and Charbit, F. (2002). Purification of landfill
leachate with membrane processes: preliminary studies for an industrial plant. Separation Science and Technology, 37(5), 1041-1063.
Tatsi, A. A., Zouboulis, A. I., Matis, K. A., and Samaras, P. (2003). Coagulation– flocculation
pretreatment of sanitary landfill leachates. Chemosphere, 53(7), 737-744. Till, S. and Mallia, H. (2001). Membrane bioreactors: Wastewater treatment applications to
achieve high quality effluent. 64th Annual Water Industry Engineers and Operators’ Conference.
Timur, H. and Özturk, I. (1999). Anaerobic sequencing batch reactor treatment of landfill
leachate. Water Research, 33(15), 3225-3230. Trebouet, D., Schlumpf, J., Jaouen, P., and Quemeneur, F. (2001). Stabilized landfill leachate
treatment by combined physicochemical–nanofiltration processes. Water Research, 35(12), 2935-2942.
Trigo, C., Campos, J. L., Garrido, J. M., and Méndez, R. (2006). Start-up of the Anammox
Process in a Membrane Bioreactor. Journal of Biotechnology, 126, 475-487. Trebouet, D., Schlumpf, J. P., Jaouen, P., Maleriat, J. P., and Quemeneur, F. (1999). Effect of
Operating Conditions on the Nanofiltration of Landfill Leachates: Pilot-Scale Studies. Environmental Technology, 20(6), 587-596.
Tünay, O., Kabdasli, I., Orhon, D., and Kolçak, S. (1997). Ammonia removal by magnesium
ammonium phosphate precipitation in industrial wastewaters. Water Science and Technology, 36(2), 225-228.
USEPA (2009). Draft 2009 Update Aquatic Life Ambient Water Quality Criteria for Ammonia –
Freshwater. Washington, DC. Uygur, A. and Kargı, F. (2004). Biological nutrient removal from pre-treated landfill leachate
in a sequencing batch reactor. Journal of Environmental Management, 71(1), 9-14.
43
Van de Graaf, A. A., Mulder, A., de Bruijn, P., Jetten, M., Robertson, L. A., and Kuenen, J. G. (1995). Anaerobic oxidation of ammonium is a biologically mediated process. Applied and Environmental Microbiology, 61(4), 1246-1251.
Van Dijk, L. and Roncken, G. C. G. (1997). Membrane bioreactors for wastewater treatment:
The state of the art and new developments. Water Science and Technology, 35(10), 35-1.
Vassileva, P. and Voikova, D. (2009). Investigation on natural and pretreated Bulgarian
clinoptilolite for ammonium ions removal from aqueous solutions. Journal of Hazardous Materials, 170(2), 948-953.
Wang, B. and Y. Shen (2000). Performance of an anaerobic baffled reactor (ABR) as a
hydrolysis-acidogenesis unitin treating landfill leachate mixed with municipal sewage. Water Science and Technology, 42(0273-1223), 115-121.
Wang, S., Wu, X., Wang, Y., Li, Q., and Tao, M. (2008). Removal of organic matter and ammonia
nitrogen from landfill leachate by ultrasound. Ultrasonics Sonochemistry, 15(6), 933-937.
Wang, Y., Liu, S., Xu, Z., Han, T., Chuan, S., and Zhu, T. (2006). Ammonia removal from leachate
solution using natural Chinese clinoptilolite. Journal of Hazardous Materials, 136(3), 735-740.
Wiszniowski, J., Robert, D., Surmacz-Gorska, J., Miksch, K., and Weber, J. V. (2006). Landfill
leachate treatment methods: A review. Environmental Chemistry Letters, 4(1), 51-61. Wu, J. J., Wu, C. C., Ma, H. W., and Chang, C. C. (2004). Treatment of landfill leachate by ozone-
based advanced oxidation processes. Chemosphere, 54(7), 997-1003. Wu, T. Y., Guo, N., The, C. Y., and Hay, J. X. W. (2012). Advances in ultrasound technology for
environmental remediation. SpingerBriefs in Molecular Science, Green Chemistry for Sustainability, Springer Science & Business Media.
Yang, S., Wang, P., Yang, X., Wei, G., Zhang, W., and Shan, L. (2009). A novel advanced
oxidation process to degrade pollutants in wastewater: microwave-activated persulfate oxidation. Journal of Environmental Sciences, 21(9), 1175-1180.
Yangin, C., S. Yilmaz, Altinbas, M., and Ozturk, I. (2002). A new process for the combined
treatment of municipal wastewaters and landfill leachates in coastal areas. Water Science and Technology, 46(8), 111-118.
Yenigün, O. and Demirel, B. (2013). Ammonia inhibition in anaerobic digestion: a review.
Process Biochemistry, 48(5), 901-9.

44
Zhang, L., Guo, X., Su, M., and Li, Y. (2007). Study of the degradation behavior of dimethoate under microwave irradiation. Journal of Hazardous Materials, 149(3), 675-679.
45
3 CHAPTER III Materials & Methodology
The following chapter will explain the materials and methodology used to perform the
laboratory experiments conducted for this thesis. More specifically, this chapter will
explain the experimental materials, set-up, and procedure used to generate data.
3.1 Experimental Materials
The following section lists the experimental materials and equipment used to perform the
experiments carried out for this thesis.
The following materials and equipment were used:
Branson Digital Sonifier® (model 450)
Branson 20 kHz ultrasonic converter
Branson ½” disruptor horn
Branson ½” disruptor horn tip
Adjustable beaker stand
Protective case
500 ml Polypropylene (PP) container with lid
Beakers (various sizes)
Erlenmeyer flask (various sizes)
Distilled water (DW)
Fisher Scientific Ammonium Chloride salt (NH4Cl)

46
Hach TNTplus 832 HR test kit
Fisher Scientific Accumet Excel XL25 dual channel pH/ion meter
Cole-Parmer Canada Inc. 20L/120V StableTemp hot water bath
Encapsulated magnetic stir bar
Mettler-Tuledo AL204 scale
Mettler PC4400 DeltaRange scale
Gilson Pipetman P200 & P1000 pipettes
0.2 ml & 1 ml pipette tips
Kimtech Kimwipes
Fisher Scientific Thermix 120 MR magnetic stirrer
Fisher Scientific 10N Sodium Hydroxide (NaOH)
Thermo Scientific Survival Legend T+ centrifuge
50 ml centrifuge tubes
Top Fin AIR-500 aquarium air pump
Top Fin aeration rocks
Panasonic KX-P1150 Multi-Mode Printer
Hach DR5000 spectrophotometer
3.2 Experimental Setup
The following describes the main experimental setup used for the sonication of samples.
Figure 3.1 illustrates the main experimental setup as a schematic and also a photograph of
the actual setup.

47
Figure 3.1 [left] Schematic of experimental setup. (1) NH3 solution or leachate (2) disruptor horn and tip (3) ultrasonic converter (4) protective case (5) adjustable stand (6) 500 ml PP
container. [right] photograph of experimental setup
3.3 Experimental Procedure
This section will outline the procedures used during experimentation, including: general
procedures, synthetic NH3 solution tests, and leachate tests.
3.3.1 pH Adjustment
The pH adjustments were done using 10N NaOH in order to attain the desired pH values of
9, 10, and 11. A Fisher Scientific Accumet Excel XL25 dual channel pH/ion meter was used
to monitor the adjustment process to the nearest tenth of a pH. The sample was stirred at a
48
low speed, 3 on the speed dial, using a magnetic stirrer and magnetic stir bar to evenly
distribute the NaOH within the sample while minimizing NH3 volatilization.
3.3.2 Ammonia Concentration Testing
The following describes the procedure used in order to determine the concentration of
ammonia nitrogen (mg TAN/L as NH3-N) in a given sample.
NH3 testing was carried out using the Hach TNTplus 832 HR testing kit coupled with a Hach
DR5000 spectrophotometer. First, the sample was diluted, 1:100 for a sample with a low
mg TAN/L initial concentration or 1:130 for a sample with a high mg TAN/L initial
concentration, to ensure that the reading would fall within the detection range of the test
kit. Second, the procedure supplied with the testing kit was followed as seen in Figure 3.2
with step 8 using the Hach DR5000 spectrophotometer.

49
Figure 3.2 TNTplus 832 testing method (Hach Company, 2012)
3.3.3 Synthetic Solution Tests
This section outlines the procedures used during the synthetic solution testing which
includes: test design, ammonia solution fabrication, ultrasonic testing, heat testing, and
volatilization testing.
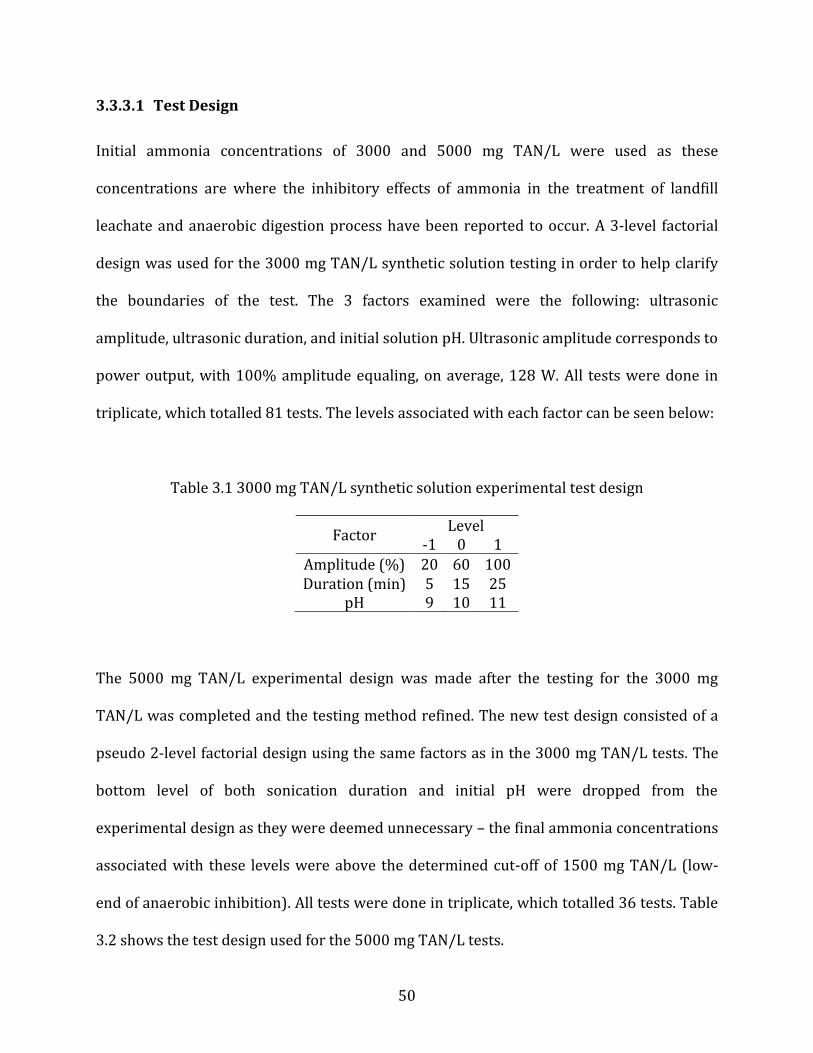
50
3.3.3.1 Test Design
Initial ammonia concentrations of 3000 and 5000 mg TAN/L were used as these
concentrations are where the inhibitory effects of ammonia in the treatment of landfill
leachate and anaerobic digestion process have been reported to occur. A 3-level factorial
design was used for the 3000 mg TAN/L synthetic solution testing in order to help clarify
the boundaries of the test. The 3 factors examined were the following: ultrasonic
amplitude, ultrasonic duration, and initial solution pH. Ultrasonic amplitude corresponds to
power output, with 100% amplitude equaling, on average, 128 W. All tests were done in
triplicate, which totalled 81 tests. The levels associated with each factor can be seen below:
Table 3.1 3000 mg TAN/L synthetic solution experimental test design
Factor Level
-1 0 1
Amplitude (%) 20 60 100 Duration (min) 5 15 25
pH 9 10 11
The 5000 mg TAN/L experimental design was made after the testing for the 3000 mg
TAN/L was completed and the testing method refined. The new test design consisted of a
pseudo 2-level factorial design using the same factors as in the 3000 mg TAN/L tests. The
bottom level of both sonication duration and initial pH were dropped from the
experimental design as they were deemed unnecessary – the final ammonia concentrations
associated with these levels were above the determined cut-off of 1500 mg TAN/L (low-
end of anaerobic inhibition). All tests were done in triplicate, which totalled 36 tests. Table
3.2 shows the test design used for the 5000 mg TAN/L tests.
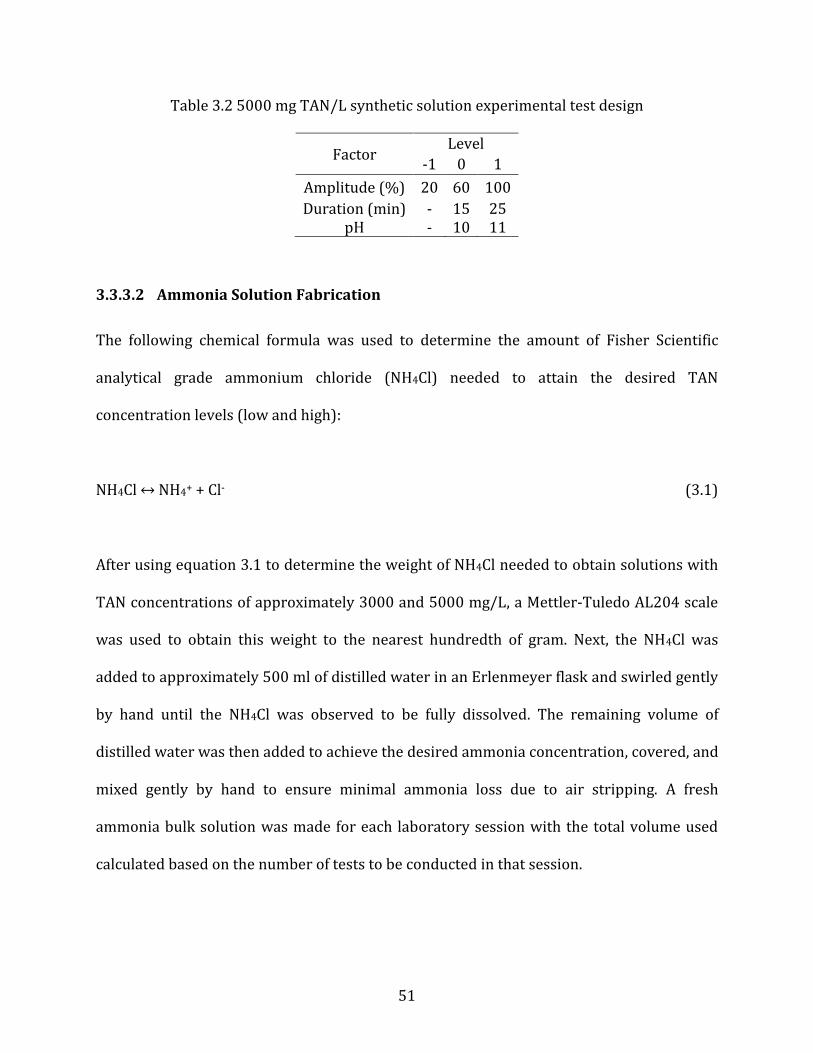
51
Table 3.2 5000 mg TAN/L synthetic solution experimental test design
Factor Level
-1 0 1
Amplitude (%) 20 60 100
Duration (min) - 15 25 pH - 10 11
3.3.3.2 Ammonia Solution Fabrication
The following chemical formula was used to determine the amount of Fisher Scientific
analytical grade ammonium chloride (NH4Cl) needed to attain the desired TAN
concentration levels (low and high):
NH4Cl ↔ NH4+ + Cl- (3.1)
After using equation 3.1 to determine the weight of NH4Cl needed to obtain solutions with
TAN concentrations of approximately 3000 and 5000 mg/L, a Mettler-Tuledo AL204 scale
was used to obtain this weight to the nearest hundredth of gram. Next, the NH4Cl was
added to approximately 500 ml of distilled water in an Erlenmeyer flask and swirled gently
by hand until the NH4Cl was observed to be fully dissolved. The remaining volume of
distilled water was then added to achieve the desired ammonia concentration, covered, and
mixed gently by hand to ensure minimal ammonia loss due to air stripping. A fresh
ammonia bulk solution was made for each laboratory session with the total volume used
calculated based on the number of tests to be conducted in that session.

52
3.3.3.3 Ultrasonic Testing
After being made, the synthetic TAN solution was tested for its ammonia concentration (mg
N-NH3/L) and pH (see 3.3.2 and 3.3.1, respectively). Then, the pH of the solution was
adjusted to one of the initial levels outlined in Table 3.1 and was again tested for its
ammonia concentration (see 3.3.2). Next, approximately 165 ml of the adjusted solution
was transferred to a 500 ml PP container using a Mettler PC4400 DeltaRange scale and the
temperature was recorded. After, the transferred solution was sonicated using a Branson
digital sonifier 450 for one of the three durations and amplitudes in Table 3.1 with the
temperature recorded at completion. The sonicated solution was allowed to cool back
down to its initial temperature and was then weighed to determine the water loss during
sonication. The weight lost in water vapour was then added back to the sonicated solution
using distilled water. Afterwards, the pH was measured then adjusted back to the initial
value (9, 10, or 11) and the final concentration was measured (see 3.3.1 and 3.3.2,
respectively). The pH adjusted ammonia concentration was then compared to the final
ammonia concentration to determine removal efficiency.
3.3.3.4 Heat Volatilization Testing
The same procedure was used as in section 3.3.3.3, however, sonication was replaced by
heating the adjusted solution in a Cole-Parmer Canada Inc. 20L/120V StableTemp hot
water bath in order to replicate the final temperature of a solution after sonication for a
given duration. The hot water bath temperatures used to correspond with each sonication
test and solution are given below:
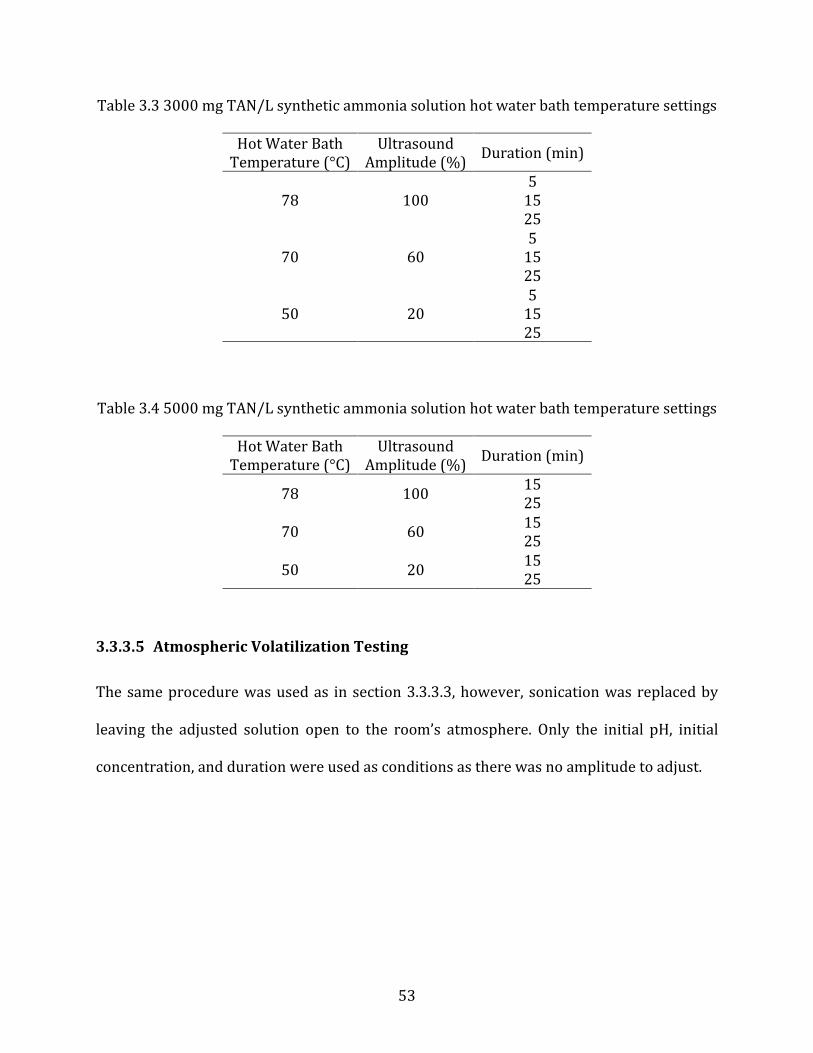
53
Table 3.3 3000 mg TAN/L synthetic ammonia solution hot water bath temperature settings
Hot Water Bath Ultrasound Duration (min)
Temperature (°C) Amplitude (%)
78 100 5
15 25
70 60 5
15 25
50 20 5
15 25
Table 3.4 5000 mg TAN/L synthetic ammonia solution hot water bath temperature settings
Hot Water Bath Ultrasound Duration (min)
Temperature (°C) Amplitude (%)
78 100 15 25
70 60 15 25
50 20 15 25
3.3.3.5 Atmospheric Volatilization Testing
The same procedure was used as in section 3.3.3.3, however, sonication was replaced by
leaving the adjusted solution open to the room’s atmosphere. Only the initial pH, initial
concentration, and duration were used as conditions as there was no amplitude to adjust.
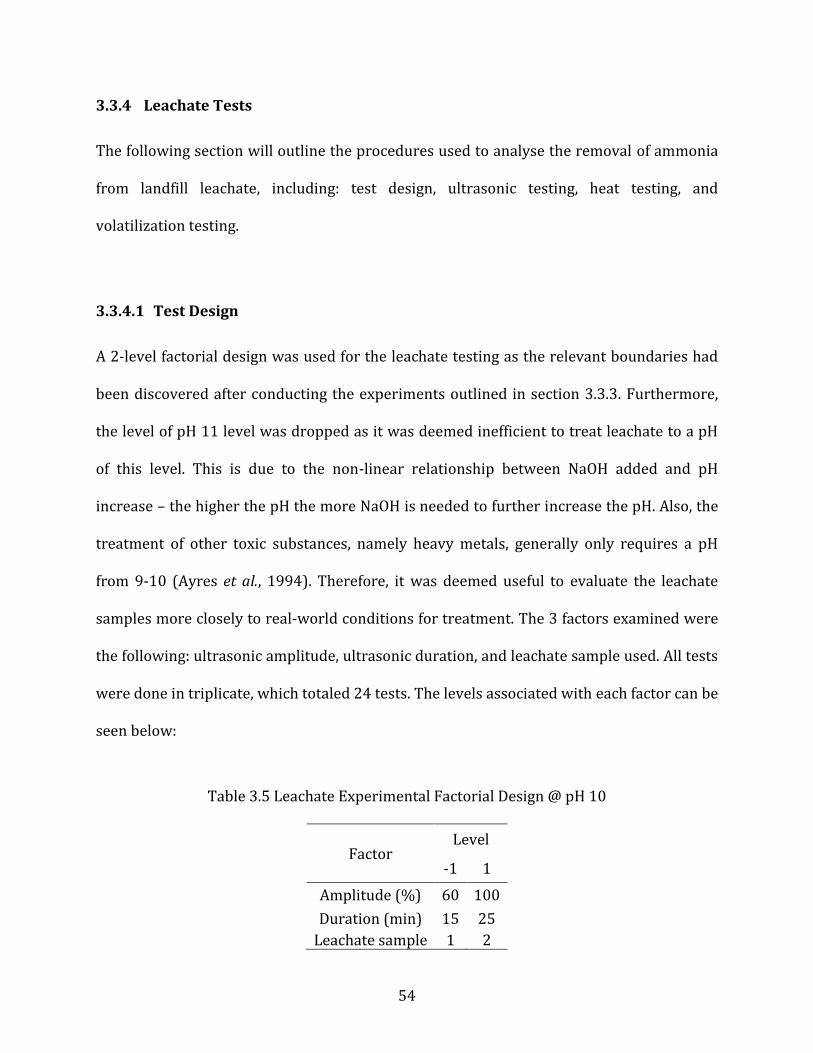
54
3.3.4 Leachate Tests
The following section will outline the procedures used to analyse the removal of ammonia
from landfill leachate, including: test design, ultrasonic testing, heat testing, and
volatilization testing.
3.3.4.1 Test Design
A 2-level factorial design was used for the leachate testing as the relevant boundaries had
been discovered after conducting the experiments outlined in section 3.3.3. Furthermore,
the level of pH 11 level was dropped as it was deemed inefficient to treat leachate to a pH
of this level. This is due to the non-linear relationship between NaOH added and pH
increase – the higher the pH the more NaOH is needed to further increase the pH. Also, the
treatment of other toxic substances, namely heavy metals, generally only requires a pH
from 9-10 (Ayres et al., 1994). Therefore, it was deemed useful to evaluate the leachate
samples more closely to real-world conditions for treatment. The 3 factors examined were
the following: ultrasonic amplitude, ultrasonic duration, and leachate sample used. All tests
were done in triplicate, which totaled 24 tests. The levels associated with each factor can be
seen below:
Table 3.5 Leachate Experimental Factorial Design @ pH 10
Factor Level
-1 1
Amplitude (%) 60 100
Duration (min) 15 25
Leachate sample 1 2
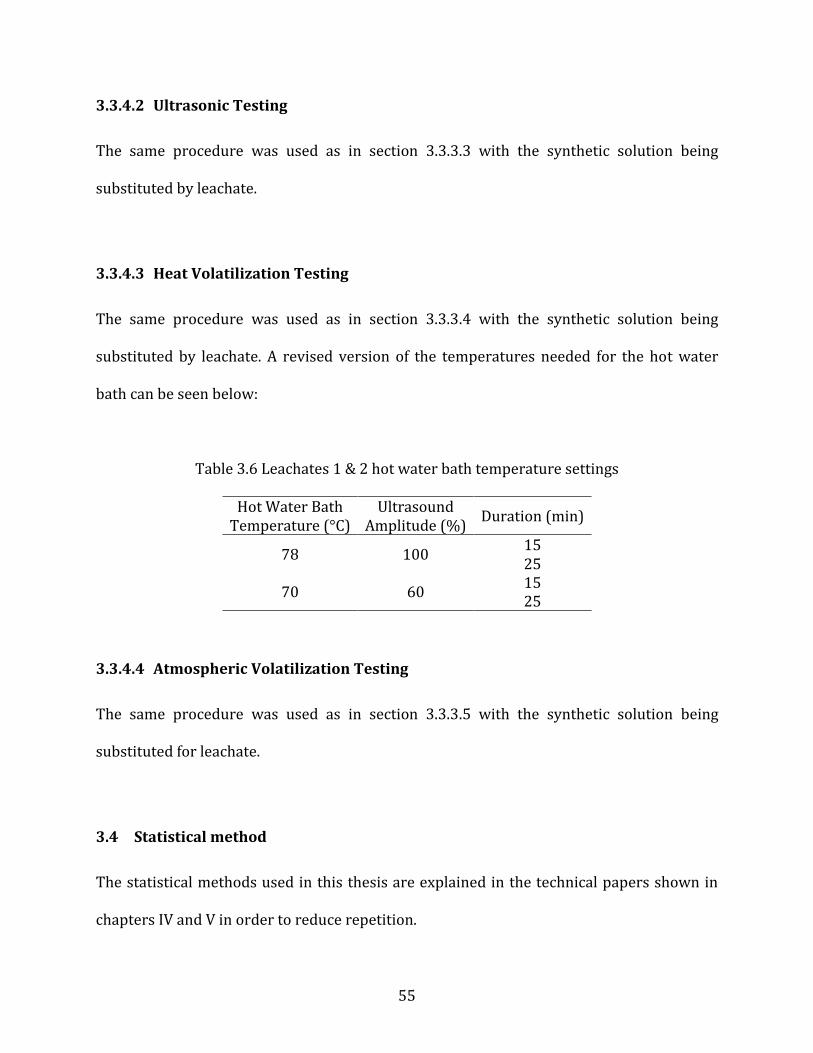
55
3.3.4.2 Ultrasonic Testing
The same procedure was used as in section 3.3.3.3 with the synthetic solution being
substituted by leachate.
3.3.4.3 Heat Volatilization Testing
The same procedure was used as in section 3.3.3.4 with the synthetic solution being
substituted by leachate. A revised version of the temperatures needed for the hot water
bath can be seen below:
Table 3.6 Leachates 1 & 2 hot water bath temperature settings
Hot Water Bath Ultrasound Duration (min)
Temperature (°C) Amplitude (%)
78 100 15 25
70 60 15 25
3.3.4.4 Atmospheric Volatilization Testing
The same procedure was used as in section 3.3.3.5 with the synthetic solution being
substituted for leachate.
3.4 Statistical method
The statistical methods used in this thesis are explained in the technical papers shown in
chapters IV and V in order to reduce repetition.
56
References
Ayres, D.M., Davis, A.P., and Gietka, P.M. (1994). Removing Heavy Metals from Wastewater. Engineering Research Center Report, University of Maryland, August.
Hach Company, 2012. Nitrogen, Ammonia. DOC316.53.01083, Ed. 7, U.S.A.

57
4 CHAPTER IV Technical Paper I
Ammonia Removal from High Concentration Aqueous Solution Using Ultrasonic
Irradiation Process and Statistical Analysis of Operating Parameters and
Thermal/Non-Thermal effects
Majid Sartaj, Andrew Tobalt, Kevin Kennedy, Rania M. Alqaralleh
Abstract
The application of ultrasonic irradiation (20 kHz) technology for removal of ammonia from
aqueous solution with high initial ammonia concentration around 3000 mg/L range where
the inhibitory effects of ammonia in treatment of landfill leachate and anaerobic digestion
process has been reported to occur was investigated under different pH and time duration.
The application of ultrasound over a short period of time (~ 15 min) was proved to be an
effective method for removal of ammonia especially at higher pH values (pH > 10). The
highest ammonia removal of 87.4% was obtained at pH of 11 and 25 min duration. The
ammonia removal increased with increasing pH and sonication time. Statistical analysis of
data demonstrated that improvements observed in increasing sonication time from 5 to 15
min were statistically significant while improvements in increasing sonication time from
15 to 25 min were not significantly different. The contribution of volatilization (samples
being exposed to the air) accounted for less than 7% of the ammonia removal. Thermal
effect of US was responsible for 21.1 - 52.7% of the ammonia removal while non-thermal

58
effect of US mechanism was responsible for 44.5 - 78.8% depending on pH and sonication
time.
Keywords: Ultrasonic Irradiation; Ammonia; Statistical Analysis; pH; Sonication Time
59
4.1 Introduction
Increasing human population, industrialization and the subsequent anthropogenic sources
of pollution such as agricultural, industrial, and municipal wastewaters contribute to the
degradation of water resources (Arabgol et al., 2016; Ozturk, 2015). Discharge of
inadequately treated domestic, industrial and agricultural wastewaters with high
ammonia–nitrogen contents can result in eutrophication and algal blooms, depletion of
dissolved oxygen, and toxicity to fish even at low concentrations in receiving water bodies,
and inhibitory effects on microbial activity of microorganisms responsible for biological
treatment of wastewater (Ozturk & Bal, 2015; Dong & Sartaj, 2016a; Alqaralleh et al., 2015;
Faryadi et al., 2015; Randall & Tsui, 2002; Lee & Chung, 2000). High levels of ammonia in
the body can produce many harmful effects mainly on the central nervous system of
vertebrates, acute ammonia intoxication, and convulsion (Ip & Chew, 2001; Rao et al.,
1992). Some studies have indicated that the presence of high ammonia levels in the brain
may cause higher levels of extracellular glutamate through stimulating glutamate release
while lowering glutamate synaptic reuptake (Randall & Tsui, 2002). Also, it is known that
ammonium ion displaces potassium and depolarizes neurons which in excess causes
abnormally high activation of NMDA type glutamate receptors; this leads to cell death in
the central nervous system due to the influx of excess calcium (Ip et al., 2001).
Total ammonia nitrogen (TAN) exists in liquid phase either in unionized form (NH3) or
ionized form (NH4), with toxicity being mainly attributed to NH3 form (Nair et al., 2014;
Clement & Merlin, 1995). Free ammonia (NH3) can traverse most biological membranes
while ionized ammonia (NH4) cannot; this is the reason NH3 is much more toxic than NH4
.

60
NH3 is a volatile compound with a boiling point of -33.4C and, like other volatile
compounds, is sensitive to pressure and temperature changes (Chang & Cruickshank,
2005). The NH3/NH4 equilibrium (pKa of NH4
is 9.25 at standard conditions) also
depends on pH; the higher the pH of a solution or more basic, the higher the concentration
of NH3 (Ding & Sartaj, 2016; Benjamin, 2002). USEPA fresh water quality criteria for
ammonia have been set at 17 mg TAN/L (acute) and 1.9 mg TAN/L (chronic) at a pH of 7
and temperature of 20 ℃ (USEPA, 2013). Canadian Environmental Protection Agency has
set the maximum concentration of un-ionized ammonia in the effluent from any
wastewater treatment plant with an average daily discharge greater than 100 m3 to 1.25
mg/L as NH3–N at (15±1℃) (Canada Gazette, 2012).
The leachate generated in landfills may contain a variety of different pollutants including
ammonia. Landfill leachate varies in strength and composition depending on several
factors, but the most significant ones are: the age of the landfill, composition of waste, and
design and operation of landfill and moisture management in particular (Sartaj et al., 2010;
Renou et al., 2008; Wang et al., 2008). Ammonia is mainly produced during the anaerobic
biodegradation of organic fraction of solid waste. The only removal path for ammonia in a
landfill is by extraction of the produced leachate, as there is no mechanism for its
degradation under methanogenic conditions (Burton & Watson-Craik, 1998). Recirculating
leachate, nowadays practiced in many landfills, in fact could increase the rate of
ammonification, resulting in accumulation of higher levels of NH3, which intensifies the
toxicity of the leachate (Yenigün & Demirel, 2013; Berge et al., 2006). A German study was
conducted on 50 landfills; the results show no significant decrease of ammonia

61
concentrations up to 30 years after a landfill’s closure (Ehrig, 1989). With this in mind,
coupled with potentially high concentrations, it should be no surprise that ammonia is
considered to be the most significant long-term pollutant found in landfill leachate (Dong &
Sartaj, 2016b; Belevi & Baccini, 1989; Robinson, 1995). Table 4.1 presents the ammonia
concentrations from a few selected landfill sites being categorized as young, mature, and
old. As it can be seen, the range of ammonia concentration is very wide covering a range of
a few hundreds to more than 10000 mg/L.
Table 4.1 Ammonia concentrations in landfill sites
Age Landfill Site Ammonia-N (mg/L) Reference
Y China, Hong Kong 760-11000 (Lo, 1996) Y Italy 5210 (Lopez et al., 2004) Y Turkey 1120-2500 (Timur & Özturk, 1999) MA Poland 750 (Neczaj et al., 2007) MA Taiwan 5500 (Wu et al., 2004)
MA Iran 864-2056 (Kheradmand et al., 2010) O Brazil 800 (Silva et al., 2004) O Finland 330-560 (Marttinen et al., 2002) O Turkey 1590 (Uygur & Kargi, 2004)
Y: young MA: mature O: old
Presence of ammonia in leachate is important from several different perspectives: meeting
the discharge criteria; the inhibitory effect on biological treatment of leachate; and the
inhibitory effect on anaerobic digestion process and biogas production within the landfill.
Li and Zhao (1999) found that progressively increasing ammonia concentrations from 50
to 800 mg NH4-N/L caused chemical oxygen demand (COD) removal in landfill leachate to
decline from 95 to 79% along with a decrease in the dehydrogenase activity of the sludge.
Lee et al. (2000) reported EC50 values (concentration of ammonia at which microbial

62
activity reduced by 50%) of 2500 and 2700 TAN/L for ammonia inhibition of microbial
activity of nitrifying and heterotrophic bacteria, respectively, in biological wastewater
treatment. Hansen et al. (1998) reported that concentrations of ammonia in recirculated
leachate in doses as low as 1100 mg NH3-N/L and a pH of 8 could inhibit anaerobic
bacterial activity while Liu et al. (2012) reported that TAN concentrations of 1500-3000
mg/L had inhibitory effect on anaerobic biodegradation of landfill leachates. Kayhanian
(1994) and Akindele and Sartaj (2016) also reported that an inhibition of anaerobic
biodegradation organic fraction of municipal solid waste occurred at 1000 and 2500 mg/L
ammonia concentration, respectively. Compounding the aforementioned toxic effects is the
fact that ammonia has the potential to inhibit biological treatment processes.
As discussed above, ammonia removal from wastewater has become a crucial issue, and
the application of different removal strategies at reasonable costs as treatment or pre-
treatment methods have been one of the main leachate management research topics in
recent years. Conventional treatment processes to remove ammonia from aqueous solution
include biological treatment, microwave radiation, air stripping, chemical precipitation,
adsorption/ion-exchange, and ultrasonic irradiation (Ozturk & Bal, 2015; Dong & Sartaj,
2016a; Wang et al., 2008; Dong & Sartaj, 2016b; Huang et al., 2014; Lin et al., 2009; Matouq
& Al-Anber, 2007). Traditional biological processes including nitrification and
denitrification are considered cost efficient, but unfortunately they do not perform
efficiently in the case of high ammonia concentration or with shock ammonia loading
(Huang et al., 2014; Lin et al., 2009; Matouq & Al-Anber, 2007; Karadag, 2006). Dong and
Sartaj (2016a & 2016b) examined the effect of microwave radiation followed by aeration
63
on ammonia removal from synthetic solutions (initial TAN concentration of 2700 mg/L)
and leachate (initial TAN concentration of 4000 mg/L); they found that the proposed
method was effective at removing up to 82% and 70% of the ammonia from synthetic
solutions and leachate, respectively, at an optimum pH of 11. Air stripping provides
satisfactory removal efficiency but only under high pH conditions where most of the
ammonia is in the NH3 (unionized) form (Marttinen et al., 2002; Ferraz et al., 2016). Ding
and Sartaj (2015 & 2016) reported high efficiency for ammonia removal by zeolite (up to
87%) and ion-exchange resin (up to 84%) at an initial ammonia concentration of 1000 mg
TAN/L and neutral pH. Huang et al. (2014) examined the ammonia removal from landfill
leachate by struvite precipitation using waste phosphoric acid as the phosphate source, the
results showed up to 83% ammonia removal. While chemical precipitation is an effective
means of removing ammonia from wastewater and leachate it requires a constant input of
chemicals, which can be costly. Also, chemical precipitation produces large amounts of
solid waste (sludge) and the precipitate formed has high concentrations of ammonia.
Ultrasonic irradiation has been studied and shown to be a promising technology for
removing high concentration of ammonia from aqueous solution. Compared with
conventional methods, ultrasonication can bring several benefits such as environmentally
friendly (no toxic chemicals are used or produced), low cost, selectivity and compact
(allowing on-site treatment). Contrary to other processes which are negatively affected by
presence of suspended solids, US efficiency may even be improved by increase of turbidity
or suspended solids. In aqueous solution Ultrasound (US) application lead to formation of
cavitation bubbles. Subsequent collapse of cavitation bubbles produces intense local

64
heating (4200 - 5000 K) and pressure (up to 1000 atm) over a short period of time, which
cause high energy chemical reactions (generation of free radicals) to occur and to break
and decompose some compounds (Ozturk & Bal, 2015; Wang et al., 2008; Matouq & Al-
Anber, 2007; Deng & Zhao, 2015; Mahvi, 2009; Sivasankar & Moholkar, 2009; Ince et al.,
2001; Pham et al., 2009). The generated free radicals are involved in the rapid oxidation of
organic and inorganic matters and degradation of complex compounds in solution (Ozturk
& Bal, 2015). Wang et al. (2008) reported that the main mechanism of ammonia nitrogen
reduction from aqueous solution by US appeared to be the entry of ammonia molecules
into the cavitation bubbles and the transformation into nitrogen molecules and hydrogen
molecules via pyrolysis. However, Ozturk and Bal (2015) concluded that the main
mechanism of ammonia removal was advanced oxidation of ammonia–nitrogen by
hydroxyl radicals.
Matouq and Al-Anber (2007) studied the effect of a high US frequency (using 1.7 and 2.4
MHz) on ammonia removal from industrial wastewater with three different ammonia
concentrations namely 5%, 15% and 25% (vol. %); they found that the optimum condition
for ammonia removal was achieved for the solution with 5% ammonia concentration and
0.080L liquid volume. Under these conditions 31.7% and 25.7% ammonia removal was
reported at 2.4 MHz and 1.7 MHz respectively. They also reported that optimum liquid
height was 0.0165 m and approximately 31% of ammonia removal was achieved within 90
minutes at a radiation of 2.4 MHz. Due to the limitation of ultrasound penetration ability, as
the height of liquid increases, the ammonia removal efficiency decreases.
Ozturk and Bal (2015) investigated the effect of initial concentration, initial pH, US power

65
density and sonication period on the efficiency of ammonia removal from aqueous
solutions by ultrasonic irradiation. Depending on initial conditions removal efficiencies
varied between 8 - 64%. Ammonia removal efficiency increased with increasing power
density, sonication period (over a range of 1 - 10 min) and pH, but decreased with
increasing initial concentration (over a range of 5.6 - 415 mg/L).
Wang et al. (2008) investigated the removal of ammonia from an old landfill leachate by a
combined US and aeration process. The leachate contained 680 mg/L TAN and had a pH of
8.1. Ammonia removal increased with increasing power and pH of the solution. After 180
min of processing at a power input of 200 W and a pH of 11, the removal efficiency for the
combination of ultrasound irradiation and aeration reached 96%. The removal efficiency at
pH 11 was approximately eight times as high that of pH 3.
Considering the above, the main objective of this study was to investigate the application of
US technology for removal of ammonia from aqueous solution with high initial ammonia
concentration around 3000 mg/L where the inhibitory effects of ammonia in treatment of
landfill leachate and anaerobic digestion process has been reported to occur. Additionally,
it was intended to assess the contribution of thermal and non-thermal effects as well as the
effect of irradiation duration, pH, and power input through statistical analysis of the data.
4.2 Materials and Methods
To achieve the objectives a series of batch tests were carried out. All tests were carried out
in triplicate. The synthetic solution of approximately 3000 mg TAN/L (approximately 2,470

66
mg/L as NH3-N) was prepared by dissolving analytical grade ammonium chloride (NH4Cl)
in distilled water; after the NH4Cl was observed to be fully dissolved the remainder of
distilled water was added to achieve the desired ammonia concentration. A fresh ammonia
bulk solution was made for each laboratory session with the total volume used calculated
based on the number of tests to be conducted. The order of experimental activities for each
test is shown in Figure 4.1. For each test, 165 mL of ammonia synthetic solution was added
to a 500 mL beaker, with a removable lid used during the cooling stage to limit water loss,
which was placed on top of a height adjustable stand, to achieve a desired disruptor horn
tip depth of 165 mm (Matouq & Al-Anber, 2007). The pH of solution was then adjusted to
the desired initial pH (9, 10, or 11) using a 10 N NaOH solution. After pH adjustment, initial
TAN, pH, and temperature of the sample were measured. Afterwards, the sample was
exposed to US irradiation using Branson digital sonifier 450 with a ½” disruptor horn and
½” disruptor tip for the desired duration (5, 10, or 25 minutes). The schematic and a
photograph of the experimental setup are illustrated in Figure 4.2. The US vibration was
generated by a 20 kHz ultrasonic converter and was transferred into the ammonia solution
by putting the US probe into it. The power output could be adjusted from 10 to 100% in 5%
increments and ranged from 0 to 400 W. Temperature was measured immediately after
this stage. The sample was allowed to cool to room temperature before distilled water was
added to account for water loss. TAN and pH were measured again and energy output
recorded (kJ).

67
Figure 4.1 Experimental Flow-chart
In order to study the amount of ammonia removed due to temperature rise during the
process, heat only experiments were conducted. This method involved the same procedure
outlined above; however, instead of being sonicated, the samples were placed into a 20
L/120 V Stable Temp hot water bath (Cole-Parmer Canada Inc.) set at a temperatures that
correlated to the final temperatures achieved after sonication for the desired durations.
The hot water bath temperatures used for sonication test were 52, 72, and 72°C
corresponding to 5, 15, and 25 min sonication duration. The contribution of evaporation on
the ammonia removal was also investigated by leaving some samples open to the
surrounding atmosphere instead of being heated in water bath or sonicated.

68
Figure 4.2 [left] Schematic of experimental setup. (1) NH3 solution (2) disruptor horn and tip (3) ultrasonic converter (4) case (5) stand. [right] Photograph of experimental setup
4.3 Results and Discussion
The ammonia removal efficiency was calculated using the Equation below:
TAN removal (%) = C0− Ce
C0 × 100% (4.1)
where Co is the initial (after pH adjustment) and Ce is equilibrium TAN concentration
(mg/L), respectively.
The results of the experiments are shown in Figure 4.3, where data points represent the
average of triplicates. As it can be noticed the ammonia removal efficiency increased with
increasing pH and duration. The lowest and highest ammonia removal observed among all
the different conditions were 8% at pH of 9 and 5 min duration and 87.4% at pH of 11 and
25 min duration respectively. The above results show that application of US over a short
69
period of time (~ 15 min) could be an effective method for removal of ammonia at higher
pH values (pH > 10). Ozturk and Bal (2015) reported lower TAN removals (8 - 64%) at
lower initial concentration (5.6 - 415 mg/L) and shorter sonication period (1 - 10 min)
while Wang et al. (2008) reported high ammonia removal (96%) but with a time duration
of 180 min at 680 mg/L TAN. Ozturk and Bal (2015) also reported that ammonia removal
increased (18 - 64%) with sonication time (1 to 10 min) following a linear trend. The
increase of removal efficiency at higher pH levels could be explained by the equilibrium
shift between the two types of ammonia (NH3 and NH4), in aqueous solutions at higher pH
levels the presence of NH3 was favored compared to NH4, and the presence of more NH3
molecules that were preferred by oxidation and/or pyrolysis, should ultimately lead to a
higher removal efficiency. It was suggested that ammonium ions do not vaporize into the
cavitation bubble, however, free ammonia can vaporize into cavitation bubbles and react
inside by thermal cleavage. Hence a higher pH would enhance the ammonia removal during
US process (Ozturk & Bal, 2015; Wang et al., 2008).
It can be seen that larger improvements in TAN removal were obtained by increasing US
duration from 5 to 15 minutes (4.3 – 41.4%) compared to increasing it from 15 to 25
minutes (1 – 5.4%). Further statistical analysis of data proved that improvements observed
in increasing sonication time from 15 to 25 min were not statistically significant. These
improvements was more obvious at higher pH values, i.e. at pH 11 compared to pH 9
(41.4% vs. 5.4%). Thus it was decided to further explore this by statistical analysis of data.
The first step of statistical analysis was performed using a two-way ANOVA to determine
whether differences between TAN removal efficiencies at different pH and durations were
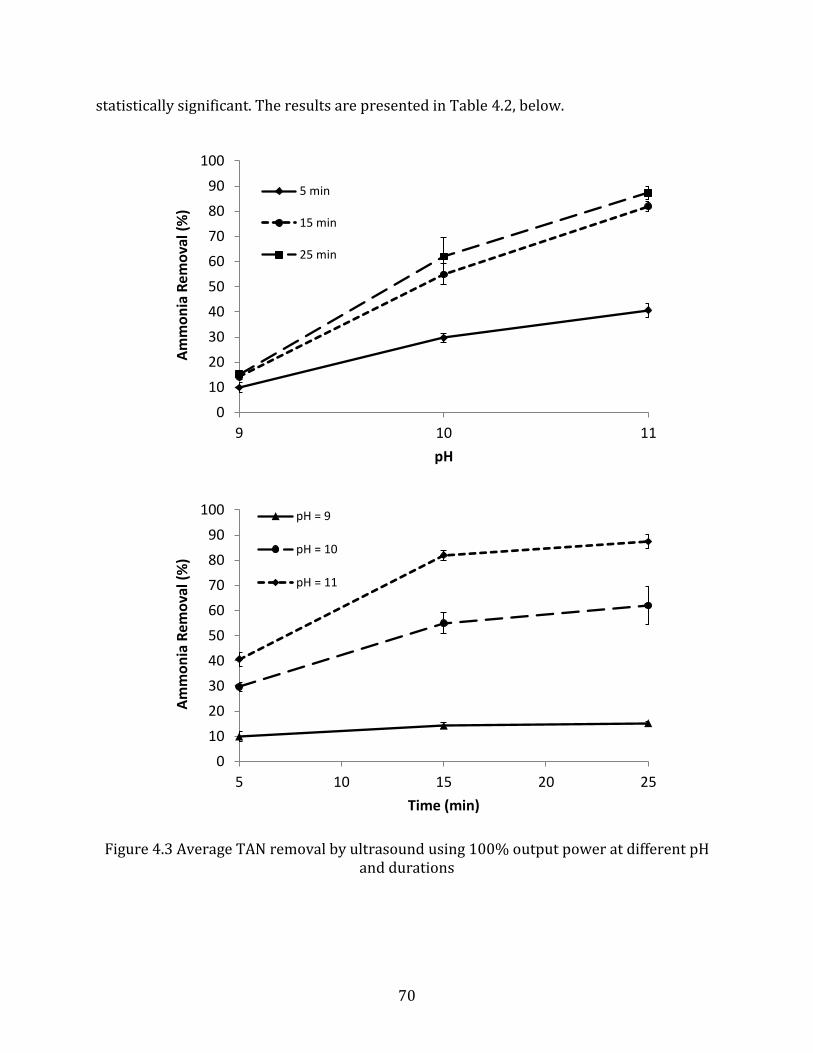
70
statistically significant. The results are presented in Table 4.2, below.
Figure 4.3 Average TAN removal by ultrasound using 100% output power at different pH and durations
0
10
20
30
40
50
60
70
80
90
100
9 10 11
Am
mo
nia
Rem
ova
l (%
)
pH
5 min
15 min
25 min
0
10
20
30
40
50
60
70
80
90
100
5 10 15 20 25
Am
mo
nia
Rem
ova
l (%
)
Time (min)
pH = 9
pH = 10
pH = 11
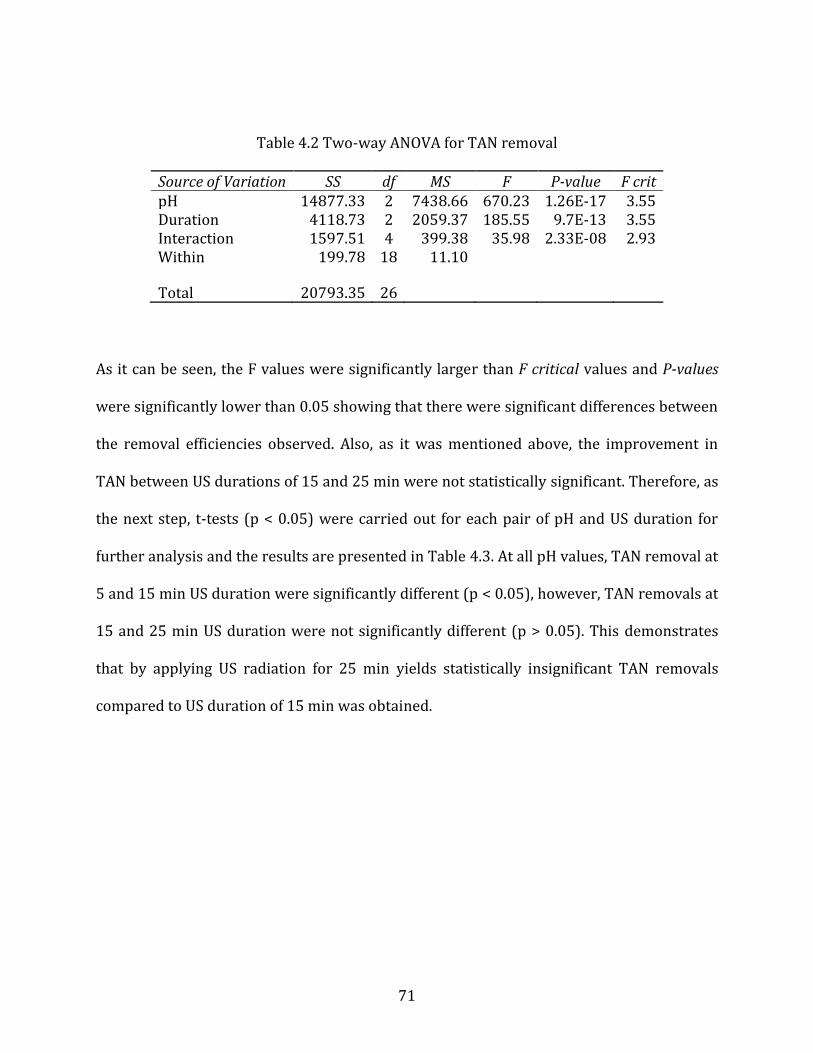
71
Table 4.2 Two-way ANOVA for TAN removal
Source of Variation SS df MS F P-value F crit pH 14877.33 2 7438.66 670.23 1.26E-17 3.55 Duration 4118.73 2 2059.37 185.55 9.7E-13 3.55 Interaction 1597.51 4 399.38 35.98 2.33E-08 2.93 Within 199.78 18 11.10
Total 20793.35 26
As it can be seen, the F values were significantly larger than F critical values and P-values
were significantly lower than 0.05 showing that there were significant differences between
the removal efficiencies observed. Also, as it was mentioned above, the improvement in
TAN between US durations of 15 and 25 min were not statistically significant. Therefore, as
the next step, t-tests (p < 0.05) were carried out for each pair of pH and US duration for
further analysis and the results are presented in Table 4.3. At all pH values, TAN removal at
5 and 15 min US duration were significantly different (p < 0.05), however, TAN removals at
15 and 25 min US duration were not significantly different (p > 0.05). This demonstrates
that by applying US radiation for 25 min yields statistically insignificant TAN removals
compared to US duration of 15 min was obtained.
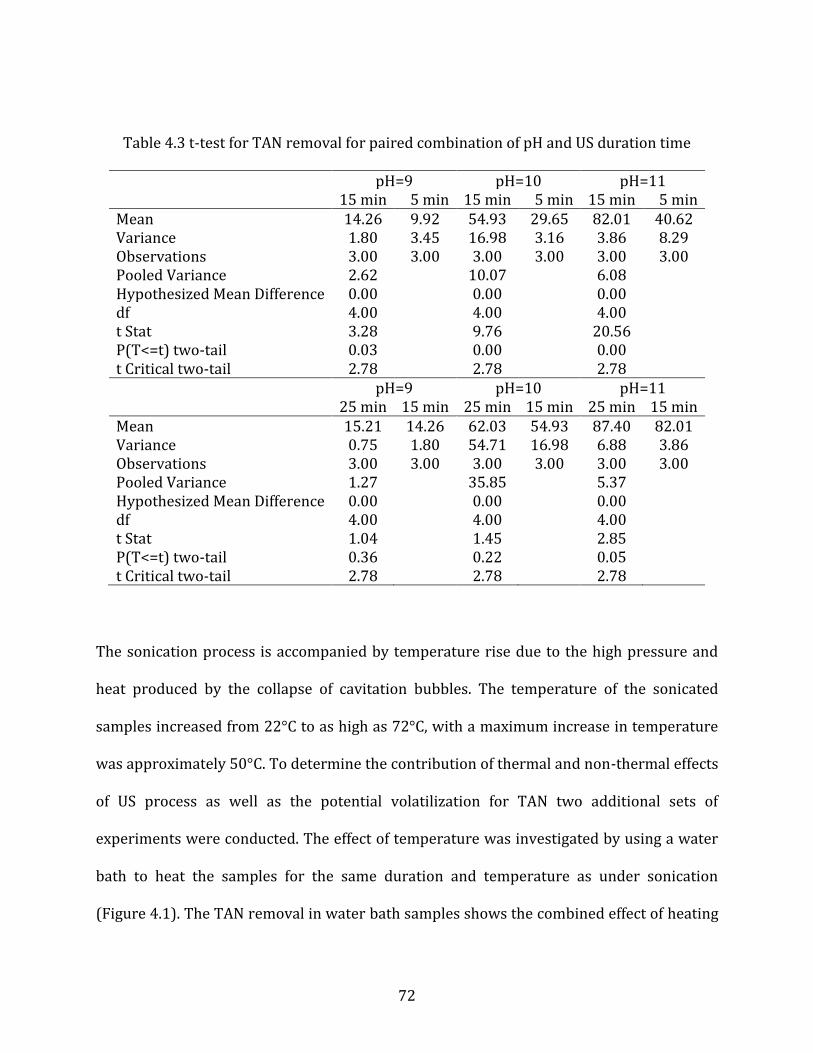
72
Table 4.3 t-test for TAN removal for paired combination of pH and US duration time
pH=9 pH=10 pH=11
15 min 5 min 15 min 5 min 15 min 5 min
Mean 14.26 9.92 54.93 29.65 82.01 40.62 Variance 1.80 3.45 16.98 3.16 3.86 8.29 Observations 3.00 3.00 3.00 3.00 3.00 3.00 Pooled Variance 2.62
10.07
6.08
Hypothesized Mean Difference 0.00
0.00
0.00 df 4.00
4.00
4.00
t Stat 3.28
9.76
20.56 P(T<=t) two-tail 0.03
0.00
0.00
t Critical two-tail 2.78
2.78
2.78
pH=9 pH=10 pH=11
25 min 15 min 25 min 15 min 25 min 15 min
Mean 15.21 14.26 62.03 54.93 87.40 82.01 Variance 0.75 1.80 54.71 16.98 6.88 3.86 Observations 3.00 3.00 3.00 3.00 3.00 3.00 Pooled Variance 1.27
35.85 5.37
Hypothesized Mean Difference 0.00
0.00
0.00 df 4.00
4.00
4.00
t Stat 1.04
1.45
2.85 P(T<=t) two-tail 0.36
0.22
0.05
t Critical two-tail 2.78
2.78
2.78
The sonication process is accompanied by temperature rise due to the high pressure and
heat produced by the collapse of cavitation bubbles. The temperature of the sonicated
samples increased from 22°C to as high as 72°C, with a maximum increase in temperature
was approximately 50°C. To determine the contribution of thermal and non-thermal effects
of US process as well as the potential volatilization for TAN two additional sets of
experiments were conducted. The effect of temperature was investigated by using a water
bath to heat the samples for the same duration and temperature as under sonication
(Figure 4.1). The TAN removal in water bath samples shows the combined effect of heating
73
and volatilization and by subtracting this concentration from the TAN removal obtained in
samples treated with US irradiation, it is possible to estimate the sonication or non-thermal
effect. Results are presented in Figure 4.4.
With the exception of the tests with pH 11 and duration of 25 min, contribution from non-
thermal effect was higher than thermal and volatilization effects, especially at higher pH
values. The least TAN removal contribution came from volatilization. In fact, at pH of 9 and
US duration of 5 min, TAN removal contribution by volatilization is negligible. These results
were converted to percentages of total TAN removal for each case and are illustrated as pie
charts in Figure 4.5. It can be noticed that the contribution of volatilization (samples being
exposed to the air) only accounts for 0.0 to 6.6 % of the ammonia removal, with a general
increasing trend with increasing pH and duration. It is clear that the contribution of this
mechanism is minor compared to the other two mechanisms, i.e. thermal and non-thermal
effects of US treatment. On the other hand, 21.2 - 33.2%, 21.1 - 39.3%, and 28.9 - 52.7% of
the TAN in the aqueous solution was removed after 5, 15 and 25 minutes, respectively,
because of the thermal effect of increased temperature, showing an increasing trend with
increasing pH. This again could be explained by the effect of pH on distribution of ammonia
species favoring NH3. Moreover, as the cavitation bubbles were created by sonication, the
NH3 was broken down by US mechanisms which contributed 44.5 - 78.8%, 66.6 - 73.8%,
and 62.9 - 70.7% of TAN removal at 5, 15 and 25 minutes duration, respectively,
representing the main removal mechanism in this experiment.

74
Figure 4.4 Average TAN removal by non-thermal (US), thermal (WB), volatilization (Volat.) at 5 min (top), 15 min (middle) and 25 min (bottom)
0
10
20
30
40
50
60
70
80
90
9 10 11
TAN
rem
ova
l (%
)
pH
TOTAL
US
WB
Volat.
0
10
20
30
40
50
60
70
80
90
9 10 11
TAN
rem
ova
l (%
)
pH
TOTAL
US
WB
Volat.
0
10
20
30
40
50
60
70
80
90
9 10 11
TAN
rem
ova
l (%
)
pH
TOTAL
US
WB
Volat.

75
TOTAL refers to TAN removal obtained in samples treated by US; WB refers to TAN
removal obtained in samples treated by water bath; US refers to the difference between
TOTAL and WB or the non-thermal (sonication) effect; and Volat. refers to the effect of
volatilization which was obtained for a set of samples exposed to the air with no treatment
for the same duration corresponding to US tests.
Figure 4.5 Percentage of TAN removal by non-thermal (US), thermal (WB), and volatilization (Volat.) at different pH and time duration

76
4.4 Conclusions
The experimental results showed ammonia can be effectively removed by US irradiation
from a synthetic solution with high ammonia concentration. The highest removal reached
in this study was 87.4% achieved at pH 11 and sonication duration of 25 minutes. High pH
conditions were preferred for the ammonia removal by US processes. Removal efficiency
increased with increasing the aqueous solution pH, the optimum pH for the current study
was found to be 11. Also, ammonia removal increased with increasing time duration of US
application, however, after reaching a certain point no further removal was observed and
extending the time would be a waste of energy as TAN removals at 15 and 25 min US
duration were not statistically different. Among the 3 mechanisms considered for ammonia
removal, i.e., thermal and non-thermal effects of US and volatilization to air, volatilization
had the least contribution while non-thermal effects of US had the highest contribution for
ammonia removal. This suggested that the main cause of ammonia molecule removal
during the sonication process was due to the breaking of the ammonia molecule by the high
temperature and pressure in the cavitation bubbles created by the US irradiation.
Acknowledgements
Financial support provided by Ontario Research Fund-Research Excellence (ORF-RE02-
007) is acknowledged and appreciated.
77
References
Alqaralleh, R., Delatolla, R., and Kennedy, K. (2015). Anaerobic digestion of simulated-organic fraction of municipal solid waste : effect of alkaline pretreatment. Int. J. Environment and Waste Management, 16, 166–185.
Akindele, A.A. and Sartaj, M. (2016). The toxicity effects of ammonia on anaerobic digestion
of organic fraction of municipal solid waste. Sixth International Symposium on Energy from Biomass and Waste, Venice, Italy, November.
Arabgol, R., Sartaj, M., and Asghari, K. (2016). Predicting Nitrate Concentration and Its
Spatial Distribution in Groundwater Resources Using Support Vector Machines (SVMs) Model. Environmental Modeling & Assessment, 21, 71-82.
Belevi, H. and Baccini, P. (1989). Long-term behavior of municipal solid waste landfills.
Waste Management and Research, 7, 43-56. Benjamin, M.M. (2002). Water Chemistry, 1st ed., McGraw-Hill, New York, NY, USA. Berge, N.D., Reinhart, D.R., Dietz, J., and Townsend, T. (2006). In situ ammonia removal in
bioreactor landfill leachate. Waste Management, 26, 334–343. Burton, S.A.Q. and Watson-Craik, I.A. (1998). Ammonia and nitrogen fluxes in landfill sites:
applicability to sustainable landfilling. Waste Management and Research, 16, 41-3. Canada Gazette (2012). Wastewater Systems Effluent Regulations. Canada Gazette, Part II,
July. Chang, R. and Cruickshank, B. (2005). Chemistry, 8th ed., McGraw-Hill, New York, NY, USA. Clement, B. and Merlin, G. (1995). The contribution of ammonia and alkalinity to landfill
leachate toxicity to duckweed. The Science of the Total Environment, 170, 71-79. Deng, Y. and Zhao, R. (2015). Advanced Oxidation Processes (AOPs) in Wastewater
Treatment. Current Pollution Reports, 1, 167–176. Ding, Y. and Sartaj, M. (2015). Statistical analysis and optimization of ammonia removal
from aqueous solution by zeolite using factorial design and response surface methodology. Journal of Environmental Chemical Engineering, 3, 807-814.
Ding, Y. and Sartaj, M. (2016). Optimization of ammonia removal by ion-exchange resin using
response surface methodology. International Journal of Environmental Science and Technology, 13, 985-994.

78
Dong, S. and Sartaj, M. (2016a). Statistical analysis of thermal and non-thermal effects of sequential microwave/aeration process for the removal of ammonia from aqueous solution. Desalination and Water Treatment, 57, 20005-20015.
Dong, S. and Sartaj, M. (2016b). Statistical analysis and optimization of ammonia removal
from landfill leachate by sequential microwave/aeration process using factorial design and response surface methodology. Journal of Environmental Chemical Engineering, 4, 10-108.
Ehrig, H.J. (1989). Water and element balances of landfills. The Landfill. P. Baccini (ed.),
Springer Berlin Heidelberg. Faryadi, M., Rahimi, M., Moradi, N., and Safari, S. (2015). Ammonia removal using 1.7 MHz
high frequency ultrasound in batch and novel dam-weir falling systems. Desalination and Water Treatment, 54, 3412–3421.
Ferraz, F.M., Povinelli, J., and Vieira, E.M. (2016). Ammonia removal from landfill leachate by
air stripping and absorption. Environmental Technology, 34, 2317–2326. Hansen, K.H., Angelidaki, I., and Ahring, B. K. (1998). Anaerobic digestion of swine Manure:
inhibition of ammonia. Water Research, 32, 5-12. Huang, H., Xiao, D., Zhang, Q., and Ding, L. (2014). Removal of ammonia from landfill
leachate by struvite precipitation with the use of low-cost phosphate and magnesium sources. Journal of Environmental Management, 145, 191–198.
Ince, N.H., Tezcanli, G., and Belen, R. K. (2001). Ultrasound as a catalyzer of aqueous reaction
systems : the state of the art and environmental applications. Applied Catalysis B: Environmental 29, 167–176.
Ip, Y. K. and Chew, S. F. (2010). Ammonia production, excretion, toxicity, and defense in fish: a
review. Frontiers in Physiology, 1, 1-20. Ip, Y.K., Chew, S.F., and Randall, D.J. (2001). Ammonia toxicity, tolerance, and excretion. Fish
Physiology, 20, 109-148. Karadag, D., Koc, Y., Turan, M., and Armagan, B. (2006). Removal of ammonium ion from
aqueous solution using natural Turkish clinoptilolite. Journal of Hazardous Materials, 136, 604-609.
Kayhanian, M. (1994). Performance of a High-Solids Anaerobic Digestion Process Under
Various Ammonia Concentrations. J. of Chemical Technology and Biotechnology, 59, 349- 352.
79
Kheradmand, S., Jashni, A.K., and Sartaj, M. (2010). Treatment of municipal landfill leachate using a combined anaerobic digester and activated sludge system. Waste Management, 30, 1025-1031.
Lee, S.M., Jung, J.Y., and Chung, Y.C. (2000). Measurement of ammonia inhibition of microbial
activity in biological wastewater treatment process using dehydrogenase assay. Biotechnology Letters, 22, 991-994.
Li, X. and Zhao, Q. (1999). Inhibition of microbial activity of activated sludge by ammonia in
leachate. Environment International, 25, 961-968. Lin, L., Yuan, S., Chen, J., Xu, Z., and Lu, X. (2009). Removal of ammonia nitrogen in
wastewater by microwave radiation. Journal of Hazardous Materials, 161, 1063-1068. Liu, J., Luo, J., Zhou, J., Liu, Q., Qian, G., and Xu, Z.P. (2012). Inhibitory effect of high-strength
ammonia nitrogen on bio-treatment of landfill leachate using EGSB reactor under mesophilic and atmospheric conditions. Bioresource Technology, 113, 239-243.
Lo, I.M.C. (1996). Characteristics and treatment of leachates from domestic landfills.
Environment International, 22, 433-442. Lopez, A., Pagano, M., Volpe, A., and Claudio Di Pinto, A. (2004). Fenton’s pre-treatment of
mature landfill leachate. Chemosphere, 54, 1005-1010. Mahvi, A.H. (2009). Application of Ultrasonic Technology for Water and Wastewater
Treatment. Iranian J Publ Health, 38, 1-17. Marttinen, S.K., Kettunen, R.H., Sormunen, K.M., Soimasuo, R.M., and Rintala, J.A. (2002).
Screening of physical–chemical methods for removal of organic material, nitrogen and toxicity from low strength landfill leachates. Chemosphere, 46, 851-858.
Matouq, M.A.D. and Al-Anber, Z.A. (2007). The application of high frequency ultrasound
waves to remove ammonia from simulated industrial wastewater. Ultrasonics Sonochemistry, 14, 393-397.
Nair, A., Sartaj, M., Kennedy, K., and Coelho, N.M. (2014). Enhancing biogas production from
anaerobic biodegradation of the organic fraction of municipal solid waste through leachate blending and recirculation. Waste Management and Research, 32, 939-946.
Neczaj, E., Kacprzak, M., Lach, J., and Okoniewska, E. (2007). Effect of sonication on
combined treatment of landfill leachate and domestic sewage in SBR reactor. Desalination, 204, 227–233.
Ozturk, E. and Bal, N. (2015). Evaluation of ammonia–nitrogen removal efficiency from
aqueous solutions by ultrasonic irradiation in short sonication periods. Ultrasonics Sonochemistry, 26, 422-427.

80
Pham, T.D., Shrestha, R.A., Virkutyte, J., and Sillanpaa, M. (2009). Recent studies in environmental applications of ultrasound. Canadian Journal of Civil Engineering, 36, 1849–1858.
Randall, D. and Tsui, T. (2002). Ammonia toxicity in fish. Marine Pollution Bulletin, 45, 17-
23. Rao, V.R., Murthy, C.R., and Butterworth, R.F. (1992). Glutamatergic synaptic dysfunction in
hyper ammonemic syndromes. Metabolic Brain Disease, 7, 1-20. Renou, S., Givaudan, J.G., Poulain, S., Dirassouyan, F., and Moulin, P. (2008). Landfill leachate
treatment: Review and opportunity. Journal of Hazardous Materials, 150, 468-93. Robinson, H.D. (1995). A Review of the Composition of Leachates from Domestic Wastes in
Landfill Sites. Department of the Environment Wastes Technical Division, UK. Sartaj, M., Ahmadifar, M., and Jashni, A.K. (2010). Assessment of in-situ aerobic treatment of
municipal landfill leachate at laboratory scale. Iranian Journal of Science and Technology B. 34, 107-116.
Silva, A.C., Dezotti, M., and Sant’Anna, Jr., G.L. (2004). Treatment and detoxification of a
sanitary landfill leachate. Chemosphere, 55, 207-214. Sivasankar, T. and Moholkar, V.S. (2009). Physical insights into the sonochemical
degradation of recalcitrant organic pollutants with cavitation bubble dynamics. Ultrasonics Sonochemistry, 16, 769-781.
Timur, H. and Özturk, I. (1999). Anaerobic sequencing batch reactor treatment of landfill
leachate. Water Research, 33, 3225-3230. USEPA (2013). Aquatic Life Ambient Water Quality Criteria for Ammonia: Freshwater, EPA
822-R-13-001, USEPA Office of Water, Washington, DC. Uygur, A. and Kargi, F. (2004). Biological nutrient removal from pre-treated landfill leachate
in a sequencing batch reactor. Journal of Environmental Management, 71, 9-14. Wang, S., Wu, X., Wang, Y., Li, Q., and Tao, M. (2008). Removal of organic matter and
ammonia nitrogen from landfill leachate by ultrasound. Ultrasonics Sonochemistry, 15, 933-937.
Wu, J.J., Wu, C.C., Ma, H.W., and Chang, C.C. (2004). Treatment of landfill leachate by ozone-
based advanced oxidation processes. Chemosphere, 54, 997-1003. Yenigün, O. and Demirel, B. (2013). Ammonia inhibition in anaerobic digestion: a review.
Process Biochemistry, 48, 901-9.

81
5 CHAPTER V Technical Paper II
Statistical Analysis and Optimization of Ammonia Nitrogen Removal from a High
Concentration Aqueous Solution Using Ultrasonic Irradiation
Andrew Tobalt, Majid Sartaj, Kevin Kennedy
Abstract
The application of ultrasound (US) irradiation was investigated as a treatment method for
the removal of ammonia nitrogen from a synthetic ammonia solution using batch
experiments. 165 mL samples of synthetic ammonia solution containing approximately
3000 mg TAN/L at a pH of 9, 10, and 11 were subjected to US for 5, 15, and 25 minutes at
output power amplitudes of 20%, 60%, and 100% using a 20 kHz sonifier. Results confirm
that US irradiation is an effective treatment method for the removal of ammonia nitrogen
from an aqueous solution. Combing the input parameters of US duration and output
amplitude showed a maximum observed experimental removal rate of 83% at a pH of 11
and energy output of 101 kJ. Statistical analysis of the experimental data showed that
ammonia nitrogen removal efficiency is strongly dependent on pH and energy output.
Increasing percent removal was found with an increase in either parameter. A response
surface methodology (RSM) was used to predict the removal efficiency of US. The RSM
generated an equation for ammonia removal efficiency (%) with an R2 of 0.94 indicating
the model predicted the observed results accurately. RSM showed that an optimum pH of
82
10.9 and energy output of 94.8 kJ yields a maximum ammonia nitrogen removal efficiency
of 87% from a synthetic ammonia solution containing approximately 3000 mg TAN/L.
Keywords: Ultrasonic Irradiation; Ammonia; Statistical Analysis; Response Surface
Methodology; Optimization; Factorial Design.
83
5.1 Introduction
Aqueous ammonia nitrogen is one of the major inorganic pollutants of surface water and is
classified as toxic by Environment Canada (2001). Ammonia and Ammonium (NH3 & NH4)
naturally occur in the environment from the decomposition of organics and through being
excreted by plants and animals (Randall & Tsui, 2002). The NH3/NH4 system is sensitive to
pH and temperature changes, with an increase in pH and/or temperature raising the
percentage of NH3 (Fernandes et al., 2012). In these naturally occurring concentrations, the
NH3/NH4 system is a major nitrogen nutrient source. However, in excessive
concentrations, NH4 and, more acutely, NH3 exhibit toxic properties to both animals and
plants (Britto & Kronzucker, 2002). High levels of ammonia in the body can produce many
harmful effects mainly on the central nervous system of vertebrates, acute ammonia
intoxication, and convulsion (Ip & Chew, 2010; Rao et al., 1992). Unfortunately, human
industrial activities, including the synthesis of NH3 for cleaning products and fertilizer as
well as biological waste treatment that produces NH3, have introduced high concentrations
of ammonia into the environment (Randall & Tsui, 2002).
Ammonia toxicity is particularly problematic when looking at landfill leachate, which can
vary greatly in composition and strength depending on the composition of the waste,
design and operation (specifically for moisture content), and the age of the landfill (Sartaj
et al., 2010; Wang et al.,2008). Ammonia generated in landfills does not have a natural
removal mechanism due to methanogenic conditions and will accumulate unless treated
externally (Burton & Watson-Craik, 1998). Furthermore, Ehrig (1989) showed that, if left
untreated, ammonia concentrations can remain constant for more than 30 years post
84
landfill closure. All of the aforementioned factors result in leachates that contain from 0.2
to 13000 mg NH3-N/L (Renou et al., 2008). As such, ammonia is considered to be the most
significant long-term pollutant found in landfill leachate (Dong & Sartaj, 2016b; Belevi &
Baccini, 1989; Robinson, 1995).
Compounding the toxic effects of ammonia is the inhibitory effect it has on biological
nutrient removal and anaerobic digestion. Lee et al. (2000) found that a concentration
between 2500 and 2700 mg TAN/L reduced the microbial activity of heterotrophic and
nitrifying bacteria by 50%. Also, Liu et al. (2012) reported that inhibitory effects on
anaerobic biodegradation of landfill leachates occurred at concentrations between 1500
and 3000 mg TAN/L. Furthermore, Akindele and Sartaj (2016) found that a concentration
of 2500 mg TAN/L was inhibitory to anaerobic biodegradation while Kayhanian (1994)
found this limit to be 1000 mg TAN/L. It is clear from literature that ammonia nitrogen is a
substance of great concern with a need for novel removal techniques.
Many treatment options exist to remove ammonia from aqueous solutions; however, a
universal treatment solution covering all of the toxins and contaminants found in leachate
has not been found yet. At present, a combination of different techniques must be used in
tandem to mediate all of the potentially ill effects associated with landfill leachate
(Wiszniowski et al., 2006).
Common biological processes used to remove ammonia employ nitrification and
denitrification and show degraded performance when treating higher concentrations of
85
ammonia. The inhibition of the biological nitrification process is reported to be due to NH3
while the presence of NH4+ inhibits the NO2 oxidation process at concentrations of 20 mg-
N/L, and also begins to inhibit the NH4 oxidation process at concentrations of 100 mg-N/L
(Metcalf & Eddy, 2014).
Alternatively to biological processes, ammonia may be removed by physical and chemical
methods, which include air stripping, membrane filtration, microwave, and ultrasound.
These methods of ammonia removal present some drawbacks: adequate results from air
stripping are achieved only in high pH conditions, where ammonia is in unionized form
(NH3) (Marrtinen et al., 2002); extensive pretreatment and chemical cleaning is required
for membrane filtration and if not vigilantly monitored and maintained, the lifecycle of the
membrane and process productivity decrease significantly (Rautenbach et al., 2000).
Microwave radiation has shown the ability to remove ammonia from aqueous solutions as well
as leachate, though the removal rates without accompanying aeration seem low (Dong & Sartaj,
2016a).
For the purpose of this paper, ultrasound (US) irradiation was used as the method of ammonia
removal. Compared to conventional treatment methods, US offers significant advantages with
respect to yield and performance; the primary benefit of using this method is that there is no
additional use of chemicals required. In turn, US does not release toxic compounds into the
environment and reduces the associated environmental impacts (Faryadi et al., 2015).
Moreover, US can provide an improved yield product and selectivities, as well as enhance
product recovery and quality if applications of several processes are used (Matouq & Al-Anber,

86
2007). Further, the use of US is a two-fold economical solution: it is easily applied and
operational costs are lowered (Faryadi et al., 2015).
Previous research conducted by Matouq and Al-Anber (2007) studied high frequency US
waves to remove ammonia from simulated industrial wastewater. The efficiency of
ammonia removal from water were examined at three different concentrations of ammonia
(5%, 15%, and 25% volume), which are similar to conditions of wastewater from strippers
at petroleum refineries. US frequencies of 1.7 and 2.4 MHz were used to study the effects of
waves on ammonia removal. The study surmised that US removed 5% concentration
ammonia, which met local wastewater standards for 0.080 L solution within less than 2
hours. Further, the study indicated that with the increase of ammonia concentration, the
amount of ammonia removed with 2 hours decreased; however, the concentration of
ammonia removed still met the local wastewater standards (Matouq & Al-Anber, 2007).
Neczaj et al. (2007) studied the effects of US on combined treatment of landfill leachate and
domestic sewage in sequencing batch reactors (SBR). Their experiments used a ratio of
sewage to leachate of 9:1 by volume and sonification was used to pre-treat landfill leachate.
Sonification of the leachate was performed in a static condition using a disintegrator UD-20
with a field frequency of 20 kHz and amplitude of 12 m. The mixed wastewater was
seeded to a mixed suspended solids solution with a concentration of 3500 mg/L with
activated sludge obtained from a biological wastewater treatment plant. The SBR operated
with a 24-hour time cycle in the following operational sequence: fill, aerobic reaction,
anoxic reaction, settlement, draw, and idle. Different operational factors were applied to

87
optimize the removal of nitrogen compounds and COD. Their results indicated that bio-
treatment of combined leachate and sewage was possible and that treatment efficiency was
strongly dependent on operational factors. Further, it was reported that US pretreatment of
raw leachate resulted in increased treatment efficiency; their results showed significant
improvements to COD and nitrogen compound removal rates in SBRs operated with
leachate, which had been irradiated by US as compared to biological treatment of non-
pretreated leachate (Neczaj et al., 2007).
Faryadi et al. (2015) investigated the removal of ammonia using high frequency US in two
sonoreactors, a batch and a new proposed dam-weir falling reactor. The study of ammonia
removal, with and without aeration, was conducted and the effects of initial concentration
and US irradiation were observed. This study reported that a 4 cm liquid height on the
surface of piezoelectric is an optimum height for US irritation and that aeration has a
significant influence on ammonia removal. Further, as determined in previous studies, their
research confirmed that aeration had an important influence on ammonia removal. It was
reported that up to 80% and 49% of ammonia was removed in the dam-weir and batch
systems, respectively, using US irradiation in conjunction with aeration after 120 minutes
(Faryadi et al., 2015).
Huang et al. (2014) reported on the treatment of landfill leachate using US stripping to
decompose struvite and the recycling of the decomposition product. Their results specified
that the ammonium in struvite could be nearly eliminated from the solution when the
decomposition of struvite by US stripping is performed at 55°C for 40 minutes.

88
Characterization analysis indicated that magnesium phosphate and dissolved phosphate
ions were the principal active derivatives and that approximately 90% of TAN in landfill
leachate could be removed by reusing the decomposition product at pH 9 for 60 minutes.
The TAN removal efficiency declined with an increase in the number of repeated use of the
struvite decomposition product. However, the study reported that the reuse of struvite
yielded approximately 90% TAN removal with the supplementation of a preformed
struvite to the solution for every recycle. An economic analysis established that 79.3% of
the treatment could be saved by the proposed process compared to the non-recycling
process. This shows the multi-faceted advantage of using US combined with other ammonia
removal techniques (Huang et al., 2014).
Wang et al. (2008) reported that an ammonia removal efficiency of up to 96% was achieved
after 180 minutes of US irradiation time. The US process was proven to be input power-
dependent with the removal rate increasing with an increase in power input. It was also
reported that a high pH was favorable to remove ammonia nitrogen using US irradiation.
The removal efficiency at pH 11 was approximately eight times as high as that of pH 3. This
was found to be the result of a higher percentage of unionized ammonia compared to
ionized ammonia at high pH. Specifically, ionized ammonia does not vaporize into the
ultrasonic cavitation bubbles while unionized ammonia is more volatile and does. In the
molecular state, unionized ammonia can react inside the cavitation bubbles by thermal
cleavage. It was found that the main mechanism of ammonia nitrogen removal was due to
the entry of ammonia molecules into the cavitation bubbles and their transformation into
nitrogen molecules and hydrogen molecules via pyrolysis (Wang et al., 2008). However,
89
Ozturk and Bal (2015) concluded that the main mechanism of ammonia removal was
advanced oxidation of ammonia–nitrogen by hydroxyl radicals.
The main objective of this study was to evaluate and optimize ammonia removal by US
using a factorial design and response surface methodology (RSM) under high TAN
concentrations range.
5.2 Materials and Methods
5.2.1 Materials and Equipment
The solution used containing approximately 3000 mg TAN/L (approximately 2400 mg/L as
NH3-N) was prepared by dissolving Fisher Scientific analytical grade ammonium chloride
(NH4Cl) in approximately 500 ml of distilled water; after the NH4Cl was observed to be fully
dissolved the remainder of distilled water was added to achieve the desired ammonia
concentration. A fresh ammonia bulk solution was made for each laboratory session with
the total volume used calculated based on the number of tests to be conducted;
approximately 4 L was used per session unless the needed laboratory equipment was not
available for a full day. The initial concentration of 3000 mg TAN/L was chosen as it lies at
the high end of the published range of 1500-3000 mg TAN/L that produces inhibitory
effects in conventional biological treatments. The initial pH was approximately 5.5 and was
adjusted to the desired levels using 10 mol/L NaOH (Fisher Scientific).

90
US irradiation was applied to aqueous ammonia samples using a Branson Digital Sonifier®
(model 450) with included 20 kHz ultrasonic converter, ½” disruptor horn, and ½”
disruptor horn tip. The maximum output power of the 450 model is 400 W and can be
adjusted from 10% to 100% in 5% increments. The Branson Digital Sonifier® was
connected to a printer that would produce a summary of each sample test including total
energy output (J) and peak power output (W). It should be noted that the maximum output
power depends on the density of the material being sonicated; the aqueous ammonia
solution being used allowed for a maximum power output of approximately 130 W.
5.2.2 Analytical Method
Ammonia concentrations were tested using TNT 832 vials from HACH Company based on
the Salicylate method using a spectrophotometer (model DR5000) also manufactured by
HACH Company. A 10 mg TAN/L as NH3-N standard solution (HACH Company) was used to
check the calibration of the spectrophotometer. All tests were triplicated and before testing
ammonia removal, a blank sample of distilled water was tested as well. The pH was
measured using a glass electrode connected to a Fisher Scientific Accumet® dual channel
pH/ion meter (model XL25). Also, each sample was diluted 100:1 before being sampled
and tested to ensure that both the pH and ammonia concentration were within the
specified range of the TNT 832 testing kit.

91
5.2.3 Experimental Design
The experimental design for testing ammonia removal is summarized in Table 5.1. The pH
range was selected based on the results of preliminary testing that determined the low and
high end effects of pH on ammonia removal. Similarly, the power output and US duration
range of 100% for 25 minutes were not chosen based on preliminary tests; the removal of
ammonia at these input values began to plateau and did not add statistically significant
data to the experiment.
Table 5.1 Experimental design for the removal of ammonia nitrogen from a synthetic solution using US
US time (mins) 5
15
25
Power output level (%) 20 60 100 20 60 100 20 60 100
pH 9
–
10
–
11
–
Experiments conducted under these conditions – No Experiments conducted under these conditions
Fig. 1 shows the order of events involved in the testing of ammonia removal from US
irradiation. For each test, approximately 165 mL of synthetic solution was used to achieve
the desired disruptor horn tip depth of 165 mm (Matouq & Al-Anber, 2007). The pH was
adjusted to the desired initial pH (9, 10, or 11) using a 10 mol/L NaOH solution, then TAN,
pH, and temperature were measured. Afterwards, the sample was exposed to US
irradiation for the desired duration (5, 10, or 25 minutes) and power output (20, 60, or 100
%). The temperature was measured immediately after US irradiation. The sample was
allowed to cool to its initial temperature before distilled water was added to account for

92
water loss; water loss was calculated by weighing the sample before and after US
irradiation. Finally, TAN and pH were measured and energy output recorded (kJ).
Figure 5.1 Experimental flow chart
5.2.4 Statistical method and data analysis
Both a factorial design and response surface methodology (RSM) were used to evaluate and
optimize the pH and US energy input required to remove ammonia from an aqueous
solution. US energy output was used as it is the product of US power output and irradiation
time. The response surface model and corresponding output response, Y (ammonia
removal efficiency), were based on the input of two independent variables: US energy
output (X1) and pH (X2). Table 5.2 shows the coded levels for both X1 and X2, which were
coded at 8 levels and 3 levels from -1 to 1, respectively. The ranges for the independent
variables were determined using preliminary test results. To reduce noise and bias in the
outcome response in addition to increasing standard deviation and random error accuracy,
all tests were performed in triplicate.
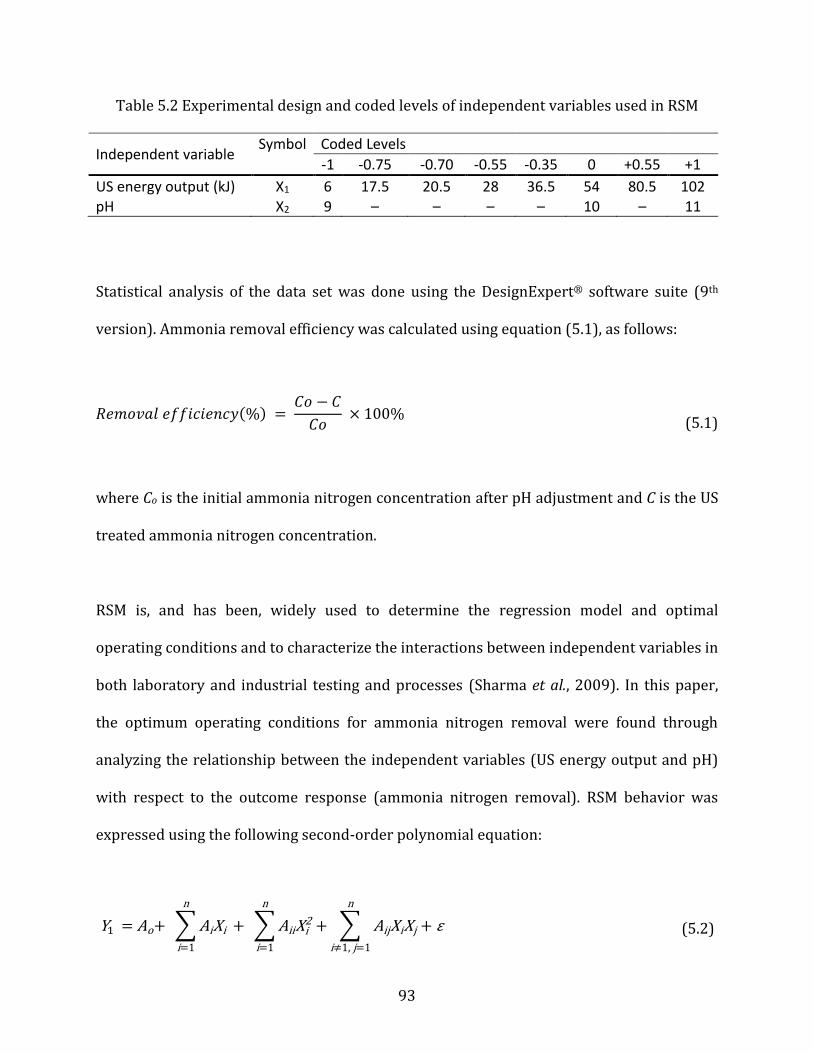
93
Table 5.2 Experimental design and coded levels of independent variables used in RSM
Independent variable Symbol Coded Levels
-1 -0.75 -0.70 -0.55 -0.35 0 +0.55 +1
US energy output (kJ) X1 6 17.5 20.5 28 36.5 54 80.5 102 pH X2 9 – – – – 10 – 11
Statistical analysis of the data set was done using the DesignExpert® software suite (9th
version). Ammonia removal efficiency was calculated using equation (5.1), as follows:
𝑅𝑒𝑚𝑜𝑣𝑎𝑙 𝑒𝑓𝑓𝑖𝑐𝑖𝑒𝑛𝑐𝑦(%) = 𝐶𝑜 − 𝐶
𝐶𝑜 × 100%
(5.1)
where Co is the initial ammonia nitrogen concentration after pH adjustment and C is the US
treated ammonia nitrogen concentration.
RSM is, and has been, widely used to determine the regression model and optimal
operating conditions and to characterize the interactions between independent variables in
both laboratory and industrial testing and processes (Sharma et al., 2009). In this paper,
the optimum operating conditions for ammonia nitrogen removal were found through
analyzing the relationship between the independent variables (US energy output and pH)
with respect to the outcome response (ammonia nitrogen removal). RSM behavior was
expressed using the following second-order polynomial equation:
Y1 = Ao+ ∑ AiXi
n
i=1
+ ∑ AiiXi2 + ∑ AijXiXj + ε
n
i≠1, j=1
n
i=1
(5.2)
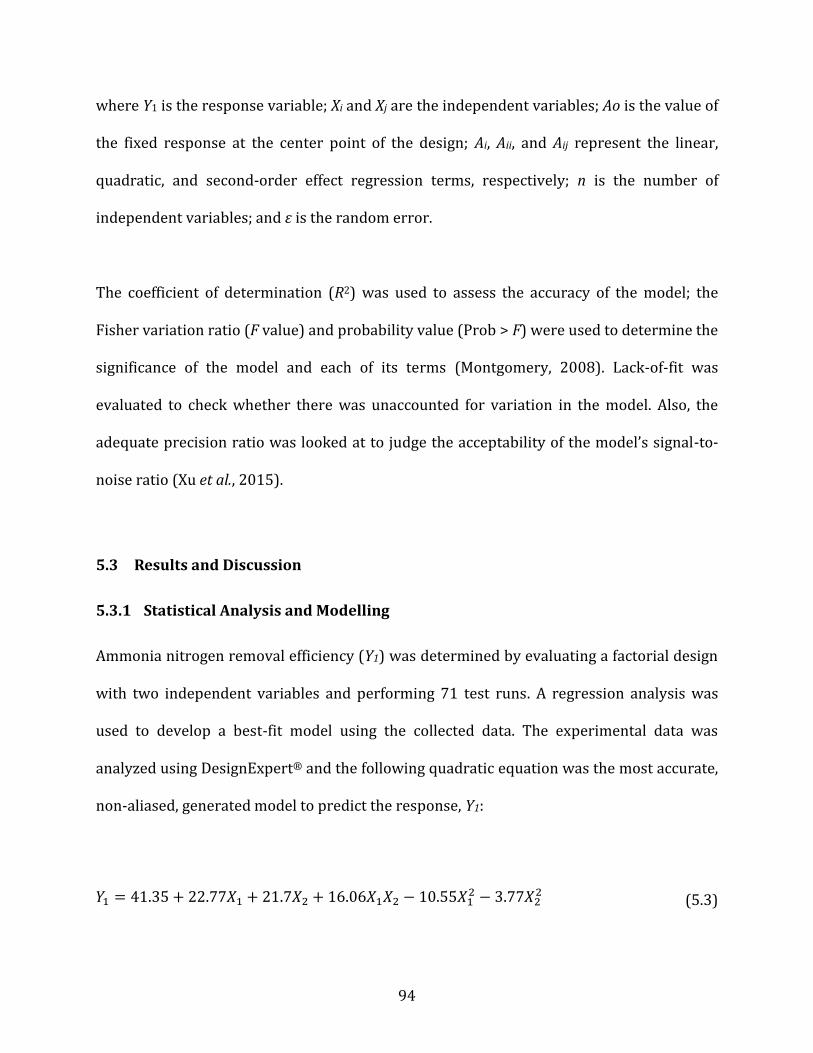
94
where Y1 is the response variable; Xi and Xj are the independent variables; Ao is the value of
the fixed response at the center point of the design; Ai, Aii, and Aij represent the linear,
quadratic, and second-order effect regression terms, respectively; n is the number of
independent variables; and ε is the random error.
The coefficient of determination (R2) was used to assess the accuracy of the model; the
Fisher variation ratio (F value) and probability value (Prob > F) were used to determine the
significance of the model and each of its terms (Montgomery, 2008). Lack-of-fit was
evaluated to check whether there was unaccounted for variation in the model. Also, the
adequate precision ratio was looked at to judge the acceptability of the model’s signal-to-
noise ratio (Xu et al., 2015).
5.3 Results and Discussion
5.3.1 Statistical Analysis and Modelling
Ammonia nitrogen removal efficiency (Y1) was determined by evaluating a factorial design
with two independent variables and performing 71 test runs. A regression analysis was
used to develop a best-fit model using the collected data. The experimental data was
analyzed using DesignExpert® and the following quadratic equation was the most accurate,
non-aliased, generated model to predict the response, Y1:
𝑌1 = 41.35 + 22.77𝑋1 + 21.7𝑋2 + 16.06𝑋1𝑋2 − 10.55𝑋12 − 3.77𝑋2
2 (5.3)
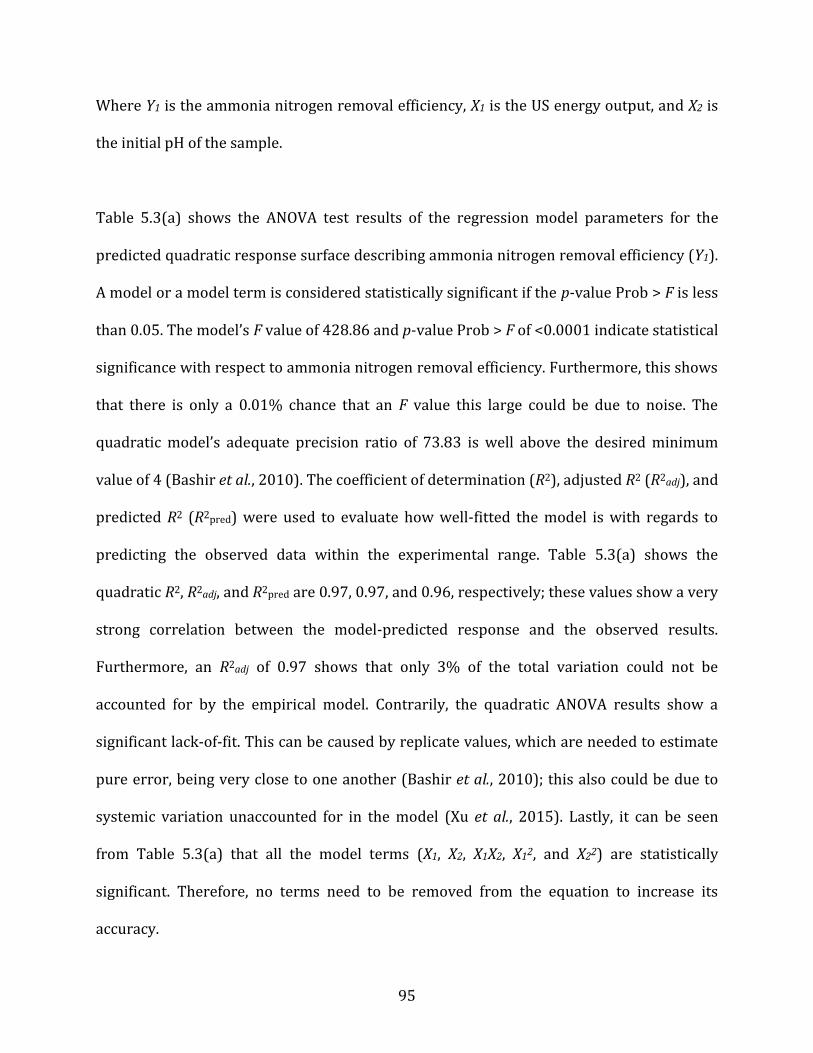
95
Where Y1 is the ammonia nitrogen removal efficiency, X1 is the US energy output, and X2 is
the initial pH of the sample.
Table 5.3(a) shows the ANOVA test results of the regression model parameters for the
predicted quadratic response surface describing ammonia nitrogen removal efficiency (Y1).
A model or a model term is considered statistically significant if the p-value Prob > F is less
than 0.05. The model’s F value of 428.86 and p-value Prob > F of <0.0001 indicate statistical
significance with respect to ammonia nitrogen removal efficiency. Furthermore, this shows
that there is only a 0.01% chance that an F value this large could be due to noise. The
quadratic model’s adequate precision ratio of 73.83 is well above the desired minimum
value of 4 (Bashir et al., 2010). The coefficient of determination (R2), adjusted R2 (R2adj), and
predicted R2 (R2pred) were used to evaluate how well-fitted the model is with regards to
predicting the observed data within the experimental range. Table 5.3(a) shows the
quadratic R2, R2adj, and R2pred are 0.97, 0.97, and 0.96, respectively; these values show a very
strong correlation between the model-predicted response and the observed results.
Furthermore, an R2adj of 0.97 shows that only 3% of the total variation could not be
accounted for by the empirical model. Contrarily, the quadratic ANOVA results show a
significant lack-of-fit. This can be caused by replicate values, which are needed to estimate
pure error, being very close to one another (Bashir et al., 2010); this also could be due to
systemic variation unaccounted for in the model (Xu et al., 2015). Lastly, it can be seen
from Table 5.3(a) that all the model terms (X1, X2, X1X2, X12, and X22) are statistically
significant. Therefore, no terms need to be removed from the equation to increase its
accuracy.
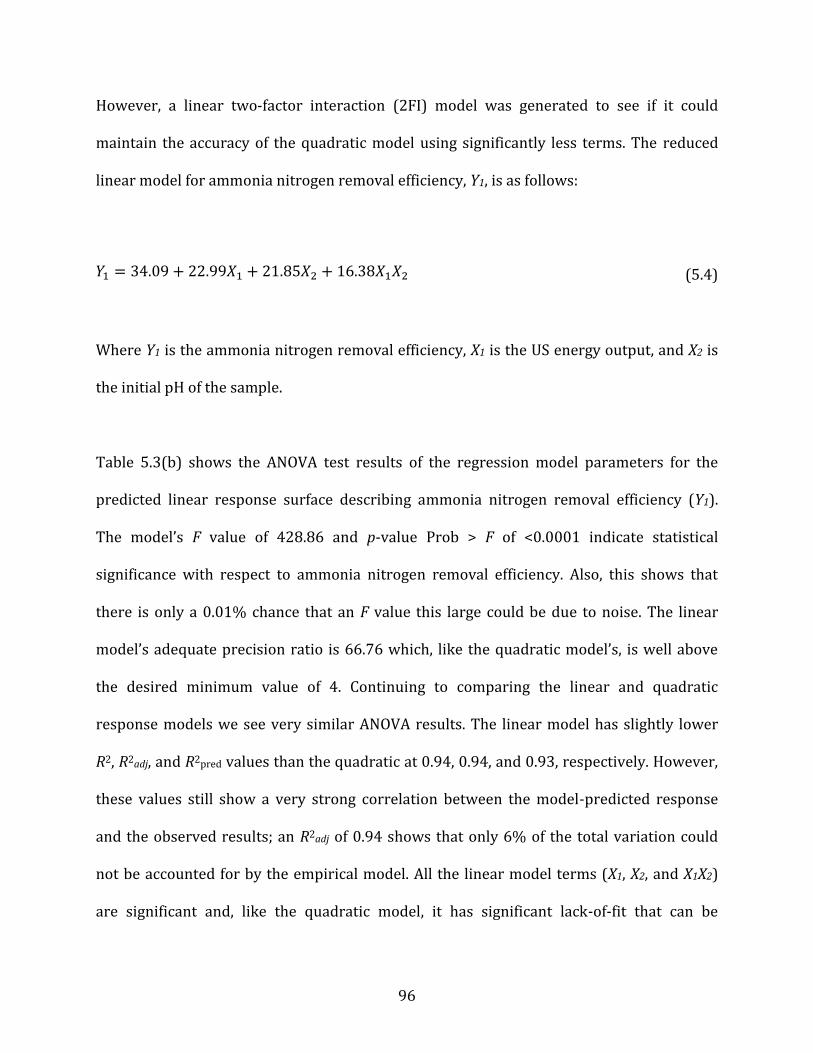
96
However, a linear two-factor interaction (2FI) model was generated to see if it could
maintain the accuracy of the quadratic model using significantly less terms. The reduced
linear model for ammonia nitrogen removal efficiency, Y1, is as follows:
𝑌1 = 34.09 + 22.99𝑋1 + 21.85𝑋2 + 16.38𝑋1𝑋2 (5.4)
Where Y1 is the ammonia nitrogen removal efficiency, X1 is the US energy output, and X2 is
the initial pH of the sample.
Table 5.3(b) shows the ANOVA test results of the regression model parameters for the
predicted linear response surface describing ammonia nitrogen removal efficiency (Y1).
The model’s F value of 428.86 and p-value Prob > F of <0.0001 indicate statistical
significance with respect to ammonia nitrogen removal efficiency. Also, this shows that
there is only a 0.01% chance that an F value this large could be due to noise. The linear
model’s adequate precision ratio is 66.76 which, like the quadratic model’s, is well above
the desired minimum value of 4. Continuing to comparing the linear and quadratic
response models we see very similar ANOVA results. The linear model has slightly lower
R2, R2adj, and R2pred values than the quadratic at 0.94, 0.94, and 0.93, respectively. However,
these values still show a very strong correlation between the model-predicted response
and the observed results; an R2adj of 0.94 shows that only 6% of the total variation could
not be accounted for by the empirical model. All the linear model terms (X1, X2, and X1X2)
are significant and, like the quadratic model, it has significant lack-of-fit that can be

97
accounted for similarly. It is quite clear comparing the two models that the linear version,
with less terms and only a small drop in accuracy when looking at R2adj, retains the
accuracy of the quadratic model with significantly less terms.
Table 5.3 ANOVA for (a) quadratic and (b) linear (2FI) response surfaces
(a)
Source Sum of squares
df Mean square
F value p-value Prob > F
Model 36691.68 5 7338.34 428.86 <0.0001
Significant X1 15076.37 1 15076.37 881.07 <0.0001
X2 20044.16 1 20044.16 1171.39 <0.0001
X1X2 5023.58 1 5023.58 293.58 <0.0001
X1
2 802.41 1 802.41 46.89 <0.0001
X22 223.39 1 223.39 13.06 0.0006
Residual 1129.35 66 17.11
Lack-of-fit 1129.34 65 17.37 1991.02 0.0178
Significant
Pure error 8.73E-03 1 8.73E-03
Total
71
R2 = 0.97 R2adj = 0.97 R2
pred = 0.96 Adequate precision = 73.83
(b)
Source Sum of squares
df Mean square
F value p-value Prob>F
Model 35661.65 3 11887.22 374.33 <0.0001
Significant X1 15412.37 1 15412.37 485.34 <0.0001
X2 20346.57 1 20346.57 640.72 <0.0001
X1X2 5231.46 1 5231.46 164.74 <0.0001
Residual 2159.38 68 31.76
Lack-of-fit 2159.37 67 32.23 3693.32 0.0131
Significant
Pure error 8.73E-03 1 8.73E-03
Total
71
R2 = 0.94 R2adj = 0.94 R2
pred = 0.93 Adequate precision = 66.76
It should be noted from table 5.3(a) and (b) that both the quadratic and linear models do
have significant lack-of-fit. A model with a low R2 value in addition to a significant lack-of-
fit would indicate a failure to properly define the correlation between the experimental

98
factors and the variables used to generate the response (Ryan & Joiner, 2001). However,
both the quadratic and linear models have very high R2 values and, as such, are acceptable
representations despite their lack-of-fit (Jabeen et al., 2015; Palaniandy et al., 2015).
Considering that both models are adequate representations of the observed data the 2FI
(linear) model was chosen due to its simplicity.
Figure 5.2 presents the predicted versus observed values with respect to the ammonia
nitrogen removal efficiency for the linear model. The general linear distribution of the
points along the ideal trend line show the linear model’s predicted values approximate the
observed values with good accuracy. Figures 5.3 and 5.4 show the externally studentized
residuals versus the predicted values and runs, respectively. These diagnostic plots
illustrate that the linear model is a fair representation of the data due to the randomly
scattered points and lack of an observable distribution pattern. Moreover, the externally
studentized plots show that the assumption of constant variance and independence holds
true for all of the runs (Montgomery, 2008). Also, Figures 5.3 and 5.4 show that there are
no outliers in the linear model. Figure 5.5 reinforces this by showing that the residuals
follow a normal distribution; this asserts that the statistical assumptions made for this
model align with the observed data.
5.3.2 Response Surface Methodology
RSM was used to evaluate the interaction between the two independent variables (pH and
energy output) with respect to the response variable (removal efficiency). Figures 5.6 and
5.7 illustrate the corresponding two-dimensional contour plot and three-dimensional

99
surface plot of ammonia removal efficiency, respectively, for the linear model. It can be
seen that removal efficiency increased with an increase in both pH and energy output. The
effects of pH and energy output were found to be equal within the observed experimental
range. Maximizing the linear response equation yields a maximum ammonia nitrogen
removal efficiency of 87% at an optimum pH of 10.9 and energy output of 94.8 kJ. It should
be noted that the experimental design was chosen to limit a potential excess of output
energy.
Figure 5.2 Correlation of predicted and actual values with respect to ammonia nitrogen removal for the linear model
Design-Expert® Software
Removal Efficiency
Color points by value of
Removal Efficiency:
83.5829
1.34532
Actual
Pre
dic
ted
Predicted vs. Actual
0
20
40
60
80
100
0 20 40 60 80 100
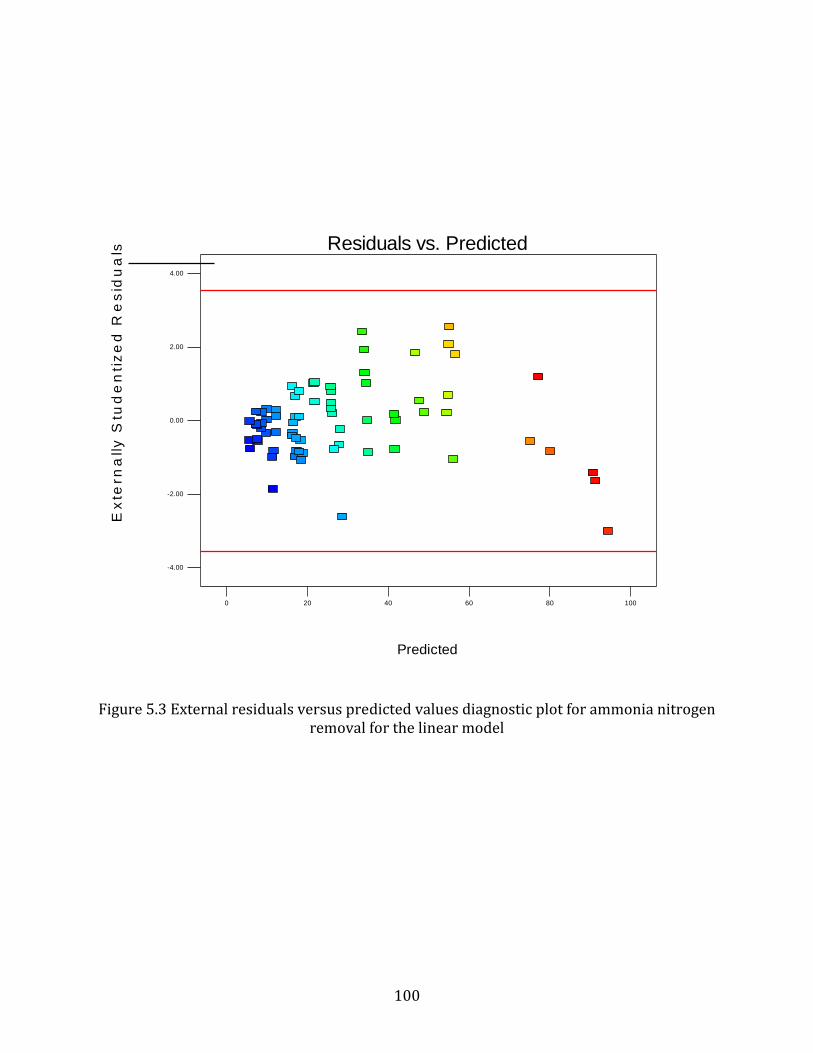
100
Figure 5.3 External residuals versus predicted values diagnostic plot for ammonia nitrogen removal for the linear model
Design-Expert® Software
Removal Efficiency
Color points by value of
Removal Efficiency:
83.5829
1.34532
Predicted
Ex
tern
all
y S
tud
en
tiz
ed
Re
sid
ua
ls Residuals vs. Predicted
-4.00
-2.00
0.00
2.00
4.00
0 20 40 60 80 100

101
Figure 5.4 External residuals versus runs diagnostic plot for ammonia nitrogen removal for the linear model
Design-Expert® Software
Removal Efficiency
Color points by value of
Removal Efficiency:
83.5829
1.34532
Run Number
Ex
tern
all
y S
tud
en
tiz
ed
Re
sid
ua
ls Residuals vs. Run
-4.00
-2.00
0.00
2.00
4.00
1 11 21 31 41 51 61 71

102
Figure 5.5 Normal probability plot of external residuals for ammonia nitrogen removal for the linear model
Design-Expert® Software
Removal Efficiency
Color points by value of
Removal Efficiency:
83.5829
1.34532
Externally Studentized Residuals
No
rm
al
% P
ro
ba
bil
ity
Normal Plot of Residuals
-3.00 -2.00 -1.00 0.00 1.00 2.00 3.00
1
5
10
20
30
50
70
80
90
95
99
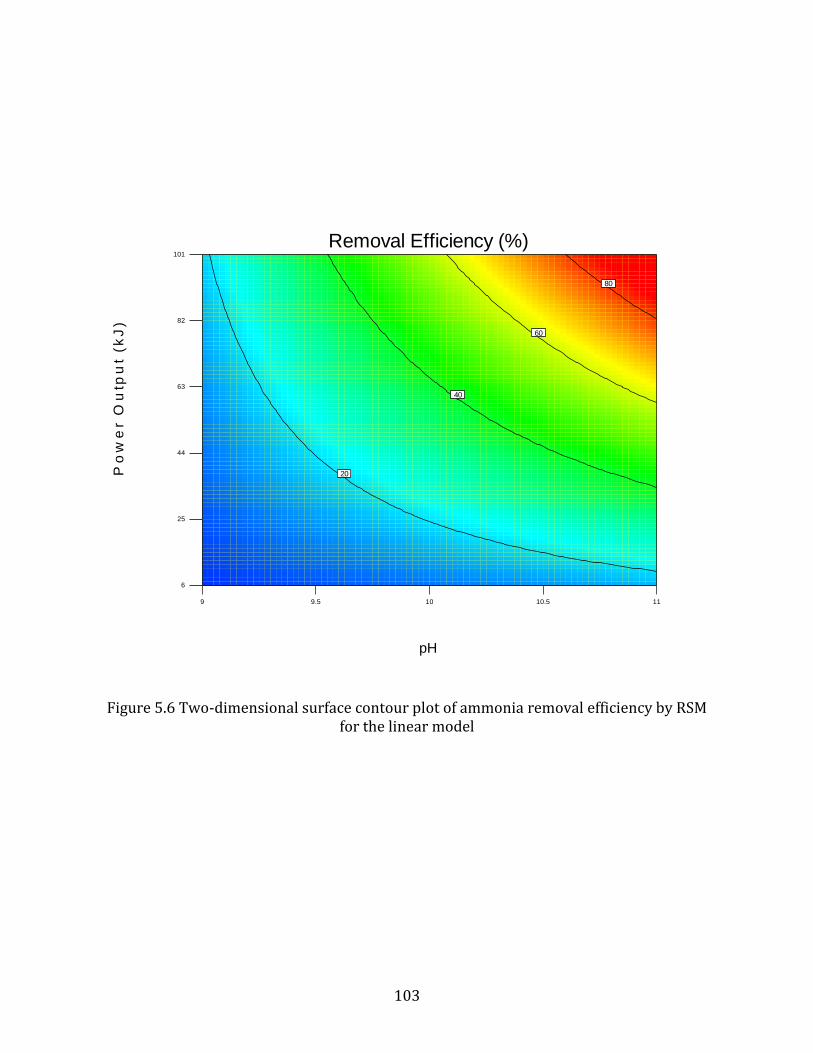
103
Figure 5.6 Two-dimensional surface contour plot of ammonia removal efficiency by RSM for the linear model
Design-Expert® Software
Factor Coding: Actual
Removal Efficiency (%)
83.5829
1.34532
X1 = A: pH
X2 = B: Power Output
9 9.5 10 10.5 11
6
25
44
63
82
101
Removal Efficiency (%)
pH
Po
we
r O
utp
ut
(k
J)
20
40
60
80
104
Figure 5.7 Three-dimensional surface contour plot of ammonia removal efficiency by RSM for the linear model
5.4 Conclusion
US irradiation was confirmed to be an effective treatment method for the removal of
ammonia nitrogen from a synthetic ammonia solution containing 3000 mg TAN/L. A
maximum observed experimental removal rate of 83% was achieved at a pH of 11 and
energy output of 101 kJ.
Design-Expert® Software
Factor Coding: Actual
Removal Efficiency (%)
83.5829
1.34532
X1 = A: pH
X2 = B: Power Output
6
25
44
63
82
101
9
9.5
10
10.5
11
0
20
40
60
80
100
Re
mo
va
l E
ffic
ien
cy
(%
)
pH
Power Output (kJ)

105
Statistical analysis of the experimental data showed that ammonia nitrogen removal
efficiency depended strongly on pH and energy output, with pH having slightly higher
influence. The response surface equation’s R2 of 0.94 indicates that the linear model
predicted the observed results accurately. RSM showed that an optimum pH of 10.9 and
energy output of 94.8 kJ yields a maximum ammonia nitrogen removal efficiency of 87%
from a synthetic ammonia solution containing 3000 mg TAN/L.
Acknowledgements
Financial support provided by Ontario Research Fund-Research Excellence (ORF-RE02-
007) is acknowledged and appreciated.

106
References
Akindele, A. A. and Sartaj, M. (2016). The toxicity effects of ammonia on anaerobic digestion of organic fraction of municipal solid waste. Sixth International Symposium on Energy from Biomass and Waste, Venice, Italy, November.
Bashir, M. J. K., Aziz, H. A., Yusoff, M. S., and Adlan, M. N. (2010). Application of response
surface methodology (RSM) for optimization of ammoniacal nitrogen removal from semi-aerobic landfill leachate using ion exchange resin. Desalination, 254 (1), 154–161.
Belevi, H. and Baccini, P. (1989). Long-term behavior of municipal solid waste landfills.
Waste Management and Research, 7, 43-56. Britto, D. T. and Kronzucker, H. J. (2010). NH4+ toxicity in higher plants: a critical review.
Journal of Plant Physiology, 159, 567-584. Environment Canada and Health Canada (2001). PSL Assessment Report – Ammonia in the Aquatic Environment. Canadian Environmental Protection Act 1999.
Burton, S. A. Q. and Watson-Craik, I. A. (1998). Ammonia and nitrogen fluxes in landfill sites:
applicability to sustainable landfilling. Waste Management and Research, 16, 41-3. Dong, S. and Sartaj, M. (2016a). Statistical analysis of thermal and nonthermal effects of
sequential microwave/aeration process for the removal of ammonia from aqueous solution. Desalination and Water Treatment, 57(42), 20005-20015.
Dong, S. and Sartaj, M. (2016b). Statistical analysis and optimization of ammonia removal
from landfill leachate by sequential microwave/aeration process using factorial design and response surface methodology. Journal of Environmental Chemical Engineering, 4, 10-108.
Ehrig, H. J. (1989). Water and element balances of landfills. The Landfill. P. Baccini (ed.),
Springer Berlin Heidelberg. Faryadi, M.. Rahimi, M.. Moradi, N., and Safari, S. (2015). Ammonia removal using 1.7 MHz
high frequency ultrasound in batch and novel dam-weir falling systems. Desalination and Water Treatment, 54, 3412–3421.
Fernandes, T. V., Keesman, K. J., Zeeman, G., and van Lier, J. B. (2012). Effect of ammonia on
the anaerobic hydrolysis of cellulose and tributyrin. Biomass and Bioenergy, 47, 316-323.
Huang, H., Xiao, D., Zhang, Q., and Ding, L. (2014). Removal of ammonia from landfill
leachate by struvite precipitation with the use of low-cost phosphate and magnesium sources. Journal of Environmental Management, 145, 191–198.
107
Ip, Y. K. and Chew, S. F. (2010). Ammonia production, excretion, toxicity, and defense in fish: a review. Frontiers in Physiology, 1.
Jabeen, H., Iqbal, S., Anwar, S., and Parales, R. E. (2015). Optimization of profenofos
degradation by a novel bacterial consortium PBAC using response surface methodology. International Biodeterioration and Biodegradation, 100, 89–97.
Kayhanian, M. (1994). Performance of a High-Solids Anaerobic Digestion Process under
Various Ammonia Concentrations. Journal of Chemical Technology and Biotechnology, 59, 349- 352.
Lee, S. M., Jung, J. Y., Chung, Y. C. (2000). Measurement of ammonia inhibition of microbial
activity in biological wastewater treatment process using dehydrogenase assay. Biotechnology Letters, 22, 991-994.
Liu, J., Luo, J., Zhou, J., Liu, Q., Qian, G., and Xu, Z. P. (2012). Inhibitory effect of high-strength
ammonia nitrogen on bio-treatment of landfill leachate using EGSB reactor under mesophilic and atmospheric conditions. Bioresource Technology, 113, 239-243.
Marttinen, S. K., Kettunen, R. H., Sormunen, K. M., Soimasuo, R.M., and Rintala, J.A. (2002).
Screening of physical–chemical methods for removal of organic material, nitrogen and toxicity from low strength landfill leachates. Chemosphere, 46, 851-858.
Matouq, M. A. D. and Al-Anber, Z. A. (2007). The application of high frequency ultrasound
waves to remove ammonia from simulated industrial wastewater. Ultrasonics Sonochemistry, 14(3), 393-397.
Metcalf, L. and Eddy, H. P. (2014). Wastewater engineering: Treatment, disposal, and reuse.
Fifth ed., McGraw-Hill Inc., New York. Montgomery, D. C. (2008). Design and Analysis of Experiments. John Wiley & Sons. Neczaj, E., Kacprzak, M., Lach, J., and Okoniewska, E. (2007). Effect of sonication on
combined treatment of landfill leachate and domestic sewage in SBR reactor. Desalination 204, 227–233.
Ozturk, E. and Bal, N. (2015). Evaluation of ammonia–nitrogen removal efficiency from
aqueous solutions by ultrasonic irradiation in short sonication periods. Ultrasonics Sonochemistry, 26, 422-427.
Palaniandy, P., Aziz, H. B. A., and Feroz, S. (2015). Treatment of petroleum wastewater using
combination of solar photo-two catalyst TiO2 and photo-Fenton process. Journal of Environmental and Chemical Engineering, 3 (2), 1117–1124.
Randall, D. and Tsui, T. (2002). Ammonia toxicity in fish. Marine Pollution Bulletin, 45, 17-
23.
108
Rao, V. R., Murthy, C. R., and Butterworth, R. F. (1992). Glutamatergic synaptic dysfunction in hyperammonemic syndromes. Metabolic Brain Disease, 7(1), 1-20.
Rautenbach, R., Linn, T., and Eilers, L. (2000). Treatment of severely contaminated waste
water by a combination of RO, high-pressure RO and NF-potential and limits of the process. Journal of Membrane Science, 174(2), 231-241.
Renou, S., Givaudan, J. G., Poulain, S., Dirassouyan, F., Moulin, P. (2008). Landfill leachate
treatment: Review and opportunity. Journal of Hazardous Materials, 150, 468-93. Robinson, H. D. (1995). A Review of the Composition of Leachates from Domestic Wastes in
Landfill Sites. Department of the Environment Wastes Technical Division, UK. Ryan, B.F. and Joiner, B.L. (2001). Minitab Handbook. Duxbury Press. Sartaj, M., Ahmadifar, M., and Jashni, A. K. (2010). Assessment of in-situ aerobic treatment of
municipal landfill leachate at laboratory scale. Iranian Journal of Science and Technology B. 34, 107-116.
Sharma, S., Malik, A., and Satya, S. (2009). Application of response surface methodology
(RSM) for optimization of nutrient supplementation for Cr (VI) removal by Aspergillus lentulus AML05. Journal of Hazardous Materials, 164 (2–3), 1198–1204.
Wang, S., Wu, X., Wang, Y., Li, Q., and Tao, M. (2008). Removal of organic matter and
ammonia nitrogen from landfill leachate by ultrasound. Ultrasonics Sonochemistry, 15, 933-937.
Wiszniowski, J., Robert, D., Surmacz-Gorska, J., Miksch, K., and Weber, J. V. (2006). Landfill
leachate treatment methods: A review. Environmental Chemistry Letters, 4(1), 51-61. Xu, C., Wang, J., Yang, T., Chen, X., Liu, X., and Ding, X. (2015). Adsorption of uranium by
amidoximated chitosan-grafted polyacrylonitrile, using response surface methodology. Carbohydrate Polymers, 121, 79–85.

109
6 CHAPTER VI Additional Tests
6.1 Introduction
This chapter will cover additional tests that were performed and were not discussed in
chapters 4 and 5. These additional tests involved evaluating the TAN removal efficiencies
using the methods outlined in Chapter 3 using (i) a synthetic ammonia solution with an
initial TAN concentration of approximately 5000 mg/L and (ii) two different leachates
supplied. The following chapter will focus on comparing the results of these additional
tests to the results presented in Chapter 4 which used a synthetic solution with an initial
TAN concentration of approximately 3000 mg TAN/L to
6.2 Results and Discussion
Table 6.1 shows the characteristics of the two leachates used to assess the effectiveness of
using ultrasound irradiation to remove ammonia nitrogen. While both leachates used had
high ammonia nitrogen content they were selected to represent both old and new leachates
– leachate 1 being more characteristic of a young landfill’s leachate and leachate 2 more
characteristic of a mature landfill’s leachate. Young landfill leachate is generally
characterized by the acidogenic phase of organic degradation which yields high oxygen
demand (both biological and chemical) along with lower pH, alkalinity, and ammonia
concentrations. Alternately, mature landfill leachate is generally characterized by the
methanogenic phase of organic degradation which yields lower oxygen demand (both

110
biological and chemical) along with higher pH, alkalinity, and ammonia concentrations
(Słomczyńska & Słomczyński, 2004).
Table 6.1 Characteristics of leachates used to assess ammonia nitrogen removal by ultrasound irradiation.
Leachate 1 Leachate 2 BOD5 (mg/L) 18600 345 TSS (mg/L) 400 163 VSS (mg/L) 265 107 Alkalinity (mg CaCO3/L) 6690 15300 COD (mg/L) 55000 6200 TKN (mg N/L) 3190 4670 NH3 + NH4+ (mg TAN/L) 2324 5076 Nitrite (mg N/L) 18.9 0.75 Nitrate (mg N/L) < 0.6 < 0.6 pH 5.1 8.2
Figure 6.1 shows the average total TAN removal efficiencies of US when used on the two
synthetic solutions (approximately 3000 and 5000 mg TAN/L initial concentration) and the
two leachates (see Table 6.1 for concentrations) adjusted to a pH 10, sonication time of 25
minutes, and US power output level of 100%. Figure 6.1 also shows the average
contributions of non-thermal, thermal, and volatilization effects of total TAN removal by
US; TOTAL refers to TAN removal obtained in samples treated by US; WB refers to TAN
removal obtained in samples treated by water bath; US refers to the difference between
TOTAL and WB or the non-thermal (sonication) effect; and Volat. refers to TAN removal
due to volatilization for samples exposed to air with no treatment for an equivalent
duration.
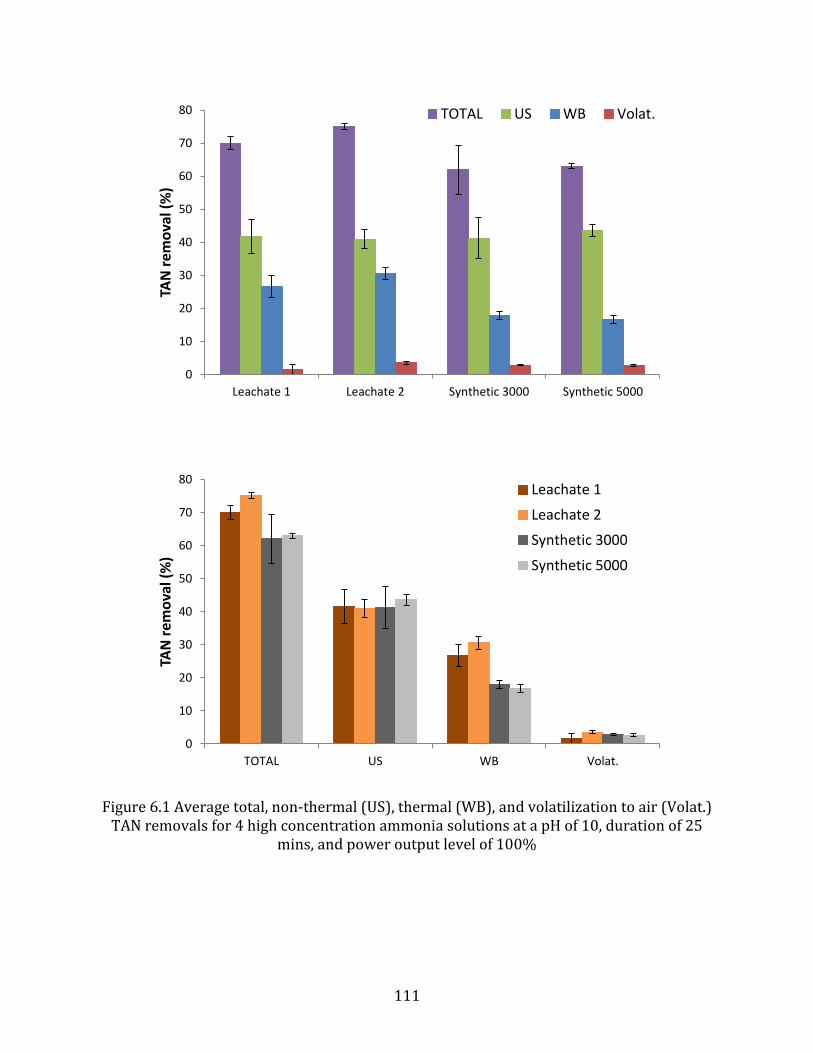
111
Figure 6.1 Average total, non-thermal (US), thermal (WB), and volatilization to air (Volat.) TAN removals for 4 high concentration ammonia solutions at a pH of 10, duration of 25
mins, and power output level of 100%
0
10
20
30
40
50
60
70
80
Leachate 1 Leachate 2 Synthetic 3000 Synthetic 5000
TAN
rem
ova
l (%
)
TOTAL US WB Volat.
0
10
20
30
40
50
60
70
80
TOTAL US WB Volat.
TAN
rem
ova
l (%
)
Leachate 1
Leachate 2
Synthetic 3000
Synthetic 5000
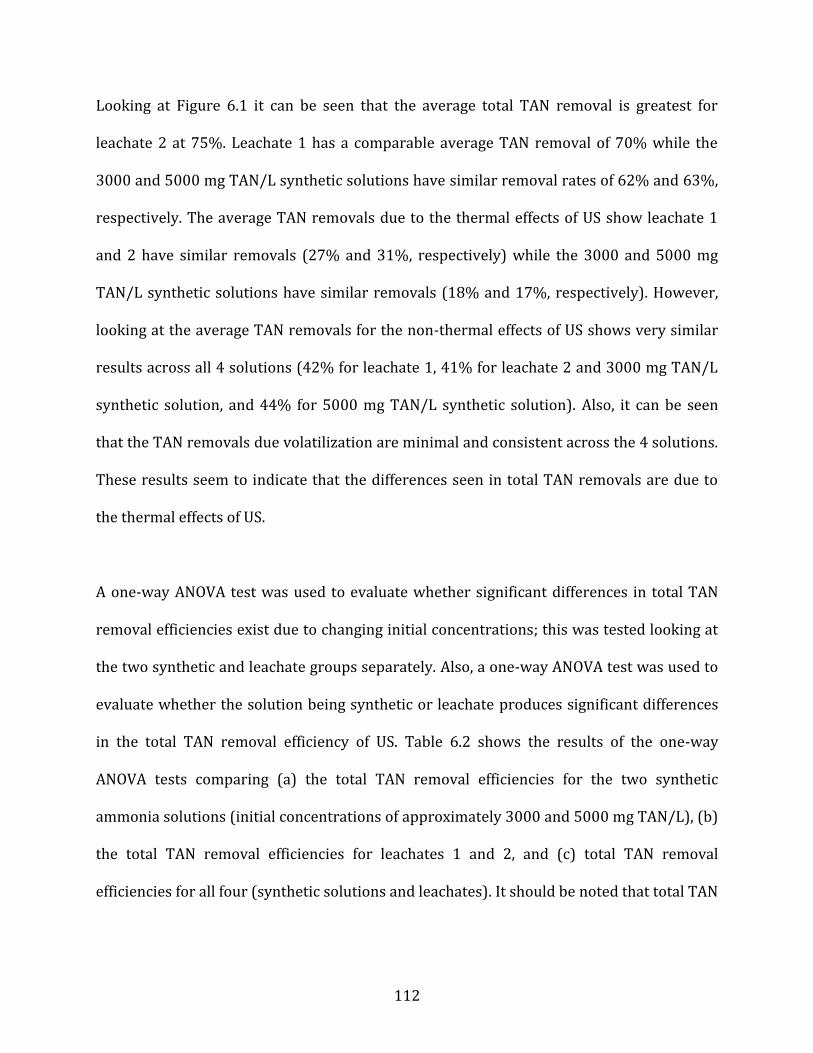
112
Looking at Figure 6.1 it can be seen that the average total TAN removal is greatest for
leachate 2 at 75%. Leachate 1 has a comparable average TAN removal of 70% while the
3000 and 5000 mg TAN/L synthetic solutions have similar removal rates of 62% and 63%,
respectively. The average TAN removals due to the thermal effects of US show leachate 1
and 2 have similar removals (27% and 31%, respectively) while the 3000 and 5000 mg
TAN/L synthetic solutions have similar removals (18% and 17%, respectively). However,
looking at the average TAN removals for the non-thermal effects of US shows very similar
results across all 4 solutions (42% for leachate 1, 41% for leachate 2 and 3000 mg TAN/L
synthetic solution, and 44% for 5000 mg TAN/L synthetic solution). Also, it can be seen
that the TAN removals due volatilization are minimal and consistent across the 4 solutions.
These results seem to indicate that the differences seen in total TAN removals are due to
the thermal effects of US.
A one-way ANOVA test was used to evaluate whether significant differences in total TAN
removal efficiencies exist due to changing initial concentrations; this was tested looking at
the two synthetic and leachate groups separately. Also, a one-way ANOVA test was used to
evaluate whether the solution being synthetic or leachate produces significant differences
in the total TAN removal efficiency of US. Table 6.2 shows the results of the one-way
ANOVA tests comparing (a) the total TAN removal efficiencies for the two synthetic
ammonia solutions (initial concentrations of approximately 3000 and 5000 mg TAN/L), (b)
the total TAN removal efficiencies for leachates 1 and 2, and (c) total TAN removal
efficiencies for all four (synthetic solutions and leachates). It should be noted that total TAN
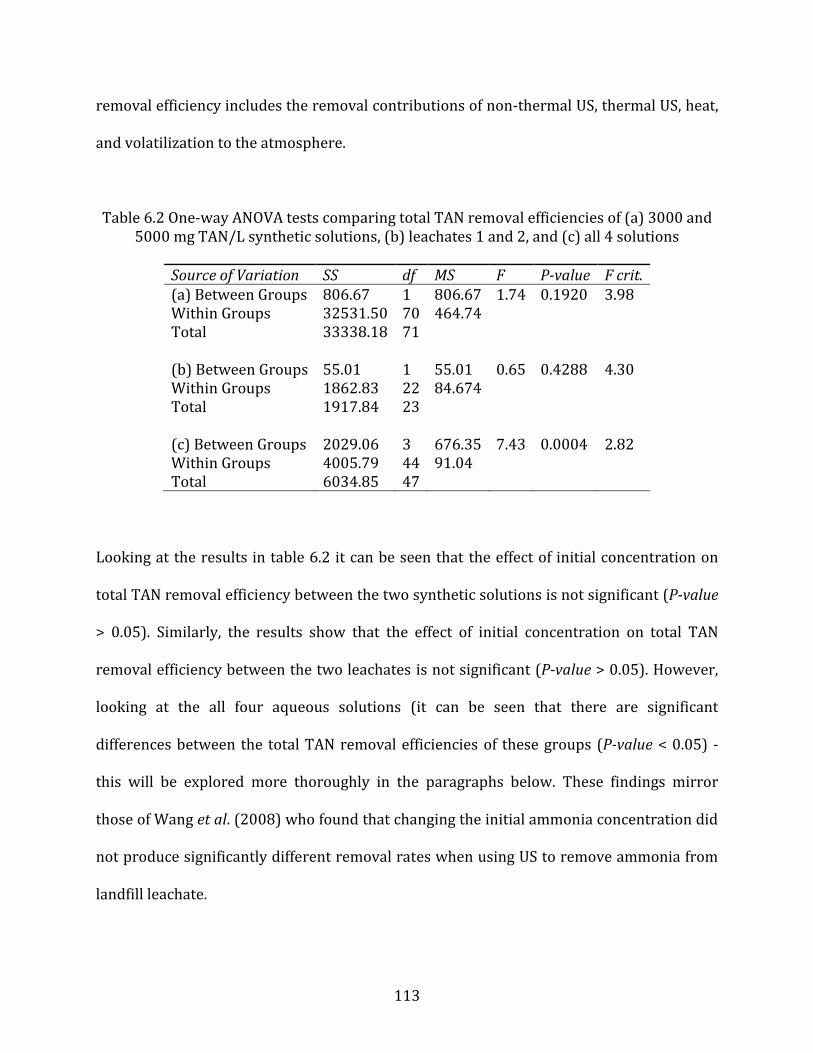
113
removal efficiency includes the removal contributions of non-thermal US, thermal US, heat,
and volatilization to the atmosphere.
Table 6.2 One-way ANOVA tests comparing total TAN removal efficiencies of (a) 3000 and 5000 mg TAN/L synthetic solutions, (b) leachates 1 and 2, and (c) all 4 solutions
Source of Variation SS df MS F P-value F crit. (a) Between Groups 806.67 1 806.67 1.74 0.1920 3.98 Within Groups 32531.50 70 464.74
Total 33338.18 71 (b) Between Groups 55.01 1 55.01 0.65 0.4288 4.30 Within Groups 1862.83 22 84.674 Total 1917.84 23 (c) Between Groups 2029.06 3 676.35 7.43 0.0004 2.82 Within Groups 4005.79 44 91.04 Total 6034.85 47
Looking at the results in table 6.2 it can be seen that the effect of initial concentration on
total TAN removal efficiency between the two synthetic solutions is not significant (P-value
> 0.05). Similarly, the results show that the effect of initial concentration on total TAN
removal efficiency between the two leachates is not significant (P-value > 0.05). However,
looking at the all four aqueous solutions (it can be seen that there are significant
differences between the total TAN removal efficiencies of these groups (P-value < 0.05) -
this will be explored more thoroughly in the paragraphs below. These findings mirror
those of Wang et al. (2008) who found that changing the initial ammonia concentration did
not produce significantly different removal rates when using US to remove ammonia from
landfill leachate.

114
To understand whether thermal or non-thermal effects were the source of the significant
total TAN removal results between synthetic solutions and leachate one-way ANOVA tests
were used to compare the TAN removal efficiencies of all 4 solutions for each isolated US
effect. Table 6.3 shows the results of one-way ANOVA tests where (a) compares the average
TAN removal efficiencies for the four solutions (synthetic and leachate) due to non-thermal
effects of US, and (b) compares the TAN removal efficiencies for the four solutions
(synthetic and leachate) due to the thermal effects of US.
Table 6.3 One-way ANOVA tests with regards to TAN removal efficiencies between all 4 solutions from the effects of (a) non-thermal effects of US, and (b) thermal effects of US
Source of Variation SS df MS F P-value F crit. (a) Between Groups 222.37 3 74.12 1.44 0.2434 2.82 Within Groups 2261.64 44 51.40
Total 2484.01 47 (b) Between Groups 1637.59 3 545.86 42.06 5.56E-13 2.82 Within Groups 571.05 44 12.978 Total 2208.64 47
Looking at the results in table 6.3 it can be seen that when the non-thermal effects of US are
isolated differences in TAN removal efficiencies between all four of the solutions are not
significant (P-value > 0.05). Alternately, when the thermal effects of US are isolated, it can
be seen that there are significant differences in the TAN removal efficiencies between the
four solutions (P-value < 0.05).
Finally, to see whether varying initial ammonia concentration was also a source of the
significant total TAN removal results when looking at the thermal effect of US, one-way
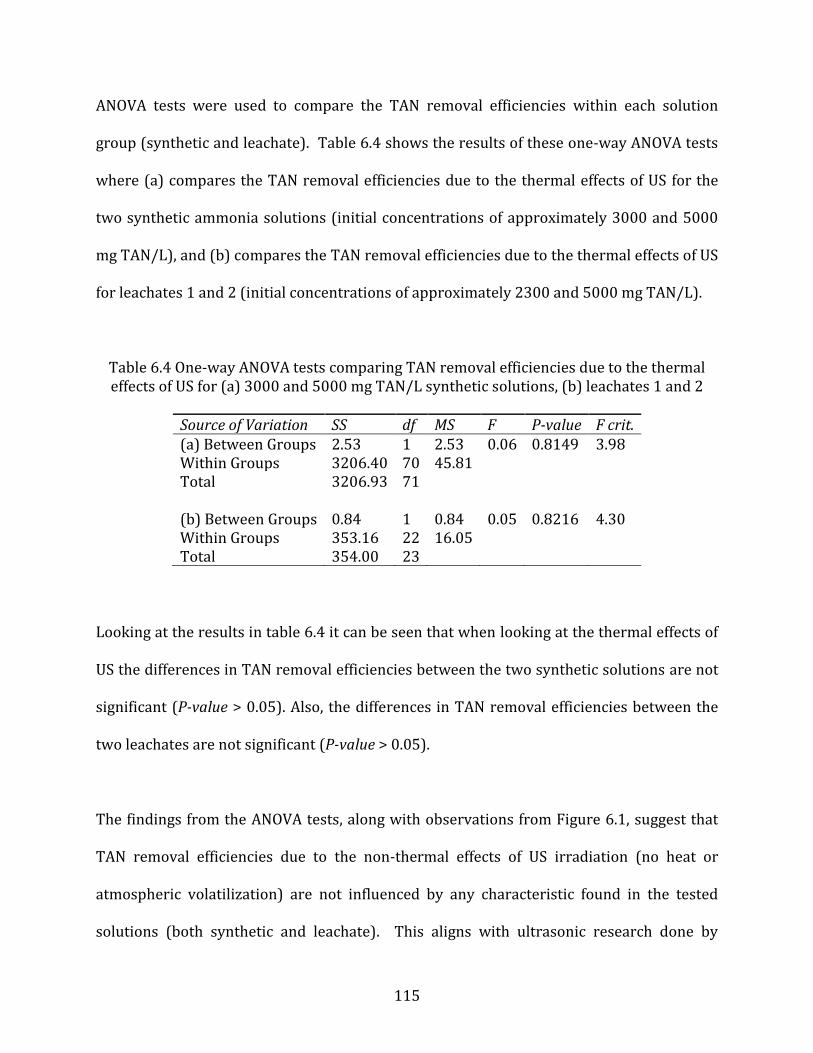
115
ANOVA tests were used to compare the TAN removal efficiencies within each solution
group (synthetic and leachate). Table 6.4 shows the results of these one-way ANOVA tests
where (a) compares the TAN removal efficiencies due to the thermal effects of US for the
two synthetic ammonia solutions (initial concentrations of approximately 3000 and 5000
mg TAN/L), and (b) compares the TAN removal efficiencies due to the thermal effects of US
for leachates 1 and 2 (initial concentrations of approximately 2300 and 5000 mg TAN/L).
Table 6.4 One-way ANOVA tests comparing TAN removal efficiencies due to the thermal effects of US for (a) 3000 and 5000 mg TAN/L synthetic solutions, (b) leachates 1 and 2
Source of Variation SS df MS F P-value F crit. (a) Between Groups 2.53 1 2.53 0.06 0.8149 3.98 Within Groups 3206.40 70 45.81
Total 3206.93 71 (b) Between Groups 0.84 1 0.84 0.05 0.8216 4.30 Within Groups 353.16 22 16.05 Total 354.00 23
Looking at the results in table 6.4 it can be seen that when looking at the thermal effects of
US the differences in TAN removal efficiencies between the two synthetic solutions are not
significant (P-value > 0.05). Also, the differences in TAN removal efficiencies between the
two leachates are not significant (P-value > 0.05).
The findings from the ANOVA tests, along with observations from Figure 6.1, suggest that
TAN removal efficiencies due to the non-thermal effects of US irradiation (no heat or
atmospheric volatilization) are not influenced by any characteristic found in the tested
solutions (both synthetic and leachate). This aligns with ultrasonic research done by
116
Kotronarou (1992) and Cost et al. (1993) on the effects of large and small particulate
matter on the removal of hydrogen sulfide (H2S) by US and the effects of particulate matter
and alkalinity on the removal of p-nitrocatechol (p-Np) by US, respectively. Both of these
studies found that particulate matter and alkalinity had no significant impact on the
removal of H2S or p-Np.
Alternately, the findings from the ANOVA tests, along with observations from Figure 6.1,
suggest that TAN removal efficiencies due to the thermal effects of US irradiation (heat
only, no atmospheric volatilization) are influenced by the characteristics found in the
tested leachates (BOD, COD, TSS, TKN, Alkalinity, etc.). A hypothesis would be that the
difference in saturation of the synthetic solutions versus the leachates is the cause of
increased ammonia volatilization – the leachates having far more dissolved constituents
than the synthetic solutions. The higher amount of dissolved molecules in leachate would
cause more collisions due to molecular agitation from a heat increase. This in-turn would
raise the temperature more rapidly than in the synthetic solution and increase the
volatilization of the compounds with the lowest boiling points, which would include NH3.
However, it is not clear which leachate characteristic(s) contribute to these significantly
different TAN removal efficiencies.
At a qualitative level, the use of US results in no foam or scum production in the leachate
samples as well as no sludge or particulate production. These two observations are main
benefits of US over other ammonia removal methods including electrocoagulation and
chemical precipitation.

117
The results obtained through testing and analysis coupled with the results from literature
would indicate that US irradiation, when heat production is mitigated, is a non-selective
ammonia removal treatment method; non-selective meaning that the initial characteristics
of the aqueous solution being sonicated have little to no impact on the removal of
ammonia.
6.3 Conclusions
These additional tests show that the non-thermal effects of US irradiation presents
statistically consistent removal of ammonia nitrogen across a wide range of aqueous
solutions – from simple synthetic solutions to complex leachates emulating landfills of
different ages. This indicates a level of non-selectivity in US irradiation which is valuable
when treating a polluted aqueous source as variable as landfill leachate. However, in order
to obtain these consistent removal results cooling the solution being sonicated is necessary.
These findings require further investigation to more fully understand which specific
characteristics of landfill leachate have the potential to influence ammonia removal by US.
Also, an investigation into which characteristics of leachate contribute to the increased
thermal volatilization of ammonia would be beneficial.
118
References
Hua, I., Hochemer, R. H., and Hoffmann, M. R. (1995). Sonochemical Degradation of p-Nitrophenol in a Parallel-Plate Near-Field Acoustical Processor. Environtal Science and Technology, 29(11), 2790-2796.
Kotronarou, A. (1992). Ultrasonic Irradiation of Chemical Compounds in Aqueous Solution.
Ph.D. Dissertation, California Institute of Technology, Pasadena, CA. Słomczyńska, B. and Słomczyński, T. (2004). Physio-Chemical and Toxicological
Characteristics of Leachates from MSW Landfills. Polish Journal of Environmental Studies, 13(6), 627-637.
Wang, S., Wu, X., Wang, Y., Li, Q., and Tao, M. (2008). Removal of organic matter and
ammonia nitrogen from landfill leachate by ultrasound. Ultrasonics Sonochemistry, 15, 933-937.
119
7 CHAPTER VII Conclusions and Recommendations
7.1 Conclusions
The application of ultrasound irradiation to remove ammonia nitrogen from aqueous
solutions, including lab-made simulated landfill leachate, at 20 kHz was investigated in this
thesis. Batch experiments were carried out using two synthetic solutions with initial
ammonia concentrations of 3000 and 5000 mg TAN/L in addition to two leachates from
new and old landfills.
The results of testing showed that US irradiation is an effective treatment technology for
the removal of aqueous ammonia. More specifically, it was found that increasing sonication
time and pH increased ammonia removal. The maximum observed removal efficiency of
ammonia was 87.4% at a pH of 11 and sonication time of 25 minutes. Also, it was found
that volatilization of ammonia to the atmosphere accounted for 0 - 7% of removal, the
thermal effect of US accounted for 21.1 - 52.7%, and the non-thermal effect of US accounted
for 44.5 - 78.8% (depending on pH and sonication time).
Results of factorial design and response surface methodology showed that pH, energy
output (kJ), and the interaction between the two were significant parameters. The
predicted two factor interaction model was in close agreement to the observed data (R2 of
0.94) and produced an optimum ammonia removal efficiency of 87% at a pH of 10.9 and
energy output of 94.8 kJ.

120
Additional testing showed similar average TAN removals for all solutions tested (two
synthetic solutions and two leachates with initial ammonia concentrations of
approximately 3000, 5000, 2400, and 5100 mg TAN/L, respectively) at a pH of 10,
sonication time of 25 minutes, and US power output amplitude of 100%. Analysis of
variance tests on the full data sets showed that differences in the TAN removal efficiency of
ammonia due to the non-thermal effects of ultrasound between synthetic and leachate
solutions were not significant. Also, that the differences in total TAN removal between
different initial ammonia concentrations within a solution group (synthetic or leachate)
were not significant. However, significant differences between TAN removal efficiencies
were observed between synthetic and leachate solution groups when the thermal effects of
US were isolated, showing higher ammonia volatilization due to heat in the leachates
versus synthetic solutions.
These results indicate that ultrasound irradiation is not only an effective method for the
removal of ammonia nitrogen from highly concentrated aqueous solutions, but also
potentially non-selective.
7.2 Future Work
Ultrasound irradiation has been shown to be an effective method for the removal of
ammonia nitrogen from highly concentrated aqueous solutions. However, all experiments
were done in batches, with continuous sonication, and no heat mitigation. Also,
experiments were only carried out using 4 different solutions (two synthetic and two
leachates).
121
Future experiments could include using a continuous flow of incoming solution or leachate
to simulate how ultrasonic technologies would be used in a real-world scenario; the use of
various pulse settings for sonication times (ex: 30s on, 30s off, repeating) should be
explored to determine the most efficient timings for the removal of ammonia nitrogen; and
a cold water bath to mitigate heat production to further explore the findings regarding
removal efficiency due to thermal and non-thermal effects. Also, experiments could be
performed with many leachates with differing characteristics to test the findings of non-
selectivity further. Furthermore, experiments could be done to find a range of ultrasonic tip
depths for a given volume of solution. Lastly, due to conflicting conclusions regarding the
removal pathways of ammonia by ultrasound, experiments should be carried out inhibiting
ammonia removal by hydroxyl radical to determine whether removal is predominated by
chemical (oxidation) or physical (pyrolysis) mechanisms.