Embed Size (px)
Citation preview

IN DEGREE PROJECT ELECTRICAL ENGINEERING,SECOND CYCLE, 30 CREDITS
, STOCKHOLM SWEDEN 2016
Static Watt Compensation System Design: Modeling, Control Strategies, and Component Dimensioning
CARLOS JOSÉ ARIAS BANDRY
KTH ROYAL INSTITUTE OF TECHNOLOGYSCHOOL OF ELECTRICAL ENGINEERING

Static Watt Compensation System Design: Modeling, Control Strategies, and Component
Dimensioning
Carlos José Arias Bandry
A master thesis written in collaboration with:
Department of Electromagnetic Engineering KTH Royal Institute of Technology
Stockholm, Sweden
And
ABB AB, FACTS Västerås, Sweden
EI270X Degree Project in Electrotechnical Theory and Design Master of Science in Electric Power Engineering
KTH Electrical Engineering School August 2016

2
KTH Electrical Engineering
EI270X Degree Project in
Electrotechnical Theory and Design
Static Watt Compensation System Design: Modeling, Control Strategies, and Component Dimensioning
Carlos José Arias Bandry
Approved
2016-08-25
Examiner
Hans Edin
Supervisor KTH
Nathaniel Taylor / Daniel Månsson
Program Director TELPM
Lars Nordström
Supervisor ABB
Magnus Tarle
Abstract
Stainless steel is a widely used material, from basic household appliances to construction material in large buildings. Nickel is one of the components required to produce stainless steel, and one of its production sources is nickel pig iron.
Nickel pig iron smelting facilities commonly use submerged-arc furnaces (SAFs) to extract the nickel from the ferronickel ores due to their high-temperature smelting capabilities. However, these furnaces present a highly fluctuating electric load to the power system as a result of the loss of arc on their electrodes being part of their normal operation.
The scope of this project is focused on weak islanded power systems with no interconnection with the local utility, meaning that their installed power generation is the solely responsible for the system stability and power supply.
A power system with significant power consumption drops within short time frames is not able to recover stability when the power generators are incapable of following this demand function, and this is the reason why an active power compensation system is required.
This power compensation system, together with a conventional static var compensator, could provide a good solution to address both the stability and power quality issues on these types of islanded power networks.
An active power compensation device is to be designed in this project, including both its components and its control strategies.
The power system is to be modeled and analyzed both in normal operation and in the presence of transient events. Both a technical and a cost analyses are the base to perform an assessment of the functionality and profitability of the active power compensator, drawing conclusions and recommendation for further development of the system.

3
KTH Elektro- och systemteknik
EI270X Examensarbete inom elektroteknisk teori och konstruktion
Static Watt Compensation System Design: Modeling, Control Strategies, and Component Dimensioning
Carlos José Arias Bandry
Godkänt
2016-08-25
Examinator
Hans Edin
Handledare KTH
Nathaniel Taylor / Daniel Månsson
Uppdragsgivare TELPM
Lars Nordström
Handledare ABB
Magnus Tarle
Sammanfattning
Rostfritt stål är ett allmänt använt material: från hushållsapparater till konstruktionsmaterial i stora byggnader. Nickel är en av de komponenter som krävs för att producera rostfritt stål, och en av dess produktionskällor är nickel tackjärn.
Smältverk för nickel tackjärn använder ofta elektriska ljusbågsugnar för att extrahera nickel från ferromalmer. Men dessa ugnar presenterar en mycket varierande elektrisk belastning på kraftsystemet då förlust av ljusbågen på deras elektroder ofta sker under deras normala drift.
Detta projekt är inriktat på svaga kraftsystem i ödrift, vilket innebär att deras installerade kraftproduktion helt ansvarar för systemets strömförsörjning och stabilitet.
Ett kraftsystem med stora laständringar inom korta tidsramar kommer att ha svårt att hålla stabil drift med accepterbar elkvalitet; ett system för kompensering av aktiveffekt krävs.
Sådan effektkompensering, tillsammans med en konventionell statisk var-kompensator, kan ge en bra lösning för att bemöta både stabilitet och kvalitetsfrågor för kraftnät i ödrift.
En aktiveffektersättning (kallad här för SWC) ska utformas i projektet, inklusive dess komponenter och dess kontrollstrategier.
Kraftsystemet ska modelleras och analyseras både vid normal drift och vid transienttillstånd. Både tekniska och kostnadsanalyser används för bedömning av den utvecklade SWC:s funktionalitet och lönsamhet, och rekommendationer för vidareutveckling.

4
Table of contents
Abstract .................................................................................................... 2
Sammanfattning ....................................................................................... 3
Table of contents ..................................................................................... 4
Acknowledgment ..................................................................................... 6
Nomenclature ........................................................................................... 7
Notations ......................................................................................................................... 7
Abbreviations ................................................................................................................... 7
Chapter 1: Introduction............................................................................ 8
1.1 Project background .................................................................................................... 8
1.2 Submerged-arc furnaces ........................................................................................... 8
1.3 Motivation ................................................................................................................ 10
1.4 Purpose ................................................................................................................... 10
1.5 Aim .......................................................................................................................... 10
1.6 Methodology ............................................................................................................ 11
Chapter 2: Literature review .................................................................. 12
2.1 Power quality ........................................................................................................... 12
2.2 Power stability ......................................................................................................... 13
2.3 Active power and frequency control ......................................................................... 14
2.4 Previous work .......................................................................................................... 14
Chapter 3: Study case ........................................................................... 16
3.1 Diesel power plant ................................................................................................... 17
3.2 Coal-fired power plant.............................................................................................. 17
3.3 Submerged-arc furnaces ......................................................................................... 17
3.4 Utility and auxiliary loads ......................................................................................... 19
3.5 NPI smelting facility operation ................................................................................. 19
Chapter 4: SWC system development .................................................. 21
4.1 System model .......................................................................................................... 21
4.2 SWC components .................................................................................................... 24
4.3 Thyristor-firing circuits.............................................................................................. 25
4.4 Control scheme ....................................................................................................... 27
4.4.1 Operator controls .................................................................................................. 29
Chapter 5: Technical analysis ............................................................... 32
5.1 Normal operation ..................................................................................................... 32
5.1.1 Harmonic content ................................................................................................. 38

5
5.2 Transient events ...................................................................................................... 42
Chapter 6: Cost analysis ....................................................................... 51
6.1 Operating cost ......................................................................................................... 51
6.2 Investment cost ....................................................................................................... 54
Chapter 7: Conclusions and future improvement ............................... 55
7.1 Conclusions ............................................................................................................. 55
7.1.1 Technical analysis conclusions ............................................................................. 55
7.1.2 Cost analysis conclusions ..................................................................................... 56
7.2 Recommendations ................................................................................................... 56
7.3 Future development ................................................................................................. 57
References .............................................................................................. 58
Appendix A: Single-line diagram .......................................................... 59
Appendix B: MATLAB code ................................................................... 61
Appendix C: PSCAD simulation file canvas ......................................... 64

6
Acknowledgment
First I would like to thank ABB FACTS for allowing me the opportunity to conduct my thesis project with them, with special thanks to my professor and colleague Richard Rivas for his unconditional support.
I have enjoyed both working on the project and the friendly and cooperative environment at ABB FACTS in Västerås. I sincerely appreciate all the guidance and help provided by my supervisor Magnus Tarle.
My sincere gratitude also goes to Christian Payerl, Andrea Grondona, Charles Sao, Jean-Philippe Hasler, Marguerite Holmberg, and Mohsen Asoodar who made the progress and eventual completion of this project possible through their continued guidance and support at ABB FACTS.
I would also like to thank Hans Edin, my professor at KTH for several courses who accepted to examine my efforts on this thesis project, as well as my two KTH supervisors Nathaniel Taylor and Daniel Månsson for their continued support.
Finally, I would like to thank my family, girlfriend, and friends for their support over these two years of my master program, both in the good and in the bad moments.
Carlos Arias
Stockholm, August 2016

7
Nomenclature
The nomenclature to be implemented in this document is shown below, divided into two different sections: notations and abbreviations.
“Notations” contains symbols and units utilized through this document while “Abbreviations” contains the acronyms and abbreviations instead.
Notations
Symbol Description
MW megawatt
kW kilowatt
MVA megavolt-ampere
MVAr megavolt-ampere reactive
kV kilovolts
min minutes
s seconds
ms milliseconds
kWh kilowatt hour
MWh megawatt hour
Hz hertz
L-L line to line
R resistance
L inductance
H henry
Ω ohm
Abbreviations
SAF/EAF submerged-arc furnace/electric-arc furnace
SWC static watt compensator
SVC static var compensator
NPI nickel pig iron
OLTC on-load tap changer
FACTS flexible AC transmission systems
TCR thyristor-controlled reactor
AC alternating current
FFT fast Fourier transform
BESS battery energy storage system
MRO maintenance, repair and operations

8
Chapter 1: Introduction
The current technology surrounding the power systems provides a suitable infrastructure to develop small and medium-sized autonomous power networks in remote areas.
Common examples of these networks are mining facilities, which harvest natural resources, such as coal, natural gas, and nickel among others, occasionally located at inaccessible regions for the power transmission grid.
Islanded power networks with weak interconnections to the transmission grid or local power generation have to constantly deal with frequency fluctuation problems due to partial or full load shedding (due to switching or failure).
In the specific case of mining facilities, it is of particular importance to guarantee the controlled operation of the whole network. A single disturbance or failure could lead to load shedding, resulting in loss of the system power stability followed by a complete blackout of the power system for the mine.
In consequence, a cost-efficient and optimized solution is required to provide a proper active power compensation system capable of mitigating considerable active power swings to retain the stability and power quality of the islanded system.
1.1 Project background
Stainless steel is a widely used material due to its resistance to corrosion and staining and its low maintenance requirement. It is utilized as a material in many applications, ranging from basic household cutlery to power transmission and distribution components, and to the automotive and aircraft industries.
Nickel is one of the components required to produce stainless steel, and two thirds of the world’s nickel production is destined to stainless steel manufacture [1]. Nickel pig iron (NPI) is a low grade ferronickel which offers a cheaper alternative to pure nickel for stainless steel manufacture [2].
The power generation sources found on the already operational NPI smelting facilities within the scope of this project are a mix between diesel and coal, with a significant amount of diesel generation needed to handle the submerged-arc furnaces’ (SAFs’) load variations and frequent load drop caused by arc loss.
Considering the drop in nickel price in the last few years, it is of particular interest to reduce the operating costs of the production plant. Even though the diesel generation has a higher controllability, it also has a higher operating cost. Therefore, solutions to reduce the use of diesel generation considering an increase in generation from the coal-fired power plant are desirable.
The implementation of an active power compensation system could provide additional tools for the power generation mix optimization, resulting in efficient usage of both the diesel and the coal-fired generators. Thereby, the operating costs of the ferronickel plant can be reduced.
1.2 Submerged-arc furnaces
Submerged-arc furnaces (SAFs) are implemented for material purification and reduction processes, being the most important component of a NPI smelting facility.
The most common physical arrangement consists of a circular bath with three vertical electrodes arranged in a triangle, as shown in figure 1 below [3]:

9
Figure 1. Submerged-arc furnace scheme [3]
The concept behind the SAFs mode of operation is the electric resistance heating. Both the NPI ores and the slag are subjected to high temperatures as a result of an electric current flowing between the electrodes and the furnace hearth [3].
Figure 2. Submerged-arc furnace in operation [4]
There are two main sources of heating in this process: electric arc generated between the electrode tip and the hearth, and the electric current flowing through the charge (nickel ores) itself.
The SAF’s normal mode of operation presents a highly fluctuating load profile, characterized by two important aspects:
First, the nature of the melting process generates a constant variation of the equivalent resistance of the burden to the electric current. This could be a consequence of burden drop or reshaping as well as changes on the resistivity of the material due to impurities of the ore.
Second, the recurrent loss of electric arc results in a power load loss on the system. The arc produced between the electrode and the hearth is surrounded by an unstable

10
and dynamic melting mass of material, which could extinguish the electric arc at any random moment.
Whenever the arc is lost the charge repositions itself, causing the loss of a major percentage of the load within a few seconds time frame until the arc is formed again and the melting process is able to continue. AC generators are not able to handle this type of fast active power variation with such a steep loading ramp if the SAFs are a significant part of the generator’s load, resulting in tripping of the generation units and loss of system stability.
1.3 Motivation
Major active power swings generated due to the fluctuating nature of the SAFs operation constitute a critical issue for the power stability of the system. Having a load reduction of 80% within a time frame of only seconds can lead to a preventive disconnection of the generators by their protection system to avoid damage or over speeding.
The implementation of an active power compensation system, here referred to as a static watt compensator (SWC), provides mitigation of large power fluctuations, resulting in a more controllable and secure power system operation.
Moreover, the addition of the SWC to the islanded power network of the NPI smelting facility allows fuel optimization, both diesel and coal, resulting in a cost reduction for the ferronickel smelting plant owner.
1.4 Purpose
The SWC’s main purpose is to compensate the power consumption deficit due to the loss of electric arc within the SAFs.
This system also provides load ramping capabilities, not possible to follow by coal-based generation alone, when a SAF is disconnected due to a failure or maintenance. The SWC can also be implemented to ramp up/down smoothly while starting-up/shutting-down the SAFs.
In the simple form studied here, the SWC is a system that wastes energy for few seconds in a high-power resistor, but provides system stability while running steam generators. As a consequence, less diesel is burned (replaced by coal) and the operating cost of the smelting facility is reduced.
1.5 Aim
The aim of this thesis is to design an active power compensation system along with its control strategy for a NPI smelting facility. In addition to that, a requirement set list is to be developed for the component dimensioning of the SWC.
For this design, the system is to be analyzed both in steady state (normal and contingency operation modes) as well as during transient events such as faults. Nevertheless, both the detailed modelling of the system network and the dynamic analysis of the generators are outside the scope of this project.
A detailed description of the system to be studied can be found in chapter 3: study case, and a detailed description of the different scenarios to be modelled can be found in chapter 4: SWC system development.

11
1.6 Methodology
The step-by-step methodology to follow for this study is presented below:
1. Evaluation of the study case and the typical power system configuration and mode of operation
2. Development of a preliminary model of the SWC, both a physical model (impedance + thyristor valve) and a control strategy (a preliminary control diagram)
3. Analysis of the system behavior during normal operation including the SWC
4. Analysis of the system behavior during contingency situations such as load shedding and loss of arc including the SWC
5. Analysis of the system behavior during different transient scenarios including the SWC
6. Permutation of the scenarios described in 4 and 5
7. Development of an optimized model of the SWC
It is important to highlight that an iterative test-and-improve designing process occurs during all the aforementioned steps.

12
Chapter 2: Literature review
Power system quality, stability and power compensation are the main three reviewed topics in order to obtain the general parameters, requirements, and delimitations for a suitable active power compensation system design.
Special emphasis should be given to the power stability and power quality areas within the scope of islanded systems and weak power networks, so that the system is fully capable of operating with the desirable performance.
2.1 Power quality
Power quality could be defined as a set of requirements a power system has to meet in order to safely deliver power to its customers in a proper manner. This is a broad concept constituted by several subtopics ranging from frequency variations and voltage fluctuations to continuity of supply [5].
When dealing with industrial power installations (NPI smelting facilities in this case) as the end user or customer, the most relevant subtopics to be considered are voltage fluctuations and flickers, voltage and current unbalances and harmonics, and power compensation.
Voltage fluctuations refer to the maximum tolerance of voltage variation allowed on the system to avoid operational problems on electrical equipment. These fluctuations are defined as the cyclic variation of voltage amplitude that does not exceed ± 10 % under normal operation [5].
Failure to comply with the aforementioned voltage fluctuation tolerance results in poor quality of the power system. A system with highly fluctuating voltages incurs in higher losses and premature wear of rotors in motors and generators, as well as distortion (commonly referred to as flickers) in lighting devices. Moreover, it provides a hostile environment for electric equipment insulation systems, resulting in shortening of their lifetime cycles.
The fundamentals of the smelting process using SAFs suggest a naturally unbalanced electric load for the power system.
Whenever an electrode loses its electric arc or the ferronickel ores fall due to the smelting process, unbalanced phase currents and asymmetrical voltage variations are generated in the power system, resulting in lost voltage balance at the system nodes [5].
These unbalances provide the path for negative-sequence currents to flow in the system due to a counter rotating magnetic-field (with respect to the main-field). The resultant field, rotating at double-frequency, causes undesirable eddy-currents to flow in various structures such as the machine’s rotor body, excitation winding, stator, end-windings, etc. As a consequence, additional losses due to equipment and conductor overheating appear in the system and the electrical equipment is forced to operate in presence of current and voltage levels for which they were not specified.
The non-linear voltage/current characteristic produced by the SAFs results in harmonics disturbances to the system, commonly quantified as a whole as the total harmonic distortion (THD) [5].
The maximum amount permissible of voltage THD depends on each country and their specific harmonics distortion factor standards. In addition to that, the percentage of

13
each specific harmonic group (even, odd, multiple of 3, among others) tolerance is defined in those standards as well.
The high content of harmonics in the power system, as well as voltage fluctuations and current/voltage unbalances, are main features of a poor-quality system.
These fluctuations and harmonics produced by unbalanced loads have a significant impact on the system performance, decreasing the power factor and the overall efficiency of the system.
A well-established solution to mitigate these effects is power compensation. Reactive power compensation is widely used to counter the voltage and current unbalances, as well as filters are commonly used to decrease the harmonic distortion.
Within the industrial power facilities area, the implementation of power electronic compensators is the common solution. These compensators rely on advanced power electronics to create a controllable and adaptive system with the sole purpose of improving the power quality of the power system.
In general, Flexible AC Transmission Systems (FACTS) controllers are divided in four categories [6]:
Series controllers
Shunt controllers
Combined series-series controllers
Combined series-shunt controllers
One of the most commonly implemented shunt controllers, and the one to be considered in this project, is the static var compensator (SVC). It is utilized to produce inductive or capacitive currents in order to maintain or control specific parameters of the power system [6]. Such specific parameters are voltage drops, harmonic distortion, unbalanced active or reactive currents, and power factor.
2.2 Power stability
Another important issue to take into consideration when studying islanded systems is the power stability. When dealing with soft systems with diesel generation sets or dedicated coal-fueled power plants, it is important to guarantee that system variables such as frequency and voltage remain within suitable operation values on the power grid.
The concept of the stability of a power system could be defined as the ability of the system to dissipate or damp oscillations caused by any disturbances, and regain a state of operating equilibrium after the oscillation clearance [7].
Sharp variation in the power load of the SAFs could create significant variations in the frequency of the system, resulting in a loss of synchronism and disconnection of the generators by their protective units on the generation stations.
In addition to that, a highly fluctuating power load with large variations within few milliseconds could force the generators to steep generation ramping, thus wearing their components and reducing their life cycle [8].
From an economical perspective, if the frequency of the system is not stable, the generators have to modify their power output constantly, resulting in inefficient fuel consumption.
Power system stability can be classified by focusing on mainly one variable as follows [6]:

14
Rotor angle stability
Frequency stability
Voltage stability
Rotor angle stability is related to the ability of the synchronous machines to remain in synchronism after being exposed to a perturbation [7]. In the context of islanded power systems, any disturbance produced by a fluctuating load will have direct impact on the synchronous generators due to the lack of an interconnected network and any reserve capacity.
In the case of the SAFs, the fluctuating nature of their load could represent a serious challenge for the generators to maintain the rotor angle stability in islanded systems.
Frequency stability deals with the ability of a power system to remain operational at a steady frequency after being subjected to a significant frequency variation due to power generation and load unbalances [7].
The frequency variation range limits differs from power system to power system. As an example, the Swedish regulation dictates that a maximum variation of 0.1 Hz should be handled by the primary control [9].
The steady state frequency on the power system should be within the range of the design requirements of all the generation, transmission, distribution, and load equipment in order to provide a suitable environment for a good performance of the power grid.
Voltage stability is similar to the frequency stability, but the main focus is on the voltage on the power grid buses. The power system should be capable of maintaining a steady voltage profile through all the buses in the system, both under normal operating conditions and after having suffered from a perturbation [7]. The voltage profile should remain within the ± 10 % range for voltage fluctuation stated in section 2.1 “Power quality” of this document.
2.3 Active power and frequency control
Electric power systems are a unique case of supply and demand, in which the amount of power produced has to match the power consumed plus the losses at any given time due to the very small stored energy in the network.
Small unbalances caused by light disturbances can be compensated by the inertia stored in the rotating masses in the system in conjunction with the primary control, but larger perturbations require special control systems in order for the power system to remain stable [7].
Given the short time frame for the fluctuations caused by the SAFs, only the primary control is to be considered in this analysis.
However, the instantaneous large-sized load variations of the SAFs have to be handled by a quick-response system, which should be able to operate faster than the primary control to compensate for these unbalances: the SWC.
2.4 Previous work
Over the last years the research topic and the prevalent solution of choice when facing power quality or stability issues has been reactive power compensation, mainly through FACTS.

15
Different solutions for active power compensation have been studied and developed, ranging from flywheels and pumped hydro storage, to supercapacitors and superconducting magnetic energy storage [10].
However, those solutions are conceived as a power reserve for the system, meaning that they can store energy when there is a surplus and supply it back to the system when required.
In the case of the islanded NPI smelting facilities, when the SAFs suffer an arc loss the load is greatly reduced very quick, causing stability problems for the islanded power network. The possibility of compensating this quick power drops with a momentary dummy load provided by the SWC accommodates another possible solution instead of a conventional energy storage system.
Little research has been done on this specific type of active compensation system that compensates lost active power consumption on the power network in order to maintain the stable operation of the generation plants in islanded systems.
Nevertheless, a previous active power system was developed back in 1982 in order to compensate significant load variations produced by earlier EAFs models. The Iron & Steel Company of Trinidad and Tobago (ISCOTT) conducted several studies to determine that an active power compensation system was necessary to compensate the active power swings produced by the EAFs on their production line [11]. The proposed active power compensation system was constituted of ten 3 MW high-power thyristor-controlled resistors. These three-phase wye-connected resistors were connected to the same bus as the EAFs through a 30 MVA three-winding transformer on the 33 kV voltage level, and supplied power through four 62.5 MW gas turbine generators and a 132 kV transmission network [11].
The SWC was able to operate on steps of 3 MW up to 30 MW and it provided a safe de-energization of the EAFs after fault tripping with a rate of 10 MW/min [11]. The first resistor would be switched on within the first 50 ms following the load change with a resistor connection rate of 3 MW each 15 ms [11].
Although the energy consumed by the SWC during the active power compensation process (825 kWh for full compensation of one arc loss event) ultimately adds to the cost of the steel produced, the results of the implementation of the SWC were positive and allowed the steel and iron plant to operate at full capacity without any operational restraints.

16
Chapter 3: Study case
The power system case to be considered for the development of the SWC is a NPI smelting facility, powered by both diesel and coal-fired steam turbine generators.
The main components of the system are:
Diesel generation power plant: two 20 MW diesel generators
Coal-fired power plant: two 60 MW coal-fueled steam turbine generators
SAF: two 40 MW SAFs
Utility and auxiliary loads
The facilities considered within the scope of this project operate in remote locations as islanded power networks with neither transmission interconnection to the local power grid nor energy storage systems, with the following general grid data:
Nominal voltage on the generation bus: 11 kV
Nominal voltage on the load bus: 33 kV
Voltage tolerance: ± 10 %
Frequency: 50 Hz
Part of the system components are assumed to share the load profile and rated values as equipment installed in another existing and fully operational NPI smelting facilities run by the same owner.
The single-line diagram for the NPI smelting facility is shown below in figure 3, and can be found in the Appendix A: “Single-line diagram” of this document in a full page for detailed reading.
Figure 3. NPI smelting facility single-line diagram

17
3.1 Diesel power plant
The diesel generators characteristics being considered for the system analysis resemble the Wärtsilä generating sets, given their implementation on other already operational NPI processing plants.
The specific generating sets model to be contemplated on the power network is Wärtsilä 50DF with the following main features [12]:
Electric power output: 17.55 MW
Power factor: 0.8
Speed: 514 rpm
Maximum overload output: 110 %
Maximum step-wise load increase: 33 %
Steady-state frequency band ≤ 1 %
Maximum speed drop 10 %
Recovery time ≤ 5 s
Time between load steps ≥ 10 s
The diesel generating sets rating considered for this study is 20 MW with the features and characteristics of the 50DF.
3.2 Coal-fired power plant
The coal-fired power plant is assumed to have the following characteristics:
Minimum load operation: 40-50 %
Ramp rate: 3-5 %/min
This ramp rate is an average estimation for a typical IGCC power plant according to the IEA Clean Coal Centre [13].
3.3 Submerged-arc furnaces
Each SAF is connected to the grid through three single-phase power transformers with the following description: 33/0.1-1.8 kV, 65 MVA, with OLTC on the low-voltage winding.
These transformers are specially designed for SAFs, thus the wide range of steps of the OLTC in order to provide the specified range of voltages at their low-voltage side. The power factor of the SAFs also fluctuates, ranging from 0.5 to 0.8, having the critical scenario during the starting process.
The SAFs are assumed to be having the commonly implemented Knapsack connection for the electrodes, which minimizes the reactance on the low-voltage side of the transformer and is showed in figure 4 [14, 15]. This is the connection of the SAFs’ electrodes, but the power supply transformers of the SAFs are simply connected in delta.

18
Figure 4. Typical SAF Knapsack connection
The load profile and mode of operation of the 40 MW SAFs is assumed to correspond with the data measured from the study case NPI facility, and with the following characteristics:
Active power consumption over a 24-hour period as follows: o Average: 38 MW o Minimum: 32 MW o Maximum: 44 MW
Loss of the electric arc on one of the three electrodes may occur every 6 minutes on average
The total time between loss and reestablishment of average power is approximately 12 seconds
The power drop following the loss of the electric arc can be characterized as follows:
o 20 % power loss over a 3.5 second period o 50 % power loss over a 4.75 second period o 85 % power loss over a 7.43 second period
The "X% power loss over a Y s period" describes the loss of power when the electric arc is lost. The power is reduced by 20 % during the first 3.5 seconds after the arc loss and so on, characterizing the power loss in a step-wise fashion during the period after the loss of arc event has happened. These measurements were provided by the NPI facilities owner and a graphic of the power drop after the loss of arc function is shown below in figure 5 for better understanding.

19
Figure 5. Power drop after arc loss
Even though the measurements suggest a power drop after arc drop for longer than 15 seconds, the average reestablishment of full load time of 12 seconds is the one to be considered for this study.
3.4 Utility and auxiliary loads
The NPI facility load under normal operation considered for this study is 95 MW, where each SAF is rated 40 MW, and the remaining 15 MW is from the rest of the loads of the plant. An average value of 15 MW will be assumed for the utility and auxiliary loads of the facility with a power factor of 0.8 for the network analysis.
3.5 NPI smelting facility operation
The NPI smelting facility is assumed to operate using both diesel and coal-fired power generation under normal operation with the following configuration:
Power generation mix
The base load power is to be produced using the coal-fired power plant, with one generator at full capacity (60 MW) and the second one at 50 % of its capacity (30 MW), giving a total of 90 MW to supply both SAFs plus 10 MW of the total utility/auxiliary loads.
This configuration guarantees an efficient performance point for each generator, having one of them fully loaded at its rated value and the other one operating at 50 % of its full production. There are other possible efficient configurations such as 75 % load for each generator, but the aforementioned arrangement (100 % – 50 %) is the one to be studied in this project
The diesel power plant is set to be an intermittent power source constituted by:
One generating set producing 5 MW to cover the rest of the average utility/auxiliary loads with a reserve of 15 MW to handle load variations
One standby generating set ready to handle fast generation ramp requirements

20
Load
Both SAFs are considered to be connected simultaneously with all three electrodes operational (worst case scenario with 2x40 MW). In addition to that, 100 % of the average utility and auxiliary loads are assumed to be connected (15 MW static load as worst case scenario) as a fixed value.

21
Chapter 4: SWC system development
The power system modelling and simulation on this project is to be implemented in the PSCADTM/EMTDCTM software for power system transient simulations.
This development process can be divided into four major stages: study case, SWC components, thyristor-firing circuits, and control scheme.
A significant assumption made when modelling the system, and for the development of the SWC, is the existence of an SVC installed together with the SWC and the SAF on each bus bar. The SVCs are assumed to guarantee the unity power factor, power balance, and the rated voltage value of 33 kV at the furnace bus bars. The specific type of SVC is yet to be defined and it is not part of the scope of this project.
4.1 System model
The power network is conformed three major areas: generation, SAFs, and other loads as it is shown in figure 6 below.
Figure 6. NPI smelting facility power network modeled in PSCAD
No protection/switching devices such as breakers nor connecting components such as cables or overhead lines have been taken into consideration in this model. Each major component is to be covered in detail below.
The NPI smelting facility requirements on each SAF bus are:
Maximum ± 5 MW fluctuations during normal operation
Full active power compensation during power drops after electric arc loss
A ramping power capability of 0.7 MW/min for the coal power plant to be able to follow the consumption changes while starting up or shutting down the SAFs
Steady power compensation provided by the SWC up to 20 MW for several hours if needed

22
Generation
The generation bus is modeled as an infinite bus with an ideal, three-phase 11 kV voltage source with zero impedance for the SWC development.
SAFs
The submerged-arc furnaces, together with their power supply transformers, are modeled as a set of three single-phase, star-connected variable resistors. The resistance values are varied over time, resulting in the SAF power consumption varying according to the arc drop characteristic presented in section 3.3 “Submerged-arc furnaces” of this document.
These set of values are created assuming 33 kV L-L on the SAFs bus bar, and the different power consumption variations required. An example of the equivalent resistance values is presented below in table 1.
Table 1. Resistance values fed to the SAF model in PSCAD
Table 1 shows the fluctuations in active power consumption during one second. Each furnace is assumed to vary 52 times per second within a range of ± 5 % of its rated power (40 MW) in normal condition of operation.

23
This ± 5 % fluctuation value has been assumed based on power measurements from other operational SAFs under normal condition, and it has been created as random increase/decrease values in EXCEL with a ± 5 % of the rated value of the SAF. A real-operation SAF measurement file has been used to compare and verify that the fluctuation range is accurate for the model of the SAFs within a NPI smelting facility run by the same owner.
Modeling the SAFs as pure resistors correlates with the assumption of an SVC compensating the reactive power consumption in order to guarantee a power factor of one.
The same set of equivalent resistance values is fed into the variable resistor on each phase (a, b, and c), providing some sort of “balanced” three-phase active power variation. This is not realistic, but it allows a higher controllability of the behavior of the SAFs for development purposes.
However, when the active power varies in an unbalanced fashion between the three phases in real operation, the resultant three-phase power consumption for each SAF is the measured value to be controlled, hence subtracting importance to the power variation per phase. Moreover, the impact of the unbalances between the phases on the voltage profile is assumed to be compensated by the SVC.
The equivalent resistance values are provided to the variable resistors in PSCAD through a data-reader block and a real pole transfer function in order to convert the random power values created in EXCEL into a continuous fluctuating function of active power consumption over time.
Figure 7. Equivalent resistance value feeding in PSCAD
Each SAF is fed with a 30-second set of values containing all modes of operation with the following sequence: start-up, normal operation, loss of arc, normal operation, and shut-down.
Both SAFs are modeled with a start-up function of a single step from 0 MW to normal condition. SAF1 is modeled with a shut-down function of a 50 % power drop for 2 seconds followed by full power drop to 0 MW, while SAF2 is modeled as a full power drop from normal condition to 0 MW. These functions have been assumed considering significant step-wise variations due to lack of information regarding the starting-up/shutting-down functions of the real SAFs by the time when this project has been developed.
There is an arc-drop function contained within the 30-second modelling of the SAFs according to the characteristic mentioned in section 3.3 “Submerged-arc furnaces” of this document, and it is set to occur at different moments through the simulation.
The power consumption variation on each SAF over the 30-second simulation period is presented below in table 2.

24
Table 2. SAFs behavior over the simulation period
Other loads
Auxiliary and utility loads are modeled as fixed active and reactive power consumption loads according to the considerations presented in section 3.4 “Utility and auxiliary loads” of this document.
4.2 SWC components
With only active power compensation being the main goal of the SWC, the implementation of a predominately-resistive impedance is considered for compensating the drop in active power consumption due to the arc loss.
The SWC concept is based on the Thyristor-Controlled Reactor (TCR) scheme, only considering a resistor in series with the inductor. The principle behind the SWC is firing the thyristors at a phase angle to consume the specific amount of active power required to compensate the SAF active power consumption drop.
A simple RL circuit is analyzed to obtain the expression of the RL-branch current as a function of time. The simple RL circuit analyzed is shown below in figure 8.
Figure 8. Simple RL circuit
Considering the following expressions:
√2𝑉𝑟𝑚𝑠 = Û
𝑍 = √𝑅2 + 𝜔2𝐿2
tan𝜑 =𝜔𝐿
𝑅
Simulation
time (s)
Power
consumption
(MW)
Mode of
operation
Simulation
time (s)
Power
consumption
(MW)
Mode of
operation
0-7 0Off/starting
up0-10 0
Off/starting
up
8 40 ± 5 %Normal
operation11 40 ± 5 %
Normal
operation
9-20Power drop
characteristicLoss of arc 12-22
Power drop
characteristicLoss of arc
21-22 40 ± 5 %Normal
operation23-25 40 ± 5 %
Normal
operation
23-3020 % for 2
seconds, then 0
Shutting
down/off26-30 0
Shutting
down/off
SAF1 SAF2

25
Resulting in the following phase current expression as a function of time:
𝑖(𝑡) =Û
𝑍sin(𝜑 − 𝛼)𝑒
−𝜔𝑡
tan𝜑 +Û
𝑍sin(𝜔𝑡 − 𝜑 + 𝛼)
The numerical computing software MATLAB is used to analyze the power consumption of a simple RL circuit as a function of its phase angle, repeating the process for different values of R and L with a maximum value of 13.33 MW per phase (a three-phase 40 MW value, which is the rated value of the SAFs). The MATLAB code implemented for this analysis can be found in the Appendix B: “MATLAB code” of this document.
At first, the required resistance value for a 13.33 MW consumption per phase was considered for the design with roughly 22 Ω per phase. However, a purely resistive circuit would produce a high harmonic content due to the non-continuities on the power function produced by the thyristor switching. Therefore, an inductance with the lowest value possible (in order to reduce reactive power consumption) was required, considering it being significant enough to smoothen the wave form, but small enough to have a low reactive power consumption.
As a result of the iterative design process performed in MATLAB, the selected SWC per-phase impedance contains a resistance value of 20 Ω together with an inductance value of 0.01 H. The PSCAD model of the SWC is presented below in figure 9.
Figure 9. SWC model in PSCAD
The thyristors utilized in the SWC model are the typical component configuration provided within PSCAD, and each thyristor possesses its own firing circuit to be presented in the section below.
4.3 Thyristor-firing circuits
Each thyristor gate receives a triggering pulse from its dedicated circuit, and the PSCAD per-phase implementation is shown below in picture 10.

26
Figure 10. Thyristor-firing circuit for phase a in PSCAD
Given the fact that each phase requires two thyristors, both the positive and negative half of the AC current, there are two firing circuits associated to each phase. The algorithm carried out for each circuit is presented below in figure 11.
Figure 11. Thyristor-firing circuit algorithm
The voltage on each phase is measured and a zero-crossing detector sends a pulse whenever the signal crosses zero. Three possible outputs are produced by the zero detectors: 1 when the signal crosses zero towards the positive half of the cycle, 0 when no zero crossing is detected, and -1 when the signal crosses zero towards the negative half of the cycle.
In order to implement the exact same algorithm for both the positive and negative cycles, the voltage measurement is multiplied by a gain of -1 in the firing circuit of the negative cycle thyristor.
This output signal is sent to an AND logic gate together with a “fire” signal (0 as default when no compensation is required, and 1 to send the current pulse to the thyristor’s gate for compensation). When both signals are 1 simultaneously, the firing pulse is sent

27
to the thyristor gate after a specific delay which is related to the amount of power consumption required for compensation.
The “fire” signal is just a true/false (1/0) logic signal, so it is combined to the time step (Delta-T) to provide the right signal dimension for the AND gate to compare both input signals over time.
Details regarding the origin and values of both the “fire” signal and the delay are covered in the next section 4.4 “Control scheme” of this document.
4.4 Control scheme
Based on the active power compensation requirement being the three-phase active power drop of the SAF, the control scheme of the SWC has being developed with three-phase measured and controlled variables.
The main purpose of the SWC is to follow the power consumption of the SAF, compare it against a preset value, and provide the deficit of power consumption to reach that value if needed. A block diagram of the basic SWC control system is shown in figure 12.
Figure 12. SWC block diagram
First, the power consumption of the SAF is subtracted from the preset power value (the 40 MW rated value of the SAFs), resulting in the reference value required for the SWC power consumption.
Second, the actual SWC power consumption is subtracted from this SWC power reference value in order to calculate the error between the current SWC power consumption and the required value.
Subsequently, this error is fed into a PI controller, which in turn outputs a new consumption power value for the SWC.
Afterwards, a lookup table created from the RL circuit analysis in MATLAB is implemented to calculate the delay (associated to the phase angle) required to fire the thyristors at the right moment in order to obtain the newly requested SWC power consumption.
Each SAF has been assumed to have its own SWC sharing the same bus bar, resulting in two SWCs for the study case of this project. The implementation of this control scheme per SAF in PSCAD is shown in pictures 13 and 14 below, presenting the scheme of the SWC connected to BusSAF1.

28
Figure 13. SWC control scheme in PSCAD
Figure 14. SWC control scheme in PSCAD (cont.)
There are several extra components in the PSCAD implementation that are not represented in the block diagram of the control scheme. These components along with the full explanation of the control scheme in PSCAD are to be detailed next, assuming that the main control philosophy has been reviewed before in the block diagram along with its explanation.
At first, a comparator block is used to guarantee that only positive values or zero power is to be consumed by the SWC, setting any possible negative value to 0 MW.
Then the SWC power consumption signal has three different switches on its control line related to alternative modes of operation of the SWC: start-up, shut-down, and trip. All three switches share the same principle, to shift the SWC power signal required from the normal mode to a different, operator-controlled, value or set of values.
The start-up sequence involves the ramping up of power consumption by the SWC, with the proper ramp function, for the steam power generators to be able to follow the demand increase up to the operation point of the SAF. This ramping-up sequence is an input from the NPI smelting facility operator, and it should take into consideration the specific power consumption increase function of each SAF so it shapes its function accordingly. Likewise, the shut-down sequence provides the same level of controllability to the NPI smelting facility operator, but associated to the ramping-down capabilities of the SWC.

29
These sequences provide the facility operator with the capability of starting-up and shutting-down the SWCs as desired in order to follow the SAF ramping power variations accordingly.
The trip signal represents the possibility of shutting down the SWC as a result of an external signal, a protection system trip signal for example. For the simulation purposes, the SWC should consume 0 MW when this trip signal is activated.
Subsequently, the SWC power consumption signal goes through a hard-limiter block in order to set the SWC power consumption values between 0 and 40 MW, with an output signal “Pval” which is the required active power consumption level from the SWC.
Following the three-phase context of the control scheme, this “Pval” signal is divided by 3 in order to obtain the per-phase required power consumption value, since the lookup table made in MATLAB is based on per-phase values.
After calculating the per-phase power consumption value required, the signal flows into two different paths; one is to obtain the associated delay, and the other one is to obtain the “fire” signal, both being essential signals for the thyristor-firing circuits.
Another comparator block is implemented on the “fire” signal path, so only “Pval” values greater than 0 MW will output a logic true (1 as an integer). This is to avoid sending currents to the thyristor gate to obtain 0 MW power consumption values on the SWC, thus unnecessarily wearing out the thyristor valve components.
This configuration is followed by another comparator block, which compares the current power consumption of the SAF (PSAF) and the power value of reference to be compensated (Pref).
If PSAF is greater than Pref minus 5 MW, then the SWC should not compensate, leaving the SAF to operate in normal condition on its own. This condition was calculated taking into consideration the ± 5 MW maximum fluctuation required by the NPI smelting facility owner, and it should be adjusted accordingly in the case of a different fluctuation tolerance requirement.
Regarding the delay path, “Pval” is directly fed into the lookup table, which is a characteristic of time as a function of power conformed by 179001 pairs of data produced from the analysis in MATLAB. This function returns the specific time (in milliseconds) at which the thyristor should be fired in order to obtain the specific power consumption value “Pval”.
A hard-limiter block is used then to set the output values between 1 and 15 MW per phase, providing a minimum three-phase power consumption value of the SWC of 3 MW when the thyristors are fired.
Finally, the delay is divided by 1000 to provide the delay in seconds to the thyristor-firing circuits.
4.4.1 Operator controls
In order to simulate the input signals to be provided from the facility operator in real life, a set of control interfaces have been implemented in the PSCAD model.
The set of online controls implemented are identical for both SAFs, and an example of the controls for the SWC1 is presented below in figure 15.

30
Figure 15. Online controls for SWC1
These online controls allow the adjustment of certain values in real-time while the simulation is being conducted. Three switches and three sliders have been employed as online controls to provide real-time input signals in the following sections of the control scheme:
Power setting
A slider allows the user to modify the target power value to which the SWC is compensating at any given time.
Start-up sequence
A switch allows the user to select the normal condition of the control scheme after the start-up sequence of the SAF has been completed.
In addition to that, a slider provides the user the capability of ramping up the power consumption of the SWC according to the SAF power consumption increase.
The aim of these controls is to emulate the adapting power consumption increase of the SWC in response to the SAF behavior, or according to pre-defined starting-up protocols implemented in the NPI smelting facility.
These input signals are manually adjusted while simulating the system for simulation purposes, but they should be defined by the facility operator for real operation (either with an automated algorithm, a manual procedure, or both).
Shut-down sequence
These online controls share the same principle as those associated with the start-up sequence.
A switch allows the user to trigger the shutting-down sequence while the SWC is working on normal condition of the control scheme after the SAF has power consumption has reached 0 MW (either by the SAF being shut down or being disconnected due to a failure or maintenance).
In addition to that, a slider provides the user the capability of ramping down the power consumption of the SWC according to the SAF power consumption decrease.
31
In the case of a sudden power consumption drop on the SAF, the SWC allows the operator to ramp down the power consumption with the proper power-drop steps per minute, so the steam generators are able to follow the variations on the demand and the system remains stable.
Trip signal
A switch allows the user to emulate a trip signal during the normal condition of the control scheme, switching the SWC power consumption to a preset value (0 MW for the simulation purposes).
This input signal allows the facility operator to send a signal to the SWC in the presence of a given event (a system failure or an emergency shut-down for example), setting a specific value or set of values for the SWC to be followed.
Again, these input signals are manually adjusted while simulating the system for simulation purposes, but they should be defined by the facility operator for real operation (either with an automated algorithm, a manual procedure, or both).
The full simulation canvas file can be found in the Appendix C: “PSCAD simulation file canvas” of this document.

32
Chapter 5: Technical analysis
With both the system and the SWC models fully developed, it is time to move forward to the technical evaluation of the SWC.
In order to make a suitable assessment of the SWC performance, several simulations have been performed. The complete model used for the simulations in PSCAD is presented in figure 16 below.
Figure 16. Complete model for the simulations in PSCAD
5.1 Normal operation
The first step is to simulate the system under normal conditions. However, a 30-second simulation scenario has been developed including all the modes of operation considered for the SAFs within the scope of this project in the following order: the start-up, normal operation, arc loss, normal operation recovered, and shut-down.
Both SAFs are modeled to follow all the modes of operation in the same order, thus their behavior over time is identical except for a time delay between the two. However, the power fluctuations, the arc drop characteristics, and the start-up/shut-down power consumption functions are different on each SAF.
For simulation purposes, the ramping-up/down of the SWC power consumption presents a highly steep characteristic which could not possibly be followed by the steam generators. This is due to the chosen 30-second simulation period, from which only roughly 5 seconds are dedicated to each ramping sequence.
In real operation, these power consumption ramps would range from few minutes to several hours until the required power value is obtained in order to allow the steam generators to be able to follow the power consumption trend while maintaining the stability of the system.
Power, voltage and current outputs from the simulation in PSCAD are presented in figures 17 to 20 as follows. These have been taken from both SAFs and both SWCs in the system.

33
Figure 17. Set of measurements from SAF1
Figure 18. Set of measurements from SAF2

34
Figure 19. Set of measurements from SWC1
Figure 20. Set of measurements from SWC2

35
All these measurements are three-phase values over the 30-second period of the simulation in PSCAD. An example of these measurements in a smaller time period is presented below in figure 21 for better understanding of the three-phase measurement.
Figure 21. Three-phase voltage and current on BusSAF1 (zoom on figure 17 approximately at the 8th second when the SAF reaches the rated value)
The SAF’s, SWC’s, and total active power consumption on each furnace bus are presented below in figures 22 and 23.
Figure 22. Active power consumption on BusSAF1

36
Figure 23. Active power consumption on BusSAF2
In both cases it is shown how the SWC compensates the active power consumption to an average 40 MW value (rated value of the SAFs).
With this result, the loss of arc inside the SAFs becomes imperceptible to the power generators of the system, keeping the system stable and the furnaces operative until the electric arc is fully recovered.
Figure 24. Net active power consumption on BusSAF1 (zoom on figure 22)
As shown in figure 24, the total power fluctuations while the SWC is compensating the arc loss remain within the ± 5 MW required tolerance range.
However, when the SAF is operating with variations above 35 MW, the SWC does not intervene as previously stated in section 4.4 “Control scheme” of this document. As a consequence, the net active power on the bus follows the power variations of the SAF, thus presenting consumption values higher than 40 MW and possibly even higher peaks than the + 5 MW requirement.
These power consumption peaks reached over time have to be supplied by the running diesel generator, given the fact that it has a faster response than the steam generators.

37
The implementation of an energy storage system (battery system, fly-wheel, among others) in parallel with the SWC could be useful to handle these power consumption peaks, improving the efficiency of the whole system and reducing the diesel consumption.
Even though the SWC has three identical branches, its power consumption is not balanced. The per-phase active power consumption of the SWC1 is shown in figure 25.
Figure 25. Per-phase power consumption on SWC1
However, these unbalances can be better appreciated in figure 26 below.
Figure 26. Zoom on the per-phase power consumption on SWC1
These unbalances are the result of a three-phase-oriented control scheme combined with the implemented thyristor-firing circuit design.
Each cycle demands a specific three-phase power consumption from the SWC, but the voltage signal on each phase crosses zero at different moments, meaning that the firing signal could reach the gate of a given thyristor slightly late. However, the unbalances are proven to be considerably short between phases, providing successful active power compensation from the SWC.
During the early stages of the SWC design, only one SAF and an infinite bus have been considered for the control scheme development. Based on that model, the lookup table has been created assuming 33 kV (1 per unit) on the SWC bus.

38
In consequence, when modeling the whole NPI smelting facility network, the voltage drop associated to the transformer impedances and other loads does not allow the SWC to behave as expected.
For any given phase angle, the actual power consumed by the SWC in the full-grid model differs from the theoretical power consumption value within the lookup table. This is the reason why the SWC, even though it has a 40 MW reference as input, cannot consume more than approximately 36 MW as shown in figure 27 below.
Figure 27. SWC1 active power consumption
In addition to that, the unbalances on the power consumption of the SWC also have an impact on the voltage level at the connection point, distorting the ideal 33 kV value with which the lookup table has been created.
5.1.1 Harmonic content
Fourier analysis has been done on both voltage and current signals on the SWC. The harmonic content and the total distortion produced by the thyristor switching have been analyzed through an FFT (Fast Fourier Transform).
Part of the measured SWC three-phase voltage and current signals during the simulation is presented in figure 28 below.
Figure 28. SWC1 voltage and current signals during normal condition compensation
The FFT has been applied to the voltage and current signals on one phase of the SWC1 for the whole 30-second simulation period, and are presented in figures 29 and 30 below.

39
Figure 29. Voltage harmonic content per phase on SWC1
Figure 30. Current harmonic content per phase on SWC1
40
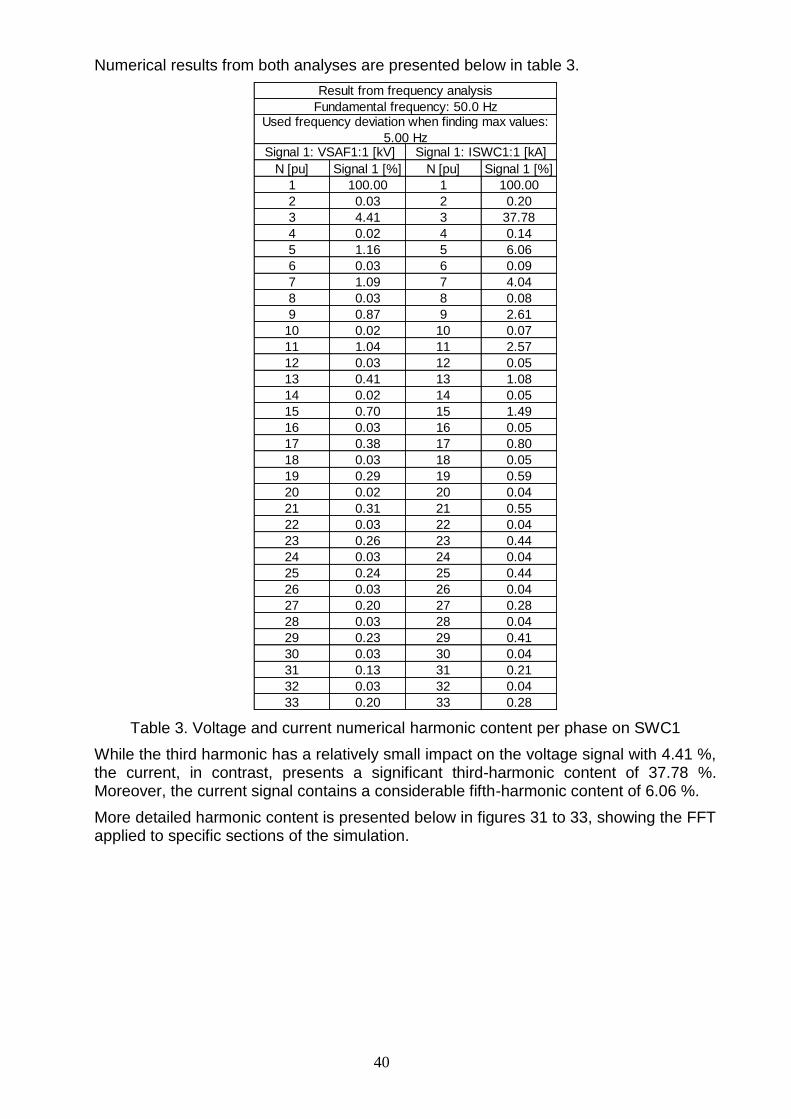
Numerical results from both analyses are presented below in table 3.
Table 3. Voltage and current numerical harmonic content per phase on SWC1
While the third harmonic has a relatively small impact on the voltage signal with 4.41 %, the current, in contrast, presents a significant third-harmonic content of 37.78 %. Moreover, the current signal contains a considerable fifth-harmonic content of 6.06 %.
More detailed harmonic content is presented below in figures 31 to 33, showing the FFT applied to specific sections of the simulation.
N [pu] Signal 1 [%] N [pu] Signal 1 [%]
1 100.00 1 100.00
2 0.03 2 0.20
3 4.41 3 37.78
4 0.02 4 0.14
5 1.16 5 6.06
6 0.03 6 0.09
7 1.09 7 4.04
8 0.03 8 0.08
9 0.87 9 2.61
10 0.02 10 0.07
11 1.04 11 2.57
12 0.03 12 0.05
13 0.41 13 1.08
14 0.02 14 0.05
15 0.70 15 1.49
16 0.03 16 0.05
17 0.38 17 0.80
18 0.03 18 0.05
19 0.29 19 0.59
20 0.02 20 0.04
21 0.31 21 0.55
22 0.03 22 0.04
23 0.26 23 0.44
24 0.03 24 0.04
25 0.24 25 0.44
26 0.03 26 0.04
27 0.20 27 0.28
28 0.03 28 0.04
29 0.23 29 0.41
30 0.03 30 0.04
31 0.13 31 0.21
32 0.03 32 0.04
33 0.20 33 0.28
Signal 1: VSAF1:1 [kV]
Result from frequency analysis
Fundamental frequency: 50.0 HzUsed frequency deviation when finding max values:
5.00 HzSignal 1: ISWC1:1 [kA]

41
Figure 31. Current harmonic content per phase on SWC1 while ramping up
Figure 32. Current harmonic content per phase on SWC1 while compensating for different power values

42
Figure 33. Current harmonic content per phase on SWC1 while ramping down
This Fourier analysis results suggest the necessity of either connecting filters in parallel with the SWC, or the reconfiguration of the SWC to a delta-connection in order to mitigate the third-harmonic content. However, the final harmonic assessment should be carried out after the SVC has been designed and incorporated to the simulation model, which is not part of the scope of this project.
5.2 Transient events
Three different transient events have been considered during the SWC development: one-phase and three-phase short-circuits, and a 10% overvoltage, all of them occurring on BusSAF1.
Both short-circuits have been simulated as one-phase or three-phase faults set to occur at the 13th second of the simulation, with a 0.05 s duration.
One-phase fault
The results from the single-phase fault simulation, as well as its model in PSCAD, are presented below in figures 34 to 37.

43
Figure 34. Single-phase fault simulation on BusSAF1 in PSCAD
Figure 35. Active power consumption on BusSAF1 in presence of a single-phase fault

44
Figure 36. Set of measurements from SWC1 in presence of a single-phase fault
Figure 37. Per-phase power consumption on SWC1 in presence of a single-phase fault

45
Three-phase fault
The results from the three-phase fault simulation, as well as its model in PSCAD, are presented below in figures 38 to 41.
Figure 38. Three-phase fault simulation on BusSAF1 in PSCAD
Figure 39. Active power consumption on BusSAF1 in presence of a three-phase fault

46
Figure 40. Set of measurements from SWC1 in presence of a three-phase fault
Figure 41. Per-phase power consumption on SWC1 in presence of a three-phase fault

47
A high active power peak is registered in the net power consumption on BusSAF1 when either fault occurs. However, after the fault clearance, the SWC continues compensating as expected.
The protection system shall guarantee the fault clearance as fast as possible to avoid this high transient power consumption, thus the high power peak mitigation is outside of the scope of the SWC design.
Overvoltage
The results from the overvoltage simulation, as well as its model in PSCAD, are presented below in figures 42 to 46.
Figure 42. Overvoltage simulation on BusSAF1 in PSCAD
The tap changer on the secondary side of the transformer has been changed to 1.15, representing a + 10 % voltage in an attempt to model a sustained overvoltage on the bus. These overvoltages are common events in power facilities, thus it is important to analyze their impact on the SWC behavior.

48
Figure 43. Active power consumption on BusSAF1 in presence of overvoltages
Figure 44. Active power consumption on BusSAF1 in presence of overvoltages (higher resolution while compensation distortion occurs)

49
Figure 45. Set of measurements from SWC1 in presence of overvoltages
Figure 46. Per-phase power consumption on SWC1 in presence of overvoltages

50
A higher voltage value results in higher power consumption over time as expected. However, there is a distortion in the power consumption values of the SWC when the required compensation is close to the 40 MW rated value.
The higher the compensation required from the SWC, the more distorted and fluctuating it signals becomes. There are two aspects to consider behind this phenomenon: the unbalances and the lookup table.
The presence of overvoltages intensifies the difference between the calculated power consumption values in the lookup table, and the actual power consumption measured when the thyristors are triggered.
In addition to that, the overvoltages amplify the phase unbalances as shown in figure 45, which in turn contributes to distortion of the three-phase power consumption of the SWC.
In consequence, the P-I controller is not able to obtain zero error, resulting in a constant fluctuation around the required compensation value (around 32 MW as shown in figure 43).
Nevertheless, even in the presence of overvoltages, the SWC is capable of compensating the power consumption drops of the SAF within the ± 5 MW tolerance range as expected.

51
Chapter 6: Cost analysis
Given the importance of cost reduction for the NPI smelting facilities, it is essential to conduct a cost analysis to assess the feasibility of the SWC and its impact on the operating cost of the facility.
This assessment has been conducted in two main segments: operating cost and investment cost; and both are to be compared to a more conventional battery energy storage system (BESS) equivalent solution.
No maintenance, repair and operations (MRO), or administrative costs have been considered within the scope of this assessment. Only power production/consumption and the cost of each fuel type have been taken into consideration in each section.
6.1 Operating cost
The interaction between the SWC and the SAF is important when estimating the operating cost of the NPI smelting facility.
The active power compensation generated by the SWC during the power drop following the arc drop within the SAF is presented below in figure 47. It contains the power drop characteristic as described in section 3.3 “Submerged-arc furnaces” of this document.
Figure 47. SAF-SWC interaction
When considering both SAFs and the rest of the auxiliary and utility loads of the smelting facility, the behavior can be presented as in figure 48 below.

52
Figure 48. SWC interaction with the NPI smelting facility
Finally, an energy consumption comparison can be done between the system in the presence of the SWC and without it. This comparison is presented in figure 49 below and it has been done assuming that both SAFs lose the electric arc at the same moment.
Figure 49. Energy consumption comparison

53
As expected, the total power consumption over the 15-second period in which the arc drop occurs is higher with the SWC than without it. However, the presence of the SWC permits stable operation of the system after loss of arc, which is one of the premises of this project.
The assumption of both SAFs losing their arc at the same time has been made in order to study the worst case scenario. Moreover, it has been assumed that the arc loss occurs one time every six minutes on each SAF (as stated in section 3.3 “Submerged-arc furnaces” of this document), and that the NPI smelting facility has a 24-hour work shift.
Since the arc loss occurs on average every six minutes, the SWC compensation is required only during 10 minutes in one hour, meaning that the other 50 minutes the SAFs operate within the ± 5 % of their rated power.
As a result, the average power consumption in a minute in which arc loss occurs on each SAF is approximately 36 MW ± 0.5 MW without considering the SWC, and approximately 40 MW ± 0.5 MW with the SWC compensating the power drop.
When the arc drop takes place, the power consumption has been set to 40 MW, obtaining the power consumption profile for the SAFs both with and without the SWC.
Finally, the average consumption of the entire smelting facility per hour has been calculated considering that only 10 minutes contain the arc drop characteristic while the rest of the time the SAFs operate without the intervention of the SWC.
The final difference between the NPI smelting facility power consumption with or without the implementation of the SWC is roughly 1 MW (95 MW with the SWC, 94 MW without it). However, it is the cost to produce those 95 MW what is of importance on this analysis.
The operating costs of the NPI smelting facility are now calculated considering the cost of diesel as 281 $/MWh and the coal as 150 $/MWh [16], and the results are presented below in table 4.
Table 4. Operating cost of the NPI smelting facility on different scenarios
From these results the trend is clear, the more coal-based generation installed, the more operating cost decrease for the NPI smelting facility. However, there are two alternatives, “Coal only” and “Coal + SWC”, that suggest a lower operating cost, but the system is not stable on both cases.
The reason behind the instability of the system with coal only is the large changes of power consumption in rather small time frames, which the steam generators are not able to follow.
The coal generation limit is set to only 60 MW in the “Coal + Diesel” scenario because the steam generators are able only to provide the base load. The diesel generators are
ScenarioEnergy consumption
(MWh)
Diesel generation
(MWh)
Coal generation
(MWh)
Operating Cost
($/MWh)
Operating Cost
(1000 $/day)
System
stable?
Diesel only 94 94 0 26.35 59.29 Yes
Diesel + SWC 95 95 0 26.80 61.34 Yes
Coal only 94 0 94 14.06 31.65 No
Coal + SWC 95 0 95 14.31 32.74 No
Coal + Diesel 95 35 60 18.94 43.35 Yes
30 MW coal 95 65 30 22.87 52.34 Yes
60 MW coal 95 35 60 18.94 43.35 Yes
90 MW coal 95 5 90 15.01 34.35 Yes
Coal + Diesel + SWC

54
the only power producers capable of following the SAFs arc drops in the absence of the SWCs, thus the estimation of approximately 35 MW requirement for the diesel generation sets.
The equivalent BESS solution is considered to have zero operating cost in terms of energy production. Nevertheless, the MRO costs of both the BESS and the SWC solutions are negligible in comparison to the energy production cost.
There are two already operational NPI smelting facility scenarios, “Diesel only” and “Coal + Diesel”, to which the implementation of the SWC together with a generation mix as stated in section 3.5 “NPI smelting facility operation” of this document, represents an annual saving of approximately $ 9.1 M and $ 3.3 M respectively.
6.2 Investment cost
There is always important to take into consideration the capital cost for the system improvement. In this case, the prize of each equivalent solution is the investment cost the NPI smelting facility owner needs to afford to implement any given solution.
The estimated price for a 40 MW / 20 MWh BESS, including the converter, controller, batteries, civil works, installation and related services, can be as much as 8 times higher than the price of the SWC (one SWC rated 40 MW), including its associated switchgear with power and measurement components, civil works, control, engineering, administration, and miscellaneous. The requirement of 20 MWh for the BESS is due to the steady power compensation requirement stated in section 4.1 “Study case” of this document.
Moreover, the lifetime of a battery system is shorter than the SWC, given the nature of its components. This represents a major overhaul being required at some instance during the lifecycle of the project (approximately in the 10th year), incurring in extra expenses that would be otherwise avoided by implementing the SWC solution.

55
Chapter 7: Conclusions and future improvement
After having completed all the simulations and both the technical and the cost analyses, a series of conclusions regarding the current state of the SWC system design can be drawn in conjunction with several recommendations and future improvements for further development of the SWC.
7.1 Conclusions
There are two main fields of analysis carried out on this project, so the conclusions are to be divided into the same two sections.
7.1.1 Technical analysis conclusions
Despite some minor details, the overall functionality and capabilities of the SWC are as expected, suggesting it as a valid solution to the specific project background problem. All the requirements set by the NPI facilities owner are satisfied except for the maximum + 5 MW fluctuations during normal operation-
It is important to keep at least one diesel generator operating within the NPI smelting facility to guarantee the power production to follow the fast power consumption surges (up to 5 MW above the 40 MW SAF rating) during the SAF’s normal operation.
To that regard, the implementation of the SWC together with a small-scale (1 or 2 MW 1 or 2 MWh respectively) energy storage system could provide a feasible solution. However, the exact size and the feasibility of this energy storage system are not part of the scope of this project.
Another benefit from a possible interaction of the SWC with a small energy storage system is an increase in the efficiency while operating the diesel generators. This configuration could allow them to produce a surplus of energy at any given time, and the energy storage system to supply it back over time during normal SAF operation to cover the power consumption surges over the rated value.
The SWC consumes a certain amount of MVAr when compensating (between 15 and 23 MVAr). This reactive power should be an additional requirement to consider when designing the SVC to implement along with the SWC.
Even though the three-phase control scheme is simple to implement and has a very suitable performance as it is, the simultaneous per-phase power consumption value requirement results in small power unbalances within the range of 0.5 to 1 MW between phases.
The difference between the theoretical 33 kV considered when creating the lookup table and the actual voltage level on the SWC bus poses a distortion factor when compensating the power consumption to 40 MW. Any given power consumption value expected from the lookup table would not be accurately attained if the voltage on the SWC bus is not exactly 33 kV. In addition to that, the fact that the proposed control scheme assumes a fixed frequency may affect the SWC performance in the event of the frequency alteration.
Regarding the harmonic content, the voltage on the SWC bus complies with a 5 % tolerance which is acceptable in most standards. However, the 3rd harmonic content in the current over 30 % prevent the sum of the currents to be zero at the neutral point, generating an oscillating current in the neutral wire.

56
A possible solution is the connection of the SWC in delta to mitigate the 3rd harmonic, alongside a small filter for 5th harmonic mitigation as well.
In the event of both single and three-phase faults on the SWC bus, the control scheme is capable of withstanding the failure and continuing its normal operation after fault clearance without any disturbance.
However, in the event of a sustained overvoltage, the power consumption compensation value is distorted. The higher the voltage value, the higher the distortion when compensating for the 40 MW rated value.
Nevertheless, the SWC is still able to compensate properly and within the required tolerance in presence of overvoltages.
7.1.2 Cost analysis conclusions
The overall cost scenario looks promising for the SWC, proposing an effective solution to the cost reduction request on the project background.
Compared to a BESS solution, the SWC has the disadvantage of having an energy-related operating cost. However, when comparing the actual plant operating cost with the optimum SWC-inclusive scenario, the annual cost savings range from $ 9.1 M to $ 3.3 M (depending on the current NPI smelting facility configuration), representing a significant cost reduction for the NPI facility owner.
There are two main considerations in the context of the NPI smelting facilities, the system stability and the cost decrease. In order to have both aspects covered, the optimum scenario suggested is “Coal + Diesel + SWC”.
Regarding the investment cost, there is a significant estimated difference of approximately 8 times the price between the BESS and the SWC solutions, giving the edge to the SWC proposal.
When taking into account both the investment and the operating cost, the SWC configuration provides the most suitable cost decreasing solution in the long term.
7.2 Recommendations
In order to mitigate the high 3rd harmonic content in the SWC currents, the most common and cost-friendly solution would be the delta connection of the SWC phases. Modifying the branch connection of the SWC would require few adjustments on the control scheme, such as the input signals for the power compensation calculation.
Another important suggestion would be to replace the three-phase control scheme for a per-phase one. This could possibly help reducing the active power unbalances produced in the SWC.
Regarding the lookup table issue (the distortion generated due to the difference between the 33 kV theoretical value and the actual voltage measurement), there are three possible solutions recommended to be analyzed:
First, the calculation in real-time of the time delay instead of the implementation of a pre-made lookup table. This option would require a few lines of code in PSCAD and it could make slightly longer the simulation time, but it is a valid solution.
Second, the use of several lookup tables for different voltage levels. Then, the actual measured voltage would be the input required for the control scheme to select which lookup table to use for any given voltage measurement.

57
Third, the scale of lookup table values using the square of the measured voltage (V2/Vn). This scaling factor could correct the deviations on both voltage and frequency from the theoretical values used when creating the lookup table.
Interactions between steam turbine and diesel generators have been estimated for the scenarios “Coal + Diesel” and all the variations of “Coal + Diesel + SWC”, but this assessment should be done with the real power generation values of each type according to the experience or real operation measurements from the NPI smelting facilities owner for a more accurate calculation.
7.3 Future development
After evaluating and analyzing the recommendations provided above, there are few improvements that could be made to the system model:
First, the modeling of the overhead distribution lines connecting the generators with the NPI smelting facility in the PSCAD model. In reality, the NPI facility is not located nearby the power generation plants, requiring overhead distribution lines to deliver the power supply.
Those distribution lines can be modeled as impedances containing significant shunt capacitances, resulting in both active and reactive power exchanges with the NPI facility.
Second, the consideration of the inner model of both generator types (diesel and coal-based steam). Adding this to the PSCAD model would allow analyzes of the impact of the SWC-SAF interactions directly on the fuel consumption. Moreover, this could also provide the possibility to conduct a more detailed analysis regarding the effect of short-time high-power fluctuations on the shafts of both generators.
Finally, adding an energy storage system to the existing PSCAD model. This addition would allow analysis of the interaction between the SAF, the SWC, and the energy storage system in order to optimize the power compensation process.
Afterwards, new technical and cost analyses would be required in order to assess the feasibility of the proposed solution.

58
References
[1] International Nickel Study Group, (2016). Nickel production, usage and prices. Retrieved July 15, 2016 from: http://www.insg.org/prodnickel.aspx
[2] Wikipedia, (2016). Nickel pig iron. Retrieved July 15, 2016 from: https://en.wikipedia.org/wiki/Nickel_pig_iron
[3] Ispatguru, (2016). Submerged Arc Furnaces. Retrieved July 15, 2016 from: http://ispatguru.com/submerged-arc-furnaces/
[4] Tenova, (2016). Submerged Arc Furnaces. Retrieved July 15, 2016 from: http://www.tenovacore.com/meltshop_04.html
[5] Baggini, A. (2008). Handbook of Power Quality. Wiley, United Kingdom
[6] Hingorani, N. G. & Gyugyi, L. (1999). Understanding FACTS: Concepts and Technology of Flexible AC Transmission Systems. Wiley-IEEE Press, USA
[7] Eremia, M. & Shahidehpour, M. (2013). Handbook of Electrical Power System Dynamics: Modeling, Stability, and Control. Wiley, United Kingdom
[8] National Electrical Manufacturers Association, (2014). NEMA MG 2-2014: Safety Standard for Construction and Guide for Selection, Installation and Use of Electric Motors and Generators
[9] Söder, L. & Amelin, M. (2011). Efficient Operation and Planning of Power Systems. Royal Institute of Technology, Sweden
[10] Ter-Gazarian, A. (2011). Energy Storage for Power Systems. (2nd Ed.). The Institution of Engineering and Technology (IET), United Kingdom
[11] Chee Hing, D. J. & Julien, K. S. (1982). A New Static Watt Compensator for the Iron & Steel Company of Trinidad and Tobago. IEEE Transactions on Power Apparatus and Systems, Vol. PAS-101, No. 8, Trinidad, West Indies
[12] Wärtsilä, (2014). Wärtsilä 50DF Product Guide. Retrieved July 15, 2016, from: http://www.wartsila.com/products/marine-oil-gas/engines-generating-sets/dual-fuel-engines/wartsila-50df
[13] IEA Clean Coal Centre, (2014). Increasing the flexibility of coal-fired power plants. CCC/242. Retrieved July 15, 2016, from: http://bookshop.iea-coal.org/reports/ccc-242/83501
[14] Saevarsdottir, G., Manolescu, P., Magnilsson, T. & Sigurjonsson, K. (2013). Circulating Currents in the Delta Connection, Feasibility of Skew Tapping in the Operation of Submerged-arc furnaces. School of science and engineering, Reykjavik University & ELK.EM, Iceland
[15] Barker, I. J. & Stewart, A. B. (1980). Inductive reactance, and the operation of large submerged-arc furnaces. Journal of the South African Institute of Mining and Metallurgy, Montreal, Canada
[16] Wikipedia, (2016). Cost of electricity by source. Retrieved July 15, 2016 from: https://en.wikipedia.org/wiki/Cost_of_electricity_by_source

59
Appendix A: Single-line diagram
The single-line diagram of the NPI smelting facility considered for the SWC development can be found in full size on the next page.


61
Appendix B: MATLAB code
The creation of this MATLAB code has been a joint effort. Approximately 50 % of the code has been provided by my supervisor Nathaniel Taylor.
clear; clc %Definitions f = 50; w = 2*pi*f; Vrms = 33000/sqrt(3); U = sqrt(2)*Vrms; Rr = 27.2250; R = 20; L = 1e-3; Z = sqrt(R^2+w^2*L^2); phi = atan(w*L/R);
%Pure resistive case tr = 0:10e-6:20e-3; AR = []; PR = []; for ar = (pi/180) * [0:1:179], ir = (U/Rr)*sin(w*tr + ar);
% find positions of sign-changes, ignoring the first point zcr = find( diff(sign(ir(2:end))) ~= 0 ) + 1; zcr = zcr(1); % take just the first one t0r = tr(1); % initial time ter = tr(zcr); % end time Tcondr = ter-t0r; % conduction time
pr = sum( ir(1:zcr).^2 * Rr ) / (zcr-1); pmeanr = pr * 2 * (ter-t0r) * f; PR = [PR,pmeanr]; AR = [AR,ar]; end
figure(1) plot(AR*180/pi,PR/1e6,'r') xlabel('Firing angle [degrees]'); ylabel('Pmean [MW]'); legend('Mean power for a purely resistive circuit'); title(sprintf('Vrms = %.1f [kV], R = %.2f [ohm], f = %.1f [Hz]', ... Vrms/1e3, Rr, f ) ); grid
%RL case t = 0:10e-6:20e-3; A = []; P = []; angles = [0:1:179]; % degrees I = zeros(numel(t), numel(angles)); acount=0; for a = (pi/180) * angles, i= (U/Z)*(sin(phi-a))*exp(-w*t/tan(phi))+(U/Z)*sin(w*t-phi+a);
% find positions of sign-changes, ignoring the first point zc = find( diff(sign(i(2:end))) ~= 0 ) + 1; zc = zc(1); % take just the first one t0 = t(1); % initial time te = t(zc); % end time Tcond = te-t0; % conduction time

62
% PLOT the time-curves, one at a time (prompting user to Enter to
continue to next angle) % blue is the full cycle of curve (if no thyristor to block conduction) % green shows the points used for power calculation (the current allowed
by the thyristor) if 0, figure(3); plot(t,i,'b.-', t(1:zc),i(1:zc),'gx'); xlabel('Time [s]'); ylabel('Current [A]'); title(sprintf('Firing angle = %.1f [degrees]', a*(180/pi))); grid input(' [enter to continue] ->','s'); end
% PLOT the time-curves all together, with zero x-axis always being firing
time if 0, figure(4); plot(t,i,'b-', t(1:zc),i(1:zc),'g.' ); grid hold on; end
% store the current-versus-time vectors in a matrix acount = acount + 1; tshift = min(find(t>(1/f)*(angles(acount))/360)); I(1:zc,acount) = i(1:zc); % insert the conduction-period part of current I(:,acount) = circshift(I(:,acount),tshift); % shift to correct relative
phase
%power calculation p = sum( i(1:zc).^2 * R ) / (zc-1); % mean power during conduction pmean = p * 2 * (te-t0) * f; % mean power given by this energy happening
every half-cycle P = [P,pmean]; A = [A,a]; fprintf('Alpha = %.1f degrees, Delay = %.1f ms, Pmean = %.2f MW \n',
... a*180/pi, (a/w)/1e-3, pmean/1e6 ); % fprintf('Alpha = %.1f degrees, Delay = %.1f ms, Pmean = %.2f MW \n',
... % a*180/pi, Tcond/1e-3, pmean/1e6 ); end
print = [A*180/pi;(A/w)/1e-3; P/1e6]; fileID = fopen('look-up table.txt','w'); fprintf(fileID,'Alpha = %.1f degrees, Delay = %.4f ms, Pmean = %.2f MW
\r\n', ... print); fclose(fileID);
Pt = sort(P,'ascend'); At = sort(A,'descend'); print = [Pt/1e6;(At/w)/1e-3]; fileID = fopen('databasePSCAD.txt','w'); fprintf(fileID,'%.4f %.8f\r\n', ... print); fclose(fileID);
m = [P/1e6; (A/w)/1e-3]; csvwrite('database.dat',m);

63
figure(2) plot(A*180/pi,P/1e6,'b') xlabel('Firing angle [degrees]'); ylabel('Pmean [MW]'); legend('Mean power for RL circuit'); title(sprintf('Vrms = %.1f [kV], R = %.2f [ohm], L = %.2f [H], f = %.1f
[Hz]', ... Vrms/1e3, R, L, f ) ); grid
figure(5) plot(t, max(max(abs(I)))*sin(w*t), 'k--',t, I, '-'); xlabel('Time [s]'); legend('Shape of applied voltage'); title(sprintf('Vrms = %.1f [kV], R = %.2f [ohm], L = %.2f [H], f = %.1f
[Hz]', ... Vrms/1e3, R, L, f ) ); ylabel('Current for each firing angle [A]'); grid

64
Appendix C: PSCAD simulation file canvas
The PSCAD simulation file canvas created and implemented to perform the system simulations during the SWC development can be found in full size on the next page.

Gen Bus
P+jQ5 [MW] /ph
3.75 [MV AR ] /ph
P+jQ5 [MW] /ph
3.75 [MV AR ] /ph
P+jQ5 [MW] /ph
3.75 [MV AR ] /ph
Bus SAF1 Bus SAF2
ISA F1ISA F1
VSA F1VSA F1
PSAF 1 PSAF 1
QS AF1QS AF1
SAF 1 SAF 2
Req1
SAF1_ful l.txt
SAF2_ful l.txt
Req2
QS AF2 QS AF2
PSAF 2PSAF 2
VSA F2 VSA F2
ISA F2 ISA F2
G1 + sT
G1 + sT
F P52 FP1
F P22
2FP3
FP42
2
2FP6
Ramp up
Start-up sequence
0
A
B Compar-ator
A
BCtrl
Ctrl = 0
A
BCtrl
Ctrl = 0
A
B Compar-ator0
Shut-dow n sequence
Ramp down
PSWC1
D +
F-PSWC1ref
I
P
PSWC1req
Power Setting
0.0
A
BCtrl
Ctrl = 1
0.0 A
B Compar-atorPSWC1ref
Pv al1
PSAF 1
Pref1
D +
F-Pref1
De lay
FP2
F ire1
De lta-T
De lta-T
F ire1
ZeroDe tector
Va1FP1
De lay
Va1*-1 Zero
De tector
ZeroDe tector
*-1Vc1
De lay
FP5Vc1 Zero
De tector
F ire1
De lta-T
De lta-T
F ire1
FP6
De lay
ZeroDe tector
*-1Vb1
De lay
FP3Vb1 Zero
De tector
F ire1
De lta-T
De lta-T
F ire1
FP4
De lay
0
A
BCtrl
Ctrl = 1
PSAF 1
Pref1
A
B Compar-ator
databasePSC A D.txt
del1
A
B Compar-ator
A
BCtrl
Ctrl= 1
Pv al1 0.0
0
1
F ire1
N
D
N/D
3.0
N
D
N/D
Pnet1Pnet1
ISWC 1ISWC 1
VSWC 1VSWC 1
PSWC1 PSWC1
QS WC1QS WC1
Pa1 Pa1
Pb1Pb1
Pc1Pc1
2FP5_2
FP6_22
2
2FP4_2
FP3_2 2
2F P2_2
FP1_2
N
D
N/D
3.0
N
D
N/D
F ire2
1
0
0.0Pv al2
A
BCtrl
Ctrl = 1
A
B Compar-ator
del2
databasePSC A D.txt
A
B Compar-atorPref2
PSAF 2
A
BCtrl
Ctrl = 1
0
De lay
FP4_2F ire2
De lta-T
De lta-T
F ire2
ZeroDe tector
Vb2FP3_2
De lay
Vb2*-1 Zero
De tector
De lay
FP6_2
F ire2
De lta-T
De lta-T
F ire2
ZeroDe tector
Vc2FP5_2
De lay
Vc2*-1 Zero
De tector
ZeroDe tector
*-1Va2
De lay
FP1_2Va2 Zero
De tector
F ire2
De lta-T
De lta-T
F ire2
FP2_2
De lay
Pref2 D +
F-
Pref2
PSAF 2
Pv al2
PSWC2ref
A
B Compar-ator
0.0
A
BCtrl
Ctrl = 1
0.0
Power Setting_2
PSWC2req
I
P
PSWC2ref D +
F-
PSWC2
Ramp down_2
Shut-dow n sequence_2
0
A
B Compar-ator
A
BCtrl
Ctrl = 0
A
BCtrl
Ctrl = 0
A
B Compar-ator0
Start-up sequence_2
Ramp up_2
QS WC2 QS WC2
PSWC2PSWC2
VSWC 2 VSWC 2
ISWC 2 ISWC 2
Compensatio n settin gPowe r Setting_2
40
Pnet2 Pnet2
1.051.05
A
BCtrl
Ctrl = 0
A
B Compar-ator0
Trip s igna l_2
0.0
Trip si gnal
Trip si gnal_2
0
Norm al Trip
0.0
Trip s igna l
0
A
B Compar-ator
A
BCtrl
Ctrl = 0
D +
F-
5.05.0
D +
F
-

TRITA TRITA-EE 2016:146
www.kth.se