Embed Size (px)
Citation preview
Statictolive:CombiningStatawithGoogleChartsAPI
StataConferenceChicago2016
BelenChavezWilliamMatsuoka
July28,2016

Overview•Motivation•Introduction•Examples•Futurefeatures•Questions•Contact
Motivation•Presentingdatathroughgraphicsthataretransparent•Reportingthroughinteractiveweb-basedgraphics•CombiningGoogleChartsAPIwithStata(screenshotsinnextslide)https://developers.google.com/chart/•Fullsuiteofgraphs•Standardizingsyntaxforeaseofuse
Introduction•Introducinggcharts – betaversion•Modeledaftertwoway command• Comprehensivelibrary•Noneedforexternalsoftware•NoneedtolearnJavaScriptand/orHTML• Noneedtoparsearrays• Easytoautomateandupdategraphics

Theprocess
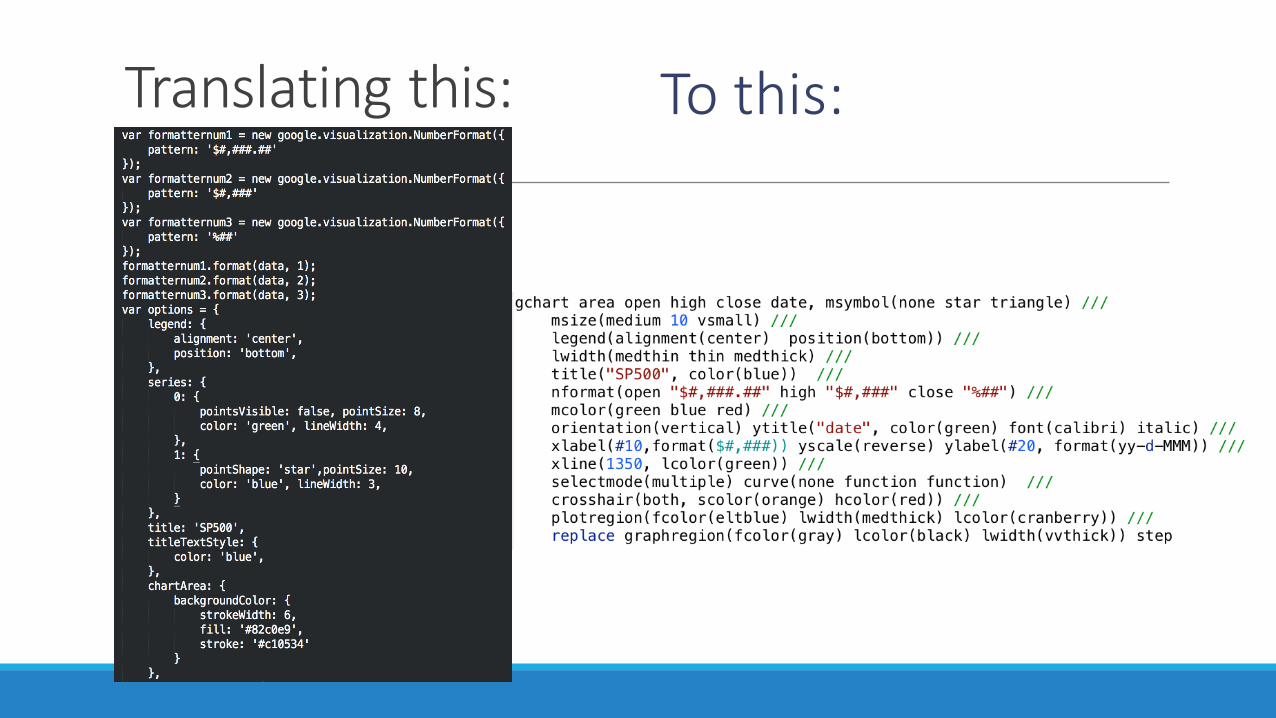
Translatingthis: Tothis:

GoogleChartSuite

GoogleChartGallery
https://developers.google.com/chart/interactive/docs/gallery

gcharts (beta)
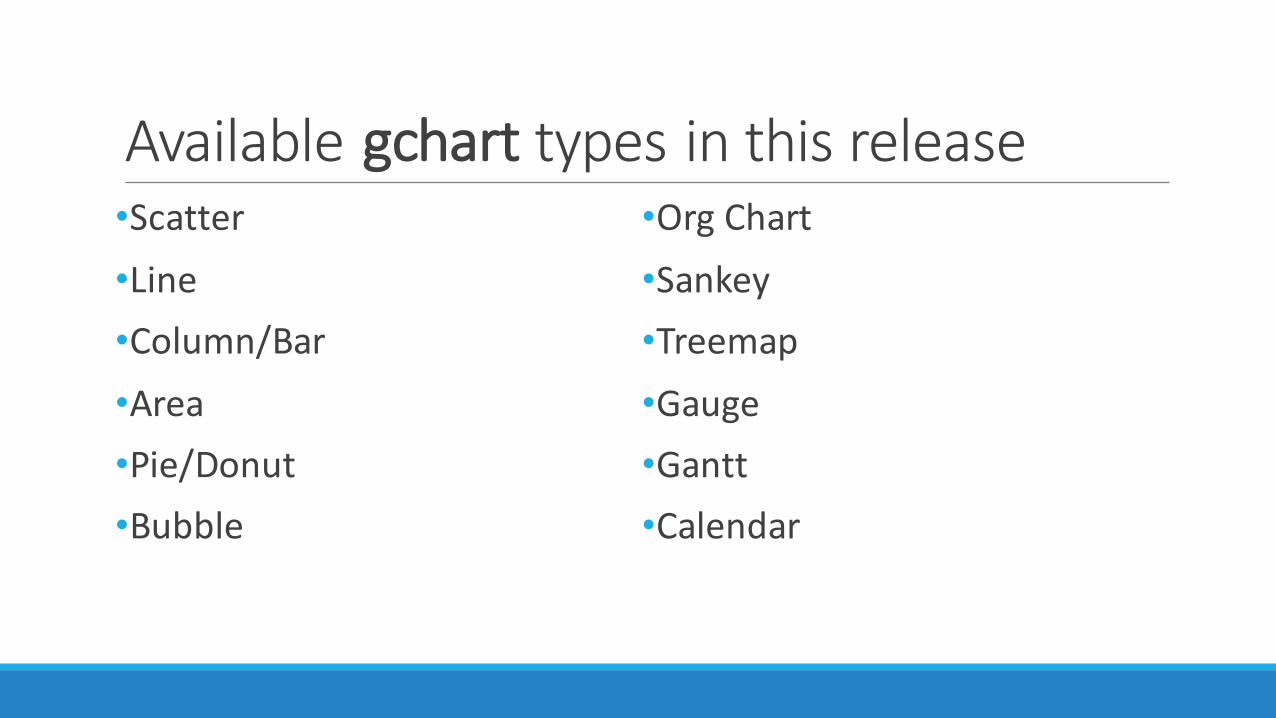
Availablegchart typesinthisrelease•Scatter•Line•Column/Bar•Area•Pie/Donut•Bubble
•OrgChart•Sankey•Treemap•Gauge•Gantt•Calendar

Stata-likegraphoptions

Stata-likeoptions•Lineoptions:• lwidth(),lcolor(),lpattern()•Scatteroptions:•msymbol(),mcolor(),msize()•Labeloptions:• xlabel(),ylabel(),xtitle(),ytitle(), xscale(),yscale(),xline()yline()•Legendoptions•Titleoptions•Plotandgraphregionoptions

Googlechartoptions
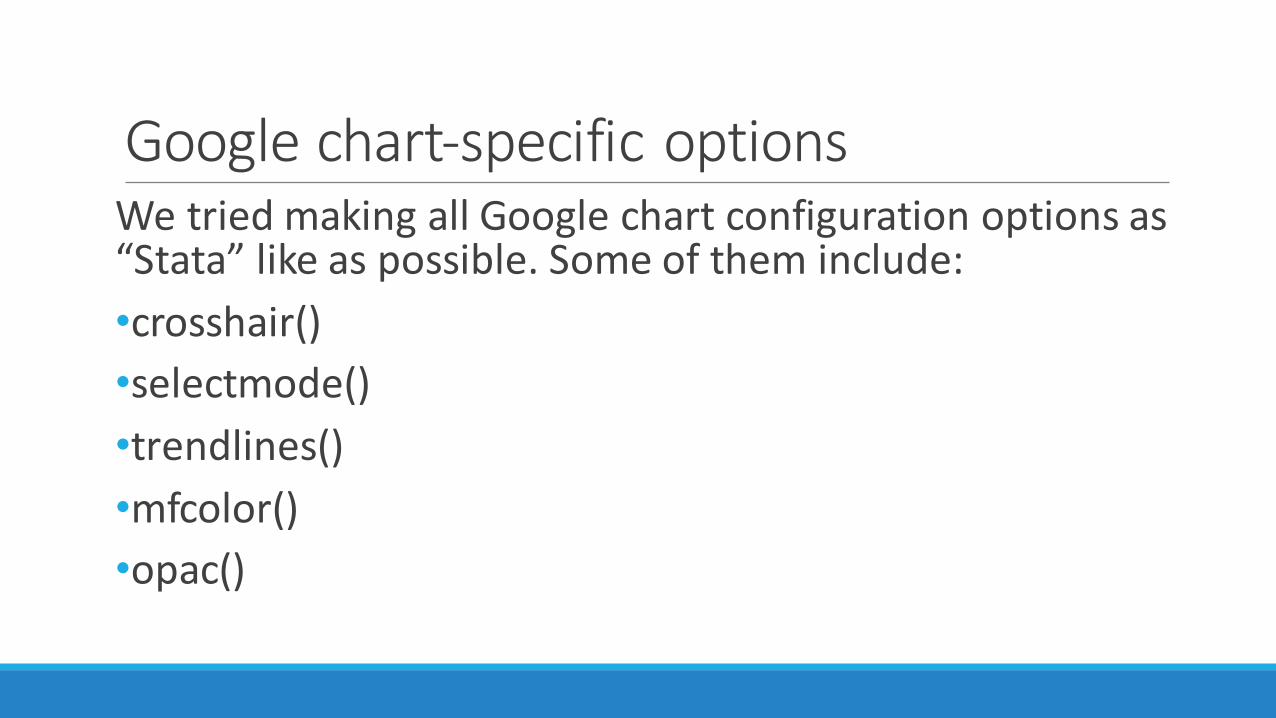
Googlechart-specificoptionsWetriedmakingallGooglechartconfigurationoptionsas“Stata”likeaspossible.Someoftheminclude:•crosshair()•selectmode()•trendlines()•mfcolor()•opac()

Googlechartsexamples
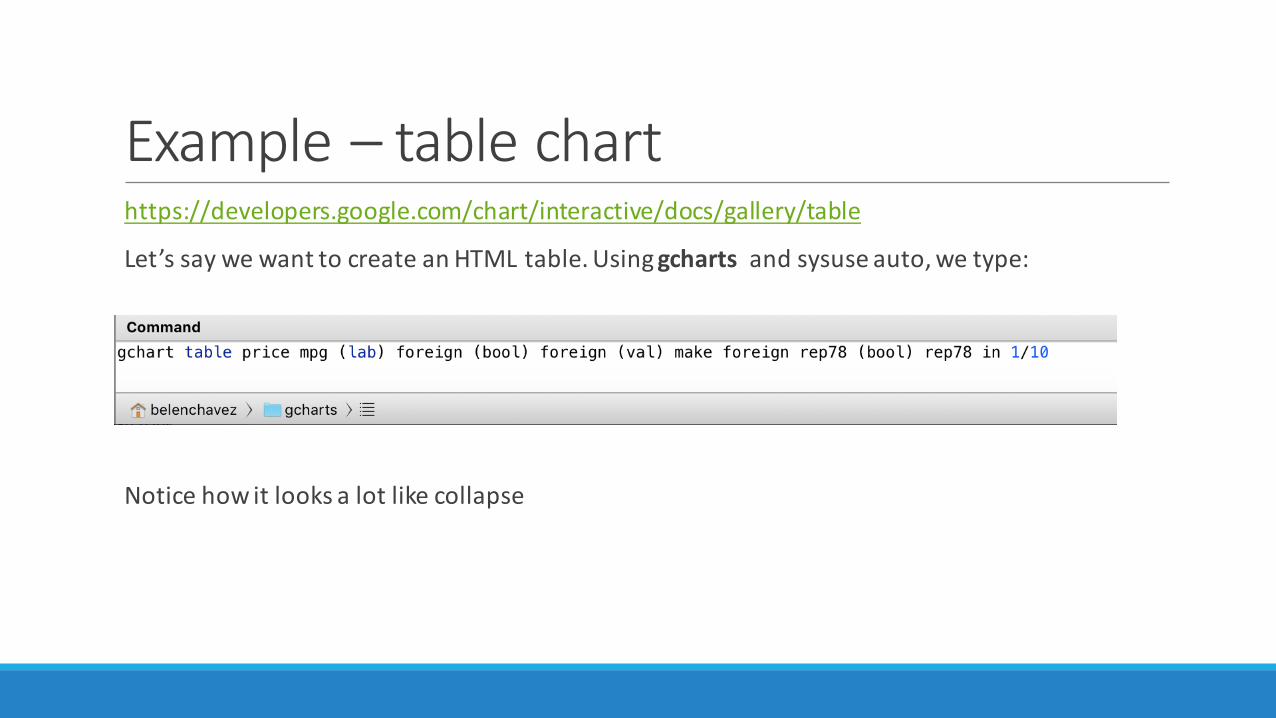
Example– tablecharthttps://developers.google.com/chart/interactive/docs/gallery/table
Let’ssaywewanttocreateanHTMLtable.Usinggcharts andsysuse auto,wetype:
Noticehowitlooksalotlikecollapse
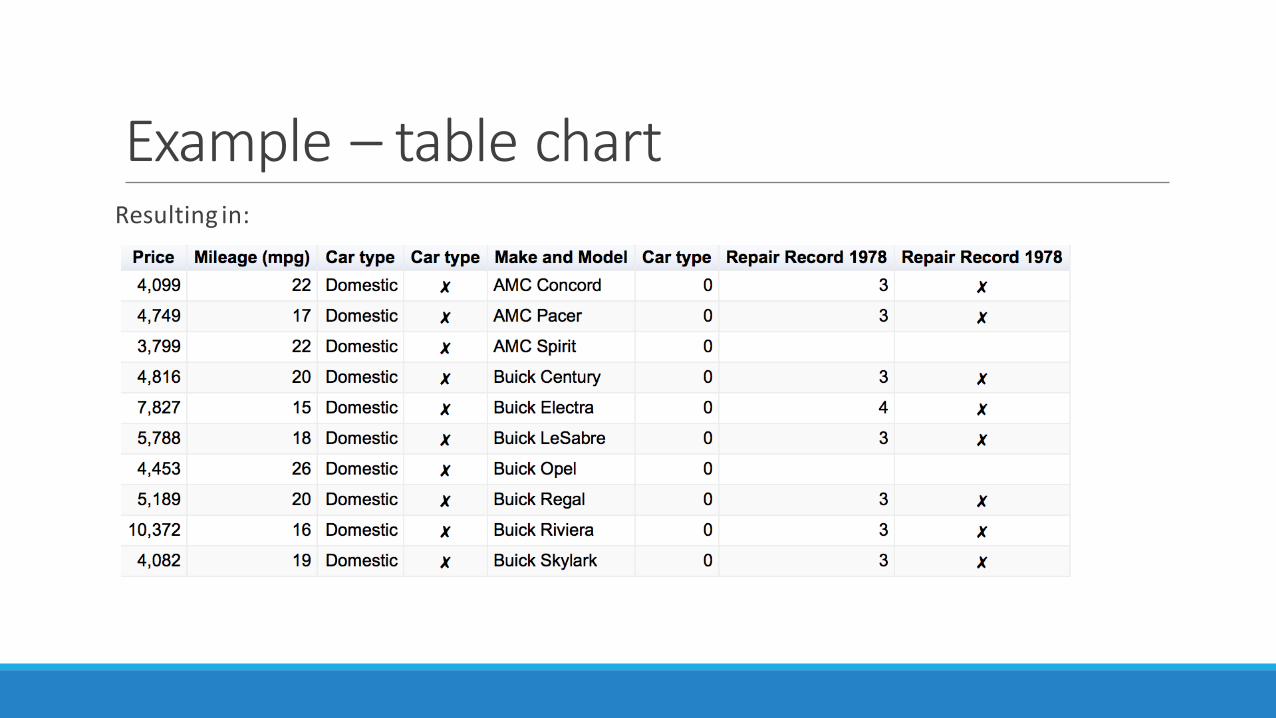
Example– tablechartResultingin:

Example– Sankeydiagramhttps://developers.google.com/chart/interactive/docs/gallery/sankey
Let’ssaywewanttolookattheflowofcustomerstoandfromdifferentrates.SankeyDiagramsareusefulforvisualizingflowsofdata.Ourexampledatalookslike:
TocreateaSankeydiagramusinggcharts wetype:

Example– SankeydiagramResultingin:

Example– calendarcharthttps://developers.google.com/chart/interactive/docs/gallery/calendar
Supposewewanttolookatmonthlyorweeklytrendsinayear.Calendarchartsareusefulforthat.Let’slookatthedailyaveragetemperatureatSeaTacairportin2015.
Usinggcharts thislookslike:
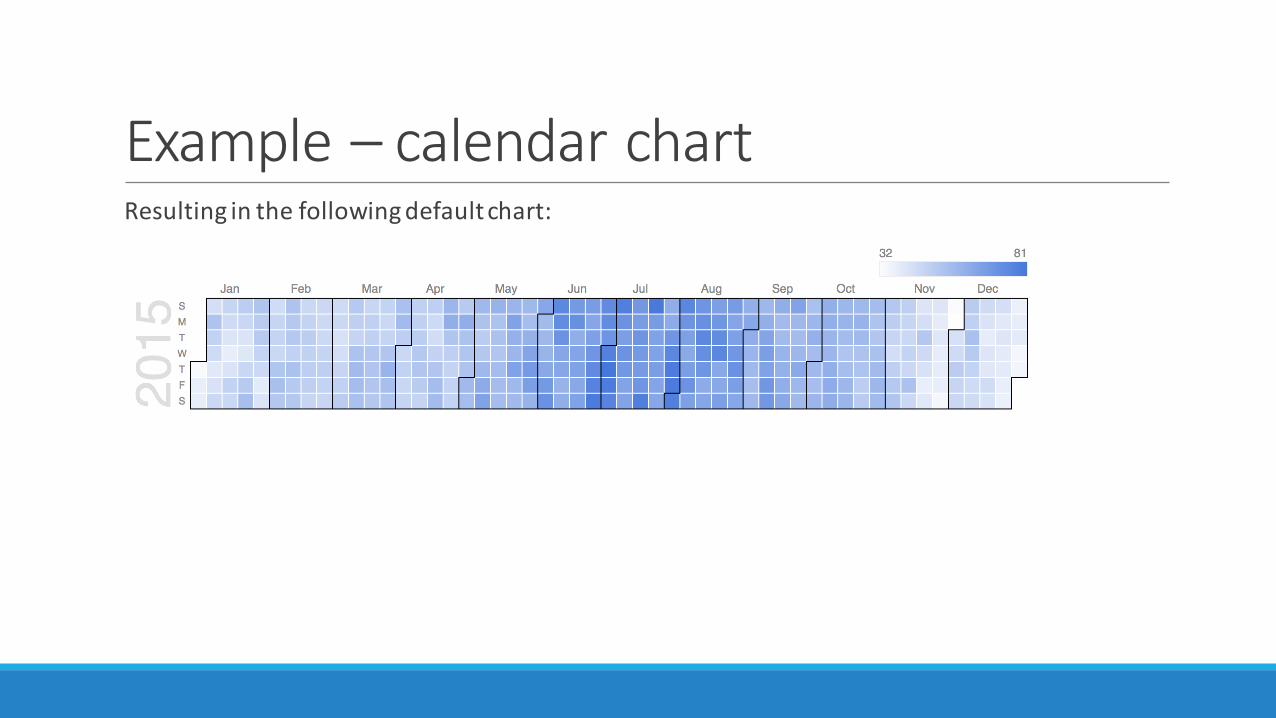
Example– calendarchartResultinginthefollowingdefaultchart:
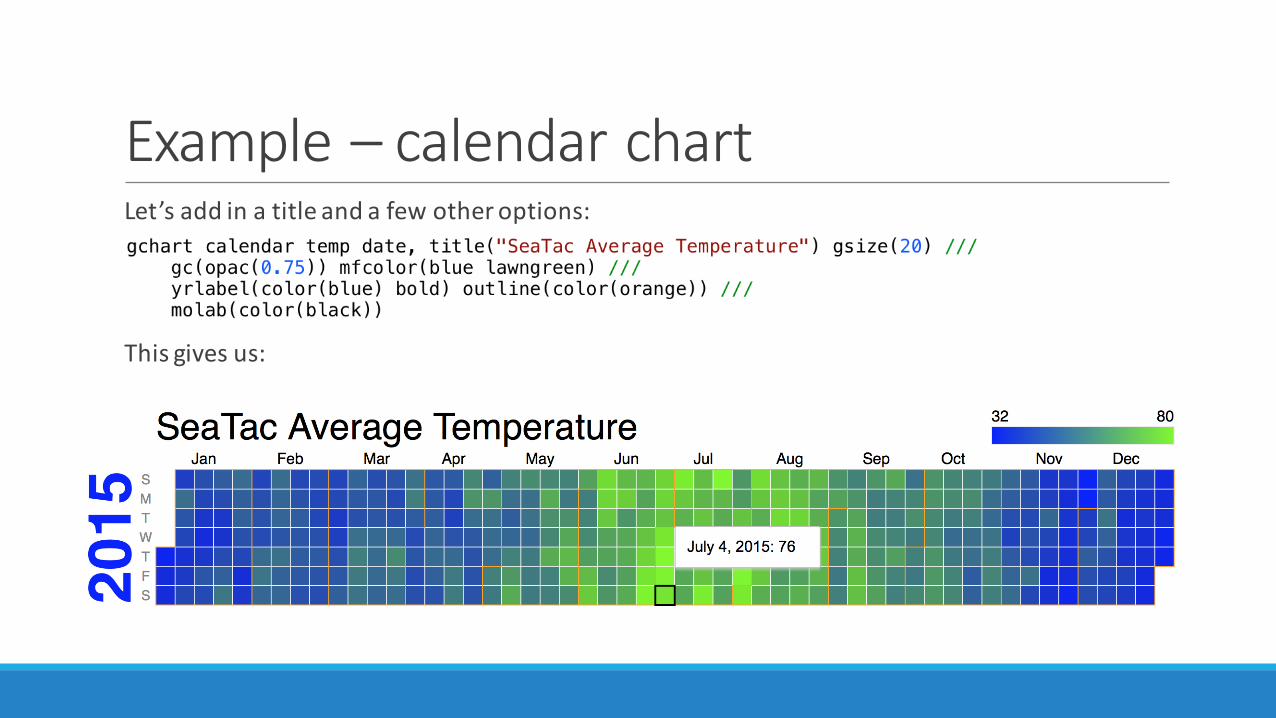
Example– calendarchartLet’saddinatitleandafewotheroptions:
Thisgivesus:

Stata-likecharts
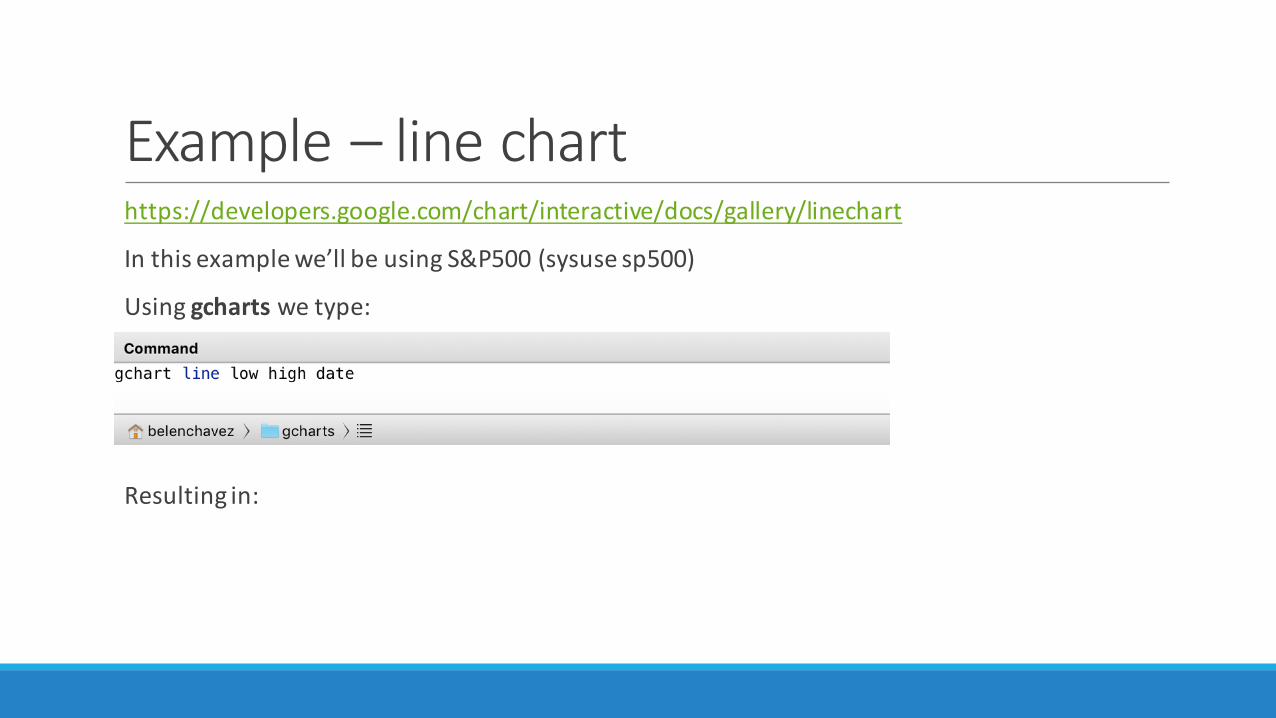
Example– linecharthttps://developers.google.com/chart/interactive/docs/gallery/linechart
Inthisexamplewe’llbeusingS&P500(sysuse sp500)
Usinggcharts wetype:
Resultingin:
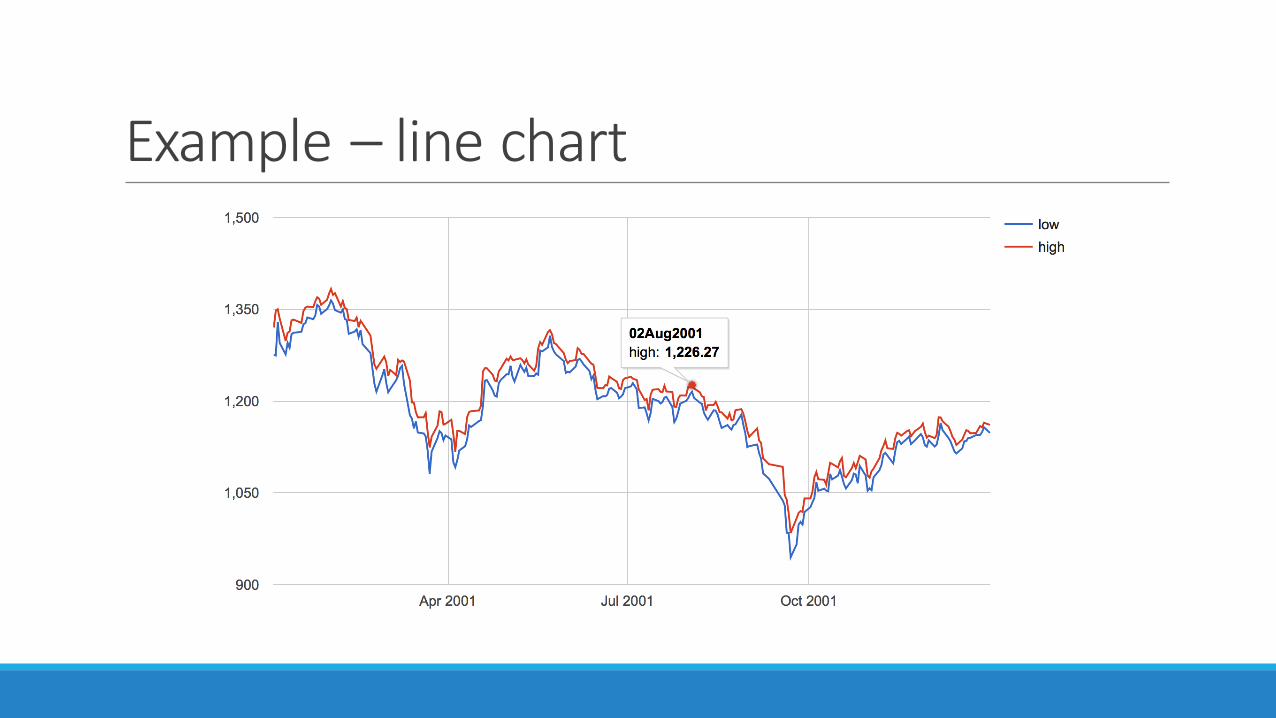
Example– linechart
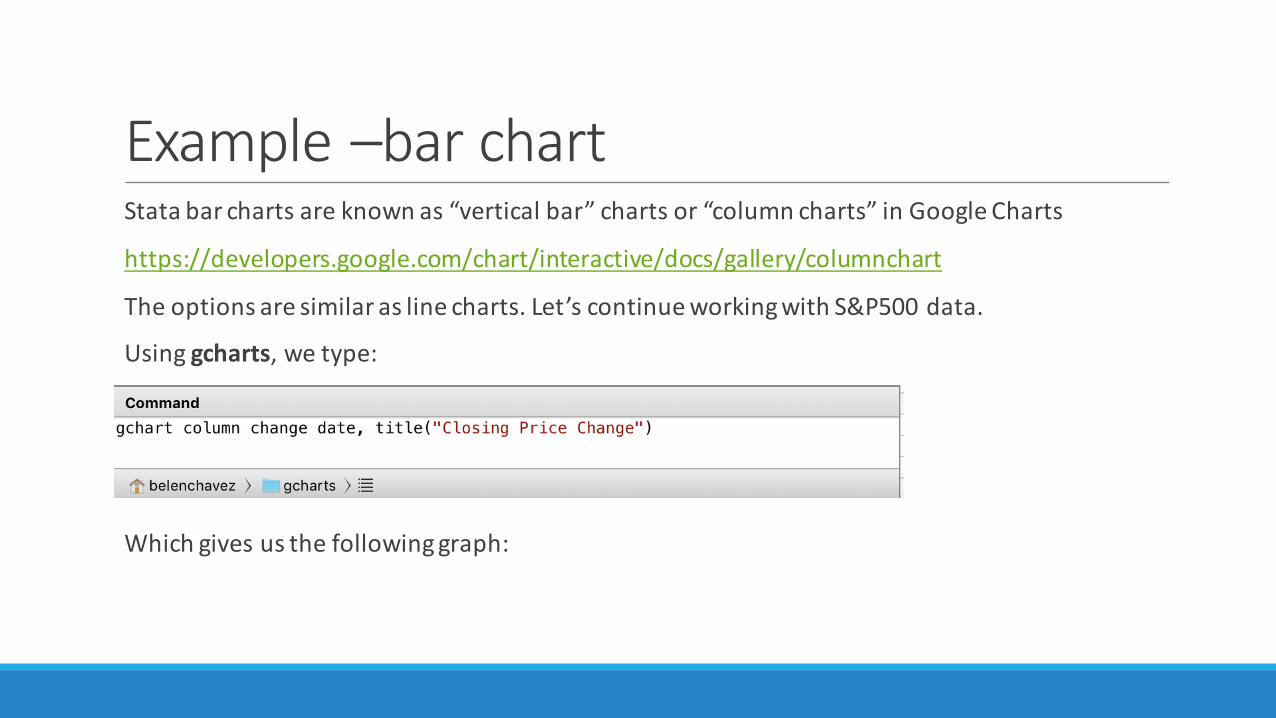
Example–barchartStatabarchartsareknownas“verticalbar”chartsor“columncharts”inGoogleCharts
https://developers.google.com/chart/interactive/docs/gallery/columnchart
Theoptionsaresimilaraslinecharts.Let’scontinueworkingwithS&P500data.
Usinggcharts,wetype:
Whichgivesusthefollowinggraph:
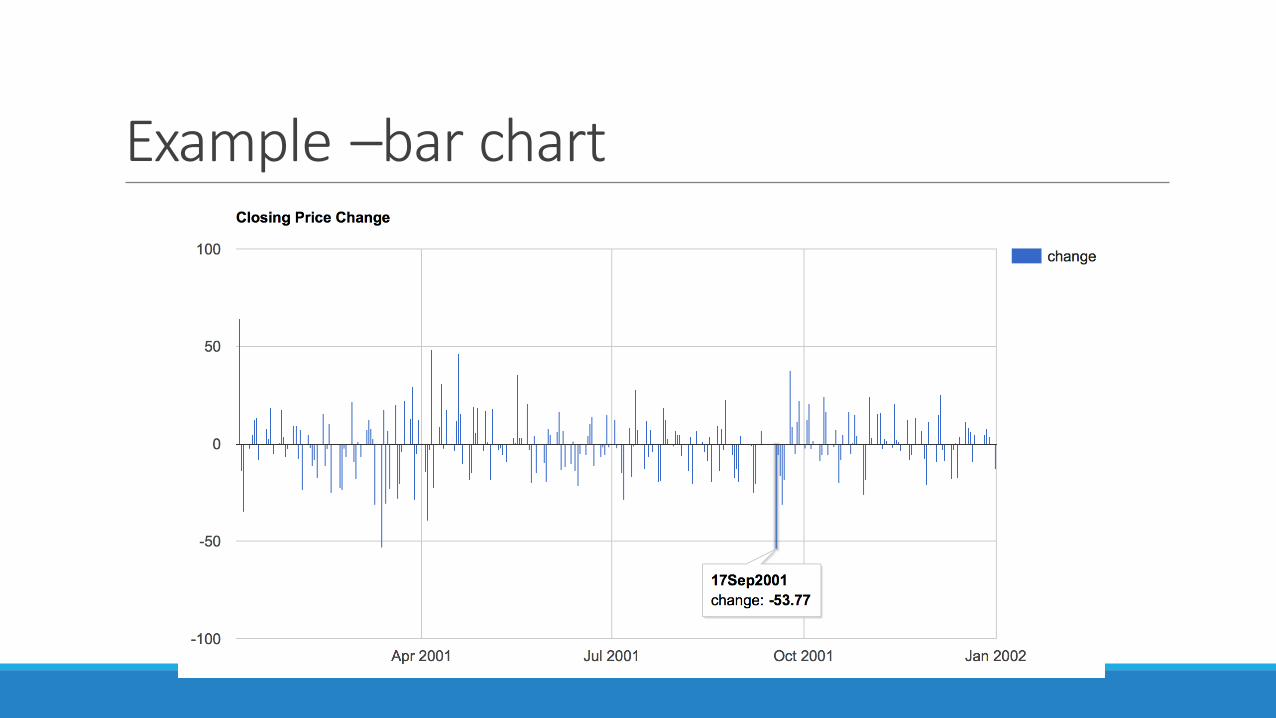
Example–barchart

Example– scattercharthttps://developers.google.com/chart/interactive/docs/gallery/scatterchart
Scatterisalsoverysimilar.Let’susetheautodatasettocreateascatterplotofpriceversusMPG
Usinggcharts wetype:
Whichgivesus:
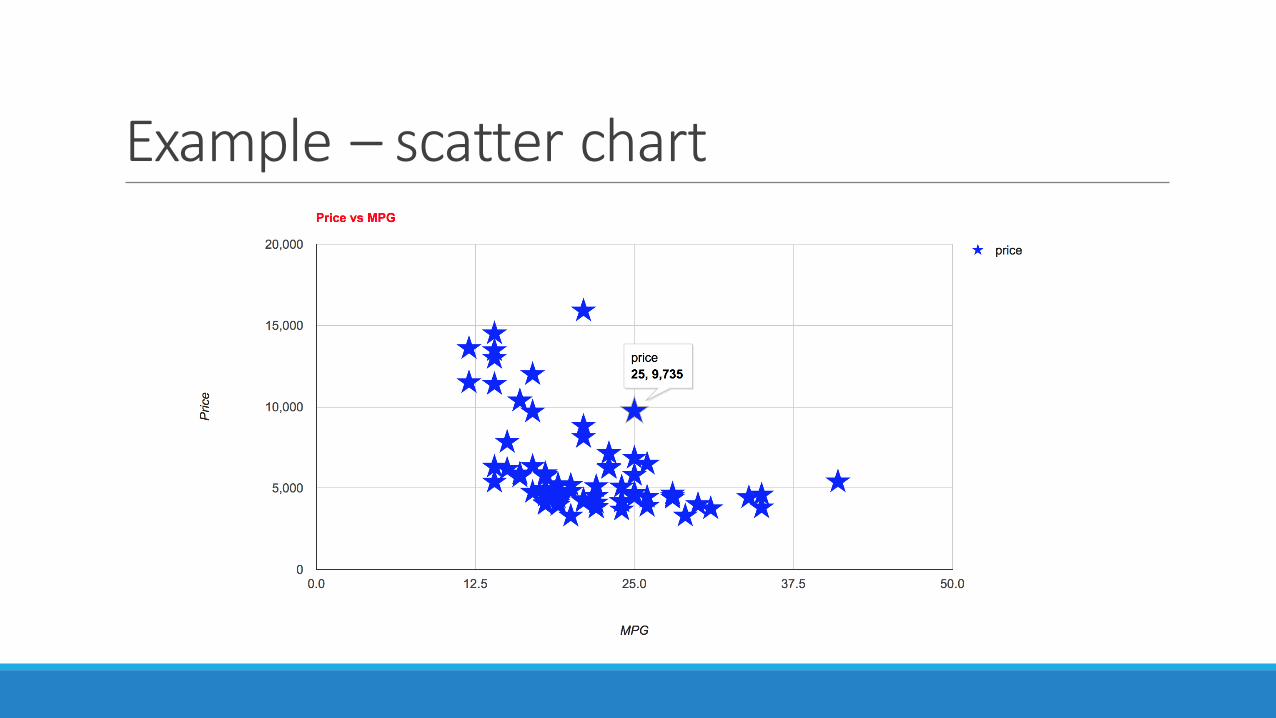
Example– scatterchart
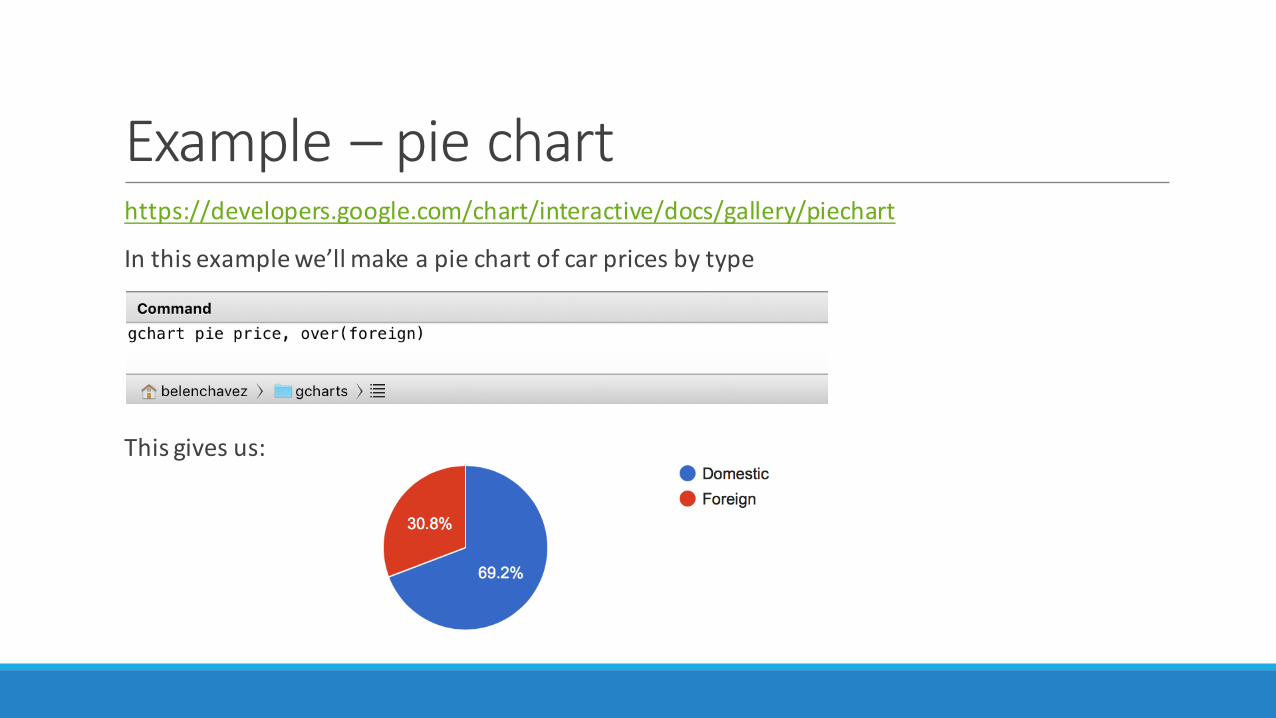
Example– piecharthttps://developers.google.com/chart/interactive/docs/gallery/piechart
Inthisexamplewe’llmakeapiechartofcarpricesbytype
Thisgivesus:

Formoreexamples•Aportfolioofexampleswithadditionaloptionsisavailableat:www.belenchavez.com/stata
Futuregchart types(availablesoon)•Timeline•Intervals•Histogram•Candlestick/Waterfall•DiffCharts

Futuregchart features(availablesoon)•Multipleaxischarts(secondaryaxisoptions)• Improvedintegrationwithcombocharts
•Barchart– barwidths•Makingchartsby-able

Questions?
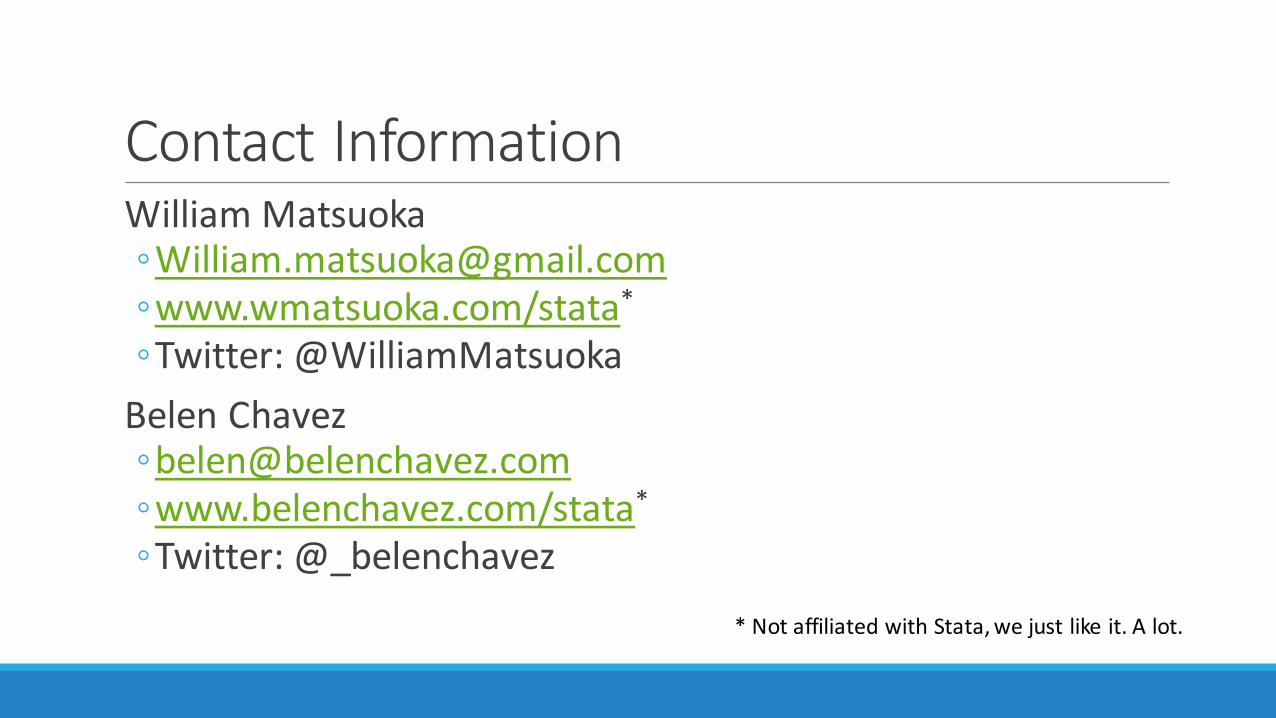
ContactInformationWilliamMatsuoka◦[email protected]◦www.wmatsuoka.com/stata*◦Twitter:@WilliamMatsuokaBelenChavez◦[email protected]◦www.belenchavez.com/stata*◦Twitter:@_belenchavez
*NotaffiliatedwithStata,wejustlikeit.Alot.

AdditionalExamples

Example– combocharthttps://developers.google.com/chart/interactive/docs/gallery/combochart
Wecancombinedifferentcharttypesintoone.Thepossibletypesofseriesarebars,line,area,scatter,andsteppedarea.
Usinggcharts,let’scombineline,scatterandabarcharttogether.

Example– combochart
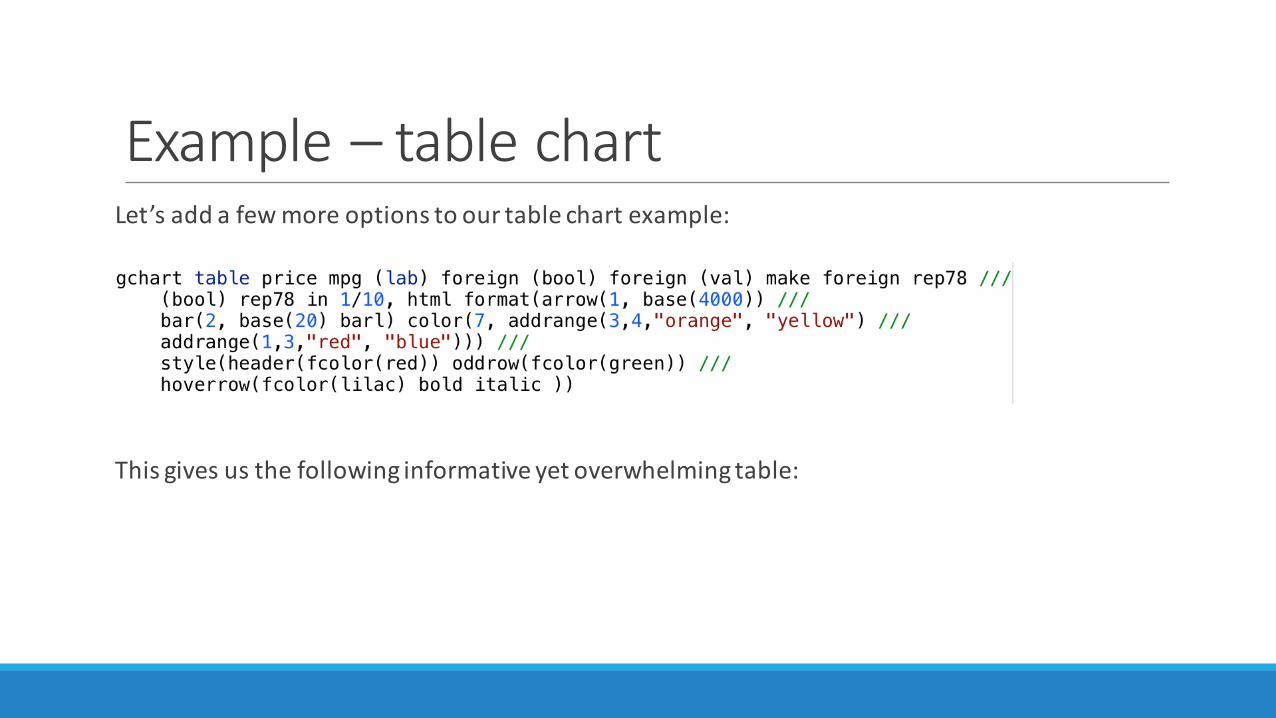
Example– tablechartLet’saddafewmoreoptionstoourtablechartexample:
Thisgivesusthefollowinginformativeyetoverwhelmingtable:
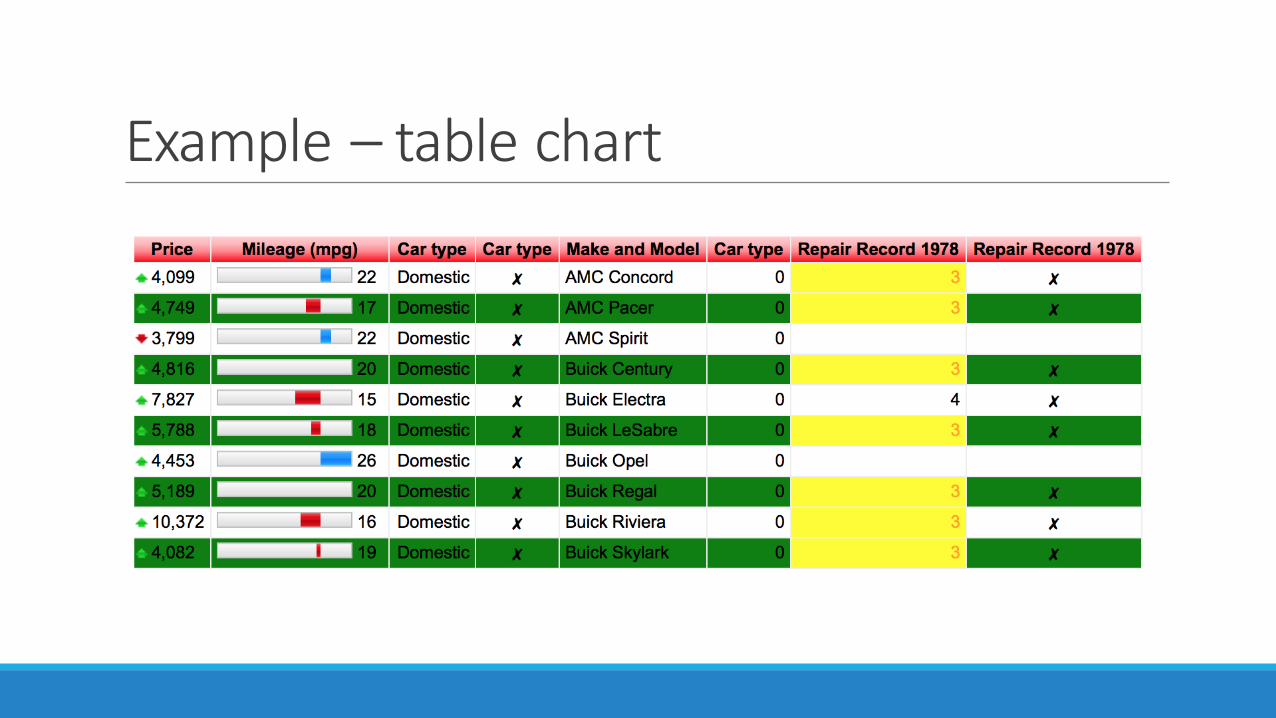
Example– tablechart
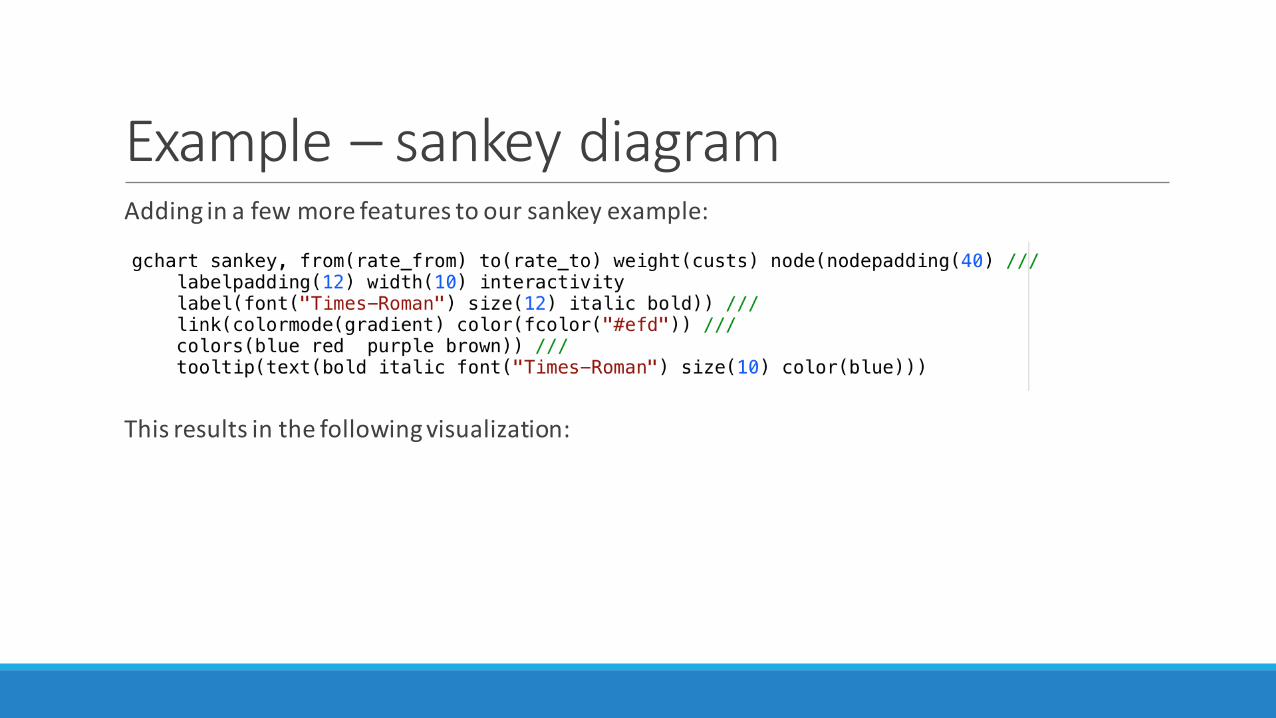
Example– sankey diagramAddinginafewmorefeaturestooursankey example:
Thisresultsinthefollowingvisualization:

Example– sankey diagram

Example– piechartAddingafewmoreoptions:
Weget:
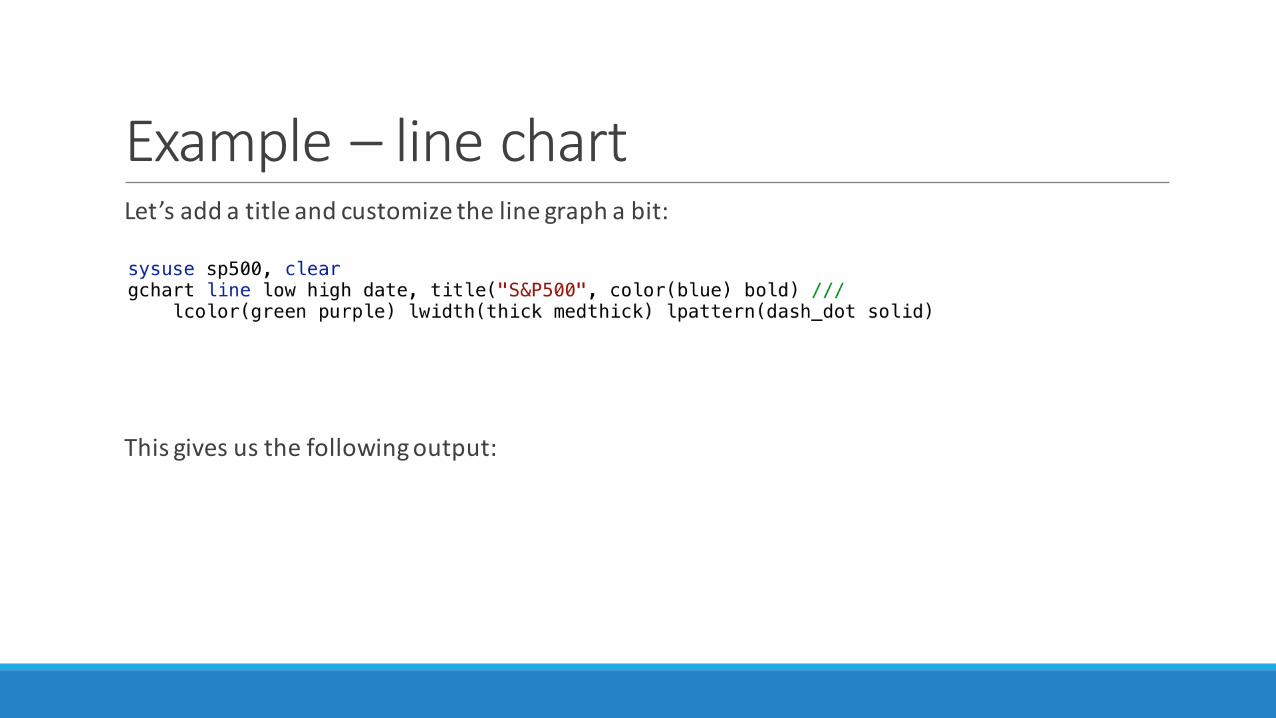
Example– linechartLet’saddatitleandcustomizethelinegraphabit:
Thisgivesusthefollowingoutput:

Example– linechart