Embed Size (px)
Citation preview

STATIC BEHAVIOR OF CONTINUOUS COMPOSITE BEAMS
by
J. Hartley Daniels
and
John W. Fisher
This work has been carried out as part of an investigation sponsored jointly by the New York Department of PublicWorks, the Department of Commerce - Bureau of Public Roads,Nelson Stud Division of Gregory Industries, Inc., KSM ProductsDivision of Ormark Industries, Inc., Tru-Weld Division of TruFit Screw Products, Inc., and Lehigh University.
March 1967
Fritz Engineering LaboratoryDepartment of Civil Engineering
Lehigh UniversityBethlehem, Pennsylvania.
Fritz Engineering Laboratory Report No. 324.2
1.0
2.0
3.0
4.0
5.0
6.0
TABLE OF CONTENTS
ABSTRACT
INTRODUCTION
REVIEW OF PREVIOUS STUDIES ON CONTINUOUS COMPOSITEBEAMS
DESCRIPTION OF TEST BEAMS
PROPERTIES OF THE TEST BEAMS
INSTRUMENTATION AND TESTING PROCEDURE
5.1 Instrumentation
5.2 Test Procedure
TEST RESULTS
i
1
5
9
12
14
14
15
18
6.1 Load-Deflection Behavior of the Continuous Bea~ 186.2 Moment-Curvature Behavior at Plastic Hinge
Locations 216.3 Slip Measurements 236.4 Cracking of Slabs in the Negative Moment Regions 24
7.0 ANALYSIS OF TEST RESULTS
7.1 Introduction7.2 Ultimate Strength Behavior of the Continuous
Beams
7.2.1 Load-Deflection Behavior7.2.2 Local Buckling(1) Flange and Web Local Buckling - Flexure(2) Web Local Buckling - Shear(3) Web Local Buckling - Flexure and Axial
Force(4) Summary
7.3 Feasibility of Plastic Design of ContinuousComposite Beams
7.4 Forces on Stud Connectors7.5 Force in the Longitudinal Slab Reinforcement7.6 Comparison of Beam Performance7.7 Variables Requiring Further Study
28
28
31
31363641
4244
4546484849

8.0
9.0
10.0
11.0
SUMMARY
ACKNOWLEDG:MENTS
TABLES AND FIGURES
REFERENCES
52
54
55
77

ABSTRACT
A previous report (Ref. 5) discussed the behavior of four two-span
cont{nuous composite steel-concrete beams which were tested under fatigue
loading. In that investigation, each beam was subjected to a certain
number of cycles of zero to maximum load. The maximum load was equal to
the service load of the beam.
This report discusses the behavior of the same four continuous com
posite beams which were subsequently tested statically to ultimate load.
These tests were made after each beam had been fatigue tested. The pur
pose of the ultimate strength tests was two-fold~ (1) to determine if
sufficient shear capacity remained after fatigue testing to develop the
flexural strength of the beam, and (2) to further investigate the feasi
bility of applying the concepts of plastic analysis and ultimate strength
theory to the design of continuous composite beams.
This investigation has shown that shear connectors designed on
the basis of the static and fatigue requirements suggested in Ref. 4,
will provide sufficient shear connection to develop the ultimate flexural
strength of the member even after the design cycle life of the connection
in fatigue has been reached. On the basis of this investigation, it has
also been shown that simple plastic analysis and ultimate strength theory
can be used for the design of continuous composite be~s. In addition,
this investigation indicates that the tensile strength of the longitudi
nal reinforcement in the slab can be used in the design.
i

The static tests of the four continuous composite beams have also
illustrated that local flange and web buckling of the wide-flange shape
adjacent to the interior support can have an effect on the ultimate
strength behavior. However, in these tests, the predicted ultimate load
capacity of three of the four beams was exceeded even with severe local
buckling. In the fourth beam the test load reached 97% of the predicted
load.
The test results reported herein clearly show that further studieS'·
of flange and web local buckling in continuous composite beams are re
qUired.
ii

1.0 INTRODUCTION
Recently, there has been a growing interest in the design of con
tinuous composite steel-concrete beams for bridges and buildings. The
determination of the elastic properties of such beams however, has tra
ditionally been a complex problem. Due to cracking of the concrete slab
in the negative moment regions, the moment of inertia of the beam will
not be constant along a span length. But the extent of the negative mo
ment region (extent of cracking) and the elastic properties of the con
tinuous beam are inter-dependent. Therefore, to determine the point of
contraflexure a tedious trial and error design approach is indicated.
Designs for moving loads on bridge girders and the presence of slip
(incomplete interaction) between the slab and the steel beam further com
plicates the problem.
A much simpler design approach for continuous composite ·beam would
be the familar plastic method for steel structures, combined with simple
rules for determining the ultimate moment of resistance of a cross-sec
tion when the slab is in tension or compression. However, safeguards
are required to ensure adequate rotation capacity of the positive (slab
in compression) and negative (slab in tension) plastic hinges. This
means that secondary failures which tend to limit the plastic hinge mo
ment must be prevented. Similar rules and safeguards are in fact neces
sary to allow the plastic design of steel structures.
It has been well established that ultimate strength con-
cepts may be used to predict the flexural strength of cross-sections
of composite beams where the slab is in compression and adequate
shear connection is provided.l
Flexural strength at negative hinge
locations, rotation capacity and the prevention of secondary fail-
ures are presently the subject of further investigation.
The current design procedure for continuous composite
b -d - d 2 - b d h · f 3r~ ge g~r ers ~s ase on t e static propert~es 0 connectors,
and present designs normally omit shear connectors in the negative
moment regions. The studies reported in Ref. 3 noted that in nega-
tive moment regions only the slab reinforcement can act compositely
with the steel beam. It was also noted that since there was no
significant difference in the distribution of strains and moments
whether or not connectors were placed in the negative moment regions,
no special provisions were needed for the design of continuous com
posite beams. Hence, the specifications2
noted only that, "In case
reinforcement steel embedded in the concrete is not used in com-
puting the section, shear connectors need not be provided in these
portions of the spans l1 ,
A recently developed procedure for the design of the shear
connectors in composite steel-concrete bridge members considers
their performance under working loads and" their ability to develop
-2-

4the flexural strength of the members. The new design criteria proposed
that connectors ~e provided throughout the length of continuous beams.
This was considered necessary because' in the negative moment regions of
composite beams with continuous longitudinal reinforcement, tensile
forces would exist that must be carried by connectors along the beam
length. If connectors are not provided throughout the negative moment
regions these forces must be carried by connectors near the inflection
points and in the positive moment regions. It was suggested that con-
nectars in the negative moment regions were also required in order to
maintain flexural conformance and to prevent the sudden transition from
a composite to a non-composite section. In addition, these connectors
would tend to minimize the large differentials in slip deformation that
might otherwise occur which could lead to fatigue failure of connectors
adjacent to the negative moment regions.
Laboratory fatigue tests on four full size two-span contin-
uous composite beams were reported in Ref. 5. These tests indicated
that connectors are required in the negative moment regions if the
shear connection is designed using the provisions of Ref. 4. These
tests also indicated that additional longitudinal reinforcement was
desirable in the negative moment regions over that currently recom
mended by the AASHO Bridge Specification.2
To provide additional information on the static strength of
continuous composite beams, comparative ultimate strength tests were
-3-
also conducted on the same four continuous composite beams reported
in Ref. 5. These tests were made following the fatigue testing of
each continuous beam. Two of the beams were identical except that
while both beams had shear connectors designed in accordance with
the fatigue requirements of Ref. 4, they were placed throughout the
beam length in one of the beams and omitted from the negative moment
region of the other beam as is commonly done in many current designs.
Both beams had identical longitudinal and transverse reinforcement.
The amount was made equal to the quantity of longitudinal distribu
tion reinforcement which would be placed in actual bridge decks of
similar proportions (Ref. 5). The other two continuous beams were
essentially the same as the first two beams but had continuous shear
connection designed in accordance with the static requirements of
Ref. 4 and substantially more longitudinal reinforcement in their
negative moment regions.
Complete details of the design, construction and fatigue
testing of the four continuous composite beams has been reported in
Ref. 5. The results of the ultimate strength tests ·of these beams
which followed the fatigue tests are the subject of this report.
The purpose of the ultimate strength ~ests was two-fold: (1) to
determine if sufficient shear capacity remained to develop the flex
ural strength of the beam, and (2) to further investigate the feasi
bility of applying the concepts of plastic analysis and ultimate
strength theory to the design of continuous composite beams.
-4-

2.0 REVIEW OF PREVIOUS STUDIES ON CONTINUOUS COMPOSITE BEAMS
Viest, Fountain and Siess 3 discussed the negative moment
regions of continuous composite bridge beams in some detail. This
discussion was based on the static behavior of two composite model
bridges that were reported by Siess and Viest. 6 These models differed
in that one had shear connectors throughout the beam while the second
had shear connectors in the positive moment regions only. From these
studies it was concluded that (1) in the negative moment regions,
only the slab reinforcement can act compositely with the steel beams;
(2) in bridges with shear connectors throughout the beam, the slab
reinforcement was fully effective; with connectors omitted from the
negative moment region the slab reinforcement was only partly effec
tive, and (3) the action of both of these continuous composite bridges
was about the same since the distribution of strains and thus also of
moments in both po?itive and negative moment regions was nearly the
same.
Based on these studies, it was concluded that the use of an
elastic analysis in combination with the usual load uistribution fac
tors is justified, and no special provisions are needed for the design
of continuous composite bridges.3
Slutter and Driscol17 summarized the behavior of a single
continuous composite beam tested statically to its ultimate load.S
The test was conducted to investigate whether or not it would be
-5-

feasible to apply the concepts of plastic analysis together with ul-
timate strength theory to the design of continuous composite beams.
In the positive moment region, the concrete contributed to the ultimate
moment of the cross-section. In the negative moment region only the
steel beam plus the reinforcement was considered. Only 0.2% of longi-
tudinal reinforcement was provided throughout the beam length. It
was noted in Ref. 7 that the theoretical plastic collapse load was
exceeded in the test even though the member theoretically had inade-
quate shear connection throughout its length. It was further concluded
in Ref. 7 that although the feasibility of the plastic design of con-
tinuous composite members cannot be fully evaluated from the test of
only one member, it appears that members in which the negative plastic
hinge forms first could be designed by plastic analysis. It was also
stated that beams in which positive plastic hinges form first have
not been tested, but plastic analysis of these members would appear
to be feasible because the positive plastic hinges undoubtedly have
sufficient rotation capacity to permit the formation of a negative
hinge. Ref. 8 suggested that only the steel beam be considered
effective over the negative moment regions, and suggested expansion
joints in the slab to control cracking.
9Iwamoto gave a comparative discussion on the design and
construction cost of the first continuous composite bridge in Japan.
At that time (1962) eleven (assumed) continuous composite gird~r
-6-
bridges had been constructed since 1958. In each bridge the concrete
slab in the negative moment region had been pre-compressed either by
raising and settlement (preloading) or by prestressing with steel
wires, or by a combination of the two methods.
Tachibana, Kondo and ItolO
discussed the behavior of contin-
uous composite beams prestressed with wire cables.
11More recently, Barnard and Johnson presented the results
of a study on the plastic behavior of continuous composite beams. In-
elastic regions or hinges in composite beams were classified as strain-
softening (positive hinges) or strain-hardening (negative hinges).
From this study it was concluded that, (1) it should be possible to
design by the conventional plastic design methods any continuous com-
posite beam in which the strain-softening hinges are the last to form,
(2) slip increases deflections, but does not appear to have any effect
on the ultimate strength behavior of the beam, (3) the fully plastic
moment of the steel alone, based on the minimum yield stresses of the
beam and reinforcement steels, is a safe estimate of the moment of
resistance at beam collapse of a cross-section in which the concrete
slab is in tension. These conclusions presuppose that secondary fail-
ures can be avoided.
The most important secondary failures requiring further study
were listed in Ref. 11 as (1) longitudinal splitting of the slab, (2)
-7-

diagonal tension failure of the slab, and (3) buckling of the steel
beam. Three other secondary failures were observed in the tests re
ported in Ref. 11 but they could easily be prevented by appropriate
detailing.
The studies reported in Ref. 11 were followed up by further
studies designed to provide more information on secondary failures. 12
In particular, the effects of cracking and transverse bending of the
slab on the ultimate strength were examined. In addition, an investi
gation of the behavior of longitudinal reinforcement over the supports
was made. Preliminary analysis of the test results suggested that
the simple plastic theory can be used for the design of continuous
composite beams, and full use can be made of the tensile strength of
the longitudinal reinforcement in the slab.
-8-

3.0 DESCRIPTION OF TEST BEAMS
The four continuous composite T- beams which were tested to ulti
mate load were each 50'-10" long. The beams had two equal spans of 25'-0"
between bearings. Symmetrical concentrated loads (distributed across the
slab width) were placed 10'-0" from the exterior support in each span.
Each of the four beams consisted of a reinforced concrete slab 60-in wide
and 6-in thick connected to a 2lW62 steel beam by pairs of 3/4-in dia
meter headed stud shear connectors 4-in high. The transverse spacing of
studs in each stud pair was 4-in (symmetrical with the W). The rolled
beams were all supplied from the same heat of A36 steel. Further des
cription of these test beams and a discussion of the design criteria,
design details, fabrication, construction, and fatigue tests, has been
reported in Section 3 of Ref. 5. The four beams were designated CC-IF,
CC-2F, CC-3S and CC-4S.
Beams CC-IF and CC-2F were designed primarily to provide compara
tive information on the fatigue behavior of the shear connection under
working loads. S The shear connection for both beams was designed in
accordance with the fatigue requirements of Ref. 4, except that connectors
were omitted from the negative moment region of CC-IF. On this basis, the
number of connectors available in each beam somewhat exceeded the number
which would be required for an ultimate strength design. 4 Fatigue fail
ures of some studs occurred in both beams, especially in beam CC-IF during
the fatigue tests. However, adequate shear connection remained for the
static tests.
-9-
Longitudinal and transverse reinforcement was provided in each beam
in accordance with the AASHO Bridge Specification.2
Flexural stresses
in the steel beam were kept close to the AASHO specified allowable
stresses to prevent premature failures of the wide-flange cross-section,
especially at the interior support of each beam.
The shear connectors in beams CC-3S and CC-4S. were propor
tioned on the basis of the static strength requirements suggested in
Ref. 4. These beams had substantially more negative longitudinal
reinforcement than beams CC-lF and CC-2F. Although beams CC-3S and
CC-4S were designed primarily to provide experimental data on the
ultimate strength behavior of continuous composite beams, they were
first tested under fatigue loading.
Failures of a few studs also occurred in beams CC-3S and
CC-4S during fatigue testing. However, adequate shear connection
was available for the subsequent ultimate strength tests, as there
was no indication of impending shear failure during these tests.
Since Ref. 4 suggests that a reduction factor of 0.~5 be used with
the static design requirement, some stud failures can be tolerated.
Because local flange buckling was of major importance during
the ultimate strength tests of beams CC-lF and CC-2F, it was decided
to make a comparative study of the effects of introducing some
stiffeners in the region of a possible local flange buckle in beams
-10-

CC-3S and CC-4S. The stiffener detail is shown in Fig. 7 of Ref. 5.
Only a bearing stiffener was provided over the interior support of
beams CC-IF and CC-2F. Additional stiffeners were purposely omitted
from beams CC-1F and CC-2F because of fatigue requirements of the
steel beam. In beams CC-3S and CC-4S, four full height stiffener
plates were provided. These plates were placed at 15" centers each
side of the support. Two small bearing stiffeners were placed at the
edges of the bearing plate, in addition to a full height bearing stiff
ener over the support.
So that comparative results of the tests of all four beams
could be made, the cross-sections, span lengths and load positions
for all four test beams were kept constant. The only variables were
the amount of shear connection along the beam, quantity of longitu
dinal reinforcement in the negative moment regions, and stiffener
details. These variables are discussed in detail in Ref. 5.
-11-

4.0· PROPERTIES OF THE TEST BEAMS
A detailed test program was conducted to determine the
physical characteristics of the materials used in the four continuous
composite beams. Also, the physical dimensions were obtained to help
ascertain the section properties of the beams. Further descriptions
of the cross section properties and the material properties of the
rolled steel beams, reinforcing bars, stud shear connectors and the
slab concrete has been reported in Section 4 of Ref. 5.
The four rolled steel beams were made of structural carbon
steel meeting the requirements of ASTM A36-63T. The beams were all
nominally 57-ft in length and furnished from the same heat. The mill
report is given in Table 2 of Ref. 5. Mechanical properties of the
structural steel were determined from tests of tensile coupons cut
from a 2-ft piece of the beam that had been flame cut from the ori
ginal 57-ft length.
Mechanical properties of the No.4, 6 and 7 deformed longi
tudinal reinforcing bars were determined by direct tension tests of
3-ft lengths of reinforcement.
The properties of the stud shear connectors were determined
from tensile tests on full sized studs. The studs were supplied by
two manufacturers.
-12-

Standard 6-in by l2-in cylinders were made of all concrete
used in the casting of the slabs. These cylinders were tested at the
age of 28 days and at the beginning of each fatigue and static test.
The 28 day cylinders were moist cured; all other cylinders were cured
under approximately the same curing conditions as the slabs.
The properties of the rolled steel beams, reinforcing bars,
stud shear connectors, slab concrete and the cross-section properties
are given in Tables 2 to 6 of Ref. 5.
The computed flexural strength in the positive moment regions
was equal to 830 k-ft Bad 809 k-ft for beams CC-IF and CC-2F respective
ly and 770 k-ft for both beams CC-3S and cc-4S. The flexural strength
of the negative moment region was 508 k-ft for both beams CC-IF and
CC-2F, 633 k-ft for CC-3S and 737 k-ft for cc-4S. The flexural strength
in the positive moment region was computed using the method described
in Ref. 7. In the negative moment regions the flexural strength was
based on the fully yielded beam and yielded tensile reinforcement.
-13-
5.0 INSTRUMENTATION AND TESTING PROCEDURE
5.1 Instrumentation
The instrumentation for beams CC-IF and ~C-2F was essentially
the same and was planned primarily for the fatigue testing program. For
those tests it was desirable to attach electrical resistance strain gages
to the steel beam at the load-points, close to the inflection points,
and over the center support so that slab forces at these sections could
be accurately computed. Bending moments and curvatures were also com
puted from these strain gage re~dings. Since beams CC-3S and CC-4S were
designed primarily for the ultimate strength tests, the instrumentation
was planned with that in mind. Electrical resistance strain gages were
kept out of the region of high strains. Mechanical strain gage points
were placed in the flange tips of the steel beams at the load-points and
over the center support so that accurate curvature data at these sections
could be obtained during the entire test. The center reaction was mea
sured with a large 300 kip capacity compression load cell so that accu
rate bending moments along the beam could be computed.
Deflection measurements under the load po~nts were initially
made with two O.OOl-in dial gages with 2-in travel. For increased de
flection a 6-in graduated scale was used which measured to O.Ol-in.
Slip measurements were taken at various locations along the
beams with O.OOl-in dial gages. Rotation of the beam over each exterior
support were measured with level bars and O.DOl-in dial gages.
-14-

Further details of the instrumentation used for all four
continuous beam tests is reported in Section 5 of Ref, 5,
5.2 Test Procedure
Beams CC-IF and CC-2F were each tested under fatigue load
ing to 2,000,000 cycles of load application using two Amsler alternat
ing stress machines and two Amsler hydraulic jacks. The ultimate
strength test of each beam was started from 4(CC-2F) to 8(CC-IF) days
after each fatigue test. The same Amsler hydraulic jacks were used
to apply the static load, The static load was measured with an Amsler
Pendulum Dynamometer which had a maximum load range of 0 to 200 kips
per jack.
Beams CC-3S and CC~4S were each tested under fatigue load
ing to 500,000 cycles of load application, The ultimate strength
test of each beam was started from 36(CC-4S) to 59(CC-3S) days after
each fatigue test. The same Amsler equipment was used for the fatigue
and static tests of these beams.
The ultimate strength test of each beam required two con
secutive days to complete. Total testing time ranged from 8 to 12
hours, Loads were increased in relatively small increments during
the first day until some plastic deformations had taken place. In
crements of load were applied in approximately one to five minutes.
Load was then held constant for 20 to 40 minutes while data was ob-
-15-
tained from all instruments. During the second day of test, plastic
deformation was continued until the ultimate load had been reached
and unloading was evident. Generally, 15 to 20 minutes was required
to allow the test load to stabilize before data was taken.
As long as the static test load was below the load corres
ponding to first yielding of the steel beam, increments of load were
applied. When it was evident that the load was stable (usually
shortly after application of the load increment) data was recorded
from all instrumentation. As plastification began (applied load to
yield load ratio of 1.0 to 1.25 approximately) a longer interval was
required before the applied load stabilized and deflections ceased.
In the plastic range, where the load was relatively constant, incre
ments of deflection were applied. Data was recorded only after a
sufficient interval had elapsed to allow the load and deflections to
stabilize. Since deformation rather than load was being applied, it
was thus possible to obtain dat~ up to and beyond maximum load capa-
city of the beams.
Detailed measurements of slab cracks in the negative moment
regions of beams CC-3S and CC-4S were made following each test. A
40 power microscope was used to measure the width of cracks.
Figure 1 shows the four continuous composite beams following
the ultimate strength tests. A schematic view of the test set-up is
-16-

shown in Fig. 11 of Ref. 5. Further discussion of the support details
for each beam and a discussion of the bracing used at the ends of the
beams has been reported in Section 5 of Ref. 5.
-17

6.0 TEST RESULTS
6.1 Load - Deflection Behavior of the Continuous Beams
Deflection measurements at the two load points of each beam
were obtained during the progress of each ultimate strength test. The
load - deflection results are summarized in Table 1 and Figs. 2 to 5.
The theoretical first yield shown in Table 1 was based on cross-section
properties reported in Ref. 5. The analysis considered the change in
the moment of inertia along the beam due to cracking of the concrete
slab. The point of inflection was computed by trial and error procedures.
The theoretical maximum load shown in the Table was computed using the
simple plastic theory. ~he theoretical elastic-plastic load - deflec-
tion curves shown in each of the above Figures was also computed from
the simple plastic theory. An idealized elastic-plastic stress-strain
curve was assumed.
Certain visual observations were made during the progress of
each test. These observations ~re summarized in Figs. 2 to 5 by the
letters (A) to (D) as follows: .
(A) Approximate indication of first yielding of the
the steel beam. Due to residual stresses in the,vicinity of welds at stiffener locations, some
yield lines were visible during the initial fatigue
tests. These lines Were mainly confined to the lower
regions of the web of the steel beam under the two
-18-

load-points and to the upper and lower regions of the
web over the center support. First yielding was taken
as the first indication of definite yielding in the
flanges of the steel beam, as evidenced by cracks in
the whitewash which covered the steel surface.
(B) Development of an apparent negative plastic hinge at
the center support. This stage was considered to have
been reached when yielding had progressed approximately
to the theoretical plastic centroid of the section. At
this point, there were large cracks in the slab in the
negative moment region of each beam, and there was con
siderable tension flange and web yielding under each
load point. Local flange and web buckling, introduced
additional yield lines which tended to obscure the yield
patterns associated with the negative plastic hinge alone.
The theoretical formation of the negative plastic hinge
is shown by an "X" on the theoretical curves in Figs. 2
to 5.
(C) Lower flange and web of the steel beam began to buckle
noticeably adjacent to the center support. Generally,
local buckling was observed to begin on both sides of the
support, then progress more rapidly on one side. At the
conclusion of the tests, the flange which developed the
-19-

major local buckle was observed to have twisted some 30
to 45 degrees from its original position. The flange on
the other side of the support would be only slightly
twisted at this time. Figure 6 shows the typical local
flange and web buckling which had developed by the end
of testing.
(D) The top surface of the concrete slab has begun to
crush adjacent to one of the loading beams. Fig. 7 shows
the extent of crushing which had occurred at two load
points by the end of the test.
In general, it was observed that the beams exhibited a linear
load - deflection behavior until first yielding. First yielding always
occurred in the bottom flange of the steel beam over the center support.
At the apparent formation of the negative plastic hinge (as defined
above), yielding under the load points was extensive. Plastic defor
mations increased rapidly following the formation of the apparent nega
tive plastic hinge at the center support. In each beam the maximum load
was determined by crushing of the concrete at the load ~oints; an ex
ception occurred in beam CC-4S where local buckling also occurred at
approximately the maximum load.
Near the first attainment of the ultimate load, tensile craaks
were observed on the lower face of the slab over the center support.
However, as deformations "increased and load either was maintained or
-20-
reduced, these cracks closed. In beams CC-3S and CC-4S, considerable
crushing occurred on the lower face on the slab over the center support
near the end of the test, thus indicating incomplete interaction. Fig.
8 shows the crushing on the lower face of the slab of beam CC-4S.
In beams CC-IF and CC-4S cracks also formed on the bottom face
of the concrete slab at the load points. When crushing was first ob
served at the load points, the crack was generally within l~ to 2~ inches
from the top of the slab. As crushing progressed with increasing de
formation, the cracks closed until at unloading, crushing had progressed
to the bottom of the slab. In beam CC-4S, considerable shear deforma
tion of the slab at the load points occurred before unloading started
as shown in Fig. 7. Similar behavior was generally observed in beams
CC-2F and CC-3S except that unloading took place before the slab had
crushed to half depth. At the end of the tests large cracks were still
present in the lower half of the slab of these two beams. This differ
ence in behavior can be clearly seen in Fig. 7.
6.2 Moment - Curvature Behavior at Plastic Hinge Locations
Two different systems of strain gages were used to measure
strains in the steel beams. In beams CC-IF and CC-2F strains were mea
sured at the load points (Sections 1 and 6) at the ~nflection points
(Sections 2 and 5) and over the center support (Sections 3 and 4) with
electrical resistance strain gages. (Section locations are shown in
Fig. 7 of Ref. 5). Good results were obtained from these gages during
-21-
the fatigue test program. However at the high strains obtained during
the ultimate strength tests, the capacity of these gages was exceeded.
Consequently, moments and curvatures during the latter stages of the
tests of beams CC-lF and CC-2F could not be computed. To increase the
range of strain measurement on beams CC-3S and CC-4S, mechanical gage
points were used at the load points (Sections 2 and 6) and over the
center support (Section 4). In beams CC-IF and CC-2F bending moments
and curvatures were computed from the strains in the steel beam. In
beams CC-3S and cc-4s bending moments were computed using a measured re-
action at the center support. This reaction was measured with a cali-
brated compression dynamometer. Curvatures were computed from the me-
chanical strain gage data.
The moment-curvature results computed from the data thus oh-
tained are summarized in Table 2 and Figs. 9, 10 and 11. Figures 9 and
10 show the moment-curvature behavior at a positive and negative plas~
tic hinge locations for beams CC-lF and CC-2F. Figure 11 shows the
same relationship for beam CC-3S,. The behavior of beam CC-4S was simi-
tar to CC-3S at each plastic hinge location. In these figures the ob-
served start of local flange buckling at the negative plastic hinge
location has been shown with an "X". The theoretical moment-curvature
curves were based on measured beam properties and an idealized elastic-
plastic stress-strain curve.
Although local buckling was observed to start almost simul-
taneously in the lower (compression) flanges on either side of the in-
-22-

terior support of each beam, a major flange buckle would develop only on
one side as load was increased. The major flange buckle developed on the
west side in beams CC-lF, CC-2F and CC-4S and on the east side in beam
CC-3S. Web local buckling was also observed adjacent to each flange
buckle. The web buckling extended to nearly the top of the web at each
major flange buckle. (Art. 6.1)
6.3 Slip Measurements
Slip measurements were taken at the exterior supports of each
beam and at various locations in the negative moment region. Dial gages
reading to O.OOl-in were used for this purpose.
Previous studies had indicated that if the number of shear con
nectors provided was adequate to develop the theoretical ultimate bending
moment of a cross-section, the load-deflection curve of the member would
not be affected significantly by the magnitude of slip.7 Beams CC-1F
and CC-2F had shear connections designed on the basis of the fatigue
criteria suggested in Ref. 4 fo~ 2,000,000 cycles of load application.
As a result beam CC-1F had 11% and beam CC-2F 12.5% more connectors than
would be required for an ultimate strength design using Ref. 4. Beams
CC-3S and cc-4S had connectors designed on an ultimate strength basis,
but were both fatigued first to 500,000 cycles. Although connector fail
ures had taken place in all four beams during the fatigue tests (see
Ref. 5), there was no indication of impending shear failure during the
ultimate strength tests.
-23-

As WqS mentioned previously (dh. 3), .the ultimate strength de
sign criteria in Ref. 4 for the design of the shear connection includes
a reduction factor of 0.85. On this basis, beams CC-lF, CC-2F" CC-3S
and CC-4S each had 29.5%, 32.5%, 17.5% and 17.5% more studs respectively
than- would be required for static strength if no reduction factor was
used.
Table 3 shows the magnitude of slips observed at nine locations
in each beam. The slips shown in the Table were measured at the attain
ment of the maximum load a'nd at the end of the test.
Figures 12 and 13 illustrate the load versus slip behavior at
the exterior ends of beams CC-2F and CC-3S. Similar behavior was observed
in beams CC-lF and cc-4S. Slip was obtained at each of the interior
points where slip measurements were made. Very small slips occurred un-
der the load points as expected. However, over the center support where
slip theoretically was zero, appreciable slips were measured as can be
seen in Table 3.
6~4 Cracking of Slabs in the Negative Moment Regions
The extent of cracking at the beginning of each ultimate strength
test 18 shown in Fig. 32 of Ref. 5. Additional cracking occurred during
each test and cracks widened appreciably as expected. Crack widths were
measured on beams CC-3S and cc-4S at the conclusion of the tests using
a 40 power microscope.
-24-

Figures 14 and 15 show the distribution of cracking throughout
the negative moment region of all four beams at the end of the ultimate
strength tests. The crack locations were emphasized by painting thin
black lines over them resulting in the appearance in the Figures of much
wider cracks than actually present.
In beam CC-IF large cracks approximately 6-in to 12-in apart
formed throughout the negative moment region. The pattern of cracks was
similar to that observed after fatigue testing, but the crack widths
were much larger. Additional longitudinal cracks appeared over the centpr
support approximately over the edges of the flanges of the steel beam.
A small amount of negative transverse bending was observed over the cen
ter support which would account for the presence of these cracks. Al
though the crack widths were not measured they were estimated to be from
G.IO-in to O.25-in wide based on known crack widths in two of the beams.
They were of nearly uniform width across the slab. Since they were of
the same magnitude of width thr~ughout the negative moment region, rea
sonably uniform tensile force existed in this region at the ultimate
load. This result was expected as there were no connectors in the nega
tive moment region of beam CC-IF. (Ref. 5).
An entirely different crack pattern is seen in beam CC-2F.
One very large crack which measured approximately 3/8 inch to 1/2 inch
-25-

wide, developed directly over the support. Very little cracking occurred
elsewhere as seen in Fig. 14, and was of smaller (O.Gl-in to O.lO-in es
timated) crack width. Most of the cracking occurred within the 22-in
length on each side of the center support in which there were no stud
connectors (see Ref. 5). Again this was the same pattern that was
observed during the fatigue tests except that in those tests the crack
widths were much smaller.
The crack patterns of beams CC-1F and CC-2F shown in Fig. 32
of Ref. 5 and Fig. 14 of this report could be expected to occur in pre
sent bridge decks where continuous composite bridge girders were de
signed using the present AASHO Bridge Specifications if the girders
were subjected to loads up to the design or to the ultimate load. The
particular pattern (CC-IF or CC-2F) would depend on whether or not
connectors were placed in the negative moment region.
In beams CC-3S and CC-4S more closely spaced and smaller
cracks developed in the slab at the ultimate load. Measured crack
widths varied from O.002-in to O.26-in in beam CC-3S,at the end of test
ing. In beam CC-4S, the crack widths at the end of testing varied from
O.OOl-in to O.21-in. In both beams crack widths were generally less
than O.09-in wide outside a 24-in width directly over the support.
Midway between the support and the inflection points the crack widths
in both beams were generally less than O.Ol-in. Fig. 15 shows the
distribution of cracking in beams CC-3S and CC-4S at the end of the
static tests.
-26-

More pronounced negative transverse bending was observed over
the center supports of beams CC-3S and CC-4S. This resulted in increased
longitudinal cracking as can be seen in Fig. 15. A short distance from
the support these cracks become inclined to between 30° and 450 to the
longitudinal beam axis. This effect was more pronounced in beam cc-4S.
In the immediate vicinity of the center support, vertical shear defor
mations across the longitudinal and inclined cracks was observed towards,
the end of testing, especially in beam CC-4S. It can be observed in
Fig, 15 that spalling of the slab surface took place about midway be
tween the steel beam and the edge of the slab of beam CC-4S, The spall
ing took place in the region of the greatest observed shear deformation,
and the greatest observed negative transverse bending of the slab o
The location of the spalled surface at the interior support
of beam cc-4S is shown again in Fig. 16. It was located approximately
at the cross-section containing the center support and lies to the north
of the beam axis.
-27-
7.0. ANALYSIS OF TEST RESULTS
7.1 Introduction
The concept of plastic design as applied to steel structures
is based on the ability of those structures to redistribute internal
forces (moments) as yielding takes place in certain regions. Rotation
capacity is therefore required at certain potential plastic hinge loca-
tions. The ability of steel structures to deform plastically is affected
by factors such as (1) moment gradient, (2) spacing of lateral bracing,
(3) the end restraint provided by spans adjacent to the inelastic span,
(4) the properties of the lateral bracing, (5) the occurrence of local
buckling, (6) the material and c-ross-sectional properties of the beam
13and (7) the occurrence of lateral torsional buckling. It has been found
that for steel structures using Wide-flange shapes, lateral-torsional
buckling will be the predominant failure mode in uniform moment regions,
while local buckling will be the predominant failure mode in regions un-
d d · 14er moment gra ~ent. Therefore, the properly designed structure must
adhere to certain lateral bracing spacing and geometrical restrictions
if these failure modes are to be prevented. Composite beams using wide-
flange shapes have certain advantages over non-composite beams in that
one of the flanges is connected at close intervals to the concrete slab.
When this flange is in compression, lateral torsional buckling is pre-
vented by the lateral bracing effect of the slab and local buckling is
prevented by the connection to the slab. The connection must of course
provide a minimum restraint to prevent such failure modes. Unrestrained
-28-

(not restrained against lateral torsional and local buckling) flanges in
composite beam will be subjected to the same restrictions as wide flange
beams.
In composite bridge girders maximum posit~ve moments are pro
duced by placing the live load on alternate spa~s. Uniform negative live
load moment therefore is produced in the unloaded span. The dead load in
th~9'span causes negative moments near the supports and positive moments
towards mid-span. If the live load to dead load ratio is sufficiently
large, negative total load moments approaching the uniform moment con
dition, can exist over the entire span. For such a case lateral tor
sional buckling of the lower (compression) flange is possible. However,
this failure mode is unrealistic for practical live load to dead load
ratios.
A more realistic failure mode is local buckling of the com
pression flange of the wide-flange shape near interior supports. Moment
gradient exists near the suppor'ts of all continuous composite beams and
the unrestrained flange is in compression in the vicinity of the interi
or supports. Therefore, if adequate precautions are not taken, local
buckling of either the compression flange or the web can be expected
in this region. Lateral restraint from the interior support itself pre
vents lateral torsional buckling in the immediate vicinity. However,
if the negative moment region is sufficiently long and local buckling is
prevented, lateral torsional buckling modes remote from the support may
-29-
be possible and should be investigated.
Composite beams exhibit other modes of failure which cannot occur
in non-composite beams. Some of the more important ones (splitting and
diagonal tension failure of the slab) were mentioned earlier (Ch. 2} 11,12
The only secondary failure which occurred during the ultimate
strength tests reported in this investigation, was local buckling of the
compression flange and web of the wide-flange beam adjacent to the center
support. Longitudinal splitting and diagonal tension cracking was ob
served only in localized regions of beams CC-3S and cc-4S (Fig. 15) and
did not affect the beam behavior (Art. 6.4). It is apparent that the
longitudinal and transverse reinforcement provided was adequate to prevent
this type of secondary failure.
The analysis of the test results presented in Chapter 6 of this
report will be confined to (1) the load-deflection hehavior and the in
fluence of the observed flange and web local buckling on the load-de
flection behavior, (2) the moment-curvature behavior at the plastic hinge
locations, (3) the feasibility of applying plastic analysis and ultimate
strength theory to the design of continuous composite beams, and (4) the
forces on the stud shear connectors and the tensile force in the longi-
tudinal reinforcement.
-30-
7.2 Ultimate Strength Behavior of the Continuous Beams
7.2.1 Load - Deflection Behavior
It was evident from Figs. 2 to 5 that the load-deflection be
havior of all four beams was similar although there were small differ
ences which will be discussed. It was further evident that three of
the four beams (CC-lF, CC-3S, CC-4S) exceeded the ultimate load. (Ch. 4
gives the ultimate flexural capacities). Beam CC-2F reached 97% of the
predicted load. All beams exhibited good deformation capacity at their
ultimate load.
The load-deflection curves for beams CC-lF and CC-2F (Figs. 2,
3) show a definite hi-linear behavior up to maximum load. In both beams,
local buckling was observed to start soon after first yielding and before
an apparent negative plastic hinge had developed. (Refer to page 19).
First yielding occurred in the compression flange at the center support
and spread outwards along the flange. The local flange buckle then de
veloped in the yielded region of each beam. Web buckling also occurred
adjacent to the major flange local buckle.
A significant difference in behavior between first yield and
the formation of the negative plastic hinge in beams CC-lF and CC-2F can
be observed from Figs. 2 and 3. In beam CC-lF, the start of local buck
ling (point C, Fig. 2) caused no appreciable change in slope. At point
B, where the apparent negative plastic hinge developed, the slope changed
abruptly especially in the West span. The curve was then approximately
-31-
linear until crushing of concrete at the load points was observed (point D).
In beam CC-2F, however, the abrupt change in slope of the load
deflection curve (Fig. 3) occurred at or shortly after the start of local
buckling (point C). The apparent formation of the negative plastic hinge
had little or no effect on the load-deflection curve.
The change in slope of the load-deflection curves for beams
CC-IF and CC-2F occurred at approximately the same relative load level
and the deflections at this point were nearly the same. It is apparent
however, that the change in slope was greater in beam CC-2F than beam
CC-lF. Since the start of crushing u~er the load points was at approxi
mately the same deflection, the result was a lower ultimate load level
for beam CC-2F.
Figures 9 and 10 show that a fully effective negative plastic
hinge did not form in either beam CC-IF or beam CC-2F. In fact, the ne
gative moment at the support of beam CC-2F (Fig. 10) was erratic and
dropped sharply to a low level soon after the theoretical yield moment
was reached. In beam CC-lF the moment-curvature behavior was somewhat
better (Fig. 9). Although the plastic moment at the support of beam
CC-lF was not reached and the moment fell sharply at first, it eventually
remained at a nearly constant level(near the theoretical yield moment)
for a considerable increase in curvature. This difference in moment
curvature behavior at the negative plastic hinge location partly explains
the difference in load-deflection behavior of beams CC-lF and CC-2F.
-32-

It is 'significant to note at this point that even though a fully
effective negative plastic hinge did not form (Figs. 9 and 10) in either
beam CC-lF or beam CC-2F, the predicted ultimate load capacity was ex
ceeded in beam CC-IF and almost equalled in beam CC-2F. This means then
that the theoretical ultimate positive moment of 830 kip. ft. (CC-IF)
must have been exceeded. Because the capacity of the electrical resis
tance strain gages was reached before the ultimate load was attained, the
moments at the positive and negative plastic hinge locations of beam CC-1F
could not be obtained at the ultimate load.
It was observed however, that yielding had spread to about 4-ft
either side of the load points. The stress at the load points was there
fore greater than the yield stress. The plastic centroid was in the con
crete slab at the initiation of crushing at the load points (observed
result). It would be located so "that the total compressive concrete
force at first crushing would be in equilibrium with the tensile force
in the steel beam. Therefore a bending moment greater than the theore
tical plastic moment of the section could have developed at the ultimate
load due to strain hardening. A further substantiation of this argument
will now be discussed.
Tests of two simple span composite beams (designated beams Be-IS
and SC-2S) were reported in Ref. 20. The cross-sections of these beams
were nearly identical to the cross-sections at the load points of the
four continuous composite beams reported herein. The material properties
-33-

varied slightly however between the 6 beams. Beams SC-2S and CC-lF were
tested to ultimate load at approximately the same time. The computed ulti
mate moment capacity of beam SC-2S was 742 k-ft. The experimental ulti
mate moment capacity was 850 k-ft which exceeded the computed value by
14.5%. On this basis it would be reasonable to assume that the theore
tical ultimate positive moment capacity of beam CC-lF could also have
been exceeded by a similar amount.
Figures 4 and 5 show load-deflection curves for beams CC-3S
and cc-4S which are somewhat different than those for beams CC-lF and
CC-2F (Figs. 2 and 3). The transition from the start of yielding (point
A) to the formation of the negative plastic hinge (point B) and beyond
to the ultimate load capacity was more gradual. This is the characteris
tic behavior of a composite beam in the absence of secondary failures.
The start of local buckling (point C) had no appreciable effect at that
point on the load-deflection behavior of beam CC-3S (Fig. 4). For beam
CC-4S, local buckling occurred almost at the predicted ultimate load and
caused a levelling off of the load-deflection curve. It is quite apparent
that the introduction of stiffeners near the center support of these two
beams greatly improved their load-deflection behavior.
The moment-curvature behavior at the negative plastic hinge
location of beams CC-3S and CC-4S was also improved. The negative moment
in beam CC-3S reached 94% of the theoretical plastic moment and remained
relatively constant for a large increase in curvature, (Fig. 11 and Table 2).
-34-

A similar behavior was obtained for beam CC-4S although the maximum ne
gative moment ratio was slightly smaller (Table 2).
A similar argument to that used previously for beams CC-IF and
CC-2F explains why the ultimate loads of beams CC-3S and CC-4S were also
reached when the negative plastic hinge did not quite develop. It can be
concluded that the ultimate posttive moment capacity of these two beams
also was exceeded due to strain hardening. Figure 7 shows the spread of
yielding at the load points of beams CC-3S and CC-4S.
In beams CC-lF and CC-2F, strain data was obtained from the
electrical resistance strain gages up to and somewhat beyond the occur
rence of buckling. However, moment-curvature data was obtained up to
the end of testing at the plastic hinge locations in beams CC-3S and
CC-4S. It is apparent from Fig. 11 that the positive plastic hinge mo
ment of 770 k-ft was exceeded in beam CC-3S. It was also exceeded in
beam Cc-4S. Since the cross-sections at positive plastic hinge locations
of all four beams was identical it is also reasonable to assume that the
positive plastic moment was also exceeded in beams CC-1F and CC-2F as
previously discussed. Large curvatures were associated with the attain
ment of the plastic mpment at positive hinge locations in beams CC-3S
and cc-4S. Because of the greater degree of interaction in beams CC-lF
and CC-2F (depending of course on the number of failed studs in each beam)
it is also reasonable to assume that the plastic moment would be reached
at slightly smaller curvatures. Some indication of the relative degree
of interaction between the four beams can be obtained from Table 3 and
-35-
Figs. 12 and 13. The slips in beams CC-1F and CC-2F were generally smaller
than the slips in beams CC-3S and CC-4S.
7.2.2 Local Buckling
Because of the flange and web buckling which occurred at the in-
terior support of the four continuous beams (Fig. 6) a preliminary study
will be made in this article in an attempt to determine the probable cause.
The results should be useful when designs are made for future continuous
composite beam tests where buckling failures must be avoided. The dis-
cussion will center on the width-thickness requirements of the flange and
web of the 2lW62 section adjacent to the center support.
(1) Flange and Web Local Buckling - Flexure
14 15 .Lay and Galambos, ' d1scuss the inelastic behavior of wide-
flange beams under moment gradient. Further discussion is given in Ref.
16 and tentative recommendations for local buckling of wide flange shapes
are given in Ref. 17.
The problem analyzed by Lay was the minimum required width-thick-
ness ratio of a compression flange which will allow a~erage strains equal
to the attainment of the strain-hardening strain before local buckling
begins. The material properties used in the analysis were those corres-
ponding to the on set of strain-hardening.
Lay found the critical width-thickness ratios for the compres-
sian flange by solving the torsional buckling problem. Solutions for two
-36-

cases were pres~nted; the first gave the limiting width-thickness ratio
assuming that the fully yielded flange was subjected to a uniform com-
pressive stress equal to the yield stress level of the flange material
(uniform moment) while the second was presented for the case of a com-
pression flange under moment gradient, where the strains were above the
strain-hardening strain. Therefore in this case the stress was greater
than the yield stress level. Using typical properties for A36 wide
flange shapes1
? the width-thickness limitations were found to be 18.4
(uniform moment) and 17 (moment gradient). The small (3%) contribution
of the web restraint was neglected in each case.
It should be pointed out that the equations for the width-
thickness ratios derived in Ref. 14 should be applicable to the unre-
strained (unrestrained from local buckling) compression flange of a wide-
flange shape used in composite beams since the problem is similar to
local buckling in ordinary wide-flange shapes.
Lay and Galambos point out in Refs. 14 and 15 that for the
moment gradient case, the yielded zone is concentrated into a restricted
region. The criterion then is that local buckling can only occur when
the yielded length equals the full length of a potential local buckle.
The length required for a potential locak buckle is dependent on materi-
al and geometry but independent of span length and moment gradient.
However, the actual yielded length of a flange will be dependent on the
value of moment at which the flange begins to yield and the form of
b d · d' 14the en ~ng moment ~agram.
-37-

Table ·4 shows the actual width-thickness ratios of the com
pression flange of the 21w62 section near the center support of each of
the four continuous composite beams. The depth-thickness ratios of the
web are also shown. These values were computed from the measured dimen-
sions of the wide-flange beams which are contained in Table 5 of Ref. 5.
Table 4 also shows the required yielded length of the compres
sion flange to develop a potential local buckle and the computed yield
length at the attainment of the full positive and negative plastic hinges
(mechanism) in each beam. For beams CC-3S and cc-4S the required length
for a potential local buckle was based on an unrestrained flange (no
stiffeners) .
The allowable width-thickness ratio for the flange and the
allowable depth-thickness ratio for the web of a rolled wide-flange shape
which have been taken from Ref. 18 are shown below Table 4. The value
of 17.5 for the flanges includes the 3% increase for the web contribu-
tion. This assumes that a secti,on under uniform compression can be
strained to the point of strain-hardening before local buckling influ
ences its carrying capacity. 19 The value of 70 for the web assumes bend
ing with zero axial load. Both of these ratios were derived for sym-
19metrical I, Vf or H shapes used as beams or c·olumns.
The actual material properties of the Wide-flange beams differed
somewhat from those assumed in the derivation of the preceeding allowable
width-thickness and depth-thickness ratios.S,l7 Using the actual values
-38-
of tensile strength and static yield stress for the flange material, and
the values of the modulus of elasticity and the strain hardening modulus,
all given in Table 3 of Ref. 5 the following ratios are obtained: l7
Allowable width-thickness ratio of flange 15.2
Allowable depth-thickness ratio of web 71.7
Although the flange and web of the wide-flange shapes used in
the four continuous composite beams appeared to be adequate against local
buckling based on the limitations of Ref. 18, the adequacy of the flanges
apparently was only marginal when based on the actual material properties.
It is evident then that local buckling of the flange could be expected to
occur. In fact, for beams CC-lF and CC-2F flange buckling did occur soon
after first yielding over the center support (Figs. 9 and 10) and con
siderably before the attainment of the theoretical fully yielded lengths
required to develop a local buckle in the compression flange.
The slightly improved behavior of beam CC-IF over beam CC-2F
can be partly explained on the basis of three factors, (1) differences in
geometry; CC-IF had a smaller flange width-thickness ratio, (2) differ
ences in material' properties, and (3) greater flange restraint at the
center support of beam CC-lF; for beam CC-IF the flange rested directly
on a steel bearing plate whereas 3/8-in of lead fillers separated the
flange and the bearing plate of beam CC-2F. (See Ref. 5). During fa
tigue testing, the lead fillers at the interior bearing of beam CC-2F de
veloped a rounded surface in the longitudinal direction thus moving the
-39-

boundary of a potential buckled length nearer to the center of bearing.
It is probable that the lead fillers developed a rounded surface in the
transverse direction also. This would tend to decrease the flange re
straint at the point of bearing.
However, even with these minor differences the behavior of both
beams CC-IF and CC-2F with respect to buckling was very poor.
It is apparent from the test results that the buckling behavior
of beams CC-3S and CC-4S was much improved. This was due no doubt to the
presence of the stiffeners. If the stiffeners had not been provided,
earlier local buckling and poorer behavior could have been expected be
cause the flange width-thickness ratios of these two beams were greater
than in beams CC-IF and CC-2F.
Two observations concerning the observed local buckling should
be stressed at this point. First, there was no sudden unloading of the
test beams at local buckling. In f~ct, in all cases, load either increased
further or stabilized after local buckling. It is evident that post
buckling strength was available. These tests provide additional experi
mental verification of the statement in Ref. 15, l1There is no reason why
local buckling in a cross-section would cause unloading of the member",
Secondly, the plastic hinge capacity at the interior support of these
test beams does not greatly affect the ultimate load capacity of the
beam (Tables I and 2). A 45% intrease in the computed negative plastic
moment (508 to 737 k-ft) results in only a 10.8% increase in ultimate
-40-

load capacity (172.4 to 185.8 kip). Therefore.8 significant reduction in
negative moment due to buckling would not be expected to greatly affect
the load carrying capacity. This may not be true of haunched beams, or
of negative moment sections which have cover plates on the compression
flange to control the locations of the neutral axis and plastic centroid.
At this point it appears that the webs of all four continuous
composite beams were adequate and that the local buckling which occurred
was due to too high values of width-thickness ratios of the flanges. How
ever, the computed value of allowable depth-thickness ratio ~or the webs
(71.7) was based on bending only. The possible reduction due to shear
and axial forces should be investigated.
(2) Web Local Buckling - Shear
The maximum shear force on either side of the center support
did not exceed 105 kips in any test. Using this value of shear, Section
2.4 of Ref. 18 gives a required shear capacity of the web (kips) at ulti
mate load, of 20.5 times the web area (in2). The measured yield stress
level of the web was used in this derivation (Ref. 5). Based on the mea
sured web thickness (Ref. 5) the minimum required de·pth-thickness ratio
of the web will then be 28. This is considerably less than the actual
values (Table 4). Adequate web area was therefore provided on this basis
to resist the maximum shear force. However, the validity of this analy
sis must be viewed with the understanding that· the equation in Ref. 18
was derived for a rectangular element in a symmetrical H, Wor I shape,19
-41-

(3) Web Local Buckling - Flexure and Axial Force
In the negative moment regions of continuous composite beams,
the force in the longitudinal slab reinforcement introduces compressive
forces to the steel beam through the shear connectors. If shear connec
tors are not present in the negative moment region compressive forces
are introduced near the inflection points providing the longitudinal
reinforcement is adequately anchored at these points.
In beam CC-IF, with no connectors in the negative moment re
gions, relatively uniform compression exists over the entire negative
moment region (See Fig. 39 of Ref. 5). In beam CC-2F, a nearly uniform
compression would exist in a 44-in length over the center support since
there were no connectors in this region. Similarly, in beams CC-3S and
CC-4S where this length was reduced to 20-in and l2-in respectively
(Fig. 4, Ref. 5). Because uniform compression would also exist between
the connectors, and the reduction at each line of connectors is rela
tively small, approximately uniform compression would exist over longer
lengths than those stated above~
The maximum value (neglecting strain hardening) of this com
pressive force can be taken as the area of longitudinal reinforcement
times its yield stress level or the yield force level of the steel beam
whichever is smaller. On this basis, the compressive forces developed
at the interior supports of beams CC-lF, CC-2F, CC-3S and cc-4S would be
110, 110, 317 and 675 kips respectively. Using the requirements of
-42-

Ref. 18 for combined axial force and plastic bending moment at ultimate
loading, the maximum dep,th-thickness limitations of the webs of beams'
CC-IF, CC-2F, CC-3S and CC-4S are 54, 54, 43 and 43 respectively (where
43 is the minimum required). On this basis, beams CC-lF and CC-2F appear
to be satisfactory but beams CC-3S and CC-4S do require web stiffeners,
(Table 4). Web stiffeners were provided adjacent to the center support
of these two beams but apparently were spaced too far apart since buck-
ling did occur. The spacing of the web stiffeners was chosen to suit
the spacing of the finger plates which provided lateral and longitudinal
stability during the fatigue tests (Ref. 5).
As pointed out earlier, beams CC-IF and CC-2F buckled approxi-
mately at the first yield load and considerably before ultimate load.
Assuming that no interaction occurred in a small length over the support
(44-in in beam CC-2F) the compressive force on the steel beams can be
determined from the measured strains at sections 3 and 4 which were with-
in this length, (Ref. 5). On this basis the compressive force was 134
kips (approximately the same fat both beams) and the required depth-
thickness ratio was 50. This is only slightly greater than the measured
values shown in Table 4. The value of 134 kips was "8 measured value and
exceeds the value of,IIO kips stated previo~sly due to strain hardening.
It must again be pointed out that the limitations provided in
h 'f-' 18 h b b d · 1 H I.r I h 19t e spec~ ~cat~ons ave ee"n aSe on symmetr~ca ,vv or s apes.
Furthermore, it was assumed that the total section area was equal to
-43-

twice the web area and that the maximum strain was four times the yield
strain. Although the first assumption is approximately satisfied, higher "
strain levels could be expected in the steel section of continuous com
pos~te beams. However, if these considerations are conveniently ignored,
it is apparent from this discussion that web buckling due to flexure and
axial force was also a major factor contributing to the local buckling
which was observed in the continuous composite beam tests.
(4) Summary
Although this analysis of local buckling has been preliminary
in nature, it does serve to indicate that in these tests (1) flange and
web local buckling could h~ve been expected to occur in an unrestrained
section near the center support, (2) flange local buckling occurred
earlier than expected because of the difference in material properties,
and (3) web local buckling was influenced by the axial force introduced
by the shear connectors. Additional research is required to establish
design rules which will allow the full negative plastic hinge to develop
in singly symmetric and unsymmetric continuous beams prior to flange and
web local buckling.
No local buckling of the steel beam was observed in the posi
tive moment regions during the continuous beam tests, even though the
top flange at the load points of beams CC-IF and CC-4S was under com
pression (Art. 6.1). Local buckling of the wide-flange beam in this re-
-44-

gion was, however, observed during the test of beam SC-lS which was re
ported in Ref. 20. This difference in behavior can be attributed to
(1) the difference in strain levels, and (2) the difference in stud con
nector spacing.
7.3 Feasibility of Plastic Design of Continuous Composite Beams
On the basis of this investigation it can be concluded that if
the negative plastic hinges are allowed to form first, continuous com
posite beams can be designed by plastic analysis. It was apparent from
the test results that even with serious local buckling at the interior
support, the load predicted by the simple plastic theory was exceeded iL
three of the four tests. The remaining beam (CC-2F) reached 97% of the
predicted load.
In a sense, the local buckle in the three successful tests
took the place of the negative plastic hinge. As buckling developed
the moments remained fairly constant (Figs. 9 and 11), as would be re
quired of a plastic hinge, although at a lower level than the theoretical
negative plastic hinge moment. In the remaining test, (CC-2F) the value
of moment was not constant after local buckling occurred (Fig. 10).
It is further apparent from these test results that even in
the absence of local buckling it would not have been possible to provide
sufficient longitudinal reinforcing steel in the negative moment region
to cause the positive plastic hinge to form first. To accomplish this
-45-

would have req~ired either a reduction of the slab width at the load points,
an increase in beam depth at the interior support (haunch) or a cover
plate on the compression flange at the interior support. The longitudinal
reinforcement in beam CC-4S was designed so that the three plastic hinges
would form at the same load (based on assumed properties). However, the
measured and assumed properties were sufficiently different that this was
not possible (Fig. 3, Ref. 5 ).
7.4 Forces on Stud Connectors
It was of interest to examine the maximum forces to which the
shear connectors were subjected during the ultimate strength tests. The
previous fatigue tests (Ref. 5) had resulted in almost complete failure
of bond between the steel beam· and the concrete slab in each composite
beam. As a result, the slab force had to be resisted by the connectors
alone. Only directly under the load points was bond not broken during
the fatigue tests.
As previously mentioned, the high strains in the wide-flange
beam which were associated with the ultimate load, exceeded the capacity
of the electrical resistance strain gages attached to beams CC-lF and
CC-2F. Therefore, in the absence of mechanical gage points no data was
obtained from which slab forces could be computed.
However, slab forces were computed from strain measurements on
the wide-flange shapes of beams CC-3S and cc-4S. Strain data from the
-46-

electrical' resistance strain gages at sections 1, 3, 5 and 7 (Ref. 5) and
from the mechanical strain gage points at sections 2 and 6 was used. Due
to the severe local buckling of the wide-flange beam, slab forces at
sect~on 4 computed from the mechanical strain gage data at that section
were not reliable.
Fig. 17 compares the design cumulative resistance of the shear
connectors in beams CC-3S and CC-4S with the force in the slab computed
from the strains at the aforementioned sections along the beam. The maxi
mum value of the slab force at each section is shown. This .did not
necessarily occur at the same value of loading. Generally, however, the
maximum slab force occurred either at or following the first attainment
of the ultimate load. The design cumulative resistance (stepped curves)
was based on an ultimate strength of 31.0 kips per 3/4-in stud shear con
nector as given in Ref. 7 (3,500 psi concrete strength). Since the de
ign includes a reduction factor of 0.85 it was expected that the test
points would fall somewhat lower than the design cu~ves.
The slab forces in beam CC-3S are lower than in beam CC-4s in
the positive moment regions even though the ultimat~ loads of the two
beams were approximately equal. The reason for this was contained in an
earlier observation. Beam CC-3S began to unload as crushing of the slab
began. Therefore since only part of the slab depth was at the crushing
stress, a smaller force existed in the slab (Fig. 7). On the other hand,
crushing progressed through the entire depth of beam cc-4S before unload
ing began. As a result, the slab force was higher (Fig. 7).
-47-
The slab force at sections 3 and 5 of beam CC-3S was also lower
than in beam CC-4S.
7.5 Force in the Longitudinal Slab Reinforcement
Figure 17 shows the maximum total force in the longitudinal-
s lab reinforcement at section 4 of beams CC-3S and CC-4S. In each casej,
the force shown occurred approximately at the ultimate load. Since the;
concrete at this section was cracked the force in the reinforcement re-.
presents the total slab force. Good agreement exists between the value
of this force and the cumulative resistance of the shear connectors.
7.6 Comparison of Beam Performance
The major variable in these tests was the percentage of longi
tudinal reinforcement at the negative plastic hinge location of each con
tinuous beam. Beams CC-1F and CC-2F each had 2.20-in2
(0.61%). Beam CC-3S
had 7.04-in2
(1.96%) and beam cc-4S had l6.20-in2
(4.50%). (Refer to
Fig.2, Ref. 5). The longitudinal reinforcement (2.20-in2
, 0.61%) at the
positive plastic hinge location of each beam was held constant.
The behavior of each beam was masked to some extent by the occur
rence of local buckling at the interior support. However, in beams CC-3S
and cc-4S the stiffeners provided near the interior support, controlled
buckling to the extent that the behavior of these beams was nearly that
which would have been expected had buckling not occurred. The behavior
of beams CC-IF and CC-2F was poorer but was remarkedly good considering
the severity of buckling which did occur.
-48-

The prior fatigue tests of the four beams had no deterimenta1
effect on the ultimate strength behavior, even though considerable
fatigue failures occurred in the stud shear connection. On the basis
of these tests it can be concluded that the shear connection of con
tinuous composite beams designed in accordance with the recommendations
of Ref. 4 will have sufficient strength to develop the ultimate flex
ural strength of the member. Furthermore, it can be expected that the
collapse mechanism can be developed.
The pattern of slab cracking in each beam differed appreci
ably. The crack pattern of beam CC-2F at the ultimate load was the
least desirable, and was apparently due to (1) the long interval over
the center support (44-in) in which no shear connectors were provided
and (2) the lower percentage of longitudinal reinforcement (0.61%).
The crack patterns of beams CC-3S and CC-4S were more desirable. How
ever, the large increase in reinforcement in beam CC-4S provided little
improvement in slab crack behavior over beam CC-3S.
7.7 Variables Requiring Further Study
(1) The fatigue tests reported in Ref. 5 suggested that the
spacing of connectors and the amount of longitudinal reinforcement in
the negative moment region of continuous composite beams required addi
tional study. That work was considered necessary in view of the fatigue
requirements of the steel beam, and to establish criteria for optimum
-49-

crack control of the concrete slab. When considering these variables
from this point of view, attention should also be given to the moment
curvature behavior at the potential negative plastic hinge location,
especially following the minimum number of cycles of load application
chosen in the fatigue studies. This work is required to ensure ade
quate rotation capacity of the negative plastic hinge. This relation
ship could not be studied conclusively in the ultimate strength tests
reported herein because of premature local buckling.
(2) This investigation has shown that a detailed study of
local buckling of continuous composite beams is required. This study
should follow studies already made on flange and web buckling of sym
metrical I,W and H shapes but should be specifically orientated to
wards singly symmetric composite steel-concrete beams using wide-flange
shapes. Consideration should be given to the placement of shear con
nectors and the degree of interaction in the negative moment region.
When the significant parameters have been established design rules
for the economical control of buckling should be developed. An exten
sion of this work to the buckling of non-symmetric c·omposite steel-con
crete beams should also be made.
(3) In haunched continuous composite bridge girders an ulti
mate strength design could be attempted where the positive plastic
hinges form first. A similar situation could arise if cover plates are
-50-

used on the compression flange at the interior supports. Further tests
are required to investigate the feasibility of plastic design for such
cases and possibly to establish slab reinforcement requirements at the
positive plastic hinge locations to ensure adequate rotation capacity
of these hinges.
(4) Ultimate strength tests should be carried out in con
junction with the further fatigue investigations suggested in Ref. 5
to determine the effect of slab width-thickness ratios and prestress-
ing on the moment-curvature behavior at negative plastic hinge locations.
-51-

8.0 SUMMARY
The results of ultimate strength tests of four continuous com
posite steel-concrete beams has been presented in this report. Each beam
had two equal spans of 25 feet and consisted of a 60 inch wide by 6 inch
reinforced concrete slab connected to a 21W62 A36 steel beam with 3/4
inch diameter by 4 inch high headed steel stud shear connectors. Each
continuous composite beam had been subjected to fatigue tests prior to
the ultimate strength tests. The fatigue test program was discussed in
Ref. 5.
The purpose of the ultimate strength tests was two-fold: (1)
to determine if sufficient shear capacity remained to develop the flex
ural strength of the beam and (2) to fUFther investigate the feasibi
lity of applying the concepts of plastic analysis and ultimate strength
theory to the design of continuous composite beams.
The following conclusions were drawn from an analysis of the
test results:
(1) Shear connectors designed on the basis of ,the static
and fatigue requirements. contained in Ref. 4 will provide
sufficient shear co'nnection to develop the ultimate flex
ural strength of the,member after the design cycle life
of the connection in fatigue has been reached.
-52-

(2) On'the basis of this investigation, plastic analysis
and ultimate strength theory can be used for the design
of continuous composite beams.
(3) The tensile strength of the longitudinal reinforcement
in the slab can be used in the design.
(4) Local flange and web buckling near the interior supports
of continuous composite beams limits the ultimate load ca
pacity of the member; further analytical and experimental
studies are required to establish design rules which would
allow the full negative plastic hinge to develop prior to
flange and web local buckling.
(5) Further studies are required to establish the rotation
capacity of negative plastic hinges.
(6) Tests of continuous composite beams are required in
which the positive plastic hinges are the first to form.
-53-
9.0 ACKNOWLEDGMENTS
The study described in this report was part of an investiga
tion on composite beams that was conducted at Fritz Engineering Labora
tory, Department of Civil Engineering, Lehigh University. L. S. Beed 1n
is Acting Chairman of the Department and Director of the Laboratory.
The project was financed by the New York Department of Public Works,
the Department of Commerce - Bureau of Public Roads, Nelson Stud Di
vision of Gregory Industries, Inc., KSM Products Division of Omark
Industries Inc., Tru-Weld Division of Tru-Fit Screw Products Inc., and
Lehigh University.
The writers wish to thank Dr. R. G. Slutter for his advice
and help in the planning and conduct of these tests. Sincere thanks
are also due Noriaki Yoshida for his assistance in the conduct of
several of the tests and for his aid in reducing and analyzing the
test data: to Messrs K. R. Harpel and C. F. Hittinger and their staff
at the Fritz Laboratory for their work in preparing the test set-up
and instrumentation; to R. N. Sopko and his staff for preparing drawings
and providing the photographic coverage; and to Mrs. D. Eversley for
typing the manuscript. '
-54-

10.0 TABLES AND FIGURES
-55-
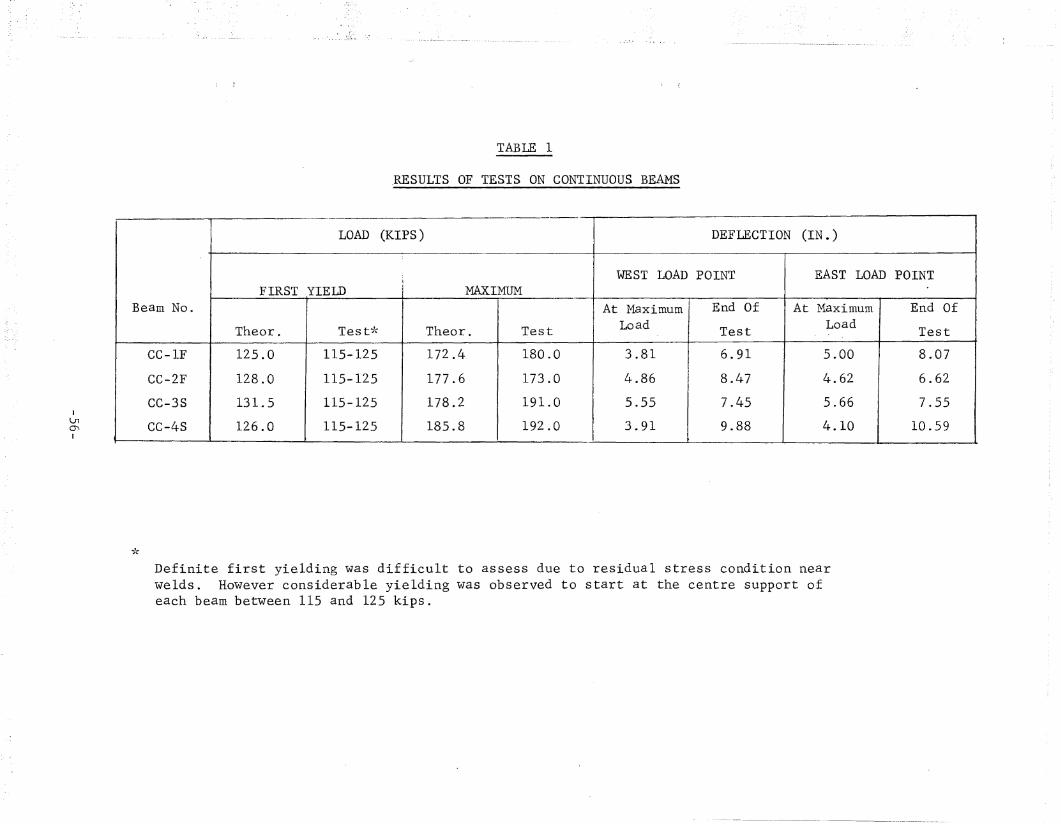
IlJl0'\I
TABLE 1
,RESULTS OF TESTS ON CONTINUOUS BEAMS
..- .. -------
LOAD (KIPS) DEFLECTION (IN.)
\WEST LOAD POINT EAST LOAD POINT
FIRST YIELD(
MAXIMUMBeam No. At Maximum End Of At Maximum End Of
Theor. Test"1~ Theor. Test Load Test Load Test
CC-1F 125.0 115-125 172.4 180.0 3.81 6.91 5.00 8.07
CC-2F 128.0 115-125 177.6 173.0 4.86 8.47 4.62 6.62
CC-3S 131.5 115-125 178.2 191.0 5.55 7.45 5.66 7.55
CC-4S 126.0 115-125 185.8 192.0 3.91 9.88 4.10 10.59
-l~
Definite first yielding was difficult to assess due to residual stress condition nearwelds. However considerable yielding was observed to start at the centre support ofeach beam between 115 and 125 kips.
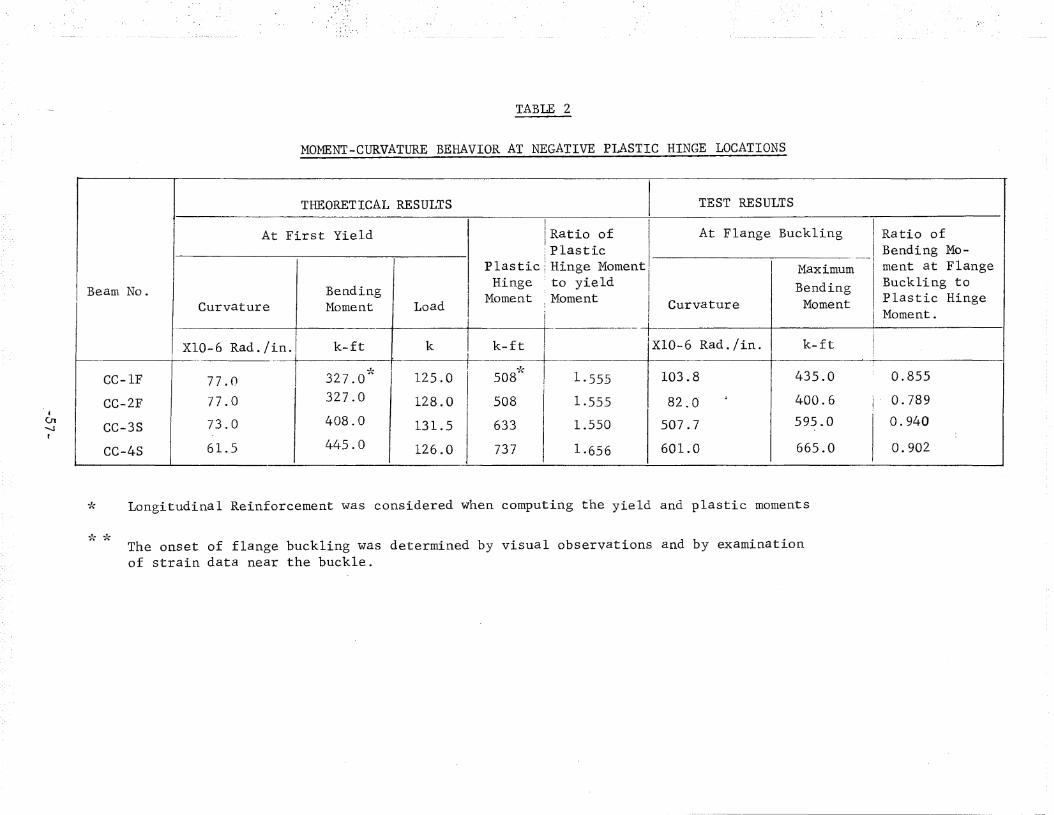
TABLE 2
MOMENT-CURVATURE BEHAVIOR AT NEGATIVE PLASTIC HINGE LOCATIONS
THEORETICAL RESULTS ;- TEST RESULTS
LoadBendingMoment
At First Yield
CurvatureI Beam No.
Ratio of At Flange Buckling Ratio ofPlastic Bending Mo-
Plastic Hinge Momentj
I Maximulll- ment at FlangeHinge : to yield ! Bending Buckling to
"
Moment ; Moment II Curvature Moment Plastic HingeI ! I Moment.
- ----t---.----+-----~-----I
X10-6 Rad./in~k-ft k I k-ft I X10-6 Rad./in. k-ft
I ~-IT 1~-~-O~~~;7.0* U5.0 I' ~~ I 1·~5 W3.-8~~~~~4-3-5-.-0~~~O-.-8-5-5~~~-1
CC-2F I 77.0 327.0 128.0 508 1.555 82.0· 400.6 0.789
CC-3S I 73.0 408.0 131.5 633 1.550 507.7 59~.0 0.940
CC-4S I 61.5 445.0 126.0 737 1.656 601.0 665.0 0.902
•en'-.Jr
* Longitudinal Reinforcement was considered when computing the yield and plastic moments
i:: -kThe onset of flange buckling was determined by visual observations and by examinationof strain data near the buckle.

TABLE 3
:MAGNITUDE OF SLIPS AT MAXIMUM LOAD AND AT END OF TEST-IN INCHES
..lJl(XlI
WEST SPAN I CENTER I EAST SPAN
I--
A B)
C D E F I G I H IBEAM !
I
NO. MAX?'( END7~?'( MAX I END MAX END i MAX ; END MAX! END MAX END :MAX 1 END MAX ; END MAX ~ ENDJ ~ I :
__ t ICC-1F .017 I .029 -- -- .116 .210 .144 .217 1.044 .016 -- -- .193 .292
I-- .0131.019
CC-2F .018 .023 .020 .044 .024 .032 .017 .024 -- -- .019 .028 .. 023 .028 .005 I .004 .013 .019\
CC-3S .052 .076 .109 .144 .106 .234 .103 .230 1. 058 .110 .111 .190 .126 .216 .134 .219 .05910075
cc-4S .068 .249 .078 .127 .064 .110 .060 .196 .009 .049 .045 .065 .058 .081 .064 .089 .058 .128
* Slip corresponding to the maximum test load
** Slip corresponding to the load at- the end of the test

TABLE 4
LOCAL BUCKLING
19.40
13.70
20.40
14.8018.58
18.20
17.90
. 17 ~ 90
-----~ired--------;Zelded~n~;h----I
Length for at the I'
a Flange Formation ofLocal Buckle a Mechanism
r-~ ---~ ......+-~ .... ~ ~-~~... ,......_ .. -
Width (Depth) - Thickness!I Ratios for 21\Af62r BEAM oJ, .WEB,ok "kNO. FLANGE
CC-lF 13.85 48.00
CC-2F 14.30 47.80
CC-3S 14.75 48.40
cC-4S 14.60 ~9.00
* Allowable width - thickness ratio for flanges of rolled shapes
is 17.5 (Ref. 18)
Allowable depth - thickness ratio for webs of rolled shapes(bending) is 70. (Ref. 18). For combined bending and axialforce this value is to be reduced by 100 times the axialload ratio (axial force / yield force).
-59-
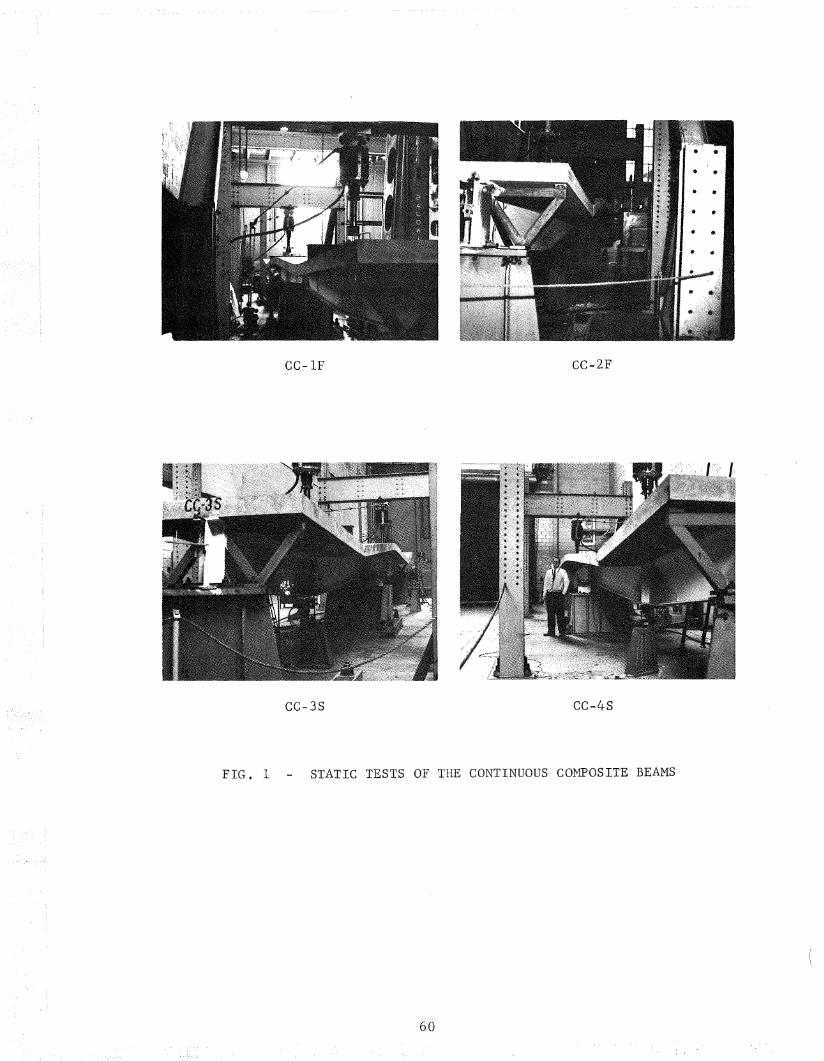
CC-1F
CC-3S
CC-2F
CC-4S
FIG. 1 STATIC TESTS OF THE CONTINUOUS COMPOSITE BEAMS
60
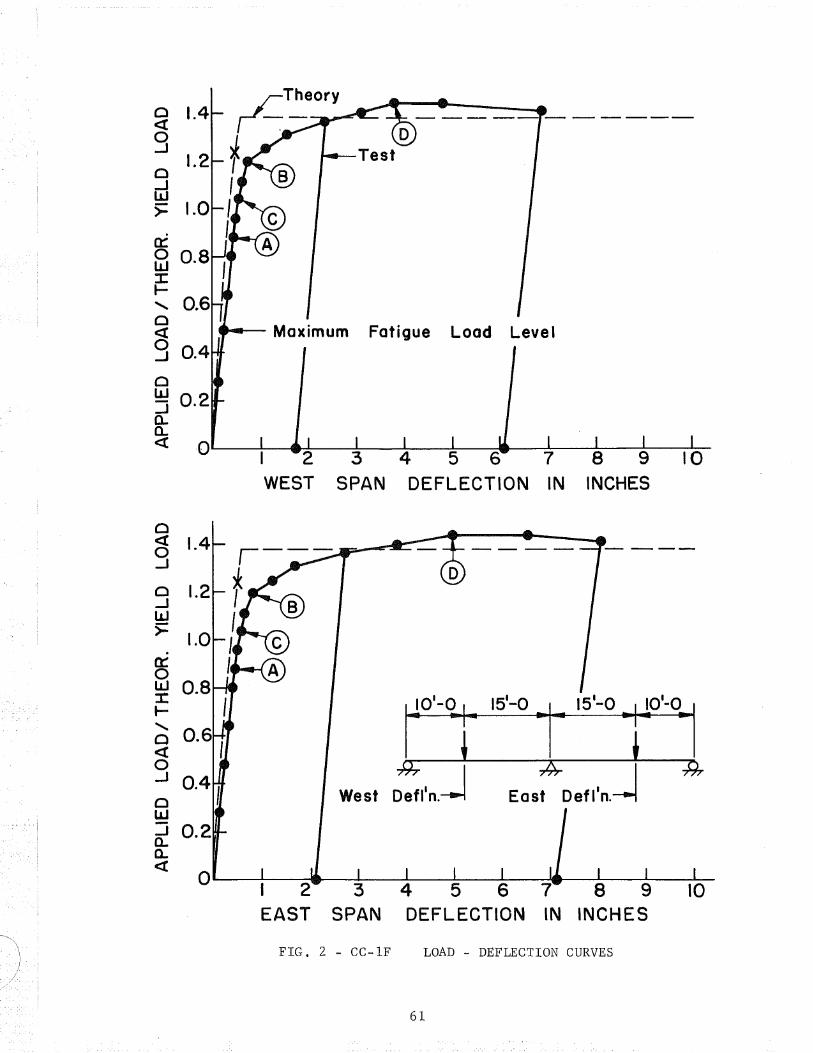
c~ 0.2aD..« ,0L...--_.&--- L-...-----JL-...-----II..-.----..IL....------4I --------..&.------------&..-
4 5 6DEFLECTION
a::@ 0.8:I:I-" 0.6o« -...- Maximum Fatigue Load Levelo.-J 0.4
~ 1.4 ~Theory
9 >J:1.2 J
:1 Iw>- 1.0 I
I
I
61
0<J: 1.40 r----I
f0 1.2....Jw I>- 1.0 Ia:: I0w 0.8X
IJO SLi.15'-0 __1- 15'-0
"'11I-
'"0<[ 1 i0
~j A= ~7Q;
..J
0 West Deflln. East Defl'n.LLJ:Ja.a.<C
04 5 6DEFLECTION
FIG. 2 - CC-1F LOAD - DEFLECTION CURVES
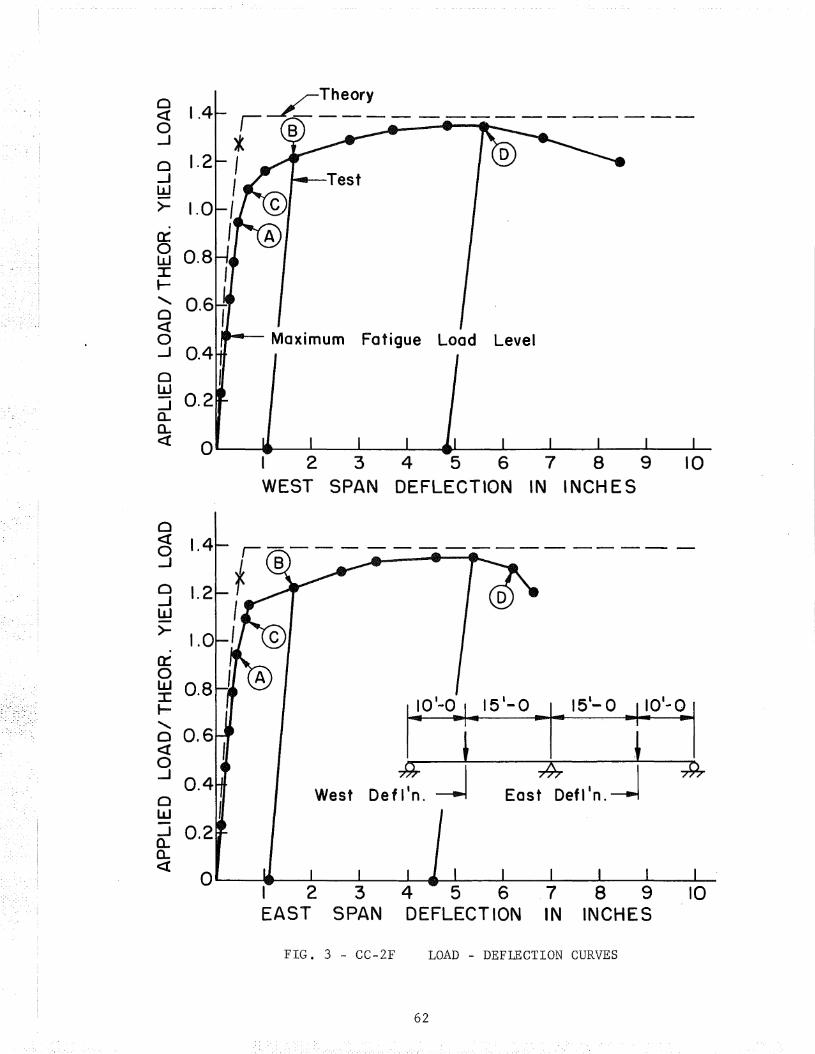
0 1.4«0...J
(:) 1.2...JlLJ>- 1.0Cl:0 0.8w:I:r-"0«0...J 0.40 ,w
0.2...Ja..c...<t 0
0« 1.40...J
0 1.2-Jw>- 1.00:::0w 0.8:c~
"- 0.60« I0...J 0.40
Iw..J 0.2a..a.<:(
0
~~Theory
r~-----------------i BI D
III
Maximum Fatigue Load Level
I 2 3 4 5 6 7 8 9 10WEST SPAN DEFLECTION IN INCH E S
1
..2.01
-0...,.... 151
-0 _I'" 15- ...Jlol-~1
1 i~"""--I "A j------*
West Defl'n. ----....I East Deft'n.
456DEFLECTION
FIG. 3 - CC-2F LOAD - DEFLECTION CURVES
62
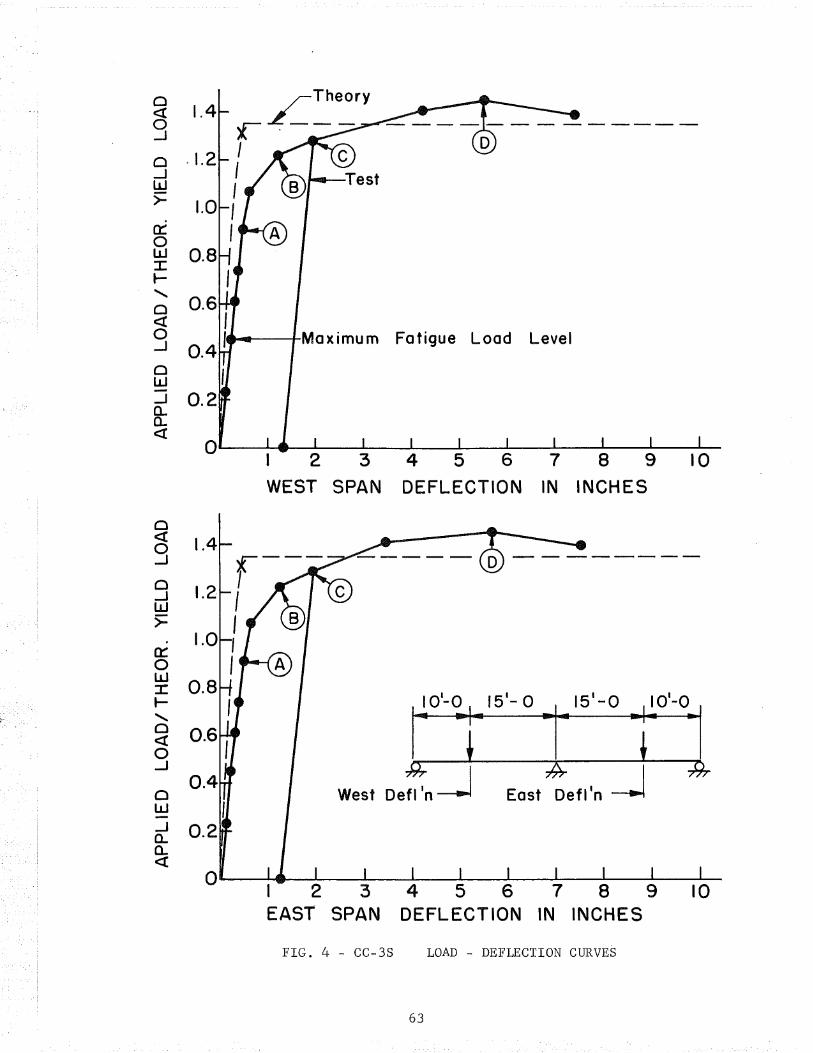
-------+-Maximum Fatigue Load Level
1.4 X~Theory
I C
/ Test
1.0 II
O--------....-a......--a......--a......--.a...---.a...---a......---------I 2 3 4 5 6 7 8 9 10
WEST SPAN DEFLECTION IN INCHES
o .1.2-.Jw>=a::ow:r:t-"o«o-l
oW--!Q.a.<[
1.4 c--1
1.2 I
I1.0 I
I
O-----........-a......--~_.a.--..-.l....---.a..---.a..---.a.....--~-..Io.--.I 2 :3 4 5 6 7 8 9 10EAST SPAN DEFLECTION IN INCHES
oc::(o.-I
o..JW>-0::ow:r: 0.8t- I
"g 0.6,
--'0.4
ow I
~ 0.2a.«
FIG. 4 - CC-3S LOAD - DEFLECTION CURVES
63

.,r-Theoryr ..L-- - - ___
~ 1.4 I9 c
I. 2 IoiJ1 I
>= 1.0
a:: I@ 0.8J:I-"-o Maximum Fatigue Load Level
S..J
olJJ-Ja..Q.« 0 ------a..-~ -~---L...--..L....------a---.a..- -----L..-.
4 5 6
DEFLECTION
101-0 15
1-0 115
1-0 10
1-0r 14
- i I-4 I =4 I 1),
West Defl'n.--...t East Defl'n.----l
o r---« 1.4 Ig Ic 1.2 I..J Iw>=0::oUJ::r:to-
"o«o...J
oW-Ja..a..<[ OL-------JL-----IL..-- i------IL.....-----JL----I~---I----'---L_____+_t__L-
123 4 567 8EAST SPAN DEFLECTION IN INCHES
FIG. 5 - CC-4S LOAD - Ul:!;r·L~C'l'lUN CURVES
64
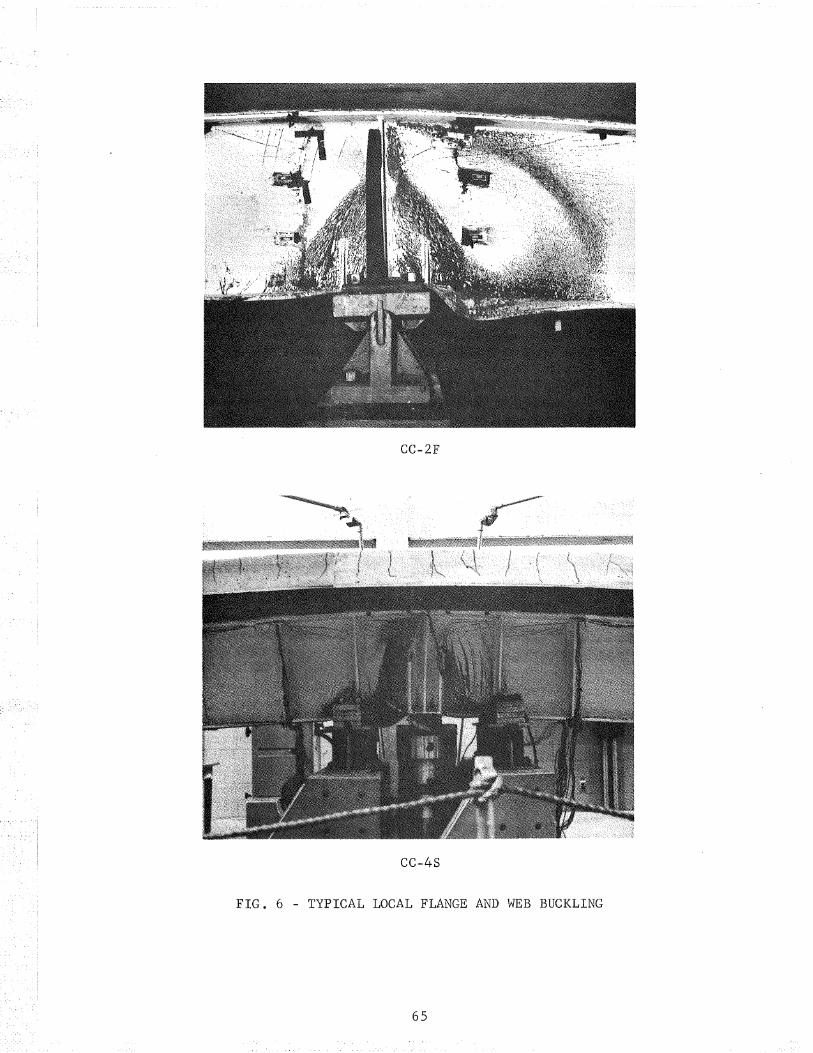
CC-2F
CC-4S
FIG. 6 - TYPICAL LOCAL FLANGE AND WEB BUCKLING
65

cc-4S
CC-3S
FIG. 7 - CRUSHING OF SLAB AT LOAD POINTS
66
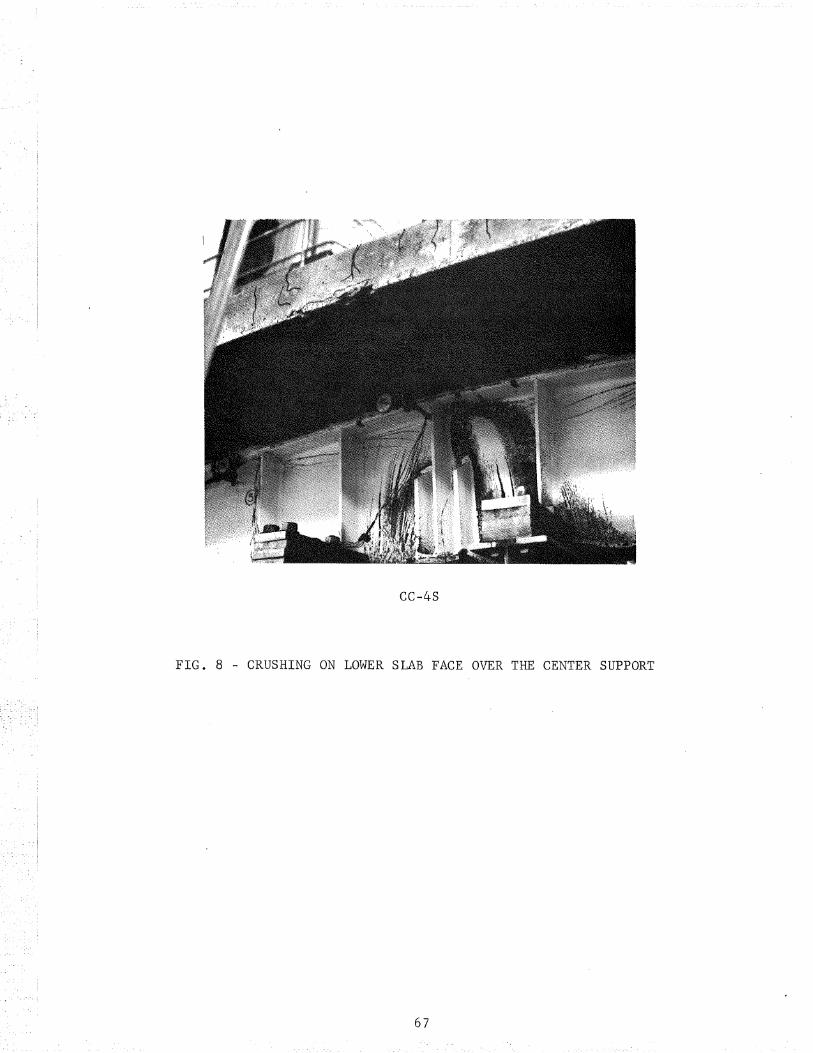
CC-4S
FIG. 8 - CRUSHING ON LOWER SLAB FACE OVER THE CENTER SUPPORT
67

~Theory - 21 'IF 62__ .L- - _
*,..---~--A=--.---i-------.*West ~ East
1.75 r _. ~TheorY--=Composite _
1.50 I Test - Section ®,
t-Zw:Eo~
o...JW>-a::ow:c~
"~Zw~o~
Q 0.25w::Ja.. 0L....--L.--------IL..---_L--_L--------I~_____JL..._____lL...__L..._____I1o_o___ _ _....._0.. I 0 20 30 40 50<t CURVATURE/THEOR. YIELD CURVATURE
EastWest
Test - Section ®
~Theory 21 'IF 62- __ L- _
~ __ JCTheOrY~COmposite------1.50 I
J
1.75
.a::oIJJJ:t-"t-Zw~o:Eo 0.25w~a.. OL---.a.....----'-----..L..-_..a....--_..I--_....&...-_.....a.--_....a..-_....a..-_-'--
~ 10 20 30 40 50<t CURVATURE ITHEOR. YIELD CURVATURE
IZw:Eo~
o..JW>-
FIG. 9 - CC-1F MOMENT-CURVATURE CURVES
68

West
.r-Theory - 21 w: 62__ --r _
a::olJ.J:I:t"r-zlLJ:Eo~
Cl 0.25w:Ja.. O---------....--..---.......--------------....--......-~------~-a. 10 20 30 40« CURVATURE / THEOR. YIELD CURVATURE
~z~ 1.75 r _. _£Theory~Composite _
~ 1.50Test - Section ®o
..JlJJ>-
~~~_t_---.-;?\;--~----...-.=H,West East
Test - Section ®
.rTheory - 21 w= 62____ 1 _
~-_-JCTheOry~Omposite------1.50 ,
I
~zw 1.75~o~
o...JW>-a::owJ:J-
~ZlJJ:!o~
o 0.25w~ O'----L....--..,jl.....--.a......--.a......--.a.----~--L....--~-'----~~ 10 20 30 40 50« CURVATURE / THEOR. YIELD CURVATURE
FIG. 10 - CC-2F MOMENT - CURVATURE CURVES
69

®
-f#......--t-----.--4=--l----.....J),..West ~ East
Theory - 21 YF 62
Test - Section
tZ~ 1.75~ ~TheOry..=. Composit~ ----.-.-=----=--=----~--
1.50II
a:::oW::I:t-~ 0.7zw:Eo~
olLJ...Ja.. O---------II~----II .........-----I----a_----a.-----I.----.L--------....----a--
~ 10 20 30 40CURVATURE/ THEOR. YIELD CURVATURE
o...JW
>-
FIG. 11 - CC-3S MOMENT - CURVATURE CURVES
~Z
~ 1.75 r- LTheory - .:.omposite _
~ 1.50 I Test - Section @
~ I>- I.25 I __ ....f::..Theory-=-2...!..- 'IF 62 _
Ct:oW::I:I-"J-ZlLI::E 0.5o~
o1.LJ:Ja. OIl......----4I-.....----a---------'---..I.--.a..--.a..-----a..---L--.-....I--a. 10 20 . 30 I 40« CURVATURE /THEOR. YIELD CURVATURE
70

-0.02 0.04 0.06 0.08 0.10WEST END SLIP IN INCHES
0<I0-J
0..JW>=a:::0w:ct-
"0«0-J
0w ,0.2-..JC-o..
0c::(
0c::( 1.40..J
0 1.2...JlLJ
>-a::0w:L:I--"-0<[0-I
0w 0.2-Ia..a..<{
lJ.a.-a.,.... 151
- a _I'" i -i~al-a"'1
+;;' "fiT !--;q,.West End Slip------\ East End Slip--j
0.02 0.04 0.06 0.08 0.10
EAST END SLIP IN INCHES
FIG. 12 - CC-2F LOAD SLIP CURVES
71

,...'
0 1.4<l0..J
01.2
...Jw>- 1.0
a:0 0.8w:cI-"- 0.60<[0...J 0.4
0w 0.2:Ja.Q.c:( 0 0.04 0.06 0.08
END SLIP IN INCHES
0 1.4<:t0...J
1.20...JW 1.0>=a::: 0.80w::I:I- 0.6.. "-0<[0 0.4...J
0w '0.2..Ja..a..<[ 0
1...101-0., ... 151-0 ..I.... 15
1-0 ..j...101-0~1
}); t A ~~;Q,West End SliP---1 East End Sli p---j
0.06 0.08
SLIP IN INCHES
FIG. 13 - CC-3S LOAD SLIP CURVES
72
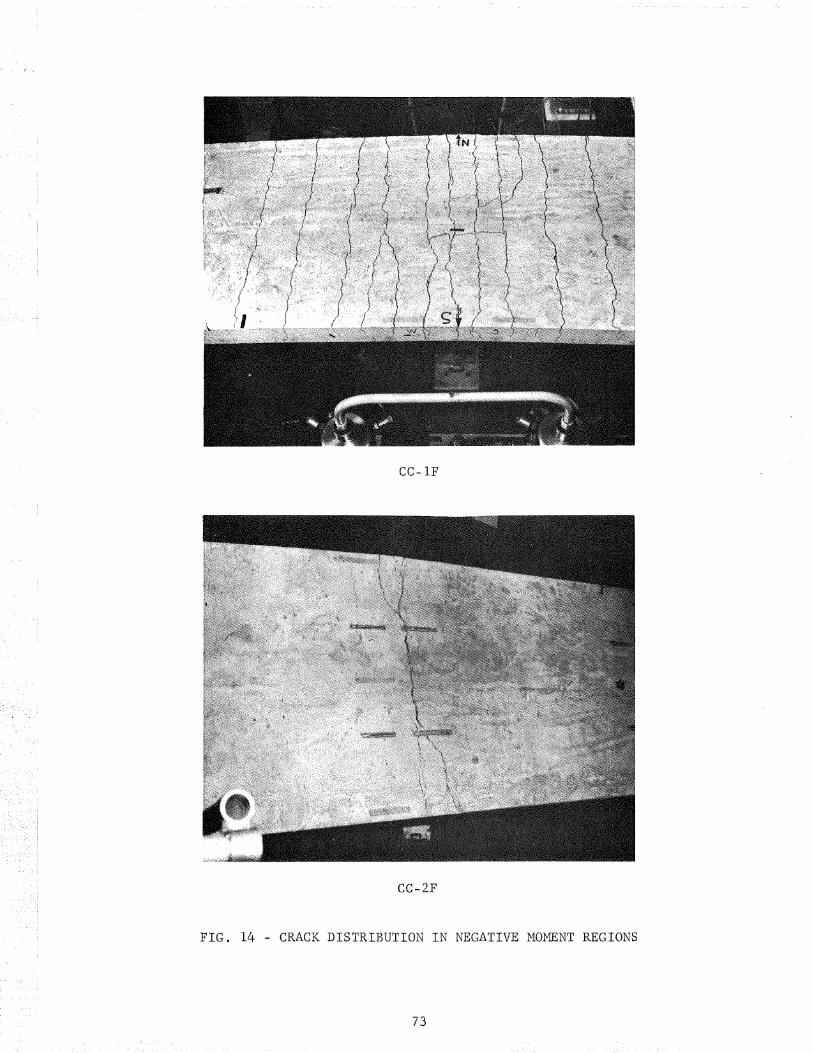
CC-1F
CC-2F
FIG. 14 - CRACK DISTRIBUTION IN NEGATIVE MOMENT REGIONS
73
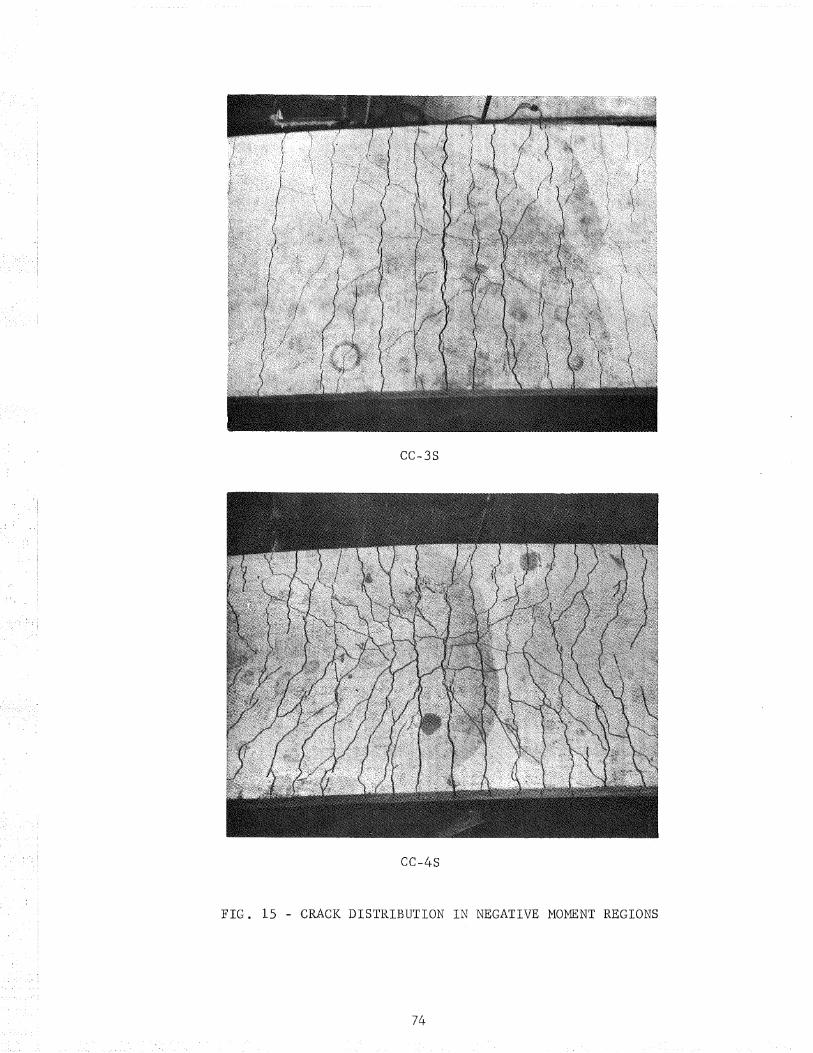
CC-3S
CC-4s
FIG. 15 - CRACK DISTRIBUTION IN NEGATIVE MOMENT REGIONS
74

CC-4s
FIG. 16 - CC-4s SPALLING OF SLAB
75
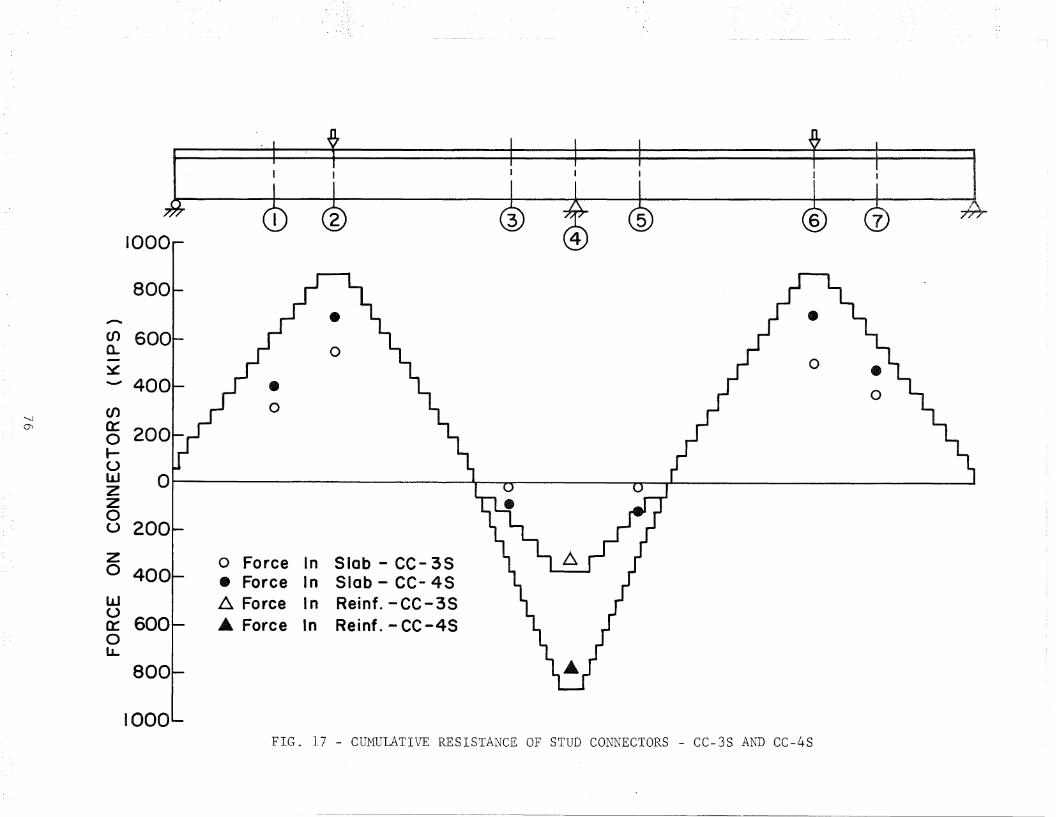
777-\!} '61 \2J ~ \2) ~ \!J
1000
800,.....en 600a... 0- ..., ,..J 0~
--' 400
'-J en0\ a::
0I-UW azz0u 200z o Force In Slob - CC- 3So 400 • Force In Slab - CC- 4Sw ~ Force In Reinf. -CC-3S~ 600 .. Force In Reinf. -CC-450u.
800
1000FIG. 17 - CUMULATIVE RESISTANCE OF STUD CONNECTORS - CC-3S AND CC-4S

11. / REFERENCES
1. Beedle, L. S., et aI,STRUCTURAL STEEL DESIGN, (CHAPTER 13) edt by Lambert Tall,Ronald Press Company, New York. 1964
2. American Association of State Highway OfficialsSTANDARD SPECIFICATIONS FOR HIGHWAY BRIDGES, Ninth Edition,Washington, D.C. 1966
3. Viest, I. M., Fountain R. S., and Siess, C. P.DEVELOPMENT OF THE NEW AASHO SPECIFICATIONS FOR COMPOSITESTEEL AND CONCRETE BRIDGES, Highway Research Board,Bulletin 174, 1958
4. Slutter, R. G., and Fisher J. W.FATIGUE STRENGTH OF SHEAR CONNECTORS, Highway ResearchRecord No. 147, Highway Research Board, 1966, pp. 65 - 88
5. Daniels, J. Hartley, and Fisher J. W.FATIGUE BEHAVIOR OF CONTINUOUS COMPOSITE BEAMS, FritzEngineering Laboratory Report No. 324.1. 1966
6. Siess, C. P., and Viest, I. M.STUDIES OF SLAB AND BEAM HIGHWAY BRIDGES: V: TESTSOF CONTINUOUS RIGHT I-BEAM BRIDGES, Bulletin No. 416,University of Illinois Engineering Experiment Station, 1953
7. Slutter, Roger G., and Driscoll, George C. Jr.FLEXURAL STRENGTH OF STEEL-CONCRETE COMPOSITE BEAMS, Journalof the Structural Division ASeE, Vol. 91, No. 8T2. 1965
8. Culver, Charles; Zarzeczny, Paul J., and Driscoll, George C. Jr.TESTS OF COMPOSITE BEAMS FOR BUILDINGS, Fritz EngineeringLaboratory Report No. 279.6. 1961
9. Iwamoto, K.ON THE CONTINUOUS COMPOSITE GIRDER, Highway Research Board,Bulletin 339. 1962 ·
10. Tachibaba, Y., Kondo, K., and Ito, K.EXPERIMENTAL STUDY ON COMPOSITE BEAMS PRESTRESSED WITHWIRE CABLES, International Association for Bridge andStructural Engineering, Preliminary Publication of theSeventh Congress. 1964
-77-

11. Barnard, P. R., and Johnson, R. P.PLASTIC BEHAVIOR OF CONTINUOUS COMPOSITE BEAMS, Proceedings,Institution of Civil Engineers, Vol. 32, October 1965.pp. 161 - 179
12. Johnson, R. P., VanDalen, K., and Kemp, A. R.ULTIMATE STRENGTH OF CONTINUOUS COMPOSITE BEAMS, ProgressReport, British Constructional Steelwork Association Conference, September 1966
13. Galambos, T. V., and Lay, M. G.STUDIES OF THE DUCTILITY OF STEEL STRUCTURES, Journal ofthe Structural Division, Proc. ASeE Vol. 91, 8T4.August 1965. p. 125
14. Lay, M. G.FLANGE LOCAL BUCKLING IN WIDE-FLANGE SHAPES, Journal ofthe Structural Division, Proc. ASeE, Vol. 91, No. ST6,December 1965, p. 95
15. Lay, M. G., and Galambos, T. V.INELASTIC BEAMS UNDER MOMENT GRADIENT, Journal of theStructural Division, Proc. ASCE, Vol. 93, No. STl,February 1967, p. 381
16. Beedle, L. S., et al.STRUCTURAL STEEL DESIGN, (Chapter 17), ed. by Lambert Tall,Ronald Press Company, New York. 1964
17. Driscoll, G. C. Jr., et al.PLASTIC DESIGN OF MULTI-STORY FRAMES - LECTURE NOTES,(Chapter 3), Fritz Eng~neering Laboratory Report No. 273.20Lehigh University, 1965. (Presented at the 1965 Summer Conference on the Plastic Design of Multi-Story Frames, LehighUniversity, August 24 - September 2, 1965·
18. American Institute of Steel ConstructionSTEEL DESIGN MANUAL, AISC·, 6th Edition, New York, 1964
19. American Institute of Steel ConstructionCOMMENTARY ON PLASTIC DESIGN IN STEEL, Manuals of EngineeringPractice, No. 41, 1961
-78-

20. Daniels, J. Hartley, and Fisher, John W.STATIC BEHAVIOR OF COMPOSITE BEAMS WITH VARIABLE LOADPOSITION, Fritz Engineering Laboratory Report No. 324.3,Lehigh University, March 1967.
-79-