Embed Size (px)
Citation preview
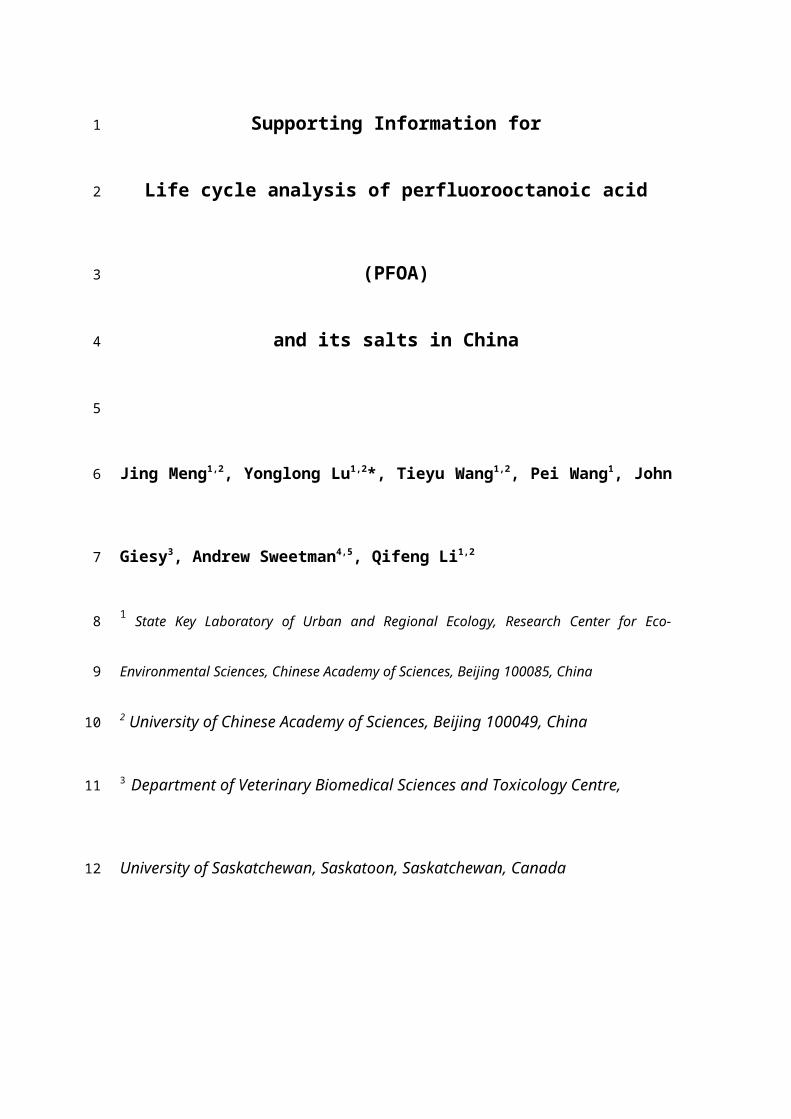
Supporting Information for
Life cycle analysis of perfluorooctanoic acid (PFOA)
and its salts in China
Jing Meng1,2, Yonglong Lu1,2*, Tieyu Wang1,2, Pei Wang1, John Giesy3, Andrew
Sweetman4,5, Qifeng Li1,2
1 State Key Laboratory of Urban and Regional Ecology, Research Center for Eco-Environmental
Sciences, Chinese Academy of Sciences, Beijing 100085, China
2 University of Chinese Academy of Sciences, Beijing 100049, China
3 Department of Veterinary Biomedical Sciences and Toxicology Centre, University of
Saskatchewan, Saskatoon, Saskatchewan, Canada
4 Centre for Ecology & Hydrology, Maclean Building, Crowmarsh Gifford
Wallingford, Oxon,OX 10 8BB, UK
5 Lancaster Environment Centre, Lancaster University, Lancaster LA1 4YQ, UK
* Corresponding author:
* Yonglong Lu
1
2
3
4
5
6
7
8
9
10
11
12
13
14
15
16
17
18
19
20

Table of Contents
S1 Production of fluoropolymers (FP)
S2 Transfer coefficients (TC) and emission factors (EF) during production of
PFOA/PFO
S3 TC and EF during industrial applications
S4 PFOA/PFO residues in commercial products
S5 TC and EF during service life of products
S6 TC and EF at end-of-life of products
S7 TC and EF in sewage system
S8 TC and EF in wastewater treatment plants (WWTPs)
S9 TC and EF in incineration plants
S10 TC and EF in landfills
S11 TC and EF in stacking sites
Fig. S1 Flows of PFOA/PFO during production and use by industries
Fig. S2 Flows of PFOA/PFO in domestic use
Fig. S3 Flows of PFOA/PFO in waste management
23
24
25
26
27
28
29
30
31
32
33
34
35
36
37
38

S1. Production of fluoropolymer (FP)
Production capacity and actual output of FP in 2010 were approximately 80,000 t and
60,000 t, respectively (CAFSI 2011). Actual output was approximately 75% of the
production capacity. Based on production capacity of 78,900 t for
polytetrafluoroethylene (PTFE) (ChinaIOL 2012){(FOEN), 2009 #32}, it was
estimated that 59,175 t of PTFE was produced in 2012. In addition, based on the same
proportion of PTFE in 2012 and 2015 and import/export volumes, approximately a
total of 78,116 t FP was produced in 2012 (Table S1).
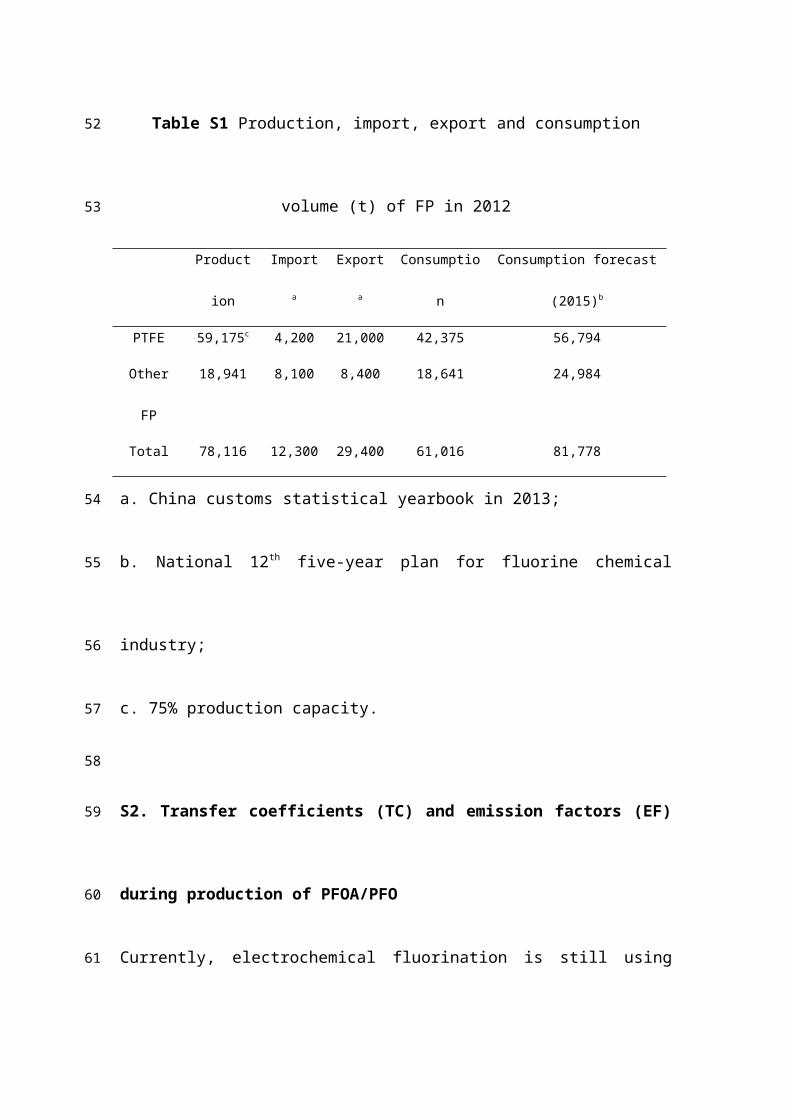
Table S1 Production, import, export and consumption volume (t) of FP in 2012
Production Import a Export a Consumption Consumption forecast (2015)b
PTFE 59,175c 4,200 21,000 42,375 56,794
Other FP 18,941 8,100 8,400 18,641 24,984
Total 78,116 12,300 29,400 61,016 81,778
a. China customs statistical yearbook in 2013;
b. National 12th five-year plan for fluorine chemical industry;
c. 75% production capacity.
S2. Transfer coefficients (TC) and emission factors (EF) during production of
PFOA/PFO
Currently, electrochemical fluorination is still using primary technology to produce
PFOA, although telomerization has been the predominant method in North America
and Europe since 2002. The purity of PFOA products was relatively high (94.0-
95.8%), and the major impurity was PFOS (2.06-3.09%) (Jiang et al. 2015). It also
39
40
41
42
43
44
45
46
47
48
49
50
51
52
53
54
55
56
57

proved that isomer structure of PFOA products in China was similar with that in 3M
Company. Therefore, the same transfer coefficients and emission factors were used.
PFOA/PFO from production and industrial applications would be released with
wastewater, gas and solid waste, and then enter WWTPs, air and disposal sites for
solid waste. It was noted that wastewater in PFOA manufacturing factories was
treated in inner WWTPs, and then discharged into rivers. The process in WWTPs was
unknown, so only the process from manufacture to emission to the hydrosphere was
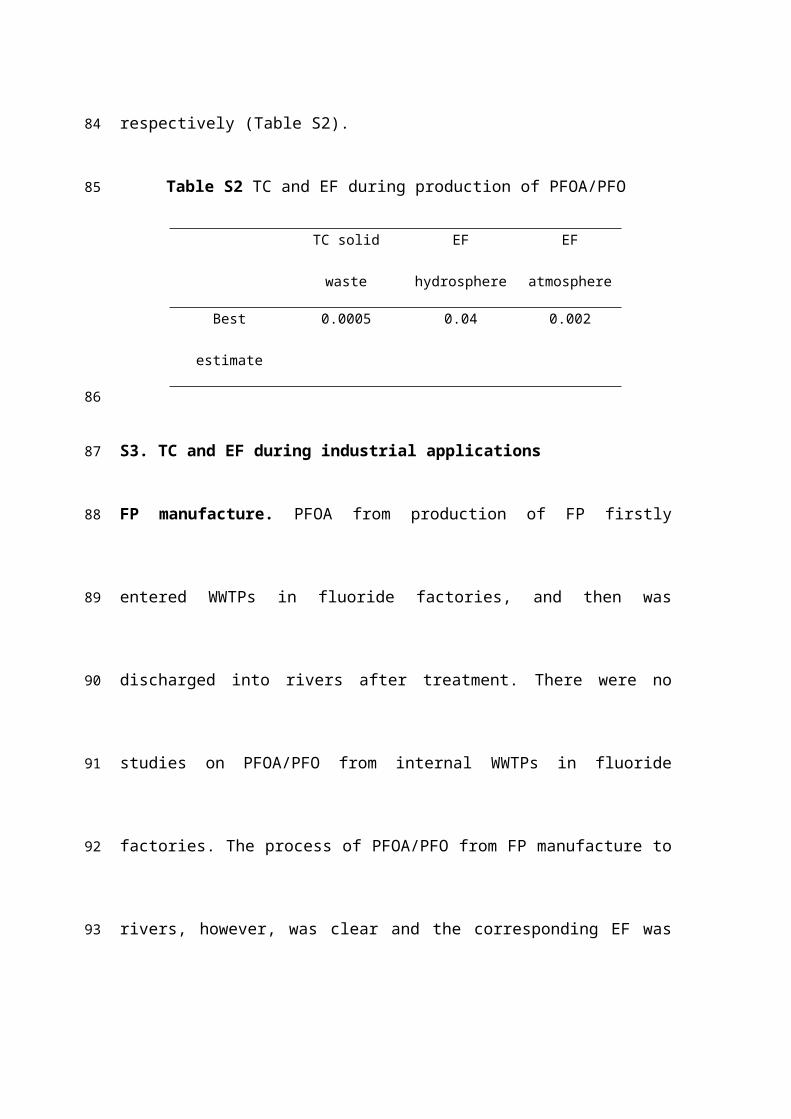
considered. According to a report from 3M Company, a total of 885, 20,412 and 227
kg of PFOA/PFO were released to air, water and solid waste with the production of
498,960 kg PFOA/PFO (3M Company 2000). Assuming that the same production
technique was used, the corresponding emission factor for solid waste and releases to
water, air were 0.0005 and 0.04, 0.002, respectively (Table S2).
Table S2 TC and EF during production of PFOA/PFO
TC solid waste EF hydrosphere EF atmosphere
Best estimate 0.0005 0.04 0.002
S3. TC and EF during industrial applications
FP manufacture. PFOA from production of FP firstly entered WWTPs in fluoride
factories, and then was discharged into rivers after treatment. There were no studies
on PFOA/PFO from internal WWTPs in fluoride factories. The process of PFOA/PFO
from FP manufacture to rivers, however, was clear and the corresponding EF was
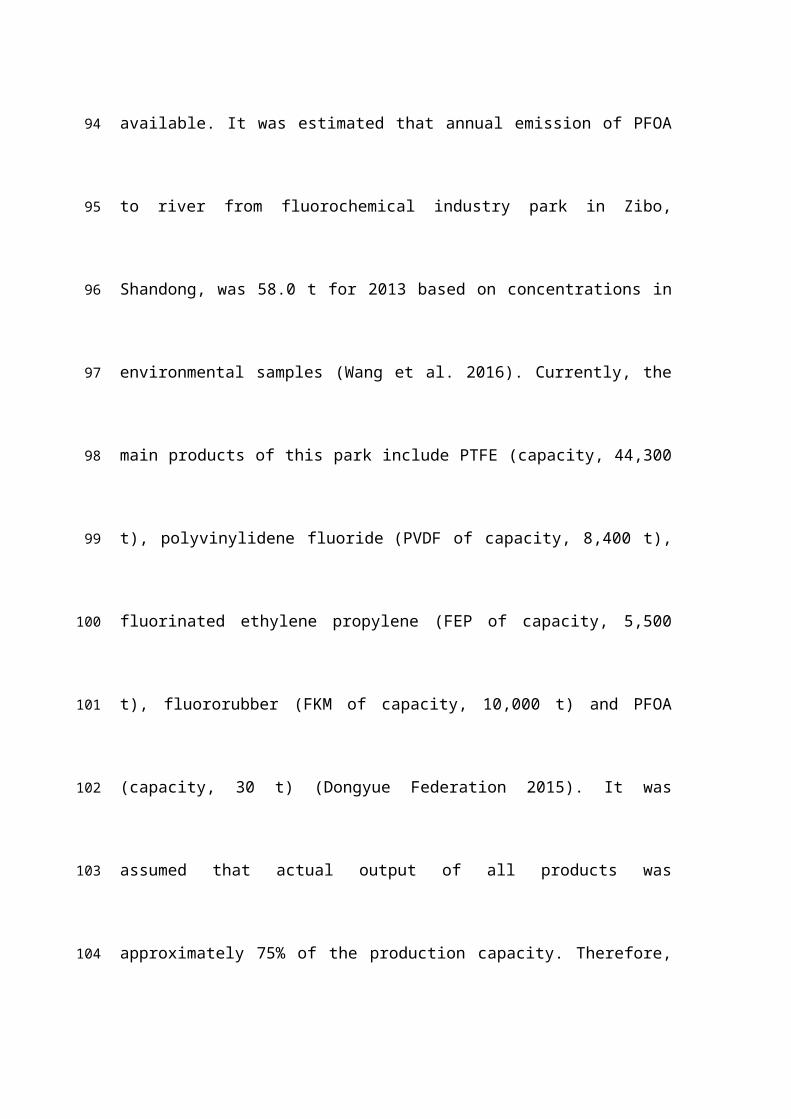
available. It was estimated that annual emission of PFOA to river from fluorochemical
58
59
60
61
62
63
64
65
66
67
68
69
70
71
72
73
74
75
76
77
industry park in Zibo, Shandong, was 58.0 t for 2013 based on concentrations in
environmental samples (Wang et al. 2016). Currently, the main products of this park
include PTFE (capacity, 44,300 t), polyvinylidene fluoride (PVDF of capacity, 8,400
t), fluorinated ethylene propylene (FEP of capacity, 5,500 t), fluororubber (FKM of
capacity, 10,000 t) and PFOA (capacity, 30 t) (Dongyue Federation 2015). It was
assumed that actual output of all products was approximately 75% of the production
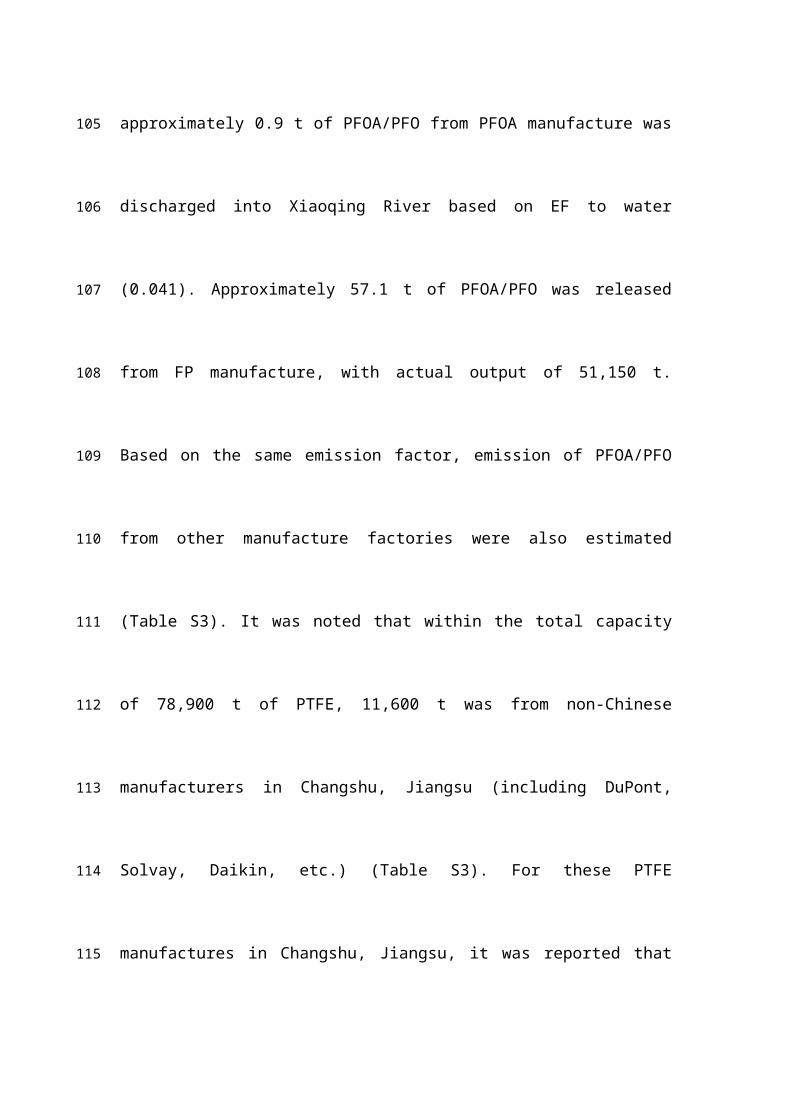
capacity. Therefore, approximately 0.9 t of PFOA/PFO from PFOA manufacture was
discharged into Xiaoqing River based on EF to water (0.041). Approximately 57.1 t of
PFOA/PFO was released from FP manufacture, with actual output of 51,150 t. Based
on the same emission factor, emission of PFOA/PFO from other manufacture
factories were also estimated (Table S3). It was noted that within the total capacity of
78,900 t of PTFE, 11,600 t was from non-Chinese manufacturers in Changshu,
Jiangsu (including DuPont, Solvay, Daikin, etc.) (Table S3). For these PTFE
manufactures in Changshu, Jiangsu, it was reported that concentration of PFOA in
effluents from WWTPs was 3,630 ng/L (Jin et al. 2015). The total emission of
wastewater of Jiangsu Hi-tech Fluorochemical Industrial Park was 2.5×10⁹ L (Jiangsu
Hi-tech Fluorochemical Industry Park 2016), so annual emission of PFOA was 9.0 kg.
It was far lower than those from Dongyue, Shandong, and likely due to the restriction
and requirement of 2010/2015 PFOA Stewardship Program (USEPA 2006). Assuming
the same emission factor to the hydrosphere for PTFE and other FP, it was estimated
that emission of PFOA/PFO from other FP manufacture was 18.0 t.
According to an investigation by the Fluoropolymers Manufacturers Group
78
79
80
81
82
83
84
85
86
87
88
89
90
91
92
93
94
95
96
97
98
99
(FMG), approximately 64% PFOA/PFO were released with wastes, including 14% to
air, 42% to wastewater and 8% to solid waste, while the remaining residues would be
destroyed, re-processed and remained in products (Wang et al. 2014). Volumes
emitted via various routes were similar to those estimated previously (Prevedouros et
al. 2006). Since no technologies to reduce emissions have been applied in China, it
has been estimated that as much as 80% of PFOA-based emulsifiers eventually enter
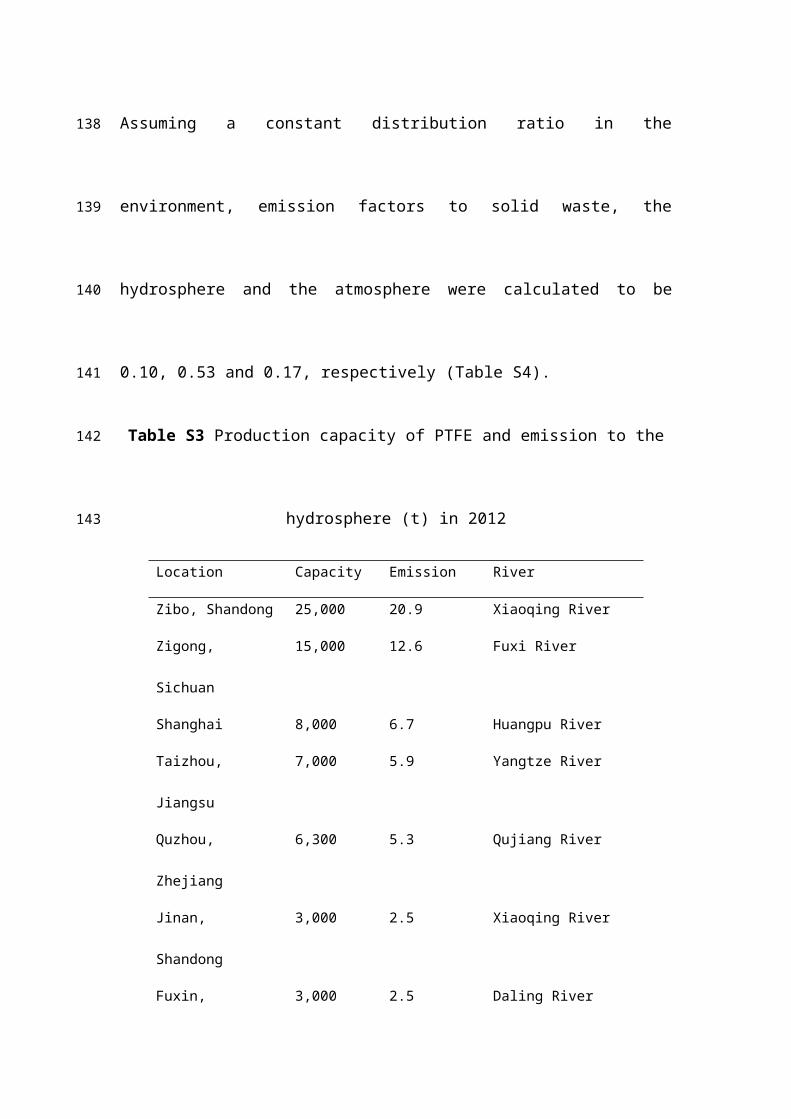
the environment (Wang et al. 2014). Assuming a constant distribution ratio in the
environment, emission factors to solid waste, the hydrosphere and the atmosphere
were calculated to be 0.10, 0.53 and 0.17, respectively (Table S4).
Table S3 Production capacity of PTFE and emission to the hydrosphere (t) in 2012
Location Capacity Emission River
Zibo, Shandong 25,000 20.9 Xiaoqing River
Zigong, Sichuan 15,000 12.6 Fuxi River
Shanghai 8,000 6.7 Huangpu River
Taizhou, Jiangsu 7,000 5.9 Yangtze River
Quzhou, Zhejiang 6,300 5.3 Qujiang River
Jinan, Shandong 3,000 2.5 Xiaoqing River
Fuxin, Liaoning 3,000 2.5 Daling River
Changshu, Jiangsu 11,600 9.0*10-3 Yangtze River
Total 78,900 56.4
Table S4 TC and EF during FP manufacture
TC solid waste EF hydrosphere EF atmosphere
100
101
102
103
104
105
106
107
108
109
110
111

Best estimate 0.10 0.53 0.17
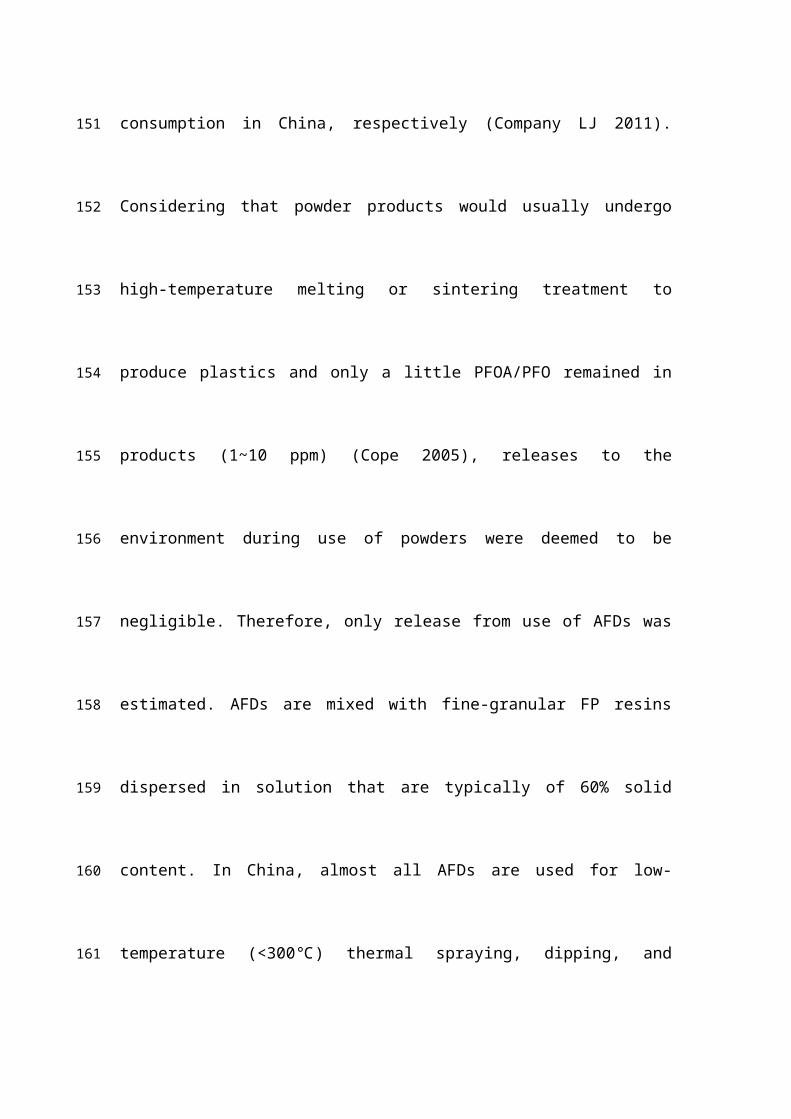
Use of aqueous fluoropolymer dispersions (AFDs). PTFE products are of three
types, namely granular molding powders, paste extrusion powders (fine powders) and
AFDs, which account for 72.8%, 19.7% and 2.0% of overall consumption in China,
respectively (Company LJ 2011). Considering that powder products would usually
undergo high-temperature melting or sintering treatment to produce plastics and only
a little PFOA/PFO remained in products (1~10 ppm) (Cope 2005), releases to the
environment during use of powders were deemed to be negligible. Therefore, only
release from use of AFDs was estimated. AFDs are mixed with fine-granular FP resins
dispersed in solution that are typically of 60% solid content. In China, almost all
AFDs are used for low-temperature (<300℃) thermal spraying, dipping, and
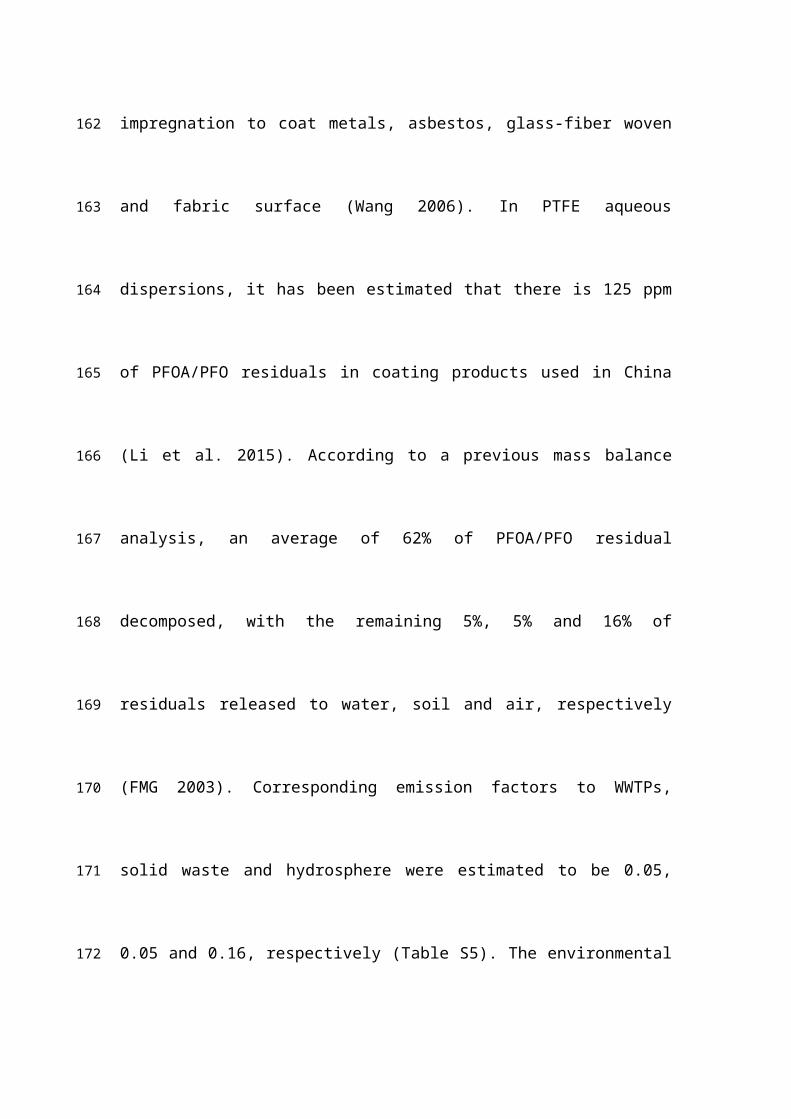
impregnation to coat metals, asbestos, glass-fiber woven and fabric surface (Wang
2006). In PTFE aqueous dispersions, it has been estimated that there is 125 ppm of
PFOA/PFO residuals in coating products used in China (Li et al. 2015). According to
a previous mass balance analysis, an average of 62% of PFOA/PFO residual
decomposed, with the remaining 5%, 5% and 16% of residuals released to water, soil
and air, respectively (FMG 2003). Corresponding emission factors to WWTPs, solid
waste and hydrosphere were estimated to be 0.05, 0.05 and 0.16, respectively (Table
S5). The environmental release from use of AFDs was calculated (Equation S1) (Li et
al. 2015).
Environmental releases = Consumption volume of AFDs × PFOA/PFO content in
112
113
114
115
116
117
118
119
120
121
122
123
124
125
126
127
128
129
130
131
132
commercial AFD products × TC (EF) (S1)
Table S5 TC and EF during use of AFDs
TC WWTPs TC solid waste EF hydrosphere
Best estimate 0.05 0.05 0.16
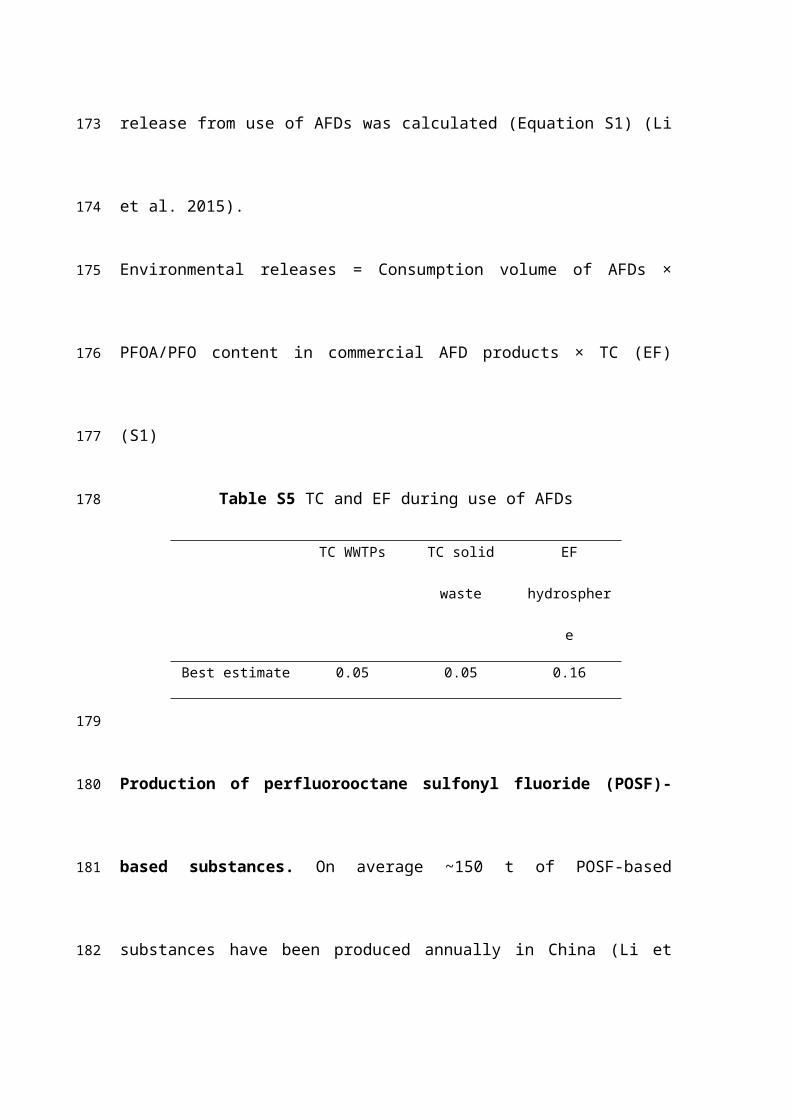
Production of perfluorooctane sulfonyl fluoride (POSF)-based substances. On
average ~150 t of POSF-based substances have been produced annually in China (Li
et al. 2015). The estimated emissions into water and air during production were
0.55~3.5 t and 1.0~1.4 t, while the production of PFOS equivalents was
approximately 220~240 t in China. The same emission factors were applied for direct
sources, namely 0.0024~0.015 to water and 0.0045~0.0060 to air (Xie et al. 2013). In
the LCA, results of which are presented here, emission factors of 0.009 to wastewater
and 0.0053 to the atmosphere were used. It was reported that purity of PFOS products
in Chinese market was only 76.7~80.6%, and PFOA contributed more than 10% to
PFOS products (Jiang et al. 2015). Therefore, it was assumed that the contents of
PFOA in POSF-based substances were about 10%. In terms of indirect sources of
POSF-equivalents released during production of POSF-based substances, excluding
POSF, PFOS and its salts, the emission factors of precursors were set as 1×10⁻⁵ for air
and 0.0003 for water (Wang et al. 2014). Based on assumptions and calculations made
previously (Li et al. 2015), the transformation rate of POSF-based precursors was
0.050~0.268. A value of 0.16 was used.
133
134
135
136
137
138
139
140
141
142
143
144
145
146
147
148
149
150
151
152
Industrial use of POSF-based substances. According to an industrial investigation
by the China Association of Fluorine and Silicone Industry (CAFSI), ~50% of
currently produced POSF-based substances were exported and the remaining 50%
were used in the domestic market, mainly including metal plating, aqueous fire-
fighting foams and sulfluramid (CAFSI 2013). Historically, larger proportions of
POSF-based substances were used in surface treatments for textiles, but this
application ceased after 2009/2010 due to import restrictions applied by other
countries. Because they were found to be few, applications of POSF-based substances
in other sectors, such as semiconductor industry, were not estimated in the present
study.
Ⅰ: ~20% of POSF-based substances were used as mist suppressants during plating
of metals. In this application, active ingredients were mainly PFOS and its salts,
which are not precursors of PFOA/PFO (Mei 2008). Therefore, only direct releases of
PFOA/PFO impurities from the discharge of POSF-based mist suppressants were
estimated. According to estimation on emissions of PFOS from metal plating,
approximately 34 t of PFOS, almost 100% was discharged during 30~40 t PFOS
using for metal plating (Zhang et al. 2012). Metal plating plants are mainly distributed
in east coastal cities, especially in Pearl River Delta and Wenzhou of Zhenjiang
Province. In the developed cities in east China, new or reconstructed metal plating
plants are required to increase the reuse rate of metal plating wastewater to 50%~90%
(Li 2011). However, metal plating wastewater is only treated by using traditional
methods and directly discharged after meeting the standards in most plants. In a few
153
154
155
156
157
158
159
160
161
162
163
164
165
166
167
168
169
170
171
172
173
174
plants, treated wastewater is only used to flush toilet or as landscape water, and finally
gets into sewage system. Based on a conservative estimate, 90% PFOA/PFO in metal
plating sector is discharged into wastewater and 10% into sewage by reuse.
Ⅱ: ~20% of POSF-based substances were used as fluorocarbon foamers during
the production of AFFFs. Active ingredients were mainly non-ionic or amphoteric
fluoroalkylamide derivatives, among which not all components could degrade to
PFOA/PFO (Mei 2008). For simple estimation, direct sources were based on
estimates made previously, where 2% and 0.1% of POSF-based products were
calculated to be released to wastewater and air, respectively (Xie et al. 2013).
Ⅲ: 5% of POSF-based substances were used as raw materials to produce
sulfluramid. The active gradient was n-ethyl perfluorooctane sulfonamide (Et-FOSA),
and its gross loss was no more than 0.1% based on previous investigation (Li et al.
2015). Here, a value of 0.1% loss was assumed to be discharged to wastewater.
Production of fluorotelomer (FT)-based substances. At present, domestic
production of FT-based substances includes two routes, namely de novo production
and secondary processing, among which long-chain perfluroalkyl iodide (PFOI)
(telomer A) as a raw material imported from aboard is applied during secondary
processing. Based on previous assessments and calculations, approximately 600 t of
telomer A were annually imported (Chen 2010), which could be used to produce
approximately 3,000 t of FT-based substances (Prevedouros et al. 2006). According to
an industrial investigation by CAFSI, domestic de novo production of FT-based
175
176
177
178
179
180
181
182
183
184
185
186
187
188
189
190
191
192
193
194
195
196

substances was 1,500 t from two local manufactures (Li et al. 2015). For de novo
production, an emission factor (in tons released FTOH-equivalents per tons of
produced FT-based products) was estimated to be 2.5×10⁻⁵ for air (Wang et al. 2014).
Concentrations of PFOA/PFO in FT-based products ranged from <1 to 100 ppm
(TRP) and 10 ppm was used. Rates of transformation of FT-based precursors to form
indirect sources were calculated to be 0.059%~0.59% (Li et al. 2015). For secondary
processing, the emission factor was set to be half of that of de novo production (Table
S6).
Industrial use of FT-based substances. In China, most FT-based substances were
applied as finishing agents for surface treatment of textiles or leather. Polymeric FT-
based substances are synthesized from FT-based monomers by polymerization, during
which unpolymerized FT-based monomers remain as residuals and PFOA/PFO
impurities appear in the ultimate polymeric FT-based substances. It has been
estimated that contents of precursors and PFOA/PFO impurities were 3.8% and 0.36
ppm in the final polymeric FT-based products, respectively (Danish EPA 2008).
During finishing of textiles or leather, most of the FT-based substances are affixed to
the treated materials after thermal impregnation and drying, and almost 100% of
FTOH residuals and 95% of PFOA/PFO impurities were released to air (Buck et al.
2005). The environmental releases from production and use of POSF/FT-based
substances were calculated (Equation S2) (Li et al. 2015). And the corresponding TC
and EF were listed in Table S6.
197
198
199
200
201
202
203
204
205
206
207
208
209
210
211
212
213
214
215
216
217
218

Environmental releases = Amount of POSF/FT-based substances × [TC
(EF)×PFOA/PFO content + TC (EF) of precursors × (PFOA/PFO content +
transformation rate)] (S2)
Table S6 TC and EF during industrial applications
Direct releases Indirect releases
PFOA/PFO
content
TC
WWTPs
TC
Sewage
EF
atmosphere
TC
WWTPs
EF
atmosphere
Transformation
Rate
Production a 10% 0.009 0.005 0.0003 1.0×10⁻⁵ 0.16
Metal plating 0.9 0.1
AFFFs 0.02 0.001
Sulfluramid 0.001 0.16
Production b 10 ppm 0.0003
Tex.& Lea. c 0.36 ppm 0.95
3.8% d 1.0 0.003
a. production of POSF-based products;
b. production of FT-based products;
c. textiles & Leather;
d. content of precursors.
S4. PFOA/PFO residues in commercial products
FP-based products. It was noted that only a little PFOA/PFO, 1~10 ppm, remained
in plastics after high-temperature treatment (Cope 2005). However, considering that
PFOA/PFO used in plastics (98%) were huge compared to those used as AFDs, there
was approximately 0.3 tons of PFOA/PFO remaining in plastics, which might be
219
220
221
222
223
224
225
226
227
228
229
230
231
232
discharged during use and treatment of plastics. For PFOA/PFO in coatings,
approximately 12% PFOA/PFO entered into final products (FMG 2003), namely 0.03
t of PFOA/PFO remaining in coatings.
POSF-based products. In metal plating, almost all PFOA/PFO was discharged into
environment during treatment, so the contents of PFOA/PAO in final electroplating
products were negligible. During production of AFFFs, approximately 2% of
PFOA/PFO were discharged (Xie et al. 2013), so it was estimated that 98% (2.9 t)
existed in products without considering degradation of precursors. Similar with that
for AFFFs, almost all PFOA/PFO (0.8 t) entered into final sulfluramid due to minimal
losses during production (Li et al. 2015).
FT-based products. During finishing of textiles and leather, it was estimated that
95% PFOA/PFO and 100% FTOHs were discharged to the atmosphere (Buck et al.
2005). Therefore, only 5% of PFOA/PFO (8.1×10⁻⁵ t) remained in final textiles and
leather.
S5. TC and EF during service life of products
Plastics. Plastics were mostly used in electric appliance, chemical industry, aviation
and machinery. Because of FP stability, including anti acid, alkali, organic solvent,
high temperature resistance, and friction resistance, it was assumed that loss of
PFOA/PFO during use of such plastics was negligible.
Coating. Although only a small fraction of PFOA/PFO in AFDs enter into coated
products, PFOA/PFO is still released to the atmosphere during use of coated products.
233
234
235
236
237
238
239
240
241
242
243
244
245
246
247
248
249
250
251
252
253
254

One study reported that mass of PFOA in nonstick coating was 59 to 1237 pg/cm , with a release of 11-503 pg/cm2 during an experiment carried at 250℃ for 20 min
(Sinclair et al. 2007). And it also showed that release of PFOA decreased with
multiple uses. Another study investigated release of PFOA from different nonstick
cookware. The results showed that releases varied greatly, and those from pans were
relatively higher and those from waffle irons were relatively lower (Schlummer et al.
2015). This may be caused by different residual PFOA in cookware or different
operation temperature. However, there were no related information on residual PFOA
in eliminated coating products. Considering different types of cookware and reduced
release during constant use, an emission factor to atmosphere of 0.7 was used during
service life (Table S7).
Table S7 TC and EF during service life of coating products
TC product EF atmosphere
Best estimate 0.3 0.7
AFFF. Considering actual situation in China, residual liquid was not treated and all
released into environment after use of fire-fighting extinguishers. Based on the
assumption of the Environment Agency that there is no containment of foams applied
to fight fires, 50% is estimated to go into the hydrosphere and 50% into soil (Brooke
et al. 2004). According to investigation by Fire Department of Ministry of Public
Security of China, cumulative production of AFFFs was 24,224 t and inventory was
18,259 t from 2001 to 2008 (Yu et al. 2010). Therefore, usage of AFFFs during this
255
256
257
258
259
260
261
262
263
264
265
266
267
268
269
270
271
272
273
274
period was 5,965 t. The fraction of the AFFF stock annually used by fire-fighting
services is 24.6%.
Table S8 TC and EF during service life of AFFF
EF hydrosphere EF soil
Best estimate 0.5 0.5
Sulfluramid. It was known that sulfluramid was mainly used to control termites and
other crawling insects (Goosey and Harrad 2011). According to average validity in
China, approximately 35% pesticide acted on crops and most (65%) flowed into soil
(Table S9), when pesticide was used on agriculture (MOA 2015).
Table S9 TC and EF during service life of sulfluramid
EF soil
Best estimate 0.65
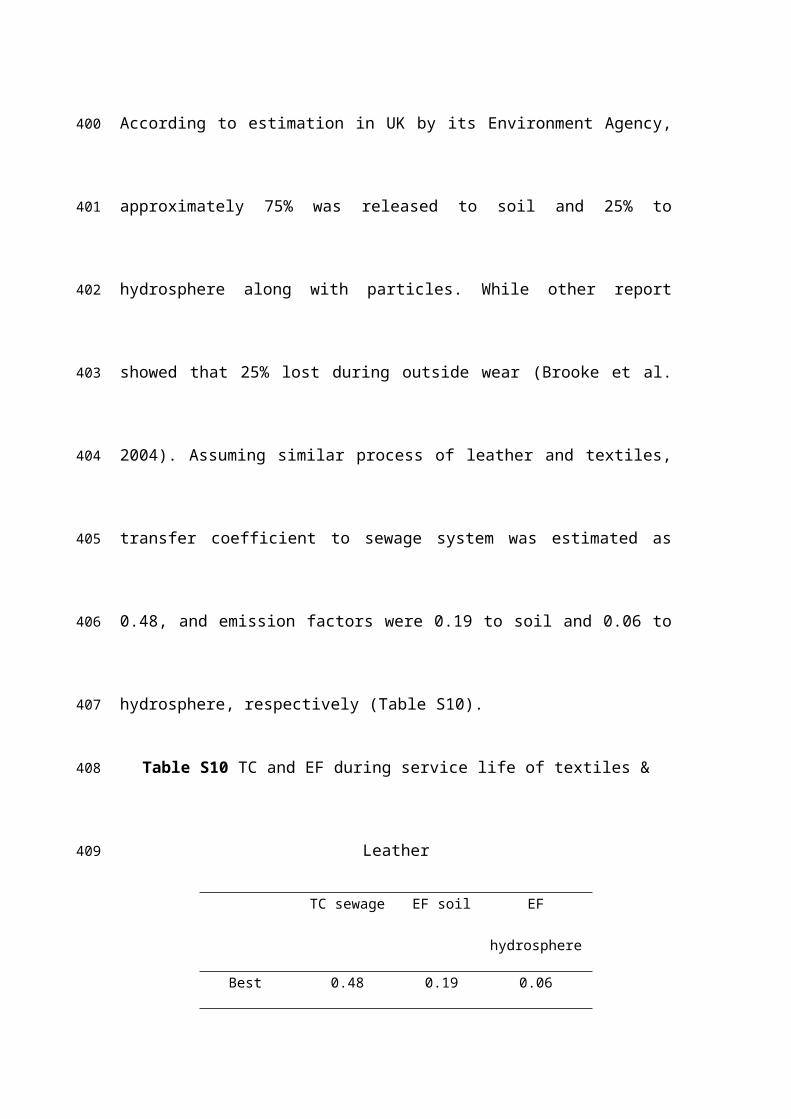
Textiles & Leather. Based on the results of an investigation by 3M Company, it was
concluded that cleaning garments with over a 2 year life span is expected to lose 73%
of surface treatments containing PFOA related substances (UNEP 2006). Loss from
textiles and leather mainly included two processes, namely washing and wear outside,
which induced emission of PFOA/PFO into sewage system and environment. If it was
wore or used outside, PFOA/PFO was mainly released with particles. According to
estimation in UK by its Environment Agency, approximately 75% was released to soil
and 25% to hydrosphere along with particles. While other report showed that 25% lost
during outside wear (Brooke et al. 2004). Assuming similar process of leather and
275
276
277
278
279
280
281
282
283
284
285
286
287
288
289
290
291
292
293
textiles, transfer coefficient to sewage system was estimated as 0.48, and emission
factors were 0.19 to soil and 0.06 to hydrosphere, respectively (Table S10).
Table S10 TC and EF during service life of textiles & Leather
TC sewage EF soil EF hydrosphere
Best estimate 0.48 0.19 0.06
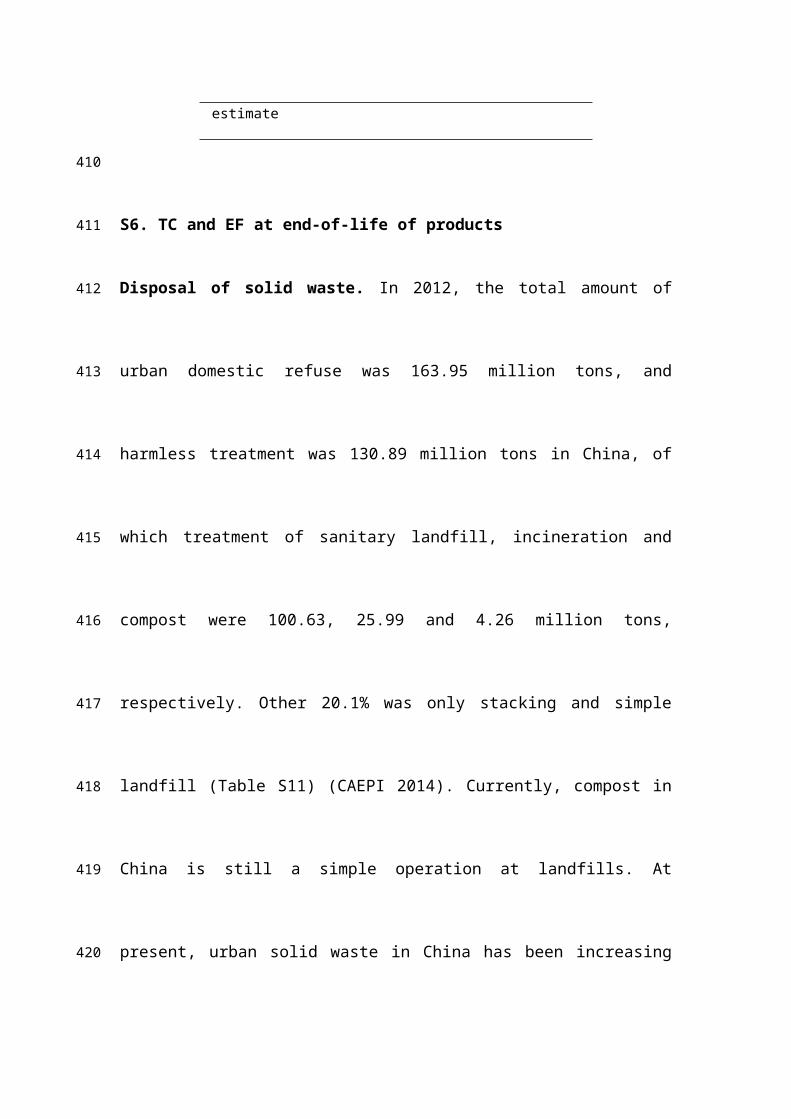
S6. TC and EF at end-of-life of products
Disposal of solid waste. In 2012, the total amount of urban domestic refuse was
163.95 million tons, and harmless treatment was 130.89 million tons in China, of
which treatment of sanitary landfill, incineration and compost were 100.63, 25.99 and
4.26 million tons, respectively. Other 20.1% was only stacking and simple landfill
(Table S11) (CAEPI 2014). Currently, compost in China is still a simple operation at
landfills. At present, urban solid waste in China has been increasing at an annual rate
of 10%, and production per capita is approximately 450~500 kg (Zhang et al. 2011).
Table S11 Disposal routes of solid waste
Incineration Landfill Stacking
Proportion 15.9% 64.0% 20.1%
Plastics. Due to negligible loss of PFOA/PFO during service life of plastics, it was
assumed that all PFOA/PFO remained and entered into end-of-life. It was reported
that a total amount of used plastics reached 200 million tons in 2011 and rate of
recovery was below 10%, among which most were plastic box and packaging (Tang et
al. 2013). Therefore, it was considered that such used plastics containing PFOA/PFO
294
295
296
297
298
299
300
301
302
303
304
305
306
307
308
309
310
311
312
were treated as solid waste (Table S11).
Coatings. According to the Annual Report on Comprehensive Utilization of
Resources (NDRC 2012), the amount of recycled copper, lead and aluminum
accounted for 50%, 23% and 42% of each total yield, respectively. Considering that
cookware were mainly recycled as metals, a total utilization ratio of 30% was used
(Table S12). It was considered that high temperature treatment was operated during
reuse. So most PFOA would degrade and a small portion was released to the
atmosphere, where the emission factor was determined as same as those in
incineration. The remaining 70% metals would be treated as solid waste.
Table S12 TC and EF at end-of-life of coating products
TC solid waste EF atmosphere
Best estimate 0.7 0.00003
AFFF. In addition to release during actual fighting of fires, PFOA/PFO is discharged
due to disposal of expired AFFF. For example, in the Netherlands, expired foam from
mobile AFFF (~ 5 year life span) tends to be dumped directly into sewers (Armitage
et al. 2009). It was assumed that AFFF in petrochemical enterprises, gasoline stations,
fire training bases and military bases were all in validity and expired AFFF would be
disposed on schedule. It was calculated that approximately 75.4% of AFFFs were
need to treated and this part would all be discharged into sewers (Table S13).
Table S13 TC and EF at end-of-life of AFFF
313
314
315
316
317
318
319
320
321
322
323
324
325
326
327
328
329
330
331
332
EF sewage
Best estimate 1.0
Textiles & leather. Generation and discharge of solid waste by the textile industry
were 6.9 and 1.1 million tons. In 2011, the total volume of waste textiles was
approximately 26 million tons, of which only 2.3 million tons of waste textile was
recycled (NDRC 2012). Other waste textiles were disposed of as municipal solid
waste. At present, domestic recycling of waste textiles is based on recovery from
small traders or donations, centralized recovery in the residential area, recovery at big
sites and reuse. After simple physical treatment, waste textiles are mainly used to
produce fiberfill, felt, mops and similar products. All of these at end-of-life products
are then treated as solid wastes no matter for recycled or non-recycled textiles (Table
S11).
S7. TC and EF in sewage system
Two types of losses from sewer system are possible, namely sewer overflows
and exfiltration. The former is caused by strong or long-lasting precipitation events,
and the latter refers to loss from leaking pipes. Currently, most cities don’t achieve
rainwater and sewerage diversion. Once storms occur, rainfall exceeds the capacity of
sewage system, which finally leads to untreated sewage into hydrosphere. Combined
the occurrence time of rainstorm and volume of sewage overflow, 1% load is assumed
for sewer overflows (FOEN 2009).
333
334
335
336
337
338
339
340
341
342
343
344
345
346
347
348
349
350
351
352
Most sewage pipelines were conducted in the 1960s or 1970s. Until 2010, the
total length of sewage pipelines was 370,000 km in China. Most pipelines are made of
concrete, which can result in exfiltration of sewage into groundwater once crack.
According to the standards for allowing exfiltration, 48 m3/d/km is made of D800 mm
reinforced concrete pipe (Wang and Yu 2003). Based on an assumption that all sewer
pipelines are D800 mm reinforced concrete pipe, 17.8 million m3 sewage is predicted
to be released underground every day. In 2010, total discharge of sewage was 61.7
billion tons in China (MEP 2010). While the exact density of sewage varies and is
unknown, using the density of pure water, exfiltration accounts for approximately
10.5% of total sewage. According to the worst-case scenario, it was assumed that 85%
of PFOA/PFO entered WWTPs and 15% was directly into hydrosphere (Table S14).
Table S14 TC and EF in sewage system
TC WWTPs EF hydrosphere
Best estimate 0.85 0.15
S8. TC and EF in wastewater treatment plants (WWTPs)
In China, the total volume of wastewater discharged in 2012 was 68.5 billion tons,
including 22.2 billion tons of industrial wastewater and 46.3 billion tons of household
wastewater (NBS 2013). WWTPs are unable to reduce concentrations of PFOA/PFO
in effluent significantly compared to concentrations in influent. In several studies,
even an increase in concentrations or mass flows from the influent to the effluent has
been found and attributed to degradation of precursor substances (Table S15). Data
353
354
355
356
357
358
359
360
361
362
363
364
365
366
367
368
369
370
371
372

from different WWTPs, however, vary significantly.373
Table S15 Concentrations and flows of PFOA in WWTPs in China
Site Capacity Type Technology Influent Effluent Sludge References
Concentration 104 m3/d ng/L ng/L ng/g
Beijing 1 100 D CAS 9.2 13.6 (Pan et al. 2011a)
Beijing 2 20 D OD 2.7 10.7
Beijing 3 40 D A2O 36.0 19.0
Beijing 4 10 D MBR 1.1 1.4
Beijing 5 8 D SBR 0.9 0.9
Beijing 6 60 D A2O 12.0 12.5
Beijing 7 4 D CO 0.09 0.3
Beijing 1 100 D CAS 3.6 n.d. (Zhang et al. 2013)
Beijing 2 10 D MBR 4.3 n.d.
Beijing 3 4 D CO 1.5 2.6
Beijing 4 20 D OD 5.3 8.5
374

Beijing 5 40 D A2O 2.9 3.9
Beijing 6 8 D SBR 4.6 6.3
Beijing 7 90 D A2O 6.7 6.4
Bengbu 1 10 D A2O+OD 3.3 5.1
Hefei 1 30 D OD 45.7 34.4
Hefei 2 10 D OD 3.1 6
Hefei 3 18 D OD 4.4 5.5
Guangzhou 1 64 D Modified A2O 13.8 7.3
Guangzhou 2 20 D Modified A2O 9.6 14.7
Guangzhou 3 15 D A2O 15.3 15.3
Foshan 1 20 D A2O 8.6 9.5
Wuhan 1 15 D Modified A2O 6.2 6.4
Wuhan 2 15 D A2O 6.9 6.1
Dalian 1 8 D LINPOR 8.9 15.5

Dalian 2 7 D A2O 5.3 5.6
Shanghai 1 8 D CAS 7.9 34.1
Shanghai 2 6 D PASF 90.6 106.6
Shanghai 3 1.7 Both CAS 58.2 67.8
Ningbo 1 16 D A2O 10.9 10.2
Ningbo 2 6 D OD 12.2 15.3
Nanjing 1 64 Both A/O 5.6 13.5
Nanjing 2 30 D CAS 7 8.4
Wuxi 1 30 D MBBR 15.3 23.6
Wuxi 2 15 D Modified A2O 10.1 26.1
Shenyang 1 38 70% D/30% I BAF 34.5 28.0 (Sun et al. 2011)
Shenyang 2 20 D SCAS 71.1 41.1
Shenyang 3 40 60% D/40% I CAS+A/O 26.6 32.5
Shenyang 4 2 D CW+FBB 26.2 18.4

Taian 1 5×10⁴ t/d D AGC+A2O 2.47 0.87 (Wang et al. 2011)
Taian 2 8×10⁴ t/d Main I OD 3.30 2.24
Beijing 1 D A2O+MBR 6.6 6.8 (Fan 2010)
Beijing 2 D A2O 49.6 26.4
Beijing 3 D OD 94.3 16.4
Mass flow (g/d) Dalian 1 6 D CAS 1.0 0.6 n.d. (Chen et al. 2012)
Dalian 2 12 D BF 1.2 1.2 0.02
Dalian 3 8 D CAS+BF 3.5 0.3 n.d.
Dalian 4 1 30% D/70% I A2O 188 100 0.23
Shanghai 1 7.5 D CAS 6.2 6.2 0.12
Shanghai 2 200 D A2O 224 1,062 1.9
Shanghai 3 170 D CF 325 202 1.0
Shanghai 4 9.5 30% D/70% I A2O 6,288 15,657 4.0
Guangzhou 1 11 D A2O 1.0 1.0 0.04
Guangzhou 2 3 D CAS 0.9 0.5 0.01
Guangzhou 3 20 D A2O 0.8 1.3 0.05
Guangzhou 4 30 D A2O 0.8 0.8 0.09
D: Domestic wastewater; I: Industrial wastewater; CAS: Conventional activated sludge process; BF: Biofilm process; A2O: Anaerobic/anoxic/oxic process; CF:
Chemical flocculation; MBR: Membrane bio-reactor; OD: Oxidation ditch; PASF: Removing phosphorus and nitrogen combined activated sludge and filter
technology; SBR: Sequencing batch reactor; MBBR: Moving bed biofilm react; CO: Contacting-oxidation; SCAS: Suspended carrier activated sewage; AGC:
Aerated grit chambers; BAF: Biological aerated filter; CW+FBB: Constructed wetland+ Floating bio- bed.
Statistical result: For EF, 56 values were contained. The mean and median values were 1.28 and 1.03, respectively. A best estimated emission factor of 1.2 was used
for the model. For TC, 12 values were contained. The mean and median values were 0.02 and 0.01, respectively.
375
376
377
378
379
380
Mean and median values of EF were 1.28 and 1.03, respectively. A best estimate
emission factor to the hydrosphere of 1.2 was used in the model. The mean value for
calculation of transfer coefficient to sewage sludge was 0.02. Due to limited data,
which was taken from a single study, there is uncertainty in this transfer coefficient.
Disposal of sewage sludge. Due to political and economic incentives, application in
agricultural land and garden land (48.3%), used as fertilizer is still the main method of
disposal, followed by landfill (34.5%) (Wang 2009). For this reason, PFOA/PFO
would be expected to be transported from sludge to soil. Compared with massive
incineration in other countries, in China the proportion of incineration was only 3.5%.
The remaining 13.8% was untreated, which was assumed to remain at stacking sites
(Table S16). Transfer coefficients to soil, incineration and landfill were calculated by
multiplying the transfer coefficient to sewage sludge by the disposal ratio of sludge
(Table S17).
Table S16 Disposal routes of sewage sludge
Incineration Landfill Stacking Soil
Proportion 3.5% 34.5% 13.8% 48.3%
Table S17 TC and EF in WWTPs
TC incineration TC landfill TC stacking EF hydrosphere EF soil
Best estimate 0.0007 0.007 0.003 1.2 0.01
S9. TC and EF in incineration plants
381
382
383
384
385
386
387
388
389
390
391
392
393
394
395
396
397
398
399
PFOA/PFO could not be detected after incineration of solid waste, such as paper,
textile and carpet. These results were interpreted due to effective removal or
destruction of PFOA/PFO during incineration (Taylor et al. 2014). The actual
temperature in China could reach 850℃, so PFOA/PFO could be effectively removed
(Zhang 2015). The atmospheric emission factor and transfer coefficient to landfill
were 0.0001 and 0.005, respectively (FOEN 2009), which was derived as the half of
maximum EFs and TCs in simulation experiment on laboratory scale or actual
monitoring in incineration plants (Table S18).
Table S18 TC and EF in incineration plants
TC landfill EF atmosphere
Best estimate 0.005 0.0001
S10. TC and EF in landfills
Atmospheric emission. It was reported that the annual emission of polychlorinated
biphenyls (PCBs) to atmosphere was 95 kg when the total storage was 170,685 t in
sludge (Yi et al. 2008). Therefore, the EF was 5.6×10⁻⁷, and this value was also used
in estimation of PFOA/PFO because of similar properties.
Landfill leachates. Landfills are classified as three types, including simple landfill,
controlled landfill and sanitary landfill. Simple landfills refer to those without any
environmental protection measures. Controlled landfills refer to those which could not
fully meet the environmental standards. Sanitary landfills have complete engineering
measures and could fully comply with the standards. The proportions of three types of
400
401
402
403
404
405
406
407
408
409
410
411
412
413
414
415
416
417
418
419
landfills were 50%, 30% and 20%, respectively (Baidu 2015).
It was assumed that PFOA/PFO in landfill sites would eventually enter into
leachate and air. The maximum percentage of landfill leachates collected and
introduced to sewage system reaches 90% for sanitary landfill (E20 Platform 2015).
Considering complex composition in leachate and different treatment technologies,
the overall percentage collected to sewage was estimated to be 70% (Table S19).
Table S19 TC and EF in landfills
TC sewage EF atmosphere EF hydrosphere
Best estimate 0.7 5.6×10⁻⁷ 0.3
S11. TC and EF in stacking sites
Leachate also emerges from stacking sites compared with that in landfill plants. The
difference is that the leachate can’t be effectively collected and then it is released into
the sewage system. It is assumed that 70% leachate in stacking sites enters soils,
which is considered similar to that part flowing into sewerage system in landfill
plants. The remaining 30% is assumed to enter into hydrosphere with runoff (Table
S20).
Table S20 TC and EF in stacking sites
EF soil EF atmosphere EF hydrosphere
Best estimate 0.7 5.6×10⁻⁷ 0.3
420
421
422
423
424
425
426
427
428
429
430
431
432
433
434
435

Table S21 Detection of PFOA and PFOS in environmental media in China
Media Location Sampling time PFOA PFOS Reference
Water (ng/L) Daling River 2009 27.2-668 (169.0) 0.28-0.54 (0.4) Bao et al. 2011
Liaohe River 2009 n.d.a-27.9 (10.9) n.d.-6.6 (0.3) Yang et al. 2011
Hanjiang River 2010 n.d.-256 (81.0) n.d.-88.9 (51.8) Wang et al. 2013
Yangtze River 2003 0.2-297.5 (16.2) 0.2-37.8 (6.7) Jin et al. 2009
Huaihe River 2011 6.2-47 (18.0) 1.4-25 (4.7) Yu et al. 2013
Taihu Lake 2009 10.6-36.7 (21.7) 3.6-394 (26.5) Yang et al. 2011
Tangxun Lake --b 70.5-1390 (372) 73.4-1650 (357) Zhou et al. 2013
East Lake 2009 15.8-158 (55.0) 9.1-132 (60.4) Chen et al. 2012
Soil (ng/g) Haihe Watershed 2008 n.d.-0.51 (0.2) 0.02-2.36 (0.2) Pan et al. 2011
Tianjin Binhai New Area 2008 n.d.-0.93 (0.2) n.d.-9.4 (1.8) Wang et al. 2012
Coastal area of Bohai Sea -- n.d.-13.3 (0.5) n.d.-9.4 (0.1) Meng et al. 2015
Shanghai 2007 3.3-47.5 (35.3) 8.6-10.4 (9.5) Li et al. 2010
436
Air (pg/m3) Shenzhen 2011 1.5-15 (5.4) n.d.-4.3 (3.1) Liu et al. 2015
Concentrations of PFOA and PFOS were presented with range of min. to max., and mean concentration was presented in brackets;
a: not detected;
b: not available.
437
438
439
440

Fig. S1 Flows of PFOA/PFO (t) during production and use by industries
Fig. S2 Flows of PFOA/PFO (t) in domestic use
441
442
443
444
445
446

Fig. S3 Flows of PFOA/PFO (t) in waste management
447
448
449

References
3M Company (2000) Voluntary use and exposure information profile:
perfluorooctanic acid and salts (US EPA Report AR 226-0295). US EPA,
Washington, DC
Armitage JM, Schenker U, Scheringer M, Martin JW, MacLeod M, Cousins IT (2009)
Modeling the Global Fate and Transport of Perfluorooctane Sulfonate (PFOS)
and Precursor Compounds in Relation to Temporal Trends in Wildlife Exposure.
Environmental Science & Technology 43:9274-9280
Baidu (2015) Landfill (in Chinese). http://baike.baidu.com/link?
url=Xo6rVh0CU5EnkChIiJ71CgDJC74v1EwZ93DSWxNs6V-
eFnlTQTBaDcrhy3ID9gSloceLk0cktHGOMU_w07UDKq
Bao J, Liu W, Liu L, Jin YH, Dai JY, Ran XR, Zhang ZX, Tsuda S (2011)
Perfluorinated Compounds in the Environment and the Blood of Residents
Living near Fluorochemical Plants in Fuxin, China. Environmental Science &
Technology 45:8075-8080
Brooke D, Footitt A, Nwaogu TA (2004) Environmental risk evaluation report:
Perfluorooctanesulphonate (PFOS).
http://www.pops.int/documents/meetings/poprc/submissions/Comments_2006/
sia/pfos.uk.risk.eval.report.2004.pdf, Wallingford, UK
Buck RC, Kaiser MA, Knaup W, Bose W, Schafer T, Thoma B (2005) Determining
the fate of fluorotelomer alcohol and PFOA in textile finishing process.
International symposium on fluorinated alkyl organics in the environment.
450
451
452
453
454
455
456
457
458
459
460
461
462
463
464
465
466
467
468
469
470
471

Chen H (2010) Competitive strength and market analysis of electronic chemicals and
special gas containing fluorine. Chemical production and technology 17:1-8 (in
Chinese)
Chen H, Zhang C, Han JB, Yu YX, Zhang P (2012) PFOS and PFOA in influents,
effluents, and biosolids of Chinese wastewater treatment plants and effluent-
receiving marine environments. Environmental Pollution 170: 26-31
Chen J, Wang LL, Zhu HD, Wang BB, Liu HC, Cao MH, Miao Z, Hu L, Lu XH, Liu
GH (2012) Spatial distribution of perfluorooctanoic acids and perfluorinate
sulphonates in surface water of East Lake. Environmental Science 33:2586-2591
(in Chinese)
China Association of Environmental Protection Industry (CAEPI) (2014)
Development Report on Chinese Treatment Industry of Urban Domestic Refuse
in 2013. China Environmental Protection Industry 12:17-24 (in Chinese)
China Association of Fluorine and Silicone Industry (CAFSI) (2011) National 12th
Five-year Plan for Fluorine Chemical Industry (in Chinese).
http://wenku.baidu.com/link?url=B5oOahlxcvirTPm-
UrVQDvQBCr4XjEvJRR6rUBnWKtC7gU_2_F9UBZvt7Ry9PbsNksex14D6dM
K3Avawu1kfl2xFrGs_jcMjHiZvkBe9A6C
ChinaIOL (2012) Report on PTFE Operation (in Chinese).
http://wenku.baidu.com/link?
url=_ndCWJKQSeNoeSUFmxkJ1b89o5I6y13IqCzPjRoC-
Jzv_DLPCt8oFH2hkImMEBhRbwlRumG9FuPi9l5s6a3_UilkbxgLmh-
472
473
474
475
476
477
478
479
480
481
482
483
484
485
486
487
488
489
490
491
492
493

M5AFBcp0KRDC
Company LJ (2011) Technoic and Market Research Report of PTFE (in Chinese).
http://www.docin.com/p-324396085.html
Cope CS (2005) Measurement of residual C-8 fluorosurfactant levels on various
products (226-2533) vol US EPA Administration Record 226.
Danish Environmental Protection Agency (Danish EPA) (2008) Survey and
environmental/health assessment of fluorinated substances in impregnated
consumer products and impregnating agents.
http://www2.mst.dk/common/Udgivramme/Frame.asp?http://www2.mst.dk/
udgiv/publications/2008/978-87-7052-845-0/html/helepubl_eng.htm
Dongyue Federation (2015) Publicity of Environmental Information (in Chinese).
http://www.dongyuechem.com/NewsDetail.aspx?
ID=1263&CategoryID=248&Category=News
E20 Environment Platform (2015) Analysis of landfill leachate treatment (in
Chinese). http://www.h2o-china.com/news/232242.html
Fan Q (2010) Occurrence of typical perfluorinated compounds in municipal
wastewater treatment plants and removal by coagulation. Dissertation, Tsinghua
University (in Chinese)
Federal Office for the Environment (FOEN) (2009) Substance flow analysis of PFOS
and PFOA for Switzerland. Bern
Fluoropolymer Manufactures Group (FMG) (2003) Final Report of Dispersion
Processor Material Balance Project (US EPA OPPT 2003-0012-0900, 0901,
494
495
496
497
498
499
500
501
502
503
504
505
506
507
508
509
510
511
512
513
514
515

0902, 0903, 0904). Washington, DC
Goosey E, Harrad S (2011) Perfluoroalkyl compounds in dust from Asian, Australian,
European, and North American homes and UK cars, classrooms, and offices.
Environment International 37:86-92
Jiangsu Hi-tech Fluorochemical Industry Park (2016) Publicity of Environmental
Information on WWTPs (in Chinese).
http://www.amip.org.cn/news_detail/newsId=244.html
Jiang WW, Zhang YF, Yang LP, Chu XL, Zhu L (2015) Perfluoroalkyl acids (PFAAs)
with isomer analysis in the commercial PFOS and PFOA products in China.
Chemosphere 127:180-187
Jin HB, Zhang YF, Zhu LY, Martin JW (2015) Isomer Profiles of Perfluoroalkyl
Substances in Water and Soil Surrounding a Chinese Fluorochemical
Manufacturing Park. Environmental Science & Technology 49:4946-4954
Jin YH, Liu W, Sato I, Nakayama SF, Sasaki K, Saito N, Tsuda S (2009) PFOS and
PFOA in environmental and tap water in China. Chemosphere 77:605-611
Li F, Wu Y, Hu RN (2011) Electroplating wastewater treatment and reuse in our
country. Plating and Finishing 33:17-20 (in Chinese)
Li F, Zhang C, Qu Y, Chen J, Chen L, Liu Y, Zhou Q (2010) Quantitative
characterization of short- and long-chain perfluorinated acids in solid matrices in
Shanghai, China. Science of the Total Environment 408:617-623
Li L, Zhai Z, Liu J, Hu J (2015) Estimating industrial and domestic environmental
releases of perfluorooctanoic acid and its salts in China from 2004 to 2012.
516
517
518
519
520
521
522
523
524
525
526
527
528
529
530
531
532
533
534
535
536
537

Chemosphere 129:100-109
Liu BL, Zhang H, Yao D, Li JY, Xie LW, Wang XX, Wang YP, Liu GQ, Yang B
(2015) Perfluorinated compounds (PFCs) in the atmosphere of Shenzhen, China:
Spatial distribution, sources and health risk assessment. Chemosphere 138:511-
518
Mei SF (2008) Production, uses and status of international and domestic standards for
PFOS/PFOA in China. Organo-Fluorine Industry 1:21-25 (in Chinese)
Meng J, Wang T, Wang P, Zhang Y, Li Q, Lu Y, Giesy JP (2015) Are levels of
perfluoroalkyl substances in soil related to urbanization in rapidly developing
coastal areas in North China? Environmental Pollution 199:102-109
Ministry of Agriculture of China (MOA) (2015) Changing mode and adjusting
structure to promote grain production (in Chinese).
http://www.gov.cn/xinwen/2015-12/21/content_5026348.htm
Ministry of Environmental Protection of China (MEP) (2010) National Environmental
Statistical Bulletin (in Chinese).
http://zls.mep.gov.cn/hjtj/qghjtjgb/201201/t20120118_222703.htm
National Bureau of Statistics of China (NBS) (2013) China Statistical Yearbook 2013.
Beijing (in Chinese)
National Development and Reform Commission of China (NDRC) (2012) Annual
Report on Comprehensive Utilization of Resources (in Chinese).
http://www.gov.cn/gzdt/2013-04/08/content_2372577.htm
Pan Y, Shi Y, Wang J, Cai Y (2011a) Evaluation of perfluorinated compounds in seven
538
539
540
541
542
543
544
545
546
547
548
549
550
551
552
553
554
555
556
557
558
559
wastewater treatment plants in Beijing urban areas. Science China Chemistry
54(3): 552-558
Pan Y, Shi Y, Wang J, Jin X, Cai Y (2011b) Pilot Investigation of Perfluorinated
Compounds in River Water, Sediment, Soil and Fish in Tianjin, China. Bulletin
of Environmental Contamination and Toxicology 87:152-157
Prevedouros K, Cousins IT, Buck RC, Korzeniowski SH (2006) Sources, fate and
transport of perfluorocarboxylates. Environmental Science & Technology 40:32-
44
Schlummer M, Solch C, Meisel T, Still M, Gruber L, Wolz G (2015) Emission of
perfluoroalkyl carboxylic acids (PFCA) from heated surfaces made of
polytetrafluoroethylene (PTFE) applied in food contact materials and consumer
products. Chemosphere 129:46-53
Sinclair E, Kim SK, Akinleye HB, Kannan K (2007) Quantitation of gas-phase
perfluoroalkyl surfactants and fluorotelomer alcohols released from nonstick
cookware and microwave popcorn bags. Environmental Science & Technology
41:1180-1185
Sun HW, Li FS, Zhang T, Zhang XZ, He N, Song Q, Zhao LJ, Sun LN, Sun TH
(2011) Perfluorinated compounds in surface waters and WWTPs in Shenyang,
China: Mass flows and source analysis. Water Research 45: 4483-4490
Tang GL, Hu B, Kang ZL, Meng CC, Zhang XY, Zhang LQ, Feng HY, Sun WP
(2013) Current status and problems on waste plastic recycling. Recycling
Research 6:31-35 (in Chinese)
560
561
562
563
564
565
566
567
568
569
570
571
572
573
574
575
576
577
578
579
580
581
Taylor PH, Yamada T, Striebich RC, Graham JL, Giraud RJ (2014) Investigation of
waste incineration of fluorotelomer-based polymers as a potential source of
PFOA in the environment. Chemosphere 110:17-22
United Nations Environment Programme (UNEP) (2006) Risk Profile on
Perfluorooctane Sulfonate. Geneva
United States Environmental Protection Agency (USEPA) (2006) 2010/2015 PFOA
Stewardship Program.
Wang BB, Cao MH, Zhu HD, Chen J, Wang LL, Liu GH, Gu XM, Lu XH (2013)
Distribution of perfluorinated compounds in surface water from Hanjiang River
in Wuhan, China. Chemosphere 93:468-473
Wang T, Lu Y, Chen C, Naile JE, Khim JS, Giesy JP (2012) Perfluorinated
compounds in a coastal industrial area of Tianjin, China. Environmental
Geochemistry and Health 34:301-311
Wang XR (2009) Domestic and foreign treatment of sewage sludge and policies of
economy and technology in China (in Chinese). http://www.docin.com/p-
1395836853.html
Wang JZ (2006) Production and import status of PTFE in China. Organo-Fluorine
Industry 1:19-20 (in Chinese)
Wang L, Zhang Z, Zhang XZ, Sun SJ, Sun HW (2011) Removal of perfluorinated
compounds by wastewater treatment plants. Acta Scientiae Circumstantiae 31:
1363-1368 (in Chinese)
Wang MY, Yu Y (2003) Inquire into sewage drain and head water pollution.
582
583
584
585
586
587
588
589
590
591
592
593
594
595
596
597
598
599
600
601
602
603

Municipal engineering technology 21:361-363 (in Chinese)
Wang P, Lu YL, Wang TY, Meng J, Li QF, Zhu ZY, Sun YJ, Wang RS, Giesy JP
(2016) Shifts in production of perfluoroalkyl acids affect emissions and
concentrations in the environment of the Xiaoqing River Basin, China. Journal of
Hazardous Materials 307:55-63
Wang Z, Cousins IT, Scheringer M, Buck RC, Hungerbuehler K (2014) Global
emission inventories for C-4-C-14 perfluoroalkyl carboxylic acid (PFCA)
homologues from 1951 to 2030, Part I: production and emissions from
quantifiable sources. Environment International 70:62-75
Xie SW, Wang TY, Liu SJ, Jones KC, Sweetman AJ, Lu YL (2013) Industrial source
identification and emission estimation of perfluorooctane sulfonate in China.
Environment International 52:1-8
Yang LP, Zhu LY, Liu ZT (2011) Occurrence and partition of perfluorinated
compounds in water and sediment from Liao River and Taihu Lake, China.
Chemosphere 83:806-814
Yi SM, Pagilla SR, Seo YC, Mills WJ, Holsen TM (2008) Emissions of
polychlorinated biphenyls (PCBs) from sludge drying beds to the atmosphere in
Chicago. Chemosphere 71:1028-1034
Yu NY, Shi W, Zhang BB, Su GY,Feng JF, Zhang XW, Wei S, Yu HX (2013)
Occurrence of Perfluoroalkyl Acids Including Perfluorooctane Sulfonate Isomers
in Huai River Basin and Taihu Lake in Jiangsu Province, China. Environmental
Science & Technology 47:710-717
604
605
606
607
608
609
610
611
612
613
614
615
616
617
618
619
620
621
622
623
624
625

Yu W, Wang P, Tian L, Fu X, Bao Z (2010) The latest information of the Stockholm
Convention and an introduction of the using of PFOS in China fire industry. Fire
Science and Technology 29:513-515 (in Chinese)
Zhang L, Liu J, Hu J, Liu C, Guo W, Wang Q, Wang H (2012) The inventory of
sources, environmental releases and risk assessment for perfluorooctane
sulfonate in China. Environmental Pollution 165:193-198
Zhang W, Zhang YT, Taniyasu S, Yeung LWY, Lam PKS, Wang JS, Li XH, Yamashita
N, Dai JY (2013) Distribution and fate of perfluoroalkyl substances in municipal
wastewater treatment plants in economically developed areas of China.
Environmental Pollution 176: 10-17
Zhang Y, Shang X, Li K, Zhang C, Zhang K, Rong H (2011) Technologies status and
management strategies of municipal solid waste disposal in China. Ecology and
Environmental Sciences 20:389-396
Zhang ZR (2015) Combustion Control of Incinerator (in Chinese).
http://wenku.baidu.com/link?url=DYWXvKDQzZ2AqlKfxWWXs-P-
x62OXqwjgiLSq90hgcdYw_Vg7J9yiN4eIfVWDc_45sOrMefkmvODjGcsWf0F
oYkXHWcX_9tmcJsg3aNDiQe
Zhou Z, Liang Y, Shi YL, Xu L, Cai YQ (2013) Occurrence and Transport of
Perfluoroalkyl Acids (PFAAs), Including Short-Chain PFAAs in Tangxun Lake,
China. Environmental Science & Technology 47:9249-9257
626
627
628
629
630
631
632
633
634
635
636
637
638
639
640
641
642
643
644
645
646