Embed Size (px)
Citation preview
STATEWIDE WATER ASSESSMENT: RECHARGE DATA
COMPILATION AND RECHARGE AREA IDENTIFICATION FOR THE
STATE OF NEW MEXICO
By
David Ketchum, Graduate Assistant
B. Talon Newton, Hydrogeologist
Fred Phillips, Professor of Hydrology
TECHNICAL PROGRESS REPORT
Sub award Q 1686
June 2015
Funded by:
New Mexico Water Resources Research Institute
New Mexico Bureau of Geology and Mineral Resources
New Mexico Institute of Mining and Technology
i
DISCLAIMER
The New Mexico Water Resource Research Institute and affiliated institutions make no
warranties, express or implied, as to the use of the information obtained from this data product.
All information included with this product is provided without warranty or any representation of
accuracy and timeliness of completeness. Users should be aware that changes may have occurred
since this data set was collected and that some parts of these data may no longer represent actual
conditions. This information may be updated without notification. Users should not use these
data for critical applications without a full awareness of its limitations. This product is for
informational purposes only and may not be suitable for legal, engineering, or surveying
purposes. The New Mexico Water Resource Research Institute and affiliated institutions shall
not be liable for any activity involving these data, installation, fitness of the data for a particular
purpose, its use, or analyses results.
ii
ABSTRACT The rate and distribution of groundwater recharge to New Mexico’s aquifers is the least
understood aspect of the state’s water budget. Despite a history of precise and distributed
measurements quantifying surface water flow, water table elevations, precipitation amounts, as
well as current models that describe evapotranspiration, a statewide assessment of recharge has
not previously been attempted. While recharge estimates and studies of recharge processes have
been conducted, the effort to date has been on the basin scale, or by county and water-planning
region. With a long-term goal of estimating groundwater recharge on a statewide scale, this study
has compiled existing recharge estimates throughout the state and constructed a recharge-area
map. We have compiled over one hundred recharge estimates made in New Mexico, many of
which are from academic and government studies. A geographic information system (GIS) layer
was created to display locations of recharge and water resource planning studies. Data are
displayed in a format that contains the study citation, location (individual basins, counties, and
water planning regions), recharge estimate, methodology, and a link to the original work. To map
recharge areas, a GIS-based distributed-parameter soil-water-balance model, the
Evapotranspiration and Recharge Model (ETRM) was developed to simulate recharge using
gridded precipitation, reference evapotranspiration, geology, vegetation cover, and soils data as
inputs. Results show high recharge in the mountainous areas of the state, which typically have
thinner soils, lower temperatures, and higher rates of precipitation than the lowlands.
Keywords: Recharge, groundwater, evapotranspiration, precipitation, soil water balance,
distributed parameter model
iii
Contents
JUSTIFICATION OF WORK PERFORMED ............................................................................... 1
METHODS ..................................................................................................................................... 4
Compilation of recharge estimates .............................................................................................. 4
Groundwater recharge potential map .......................................................................................... 5
PRINCIPAL FINDINGS ................................................................................................................ 7
DISCUSSION ............................................................................................................................... 12
FUTURE WORK .......................................................................................................................... 14
REFERENCES CITED ................................................................................................................. 16
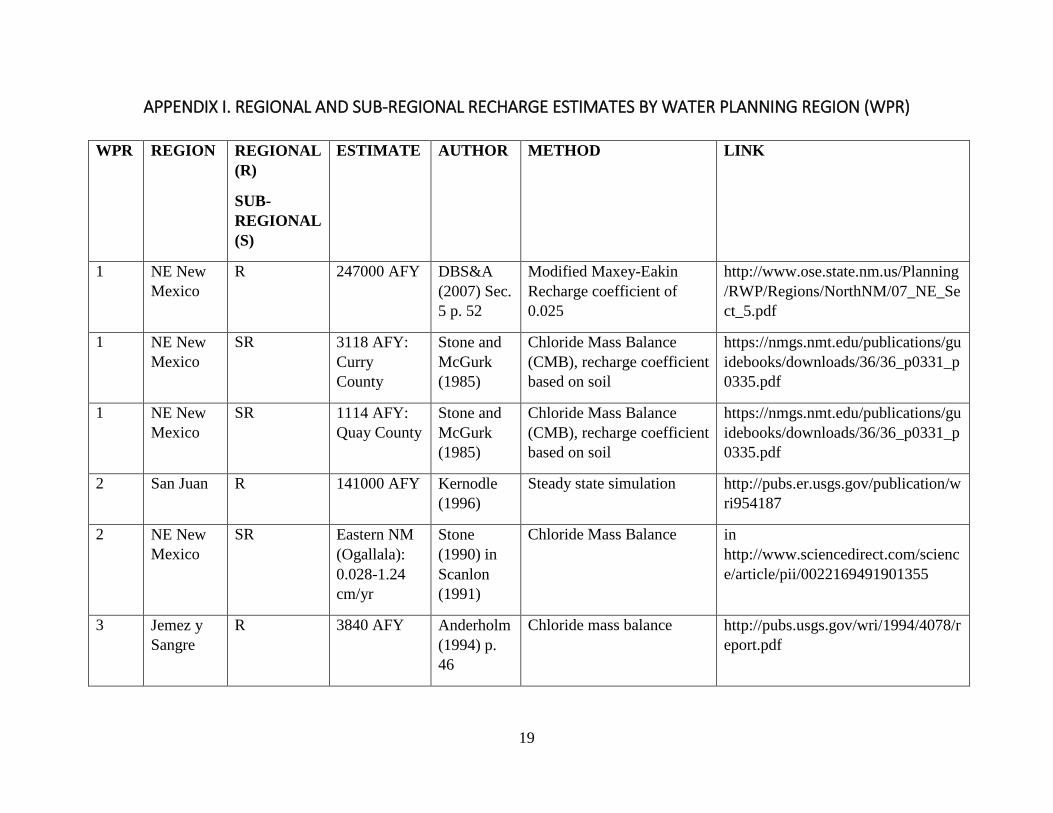
APPENDIX I. REGIONAL AND SUB-REGIONAL RECHARGE ESTIMATES BY WATER
PLANNING REGION (WPR) ...................................................................................................... 19
APPENDIX II. RECHARGE ESTIMATE REFERENCES ......................................................... 47
LIST OF FIGURES
Figure 1. The NM recharge-area map is an integration of several existing spatial data sets,
including elevation, precipitation, temperature (proxy for potential ET), geology, and vegetation.
......................................................................................................................................................... 3
Figure 2. New Mexico and headwaters base map shows recharge estimate study points
throughout the state. Selection of a point displays a window with pertinent information.............. 8
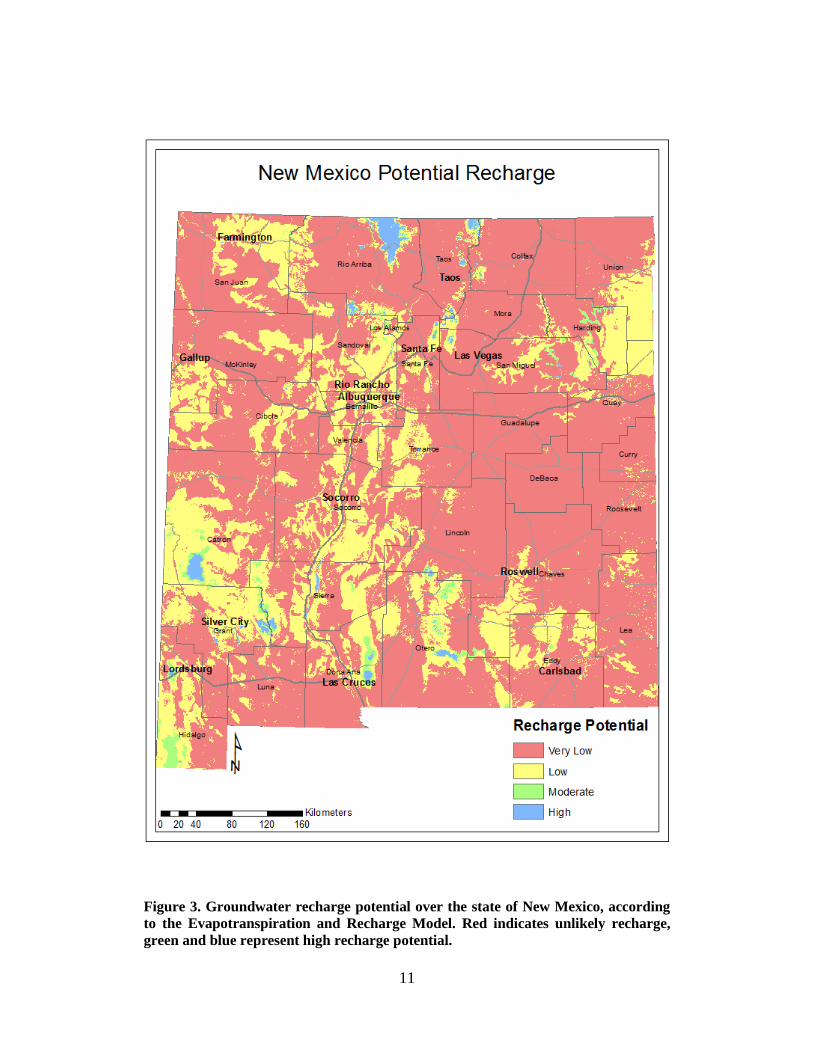
Figure 3. Groundwater recharge potential over the state of New Mexico, according to the
Evapotranspiration and Recharge Model. Red indicates unlikely recharge, green and blue
represent high recharge potential. ................................................................................................. 11

iv
1
JUSTIFICATION OF WORK PERFORMED
Groundwater recharge is the least understood component of the New Mexico state water
budget. Despite a long history of systematic stream gauging, water-table elevation monitoring,
and precipitation measurements, along with a burgeoning evapotranspiration (ET) measurement
effort, large-scale estimation of recharge in New Mexico has not been undertaken. Groundwater
recharge defines a limit for the availability of water for humans and ecosystems, therefore
estimating recharge for the state of New Mexico is critical for effective water resource
management. However, estimating recharge is difficult in New Mexico, where the extremely
heterogeneous topography and sporadic precipitation complicate recharge calculations. Efforts in
New Mexico to date have typically employed methods of partitioning precipitation into a
recharge fraction based on precipitation intensity, by stream base-flow estimates, or by
completing water mass-balance calculations with recharge defined as the remainder of other
measured components of the water budget. In order to understand the water resources of New
Mexico, accurate and large-scale estimation methods must be developed. The benefits of more
extensive and accurate recharge estimates include enabling federal, state, and municipal
organizations to plan for a sustainable use of groundwater resources as extraction increases and
the groundwater system reacts to climate change.
The overall goal of this study is to estimate groundwater recharge for the entire state as
part of the Water Resources Research Institute (WRRI) Statewide Water Assessment.
Ultimately, this statewide recharge estimate will be presented along with other components of
the state water balance on an interactive map that can be accessed on the Internet. Estimates will
2
be updated on an regular basis and will be based on the best and latest data available. It is
important to note that this project will likely take three to four years to complete.
This report describes the results of the first year of this study. The objectives of this study were
to:
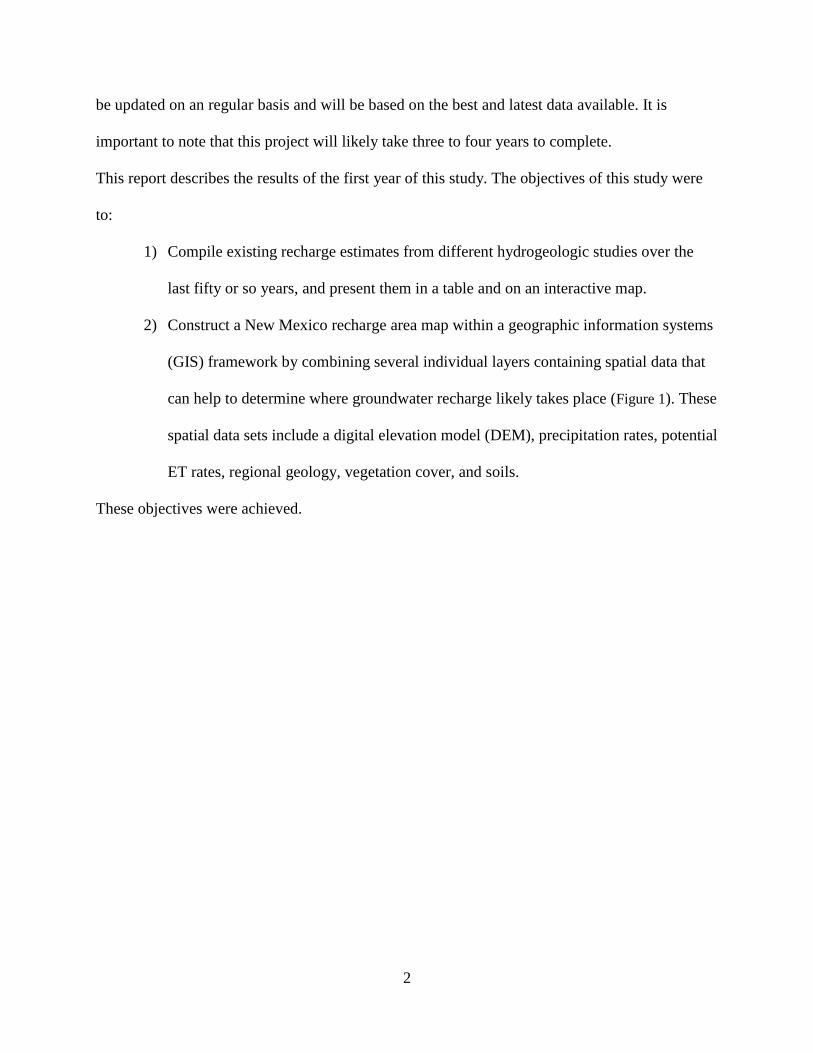
1) Compile existing recharge estimates from different hydrogeologic studies over the
last fifty or so years, and present them in a table and on an interactive map.
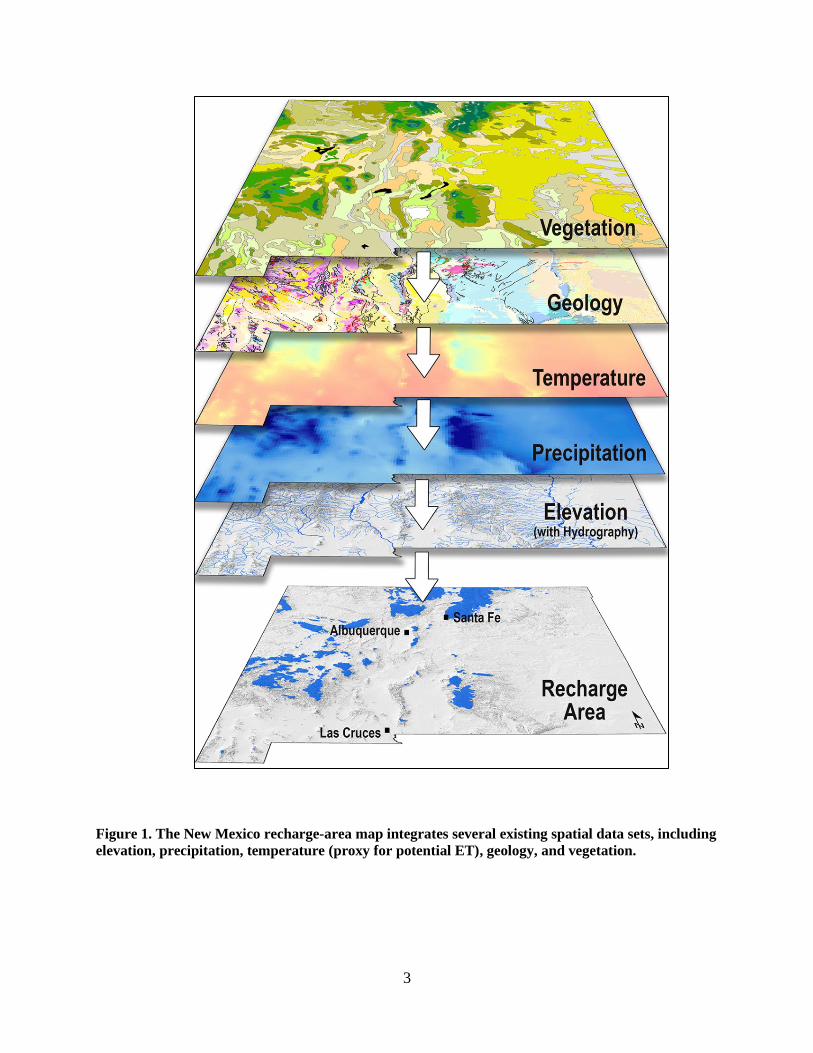
2) Construct a New Mexico recharge area map within a geographic information systems
(GIS) framework by combining several individual layers containing spatial data that
can help to determine where groundwater recharge likely takes place (Figure 1). These
spatial data sets include a digital elevation model (DEM), precipitation rates, potential
ET rates, regional geology, vegetation cover, and soils.
These objectives were achieved.
3
Figure 1. The New Mexico recharge-area map integrates several existing spatial data sets, including
elevation, precipitation, temperature (proxy for potential ET), geology, and vegetation.
4
METHODS
Compilation of recharge estimates
The compilation of previously conducted recharge estimates consists of around 130
individual estimates ranging in geographic scale from entire Water Resource Planning Regions
(WRPRs) to small basins, geologic formations, and individual mountain slopes. The data were
found through a review of New Mexico-related water studies. The principal source of recharge
estimates were the Water-Resource Investigation Reports published by the United States
Geological Survey (USGS), many of which are computational models of groundwater flow. The
New Mexico Office of the State Engineer (OSE) has documents posted online pertaining to each
of New Mexico’s 16 WRPRs, many of which estimate the components of the water budget over
the entire region, including recharge. These reports have typically been completed by private
industry consultants.
The data pertaining to recharge was compiled in tabular form, associated to geographic
points, and converted to a “layer” in GIS. Each layer represents a feature type that can be
represented geographically on a map in point, line, or polygon form. Each study location was
included in the tabular data and was then converted to a point layer in a GIS. A base map of New
Mexico and the outlying headwaters of inflowing rivers from other states was created. The
purpose of the base map is simply to orient the viewer to where the points are located with
familiar geographic features of New Mexico. The points layer on the map shows each study.
Using ArcGIS software, the viewer simply chooses the Identify Selection tool from the toolbar
and clicks on any point. This displays a window in which the information from the tabulated
recharge data is shown.
5
Groundwater recharge potential map
Identification of potential recharge areas statewide was completed using the
Evapotranspiration and Recharge Model (ETRM), which was developed specifically for this
purpose. The soil layer is the interface between the atmosphere and the groundwater system, and
mediates the transfer of water between the surface and subsurface. Precipitation that does not
become runoff is stored temporarily before it eventually recharges the groundwater system or is
lost to the atmosphere as ET. Treating soil as a reservoir in a mathematical model allows for
calculation of the water balance over large areas using ET, deep drainage (recharge), and runoff
to account for losses that balance water inputs by precipitation and run-on. In the arid and semi-
arid southwest United States, Flint and Flint (2007) and Hevesi (2003) employed soil water
balance (SWB) to estimate regional recharge rates using a model framework that was first
developed to characterize recharge at a proposed high-level nuclear waste disposal site at Yucca
Mountain, Nevada. This method incorporates many of the physical parameters controlling
recharge: soil water storage capacity, vegetative cover, underlying geology, and meteorological
conditions controlling the energy and water available for ET and precipitation. The
Evapotranspiration and Recharge Model (ETRM) has been developed to estimate diffuse
recharge and ET over New Mexico by employing a similar technique. The ETRM is a spatially
distributed model; rather than estimating recharge at a specific point, the model uses gridded
(raster) data that covers the entire state. The aforementioned inputs to the SWB are represented
by individual cells that are continuous over the state and limited in spatial detail by the resolution
of the grid.
6
The ETRM is designed to solve the following soil water balance on a daily time step
(modified from Allen et al., 2005):
𝐷𝑖 = 𝐷𝑖−1 + 𝑅𝑂 + 𝐸𝑇 + 𝑅 − 𝑃
where 𝐷𝑖 and 𝐷𝑖−1 is soil water depletion on the current and previous day, respectively, RO is
runoff, ET is evapotranspiration, R is recharge, and P is precipitation. All terms are reported as
depth of water in millimeters. Soil-water depletion is a convenient parameter with which the
water accounting is carried from day to day. At any cell in the model extent, maximum soil water
capacity is estimated based on the STATSGO statewide soil survey (Schwarz and Alexander,
1995); the depletion term represents the depth of water that could be added by precipitation to
the soil before runoff and recharge begin. If depletion is zero, the soil is at field capacity. When
the soil water balance is calculated, depletion from the previous day plus water loss from runoff,
ET, and recharge defines a new soil depletion at each cell. Only when the soil depletion is
negative (during prolonged or intense precipitation events) does recharge occur.
ET is calculated using the dual-crop-coefficient method after Allen and others (2005) and
the daily National Land Data Assimilation System reference ET layer (Cosgrove et al., 2003).
The reference ET is the rate of ET that would occur in a crop of well watered alfalfa, of 70 cm
height, according to that day’s local meteorological conditions. Runoff in the ETRM is caused by
precipitation in excess of the maximum rate of recharge, which is controlled by the saturated
hydraulic conductivity of the underlying rock or unconsolidated material. While runoff
contributes to focused recharge, an important pathway for recharge in the state, the ETRM
currently only estimates in-place recharge and does not consider recharge by runoff that becomes
surface-water flow. Daily precipitation data is provided by the Parameter-Regression and
Independent Slopes Model (PRISM) at an 800 m resolution (Daly et al., 1998). Data from the
7
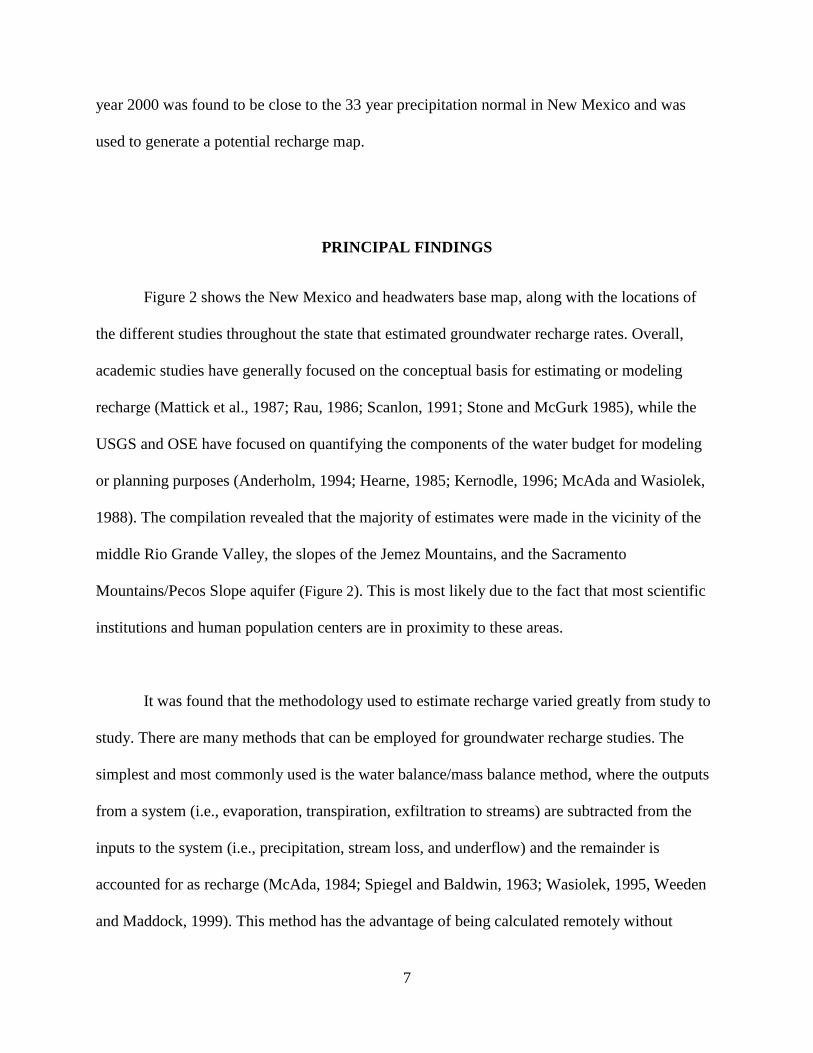
year 2000 was found to be close to the 33 year precipitation normal in New Mexico and was
used to generate a potential recharge map.
PRINCIPAL FINDINGS
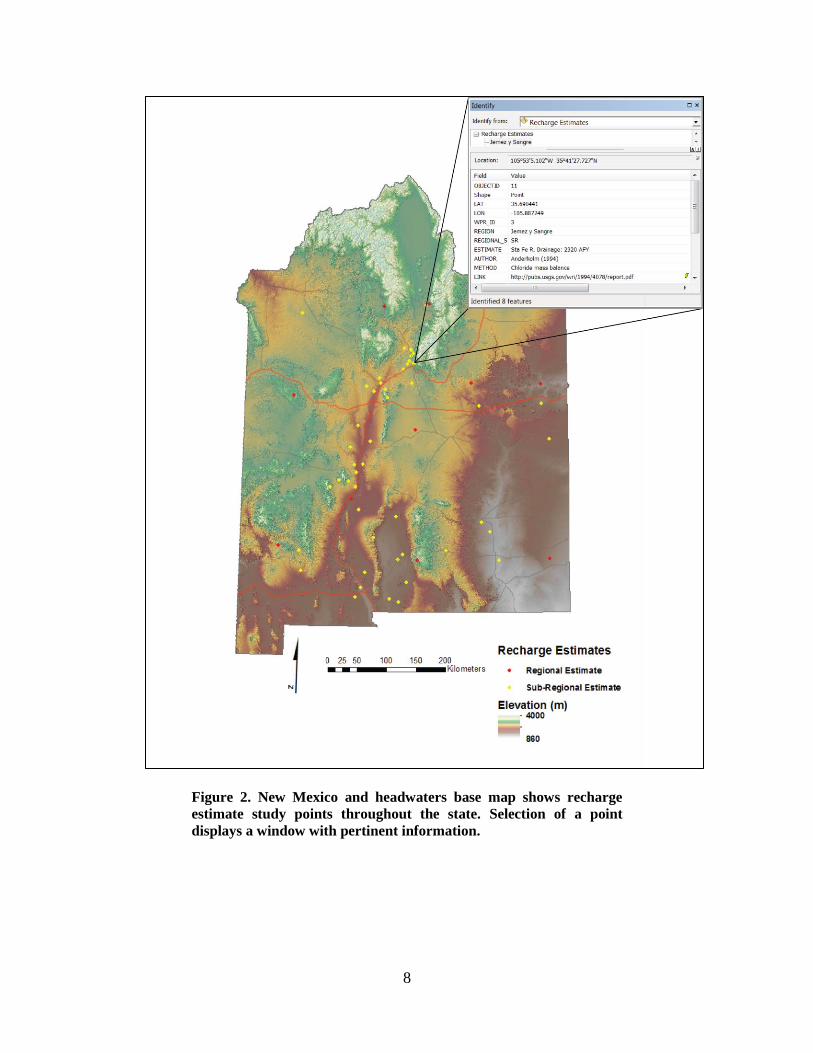
Figure 2 shows the New Mexico and headwaters base map, along with the locations of
the different studies throughout the state that estimated groundwater recharge rates. Overall,
academic studies have generally focused on the conceptual basis for estimating or modeling
recharge (Mattick et al., 1987; Rau, 1986; Scanlon, 1991; Stone and McGurk 1985), while the
USGS and OSE have focused on quantifying the components of the water budget for modeling
or planning purposes (Anderholm, 1994; Hearne, 1985; Kernodle, 1996; McAda and Wasiolek,
1988). The compilation revealed that the majority of estimates were made in the vicinity of the
middle Rio Grande Valley, the slopes of the Jemez Mountains, and the Sacramento
Mountains/Pecos Slope aquifer (Figure 2). This is most likely due to the fact that most scientific
institutions and human population centers are in proximity to these areas.
It was found that the methodology used to estimate recharge varied greatly from study to
study. There are many methods that can be employed for groundwater recharge studies. The
simplest and most commonly used is the water balance/mass balance method, where the outputs
from a system (i.e., evaporation, transpiration, exfiltration to streams) are subtracted from the
inputs to the system (i.e., precipitation, stream loss, and underflow) and the remainder is
accounted for as recharge (McAda, 1984; Spiegel and Baldwin, 1963; Wasiolek, 1995, Weeden
and Maddock, 1999). This method has the advantage of being calculated remotely without
8
Figure 2. New Mexico and headwaters base map shows recharge
estimate study points throughout the state. Selection of a point
displays a window with pertinent information.
9
making field measurements of recharge through other means, though the recharge estimate is
entirely dependent on the accuracy of other water-budget components.
Another common method that has been used in New Mexico is the Maxey-Eakin method.
Maxey and Eakin (1949) postulated that precipitation is proportional to recharge in semiarid
regions and that with increasing precipitation over an area, an increasing proportion of that water
infiltrates to become groundwater. This rough estimate is considered a good “first
approximation” and has much precedent in the literature and use in the southwestern United
States, so it is often the method employed when a large area needs to be analyzed (Daniel B.
Stephens and Associates, 2003a, 2003b, 2005a, 2005b, 2007; Frenzel, 1992). The disadvantage
is that this method assumes homogeneous conditions over a large surface area.
Both the water-balance, and Maxey-Eakin, approaches are often incorporated into more
nuanced methods of recharge estimation that are documented in this compilation, especially in
the many groundwater modeling efforts conducted by the USGS over the past 30 years (Orr and
Risser, 1992; Roybal, 1989; Waltemeyer, 2001). Modeled recharge estimates are common,
though their existence is owed in great part to the need of recharge quantification during the
process of model parameterization. Less-often-employed but more scientifically rigorous
methods include chloride mass balance, stream-loss calculations, long-term aquifer tests, and
Darcy calculations (Anderholm, 1994: Hearne, 1985; Frenzel 1985, Stephens and Knowlton,
1986). In any case, since there is no method of measuring groundwater recharge directly aside
from very expensive point measurements using lysimeters (a method typically employed at
agricultural sites); recharge estimates rely heavily on measurement of other components of the
water budget.
10
As the ETRM is still in development, the model results were interpreted as relative
recharge potential across the state (Figure 3). Areas were delineated based on the modeled
propensity for recharge. It was found that the potential recharge is highest in the mountains,
especially the Black and San Francisco Ranges of Catron and Grant counties; the Organ
Mountains of Doña Ana County; the Sacramento Mountains of Otero and Lincoln counties; the
Jemez and Brazos Mountains of Rio Arriba County; and the Sangre de Cristo Mountains of Taos,
Colfax, Mora, San Miguel, and Santa Fe counties. Most of the state (76%) has a very low
potential for recharge, 22% has a low potential, and a very small portion of the state has
moderate or high potential for recharge (1.2% and 0.8%, respectively).
11
Figure 3. Groundwater recharge potential over the state of New Mexico, according
to the Evapotranspiration and Recharge Model. Red indicates unlikely recharge,
green and blue represent high recharge potential.
12
DISCUSSION
While recharge estimates have been made over the essentially the entire state (Appendix
I), the techniques used at the water resource planning region scale have been first order
approximations based on disparate techniques involving unrealistic physical assumptions. The
most common WRPR-wide estimation technique is the modified Maxey-Eakin approach, which
was has been found to produce results within 50 percent of independent estimates (Avon and
Durbin, 1994). Smaller scale estimates have been made using a wide variety of techniques. This
disparity in technique and geographic coverage makes estimating statewide recharge based on
existing work in the literature difficult.
Recharge across the state appears to correlate strongly with elevation. High recharge in
mountainous areas is indicated by the ETRM and is expected; high altitude ranges cause air
masses to rise and cool, causing precipitation (the orographic effect). Soils also tend to be thin in
the mountains where the work of erosion is rapid and loose material tends to be washed quickly
downwards into valleys. Thin soils are quickly saturated during precipitation and thus cause
higher recharge. Low recharge potential is predicted by the ETRM at low elevations and in areas
with thick soils. This is expected, as low areas have high barometric pressures and temperatures,
which allow atmospheric water to remain in the vapor phase rather than condensing and
precipitating. Thick soils tend to host vegetation with deep roots that can effectively drain the
soil layer of water for long periods of time after precipitation events, preventing water from
percolating through the root zone to become recharge.
13
The ETRM makes several significant assumptions that ignore certain physical realities.
First, the model does not account for water that recharges after having run off the place where it
initially fell as precipitation. Second, the model treats the soil layer as a one-dimensional space;
unsaturated and saturated-zone lateral flow is not accounted for. Third, the ETRM doesn’t
attempt to model the unsaturated zone between the soil layer and the aquifer; once water has
passed through the soil, it is immediately considered recharge. This is a particularly significant
assumption in the Southwest United States, where the unsaturated zone can be hundreds of
meters in thickness and travel times through it could be from years to millennia (Flint and Flint,
2004). Though the ETRM uses high-resolution precipitation data, the soils data has been
converted from a 1:250,000 scale map, while the reference ET data is a raster grid of 12 km
cells. The low resolution of soils and reference ET data neglect the fine-scale variability
associated with the topography of New Mexico and result in ET estimates that, while constrained
by the water and energy balance, do not reflect this high spatial heterogeneity.
The ETRM provides quantified recharge estimates, yet the results are presented
qualitatively as relative recharge potential. This is because the model does not have continuous
soil data coverage over the state, the model does not account for focused recharge generated by
runoff, and the simulation used data from just one year. There are several large soil-data gaps,
especially in the north around the Jemez Mountains, and in and around the lower ranges of the
south. These gaps cause the ETRM to fail and were thus given 5 mm of soil manually. The
ETRM simulated only the year 2000, which was found to have near normal total precipitation
statewide. It would be expected that precipitation, while normal for the state, would have varied
from the 30 year normal locally. For these reasons, the results are presented qualitatively, to

14
indicate the propensity for in-place recharge anywhere in the state, while not seeking to quantify
the recharge that year. The classification of “Very Low”, “Low”, “Moderate”, and “High”
recharge potential is somewhat arbitrary, as the threshold between classes of potential recharge
was applied manually to best show the geographic pattern statewide.
FUTURE WORK
Future work on recharge estimation in New Mexico will include improvements to the
ETRM and the field collection of water samples that will be analyzed for chloride concentration
to estimate recharge in the mountains and assess the performance of the ETRM. The reference
ET layer upon which the ETRM relies to control the energy budget must be adjusted to the
topography of the state to realistically represent changes in ET due to changing elevation, aspect,
shading, and slope. The soils data used to model the soil layer water storage and depletion in the
ETRM must be improved by replacing the STATSGO coverage with the latest National
Resources Conservation Service SSURGO soils survey. Chloride concentrations found by lab
analysis of mountain spring water will be used to perform chloride-mass-balance calculations, an
established technique to estimate recharge using groundwater samples. With the completion of
future modeling and point-scale recharge estimates, statewide recharge amounts can be
quantified.
15
SUMMARY
Using a GIS framework, existing recharge estimates made within New Mexico were
compiled and mapped, and a soil-water-balance model was used to identify potential recharge
areas in the state. Over 130 recharge estimates were found. Review of recharge estimation
techniques revealed that the methods to estimate recharge over large areas were rough first-order
approximations, and efforts to estimate recharge on a smaller scale were made using disparate
techniques. A soil-water-balance model that uses soils, precipitation, reference ET, geology, and
vegetation to model water mass balance transfer at the atmosphere/subsurface interface
simulated daily conditions over one year to identify likely recharge areas. The model shows the
expected result, most in-place groundwater recharge occurs in mountainous terrain, where low
temperatures, high precipitation, and thin soils allow high recharge rates. Further development of
soil water balance modeling is recommended to quantify in-place recharge and analyze possible
methods for quantifying focused recharge in New Mexico.
16
REFERENCES CITED
Allen, R.G., L.S. Pereira, M. Smith, D. Raes, and J.L. Wright. 2005. FAO-56 dual crop coefficient
method for estimating evaporation from soil and application extensions. Journal of Irrigation
and Drainage Engineering. 131: 2-13.
Anderholm, S.K. 1994. Mountain-front recharge along the eastern side of the Middle Rio Grande Basin,
Central New Mexico. Middle Rio Grande Basin Study: U.S. Geological Survey Water-Resources
Investigations Report no. 94-4078. p. 46.
Avon, L. and T. J. Durbin. 1994. Evaluation of the Maxey-Eakin method for estimating groundwater
recharge in Nevada. Journal of the American Water Resources Association. 30: 99-111.
Cosgrove, B.A., D. Lohmann, K.E. Mitchell, P.R. Houser, E.F. Wood, J.C. Schaake, and J. Meng. 2003.
Real‐time and retrospective forcing in the North American Land Data Assimilation System
(NLDAS) project. Journal of Geophysical Research: Atmospheres (1984–2012), 108(D22).
Daly, C., R.P. Neilson, and D.L. Phillips. 1994.. A statistical-topographic model for mapping
climatological precipitation over mountainous terrain. Journal of Applied Meteorology, 33(2),
140-158.
Daniel B. Stephens and Associates. 2003a. Colfax Regional Water Plan. Prepared for the Colfax Soil
and Water Conservation District, Raton, New Mexico, March 2003. sec. 7 p. 13.
-- Socorro-Sierra Regional Water Plan. 2003b. Prepared for the Socorro Soil and Water
Conservation District, Socorro New Mexico App. F3 p. 2.
-- Southwest New Mexico Regional Water Plan. 2005a. Prepared for the Southwest New Mexico
Regional Water Plan Steering Committee, City of Deming, New Mexico, and Fiscal
Agent Sec. 7 p. 8.
-- Mora-San Miguel-Guadalupe Regional Water Plan. 2005b. Prepared for the Tierra y Montes
Soil and Water Conservation District and the Mora-San Miguel-Guadalupe Regional
Water Planning Steering Committee, June 2005 Sec. 7 p. 8.
-- Northeast New Mexico Regional Water Plan. 2007. Prepared for the City of Tucumcari and
the Northeast New Mexico Regional Water Plan Steering Committee. Sec 5. p. 52.
-- Taos Regional Water Plan. 2008. Prepared for the Taos Regional Water Planning Steering
Committee. Sec. 7 p. 30.
Flint, A. L., L. E. Flint, J. A. Hevesi, and J.B. Blainey. 2004. Fundamental concepts of recharge in the
Desert Southwest: a regional modeling perspective. In Groundwater Recharge in a Desert
Environment: The Southwestern United States, edited by J.F. Hogan, F.M. Phillips, and B.R.
Scanlon, Water Science and Application Series, vol. 9, American Geophysical Union, 159-184.
Flint, A. L. and L.E. Flint. 2007. Application of the basin characterization model to estimate in-place
recharge and runoff potential in the Basin and Range carbonate-rock aquifer system, White Pine
County, Nevada, and adjacent areas in Nevada and Utah. U.S. Geological Society Scientific
Investigations Report no. 2007-5099.
17
Frenzel, P.F. 1992. Simulation of Ground-water flow in the San Andres-Glorieta Aquifer in the Acoma
Embayment and Eastern Zuni Uplift, West-Central New Mexico. U.S. Geological Survey Water-
Resources Investigations Report, no. 91-4099, p. 30.
Hearne, Glenn A. 1985. Mathematical model of the Tesuque Aquifer System near Pojoaque, New
Mexico. U.S. Geological Survey Water Supply Paper 2205. p. 25.
Hevesi, J.A., A.L. Flint, and L.E. Flint. 2003. Simulation of net infiltration and potential recharge using
a distributed-parameter watershed model of the Death Valley region, Nevada and California.
U.S. Geological Survey Water-Resources Investigations Report no. 03-4090.
Kernodle, J.M. 1996. Hydrogeology and steady-state simulation of ground-water flow in the San Juan
Basin, New Mexico, Colorado, Arizona, and Utah. U.S. Geological Survey Water-Resources
Investigations Report. 95-4187.
-- 1998. Simulation of ground-water flow in the Albuquerque Basin, Central New Mexico, 1901-
05, with Projections to 2020. U.S. Geological Survey Water-Resources Investigations
Report. 94-4251.
Maxey, G.B. and T. E. Eakin. 1949. Ground water in White River Valley, White Pine, Nye, and Lincoln
Counties, Nevada. Nevada State Engineer.
McAda, D.P. 1984. Projected water-level declines in the Ogallala Aquifer in Lea County, New Mexico.
U.S. Geological Survey Water-Resources Investigations Report 83-4013
McAda, D.P., and M. Wasiolek. 1988. Simulation of the Regional Geohydrology of the Tesuque
Aquifer System near Santa Fe, New Mexico. U.S. Geological Survey Water-Resources
Investigations Report 87-4056
Orr, B.R., and D.W. Risser. 1992. Geohydrology and potential effects of development of freshwater
resources in the northern part of the Hueco Bolson, Dona Ana and Otero Counties, New Mexico,
and El Paso County, Texas. U.S. Geological Survey Water-Resources Investigations Report 91-
4082.
Rau, B. 1986. Ground-water resources in the Carrizozo Area, New Mexico. In New Mexico Geological
Society Guidebook, 37th Field Conference, Truth or Consequences. p. 315.
Roybal, E. 1989. Ground-water resources of Socorro County, New Mexico. U.S. Geological Survey
Water-Resources Investigations Report 89-4083.
Scanlon, B.R. 1991. Evaluation of moisture flux from chloride data in desert soils. Journal of
Hydrology, 128: 137-156.
Schwarz, G.E. and R.B. Alexander. 1995. State Soil Geographic (STATSGO) data base for the
conterminous United States. U.S. Geological Survey Scientific Investigations Report no. 95-449.
18
Spiegel, Z., and B. Baldwin. 1963. Geology and water resources of the Santa Fe area, New Mexico. U.S.
Geological Survey Water-Supply Paper no. 1525.
Stephens, D.B. and R. Knowlton, Jr. 1986. Soil water movement and recharge through sand at a
semiarid site in New Mexico. Water Resources Research, 22: 881-889.
Waltemeyer, S.D. 2001. Estimates of mountain-front streamflow available for potential recharge to the
Tularosa Basin, New Mexico. U.S. Geological Survey Water-Resources Investigations Report
no. 2001-4013.
Wasiolek, M. 1995. Subsurface recharge to the Tesuque Aquifer system from selected drainage basins
along the western side of the Sangre de Cristo Mountains near Santa Fe, New Mexico. U.S.
Geological Survey Water-Resources Investigations Report no. 94-4072.
Weeden, A.C., Jr., and T. Maddock. 1999. Simulation of groundwater flow in the Rincon Valley area
and Mesilla Basin, New Mexico and Texas. Master’s Thesis, Univ. of Arizona.
See Appendix II for recharge estimate references.
19
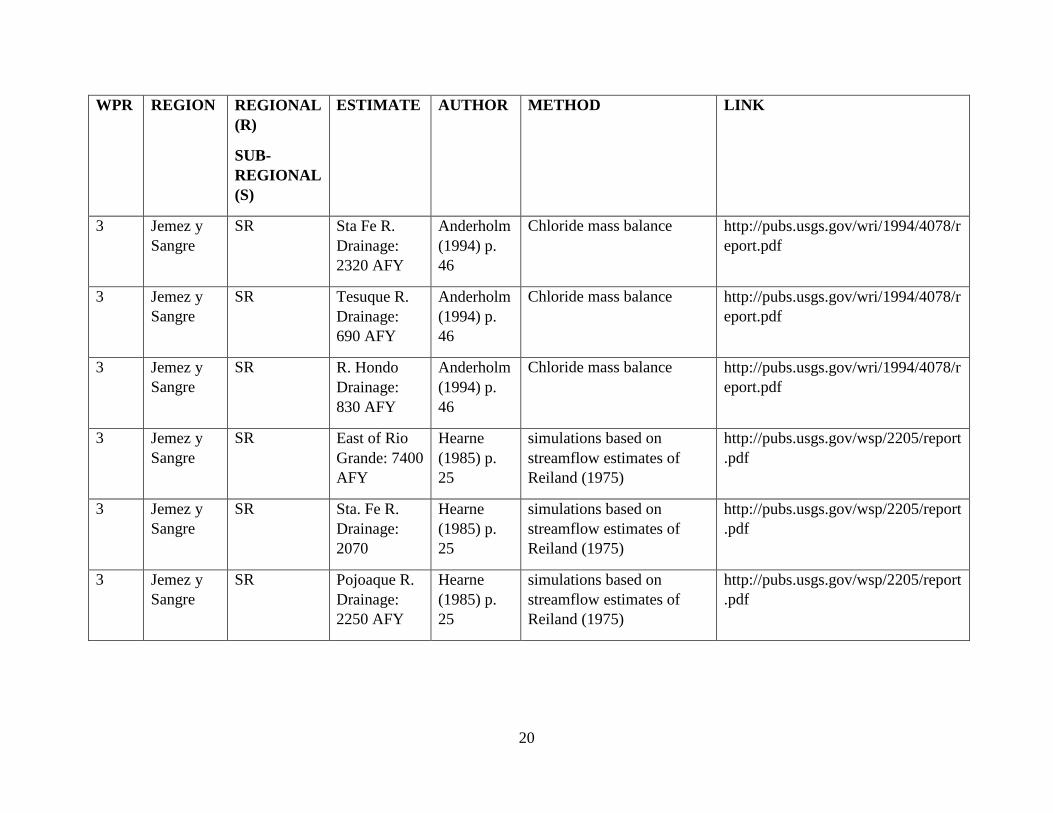
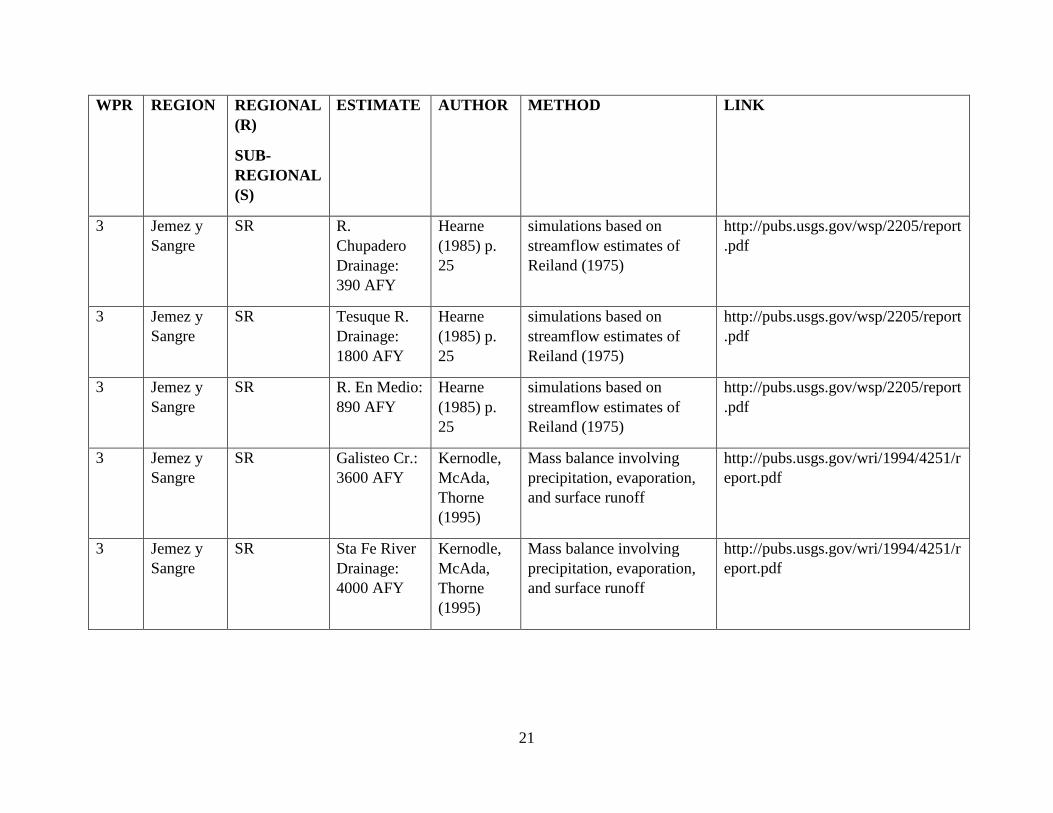
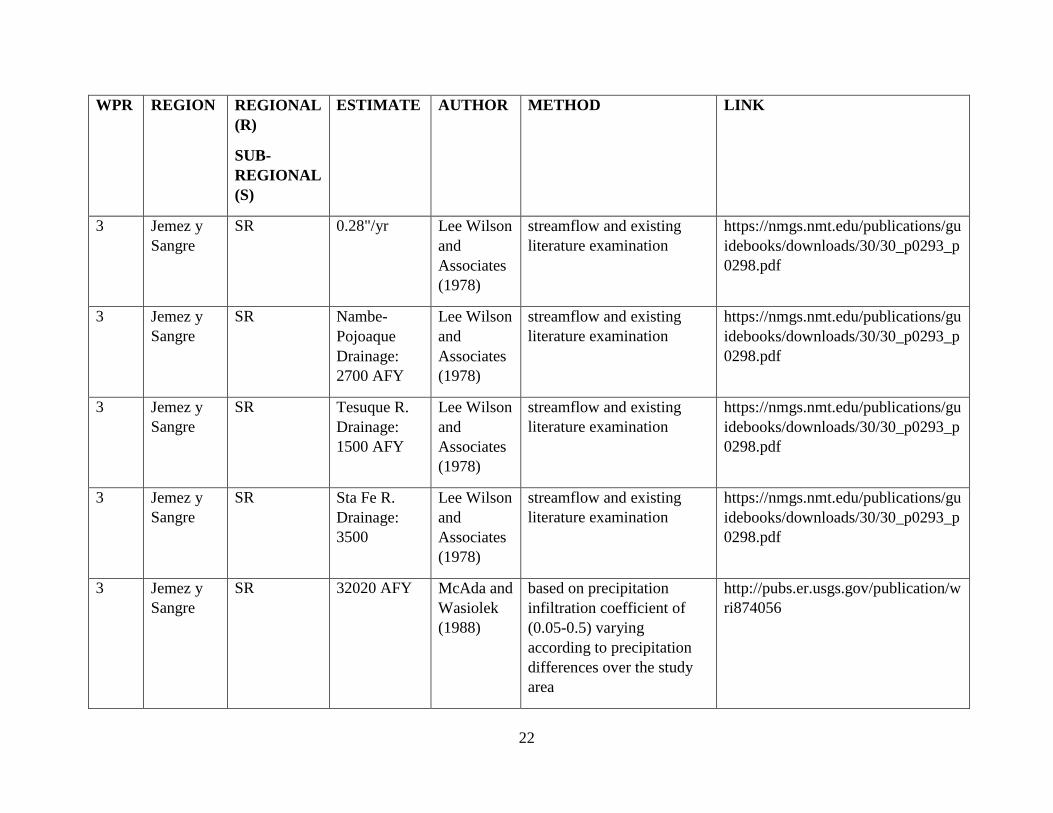
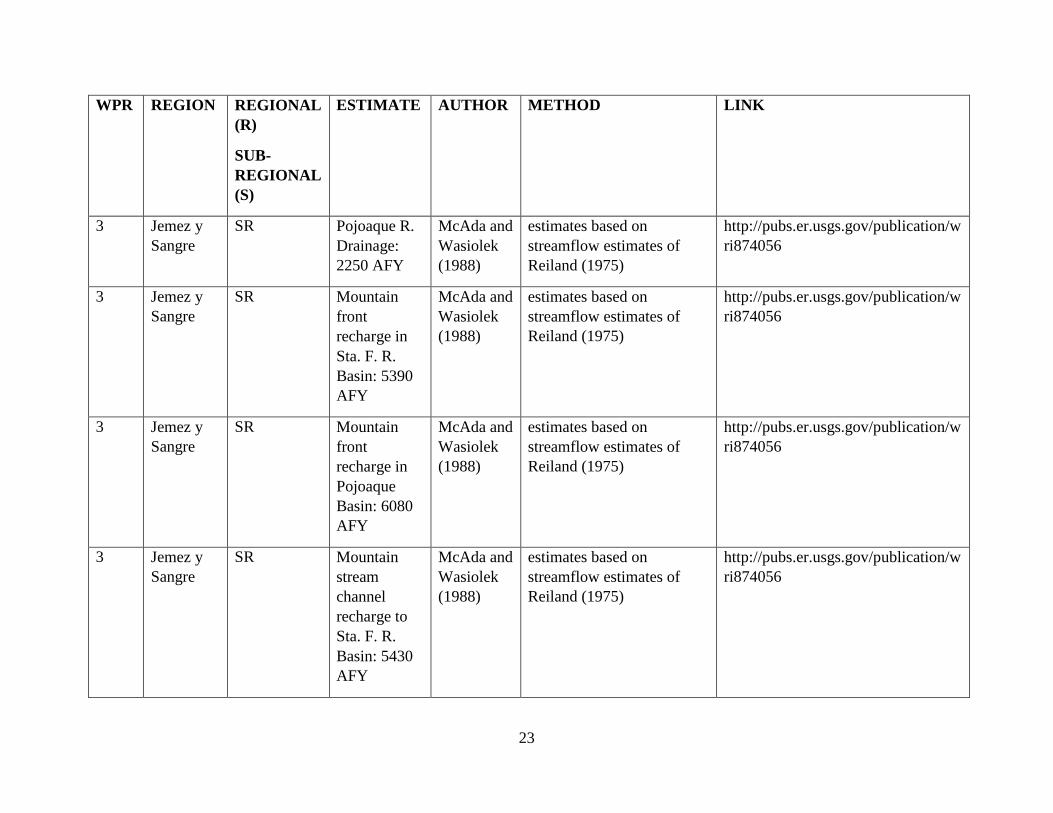
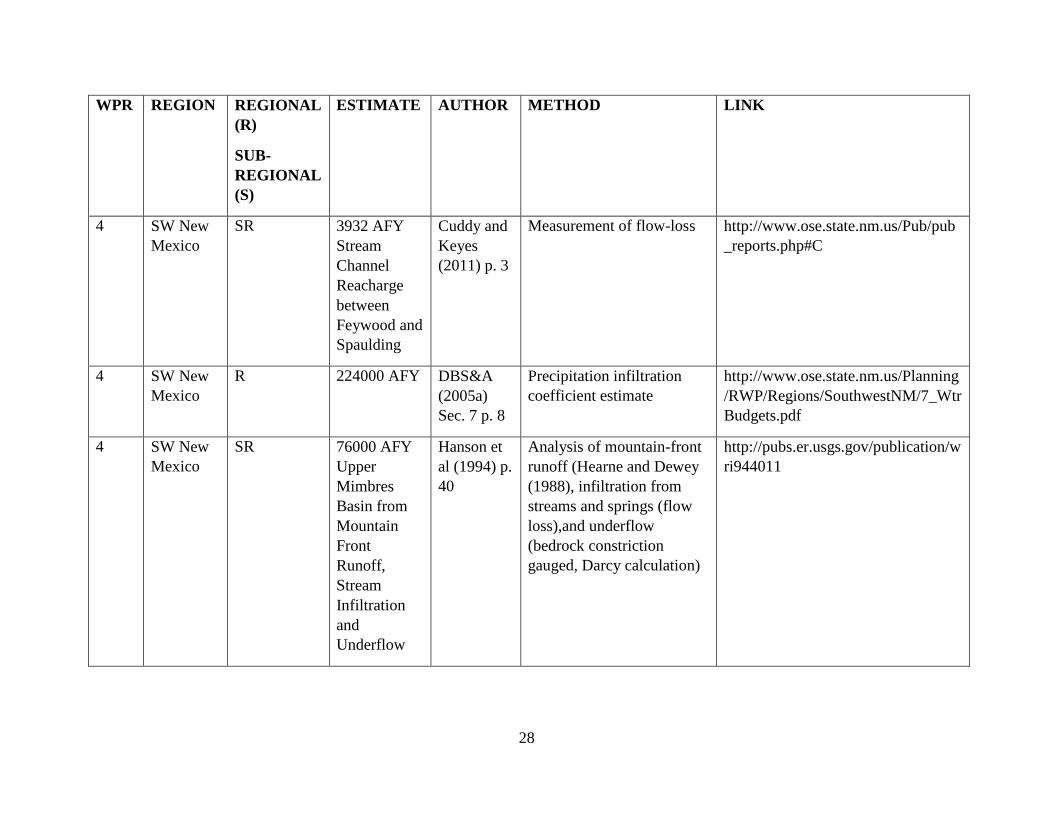
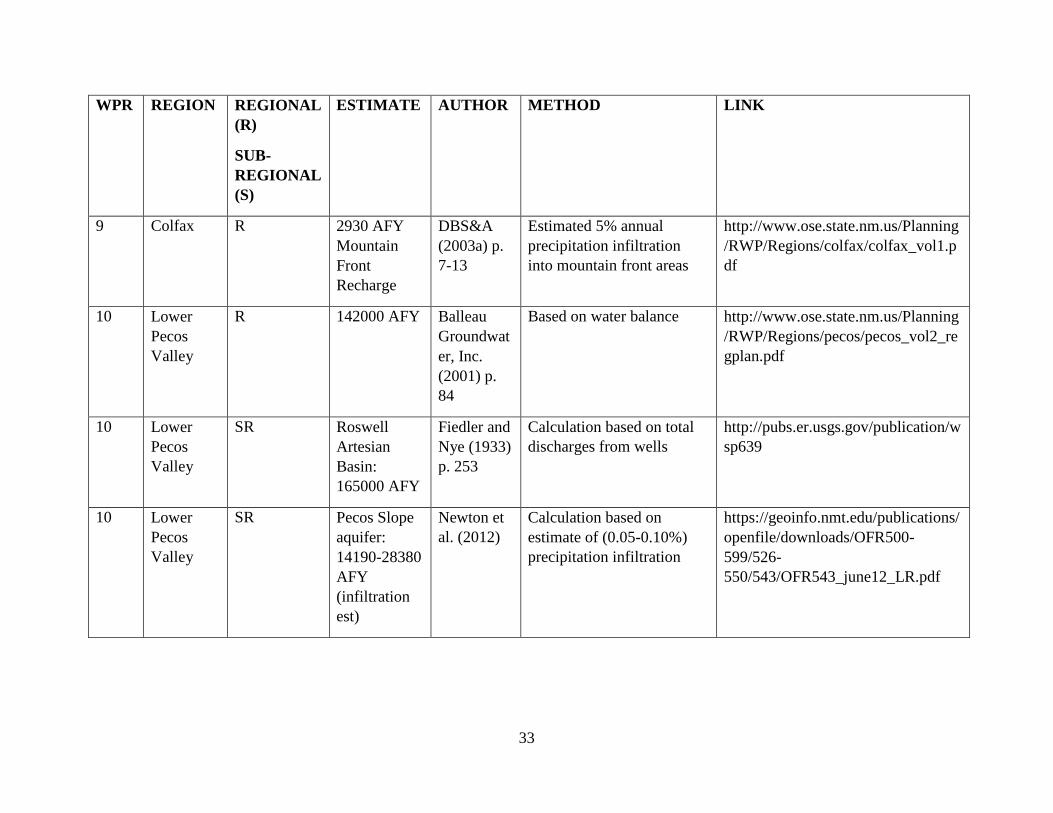
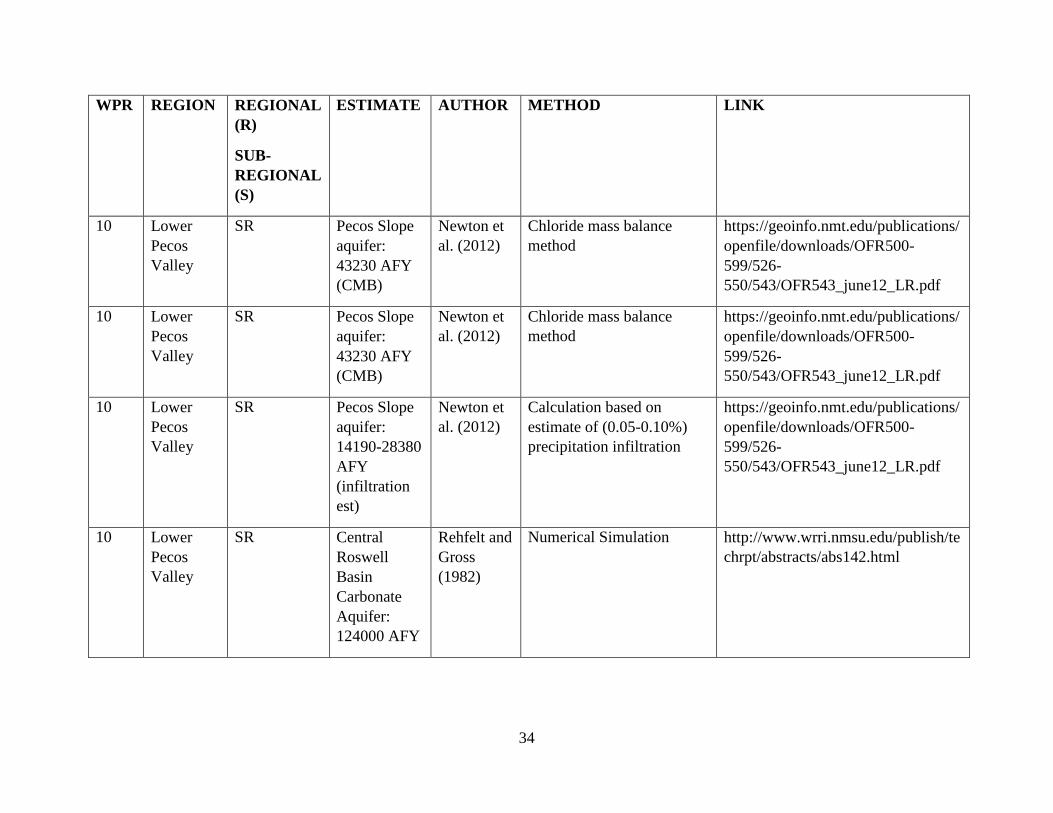
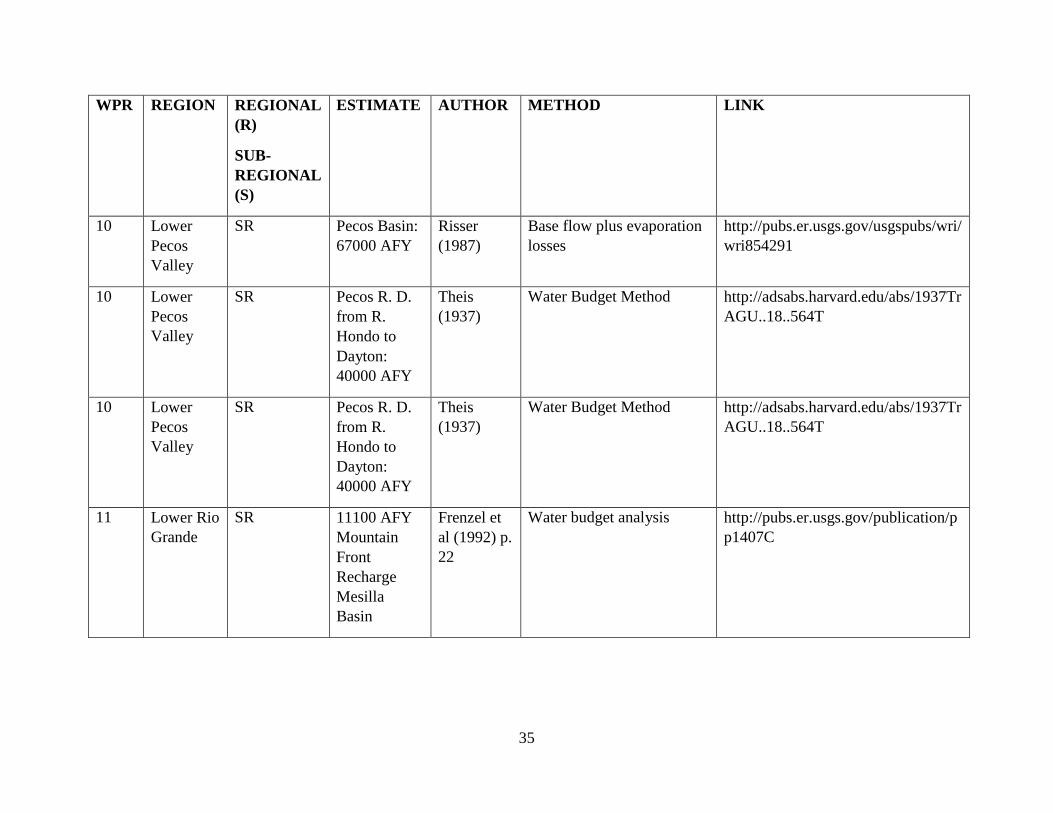
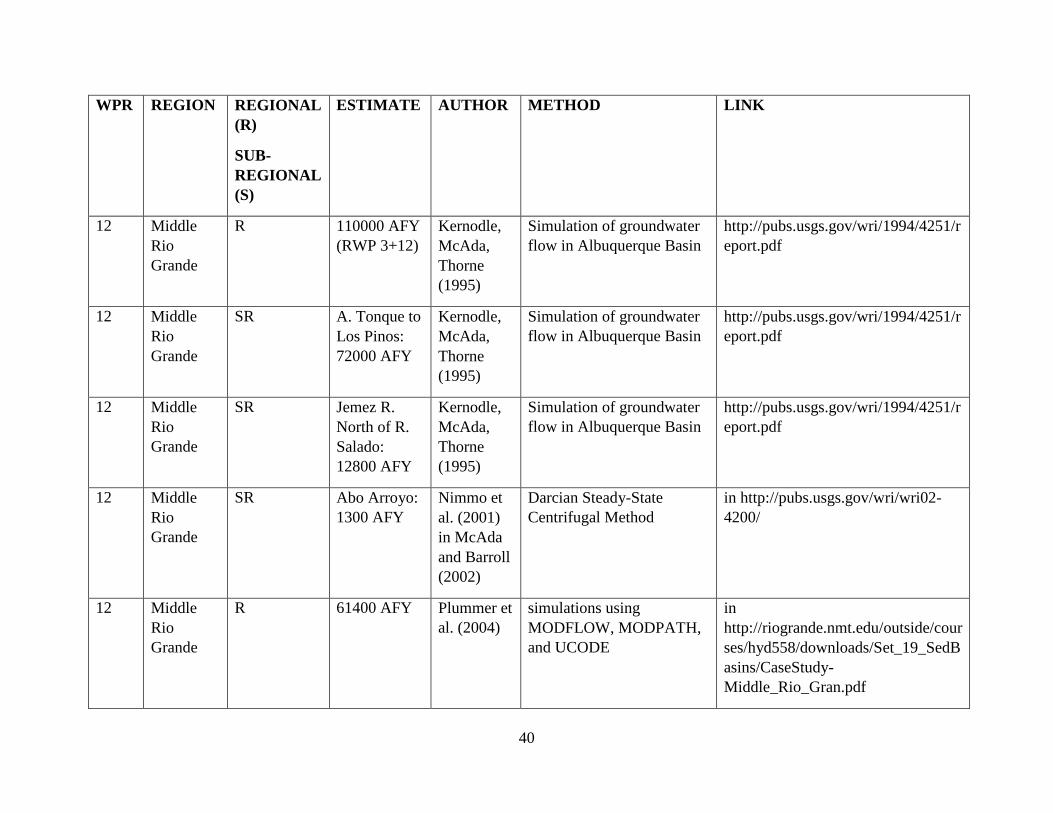
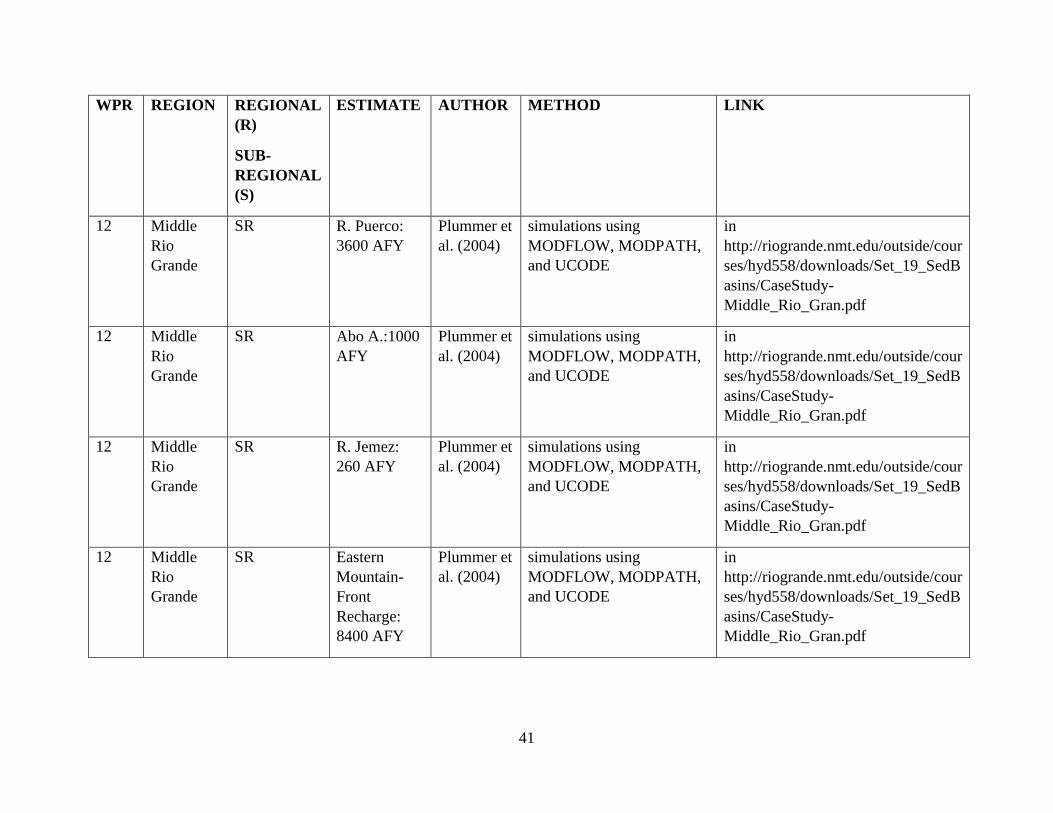
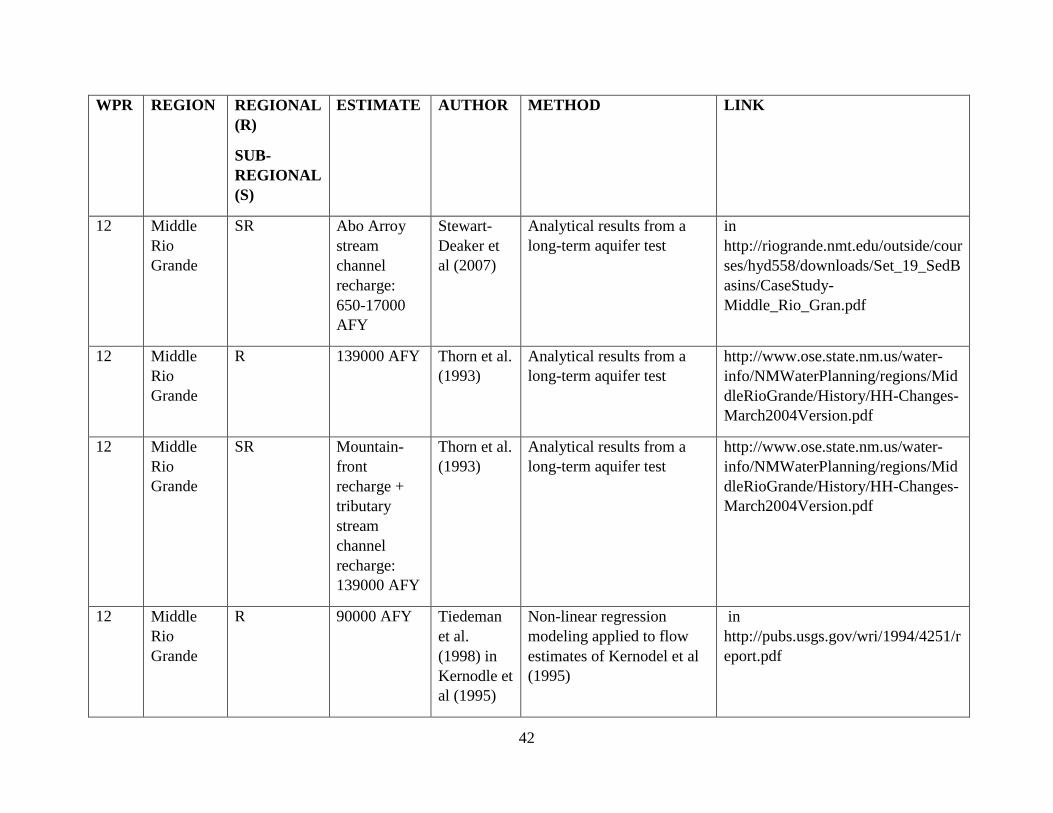
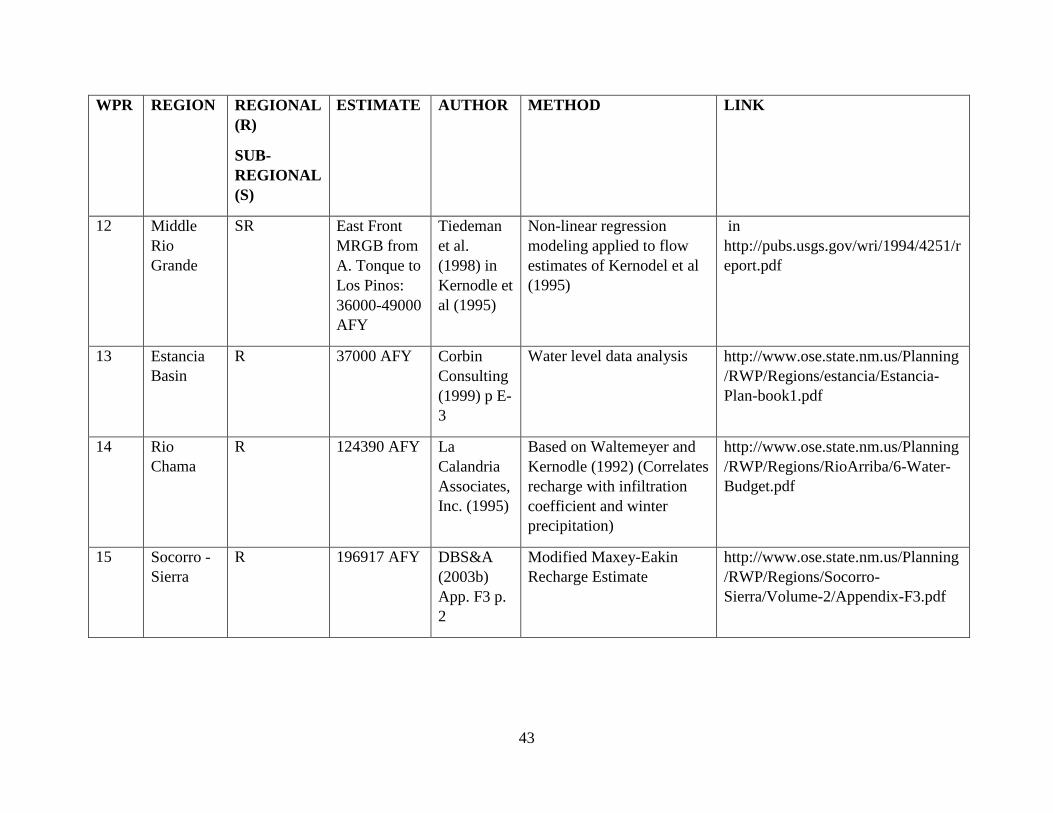
APPENDIX I. REGIONAL AND SUB-REGIONAL RECHARGE ESTIMATES BY WATER PLANNING REGION (WPR)
WPR REGION REGIONAL
(R)
SUB-
REGIONAL
(S)
ESTIMATE AUTHOR METHOD LINK
1 NE New
Mexico
R 247000 AFY DBS&A
(2007) Sec.
5 p. 52
Modified Maxey-Eakin
Recharge coefficient of
0.025
http://www.ose.state.nm.us/Planning
/RWP/Regions/NorthNM/07_NE_Se
ct_5.pdf
1 NE New
Mexico
SR 3118 AFY:
Curry
County
Stone and
McGurk
(1985)
Chloride Mass Balance
(CMB), recharge coefficient
based on soil
https://nmgs.nmt.edu/publications/gu
idebooks/downloads/36/36_p0331_p
0335.pdf
1 NE New
Mexico
SR 1114 AFY:
Quay County
Stone and
McGurk
(1985)
Chloride Mass Balance
(CMB), recharge coefficient
based on soil
https://nmgs.nmt.edu/publications/gu
idebooks/downloads/36/36_p0331_p
0335.pdf
2 San Juan R 141000 AFY Kernodle
(1996)
Steady state simulation http://pubs.er.usgs.gov/publication/w
ri954187
2 NE New
Mexico
SR Eastern NM
(Ogallala):
0.028-1.24
cm/yr
Stone
(1990) in
Scanlon
(1991)
Chloride Mass Balance in
http://www.sciencedirect.com/scienc
e/article/pii/0022169491901355
3 Jemez y
Sangre
R 3840 AFY Anderholm
(1994) p.
46
Chloride mass balance http://pubs.usgs.gov/wri/1994/4078/r
eport.pdf
20
WPR REGION REGIONAL
(R)
SUB-
REGIONAL
(S)
ESTIMATE AUTHOR METHOD LINK
3 Jemez y
Sangre
SR Sta Fe R.
Drainage:
2320 AFY
Anderholm
(1994) p.
46
Chloride mass balance http://pubs.usgs.gov/wri/1994/4078/r
eport.pdf
3 Jemez y
Sangre
SR Tesuque R.
Drainage:
690 AFY
Anderholm
(1994) p.
46
Chloride mass balance http://pubs.usgs.gov/wri/1994/4078/r
eport.pdf
3 Jemez y
Sangre
SR R. Hondo
Drainage:
830 AFY
Anderholm
(1994) p.
46
Chloride mass balance http://pubs.usgs.gov/wri/1994/4078/r
eport.pdf
3 Jemez y
Sangre
SR East of Rio
Grande: 7400
AFY
Hearne
(1985) p.
25
simulations based on
streamflow estimates of
Reiland (1975)
http://pubs.usgs.gov/wsp/2205/report
3 Jemez y
Sangre
SR Sta. Fe R.
Drainage:
2070
Hearne
(1985) p.
25
simulations based on
streamflow estimates of
Reiland (1975)
http://pubs.usgs.gov/wsp/2205/report
3 Jemez y
Sangre
SR Pojoaque R.
Drainage:
2250 AFY
Hearne
(1985) p.
25
simulations based on
streamflow estimates of
Reiland (1975)
http://pubs.usgs.gov/wsp/2205/report
21
WPR REGION REGIONAL
(R)
SUB-
REGIONAL
(S)
ESTIMATE AUTHOR METHOD LINK
3 Jemez y
Sangre
SR R.
Chupadero
Drainage:
390 AFY
Hearne
(1985) p.
25
simulations based on
streamflow estimates of
Reiland (1975)
http://pubs.usgs.gov/wsp/2205/report
3 Jemez y
Sangre
SR Tesuque R.
Drainage:
1800 AFY
Hearne
(1985) p.
25
simulations based on
streamflow estimates of
Reiland (1975)
http://pubs.usgs.gov/wsp/2205/report
3 Jemez y
Sangre
SR R. En Medio:
890 AFY
Hearne
(1985) p.
25
simulations based on
streamflow estimates of
Reiland (1975)
http://pubs.usgs.gov/wsp/2205/report
3 Jemez y
Sangre
SR Galisteo Cr.:
3600 AFY
Kernodle,
McAda,
Thorne
(1995)
Mass balance involving
precipitation, evaporation,
and surface runoff
http://pubs.usgs.gov/wri/1994/4251/r
eport.pdf
3 Jemez y
Sangre
SR Sta Fe River
Drainage:
4000 AFY
Kernodle,
McAda,
Thorne
(1995)
Mass balance involving
precipitation, evaporation,
and surface runoff
http://pubs.usgs.gov/wri/1994/4251/r
eport.pdf
22
WPR REGION REGIONAL
(R)
SUB-
REGIONAL
(S)
ESTIMATE AUTHOR METHOD LINK
3 Jemez y
Sangre
SR 0.28"/yr Lee Wilson
and
Associates
(1978)
streamflow and existing
literature examination
https://nmgs.nmt.edu/publications/gu
idebooks/downloads/30/30_p0293_p
0298.pdf
3 Jemez y
Sangre
SR Nambe-
Pojoaque
Drainage:
2700 AFY
Lee Wilson
and
Associates
(1978)
streamflow and existing
literature examination
https://nmgs.nmt.edu/publications/gu
idebooks/downloads/30/30_p0293_p
0298.pdf
3 Jemez y
Sangre
SR Tesuque R.
Drainage:
1500 AFY
Lee Wilson
and
Associates
(1978)
streamflow and existing
literature examination
https://nmgs.nmt.edu/publications/gu
idebooks/downloads/30/30_p0293_p
0298.pdf
3 Jemez y
Sangre
SR Sta Fe R.
Drainage:
3500
Lee Wilson
and
Associates
(1978)
streamflow and existing
literature examination
https://nmgs.nmt.edu/publications/gu
idebooks/downloads/30/30_p0293_p
0298.pdf
3 Jemez y
Sangre
SR 32020 AFY McAda and
Wasiolek
(1988)
based on precipitation
infiltration coefficient of
(0.05-0.5) varying
according to precipitation
differences over the study
area
http://pubs.er.usgs.gov/publication/w
ri874056
23
WPR REGION REGIONAL
(R)
SUB-
REGIONAL
(S)
ESTIMATE AUTHOR METHOD LINK
3 Jemez y
Sangre
SR Pojoaque R.
Drainage:
2250 AFY
McAda and
Wasiolek
(1988)
estimates based on
streamflow estimates of
Reiland (1975)
http://pubs.er.usgs.gov/publication/w
ri874056
3 Jemez y
Sangre
SR Mountain
front
recharge in
Sta. F. R.
Basin: 5390
AFY
McAda and
Wasiolek
(1988)
estimates based on
streamflow estimates of
Reiland (1975)
http://pubs.er.usgs.gov/publication/w
ri874056
3 Jemez y
Sangre
SR Mountain
front
recharge in
Pojoaque
Basin: 6080
AFY
McAda and
Wasiolek
(1988)
estimates based on
streamflow estimates of
Reiland (1975)
http://pubs.er.usgs.gov/publication/w
ri874056
3 Jemez y
Sangre
SR Mountain
stream
channel
recharge to
Sta. F. R.
Basin: 5430
AFY
McAda and
Wasiolek
(1988)
estimates based on
streamflow estimates of
Reiland (1975)
http://pubs.er.usgs.gov/publication/w
ri874056
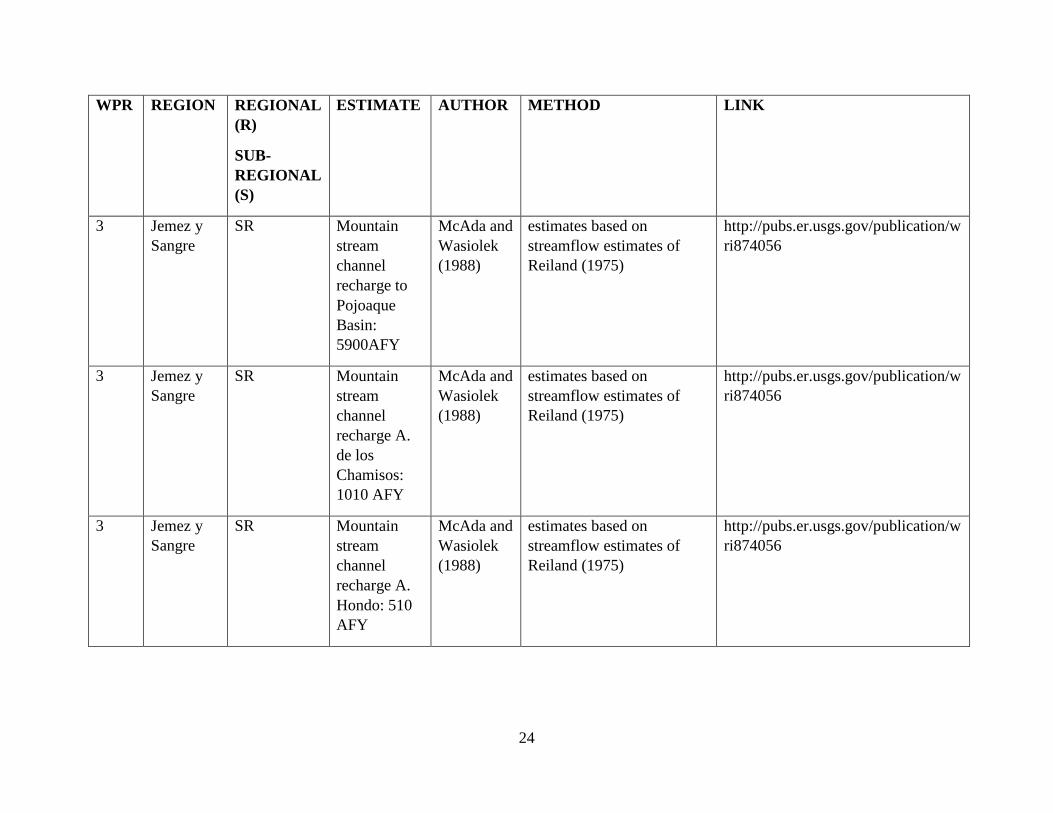
24
WPR REGION REGIONAL
(R)
SUB-
REGIONAL
(S)
ESTIMATE AUTHOR METHOD LINK
3 Jemez y
Sangre
SR Mountain
stream
channel
recharge to
Pojoaque
Basin:
5900AFY
McAda and
Wasiolek
(1988)
estimates based on
streamflow estimates of
Reiland (1975)
http://pubs.er.usgs.gov/publication/w
ri874056
3 Jemez y
Sangre
SR Mountain
stream
channel
recharge A.
de los
Chamisos:
1010 AFY
McAda and
Wasiolek
(1988)
estimates based on
streamflow estimates of
Reiland (1975)
http://pubs.er.usgs.gov/publication/w
ri874056
3 Jemez y
Sangre
SR Mountain
stream
channel
recharge A.
Hondo: 510
AFY
McAda and
Wasiolek
(1988)
estimates based on
streamflow estimates of
Reiland (1975)
http://pubs.er.usgs.gov/publication/w
ri874056
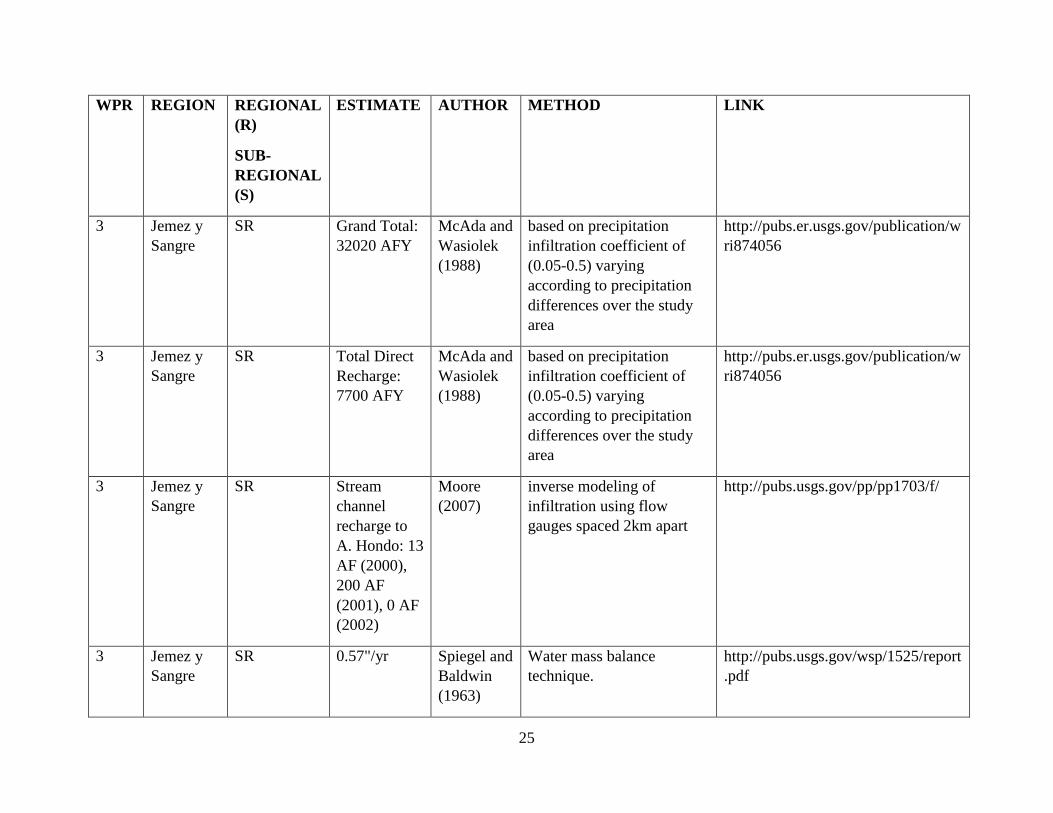
25
WPR REGION REGIONAL
(R)
SUB-
REGIONAL
(S)
ESTIMATE AUTHOR METHOD LINK
3 Jemez y
Sangre
SR Grand Total:
32020 AFY
McAda and
Wasiolek
(1988)
based on precipitation
infiltration coefficient of
(0.05-0.5) varying
according to precipitation
differences over the study
area
http://pubs.er.usgs.gov/publication/w
ri874056
3 Jemez y
Sangre
SR Total Direct
Recharge:
7700 AFY
McAda and
Wasiolek
(1988)
based on precipitation
infiltration coefficient of
(0.05-0.5) varying
according to precipitation
differences over the study
area
http://pubs.er.usgs.gov/publication/w
ri874056
3 Jemez y
Sangre
SR Stream
channel
recharge to
A. Hondo: 13
AF (2000),
200 AF
(2001), 0 AF
(2002)
Moore
(2007)
inverse modeling of
infiltration using flow
gauges spaced 2km apart
http://pubs.usgs.gov/pp/pp1703/f/
3 Jemez y
Sangre
SR 0.57"/yr Spiegel and
Baldwin
(1963)
Water mass balance
technique.
http://pubs.usgs.gov/wsp/1525/report
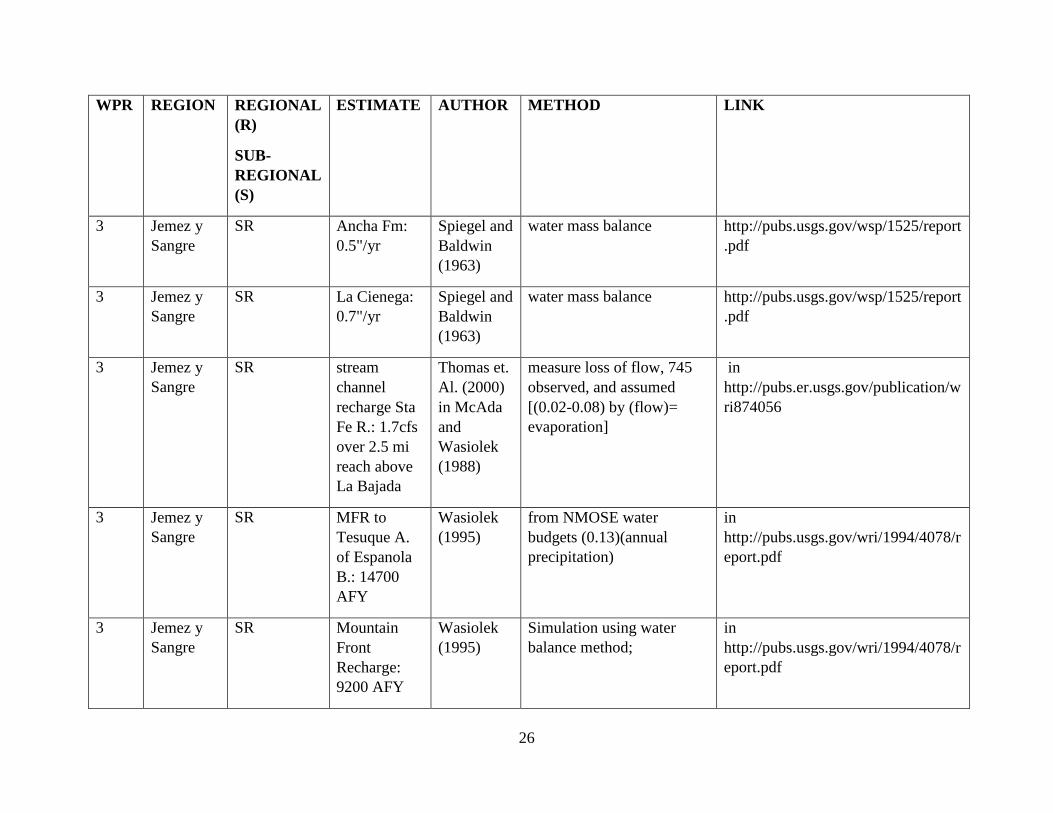
26
WPR REGION REGIONAL
(R)
SUB-
REGIONAL
(S)
ESTIMATE AUTHOR METHOD LINK
3 Jemez y
Sangre
SR Ancha Fm:
0.5"/yr
Spiegel and
Baldwin
(1963)
water mass balance http://pubs.usgs.gov/wsp/1525/report
3 Jemez y
Sangre
SR La Cienega:
0.7"/yr
Spiegel and
Baldwin
(1963)
water mass balance http://pubs.usgs.gov/wsp/1525/report
3 Jemez y
Sangre
SR stream
channel
recharge Sta
Fe R.: 1.7cfs
over 2.5 mi
reach above
La Bajada
Thomas et.
Al. (2000)
in McAda
and
Wasiolek
(1988)
measure loss of flow, 745
observed, and assumed
[(0.02-0.08) by (flow)=
evaporation]
in
http://pubs.er.usgs.gov/publication/w
ri874056
3 Jemez y
Sangre
SR MFR to
Tesuque A.
of Espanola
B.: 14700
AFY
Wasiolek
(1995)
from NMOSE water
budgets (0.13)(annual
precipitation)
in
http://pubs.usgs.gov/wri/1994/4078/r
eport.pdf
3 Jemez y
Sangre
SR Mountain
Front
Recharge:
9200 AFY
Wasiolek
(1995)
Simulation using water
balance method;
in
http://pubs.usgs.gov/wri/1994/4078/r
eport.pdf
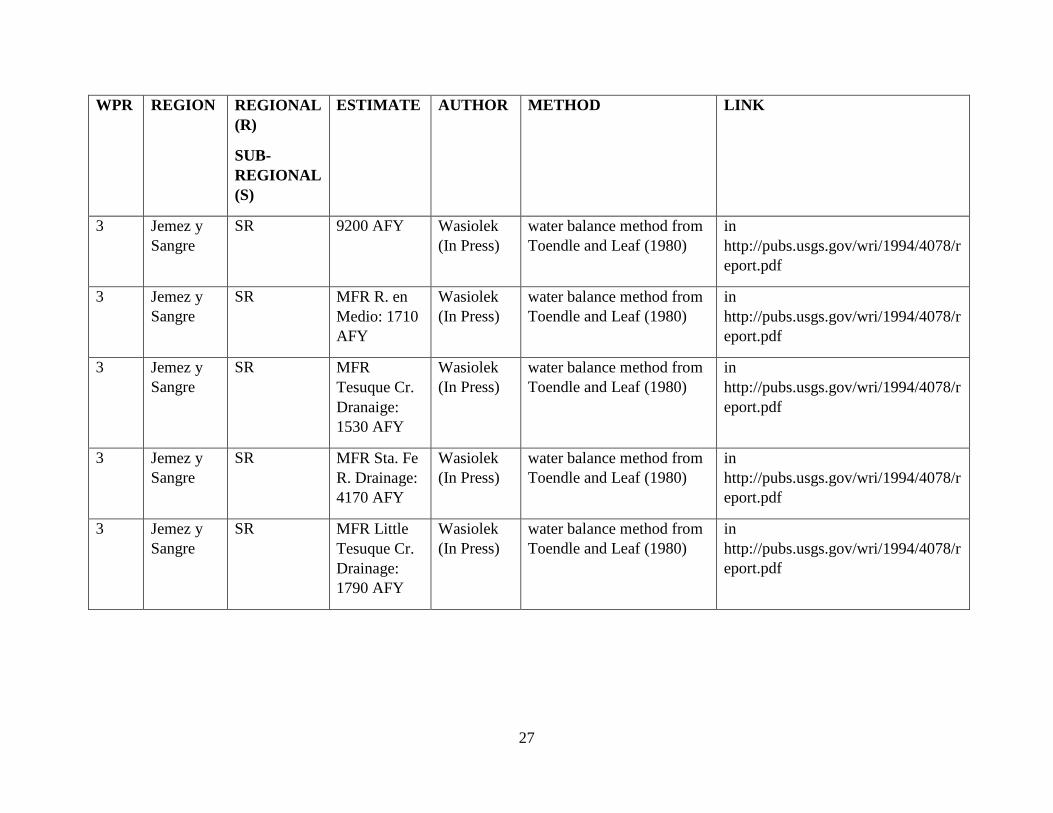
27
WPR REGION REGIONAL
(R)
SUB-
REGIONAL
(S)
ESTIMATE AUTHOR METHOD LINK
3 Jemez y
Sangre
SR 9200 AFY Wasiolek
(In Press)
water balance method from
Toendle and Leaf (1980)
in
http://pubs.usgs.gov/wri/1994/4078/r
eport.pdf
3 Jemez y
Sangre
SR MFR R. en
Medio: 1710
AFY
Wasiolek
(In Press)
water balance method from
Toendle and Leaf (1980)
in
http://pubs.usgs.gov/wri/1994/4078/r
eport.pdf
3 Jemez y
Sangre
SR MFR
Tesuque Cr.
Dranaige:
1530 AFY
Wasiolek
(In Press)
water balance method from
Toendle and Leaf (1980)
in
http://pubs.usgs.gov/wri/1994/4078/r
eport.pdf
3 Jemez y
Sangre
SR MFR Sta. Fe
R. Drainage:
4170 AFY
Wasiolek
(In Press)
water balance method from
Toendle and Leaf (1980)
in
http://pubs.usgs.gov/wri/1994/4078/r
eport.pdf
3 Jemez y
Sangre
SR MFR Little
Tesuque Cr.
Drainage:
1790 AFY
Wasiolek
(In Press)
water balance method from
Toendle and Leaf (1980)
in
http://pubs.usgs.gov/wri/1994/4078/r
eport.pdf
28
WPR REGION REGIONAL
(R)
SUB-
REGIONAL
(S)
ESTIMATE AUTHOR METHOD LINK
4 SW New
Mexico
SR 3932 AFY
Stream
Channel
Reacharge
between
Feywood and
Spaulding
Cuddy and
Keyes
(2011) p. 3
Measurement of flow-loss http://www.ose.state.nm.us/Pub/pub
_reports.php#C
4 SW New
Mexico
R 224000 AFY DBS&A
(2005a)
Sec. 7 p. 8
Precipitation infiltration
coefficient estimate
http://www.ose.state.nm.us/Planning
/RWP/Regions/SouthwestNM/7_Wtr
Budgets.pdf
4 SW New
Mexico
SR 76000 AFY
Upper
Mimbres
Basin from
Mountain
Front
Runoff,
Stream
Infiltration
and
Underflow
Hanson et
al (1994) p.
40
Analysis of mountain-front
runoff (Hearne and Dewey
(1988), infiltration from
streams and springs (flow
loss),and underflow
(bedrock constriction
gauged, Darcy calculation)
http://pubs.er.usgs.gov/publication/w
ri944011
29
WPR REGION REGIONAL
(R)
SUB-
REGIONAL
(S)
ESTIMATE AUTHOR METHOD LINK
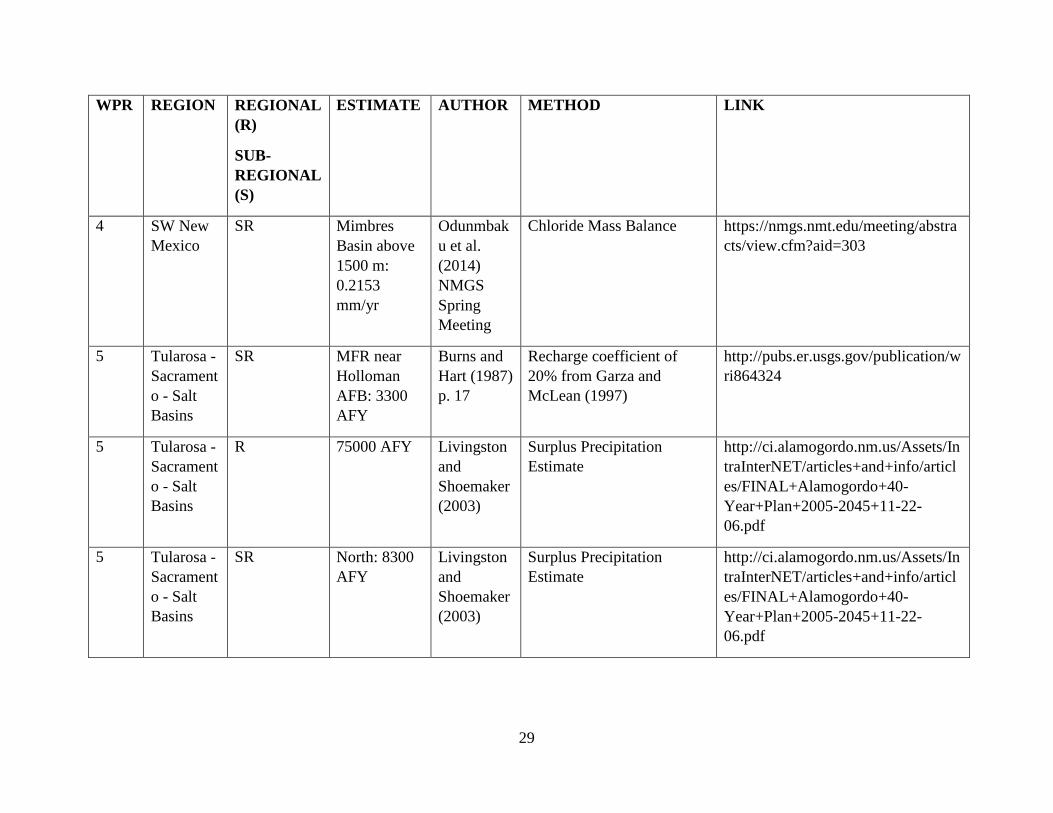
4 SW New
Mexico
SR Mimbres
Basin above
1500 m:
0.2153
mm/yr
Odunmbak
u et al.
(2014)
NMGS
Spring
Meeting
Chloride Mass Balance https://nmgs.nmt.edu/meeting/abstra
cts/view.cfm?aid=303
5 Tularosa -
Sacrament
o - Salt
Basins
SR MFR near
Holloman
AFB: 3300
AFY
Burns and
Hart (1987)
p. 17
Recharge coefficient of
20% from Garza and
McLean (1997)
http://pubs.er.usgs.gov/publication/w
ri864324
5 Tularosa -
Sacrament
o - Salt
Basins
R 75000 AFY Livingston
and
Shoemaker
(2003)
Surplus Precipitation
Estimate
http://ci.alamogordo.nm.us/Assets/In
traInterNET/articles+and+info/articl
es/FINAL+Alamogordo+40-
Year+Plan+2005-2045+11-22-
06.pdf
5 Tularosa -
Sacrament
o - Salt
Basins
SR North: 8300
AFY
Livingston
and
Shoemaker
(2003)
Surplus Precipitation
Estimate
http://ci.alamogordo.nm.us/Assets/In
traInterNET/articles+and+info/articl
es/FINAL+Alamogordo+40-
Year+Plan+2005-2045+11-22-
06.pdf
30
WPR REGION REGIONAL
(R)
SUB-
REGIONAL
(S)
ESTIMATE AUTHOR METHOD LINK
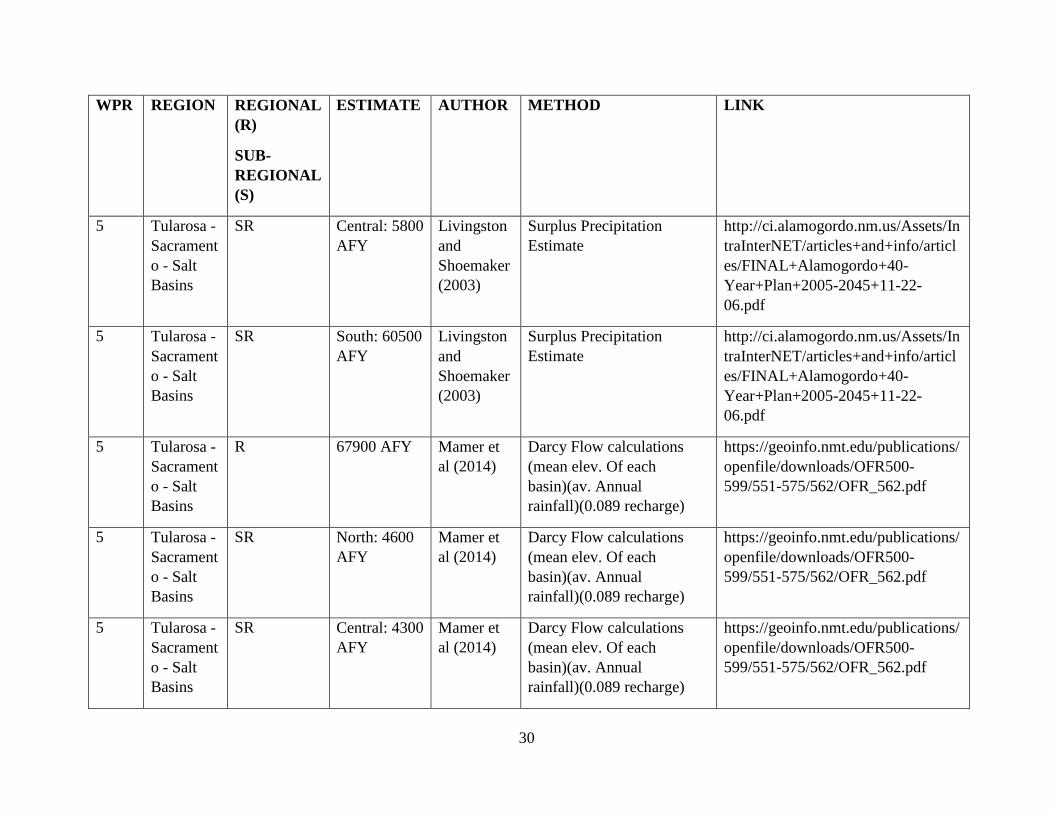
5 Tularosa -
Sacrament
o - Salt
Basins
SR Central: 5800
AFY
Livingston
and
Shoemaker
(2003)
Surplus Precipitation
Estimate
http://ci.alamogordo.nm.us/Assets/In
traInterNET/articles+and+info/articl
es/FINAL+Alamogordo+40-
Year+Plan+2005-2045+11-22-
06.pdf
5 Tularosa -
Sacrament
o - Salt
Basins
SR South: 60500
AFY
Livingston
and
Shoemaker
(2003)
Surplus Precipitation
Estimate
http://ci.alamogordo.nm.us/Assets/In
traInterNET/articles+and+info/articl
es/FINAL+Alamogordo+40-
Year+Plan+2005-2045+11-22-
06.pdf
5 Tularosa -
Sacrament
o - Salt
Basins
R 67900 AFY Mamer et
al (2014)
Darcy Flow calculations
(mean elev. Of each
basin)(av. Annual
rainfall)(0.089 recharge)
https://geoinfo.nmt.edu/publications/
openfile/downloads/OFR500-
599/551-575/562/OFR_562.pdf
5 Tularosa -
Sacrament
o - Salt
Basins
SR North: 4600
AFY
Mamer et
al (2014)
Darcy Flow calculations
(mean elev. Of each
basin)(av. Annual
rainfall)(0.089 recharge)
https://geoinfo.nmt.edu/publications/
openfile/downloads/OFR500-
599/551-575/562/OFR_562.pdf
5 Tularosa -
Sacrament
o - Salt
Basins
SR Central: 4300
AFY
Mamer et
al (2014)
Darcy Flow calculations
(mean elev. Of each
basin)(av. Annual
rainfall)(0.089 recharge)
https://geoinfo.nmt.edu/publications/
openfile/downloads/OFR500-
599/551-575/562/OFR_562.pdf
31
WPR REGION REGIONAL
(R)
SUB-
REGIONAL
(S)
ESTIMATE AUTHOR METHOD LINK
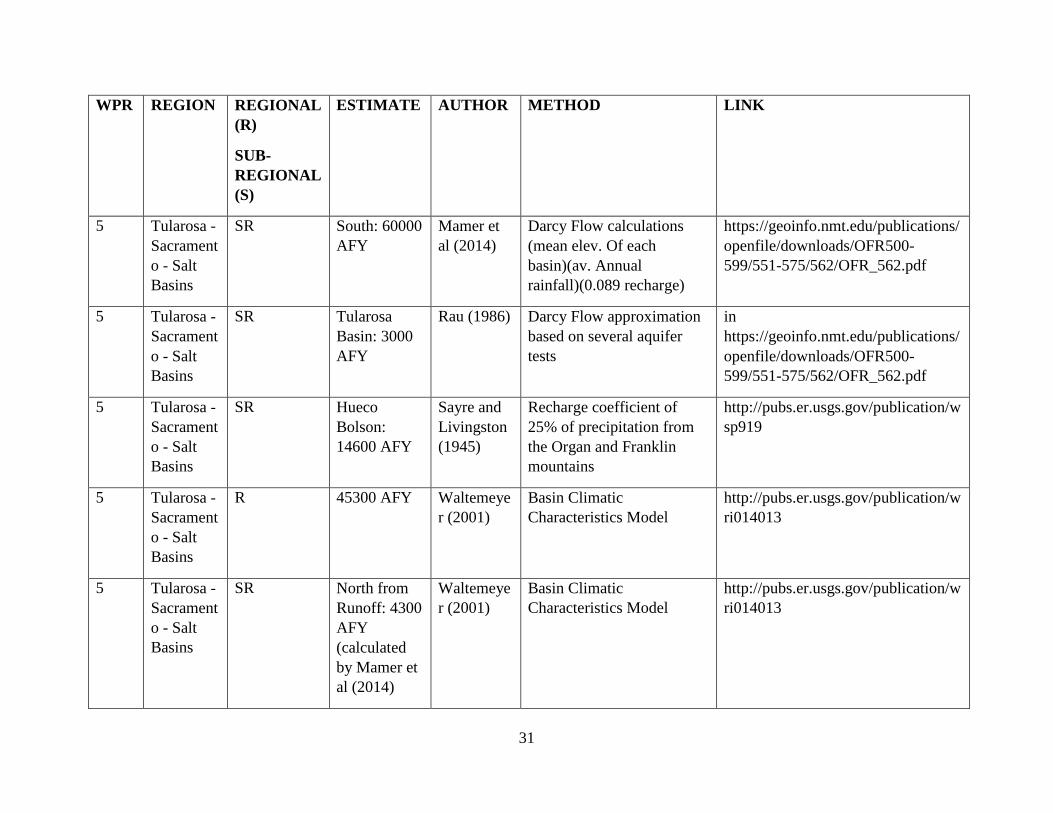
5 Tularosa -
Sacrament
o - Salt
Basins
SR South: 60000
AFY
Mamer et
al (2014)
Darcy Flow calculations
(mean elev. Of each
basin)(av. Annual
rainfall)(0.089 recharge)
https://geoinfo.nmt.edu/publications/
openfile/downloads/OFR500-
599/551-575/562/OFR_562.pdf
5 Tularosa -
Sacrament
o - Salt
Basins
SR Tularosa
Basin: 3000
AFY
Rau (1986) Darcy Flow approximation
based on several aquifer
tests
in
https://geoinfo.nmt.edu/publications/
openfile/downloads/OFR500-
599/551-575/562/OFR_562.pdf
5 Tularosa -
Sacrament
o - Salt
Basins
SR Hueco
Bolson:
14600 AFY
Sayre and
Livingston
(1945)
Recharge coefficient of
25% of precipitation from
the Organ and Franklin
mountains
http://pubs.er.usgs.gov/publication/w
sp919
5 Tularosa -
Sacrament
o - Salt
Basins
R 45300 AFY Waltemeye
r (2001)
Basin Climatic
Characteristics Model
http://pubs.er.usgs.gov/publication/w
ri014013
5 Tularosa -
Sacrament
o - Salt
Basins
SR North from
Runoff: 4300
AFY
(calculated
by Mamer et
al (2014)
Waltemeye
r (2001)
Basin Climatic
Characteristics Model
http://pubs.er.usgs.gov/publication/w
ri014013
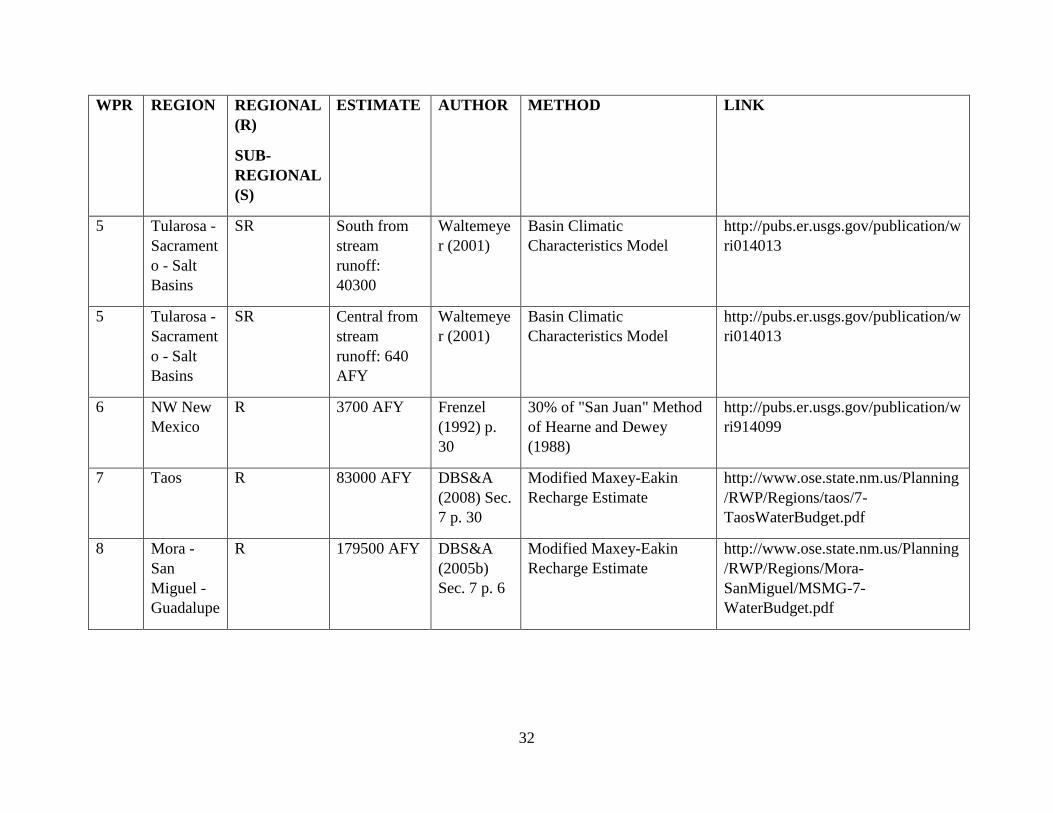
32
WPR REGION REGIONAL
(R)
SUB-
REGIONAL
(S)
ESTIMATE AUTHOR METHOD LINK
5 Tularosa -
Sacrament
o - Salt
Basins
SR South from
stream
runoff:
40300
Waltemeye
r (2001)
Basin Climatic
Characteristics Model
http://pubs.er.usgs.gov/publication/w
ri014013
5 Tularosa -
Sacrament
o - Salt
Basins
SR Central from
stream
runoff: 640
AFY
Waltemeye
r (2001)
Basin Climatic
Characteristics Model
http://pubs.er.usgs.gov/publication/w
ri014013
6 NW New
Mexico
R 3700 AFY Frenzel
(1992) p.
30
30% of "San Juan" Method
of Hearne and Dewey
(1988)
http://pubs.er.usgs.gov/publication/w
ri914099
7 Taos R 83000 AFY DBS&A
(2008) Sec.
7 p. 30
Modified Maxey-Eakin
Recharge Estimate
http://www.ose.state.nm.us/Planning
/RWP/Regions/taos/7-
TaosWaterBudget.pdf
8 Mora -
San
Miguel -
Guadalupe
R 179500 AFY DBS&A
(2005b)
Sec. 7 p. 6
Modified Maxey-Eakin
Recharge Estimate
http://www.ose.state.nm.us/Planning
/RWP/Regions/Mora-
SanMiguel/MSMG-7-
WaterBudget.pdf
33
WPR REGION REGIONAL
(R)
SUB-
REGIONAL
(S)
ESTIMATE AUTHOR METHOD LINK
9 Colfax R 2930 AFY
Mountain
Front
Recharge
DBS&A
(2003a) p.
7-13
Estimated 5% annual
precipitation infiltration
into mountain front areas
http://www.ose.state.nm.us/Planning
/RWP/Regions/colfax/colfax_vol1.p
df
10 Lower
Pecos
Valley
R 142000 AFY Balleau
Groundwat
er, Inc.
(2001) p.
84
Based on water balance http://www.ose.state.nm.us/Planning
/RWP/Regions/pecos/pecos_vol2_re
gplan.pdf
10 Lower
Pecos
Valley
SR Roswell
Artesian
Basin:
165000 AFY
Fiedler and
Nye (1933)
p. 253
Calculation based on total
discharges from wells
http://pubs.er.usgs.gov/publication/w
sp639
10 Lower
Pecos
Valley
SR Pecos Slope
aquifer:
14190-28380
AFY
(infiltration
est)
Newton et
al. (2012)
Calculation based on
estimate of (0.05-0.10%)
precipitation infiltration
https://geoinfo.nmt.edu/publications/
openfile/downloads/OFR500-
599/526-
550/543/OFR543_june12_LR.pdf
34
WPR REGION REGIONAL
(R)
SUB-
REGIONAL
(S)
ESTIMATE AUTHOR METHOD LINK
10 Lower
Pecos
Valley
SR Pecos Slope
aquifer:
43230 AFY
(CMB)
Newton et
al. (2012)
Chloride mass balance
method
https://geoinfo.nmt.edu/publications/
openfile/downloads/OFR500-
599/526-
550/543/OFR543_june12_LR.pdf
10 Lower
Pecos
Valley
SR Pecos Slope
aquifer:
43230 AFY
(CMB)
Newton et
al. (2012)
Chloride mass balance
method
https://geoinfo.nmt.edu/publications/
openfile/downloads/OFR500-
599/526-
550/543/OFR543_june12_LR.pdf
10 Lower
Pecos
Valley
SR Pecos Slope
aquifer:
14190-28380
AFY
(infiltration
est)
Newton et
al. (2012)
Calculation based on
estimate of (0.05-0.10%)
precipitation infiltration
https://geoinfo.nmt.edu/publications/
openfile/downloads/OFR500-
599/526-
550/543/OFR543_june12_LR.pdf
10 Lower
Pecos
Valley
SR Central
Roswell
Basin
Carbonate
Aquifer:
124000 AFY
Rehfelt and
Gross
(1982)
Numerical Simulation http://www.wrri.nmsu.edu/publish/te
chrpt/abstracts/abs142.html
35
WPR REGION REGIONAL
(R)
SUB-
REGIONAL
(S)
ESTIMATE AUTHOR METHOD LINK
10 Lower
Pecos
Valley
SR Pecos Basin:
67000 AFY
Risser
(1987)
Base flow plus evaporation
losses
http://pubs.er.usgs.gov/usgspubs/wri/
wri854291
10 Lower
Pecos
Valley
SR Pecos R. D.
from R.
Hondo to
Dayton:
40000 AFY
Theis
(1937)
Water Budget Method http://adsabs.harvard.edu/abs/1937Tr
AGU..18..564T
10 Lower
Pecos
Valley
SR Pecos R. D.
from R.
Hondo to
Dayton:
40000 AFY
Theis
(1937)
Water Budget Method http://adsabs.harvard.edu/abs/1937Tr
AGU..18..564T
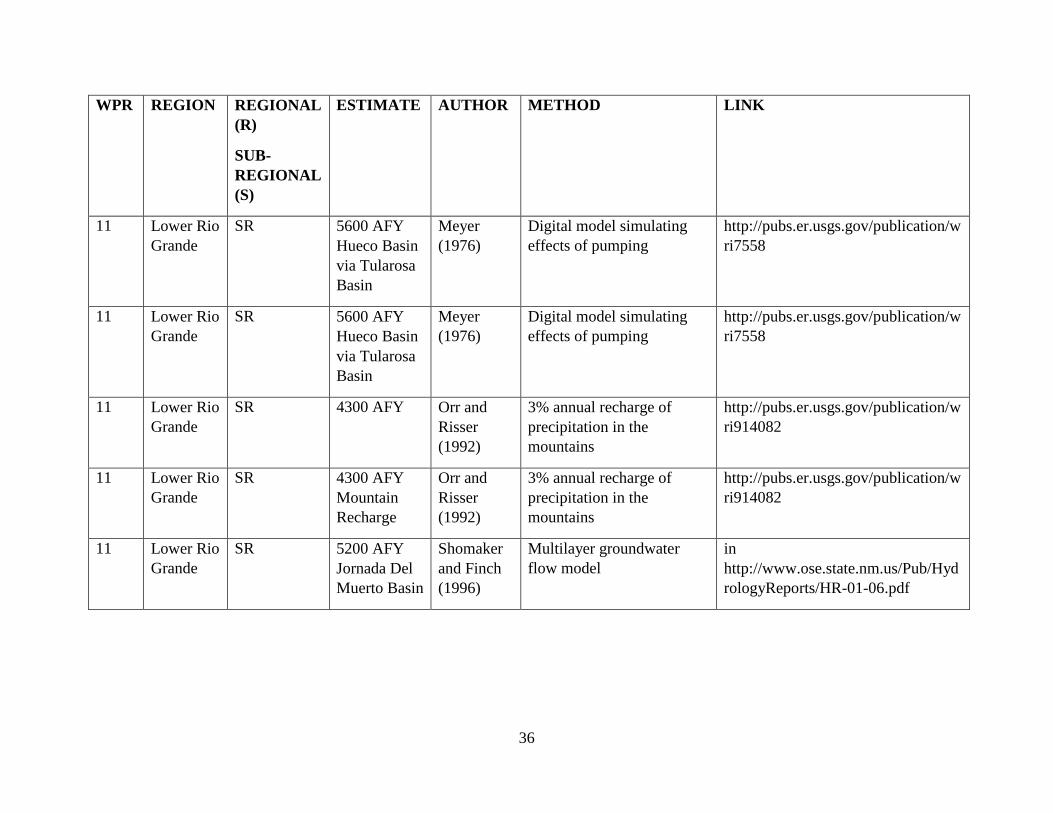
11 Lower Rio
Grande
SR 11100 AFY
Mountain
Front
Recharge
Mesilla
Basin
Frenzel et
al (1992) p.
22
Water budget analysis http://pubs.er.usgs.gov/publication/p
p1407C
36
WPR REGION REGIONAL
(R)
SUB-
REGIONAL
(S)
ESTIMATE AUTHOR METHOD LINK
11 Lower Rio
Grande
SR 5600 AFY
Hueco Basin
via Tularosa
Basin
Meyer
(1976)
Digital model simulating
effects of pumping
http://pubs.er.usgs.gov/publication/w
ri7558
11 Lower Rio
Grande
SR 5600 AFY
Hueco Basin
via Tularosa
Basin
Meyer
(1976)
Digital model simulating
effects of pumping
http://pubs.er.usgs.gov/publication/w
ri7558
11 Lower Rio
Grande
SR 4300 AFY Orr and
Risser
(1992)
3% annual recharge of
precipitation in the
mountains
http://pubs.er.usgs.gov/publication/w
ri914082
11 Lower Rio
Grande
SR 4300 AFY
Mountain
Recharge
Orr and
Risser
(1992)
3% annual recharge of
precipitation in the
mountains
http://pubs.er.usgs.gov/publication/w
ri914082
11 Lower Rio
Grande
SR 5200 AFY
Jornada Del
Muerto Basin
Shomaker
and Finch
(1996)
Multilayer groundwater
flow model
in
http://www.ose.state.nm.us/Pub/Hyd
rologyReports/HR-01-06.pdf
37
WPR REGION REGIONAL
(R)
SUB-
REGIONAL
(S)
ESTIMATE AUTHOR METHOD LINK
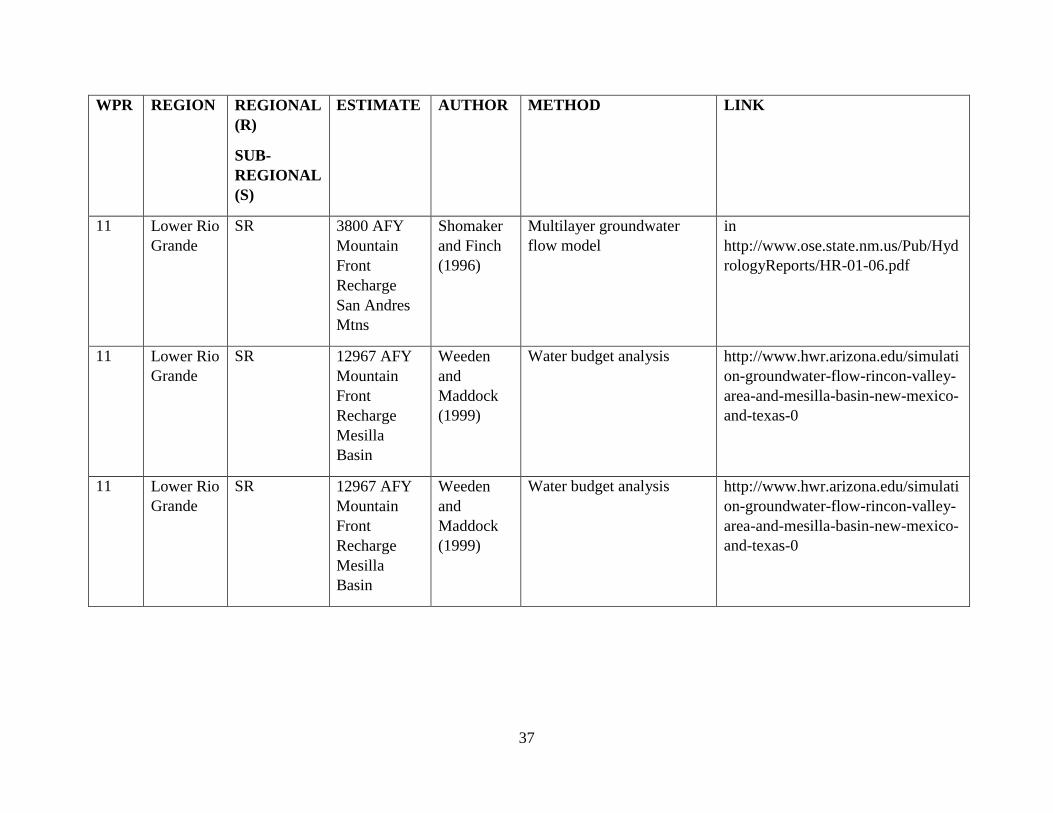
11 Lower Rio
Grande
SR 3800 AFY
Mountain
Front
Recharge
San Andres
Mtns
Shomaker
and Finch
(1996)
Multilayer groundwater
flow model
in
http://www.ose.state.nm.us/Pub/Hyd
rologyReports/HR-01-06.pdf
11 Lower Rio
Grande
SR 12967 AFY
Mountain
Front
Recharge
Mesilla
Basin
Weeden
and
Maddock
(1999)
Water budget analysis http://www.hwr.arizona.edu/simulati
on-groundwater-flow-rincon-valley-
area-and-mesilla-basin-new-mexico-
and-texas-0
11 Lower Rio
Grande
SR 12967 AFY
Mountain
Front
Recharge
Mesilla
Basin
Weeden
and
Maddock
(1999)
Water budget analysis http://www.hwr.arizona.edu/simulati
on-groundwater-flow-rincon-valley-
area-and-mesilla-basin-new-mexico-
and-texas-0
38
WPR REGION REGIONAL
(R)
SUB-
REGIONAL
(S)
ESTIMATE AUTHOR METHOD LINK
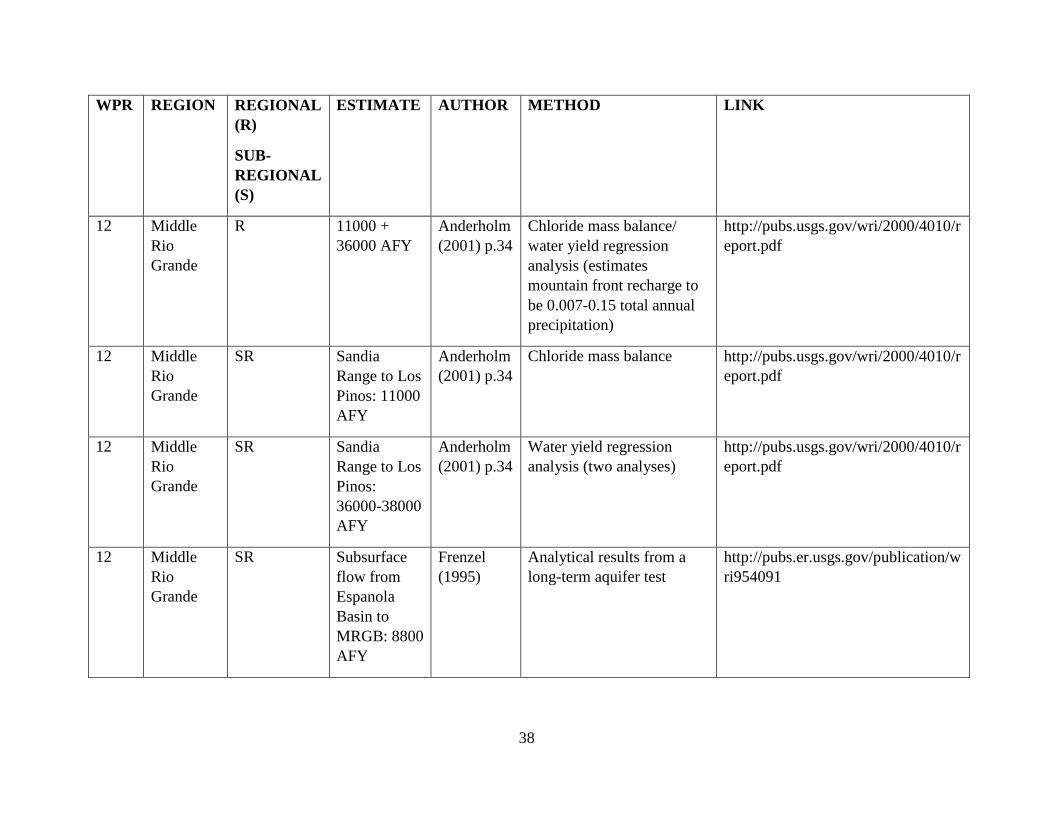
12 Middle
Rio
Grande
R 11000 +
36000 AFY
Anderholm
(2001) p.34
Chloride mass balance/
water yield regression
analysis (estimates
mountain front recharge to
be 0.007-0.15 total annual
precipitation)
http://pubs.usgs.gov/wri/2000/4010/r
eport.pdf
12 Middle
Rio
Grande
SR Sandia
Range to Los
Pinos: 11000
AFY
Anderholm
(2001) p.34
Chloride mass balance http://pubs.usgs.gov/wri/2000/4010/r
eport.pdf
12 Middle
Rio
Grande
SR Sandia
Range to Los
Pinos:
36000-38000
AFY
Anderholm
(2001) p.34
Water yield regression
analysis (two analyses)
http://pubs.usgs.gov/wri/2000/4010/r
eport.pdf
12 Middle
Rio
Grande
SR Subsurface
flow from
Espanola
Basin to
MRGB: 8800
AFY
Frenzel
(1995)
Analytical results from a
long-term aquifer test
http://pubs.er.usgs.gov/publication/w
ri954091
39
WPR REGION REGIONAL
(R)
SUB-
REGIONAL
(S)
ESTIMATE AUTHOR METHOD LINK
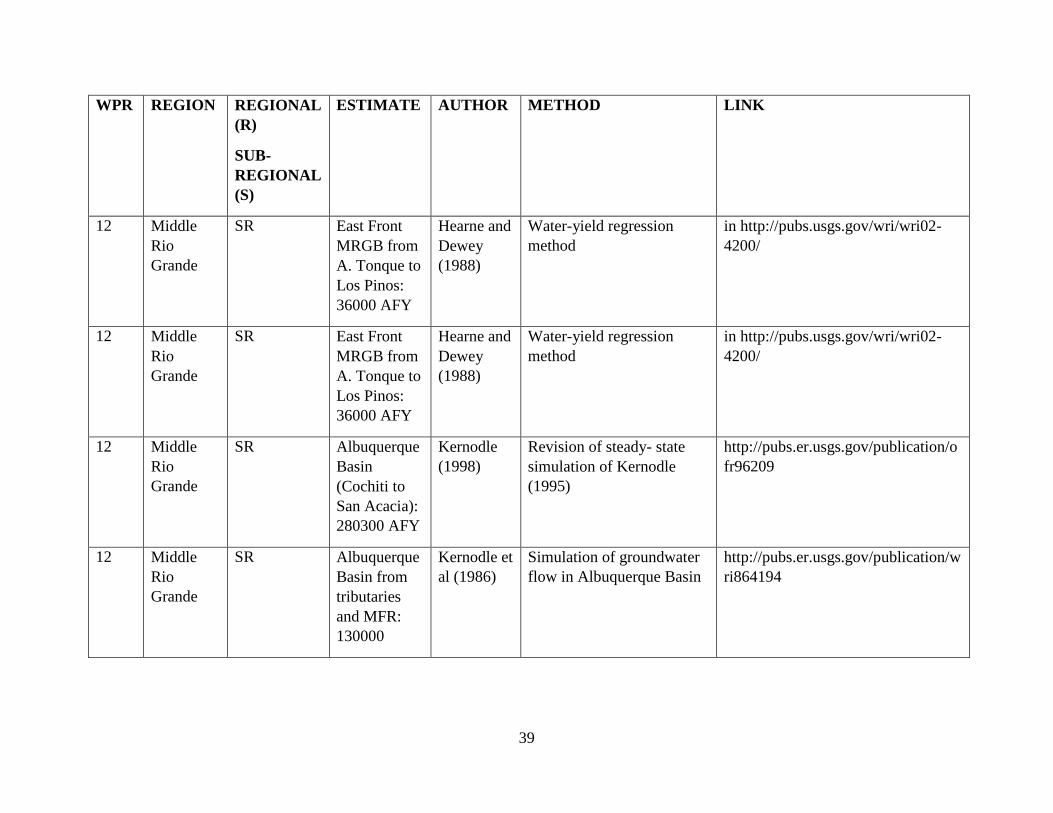
12 Middle
Rio
Grande
SR East Front
MRGB from
A. Tonque to
Los Pinos:
36000 AFY
Hearne and
Dewey
(1988)
Water-yield regression
method
in http://pubs.usgs.gov/wri/wri02-
4200/
12 Middle
Rio
Grande
SR East Front
MRGB from
A. Tonque to
Los Pinos:
36000 AFY
Hearne and
Dewey
(1988)
Water-yield regression
method
in http://pubs.usgs.gov/wri/wri02-
4200/
12 Middle
Rio
Grande
SR Albuquerque
Basin
(Cochiti to
San Acacia):
280300 AFY
Kernodle
(1998)
Revision of steady- state
simulation of Kernodle
(1995)
http://pubs.er.usgs.gov/publication/o
fr96209
12 Middle
Rio
Grande
SR Albuquerque
Basin from
tributaries
and MFR:
130000
Kernodle et
al (1986)
Simulation of groundwater
flow in Albuquerque Basin
http://pubs.er.usgs.gov/publication/w
ri864194
40
WPR REGION REGIONAL
(R)
SUB-
REGIONAL
(S)
ESTIMATE AUTHOR METHOD LINK
12 Middle
Rio
Grande
R 110000 AFY
(RWP 3+12)
Kernodle,
McAda,
Thorne
(1995)
Simulation of groundwater
flow in Albuquerque Basin
http://pubs.usgs.gov/wri/1994/4251/r
eport.pdf
12 Middle
Rio
Grande
SR A. Tonque to
Los Pinos:
72000 AFY
Kernodle,
McAda,
Thorne
(1995)
Simulation of groundwater
flow in Albuquerque Basin
http://pubs.usgs.gov/wri/1994/4251/r
eport.pdf
12 Middle
Rio
Grande
SR Jemez R.
North of R.
Salado:
12800 AFY
Kernodle,
McAda,
Thorne
(1995)
Simulation of groundwater
flow in Albuquerque Basin
http://pubs.usgs.gov/wri/1994/4251/r
eport.pdf
12 Middle
Rio
Grande
SR Abo Arroyo:
1300 AFY
Nimmo et
al. (2001)
in McAda
and Barroll
(2002)
Darcian Steady-State
Centrifugal Method
in http://pubs.usgs.gov/wri/wri02-
4200/
12 Middle
Rio
Grande
R 61400 AFY Plummer et
al. (2004)
simulations using
MODFLOW, MODPATH,
and UCODE
in
http://riogrande.nmt.edu/outside/cour
ses/hyd558/downloads/Set_19_SedB
asins/CaseStudy-
Middle_Rio_Gran.pdf
41
WPR REGION REGIONAL
(R)
SUB-
REGIONAL
(S)
ESTIMATE AUTHOR METHOD LINK
12 Middle
Rio
Grande
SR R. Puerco:
3600 AFY
Plummer et
al. (2004)
simulations using
MODFLOW, MODPATH,
and UCODE
in
http://riogrande.nmt.edu/outside/cour
ses/hyd558/downloads/Set_19_SedB
asins/CaseStudy-
Middle_Rio_Gran.pdf
12 Middle
Rio
Grande
SR Abo A.:1000
AFY
Plummer et
al. (2004)
simulations using
MODFLOW, MODPATH,
and UCODE
in
http://riogrande.nmt.edu/outside/cour
ses/hyd558/downloads/Set_19_SedB
asins/CaseStudy-
Middle_Rio_Gran.pdf
12 Middle
Rio
Grande
SR R. Jemez:
260 AFY
Plummer et
al. (2004)
simulations using
MODFLOW, MODPATH,
and UCODE
in
http://riogrande.nmt.edu/outside/cour
ses/hyd558/downloads/Set_19_SedB
asins/CaseStudy-
Middle_Rio_Gran.pdf
12 Middle
Rio
Grande
SR Eastern
Mountain-
Front
Recharge:
8400 AFY
Plummer et
al. (2004)
simulations using
MODFLOW, MODPATH,
and UCODE
in
http://riogrande.nmt.edu/outside/cour
ses/hyd558/downloads/Set_19_SedB
asins/CaseStudy-
Middle_Rio_Gran.pdf
42
WPR REGION REGIONAL
(R)
SUB-
REGIONAL
(S)
ESTIMATE AUTHOR METHOD LINK
12 Middle
Rio
Grande
SR Abo Arroy
stream
channel
recharge:
650-17000
AFY
Stewart-
Deaker et
al (2007)
Analytical results from a
long-term aquifer test
in
http://riogrande.nmt.edu/outside/cour
ses/hyd558/downloads/Set_19_SedB
asins/CaseStudy-
Middle_Rio_Gran.pdf
12 Middle
Rio
Grande
R 139000 AFY Thorn et al.
(1993)
Analytical results from a
long-term aquifer test
http://www.ose.state.nm.us/water-
info/NMWaterPlanning/regions/Mid
dleRioGrande/History/HH-Changes-
March2004Version.pdf
12 Middle
Rio
Grande
SR Mountain-
front
recharge +
tributary
stream
channel
recharge:
139000 AFY
Thorn et al.
(1993)
Analytical results from a
long-term aquifer test
http://www.ose.state.nm.us/water-
info/NMWaterPlanning/regions/Mid
dleRioGrande/History/HH-Changes-
March2004Version.pdf
12 Middle
Rio
Grande
R 90000 AFY Tiedeman
et al.
(1998) in
Kernodle et
al (1995)
Non-linear regression
modeling applied to flow
estimates of Kernodel et al
(1995)
in
http://pubs.usgs.gov/wri/1994/4251/r
eport.pdf
43
WPR REGION REGIONAL
(R)
SUB-
REGIONAL
(S)
ESTIMATE AUTHOR METHOD LINK
12 Middle
Rio
Grande
SR East Front
MRGB from
A. Tonque to
Los Pinos:
36000-49000
AFY
Tiedeman
et al.
(1998) in
Kernodle et
al (1995)
Non-linear regression
modeling applied to flow
estimates of Kernodel et al
(1995)
in
http://pubs.usgs.gov/wri/1994/4251/r
eport.pdf
13 Estancia
Basin
R 37000 AFY Corbin
Consulting
(1999) p E-
3
Water level data analysis http://www.ose.state.nm.us/Planning
/RWP/Regions/estancia/Estancia-
Plan-book1.pdf
14 Rio
Chama
R 124390 AFY La
Calandria
Associates,
Inc. (1995)
Based on Waltemeyer and
Kernodle (1992) (Correlates
recharge with infiltration
coefficient and winter
precipitation)
http://www.ose.state.nm.us/Planning
/RWP/Regions/RioArriba/6-Water-
Budget.pdf
15 Socorro -
Sierra
R 196917 AFY DBS&A
(2003b)
App. F3 p.
2
Modified Maxey-Eakin
Recharge Estimate
http://www.ose.state.nm.us/Planning
/RWP/Regions/Socorro-
Sierra/Volume-2/Appendix-F3.pdf
44
WPR REGION REGIONAL
(R)
SUB-
REGIONAL
(S)
ESTIMATE AUTHOR METHOD LINK
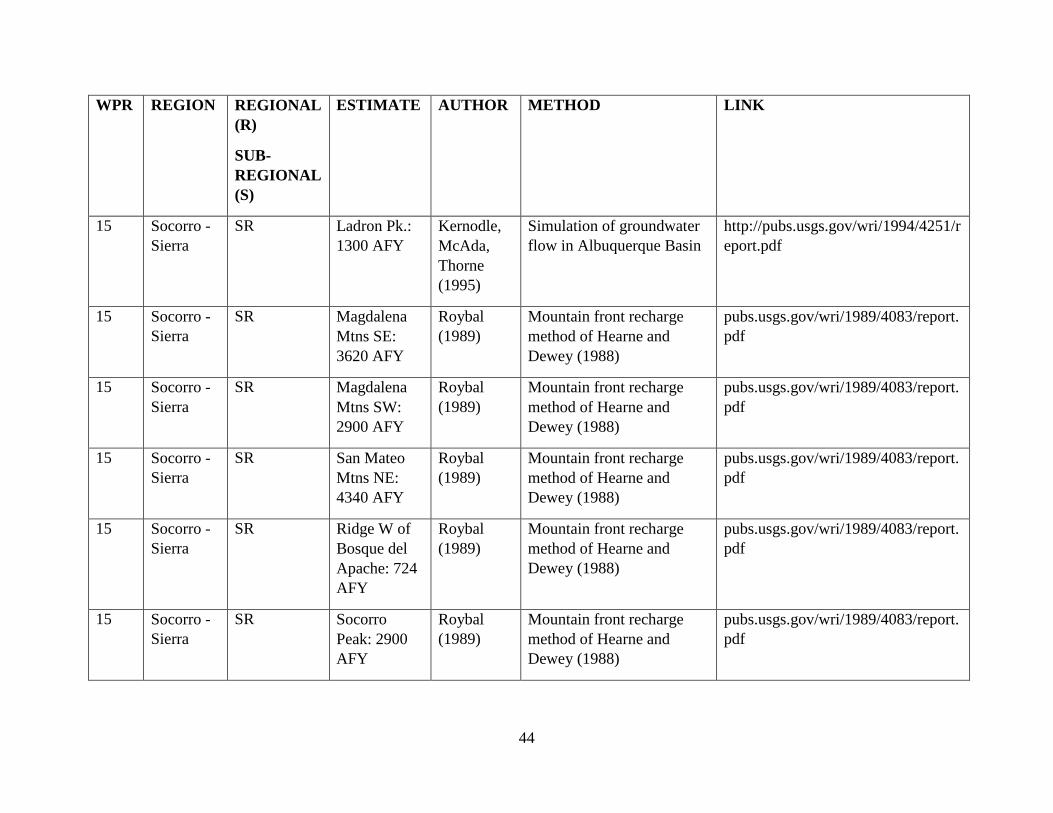
15 Socorro -
Sierra
SR Ladron Pk.:
1300 AFY
Kernodle,
McAda,
Thorne
(1995)
Simulation of groundwater
flow in Albuquerque Basin
http://pubs.usgs.gov/wri/1994/4251/r
eport.pdf
15 Socorro -
Sierra
SR Magdalena
Mtns SE:
3620 AFY
Roybal
(1989)
Mountain front recharge
method of Hearne and
Dewey (1988)
pubs.usgs.gov/wri/1989/4083/report.
15 Socorro -
Sierra
SR Magdalena
Mtns SW:
2900 AFY
Roybal
(1989)
Mountain front recharge
method of Hearne and
Dewey (1988)
pubs.usgs.gov/wri/1989/4083/report.
15 Socorro -
Sierra
SR San Mateo
Mtns NE:
4340 AFY
Roybal
(1989)
Mountain front recharge
method of Hearne and
Dewey (1988)
pubs.usgs.gov/wri/1989/4083/report.
15 Socorro -
Sierra
SR Ridge W of
Bosque del
Apache: 724
AFY
Roybal
(1989)
Mountain front recharge
method of Hearne and
Dewey (1988)
pubs.usgs.gov/wri/1989/4083/report.
15 Socorro -
Sierra
SR Socorro
Peak: 2900
AFY
Roybal
(1989)
Mountain front recharge
method of Hearne and
Dewey (1988)
pubs.usgs.gov/wri/1989/4083/report.
45
WPR REGION REGIONAL
(R)
SUB-
REGIONAL
(S)
ESTIMATE AUTHOR METHOD LINK
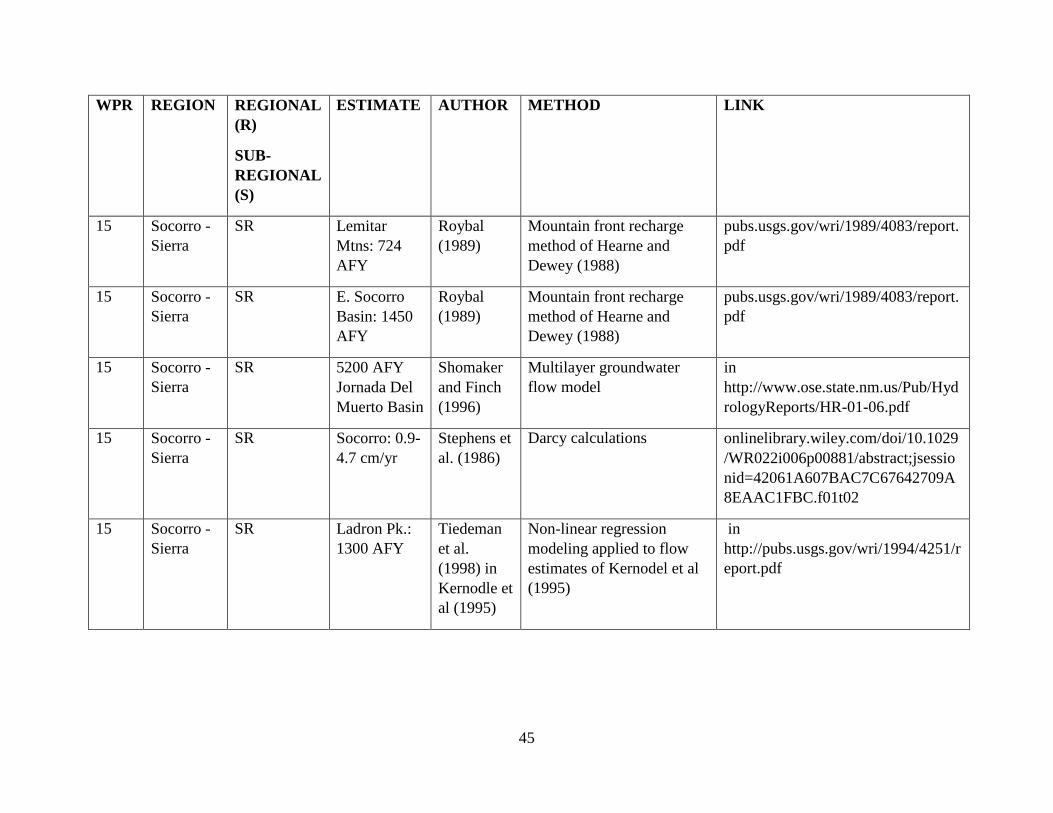
15 Socorro -
Sierra
SR Lemitar
Mtns: 724
AFY
Roybal
(1989)
Mountain front recharge
method of Hearne and
Dewey (1988)
pubs.usgs.gov/wri/1989/4083/report.
15 Socorro -
Sierra
SR E. Socorro
Basin: 1450
AFY
Roybal
(1989)
Mountain front recharge
method of Hearne and
Dewey (1988)
pubs.usgs.gov/wri/1989/4083/report.
15 Socorro -
Sierra
SR 5200 AFY
Jornada Del
Muerto Basin
Shomaker
and Finch
(1996)
Multilayer groundwater
flow model
in
http://www.ose.state.nm.us/Pub/Hyd
rologyReports/HR-01-06.pdf
15 Socorro -
Sierra
SR Socorro: 0.9-
4.7 cm/yr
Stephens et
al. (1986)
Darcy calculations onlinelibrary.wiley.com/doi/10.1029
/WR022i006p00881/abstract;jsessio
nid=42061A607BAC7C67642709A
8EAAC1FBC.f01t02
15 Socorro -
Sierra
SR Ladron Pk.:
1300 AFY
Tiedeman
et al.
(1998) in
Kernodle et
al (1995)
Non-linear regression
modeling applied to flow
estimates of Kernodel et al
(1995)
in
http://pubs.usgs.gov/wri/1994/4251/r
eport.pdf
46
WPR REGION REGIONAL
(R)
SUB-
REGIONAL
(S)
ESTIMATE AUTHOR METHOD LINK
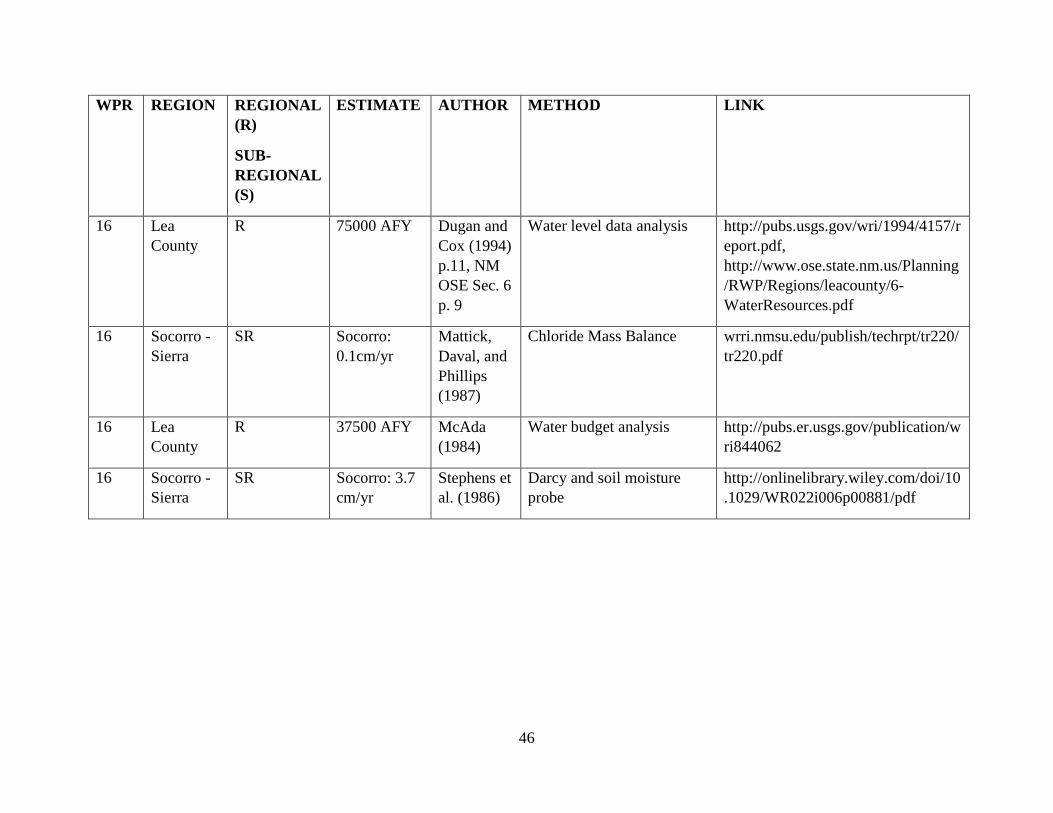
16 Lea
County
R 75000 AFY Dugan and
Cox (1994)
p.11, NM
OSE Sec. 6
p. 9
Water level data analysis http://pubs.usgs.gov/wri/1994/4157/r
eport.pdf,
http://www.ose.state.nm.us/Planning
/RWP/Regions/leacounty/6-
WaterResources.pdf
16 Socorro -
Sierra
SR Socorro:
0.1cm/yr
Mattick,
Daval, and
Phillips
(1987)
Chloride Mass Balance wrri.nmsu.edu/publish/techrpt/tr220/
tr220.pdf
16 Lea
County
R 37500 AFY McAda
(1984)
Water budget analysis http://pubs.er.usgs.gov/publication/w
ri844062
16 Socorro -
Sierra
SR Socorro: 3.7
cm/yr
Stephens et
al. (1986)
Darcy and soil moisture
probe
http://onlinelibrary.wiley.com/doi/10
.1029/WR022i006p00881/pdf
47
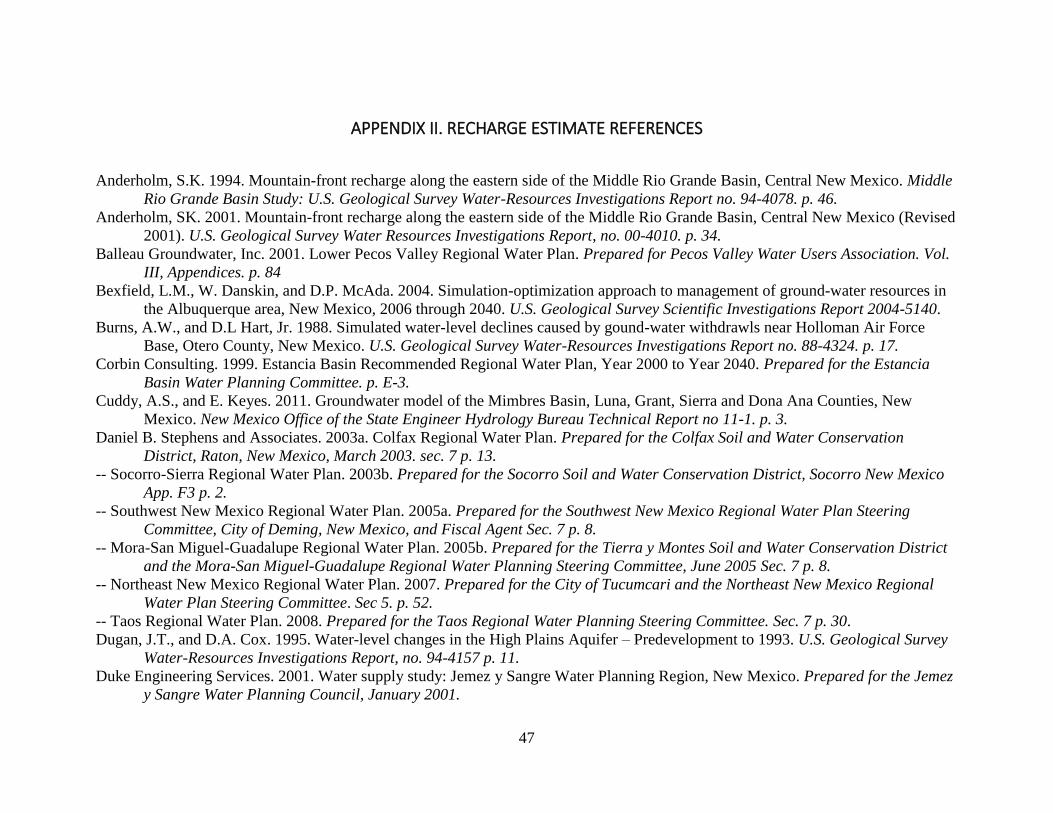
APPENDIX II. RECHARGE ESTIMATE REFERENCES
Anderholm, S.K. 1994. Mountain-front recharge along the eastern side of the Middle Rio Grande Basin, Central New Mexico. Middle
Rio Grande Basin Study: U.S. Geological Survey Water-Resources Investigations Report no. 94-4078. p. 46.
Anderholm, SK. 2001. Mountain-front recharge along the eastern side of the Middle Rio Grande Basin, Central New Mexico (Revised
2001). U.S. Geological Survey Water Resources Investigations Report, no. 00-4010. p. 34.
Balleau Groundwater, Inc. 2001. Lower Pecos Valley Regional Water Plan. Prepared for Pecos Valley Water Users Association. Vol.
III, Appendices. p. 84
Bexfield, L.M., W. Danskin, and D.P. McAda. 2004. Simulation-optimization approach to management of ground-water resources in
the Albuquerque area, New Mexico, 2006 through 2040. U.S. Geological Survey Scientific Investigations Report 2004-5140.
Burns, A.W., and D.L Hart, Jr. 1988. Simulated water-level declines caused by gound-water withdrawls near Holloman Air Force
Base, Otero County, New Mexico. U.S. Geological Survey Water-Resources Investigations Report no. 88-4324. p. 17.
Corbin Consulting. 1999. Estancia Basin Recommended Regional Water Plan, Year 2000 to Year 2040. Prepared for the Estancia
Basin Water Planning Committee. p. E-3.
Cuddy, A.S., and E. Keyes. 2011. Groundwater model of the Mimbres Basin, Luna, Grant, Sierra and Dona Ana Counties, New
Mexico. New Mexico Office of the State Engineer Hydrology Bureau Technical Report no 11-1. p. 3.
Daniel B. Stephens and Associates. 2003a. Colfax Regional Water Plan. Prepared for the Colfax Soil and Water Conservation
District, Raton, New Mexico, March 2003. sec. 7 p. 13.
-- Socorro-Sierra Regional Water Plan. 2003b. Prepared for the Socorro Soil and Water Conservation District, Socorro New Mexico
App. F3 p. 2.
-- Southwest New Mexico Regional Water Plan. 2005a. Prepared for the Southwest New Mexico Regional Water Plan Steering
Committee, City of Deming, New Mexico, and Fiscal Agent Sec. 7 p. 8.
-- Mora-San Miguel-Guadalupe Regional Water Plan. 2005b. Prepared for the Tierra y Montes Soil and Water Conservation District
and the Mora-San Miguel-Guadalupe Regional Water Planning Steering Committee, June 2005 Sec. 7 p. 8.
-- Northeast New Mexico Regional Water Plan. 2007. Prepared for the City of Tucumcari and the Northeast New Mexico Regional
Water Plan Steering Committee. Sec 5. p. 52.
-- Taos Regional Water Plan. 2008. Prepared for the Taos Regional Water Planning Steering Committee. Sec. 7 p. 30.
Dugan, J.T., and D.A. Cox. 1995. Water-level changes in the High Plains Aquifer – Predevelopment to 1993. U.S. Geological Survey
Water-Resources Investigations Report, no. 94-4157 p. 11.
Duke Engineering Services. 2001. Water supply study: Jemez y Sangre Water Planning Region, New Mexico. Prepared for the Jemez
y Sangre Water Planning Council, January 2001.
48
Fiedler, A.G., and S.S. Nye. 1933. Geology and ground-water resources of the Roswell Artesian Basin, New Mexico. U.S. Geological
Survey Water Supply Paper no. 639. p. 253.
Frenzel, P. F., C. A. Kaehler, and S. K. Anderholm. 1992. Geohydrology and simulation of ground-water flow in the Mesilla Basin,
Dona Ana County, New Mexico, and El Paso County, Texas, with a section on water quality and geochemistry. U.S.
Geological Survey Professional Paper 1407-C.
Frenzel, P.F. 1995. Geohydrology and simulation of ground-water flow near Los Alamos, North-Central New Mexico. U.S.
Geological Survey Water-Resources Investigations Report, no. 95-4091.
-- 1983. Simulated changes in ground-water levels related to proposed development of federal coal leases, San Juan basin New
Mexico. U.S. Geological Survey Open-File Report: 83-949.
-- 1992. Simulation of Ground-water flow in the San Andres-Glorieta Aquifer in the Acoma Embayment and Eastern Zuni Uplift,
West-Central New Mexico. U.S. Geological Survey Water-Resources Investigations Report, no. 91-4099, p. 30.
Garza, S. and J.S. McLean. 1977. Freshwater resources in the southeastern part of the Tularosa Basin. New Mexico State Engineer
Technical Report no. 40.
Hanson, R. T.; McLean, J. S.; Miller, R. S. 1994. Hydrogeologic framework and preliminary simulation of ground-water flow in the
Mimbres Basin, Southwestern New Mexico. U.S. Geological Survey Water-Resources Investigations Report 94-4011 p. 40.
Hearne, Glenn A. 1985. Mathematical model of the Tesuque Aquifer System near Pojoaque, New Mexico. U.S. Geological Survey
Water Supply Paper 2205. p. 25.
Hearne, Glenn A, and Dewey, J.D. 1988. Hydrologic analysis of the Rio Grande Basin North of Embudo, New Mexico; Colorado, and
New Mexico. U.S. Geological Survey Scientific Investigations Report 86-4113.
Kernodle, J. M., Miller, R. S., and Scott, W.B. 1986. Three-dimensional model simulation of transient ground-water flow in the
Albuquerque-Belen Basin, New Mexico. U.S. Geological Survey Water-Resources Investigations Report 86-4194.
Kernodle, J.M., D.P. McAda, and C.R. Thorn. 1995. Simulation of ground-water flow in the Albuquerque Basin, Central New
Mexico, 1901-1994, with projections to 2020. U.S. Geological Survey Water-resources investigations report 94-4251.
Kernodle, J.M. 1996. Hydrogeology and steady-state simulation of ground-water flow in the San Juan Basin, New Mexico, Colorado,
Arizona, and Utah. U.S. Geological Survey Water-Resources Investigations Report. 95-4187.
-- 1998. Simulation of ground-water flow in the Albuquerque Basin, Central New Mexico, 1901-05, with Projections to 2020. U.S.
Geological Survey Water-Resources Investigations Report. 94-4251.
La Calandria Associates, Inc. 1995. Rio Chama Regional Water Plan. Prepared for Rio Chama Acequias Association, Rio Arriba
County.
Lee Wilson and Associates. 1978. Santa Fe County Water Plan, Santa Fe County, New Mexico. p. 162.
John Schomaker and Associates, Inc. and Livingston and Associates, P.C. 2003. City of Alamogordo 40-Year Water Supply
Plan. Prepared for the City of Alamogordo, New Mexico.
49
Mamer, E.A., B.T. Newton, D.J. Koning, S.S. Timmons, and S.A. Kelley. 2014. Northeastern Tularosa Basin Regional Hydrogeology
Study, New Mexico, Final Technical Report. Prepared for Otero Soil and Water Conservation District. New Mexico Bureau of
Geology and Mineral resources Open-file Report no. 562.
Mattick, J.L., T.A. Duval, and F.M. Phillips. 1987. Quantification of Groundwater Recharge Rates in New Mexico Using Bomb 36Cl,
Bomb 3H, and Chloride as Soil-Water Tracers. New Mexico Water Resources Research Institute, Technical Completion
Report No. 220, New Mexico State University, Las Cruces, NM.
McAda, D.P. 1984. Projected water-level declines in the Ogallala Aquifer in Lea County, New Mexico. U.S. Geological Survey
Water-Resources Investigations Report 83-4013.
McAda, D.P. and P. Barroll. 2002. Simulation of ground-water flow in the Middle Rio Grande between Cochiti and San Acacia, New
Mexico. U.S. Geological Survey Water-Resources Investigations Report no. 02-4200.
McAda, D.P., and M. Wasiolek. 1988. Simulation of the Regional Geohydrology of the Tesuque Aquifer System near Santa Fe, New
Mexico. U.S. Geological Survey Water-Resources Investigations Report 87-4056.
Moore, S.J. 2007. Streamflow, infiltration, and recharge in Arroyo Hondo, New Mexico: U.S. Geological Survey Professional Paper
1703.
Newton, B.T., G.C. Rawling, S.S. Timmons, L. Land, P.S. Johnson, T.J. Kludt, and J.M. Timmons. 2012. Sacramento Mountains
Hydrogeology Study. Prepared for Otero Soil and Water Conservation District. New Mexico Bureau of Geology and Mineral
Resources, Open-file Report no. 543.
Nimmo, J.R., A.M. Lewis, and K.A. Winfield. 2001. Discernable large- and small-scale features affecting recharge in Abo Arroyo and
similar basins. In U.S. Geological Survey Middle Rio Grande Basin Study, Proceedings of the 4th Annual Workshop,
Albuquerque, New Mexico. U.S. Geological Survey Open-File Report no. 00-488.
Odunmbaku, A.A., J. Walton, R. Aldouri, and T. Gill. 2014. Estimating recharge in the Mimbres Basin using environmental tracer
isotopes and GIS. In Proceedings of the New Mexico Geological Society Spring Meeting. April 11, 2014.
Orr, B.R., and D.W. Risser. 1992. Geohydrology and potential effects of development of freshwater resources in the northern part of
the Hueco Bolson, Dona Ana and Otero Counties, New Mexico, and El Paso County, Texas. U.S. Geological Survey Water-
Resources Investigations Report 91-4082.
Plummer, L.N., W.E. Sanford, L.M. Bexfield, S.K. Anderholm, and E. Busenberg. 2004. Using geochemical data and aquifer
simulation to characterize recharge and groundwater flow in the Middle Rio Grande Basin, New Mexico. In Groundwater
Recharge in a Desert Environment: The Southwestern United States, Water Science and Application 9: 185-216.
Rau, B. 1986. Ground-water resources in the Carrizozo Area, New Mexico. In New Mexico Geological Society Guidebook, 37th Field
Conference, Truth or Consequences. p. 315.
Rehfeldt, K.R., and G.W. Gross. 1982. Carbonate Aquifer of the Central Roswell Basin: Recharge Estimation by Numerical
Modeling. New Mexico Water Resources Research Institute, Technical Completion Report No. 113. New Mexico State
University, Las Cruces, NM.
50
Reiland, LJ. 1975. Estimated mean-monthly and annual runoff at selected sites in the Pojoaque River drainage basin, Santa Fe County,
New Mexico. U.S. Geological Survey Open-file Report no. 74-150.
Risser, D. W. 1987. Possible changes in ground-water flow to the Pecos River caused by Santa Rosa Lake, Guadalupe County, New
Mexico. U.S. Geological Survey Water-Resources Investigations Report 85-4291.
Roybal, E. 1989. Ground-water resources of Socorro County, New Mexico. U.S. Geological Survey Water-Resources Investigations
Report 89-4083.
Sanford, W.E., Plummer, L.N., McAda, D.P., Bexfield, L.M., Anderholm, S.K. 2004. Use of environmental tracers to estimate
parameters for a predevelopment gound-water-flow model of the Middle Rio Grande Basin, New Mexico. U.S. Geological
Survey Water-Resources Investigations Report no. 03-4286.
Sayre, A.N., and P.P. Livingston. 1945. Ground-water resources of the El Paso area, Texas. U.S. Geological Survey Water-Supply
Paper no. 919.
Scanlon, B.R. 1991. Evaluation of moisture flux from chloride data in desert soils. Journal of Hydrology, 128: 137-156.
Shomaker, J.W., and S.T. Finch. 1996. Multilayer ground-water flow model of Southern Jornada del Muerto basin. Dona Ana County,
New Mexico, and predicted effects of pumping wells LRG-430-S-29 and S-30. Report prepared for the City of Las Cruces,
May 1996.
Spiegel, Z., and B. Baldwin. 1963. Geology and water resources of the Santa Fe area, New Mexico. U.S. Geological Survey Water-
Supply Paper no. 1525.
Stephens, D.B. and R. Knowlton, Jr. 1986. Soil water movement and recharge through sand at a semiarid site in New Mexico. Water
Resources Research, 22: 881-889.
Stone, W.J., and B.E. McGurk. 1985. Ground-water recharge on the Southern High Plains, East-Central New Mexico. New Mexico
Geological Society Guidebook, 36th Field Conference, Santa Rosa NM: pp. 331-35.
Stone, W.J. 1990. Natural recharge of the Ogallala aquifer through playas and other non-stream-channel setting, eastern New Mexico.
In: Gustavson, T.C., eds., Geologic framework and regional hydrology: upper Cenozoic Blackwater Draw and Ogallala
Formations, Great Plains. University of Texas, Austin, Bureau of Economic Geology., pp. 180-192.
Theis, C.V. 1937. Amount of ground-water recharge in the southern High Plains. Transactions, American Geophysical Union v. 18
(1937): pp. 564-68.
Thorn, C.R., D.P. McAda, and J.M. Kernodle. 1993. Geohydrologic framework and hydrologic conditions in the Albuquerque Basin,
Central New Mexico. U.S. Geological Survey Water-Resources Investigations Report no. 93-4149. Appendix C-1.
Troendle, C.A. and C.F. Lear. 1980. Hydrology, In: An approach to water resources evaluation of non-point silvicultural sources. U.S.
Environmental Protection Agency Report EPA-600/8-80-012; chap. 3.
Waltemeyer, S.D. 2001. Estimates of mountain-front streamflow available for potential recharge to the Tularosa Basin, New Mexico.
U.S. Geological Survey Water-Resources Investigations Report no. 2001-4013.
51
Wasiolek, M. 1995. Subsurface recharge to the Tesuque Aquifer system from selected drainage basins along the western side of the
Sangre de Cristo Mountains near Santa Fe, New Mexico. U.S. Geological Survey Water-Resources Investigations Report no.
94-4072.
Wasiolek, M. In Press. Subsurface recharge to the western side of the Sangre de Cristo Mountains near Santa Fe, New Mexico. U.S.
Geological Survey Water-Resources Investigations Report no. 94-4072.
Weeden, A.C., Jr., and T. Maddock. 1999. Simulation of groundwater flow in the Rincon Valley area and Mesilla Basin, New Mexico
and Texas. Master’s Thesis, Univ. of Arizona.