Embed Size (px)
Citation preview
ECONorthwest)'3231-'7�����*-2%2')�����40%22-2+
Michael Wilkerson, Ph.D.November 16, 2021
House Economic Recovery and Prosperity Committee
Statewide Economic Development Programs: Overview and Policy Implications
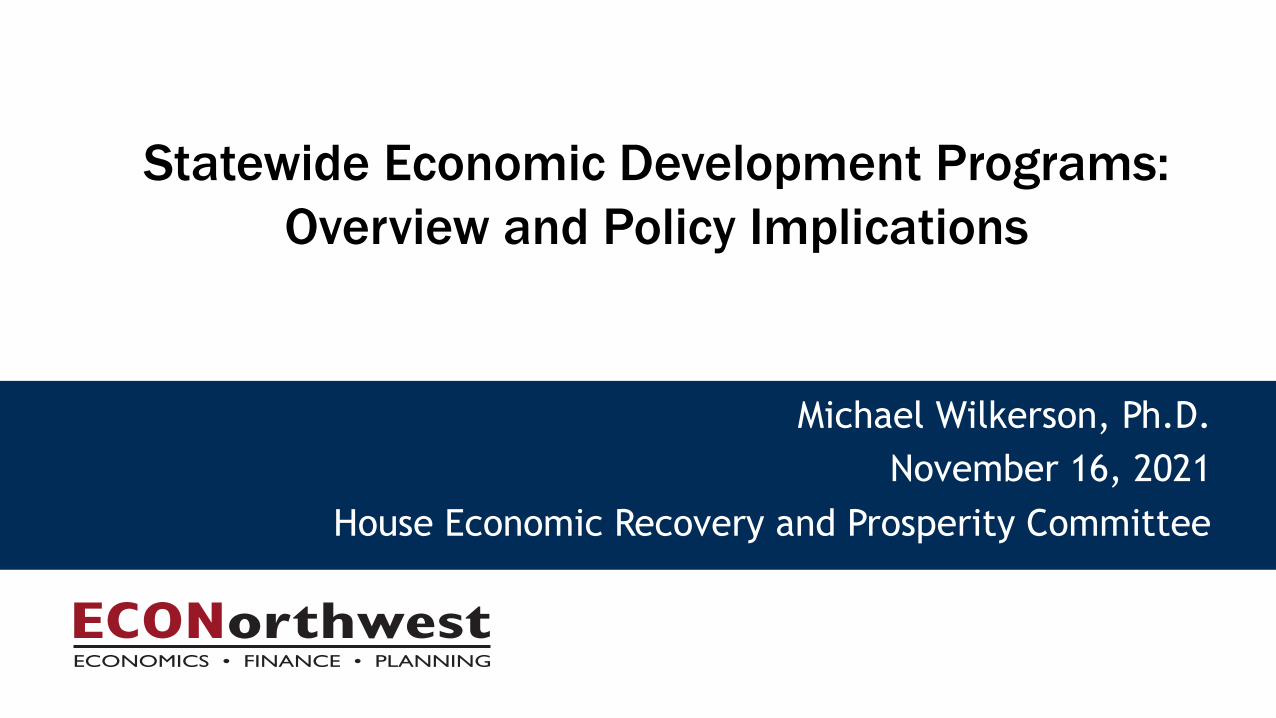
Oregon has limited set of statewide economic development tools
•Enterprise Zones (the most used program)•3-5 year• Long-term rural
•Strategic Investment Program (SIP)•Oregon Investment Advantage•Governor’s Strategic Reserve Fund•Business Expansion Program
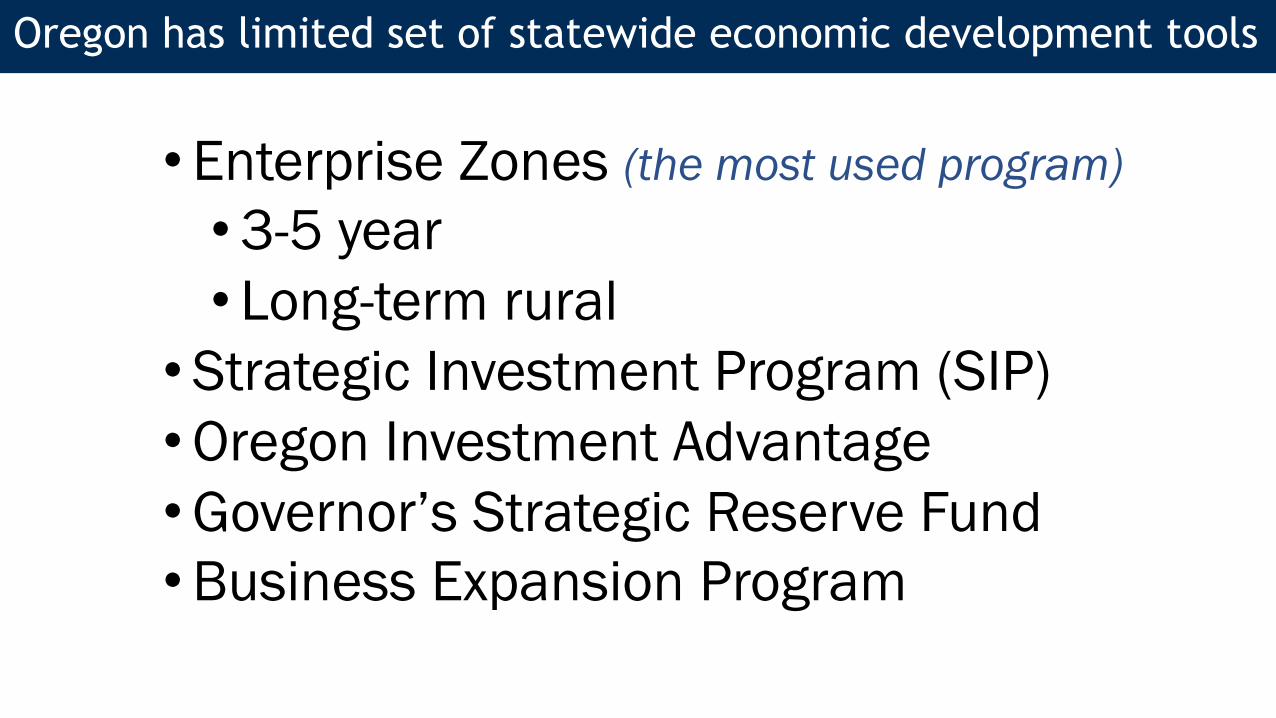
Oregon has a lot of company in the application of EZ
Source: Lincoln Institute of Land Policy, https://www.lincolninst.edu/sites/default/files/pubfiles/rethinking-property-tax-incentives-for-business-full_0.pdf
Number of States with Economic Development Incentive Programs
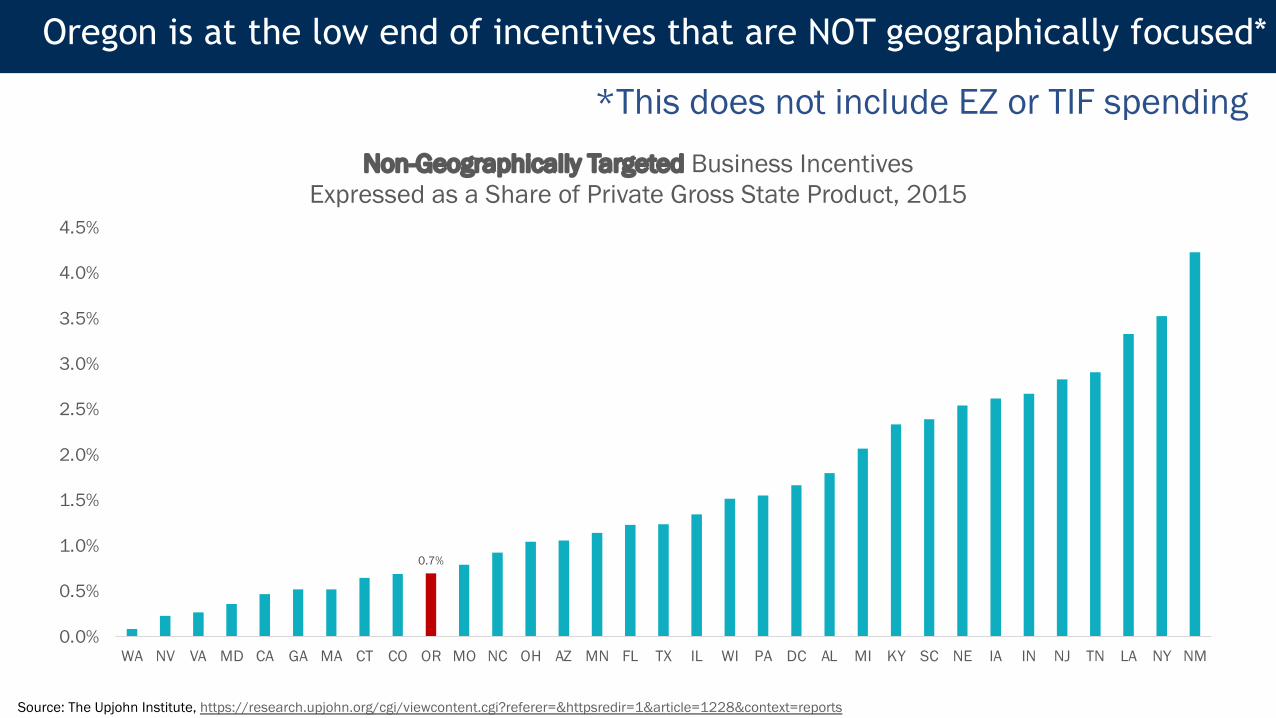
Oregon is at the low end of incentives that are NOT geographically focused*
0.7%
0.0%
0.5%
1.0%
1.5%
2.0%
2.5%
3.0%
3.5%
4.0%
4.5%
WA NV VA MD CA GA MA CT CO OR MO NC OH AZ MN FL TX IL WI PA DC AL MI KY SC NE IA IN NJ TN LA NY NM
Non-Geographically Targeted Business Incentives Expressed as a Share of Private Gross State Product, 2015
*This does not include EZ or TIF spending
Source: The Upjohn Institute, https://research.upjohn.org/cgi/viewcontent.cgi?referer=&httpsredir=1&article=1228&context=reports
Enterprise zone tax abatement value and use
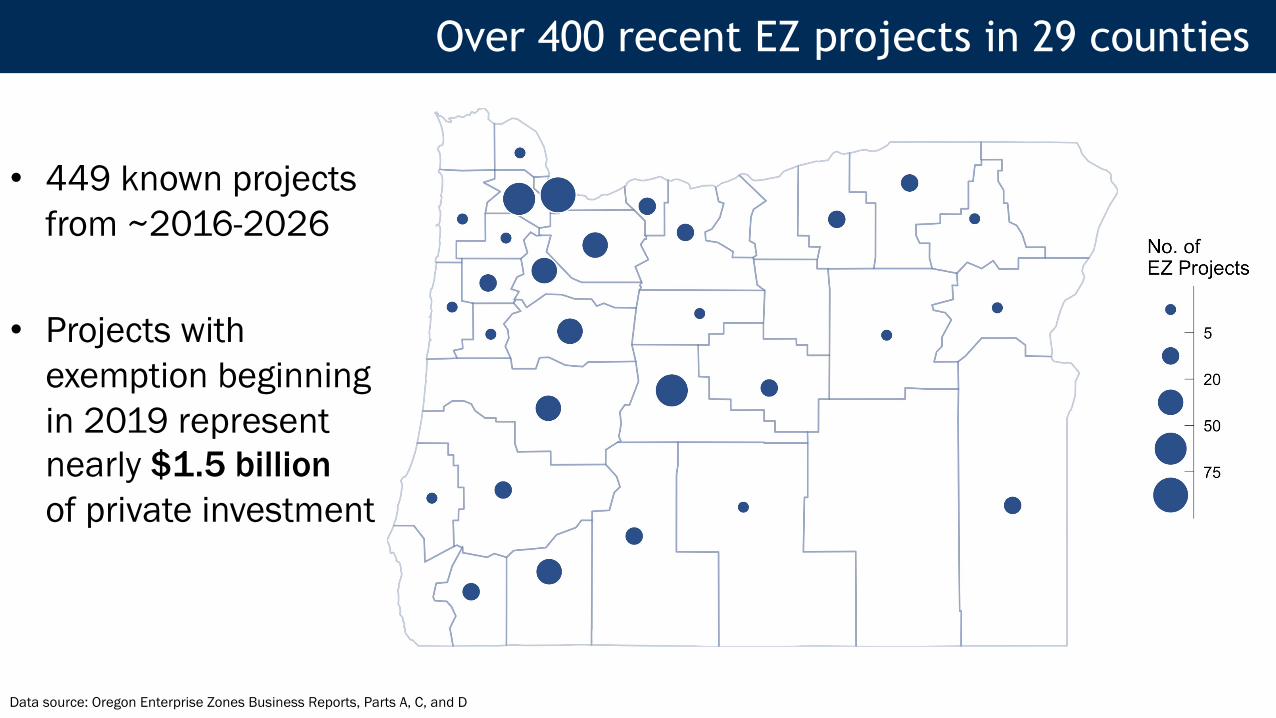
Over 400 recent EZ projects in 29 counties
Data source: Oregon Enterprise Zones Business Reports, Parts A, C, and D
• 449 known projects from ~2016-2026
• Projects with exemption beginning in 2019 represent nearly $1.5 billion of private investment
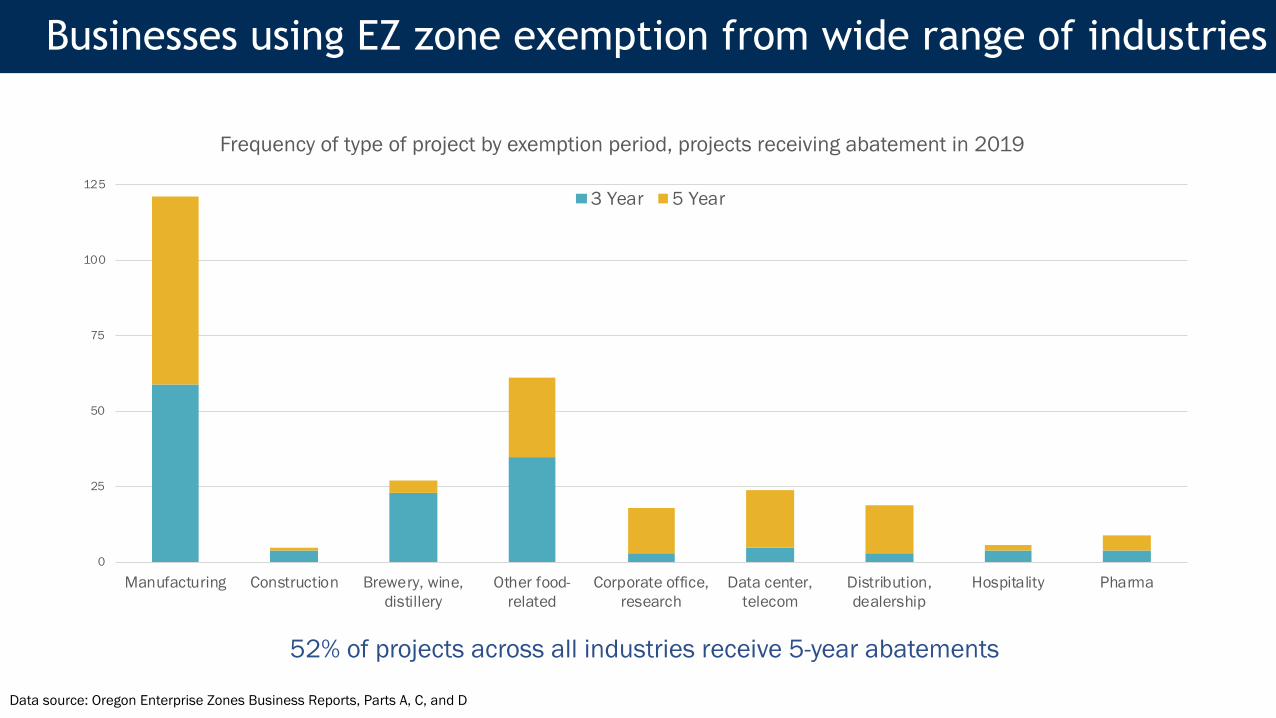
Businesses using EZ zone exemption from wide range of industries
Data source: Oregon Enterprise Zones Business Reports, Parts A, C, and D
0
25
50
75
100
125
Manufacturing Construction Brewery, wine,distillery
Other food-related
Corporate office,research
Data center,telecom
Distribution,dealership
Hospitality Pharma
Frequency of type of project by exemption period, projects receiving abatement in 2019
3 Year 5 Year
52% of projects across all industries receive 5-year abatements
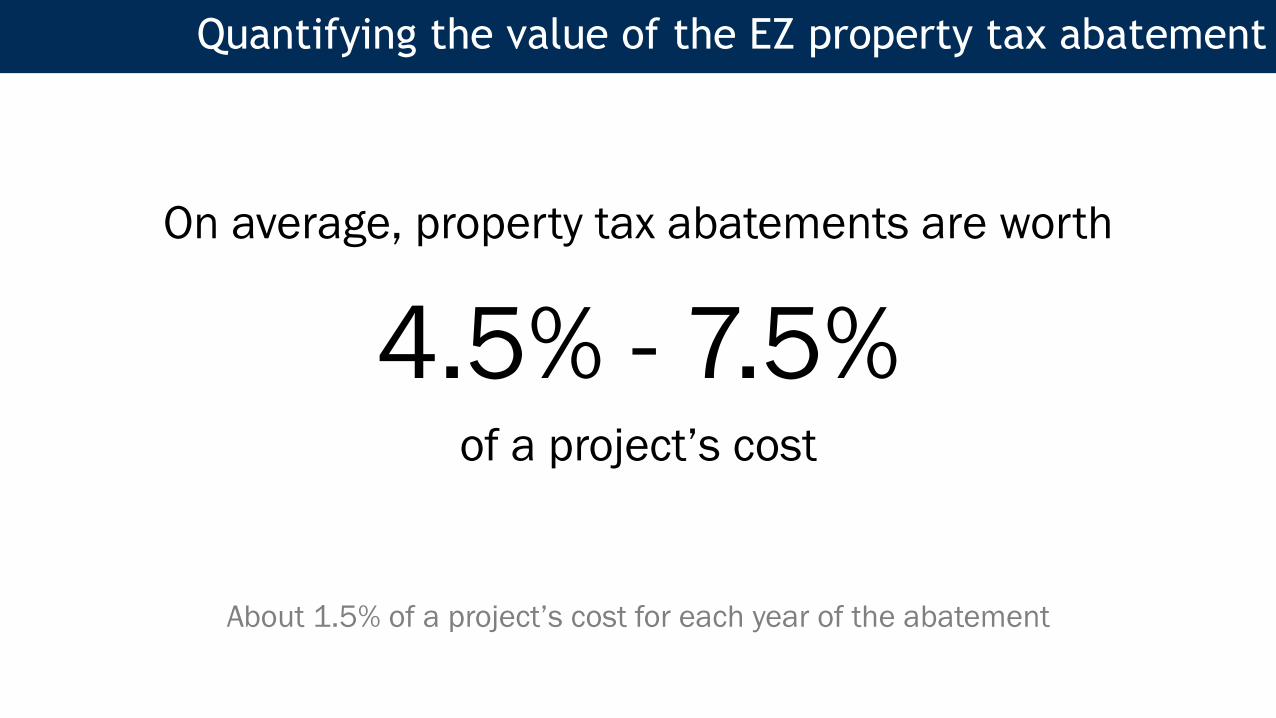
On average, property tax abatements are worth
4.5% - 7.5% of a project’s cost
About 1.5% of a project’s cost for each year of the abatement
Quantifying the value of the EZ property tax abatement
How could a policy change impact E-Zones
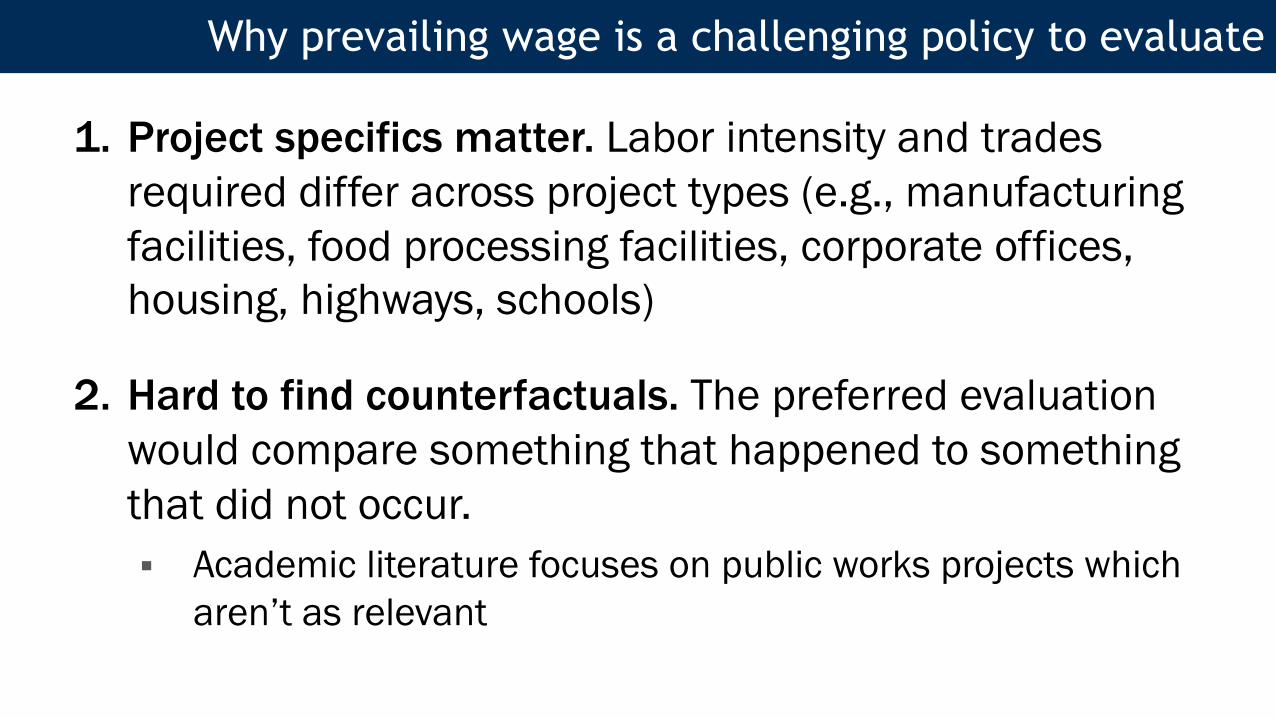
1. Project specifics matter. Labor intensity and trades required differ across project types (e.g., manufacturing facilities, food processing facilities, corporate offices, housing, highways, schools)
2. Hard to find counterfactuals. The preferred evaluation would compare something that happened to something that did not occur. § Academic literature focuses on public works projects which
aren’t as relevant
Why prevailing wage is a challenging policy to evaluate
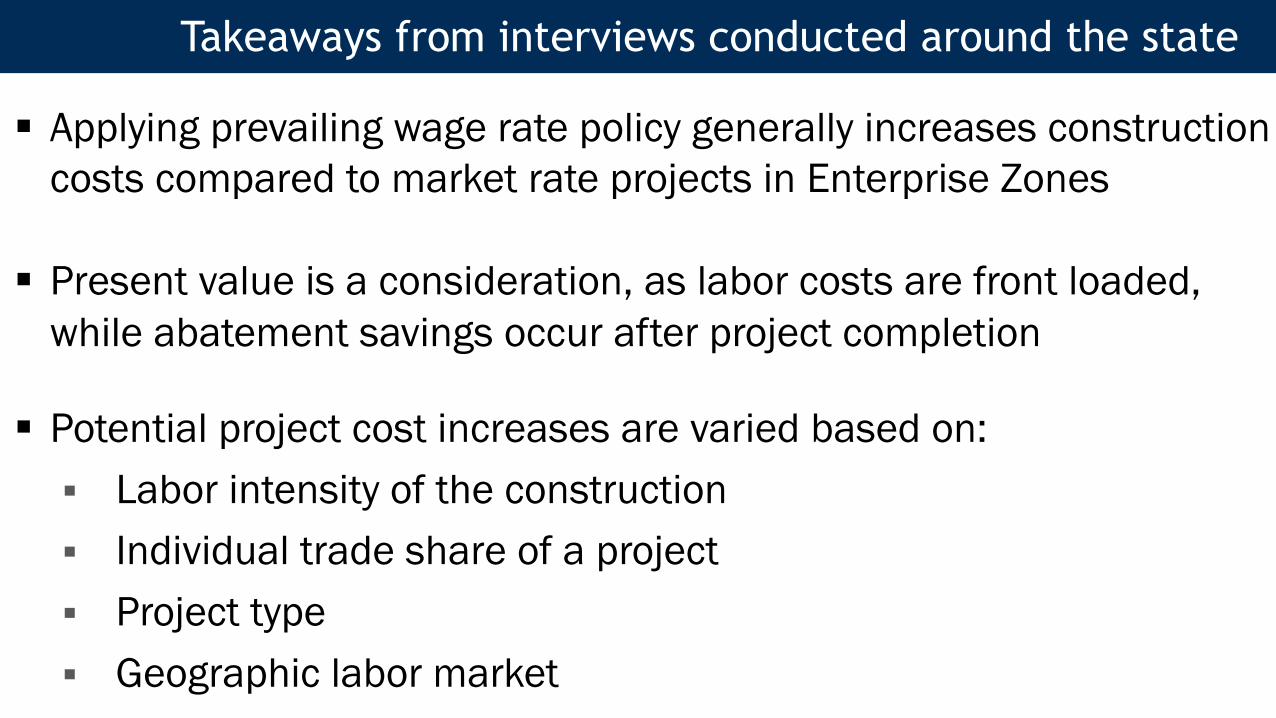
§ Applying prevailing wage rate policy generally increases construction costs compared to market rate projects in Enterprise Zones
§ Present value is a consideration, as labor costs are front loaded, while abatement savings occur after project completion
§ Potential project cost increases are varied based on:§ Labor intensity of the construction § Individual trade share of a project§ Project type§ Geographic labor market
Takeaways from interviews conducted around the state
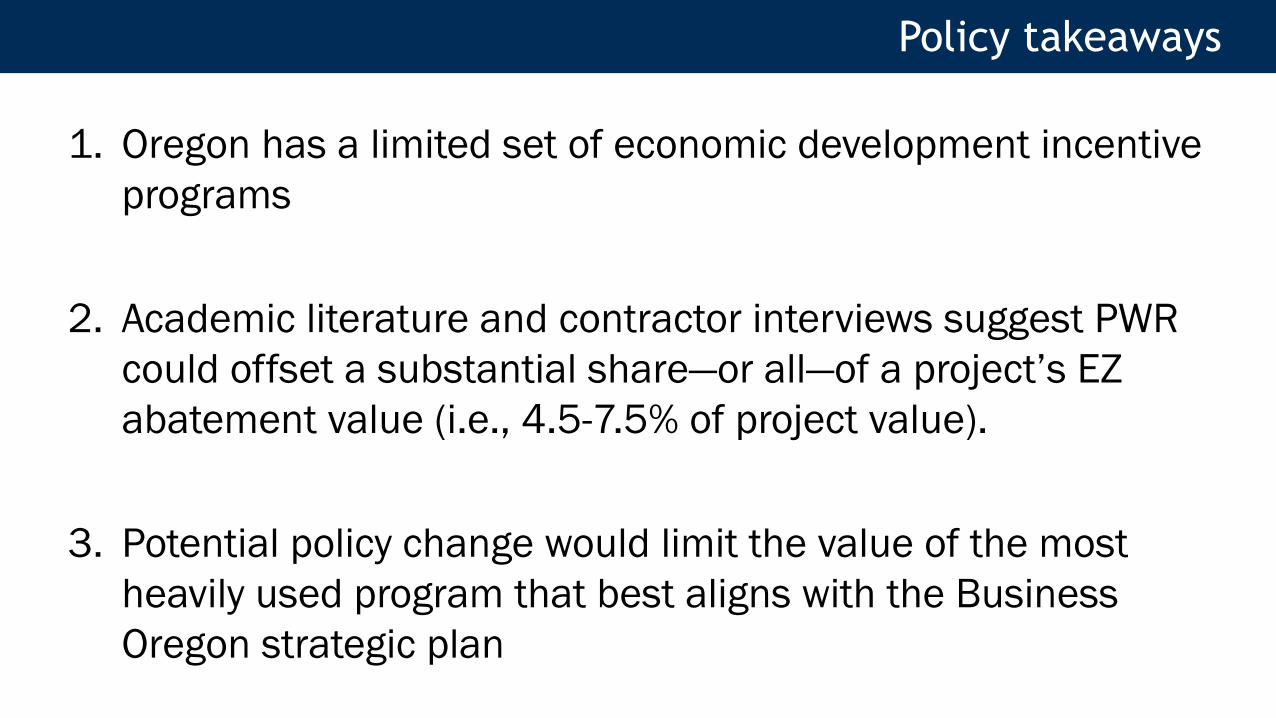
1. Oregon has a limited set of economic development incentive programs
2. Academic literature and contractor interviews suggest PWR could offset a substantial share—or all—of a project’s EZ abatement value (i.e., 4.5-7.5% of project value).
3. Potential policy change would limit the value of the most heavily used program that best aligns with the Business Oregon strategic plan
Policy takeaways
Los Angeles Portland Seattle Boise