Embed Size (px)
Citation preview

1
Statement of Basis Greenhouse Gas Prevention of Significant Deterioration Preconstruction Draft Permit
for the Celanese Ltd., Clear Lake Plant
Permit Number: PSD-TX-1296-GHG
June 2013
This document serves as the Statement of Basis (SOB) for the above-referenced draft permit, as required by 40 CFR 124.7. This document sets forth the legal and factual basis for the draft permit conditions and provides references to the statutory or regulatory provisions, including provisions in 40 CFR 52.21, that would apply if the permit is finalized. This document is intended for use by all parties interested in the permit. I. Executive Summary
On August 10, 2012, Celanese, Ltd. (Celanese) Clear Lake Plant submitted to EPA Region 6 a Prevention of Significant Deterioration (PSD) permit application for Greenhouse Gas (GHG) emissions. A revised application was submitted on June 13, 2013 (hereinafter, referred to as “the application”). In connection with the same proposed project, Celanese submitted a PSD and Nonattainment New Source Review (NNSR) permit applications for non-GHG pollutants to the Texas Commission on Environmental Quality (TCEQ) on June 12, 2012. The project involves construction of a new methanol manufacturing unit at the existing Clear Lake Plant. After reviewing the application, EPA has prepared the following SOB and draft PSD permit that, when finalized, will authorize the construction of new equipment and modification of existing air emission sources at the Celanese, Clear Lake Plant. This SOB provides the information and analysis used to support EPA’s decisions in drafting the PSD permit. It includes a description of the facility and proposed modification, the PSD permit requirements based on BACT analyses conducted on the proposed new units, and the compliance terms of the permit. EPA Region 6 concludes that Celanese’s application is complete and provides the necessary information to demonstrate that the proposed project meets the applicable PSD permit regulations. EPA's conclusions rely upon information provided in the permit application, supplemental information EPA requested and provided by Celanese, and EPA's own technical analysis. EPA is making this information available as part of the public record.
2
II. Applicant Celanese, Ltd. 222 W. Las Colinas Blvd., Suite 900 Irving, TX 75039 Physical Address: 9502 Bayport Blvd. Pasadena, TX 77507 Contact: Jan Day Senior Environmental Engineer Celanese Chemicals (281) 474-8802 III. Permitting Authority On May 3, 2011, EPA published a federal implementation plan (FIP) that makes EPA Region 6 the PSD permitting authority for the pollutant GHGs. See 75 FR 25178 (promulgating 40 CFR § 52.2305). The GHG PSD Permitting Authority for the State of Texas is: EPA, Region 6 1445 Ross Avenue Dallas, TX 75202 The EPA, Region 6 Permit Writer is: Aimee Wilson Air Permitting Section (6PD-R) (214) 665-7596
3
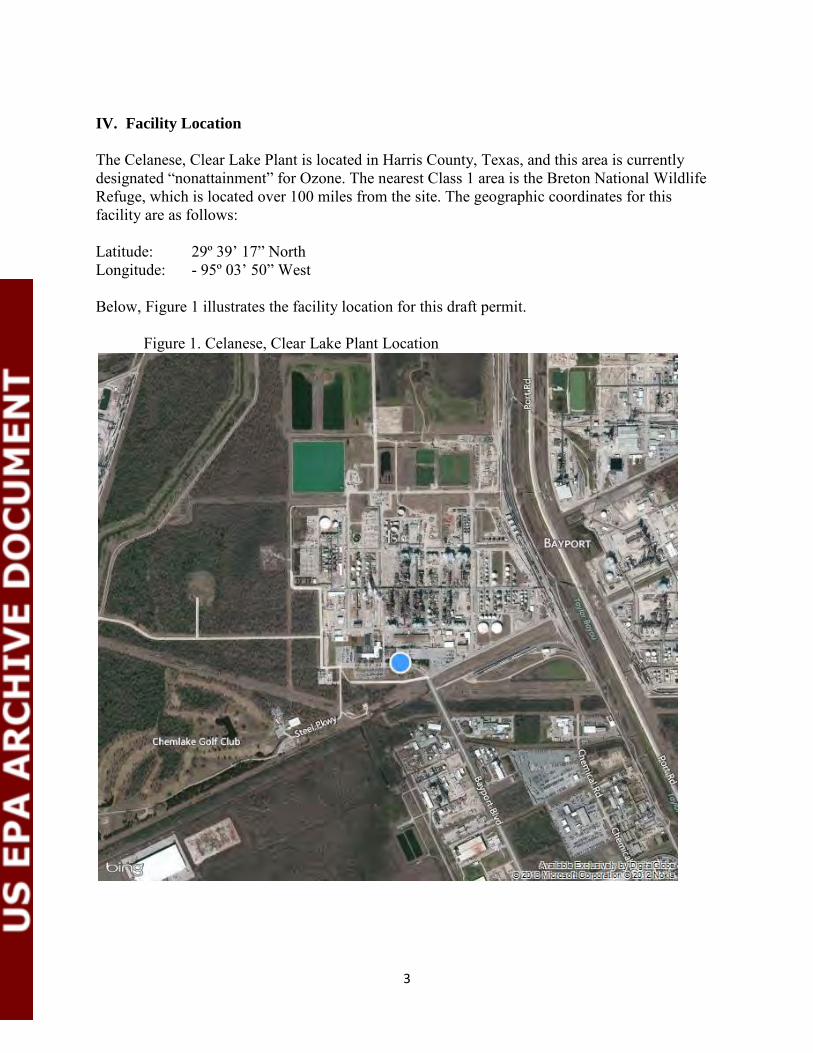
IV. Facility Location The Celanese, Clear Lake Plant is located in Harris County, Texas, and this area is currently designated “nonattainment” for Ozone. The nearest Class 1 area is the Breton National Wildlife Refuge, which is located over 100 miles from the site. The geographic coordinates for this facility are as follows: Latitude: 29º 39’ 17” North Longitude: - 95º 03’ 50” West Below, Figure 1 illustrates the facility location for this draft permit. Figure 1. Celanese, Clear Lake Plant Location
4
V. Applicability of Prevention of Significant Deterioration (PSD) Regulations EPA concludes that Celanese’s application is subject to PSD review for the pollutant GHGs, because the project would result in an emissions increase of 75,000 tpy CO2e or more as described at 40 CFR § 52.21(b)(49)(iv)(b) and an emissions increase greater than zero tpy on a mass basis as described at 40 CFR § 52.21(b)(23)(ii) (Celanese calculates CO2e emissions of 535,218 tpy). As noted above in Section III, EPA Region 6 implements a GHG PSD FIP for the Texas under the provisions of 40 CFR 52.21 (except paragraph (a)(1)). See, 40 CFR § 52.2305. Celanese represents that TCEQ, the permitting authority for regulated NSR pollutants other than GHGs, will determine that Celanese is also subject to PSD review for CO, PM10, PM2.5, and NOx; and NNSR for VOC and NOx. Accordingly, under the circumstances of this project, the TCEQ will issue the non-GHG portion of the permit and EPA will issue the GHG portion.1
EPA Region 6 applies the policies and practices reflected in EPA’s PSD and Title V Permitting Guidance for Greenhouse Gases (March 2011). Consistent with that guidance, we have not required the applicant to model or conduct ambient monitoring for GHGs, nor have we required any assessment of impacts of GHGs in the context of the additional impacts analysis or Class I area provisions of 40 CFR 52.21(o) and (p), respectively. Instead, EPA has determined that compliance with the selected BACT is the best technique that can be employed at present to satisfy the additional impacts analysis and Class I area requirements of the rules related to GHGs. We note again, however, that the proposed project has regulated NSR pollutants that are non-GHG pollutants, which are addressed by the PSD and NNSR permit to be issued by TCEQ. VI. Project Description
With this permit application, Celanese is proposing to construct a new methanol (MeOH) manufacturing unit at the Clear Lake Plant. Celanese owns and operates multiple chemical manufacturing units at the Clear Lake Plant. Currently, methanol is one of the feedstocks imported to the facility. To provide improved reliability of their MeOH supply and reduce transportation expenses, Celanese proposes to manufacture MeOH onsite with the construction of a new MeOH manufacturing unit. The design capacity of the new Methanol plant is 1,433,000 tons per year of methanol. Pipeline natural gas is compressed, preheated, treated to remove sulfur, saturated with process water, mixed with steam, reheated and the natural gas/steam mixture fed to the primary reformer where a portion of the methane is converted to synthesis gas (a mixture of carbon monoxide, carbon dioxide, and hydrogen).
1 See EPA, Question and Answer Document: Issuing Permits for Sources with Dual PSD Permitting Authorities, April 19, 2011, http://www.epa.gov/nsr/ghgdocs/ghgissuedualpermitting.pdf
5
The reformer consists of a large number of catalyst-filled tubes suspended in the radiant section of a process heater. The process stream containing light hydrocarbons and steam flows into the tubes where it is heated to reaction temperature to produce the synthesis gas. Heat input to the primary reformer is provided by natural gas and a purge stream. Heat is recovered from the flue gases from the primary reformer (by super-heating steam, reheating the natural gas/steam mixture fed to the primary reformer, preheating the natural gas feed to the sulfur removal system and preheating combustion air) prior to venting the flue gases to atmosphere. The partially reformed gas stream from the primary reformer is sent to the secondary reformer where it is reacted with oxygen and most of the remaining methane is converted to synthesis gas. The synthesis gas leaving the secondary reformer is cooled, compressed and sent to the converter loop where carbon monoxide, carbon dioxide and hydrogen are reacted to produce crude methanol, a mixture mainly of methanol and water. Process streams including, but not limited to, the synthesis gas and converted methanol will be monitored using various process analyzers. Most of the steam that is required to operate the Methanol plant is produced by heat recovery from the synthesis gas leaving the secondary reformer; the remainder is produced by heat recovery from the converters. The crude methanol is sent to a three-column distillation train. Light ends are taken overhead in the first column and combined with the purge stream from the converter loop. Finished methanol is taken overhead in the second column. The residue from the second column feeds a third column. The finished methanol is also taken overhead in the third column. A side stream from the third column is recycled to the saturator. The process water stream from the bottom of the third column is recycled to the saturator. Finished methanol is sent to the storage area. The storage area consists of five existing fixed-roof storage tanks and a proposed new internal floating roof (IFR) storage tank. All of the VOC emissions from the tanks will be routed to the existing Tank Farm vent scrubber. There are no expected GHG emissions from the storage tanks. Finished methanol is fed to the Acetic Acid Plant or shipped from the Methanol Plant by truck, railcar and/or pipeline. The loading emissions from the loading rack vent headers are controlled by a 3rd
party company. No net increase in GHG emissions from the 3rd party will
result since heat requirements are off-set by reduction in natural gas required. A flare (EPN: MEOHFLR) will be available to control emissions as appropriate from Maintenance, Start-up, or Shutdown (MSS) activities or emergency vents. MSS GHG emissions not able to be controlled by the flare will be emitted to atmosphere (EPN: MEOHMSS). A back-up diesel emergency generator (EPN: MEOHENG) will be located in the Methanol Unit and will be used for back-up power. Piping components from the process equipment described above will also be a source of GHG emissions (EPN: MEOHFUG).
6
VII. General Format of the BACT Analysis The BACT analyses for this draft permit are consistent with the statutory requirements of CAA sections 165(a)(4) and 169(3) and 40 CFR sections 52.21 (b)(12) and 52.21 (j). The analyses are also consistent with EPA’s PSD and Title V Permitting Guidance for Greenhouse Gases (March 2011), which outlines the steps for conducting a “top-down” BACT analysis. Those steps are listed below.
(1) Identify all potentially available control options; (2) Eliminate technically infeasible control options; (3) Rank remaining control technologies; (4) Evaluate the most effective controls and document the results; and (5) Select BACT.
VIII. Applicable Emission Units The majority of the contribution of GHGs associated with the project is from combustion sources (i.e., reformer furnace, emergency generator, and flare). The site has some fugitive emissions from piping components which contribute a relatively small amount of GHGs. These stationary combustion sources primarily emit carbon dioxide (CO2), and small amounts of nitrous oxide (N2O) and methane (CH4). The following devices are subject to this GHG PSD permit:
• Reformer Furnace (EPN: REFORM) • MSS Flare (EPN: MEOHFLR) • Equipment MSS (EPN: MEOHMSS) • Fugitive Emissions (EPN: MEOHFUG) • Emergency Generator Engine (EPN: MEOHENG) • Cooling Tower (EPN: MEOHMT)
IX. Reformer Furnace (REFORM) BACT Analysis The MeOH manufacturing unit consists of a reformer furnace (REFORM). The reformer combusts methane and a hydrogen rich process gas stream to make synthesis gas. The furnace is equipped with low NOx burners and selective catalytic reduction (SCR) systems to control NOx emissions. Furnace fuel is natural gas and it may also combust high hydrogen fuel gas as a secondary fuel when practicable and available. As part of the PSD review, Celanese provided in the GHG permit application a 5-step top-down BACT analysis for the reformer furnace. In setting forth BACT for this proposed permit, EPA
7
has reviewed Celanese’s BACT analysis for the furnace, portions of which have been incorporated into this SOB, and also conducted its own analysis, as summarized below. Step 1 – Identification of Potential Control Technologies for GHGs
• Selection of the Lowest Carbon Fuel – Use of fuels containing lower concentrations of
carbon generate less CO2 than other higher-carbon fuels. Typically, gaseous fuels such as natural gas or a hydrogen rich gas stream contain less carbon, and thus lower CO2 potential, than liquid or solid fuels such as diesel or coal.
• Methanol Reforming Process Design –Furnace design that provides higher efficiency, lower energy consumption, higher raw material yields, and lower potential emissions than other existing technologies.
• Installation of Energy Efficiency Options– Air preheater, heat recovery, and high efficiency burners are energy efficient options.
• Best Operational Practices – Best operation practices include periodic tune-ups and oxygen trim controls. The tune-ups will include instrument calibrations and cleaning of dirty or fouled mechanical parts. Oxygen trim control allows the excess oxygen to be controlled to optimum levels, thus allowing the furnace to operate at continuous high levels of efficiency.
• Carbon Capture and Storage – CCS is an available add-on control technology that is applicable for all of the site’s affected combustion units.
• N2O Catalysts – N2O catalysts have been used in the nitric/adipic acid plants to minimize N2O emissions.
• Post-Combustion Catalytic Oxidation – Post-combustion catalytic oxidation provides rapid conversion of a hydrocarbon into CO2 and water vapor in the presence of available oxygen.
Step 2 – Elimination of Technically Infeasible Alternatives
All options identified in Step 1 are considered technically feasible, except for N2O catalysts and post-combustion catalytic oxidation. The only available and applicable CO2 capture technology, post-combustion capture, is also believed to be technically feasible. 2 Carbon Capture and Storage (CCS) Carbon capture and storage is a GHG control process that can be used by “facilities emitting CO2 in large concentrations, including fossil fuel-fired power plants, and for industrial facilities with high-purity CO2 streams (e.g., hydrogen production, ammonia production, natural gas processing, ethanol production, ethylene oxide production, cement production, and iron and steel
2 Based on the information provided by Celanese and reviewed by EPA for this BACT analysis, while there are some portions of CCS that may be technically infeasible for this project, EPA has determined that overall Carbon Capture and Storage (CCS) technology is technically feasible at this source.
8
manufacturing).”3 CCS systems involve the use of adsorption or absorption processes to remove CO2 from flue gas, with subsequent desorption to produce a concentrated CO2 stream. The three main capture technologies for CCS are pre-combustion capture, post-combustion capture, and oxyfuel combustion (IPCC, 2005). Of these approaches, pre-combustion capture is applicable primarily to gasification plants, where solid fuel such as coal is converted into gaseous components by applying heat under pressure in the presence of steam and oxygen (U.S. Department of Energy, 2011). At this time, oxyfuel combustion has not yet reached a commercial stage of deployment for furnace applications and still requires the development of oxy-fuel combustors and other components with higher temperature tolerances (IPCC, 2005). Accordingly, pre-combustion capture and oxyfuel combustion are not considered available control options for this proposed project; the third approach, post-combustion capture, is available and applicable to the reformer furnace. With respect to post-combustion capture, a number of methods may potentially be used for separating the CO2 from the exhaust gas stream, including adsorption, physical absorption, chemical absorption, cryogenic separation, and membrane separation (Wang et al., 2011). Many of these methods are either still in development or are not suitable for treating reformer furnace flue gas due to the characteristics of the exhaust stream (Wang, 2011; IPCC, 2005). Of the potentially applicable technologies, post-combustion capture with an amine solvent such as monoethanolamine (MEA) is currently the preferred option because it is the most mature and well-documented technology (Kvamsdal et al., 2011), and because it offers high capture efficiency, high selectivity, and the lowest energy use compared to the other existing processes (IPCC, 2005). Post-combustion capture using MEA is also the only process known to have been previously demonstrated in practice on furnaces (Reddy, Scherffius, Freguia, & Roberts, 2003). As such, post-combustion capture is the sole carbon capture technology considered in this BACT analysis.
In a typical MEA absorption process, the flue gas is cooled before it is contacted counter-currently with the lean solvent in a reactor vessel. The scrubbed flue gas is cleaned of solvent and vented to the atmosphere while the rich solvent is sent to a separate stripper where it is regenerated at elevated temperatures and then returned to the absorber for re-use. Fluor’s Econamine FG Plus process operates in this manner, and it uses an MEA-based solvent that has been specially designed to recover CO2 from oxygen-containing streams with low CO2 concentrations typical of furnace exhaust. Because this technology is commercially available and applicable and has been demonstrated in practice in natural gas purification and ammonia production applications EPA has determined technically feasible, Celanese evaluated the cost for CO2 capture from the reformer furnace using absorption into MEA.
3U.S. Environmental Protection Agency, PSD and Title V Permitting Guidance for Greenhouse Gases, March 2011, <http:/www.epa.gov/nsr/ghgdocs/ghgpermittingguidance.pdf> (March 2011)
9
Once CO2 is captured from the flue gas, the captured CO2 is compressed to 100 atmospheres (atm) or higher for ease of transport (usually by pipeline). The CO2 would then be transported to an appropriate location for underground injection into a suitable geological storage reservoir, such as a deep saline aquifer or depleted coal seam, or used in crude oil production for enhanced oil recovery (EOR). There is a large body of ongoing research and field studies focused on developing better understanding of the science and technologies for CO2 storage.4 N2O Catalysts N2O catalysts have not been used to control N2O emissions from reformer furnace applications. In addition, the low N2O concentrations present in the exhaust stream would make installation of N2O catalysts technically infeasible. N2O catalysts are therefore eliminated as a technically infeasible option for the proposed project. Catalytic Oxidation The reformer furnace flue gas is expected to contain about 5 ppmv CH4. This concentration is about two orders of magnitude below the lower end of VOC concentration streams where catalytic oxidation has been demonstrated for control. Addition of post-combustion catalytic oxidation on the reformer furnace for control of CH4 is technically infeasible for the proposed project and is eliminated for the proposed project. Step 3 – Ranking of Remaining Technologies Based on Effectiveness
• Carbon capture and storage (up to 90%) • Fuel Selection (up to 70%) • Process Design • Energy Efficiency Options • Best Operation Practices
CCS is capable of achieving up to a 90% reduction of produced CO2 emissions. Selection of a fuel with a low carbon content can reduce emissions of CO2. Hydrogen has no capacity to produce CO2 when combusted. Hydrogen used along with the process gas recycled back to the reformer would provide 70% effectiveness in control of CO2 emissions from the reformer furnace and thus is considered to be the second most effective control. Supplementing the reformer natural gas fuel with a hydrogen rich stream will reduce the CO2 emissions by
4 U.S. Department of Energy, Office of Fossil Energy, National Energy Technology Laboratory Carbon Sequestration Program: Technology Program Plan, <http://www.netl.doe.gov/technologies/carbon_seq/refshelf/2011_Sequestration_Program_Plan.pdf>, February 2011
10
319,215 tpy. The hydrogen-rich process stream will be available as fuel during normal operation of the plant but not in the quantity necessary for continuous operation. An estimated additional 2,247 mscf H2/hour would be needed to completely replace natural gas as a fuel source. A new hydrogen plant that would meet Celanese’s hydrogen demand would generate between 374,053 to 561,079 tpy CO2 based on the current literature (Bonaquist, D., "Analysis of CO2 Emissions, Reductions, and Capture for Large-Scale Hydrogen Production: A White Paper", www.praxair.com, October 2010). Therefore natural gas is the lowest carbon fuel that could be relied upon for continuous fueling of the proposed operation. The steam methane reforming (SMR) process requires combusting a fuel source to provide radiant heat to crack a carbon-containing feed in the presence of steam. The SMR processes evaluated ranged between 34 to 35 MMBtu/metric ton of methanol produced. The autothermal reforming (ATR) process reacts natural gas and oxygen below stoichiometric conditions. The ATR process has a lower methanol conversion efficiency than SMR since the process does not produce enough hydrogen to consume all the CO2. The ATR processes evaluated ranged between 32 to 33 MMBtu/metric ton of methanol produced. A combined gas thermal reforming process was also evaluated. The combined reforming process uses a primary and secondary reformer to produce methanol. The combined reforming process evaluated ranged between 31 and 33 MMBtu/metric ton of methanol produced. Consequently, the combined reforming process will generate fewer GHG emissions than the other processes. Celanese evaluated several energy efficiency technologies to be incorporated into the design of the reformer furnace. An air preheater will be installed to heat the incoming combustion air. The proposed methanol process will incorporate heat recovery as well. Celanese will utilize high efficiency burners to reduce emissions from non-GHG pollutants. Celanese will implement best operational practices. Celanese will monitor the stack excess O2 to ensure efficient combustion in the reformer furnace. The reformer will be operated at a 3% stack O2 concentration during normal operation, monitored by an analyzer in the reformer stack. Celanese will increase energy efficiency in the process by reducing heat loss by insulating the high temperature equipment where practical to reduce heat loss. Celanese will implement preventative maintenance practices to keep the reformer in good operating condition.
11
Step 4 – Evaluation of Control Technologies in Order of Most Effective to Least Effective, with Consideration of Economic, Energy, and Environmental Impacts Carbon Capture and Sequestration Celanese provided a five-step top-down BACT analysis for CCS that provided the basis for eliminating the technology in step 4 of the BACT process as a viable control option based on economic costs and environmental impact. The recovery and purification of CO2 from the stack gases would necessitate significant additional processing and also create environmental/air quality penalties, to achieve the necessary CO2 concentration to allow for effective sequestration. As explained more fully below, EPA has reviewed Celanese’s CCS analysis and has determined that CCS is not cost-effective at this time for this application and has negative environmental and energy impacts, which in combination support the elimination of CCS as BACT. Celanese identified one method of CO2 capture that were technically feasible for the reformer flue gases - separation by amine (MEA) absorption into an amine solvent. Separation by a permeable membrane was considered infeasible as has not yet reached a commercial stage of deployment for industrial applications. The estimated capital cost of an amine treating system used to capture 90% of the reformer flue gas CO2 was estimated to be $95,000,000 with an additional $6,000,000 needed for plant electrical infrastructure upgrades and $19,000,000 to provide a steam system (boiler, deaerator, condensate receiver, boiler feedwater pumps, condensate return pumps, etc.) producing 317 thousand pounds per hour of 90 psig saturated steam to regenerate MEA in the system. The cost of natural gas for the boiler would be $16,575,000 per year, assuming a natural gas price of $5.00/MMBtu, an 80% boiler efficiency, and an operational period of 8,760 hr/yr. The MEA system would require 5,309 HP, or 3.959 MW, of electricity for pumps and air coolers. An additional 5,656 HP, or 4.218 MW, would be required for CO2 compressions. Assuming $50 per MW-hr, the electricity costs of capture and compression are estimated at $3,940,000 per year. The boiler would have to be permitted in the Houston/Galveston/Brazoria (HGB) non-attainment area, requiring a purchase of at least $5,000,000 in NOx and VOC off-sets. An assumed 25 miles of pipeline would be required to transport the captured CO2 to a sequestration site. The costs associated with an 8” diameter pipeline were estimated using the methodology established in guidance from the National Energy and Technology Laboratory (NETL).5 The materials, labor, right of way, pipeline control system, and miscellaneous costs are estimated at a capital cost of $17,000,000, with an additional $216,000 per year for operation and maintenance.
5 The National Energy and Technology Laboratry Quality Guidelines for Energy System Studies Estimating Carbon Dioxide Transport and Storage Costs (DOE/NETL-400/2010/1447, March 2010) is available online at http://www.netl.doe.gov/energy-analyses/pubs/QGESStransport.pdf
12
Geologic storage of captured CO2 was also estimated using the NETL guidance. For one 4,000 foot deep injection well the total costs including site screening and evaluation, injection well and equipment, and liability costs are estimated at $10,000,000, with an additional $3,839,000 per year for operation and maintenance. The total annualized cost for a CCS system is estimated to be $34,371,912. Ninety percent (90%) capture of CO2 from the reformer furnace is estimated to be at 479,372 tpy of CO2 removed. The new boiler required for an amine system would generate an additional 195,909 tpy CO2. The estimated CCS capital needed only for capture and a new pipeline for the current project results in an increase of more than 25% in the capital costs for Celanese’s project. EPA Region 6 reviewed Celanese’s BACT analysis, which was supported by a CCS cost estimate and believes it adequately approximates the cost of a CCS control for this project and demonstrates those costs are prohibitive in relation to the overall cost of the proposed project, and thus CCS has been eliminated as BACT for this project as economically infeasible. Economic infeasibility notwithstanding, Celanese asserts that CCS can have a collateral increase of National Ambient Air Quality Standards (NAAQS) pollutants. Implementation of CCS would increase emissions of GHGs, NOx, CO, VOC, PM10, and SO2 because of the increased energy needed to operate the CCS controls. The proposed plant is located in an area of ozone non-attainment (Houston, Galveston, and Brazoria (HGB)), and the generation of additional NOx and VOC could exacerbate ozone formation in the area. EPA reviewed Celanese’s BACT analysis and determined that CCS would, in addition to being economically infeasible, also have environmental impacts that provide a basis for elimination, since its use would cause an increase in emissions of NOx and VOCs to the HGB non-attainment area airshed. Use of the Lowest Carbon Fuel Natural gas is the lowest emitting carbon fuel that could be relied upon for the proposed operation. High hydrogen fuel gas streams may be utilized as a secondary fuel for the reformer furnace when it is available and its use is practicable. Pipeline hydrogen for combustion in the methanol reformer would cost an additional $737 million above the cost of an equivalent heat value of natural gas over the lifetime of the process operation (assuming 30-year life of equipment) and would render the project economically unviable. The process of producing hydrogen as a standalone project for use as a fuel will create 10.8 pounds of GHG emissions per pound of hydrogen produced. The avoided GHG emissions at the Clear Lake Plant from burning hydrogen rather than natural gas in the reformer furnace would result in a decrease of 6.8pounds of greenhouse gas per pound of hydrogen produced. This results in a deficit of approximately 4 pounds of GHGs for every pound of Hydrogen produced for fuel. Applying this deficit to the amount of hydrogen required for the process, an estimated 209,205 tpy additional CO2e would be generated by an additional H2 generation source. Accordingly, EPA has reviewed Celanese’s
13
analysis and has determined that natural gas is BACT and that use of hydrogen as the primary fuel is eliminated based on the negative environmental impact of these collateral increases in CO2. Methanol Reforming Design Celanese selected a combined reforming process that uses a primary and secondary reformer to produce methanol based on the 5-step BACT analysis. The combined reforming process will use between 31 and 33 MMBtu per metric ton of methanol produced. This was the most energy efficient design evaluated. The combined reformer also had the lowest GHG emissions. An SMR reformer design would produce up to 434,537 tpy more of CO2e than the combined reformer. The ATR reformer furnace design would create 43,454 more tpy of CO2e than the combined reformer. The combined reformer has the lowest environmental impact in respect to GHG emissions. Energy Efficiency Options The use of an energy efficient furnace and unit design is economically and environmentally practicable for the proposed project. By optimizing energy efficiency, the project requires less fuel than comparable less-efficient operations, resulting in cost savings. Further, reduction in fuel consumption corresponding to energy efficient design provides additional environmental benefits of reducing emissions of other combustion products such as NOx, CO, VOC, PM10, and SO2. Celanese will monitor and keep records of the energy consumption of the reformer furnace and meet an output-based limit of 30 MMBtu/ton of methanol produced. Celanese will also monitor the reformer furnace exhaust stack temperature and not exceed a temperature of 350 oF on a 12-month rolling average basis. Best Operation Practices Best operation practices effectively support the energy efficient design. Celanese will monitor stack excess O2 to ensure efficient combustion. The fuel requirements and combustion efficiency increase as the facility operates with more excess air. The reformer furnace will be operated at 3% stack oxygen concentration during normal operation, monitored by an analyzer in the reformer stack. Celanese maintenance procedures for equipment in natural gas service will include depressuring the system to the flare as appropriate, prior to opening to the atmosphere. Maintenance activities include instrument calibration, and cleaning dirty or fouled mechanical parts. Thus, the economic and environmental benefits of energy efficient design techniques also apply to the use of best operation practices.
14
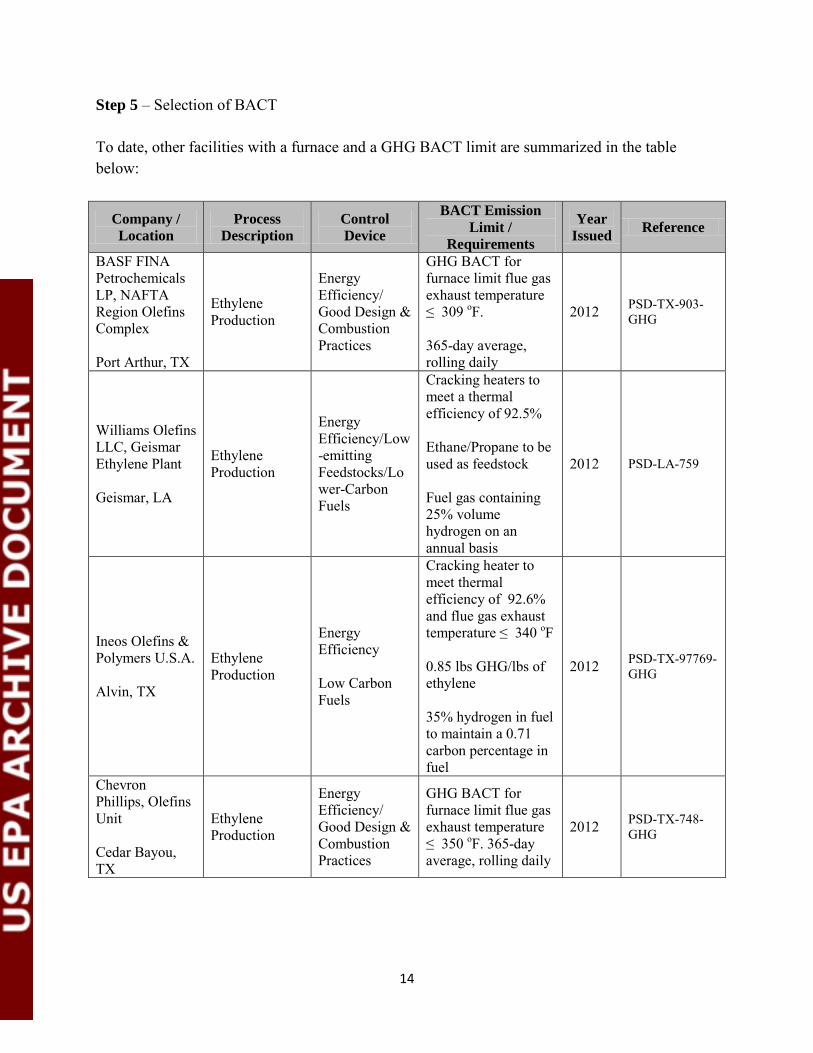
Step 5 – Selection of BACT To date, other facilities with a furnace and a GHG BACT limit are summarized in the table below:
Company / Location
Process Description
Control Device
BACT Emission Limit /
Requirements
Year Issued Reference
BASF FINA Petrochemicals LP, NAFTA Region Olefins Complex Port Arthur, TX
Ethylene Production
Energy Efficiency/ Good Design & Combustion Practices
GHG BACT for furnace limit flue gas exhaust temperature ≤ 309 oF. 365-day average, rolling daily
2012 PSD-TX-903-GHG
Williams Olefins LLC, Geismar Ethylene Plant Geismar, LA
Ethylene Production
Energy Efficiency/Low-emitting Feedstocks/Lower-Carbon Fuels
Cracking heaters to meet a thermal efficiency of 92.5% Ethane/Propane to be used as feedstock Fuel gas containing 25% volume hydrogen on an annual basis
2012 PSD-LA-759
Ineos Olefins & Polymers U.S.A. Alvin, TX
Ethylene Production
Energy Efficiency Low Carbon Fuels
Cracking heater to meet thermal efficiency of 92.6% and flue gas exhaust temperature ≤ 340 oF 0.85 lbs GHG/lbs of ethylene 35% hydrogen in fuel to maintain a 0.71 carbon percentage in fuel
2012 PSD-TX-97769-GHG
Chevron Phillips, Olefins Unit Cedar Bayou, TX
Ethylene Production
Energy Efficiency/ Good Design & Combustion Practices
GHG BACT for furnace limit flue gas exhaust temperature ≤ 350 oF. 365-day average, rolling daily
2012 PSD-TX-748-GHG
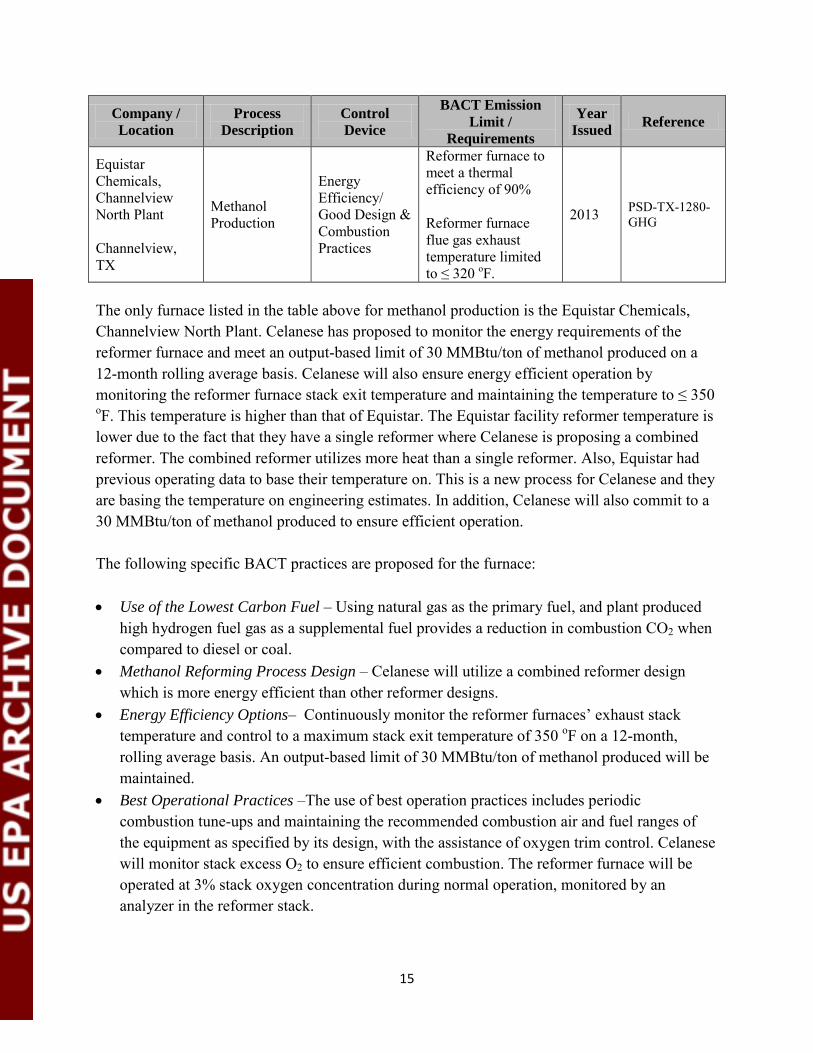
15
Company / Location
Process Description
Control Device
BACT Emission Limit /
Requirements
Year Issued Reference
Equistar Chemicals, Channelview North Plant Channelview, TX
Methanol Production
Energy Efficiency/ Good Design & Combustion Practices
Reformer furnace to meet a thermal efficiency of 90% Reformer furnace flue gas exhaust temperature limited to ≤ 320 oF.
2013 PSD-TX-1280-GHG
The only furnace listed in the table above for methanol production is the Equistar Chemicals, Channelview North Plant. Celanese has proposed to monitor the energy requirements of the reformer furnace and meet an output-based limit of 30 MMBtu/ton of methanol produced on a 12-month rolling average basis. Celanese will also ensure energy efficient operation by monitoring the reformer furnace stack exit temperature and maintaining the temperature to ≤ 350 oF. This temperature is higher than that of Equistar. The Equistar facility reformer temperature is lower due to the fact that they have a single reformer where Celanese is proposing a combined reformer. The combined reformer utilizes more heat than a single reformer. Also, Equistar had previous operating data to base their temperature on. This is a new process for Celanese and they are basing the temperature on engineering estimates. In addition, Celanese will also commit to a 30 MMBtu/ton of methanol produced to ensure efficient operation. The following specific BACT practices are proposed for the furnace: • Use of the Lowest Carbon Fuel – Using natural gas as the primary fuel, and plant produced
high hydrogen fuel gas as a supplemental fuel provides a reduction in combustion CO2 when compared to diesel or coal.
• Methanol Reforming Process Design – Celanese will utilize a combined reformer design which is more energy efficient than other reformer designs.
• Energy Efficiency Options– Continuously monitor the reformer furnaces’ exhaust stack temperature and control to a maximum stack exit temperature of 350 oF on a 12-month, rolling average basis. An output-based limit of 30 MMBtu/ton of methanol produced will be maintained.
• Best Operational Practices –The use of best operation practices includes periodic combustion tune-ups and maintaining the recommended combustion air and fuel ranges of the equipment as specified by its design, with the assistance of oxygen trim control. Celanese will monitor stack excess O2 to ensure efficient combustion. The reformer furnace will be operated at 3% stack oxygen concentration during normal operation, monitored by an analyzer in the reformer stack.
16
BACT Limits and Compliance: Celanese will demonstrate compliance with energy efficient operations by continuously monitoring the exhaust stack temperature of the reformer furnace. The maximum stack exit temperature of 350 oF on a 12-month, rolling average basis will be calculated daily for the furnace. Energy efficiency will be calculated monthly and will be maintained at 30 MMBtu/ton of methanol produced. Celanese will monitor stack excess O2 to ensure efficient combustion. The reformer furnace will be operated at 3% stack oxygen concentration during normal operation, monitored by an analyzer in the reformer stack. Reformer furnace design, use of low carbon fuels, use of energy efficient options, and best operational practices of the furnace corresponds to a permit limit of 533,334 TPY CO2e. Celanese will design the reformer furnace to be energy efficient by implementing the latest improvements and technologies in heat transfer and fluid flow to maximize the energy efficiency and energy recovery. Celanese proposes an output-based, heat input per product limit (MMBtu/ton methanol) to ensure that energy efficiency is achieved. Natural gas fed as fuel and/or raw material to the reformer and composition in combination with HHV for the fuel gas components will be used to calculate the hourly heat input associated with methanol reformer going to the furnace on a 12-month basis. The natural gas flow to the reformer will be continuously monitored and recorded in a data historian. Per 40 CFR § 98.34(b)(1)(ii), the fuel flow meter will be calibrated per manufacturer’s recommendation. A composition analyzer at the inlet will be used to determine the composition of the process fuel on a daily basis as required by 40 CFR § 98.34(b)(3)(ii)(E). If the composition analyzer is not online, weekly sampling and analysis will be used per 40 CFR § 98.34(b)(3)(ii)(E). The natural gas composition will be determined semi-annually or obtained from the natural gas supplier. There will be heat recovered from the flue gases of the primary reformer that will be used to generate steam that is exported to the Celanese Clear Lake Plant’s main steam header system. This recovered heat is not used to produce methanol and therefore will not be counted in the heat input when evaluating the reformer’s energy efficiency for compliance. The natural gas to the reformer minus heat that is used to generate steam for the plant will be used in conjunction with production records to update the output-based result (MMBtu/ton methanol) of the methanol unit on a calendar year basis. When the reformer is firing at 75% of design heat input, measurement of O2 and temperature downstream of the furnace heat recovery will be used to show that BACT is applied continuously during normal operation. O2 will be measured by an O2 CEMS in the stack and will be evaluated against a limit of 3%. Reliability of the measurement will be ensured by a weekly zero and span, and a semi-annual cylinder gas audit. Temperature will be monitored in the stack and the 12-month rolling average will be evaluated against a limit of 350 oF. The flow meters,
17
analyzers, O2 CEMS, and temperature monitoring equipment used for reformer furnace compliance will be operated at least 95% of the time when the reformer is operational, averaged over a 12 month rolling period. The composition of the fuel gas components will be used to determine CO2e emissions on a 12-month rolling basis. To calculate the CO2e emissions, the draft permit requires calculation of the emissions based on the procedures and Global Warming Potentials (GWP) contained in the Greenhouse Gas Regulations, 40 CFR Part 98, Subpart A, Table A-1. Records of the calculations would be required to be kept to demonstrate compliance with the emission limits on a 365-day average, rolling daily. Celanese will calculate the CO2 emissions for the reformer furnace using the heat input, flow, and the site specific fuel analysis for process fuel gas. The equation for estimating CO2 emissions from combustion of process fuel gas will be performed as specified in 40 CFR 98.33(a)(3)(iii) as follows:
𝐶𝑂2 = 4412
∗ 𝐹𝑢𝑒𝑙 ∗ 𝐶𝐶 ∗𝑀𝑊𝑀𝑉𝐶
∗ 0.001 ∗ 1.102311
Where: CO2 = Annual CO2 mass emissions from combustion of natural gas and/or plant produced high hydrogen gas (short tons)
Fuel = Annual volume of the gaseous fuel combusted (scf). The volume of fuel combusted must be measured directly, using fuel flow meters calibrated according to §98.3(i). CC = Annual average carbon content of the gaseous fuel (kg C per kg of fuel). The annual average carbon content shall be determined using the same procedures as specified for HHV at §98.33(a)(2)(ii). MW = Annual average molecular weight of the gaseous fuel (kg/kg-mole). The annual average molecular weight shall be determined using the same procedure as specified for HHV at §98.33(a)(2)(ii). MVC = Molar volume conversion factor at standard conditions, as defined in §98.6. 44/12 = Ratio of molecular weights, CO2 to carbon. 0.001 = Conversion of kg to metric tons. 1.102311 = Conversion of metric tons to short tons.
Celanese will calculate the CO2 emissions for the reformer furnace from the combustion of natural gas using equation C-2a as specified in 40 CFR 98.33(a)(2)(i). The value obtained will be added to the CO2 emissions from the combustion of process fuel gas above to determine compliance with the CO2 limit in Table 1.
18
As an alternative, Celanese may install, calibrate, and operate a CO2 continuous emissions monitor (CEMS) and volumetric stack gas flow monitoring system with an automated data acquisition and handling system for measuring and recording CO2 emissions. The emission limits associated with CH4 and N2O are calculated based on emission factors provided in 40 CFR Part 98, Table C-2, site specific analysis of process fuel gas, and the actual HHV. Comparatively, the emissions from CO2 contribute the most (greater than 99%) to the overall emissions from the furnaces and; therefore, additional site specific emission factors are not required for CH4 and N2O. An initial stack test demonstration will be required for CO2 emissions from each emission unit. An initial stack test demonstration for CH4 and N2O emissions is not required because the CH4 and N2O emission are less than 0.01% of the total CO2e emissions from the heaters and are considered a de minimis level in comparison to the CO2 emissions, making initial stack testing impractical and unnecessary. X. Flare (MEOHFLR) BACT Analysis The methanol manufacturing unit will be equipped with a new flare (MEOHFLR) to combust waste gas. CO2 emissions from the flaring process gases that are produced from the combustion of carbon containing compounds (e.g., CO, VOCs, CH4) present in the process-gas streams and the pilot fuel. CO2 emissions from the flare are based on the estimated flow rates of CO2 and flared carbon-containing gases derived from heat and material balance data. The proposed flare is non-assisted and shall have a destruction and removal efficiency of 99% for methane on a 12-month rolling average basis. The flare is an example of a control device in which the control of certain pollutants causes the formation of collateral GHG emissions. Specifically, the control of CH4 in the process gas at the flare results in the creation of additional CO2 emissions via the combustion reaction mechanism. However, given the relative GWPs of CO2 and CH4, it is appropriate to apply flare combustion controls to reduce CH4 emissions since the impact of that GHG reduction will be greater than the GHG impact of the additional CO2 emissions resulting from combustion, and there will also be concurrent destruction of VOCs and HAPs. Step 1 – Identification of Potential Control Technologies • Good Process Design – The combined reformer design recycles loop converter purge gas
back to the front of the process rather than routing it as a continuous vent stream to the flare for control.
• Best Operational Practices – Best operational practices for the flare include pilot flame monitoring, flow measurement, and monitoring/control of waste gas heating value to ensure flame stability.
19
• Good Flare Design – Good flare design can be employed to destroy large fractions of the flare gas. The flare shall meet the requirements of 40 CFR § 60.18.
• Flare Gas Recovery (FGR) – Flaring can be reduced by installation of commercially available recovery systems, including recovery compressors and collection and storage tanks.
Step 2 – Elimination of Technically Infeasible Alternatives Only one option identified in Step 1 is considered technically infeasible, flare gas recovery (FGR). Use of FGR is not suited to the proposed project because this system would not receive a constant volumetric flow of recoverable gases. The vent streams that will be routed to the flare will result from intermittent maintenance, startup, and shutdown (MSS) events. Furthermore, the reformer would be the most likely recipient of the recovered gas, which is not a viable scenario since the reformer would be in start-up or shutdown mode when the gas is available. For this project, flare gas recovery is eliminated as technically infeasible. Step 3 – Ranking of Remaining Technologies Based on Effectiveness Use of good flare design, good process design, and best operational practices will be applied as GHG BACT for the flare in order to minimize emissions from the flare. Because the combination of all of the control options in Step 1 are being proposed by the applicant, a ranking of the individual control options is not necessary. Step 4 – Evaluation of Control Technologies in Order of Most Effective to Least Effective, with Consideration of Economic, Energy, and Environmental Impacts Because the combination of all of the control options in Step 1 are being proposed by the applicant, there is no need to evaluate the economic, energy and environmental impacts of the proposed project. Step 5 – Selection of BACT EPA has reviewed and concurs with Celanese that the use of good flare design, good process design, and best operational practices are BACT. Celanese will use good flare design with appropriate instrumentation and control in addition to good process design and best operational practices as BACT for reducing GHG emissions from the flare. Celanese proposes to follow the velocity and heating value requirements of 40 CFR §60.18 when waste gas is directed to the flare. This operating practice will ensure the flare achieves at least a 99% DRE for methane. The waste gas flow will be continuously monitored at the flare header and recorded by the data historian when waste gas is directed to the flare. The
20
composition of the waste gas will be determined on an hourly basis by a composition analyzer or equivalent at the flare header. The composition analyzer will be calibrated and will identify at least 95% of the compounds in the waste gas. Metered supplemental fuel will also be continuously monitored to maintain the minimum heating value necessary for flame stability. The presence of a pilot flame will be continuously monitored by thermocouple or IR camera. The flow meter and analyzers used for flare compliance will be operational at least 95% of the time when waste gas is being sent to the flare , averaged over a calendar year. The flow meter will be calibrated biannually. The composition analyzer will have a single point calibration check weekly when the flare is receiving waste gas vents. Implementing these BACT practices and design technologies results in an emission limit of 1,366 TPY CO2e for EPN MEOHFLR. BACT Limits and Compliance Celanese will demonstrate compliance with the CO2e emission limit using the emission factors for natural gas from 40 CFR Part 98 Subpart C, Table C-1, and the site specific composition and flow for waste gas. The equation for estimating CO2 emissions as specified in 40 CFR 98.253(b)(1)(ii)(A) is as follows:
𝐶𝑂2 = 0.99 × 0.001 × ���4412
× (𝐹𝑙𝑎𝑟𝑒)𝑝 ×(𝑀𝑊)𝑝𝑀𝑉𝐶
× (𝐶𝐶)𝑝�𝑛
𝑝=1
� ∗ 1.102311
Where:
CO2 = Annual CO2 emissions for a specific fuel type (short tons/year). 0.99 = Assumed combustion efficiency of the flare. 0.001 = Unit conversion factor (metric tons per kilogram, mt/kg). n = Number of measurement periods. The minimum value for n is 52 (for weekly measurements); the maximum value for n is 366 (for daily measurements during a leap year). p = Measurement period index. 44 = Molecular weight of CO2 (kg/kg-mole). 12 = Atomic weight of C (kg/kg-mole). (Flare)p = Volume of flare gas combusted during the measurement period (standard cubic feet per period, scf/period). If a mass flow meter is used, measure flare gas flow rate in kg/period and replace the term “(MW)p/MVC” with “1”. (MW)p = Average molecular weight of the flare gas combusted during measurement period (kg/kg-mole). If measurements are taken more frequently than daily, use the arithmetic average of measurement values within the day to calculate a daily average. MVC = Molar volume conversion factor (849.5 scf/kg-mole).

21
(CC)p = Average carbon content of the flare gas combusted during measurement period (kg C per kg flare gas ). If measurements are taken more frequently than daily, use the arithmetic average of measurement values within the day to calculate a daily average. 1.102311 = Conversion of metric tons to short tons.
The emission limits associated with CH4 and N2O are calculated based on emission factors provided in 40 CFR Part 98 Subpart C, Table C-2, site specific analysis of process fuel gas, and the actual heat input (HHV). XI. Equipment MSS (MEOHMSS) BACT Analysis MSS GHG emissions that are not able to be controlled by the flare will be emitted to the atmosphere. These MSS emissions are generated from the isolation of pipe sections and venting of equipment for MSS activities. These activities are infrequent in nature and will result in very minimal GHG emissions. These emissions are estimated at 0.9 TPY of CH4 and 19.4 TPY as CO2e. Step 1 – Identification of Potential Control Technologies for GHGs • Routing MSS Emissions to the Flare • Minimization of Releases to the Atmosphere
Step 2 – Elimination of Technically Infeasible Alternatives Routing MSS Emissions to the Flare The MSS emissions are generated from the venting of sections of pipe and some small pieces of equipment and account for less than 0.0001% of the overall emissions; therefore, routing these streams to the flare is considered technically infeasible. Step 3 – Ranking of Remaining Technologies Based on Effectiveness Because only one control option is technically feasible, there is no need to provide a ranking. Step 4 – Evaluation of Control Technologies in Order of Most Effective to Least Effective, with Consideration of Economic, Energy, and Environmental Impacts Because only one control option is technically feasible, there is no need to evaluate the economic, energy and environmental impacts of the proposed project.
22
Step 5 – Selection of BACT EPA concurs with Celanese that minimization of flare emissions is BACT. Celanese will plan maintenance activities in a manner to minimize the venting of emissions to the atmosphere and will maintain records of MSS activities resulting in releases to the atmosphere. BACT Limits and Compliance: Celanese will clear pipe and equipment of excess process gas prior to performing MSS activities. Releases to the atmosphere will be limited to no more than 15,000 ft3 of gases on a 12-month rolling basis. Records will be maintained of each event, date, time, and estimated volume of the release. XII. Emergency Generator (MEOHENG) BACT Analysis The proposed facility design includes an emergency diesel engine for an emergency generator. The engine shall be rated no greater than 350 KW. GHG emissions from the engine results from the combustion of diesel fuel and are comprised primarily of CO2, with CH4 and N2O present in smaller quantities. Step 1 – Identification of Potential Control Technologies
• Vendor certified Tier 3 Engine – Selection of an engine compliant with the non-road, compression ignition standards at 40 CFR Part 60 Subpart IIII.
• Selection of a clean burn engine – Clean burning engines are widely available at competitive prices.
• Restrict hours of operation – Operating hours can be restricted through monitoring by using a run-time meter.
• Use of low carbon fuels – Engine options include and engine powered by electricity, natural gas, or liquid fuel, such as gasoline or fuel oil.
Step 2 – Elimination of Technically Infeasible Alternatives Celanese’s analysis determined that the design and operational parameters designed to increase the engine’s efficiency are all technically feasible. However, due to the fact that the emergency engine is designed to operate during disruptions of availability of other fuel supplies or power sources, the use of lower-carbon fuels such as natural gas, which may experience fuel supply disruptions during natural disasters and emergencies, was determined to be technically infeasible and eliminated from further consideration.
23
Step 3 – Ranking of Remaining Technologies Based on Effectiveness Since the remaining technically feasible processes, practices, and designs in Step 1 are being proposed for the engine, a ranking of the control technologies is not necessary. Step 4 – Evaluation of Control Technologies in Order of Most Effective to Least Effective, with Consideration of Economic, Energy, and Environmental Impacts Since the remaining technically feasible processes, practices, and designs in Step 1 are being proposed for the engine, an evaluation of the most effective controls is not necessary. Step 5 – Selection of BACT EPA concurs with Celanese that the following specific practices are BACT for the emergency generator:
• Vendor Certified Tier 3 Engine - Celanese will install an efficient Tier 3 design engine meeting 40 CFR Part 60 Subpart IIII requirements §60.4205(b).
• Selection of a Clean Burn Engine o Celanese will select a diesel powered generator that will meet the EPA Tier 3
emission standards for engines. • Restrict Hours of Operation
o Limiting hours of operation for testing and maintenance to 100 hours/year. The engine is not restricted on the number runtime hours used in emergency situations.
BACT Limits and Compliance: Using the practices identified above results in an emission limit of 33.3 tpy CO2e for non-emergency operations. Celanese shall employ good combustion practices, including manufacturer’s recommended inspections and maintenance. To calculate the CO2e emissions, the draft permit requires calculation of the emissions based on the procedures and Global Warming Potentials (GWP) contained in the Greenhouse Gas Regulations, 40 CFR Part 98, Subpart A, Table A-1 as published on October 30, 2009 (74 FR 56395). Records of the calculations would be required to be kept to demonstrate compliance with the emission limits on a 12-month rolling average. Additionally, Celanese shall maintain records of fuel usage, hours of operation, and maintenance/tune-ups performed on the engines.
24
XIII. Fugitive Emissions (MEOHFUG) BACT Analysis GHGs emissions from leaking pipe components (fugitive emissions) in the proposed project contain CO2 and CH4. The majority of the fugitive emissions are CH4. Step 1 – Identification of Potential Control Technologies
• Installation of leakless technology components to eliminate fugitive emission sources. • Instrumented Leak Detection and Repair (LDAR) program • Leak Detections and Repair with remote sensing technology • Auditory, Visual, and Olfactory (AVO) monitoring program. • Design and construct facilities with high quality components, with materials of
construction compatible with the process. Step 2 – Elimination of Technically Infeasible Alternatives None of the options identified in Step 1 are considered technically infeasible. Leakless/Sealless Technology – Leakless technology valves may be incorporated in situations where highly toxic or otherwise hazardous materials are present. Likewise, some technologies, such as bellows valves, cannot be repaired without a unit shutdown. Instrument LDAR Programs – LDAR programs have traditionally been developed for control of VOC emissions. Instrumented monitoring is considered technically feasible for components in CH4 service. Remote Sensing – Remote sensing technologies have been proven effective in leak detection and repair. The use of sensitive infrared camera technology has become widely accepted as a cost effective means for identifying leaks of hydrocarbons. AVO Monitoring – Leaking components can be identified through AVO methods. AVO programs are common practice in industry and are considered technically feasible. High quality components - A key element for control of fugitive emissions is the use of high quality equipment that is designed for the specific service in which it is employed. The Celanese plant utilizes such components, and materials of construction, including gasketing that is compatible with the service in which they are employed.
25
Step 3 – Ranking of Remaining Technologies Based on Effectiveness
• Leakless Technologies (~100%) • Instrumented LDAR 28LAER (97%) • LDAR through Remote Sensing (>75%) • AVO Monitoring Program (30%) • Design and Construct Using High Quality Components (Not Measurable)
Leakless technologies are nearly 100% effective in eliminating fugitive emissions from the specific interface where installed, however leak interfaces remain even with leakless technology components in place. In addition, the sealing mechanism, such as a bellows, is not repairable online and may leak in the event of a failure until the next unit shutdown. This is the most effective of the controls. Instrumented monitoring can identify leaking CH4, making identification of components requiring repair possible. This is the second most effective of the controls. Remote sensing using an infrared imaging has proven effective for identification of leaks. Instrument LDAR programs and the alternative work practice of remote sensing using an infrared camera have been determined by EPA to be equivalent methods of piping fugitive controls.6 As-observed AVO methods are generally somewhat less effective than instrument LDAR and remote sensing, since they are not conducted at specific intervals. This method cannot generally identify leaks at as low a leak rate as instrument readings can. This method, due to frequency of observation, is effective for identification of larger leaks. Use of high quality components is effective in preventing emissions of GHGs, relative to use of lower quality components. Step 4 – Evaluation of Control Technologies in Order of Most Effective to Least Effective, with Consideration of Economic, Energy, and Environmental Impacts Use of leakless technology can have adverse environmental impacts, since following a failure of one of these parts, the component is most often not repairable online and may leak until the next unit shutdown, resulting in the emissions from the leak itself, and the emissions of GHG and other criteria pollutants that result from the need to shutdown and restart the facility. Based on these potential adverse environmental impacts, leakless technologies are eliminated as BACT. 6 73 FR 78199-78219, December 22, 2008.
26
LDAR programs for which instrumented detection of leaks is an essential activity have traditionally been developed for control of VOC emissions. The adverse impact of non-VOC fugitive emissions of CH4 due to global warming potential has not been quantified, and no reasonable cost effectiveness has been assigned. Celanese proposes to use TCEQ method 28LAER for LDAR. Remote sensing of fugitive components in CH4 service can provide an effective means to identify leaks. However, this option is rejected as BACT since the higher ranked 28LAER program will be adopted for control of fugitive CH4 emissions. Adverse impact of environmental impacts of as-observed AVO methods have not been noted, and no reasonable cost effectiveness has been assigned. Celanese proposes to use AVO methods as additional monitoring for leaks. Design to incorporate high quality components is effective in proving longer term emissions control. Step 5 – Selection of BACT EPA concurs with Celanese that BACT for the fugitive emissions is to use TCEQ method 28LAER for LDAR for fugitive emissions of methane for components that are in methane service (containing greater than 10% CH4). In addition to instrumented monitoring required by TCEQ 28LAER, Celanese will also use high quality components and conduct as-observed AVO monitoring. XIV. Cooling Towers (MEOHMT) BACT Analysis Although Celanese will utilize non-contact cooling water and a closed loop system for its cooling water needs, the potential exists for equipment (heat exchanger) leaks to cause CH4 to be entrained in the cooling water which could be air-stripped during the evaporative cooling of the water in the cooling towers. Step 1 – Identification of Potential Control Technologies Celanese identified only one available technology: leak detection through quarterly monitoring of cooling water and the subsequent repair of any heat exchangers that have been determined to be leaking. EPA is unable to independently identify any other available technology. Therefore, a detailed analysis under Steps 2-4 is not necessary.
27
Step 2 – Elimination of Technically Infeasible Alternatives The one control technology is determined to be technically feasible. Step 3 – Ranking of Remaining Technologies Based on Effectiveness Since there is only one control technology identified, a ranking is not available. Step 4 – Evaluation of Control Technologies in Order of Most Effective to Least Effective, with Consideration of Economic, Energy, and Environmental Impacts No adverse collateral impacts were identified. Step 5 – Selection of BACT The method for monitoring leaks in a heat exchanger/cooling tower does not differentiate between VOCs, and CH4. Therefore, a numerical BACT limit is technically infeasible. Celanese is proposing to implement a cooling tower leak monitoring and repair program that utilizes the monitoring and repair requirements of 40 CFR Part 63, Subpart F (HON MACT). TOC will be substituted for HAP when utilizing the HON MACT to determine if a GHG leak is present. TOC will be measured utilizing Method 5310 from Standard Methods for the Examination of Water and Wastewater. Any hydrocarbons detected by this method will be assumed to be CH4. BACT for the cooling towers shall consist of monthly monitoring for the first 6 months of operation, then a quarterly monitoring program thereafter, consistent with 40 CFR Part 63 Subpart F. Leak thresholds and timelines for repair will be consistent with § 63.104. XV. Endangered Species Act (ESA) Pursuant to Section 7(a)(2) of the Endangered Species Act (ESA) (16 U.S.C. 1536) and its implementing regulations at 50 CFR Part 402, EPA is required to insure that any action authorized, funded, or carried out by EPA is not likely to jeopardize the continued existence of any federally-listed endangered or threatened species or result in the destruction or adverse modification of such species’ designated critical habitat. To meet the requirements of Section 7, EPA is relying on a Biological Assessment (BA) prepared by the applicant and adopted by EPA. Further, EPA designated Celanese Ltd. (“Celanese”) and its consultant, Cardno ENTRIX, as non-federal representatives for purposes of preparation of the BA.
28
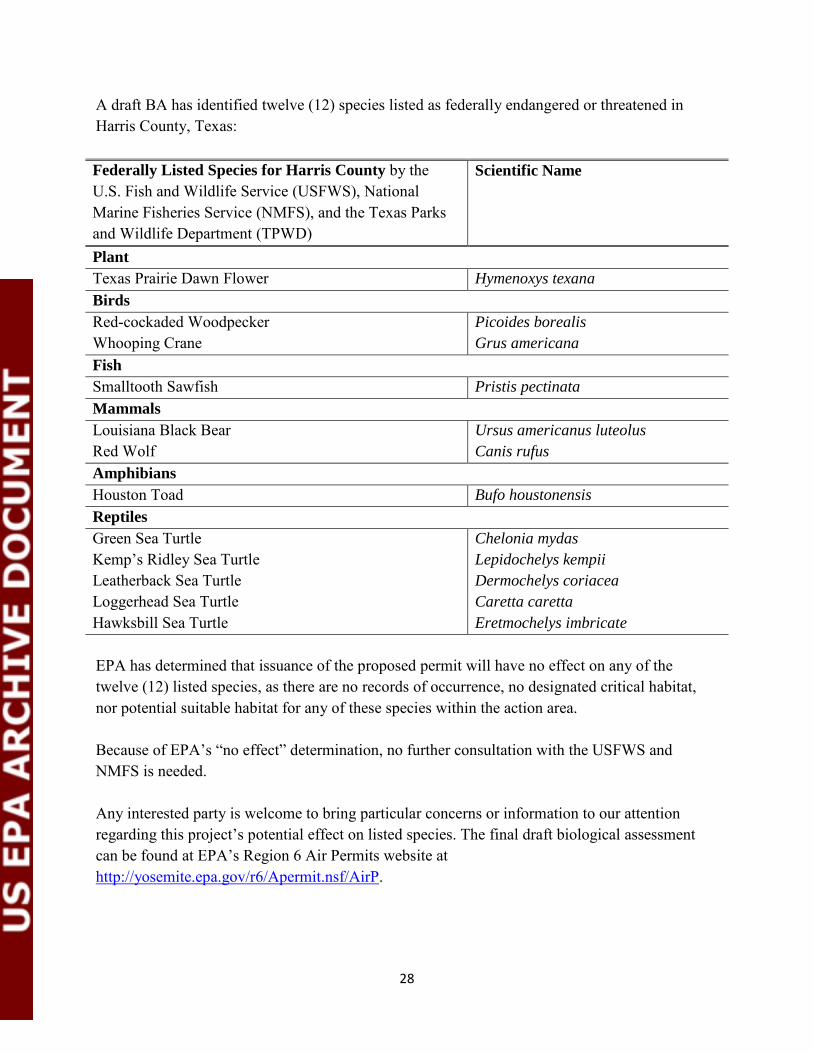
A draft BA has identified twelve (12) species listed as federally endangered or threatened in Harris County, Texas: Federally Listed Species for Harris County by the U.S. Fish and Wildlife Service (USFWS), National Marine Fisheries Service (NMFS), and the Texas Parks and Wildlife Department (TPWD)
Scientific Name
Plant Texas Prairie Dawn Flower Hymenoxys texana Birds Red-cockaded Woodpecker Picoides borealis Whooping Crane Grus americana Fish Smalltooth Sawfish Pristis pectinata Mammals Louisiana Black Bear Ursus americanus luteolus Red Wolf Canis rufus Amphibians Houston Toad Bufo houstonensis Reptiles Green Sea Turtle Chelonia mydas Kemp’s Ridley Sea Turtle Lepidochelys kempii Leatherback Sea Turtle Dermochelys coriacea Loggerhead Sea Turtle Caretta caretta Hawksbill Sea Turtle Eretmochelys imbricate EPA has determined that issuance of the proposed permit will have no effect on any of the twelve (12) listed species, as there are no records of occurrence, no designated critical habitat, nor potential suitable habitat for any of these species within the action area. Because of EPA’s “no effect” determination, no further consultation with the USFWS and NMFS is needed. Any interested party is welcome to bring particular concerns or information to our attention regarding this project’s potential effect on listed species. The final draft biological assessment can be found at EPA’s Region 6 Air Permits website at http://yosemite.epa.gov/r6/Apermit.nsf/AirP.
29
XVI. National Historic Preservation Act (NHPA) Section 106 of the NHPA requires EPA to consider the effects of this permit action on properties eligible for inclusion in the National Register of Historic Places. To make this determination, EPA relied on and adopted a cultural resource report prepared by Cardno ENTRIX submitted on February 18, 2013. For purposes of the NHPA review, the Area of Potential Effect (APE) was determined to be approximately 183 acres of land within the construction footprint of the existing facility. Cardno ENTRIX conducted a field survey, including shovel testing, of the property and a desktop review on the archaeological background and historical records within a 1.0-mile radius area of potential effect (APE) which included a review of the Texas Historical Commission’s online Texas Archaeological Site Atlas (TASA) and the National Park Service’s National Register of Historic Places (NRHP). Based on the results of the field survey, no archaeological resources or historic structures were found within the APE. Based on the desktop review, one previously recorded archaeological site potentially eligible for listing on the National Register and one National Register district were identified; however, both sites are outside the APE and neither site will be impacted visually or otherwise due to the construction and operation of the proposed project. EPA Region 6 determines that because no historic properties are located within the APE and that a potential for the location of archaeological resources within the construction footprint itself is low, issuance of the permit to Celanese will not affect properties potentially eligible for listing on the National Register. On April 24, 2013, EPA sent letters to Indian tribes identified by the Texas Historical Commission as having historical interests in Texas to inquire if any of the tribes have historical interest in the particular location of the project and to inquire whether any of the tribes wished to consult with EPA in the Section 106 process. EPA received no requests from any tribe to consult on this proposed permit. EPA will provide a copy of the report to the State Historic Preservation Officer for consultation and concurrence with its determination. Any interested party is welcome to bring particular concerns or information to our attention regarding this project’s potential effect on historic properties. A copy of the report may be found at http://yosemite.epa.gov/r6/Apermit.nsf/AirP.
XVII. Environmental Justice (EJ) Executive Order (EO) 12898 (59 FR 7629 (Feb. 16, 1994)) establishes federal executive branch policy on environmental justice. Based on this Executive Order, the EPA’s Environmental Appeals Board (EAB) has held that environmental justice issues must be considered in connection with the issuance of federal Prevention of Significant Deterioration (PSD) permits
30
issued by EPA Regional Offices [See, e.g., In re Prairie State Generating Company, 13 E.A.D. 1, 123 (EAB 2006); In re Knauf Fiber Glass, Gmbh, 8 E.A.D. 121, 174-75 (EAB 1999)]. This permitting action, if finalized, authorizes emissions of GHG, controlled by what we have determined is the Best Available Control Technology for those emissions. It does not select environmental controls for any other pollutants. Unlike the criteria pollutants for which EPA has historically issued PSD permits, there is no National Ambient Air Quality Standard (NAAQS) for GHG. The global climate-change inducing effects of GHG emissions, according to the “Endangerment and Cause or Contribute Finding”, are far-reaching and multi-dimensional (75 FR 66497). Climate change modeling and evaluations of risks and impacts are typically conducted for changes in emissions that are orders of magnitude larger than the emissions from individual projects that might be analyzed in PSD permit reviews. Quantifying the exact impacts attributable to a specific GHG source obtaining a permit in specific places and points would not be possible [PSD and Title V Permitting Guidance for GHGS at 48]. Thus, we conclude it would not be meaningful to evaluate impacts of GHG emissions on a local community in the context of a single permit. Accordingly, we have determined an environmental justice analysis is not necessary for the permitting record. XVIII. Conclusion and Proposed Action Based on the information supplied by Celanese, our review of the BACT analyses contained in the TCEQ PSD Permit Application and the GHG PSD Permit Application, and our independent evaluation of the information contained in our Administrative Record, it is our determination that the proposed facility would employ BACT for GHGs under the terms contained in the draft permit. Therefore, EPA is proposing to issue Celanese a PSD permit for GHGs for the facility, subject to the PSD permit conditions specified therein. This permit is subject to review and comments. A final decision on issuance of the permit will be made by EPA after considering comments received during the public comment period.
31
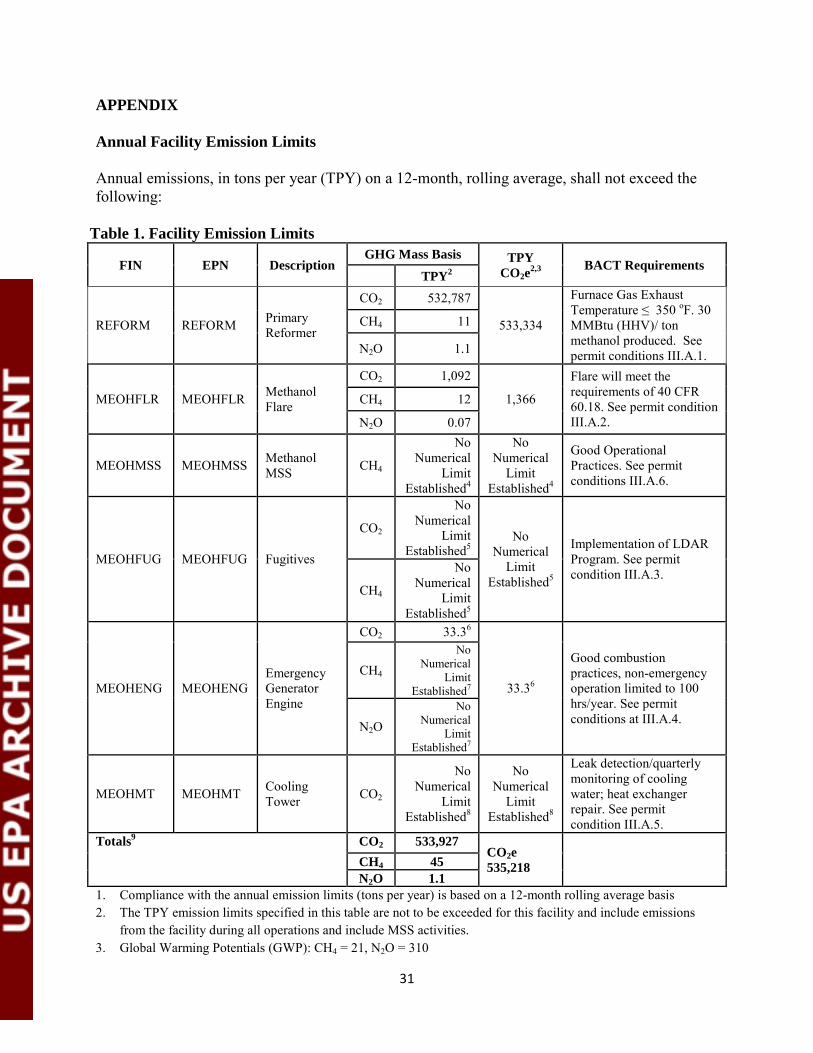
APPENDIX Annual Facility Emission Limits
Annual emissions, in tons per year (TPY) on a 12-month, rolling average, shall not exceed the following:
Table 1. Facility Emission Limits
FIN EPN Description GHG Mass Basis TPY
CO2e2,3 BACT Requirements
TPY2
REFORM REFORM Primary Reformer
CO2 532,787
533,334
Furnace Gas Exhaust Temperature ≤ 350 oF. 30 MMBtu (HHV)/ ton methanol produced. See permit conditions III.A.1.
CH4 11
N2O 1.1
MEOHFLR MEOHFLR Methanol Flare
CO2 1,092
1,366
Flare will meet the requirements of 40 CFR 60.18. See permit condition III.A.2.
CH4 12
N2O 0.07
MEOHMSS MEOHMSS Methanol MSS CH4
No Numerical
Limit Established4
No Numerical
Limit Established4
Good Operational Practices. See permit conditions III.A.6.
MEOHFUG MEOHFUG Fugitives
CO2
No Numerical
Limit Established5
No Numerical
Limit Established5
Implementation of LDAR Program. See permit condition III.A.3.
CH4
No Numerical
Limit Established5
MEOHENG MEOHENG Emergency Generator Engine
CO2 33.36
33.36
Good combustion practices, non-emergency operation limited to 100 hrs/year. See permit conditions at III.A.4.
CH4 No
Numerical Limit
Established7
N2O No
Numerical Limit
Established7
MEOHMT MEOHMT Cooling Tower CO2
No Numerical
Limit Established8
No Numerical
Limit Established8
Leak detection/quarterly monitoring of cooling water; heat exchanger repair. See permit condition III.A.5.
Totals9 CO2 533,927 CO2e 535,218
CH4 45 N2O 1.1
1. Compliance with the annual emission limits (tons per year) is based on a 12-month rolling average basis 2. The TPY emission limits specified in this table are not to be exceeded for this facility and include emissions
from the facility during all operations and include MSS activities. 3. Global Warming Potentials (GWP): CH4 = 21, N2O = 310
32
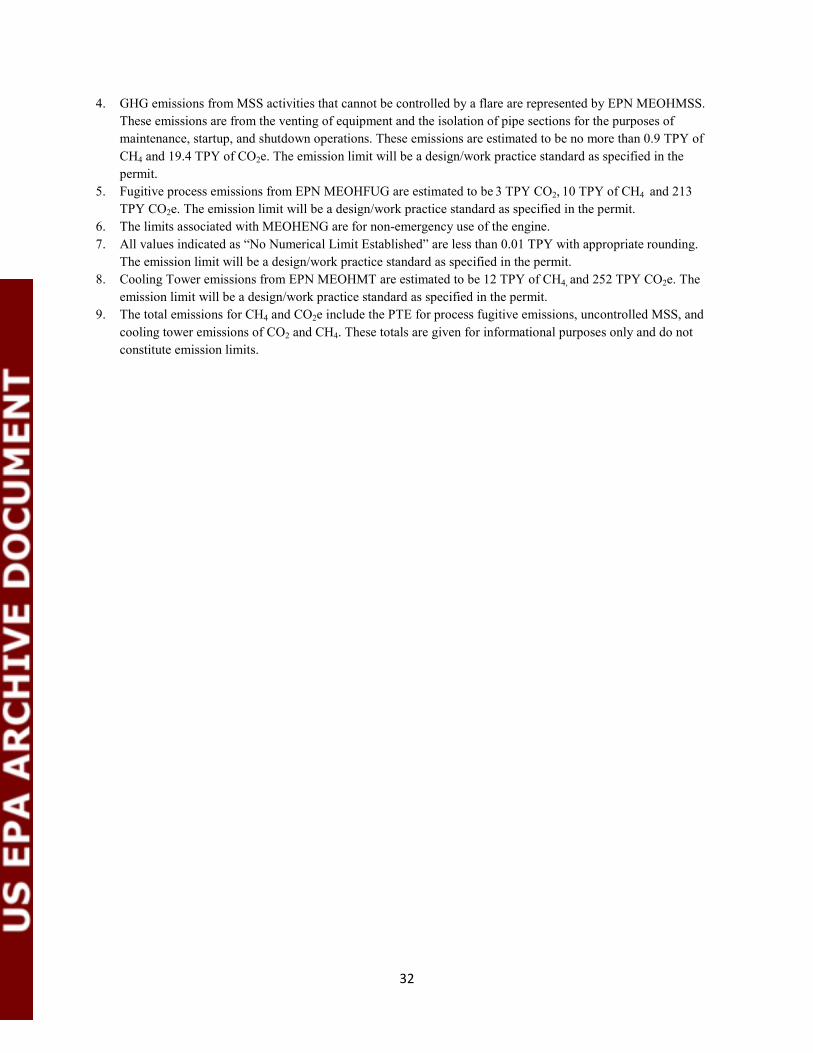
4. GHG emissions from MSS activities that cannot be controlled by a flare are represented by EPN MEOHMSS. These emissions are from the venting of equipment and the isolation of pipe sections for the purposes of maintenance, startup, and shutdown operations. These emissions are estimated to be no more than 0.9 TPY of CH4 and 19.4 TPY of CO2e. The emission limit will be a design/work practice standard as specified in the permit.
5. Fugitive process emissions from EPN MEOHFUG are estimated to be 3 TPY CO2, 10 TPY of CH4 and 213 TPY CO2e. The emission limit will be a design/work practice standard as specified in the permit.
6. The limits associated with MEOHENG are for non-emergency use of the engine. 7. All values indicated as “No Numerical Limit Established” are less than 0.01 TPY with appropriate rounding.
The emission limit will be a design/work practice standard as specified in the permit. 8. Cooling Tower emissions from EPN MEOHMT are estimated to be 12 TPY of CH4, and 252 TPY CO2e. The
emission limit will be a design/work practice standard as specified in the permit. 9. The total emissions for CH4 and CO2e include the PTE for process fugitive emissions, uncontrolled MSS, and
cooling tower emissions of CO2 and CH4. These totals are given for informational purposes only and do not constitute emission limits.