Embed Size (px)
Citation preview
1
For the year ending 31 March 2018
Cambridge City Council
Statement of Accounts
Cambridge City Council Statement of Accounts
2017/18
Contents
Narrative Report ........................................................................................................................................ i Statement of Accounts Statement of Responsibilities ........................................................................................................................... xi Annual Governance Statement ..................................................................................................................... xiii Auditors' Report on the Accounts ................................................................................................................ xxiii
Main Financial Statements:
♦ Movement in Reserves Statement .............................................................................. 3
♦ Comprehensive Income and Expenditure Statement .................................................. 5 ♦ Balance Sheet ............................................................................................................ 6 ♦ Cash Flow Statement ................................................................................................. 7
Notes to the Main Financial Statements ........................................................................................... 10
Additional Financial Statements and Information:
♦ Housing Revenue Account Income and Expenditure Account .................................. 73 ♦ Statement of Movement on the Housing Revenue Account Balance ........................ 74
♦ Notes to the Housing Revenue Account ................................................................... 75 ♦ Collection Fund ......................................................................................................... 79
♦ Notes to the Collection Fund ................................................................................................ 80
Group Financial Statements:
♦ Group Movement in Reserves Statement ................................................................. 86
♦ Group Comprehensive Income and Expenditure Statement ..................................... 88
♦ Group Balance Sheet ............................................................................................... 89
♦ Group Cash Flow Statement ..................................................................................... 90
Notes to the Group Financial Statements ....................................................................... 92
Statement of Accounting Policies and Glossary:
♦ Statement of Accounting Policies ............................................................................ 103
♦ Glossary of Financial Terms and Abbreviations ...................................................... 123

Narrative Report
Statement of Accounts i
The Statement of Accounts, set out on pages 1 to 121, contain a series of statements, summarising the financial implications to the Council of delivering services in the period from 1 April 2017 to 31 March 2018. In addition, details of the Council’s assets and liabilities at the beginning and end of the Council’s financial year are presented.
The accounts have been prepared in accordance with the ‘Code of Practice on Local Authority Accounting in the United Kingdom’ (The Code). The code is based on International Financial Reporting Standards (IFRS) and sets out the format and content of the key financial statements and accompanying notes in this publication.
In addition to the Council’s Statement of Accounts, consolidated Group Accounts are also presented. The key financial statements are as follows:
♦ Movement in Reserves Statement ♦ Comprehensive Income and Expenditure Statement ♦ Balance Sheet ♦ Cash Flow Statement ♦ Housing Revenue Account ♦ Collection Fund ♦ Group Movement in Reserves Statement ♦ Group Comprehensive Income and Expenditure Statement ♦ Group Balance Sheet ♦ Group Cash Flow Statement
These accounts are supported by a comprehensive set of notes together with a statement of the accounting policies of the Council and a glossary of terms. An index to the main notes to the accounts is provided on page 10.
The accounts aim to provide information so that members of the public, including electors and residents of Cambridge, Council Members, partners, stakeholders and other interested parties can:
♦ Understand the overarching financial position of the Council ♦ Have confidence that public money has been accounted for in an appropriate manner ♦ Be assured that the financial position of the Council is sound and secure
Review of 2017/18
The Narrative Report is designed to explain the most significant features of the accounts and to provide information on the Council’s use of resources.
The Report includes the review of achievements against the Council’s Corporate Plan which is also due to be presented to the Council’s Strategy and Resources Committee in July 2018, alongside a review of the financial performance for the year.
Narrative Report
Statement of Accounts ii
Corporate Plan – Review of 2017/18
The Council’s Corporate Plan for 2016-19 sets out the key activities Cambridge City Council will undertake over a three year period in order to achieve its strategic objectives and vision.
An Annual Report shows what has been achieved each year against each of the objectives contained within the Corporate Plan. For the second year of the Corporate Plan our headline achievements have been:
Deliver sustainable prosperity for Cambridge and fair shares for all
• Spent just over £255,000 of additional money from a Sharing Prosperity Fund to deliver 21 projects set out in our Anti-Poverty Strategy to improve the lives of local people living on low incomes in the city.
• Over 110,000 people, including low income families, attended our Community Centres during the year to participate in a wide range of activities.
• Funded over 100 voluntary and community groups to deliver services and activities to support vulnerable people in local communities.
• Our Children and Young People's Participation Service provided just over 700 sessions, which were attended by 25,000 children
• Continued to ensure that vital local legal, debt and money advice is available free to city residents in most need by providing Cambridge Citizens Advice Bureau with £260,000 of community grant.
Tackle the city’s housing crisis and delivering our planning objectives
• Investigated nearly 300 complaints concerning housing standards and empty properties and served 39 enforcement notices to bring about improvements.
• Helped bring back into use 26 empty homes and trained 48 landlords in good housing management practice.
• Just over 400 new affordable homes were completed, 190 of those from the council’s own programme, providing a mix of social housing for rent, shared ownership and intermediate rent.
• Prevented or relieved from homelessness for just over 1,200 people.
• Supported 1,100 people living within council sheltered housing schemes and funded a project to reduce pensioner poverty.
Make Cambridge safer and more inclusive
• Dealt with just over 1,700 complaints relating to noise nuisance, served a total of 32 abatement notices and successfully prosecuted two individuals.
• Dealt with over 300 cases of antisocial behaviour, of which over 100 involved intensive casework.
• Provided grant aid support to a Dual Diagnosis Street Team (DDST), working with rough sleepers who have both substance misuse and mental health problems.
• Responded to 543 reports of detrimental graffiti, cleaning the affected areas, investigated 1,510 incidents of fly-tipping and removed 935 derelict cycles.
Narrative Report
Statement of Accounts iii
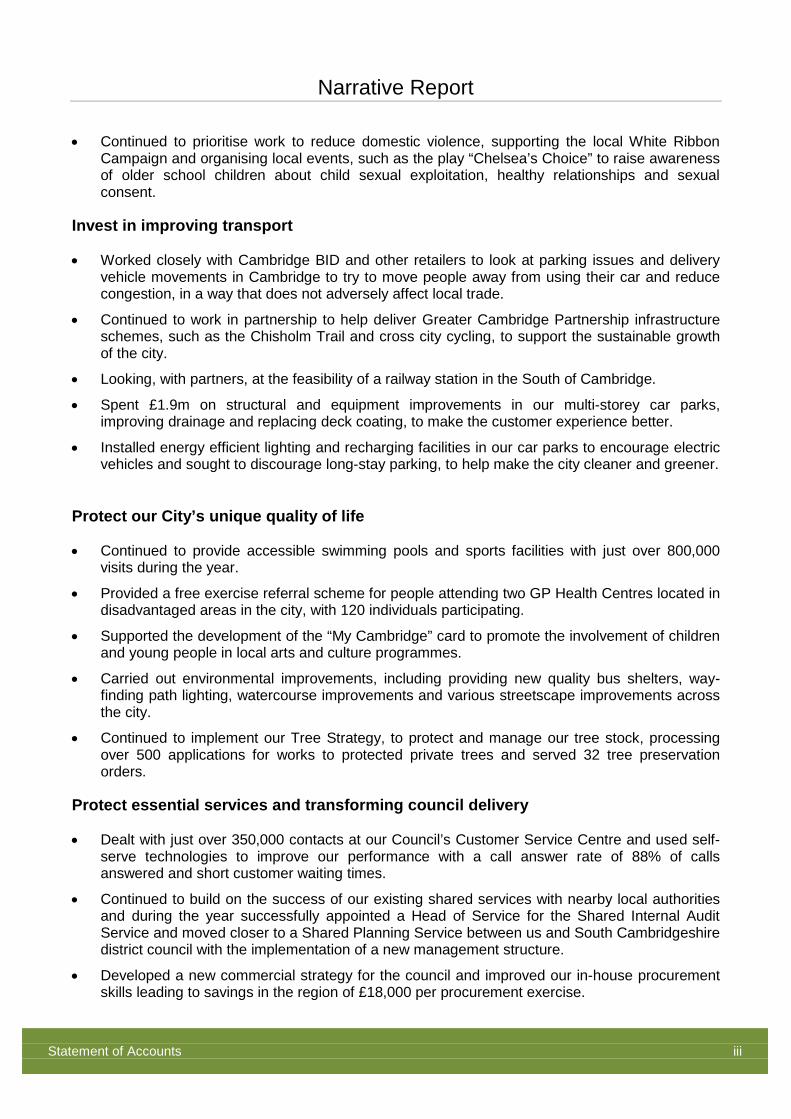
• Continued to prioritise work to reduce domestic violence, supporting the local White Ribbon Campaign and organising local events, such as the play “Chelsea’s Choice” to raise awareness of older school children about child sexual exploitation, healthy relationships and sexual consent.
Invest in improving transport
• Worked closely with Cambridge BID and other retailers to look at parking issues and delivery vehicle movements in Cambridge to try to move people away from using their car and reduce congestion, in a way that does not adversely affect local trade.
• Continued to work in partnership to help deliver Greater Cambridge Partnership infrastructure schemes, such as the Chisholm Trail and cross city cycling, to support the sustainable growth of the city.
• Looking, with partners, at the feasibility of a railway station in the South of Cambridge.
• Spent £1.9m on structural and equipment improvements in our multi-storey car parks, improving drainage and replacing deck coating, to make the customer experience better.
• Installed energy efficient lighting and recharging facilities in our car parks to encourage electric vehicles and sought to discourage long-stay parking, to help make the city cleaner and greener.
Protect our City’s unique quality of life
• Continued to provide accessible swimming pools and sports facilities with just over 800,000 visits during the year.
• Provided a free exercise referral scheme for people attending two GP Health Centres located in disadvantaged areas in the city, with 120 individuals participating.
• Supported the development of the “My Cambridge” card to promote the involvement of children and young people in local arts and culture programmes.
• Carried out environmental improvements, including providing new quality bus shelters, way-finding path lighting, watercourse improvements and various streetscape improvements across the city.
• Continued to implement our Tree Strategy, to protect and manage our tree stock, processing over 500 applications for works to protected private trees and served 32 tree preservation orders.
Protect essential services and transforming council delivery
• Dealt with just over 350,000 contacts at our Council’s Customer Service Centre and used self-serve technologies to improve our performance with a call answer rate of 88% of calls answered and short customer waiting times.
• Continued to build on the success of our existing shared services with nearby local authorities and during the year successfully appointed a Head of Service for the Shared Internal Audit Service and moved closer to a Shared Planning Service between us and South Cambridgeshire district council with the implementation of a new management structure.
• Developed a new commercial strategy for the council and improved our in-house procurement skills leading to savings in the region of £18,000 per procurement exercise.
Narrative Report
Statement of Accounts iv
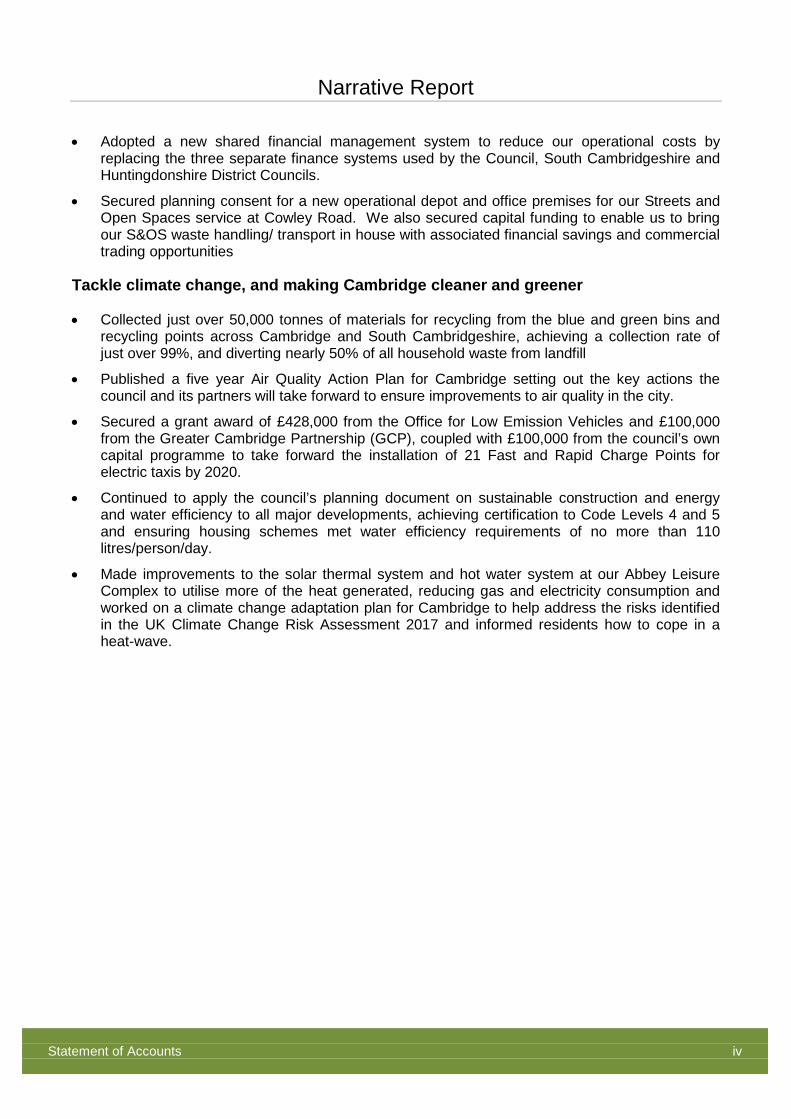
• Adopted a new shared financial management system to reduce our operational costs by replacing the three separate finance systems used by the Council, South Cambridgeshire and Huntingdonshire District Councils.
• Secured planning consent for a new operational depot and office premises for our Streets and Open Spaces service at Cowley Road. We also secured capital funding to enable us to bring our S&OS waste handling/ transport in house with associated financial savings and commercial trading opportunities
Tackle climate change, and making Cambridge cleaner and greener
• Collected just over 50,000 tonnes of materials for recycling from the blue and green bins and recycling points across Cambridge and South Cambridgeshire, achieving a collection rate of just over 99%, and diverting nearly 50% of all household waste from landfill
• Published a five year Air Quality Action Plan for Cambridge setting out the key actions the council and its partners will take forward to ensure improvements to air quality in the city.
• Secured a grant award of £428,000 from the Office for Low Emission Vehicles and £100,000 from the Greater Cambridge Partnership (GCP), coupled with £100,000 from the council’s own capital programme to take forward the installation of 21 Fast and Rapid Charge Points for electric taxis by 2020.
• Continued to apply the council’s planning document on sustainable construction and energy and water efficiency to all major developments, achieving certification to Code Levels 4 and 5 and ensuring housing schemes met water efficiency requirements of no more than 110 litres/person/day.
• Made improvements to the solar thermal system and hot water system at our Abbey Leisure Complex to utilise more of the heat generated, reducing gas and electricity consumption and worked on a climate change adaptation plan for Cambridge to help address the risks identified in the UK Climate Change Risk Assessment 2017 and informed residents how to cope in a heat-wave.
Narrative Report
Statement of Accounts v
Review of Financial Performance 2017/18
Revenue Spending and Income
General Fund Services
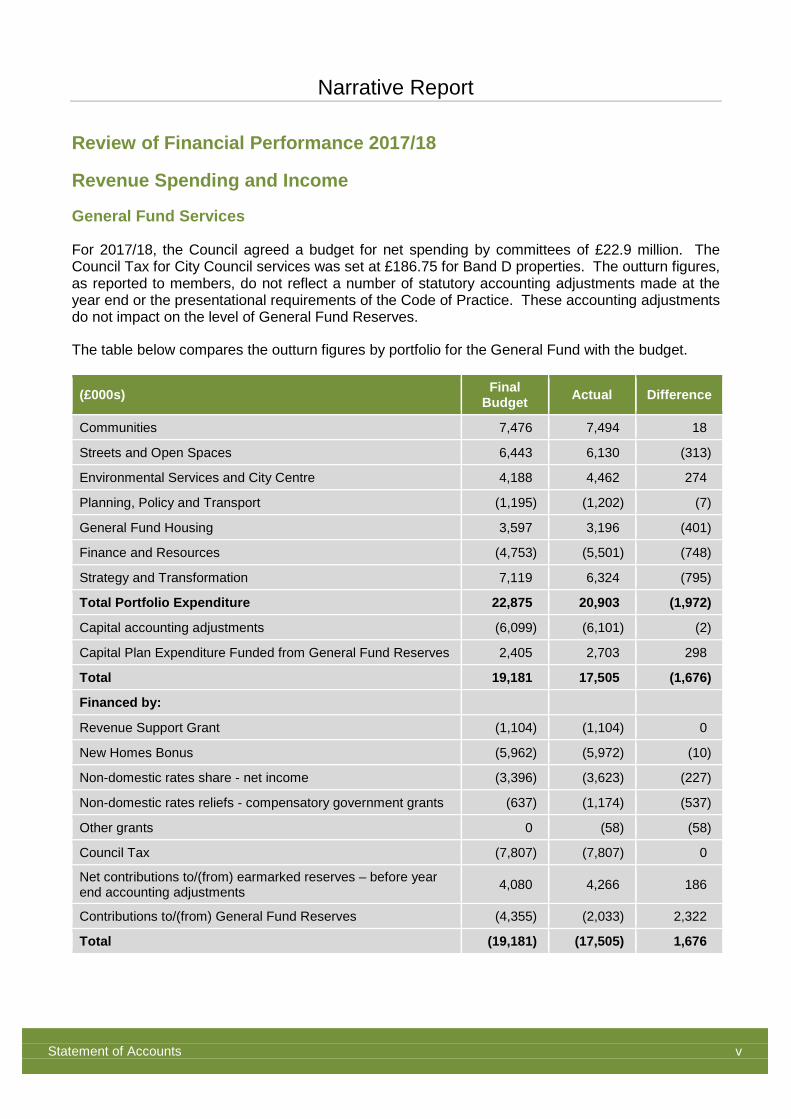
For 2017/18, the Council agreed a budget for net spending by committees of £22.9 million. The Council Tax for City Council services was set at £186.75 for Band D properties. The outturn figures, as reported to members, do not reflect a number of statutory accounting adjustments made at the year end or the presentational requirements of the Code of Practice. These accounting adjustments do not impact on the level of General Fund Reserves.
The table below compares the outturn figures by portfolio for the General Fund with the budget.
(£000s) Final Budget Actual Difference
Communities 7,476 7,494 18
Streets and Open Spaces 6,443 6,130 (313)
Environmental Services and City Centre 4,188 4,462 274
Planning, Policy and Transport (1,195) (1,202) (7)
General Fund Housing 3,597 3,196 (401)
Finance and Resources (4,753) (5,501) (748)
Strategy and Transformation 7,119 6,324 (795)
Total Portfolio Expenditure 22,875 20,903 (1,972)
Capital accounting adjustments (6,099) (6,101) (2)
Capital Plan Expenditure Funded from General Fund Reserves 2,405 2,703 298
Total 19,181 17,505 (1,676)
Financed by:
Revenue Support Grant (1,104) (1,104) 0
New Homes Bonus (5,962) (5,972) (10)
Non-domestic rates share - net income (3,396) (3,623) (227)
Non-domestic rates reliefs - compensatory government grants (637) (1,174) (537)
Other grants 0 (58) (58)
Council Tax (7,807) (7,807) 0
Net contributions to/(from) earmarked reserves – before year end accounting adjustments 4,080 4,266 186
Contributions to/(from) General Fund Reserves (4,355) (2,033) 2,322
Total (19,181) (17,505) 1,676
Narrative Report
Statement of Accounts vi
The Council’s actual net portfolio revenue expenditure was £1,972,000 less than the final budget set for the year. A variety of factors contributed to this overall position but the single largest factor was an underspend on staff costs (net of agency costs).
Under statutory regulation the amount of business rates credited to the General Fund in 2017/18 is based on an estimate, with any resulting difference being recovered from the General Fund, or paid to it in future years. Taking into account the levy payment due to central government for the year on growth above the assumed baseline, the charge for recovery of previous years’ deficits and business rate relief compensatory grants from central government, the income credited to the General Fund was £764,000 above the budget.
As noted above the outturn presentation differs from that required by the Code for the Statement of Accounts. Note 1 to the Statement of Accounts reconciles the difference between the total spend as reported at outturn with the amount chargeable to the General Fund and that presented in the Comprehensive Income and Expenditure Statement.
Overall, a net contribution from General Fund reserves of £2,031,000 has been reflected in the financial statements against a budgeted use of reserves of £4,355,000. At the 31 March 2018 the reserve stood at £13,381,000.
Narrative Report
Statement of Accounts vii
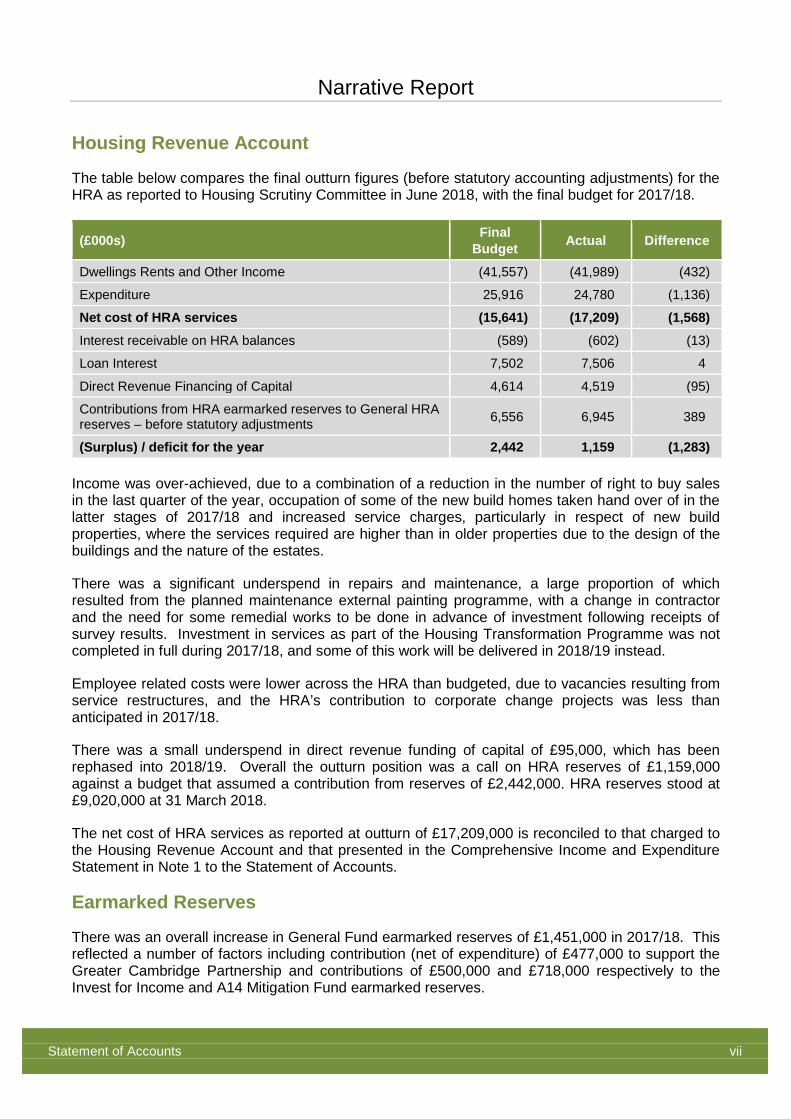
Housing Revenue Account
The table below compares the final outturn figures (before statutory accounting adjustments) for the HRA as reported to Housing Scrutiny Committee in June 2018, with the final budget for 2017/18.
(£000s) Final Budget Actual Difference
Dwellings Rents and Other Income (41,557) (41,989) (432)
Expenditure 25,916 24,780 (1,136)
Net cost of HRA services (15,641) (17,209) (1,568) Interest receivable on HRA balances (589) (602) (13)
Loan Interest 7,502 7,506 4
Direct Revenue Financing of Capital 4,614 4,519 (95)
Contributions from HRA earmarked reserves to General HRA reserves – before statutory adjustments 6,556 6,945 389
(Surplus) / deficit for the year 2,442 1,159 (1,283)
Income was over-achieved, due to a combination of a reduction in the number of right to buy sales in the last quarter of the year, occupation of some of the new build homes taken hand over of in the latter stages of 2017/18 and increased service charges, particularly in respect of new build properties, where the services required are higher than in older properties due to the design of the buildings and the nature of the estates.
There was a significant underspend in repairs and maintenance, a large proportion of which resulted from the planned maintenance external painting programme, with a change in contractor and the need for some remedial works to be done in advance of investment following receipts of survey results. Investment in services as part of the Housing Transformation Programme was not completed in full during 2017/18, and some of this work will be delivered in 2018/19 instead.
Employee related costs were lower across the HRA than budgeted, due to vacancies resulting from service restructures, and the HRA’s contribution to corporate change projects was less than anticipated in 2017/18.
There was a small underspend in direct revenue funding of capital of £95,000, which has been rephased into 2018/19. Overall the outturn position was a call on HRA reserves of £1,159,000 against a budget that assumed a contribution from reserves of £2,442,000. HRA reserves stood at £9,020,000 at 31 March 2018.
The net cost of HRA services as reported at outturn of £17,209,000 is reconciled to that charged to the Housing Revenue Account and that presented in the Comprehensive Income and Expenditure Statement in Note 1 to the Statement of Accounts.
Earmarked Reserves
There was an overall increase in General Fund earmarked reserves of £1,451,000 in 2017/18. This reflected a number of factors including contribution (net of expenditure) of £477,000 to support the Greater Cambridge Partnership and contributions of £500,000 and £718,000 respectively to the Invest for Income and A14 Mitigation Fund earmarked reserves.
Narrative Report
Statement of Accounts viii
There was an overall increase in HRA earmarked reserves of £6,884,000. A contribution of £6,770,000 was made to a fund for possible future redevelopment or debt redemption.
Capital Spending and Receipts
In 2017/18 the Council spent £27,896,000 on property, plant and equipment. Of this £6,403,000 was on major repairs and improvements to council dwellings, £2,193,000 on vehicles, plant and equipment and £17,831,000 on assets in the course of construction. Of the assets in the course of construction spend £11,047,000 was on new housing developments. £23,065,000 was transferred from assets in the course of construction to HRA dwellings on completion of new homes, including over 100 at Clay Farm and others on sites at Ekin Road, Water Lane and Fulbourn Road.
Expenditure in the year on assets in the course of construction also included £3,659,000 on the new multi-agency community centre at Clay Farm added to expenditure in prior years. This centre opened towards the end of the year with £6,373,000 being transferred from Assets Under Construction to Land and Buildings and £4,967,000 of expenditure was transferred to Assets Held for Sale representing the share of construction costs for flats which were then disposed of on a long lease to a housing association.
Capital receipts continue to be generated through the sale of land, council houses, shared ownership dwellings and other property. Disposal proceeds were £26,334,000 in the year of which £11,550,000 was in relation to the disposal of housing properties. £961,000 of housing receipts had to be paid over to central government.
Disposal proceeds included deferred receipts in relation to the disposal of the Mill Road depot to Cambridge Investment Partnership LLP (a venture in which the Council has a 50% interest) to facilitate the redevelopment of site for a mix of affordable and market housing. The Council also disposed of a site at Orchard Park to a co-housing group for redevelopment.
The Council’s future commitments under capital contracts are detailed further in Note 18 to the accounts.
Assets
Just as in the private sector, changes in the values of Council-owned property are reflected in the accounts each year. As a result of asset revaluations and the capital expenditure discussed above (and net of asset disposals) the value of Property, Plant and Equipment increased by £24,609,000 to £795,643,000 and the value of Investment Property increased by £21,575,000 to £175,281,000 as at 31 March 2018. Although these movements appear significant, it should be noted that revaluation increases and decreases are not realised until assets are disposed of.
Liabilities
The Council did not need to undertake any new external borrowing during the year. The external debt of £213.6 million shown in the Balance Sheet at the end of the financial year relates to borrowing undertaken in 2011/12 to meet a one-off debt settlement payment to Central Government in relation to new Self-Financing arrangements for the Housing Revenue Account.
The Council’s share of the assets and liabilities of the County Pension Fund show an estimated net liability of £113.6 million at 31 March 2018. This liability has no impact on the level of the Council’s usable reserves.
Narrative Report
Statement of Accounts ix
The net pension liability has decreased this year by £ 0.4 million. This net figure reflects a number of factors including an increase in the discount rate used by the actuary to estimate the Council’s scheme liabilities. Further information on this change and relating to the assets, liabilities, income and expenditure of the Council’s pension scheme is presented in note 36.
Cash flows
The balance of cash and cash equivalents at 31 March 2018 was £8,248,000. This excludes the Council’s investments in fixed term deposits and other longer term investments which are detailed in note 22. Further information on cash flows for the year can be found in the cash flow statement and accompanying notes.
Council Staff
The number of staff employed by the Council fell during the year from 725 full time equivalents at 31 March 2017 to 698 at 31 March 2018.
Trade Union Facility Time
Details of trade union facility time can be found at www.cambridge.gov.uk/open-data
Group Performance
The accounts include the group accounts which include the performance of the Council’s wholly owned subsidiary, Cambridge City Housing Company and that of the Cambridge Investment Partnership LLP, a joint venture.
Looking ahead to 2018/19
Following on from previous shared service arrangements, with both South Cambridgeshire and Huntingdonshire District Councils, the Council began sharing planning services with South Cambridgeshire on 1 April 2018.
The Council will conclude the relocation of services from Mill Road depot and occupy new premises in Cowley Road. It will also begin a major IT upgrade with the introduction of ‘Council Anywhere’ which will allow staff to work more flexibly.
The Council continues to explore sites for redevelopment and the provision of new affordable homes with Cambridge Investment Partnership LLP. The Council purchased a site off Cromwell Road in June 2018.
The Council is well placed to deal with the challenges of reduced central government funding, including the phasing out of Revenue Support Grant and changes to New Homes Bonus, but there will continue to be financial pressures. There remains uncertainty around the proposed move to 100% business rates retention, but the Council will continue to work to understand the implications and the risks that this will bring in the future.
Narrative Report
Statement of Accounts x
Further Information
Further information about the accounts is available from:
Head of Finance Cambridge City Council PO Box 700 Cambridge CB1 0JH
In addition, interested members of the public have a right to inspect the accounts each year before the audit is completed. This period opens on the 1 June for 30 working days. The availability of the accounts for public inspection is advertised on the Council’s website.
Statement of Responsibilities for the Statement of Accounts
Statement of Accounts xi
The Council’s Responsibilities
The Council is required to:
♦ make arrangements for the proper administration of its financial affairs and to secure that one of its officers has the responsibility for the administration of those affairs. In this Council, that officer is the Head of Finance;
♦ manage its affairs to secure economic, efficient and effective use of resources and safeguard its assets; and
♦ approve the Statement of Accounts.
The Head of Finance’s Responsibilities
The Head of Finance is responsible for the preparation of the Council’s Statement of Accounts in accordance with proper practices as set out in the Chartered Institute of Public Finance and Accountancy (CIPFA) Code of Practice on Local Authority Accounting in the United Kingdom.
In preparing the Statement of Accounts, the Head of Finance has:
♦ selected suitable accounting policies and then applied them consistently;
♦ made judgements and estimates that were reasonable and prudent; and
♦ Complied with the Code of Practice.
The Head of Finance has also:
♦ kept proper accounting records which were up to date; and
♦ Taken reasonable steps for the prevention and detection of fraud and other irregularities.
Opinion
I certify that the Statement of Accounts present a true and fair view of the financial position of Cambridge City Council at 31 March 2018 and its income and expenditure for the year then ended.
Caroline Ryba Head of Finance Date: 25 July 2018
I confirm that the accounts were approved by the Civic Affairs Committee held on the 25 July 2018.
Cllr Russ McPherson Chair of Civic Affairs Date: 25 July 2018

Annual Governance Statement
Statement of Accounts xiii
Introduction and purpose
The Council is responsible for ensuring that its business is conducted in accordance with the law and proper standards, that public money is safeguarded and properly accounted for, and that is also provides value for money. It has to effectively manage its risks, and put in place proper arrangements for the governance of its affairs.
Definition of Corporate Governance
Corporate governance generally refers to the processes by which an organisation is directed, controlled, led and held to account.
Good governance in the public sector means: "achieving the intended outcomes while acting in the public interest at all times"
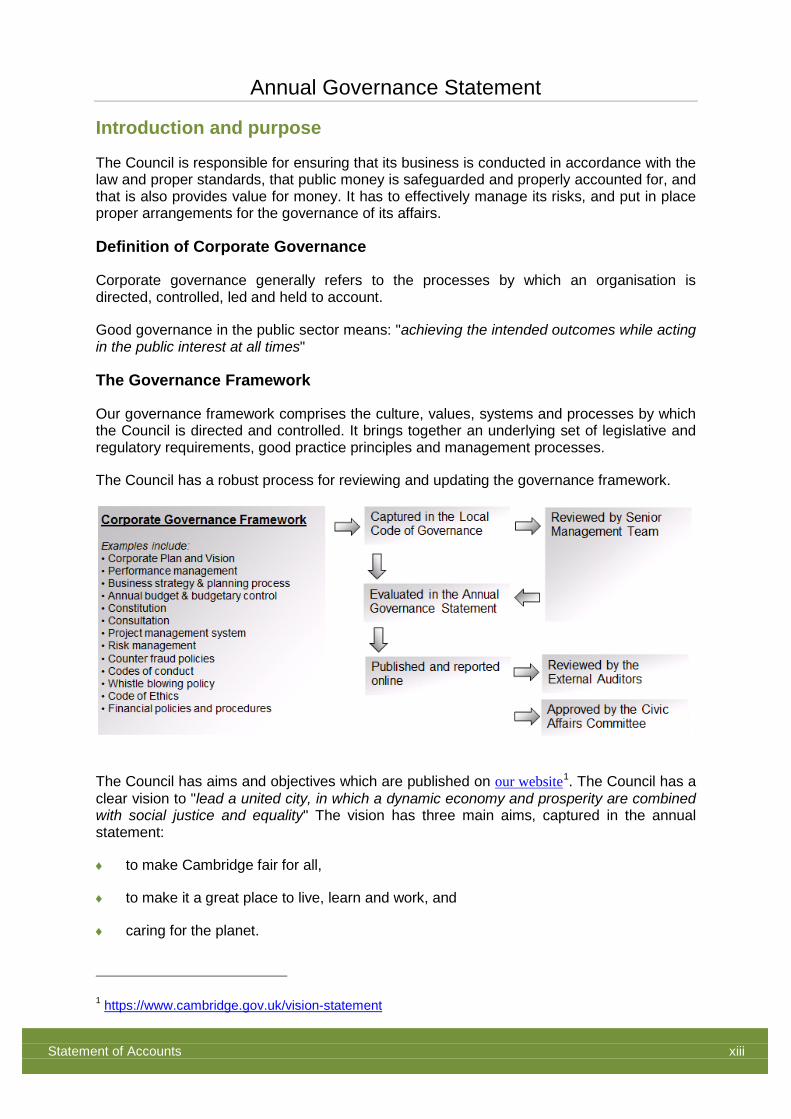
The Governance Framework
Our governance framework comprises the culture, values, systems and processes by which the Council is directed and controlled. It brings together an underlying set of legislative and regulatory requirements, good practice principles and management processes.
The Council has a robust process for reviewing and updating the governance framework.
The Council has aims and objectives which are published on our website1. The Council has a clear vision to "lead a united city, in which a dynamic economy and prosperity are combined with social justice and equality" The vision has three main aims, captured in the annual statement:
♦ to make Cambridge fair for all,
♦ to make it a great place to live, learn and work, and
♦ caring for the planet.
1 https://www.cambridge.gov.uk/vision-statement
Annual Governance Statement
Statement of Accounts xiv
The Council produces a Corporate Plan 2, which sets strategic objectives under seven themes:
♦ Delivering sustainable prosperity for Cambridge and fair shares for all
♦ Tackling the city’s housing crisis and delivering our planning objectives
♦ Making Cambridge safer and more inclusive
♦ Investing in improving transport and tackling congestion
♦ Protecting our city’s unique quality of life
♦ Tackling climate change, and making Cambridge cleaner and greener
♦ Protecting essential services and transforming council delivery
The Council prepares an Annual Report illustrating progress against the plan each year, and this is published on the website.
The governance framework has been in place at the Council for the year ended 31 March 2018 and up to the date of approval of the statement of accounts.
Local Code of Governance
We are responsible for ensuring that there is a sound system of governance which incorporates the system of internal control.
This Governance Framework is recorded in our Local Code of Governance, which is underpinned by the 7 principles of good governance as set out in the CIPFA / SOLACE publication ‘Delivering Good Governance in Local Government Framework 2016’. The principles are:
A. behaving with integrity and in accordance with our core values
B. being open and ensuring effective engagement takes place
C. working together to achieve our intended outcomes
D. setting goals for economic, social and environmental benefits and reaching them
E. growing our capacity - including our leadership and the people who work with us
F. managing risks and performance through robust internal control and strong financial management
G. Implementing good practice in transparency, reporting and audit – delivering effective accountability
2 https://www.cambridge.gov.uk/corporate-plan
Annual Governance Statement
Statement of Accounts xv
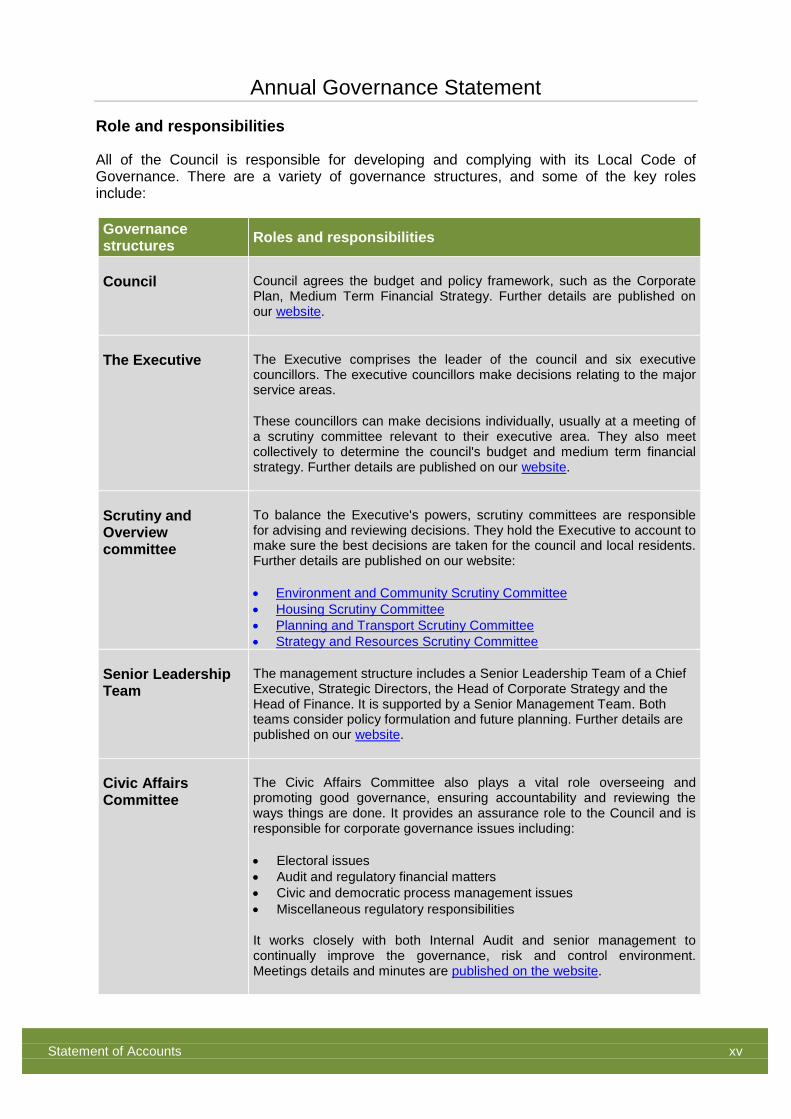
Role and responsibilities
All of the Council is responsible for developing and complying with its Local Code of Governance. There are a variety of governance structures, and some of the key roles include:
Governance structures Roles and responsibilities
Council Council agrees the budget and policy framework, such as the Corporate Plan, Medium Term Financial Strategy. Further details are published on our website.
The Executive The Executive comprises the leader of the council and six executive councillors. The executive councillors make decisions relating to the major service areas.
These councillors can make decisions individually, usually at a meeting of a scrutiny committee relevant to their executive area. They also meet collectively to determine the council's budget and medium term financial strategy. Further details are published on our website.
Scrutiny and Overview committee
To balance the Executive's powers, scrutiny committees are responsible for advising and reviewing decisions. They hold the Executive to account to make sure the best decisions are taken for the council and local residents. Further details are published on our website:
• Environment and Community Scrutiny Committee • Housing Scrutiny Committee • Planning and Transport Scrutiny Committee • Strategy and Resources Scrutiny Committee
Senior Leadership Team
The management structure includes a Senior Leadership Team of a Chief Executive, Strategic Directors, the Head of Corporate Strategy and the Head of Finance. It is supported by a Senior Management Team. Both teams consider policy formulation and future planning. Further details are published on our website.
Civic Affairs Committee
The Civic Affairs Committee also plays a vital role overseeing and promoting good governance, ensuring accountability and reviewing the ways things are done. It provides an assurance role to the Council and is responsible for corporate governance issues including:
• Electoral issues • Audit and regulatory financial matters • Civic and democratic process management issues • Miscellaneous regulatory responsibilities
It works closely with both Internal Audit and senior management to continually improve the governance, risk and control environment. Meetings details and minutes are published on the website.
Annual Governance Statement
Statement of Accounts xvi
Purpose of the Annual Governance Statement
The Council conducts a review of its system of internal control, prepares and publishes an Annual Governance Statement in each financial year.
This enables us to demonstrate whether, and to what extent, the Council complied with its Local Code of Governance.
The Local Code of Governance is updated regularly. This process records our good practice, and also helps us to plan further action which can improve our governance arrangements.
Statutory compliance
Producing the Annual Governance Statement helps the Council meet the requirements of Regulation 6(1)b of the Accounts and Audit (England) Regulations 2015. It is reviewed by the Civic Affairs Committee and approved in advance of the Statement of Accounts.
The Council also has a duty under the Local Government Act 1999 to make arrangements to secure continuous improvement in the way in which its functions are exercised, having regard to a combination of economy, efficiency and effectiveness. That duty has grown in importance with the reduction in resources being made available for Local Authorities as part of the Government’s on-going austerity programme.
The Councils financial management arrangements are consistent with the governance requirements of the CIPFA Statement on the Role of the Chief Financial Officer in Local Government (2010).
Other review and assurance mechanisms
Management have helped to review the Local Code of Governance, and also inform the Annual Governance Statement. In addition assurance can be provided from other sources, as detailed below:
Head of Internal Audit Opinion
The Head of Internal Audit provides an independent opinion on the overall adequacy of and effectiveness of the Council's governance, risk and control framework and therefore the extent to which the Council can rely on it. This has been considered in the development of the Annual Governance Statement.
The Annual Report will be presented to the Civic Affairs Committee in July 2018. This report will outline the key findings of the audit work undertaken during 2017/18, including any areas of significant weakness in the internal control environment.
From the audit reviews undertaken, no areas were identified where it was considered that, if the risks highlighted materialised, it would have a major impact on the organisation as a whole. In each instance where it has been identified that the control environment was not strong enough, or was not complied with sufficiently to prevent risks to the organisation, Internal Audit has issued recommendations to further improve the system of control and compliance. Where these recommendations are considered to have significant impact on the system of internal control, the implementation of actions is followed-up by Internal Audit and is reported to Civic Affairs Committee.
Annual Governance Statement
Statement of Accounts xvii
It is the opinion of the Head of Internal Audit that, taking into account all available evidence, reasonable assurance may be awarded over the adequacy and effectiveness of the Council’s overall internal control environment during the financial year 2017/18, and this remains at a similar level to the previous year.
External Audit
Ernst & Young (now EY) are the appointed external auditor. Their results report (ISA260), annual audit letter and annual report on the certification of claims and returns was presented to Civic Affairs committee.
For 2016-17 EY issued unqualified audit opinions on the financial statements, value for money conclusion and whole of government accounts.
Peer Challenge
In December 2017 the Council participated in a Peer Challenge with the Local Government Association. It concluded that Cambridge City Council is a good council that is performing well and has a number of areas of strong practice, including leveraging in additional funding and grants, building new homes and supporting vulnerable residents both through service delivery and support grants to the voluntary and third sector.
The Peer team’s full report, and the Council’s response is published on a dedicated page of our website.
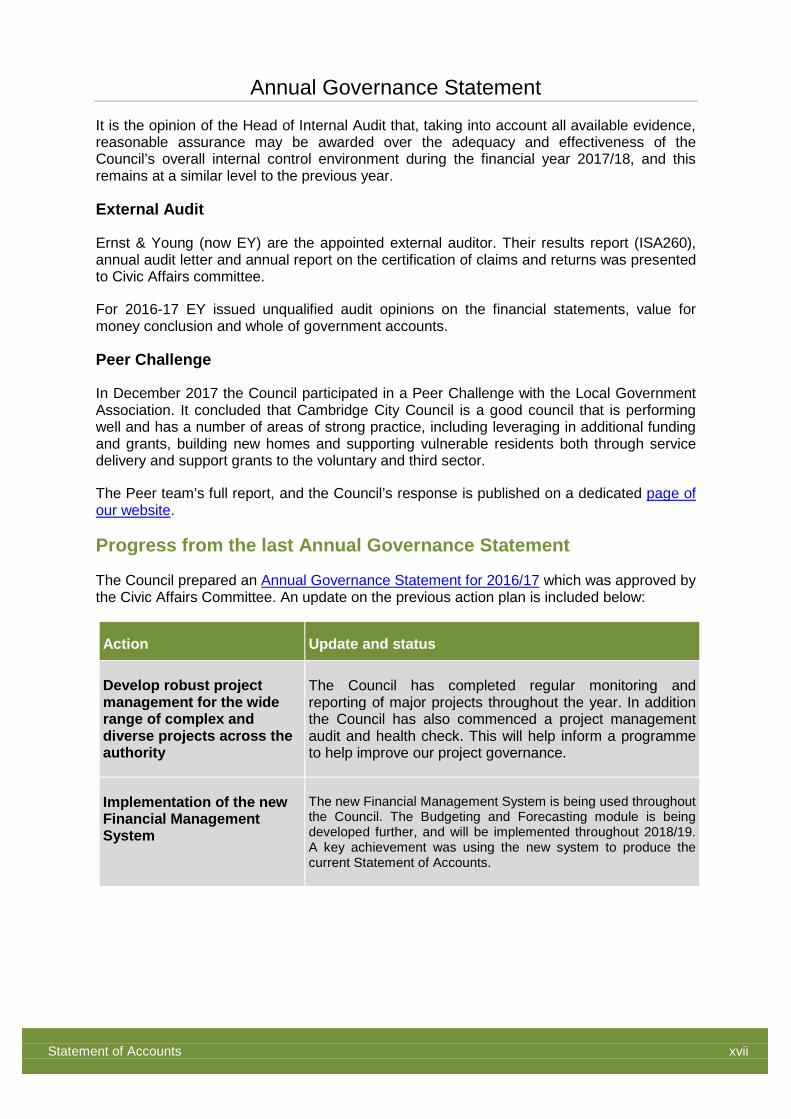
Progress from the last Annual Governance Statement
The Council prepared an Annual Governance Statement for 2016/17 which was approved by the Civic Affairs Committee. An update on the previous action plan is included below:
Action Update and status
Develop robust project management for the wide range of complex and diverse projects across the authority
The Council has completed regular monitoring and reporting of major projects throughout the year. In addition the Council has also commenced a project management audit and health check. This will help inform a programme to help improve our project governance.
Implementation of the new Financial Management System
The new Financial Management System is being used throughout the Council. The Budgeting and Forecasting module is being developed further, and will be implemented throughout 2018/19. A key achievement was using the new system to produce the current Statement of Accounts.
Annual Governance Statement
Statement of Accounts xviii
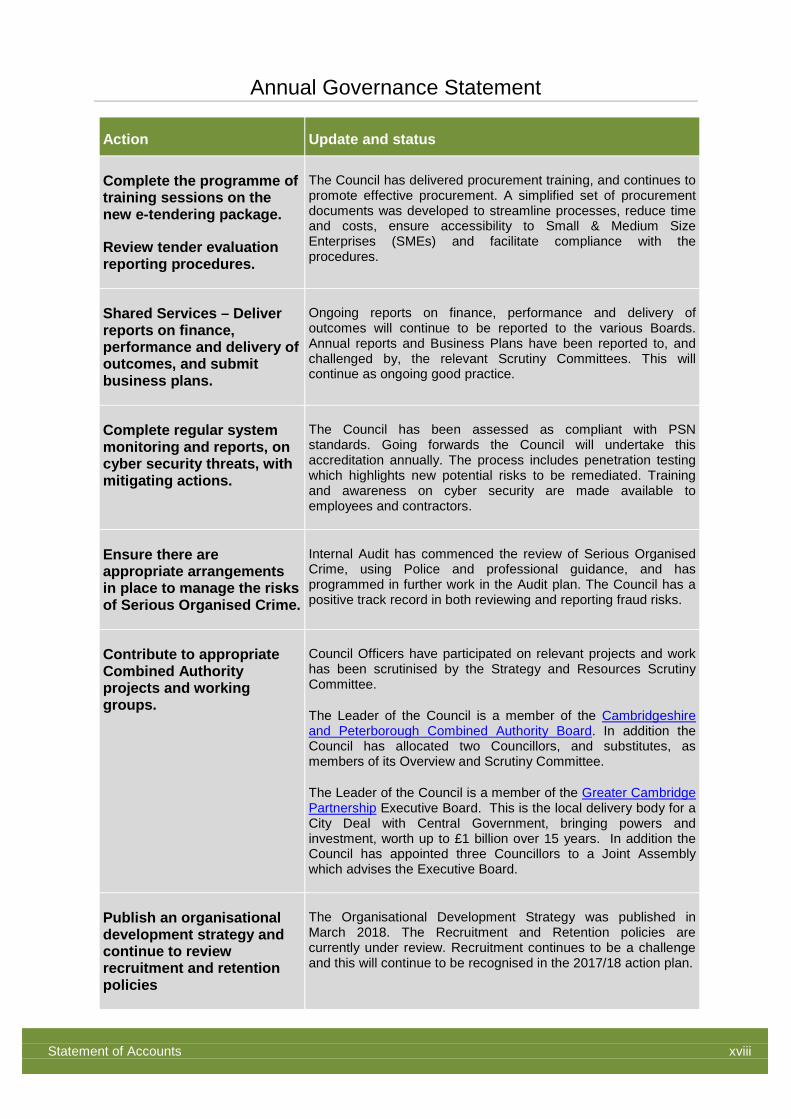
Action Update and status
Complete the programme of training sessions on the new e-tendering package.
Review tender evaluation reporting procedures.
The Council has delivered procurement training, and continues to promote effective procurement. A simplified set of procurement documents was developed to streamline processes, reduce time and costs, ensure accessibility to Small & Medium Size Enterprises (SMEs) and facilitate compliance with the procedures.
Shared Services – Deliver reports on finance, performance and delivery of outcomes, and submit business plans.
Ongoing reports on finance, performance and delivery of outcomes will continue to be reported to the various Boards. Annual reports and Business Plans have been reported to, and challenged by, the relevant Scrutiny Committees. This will continue as ongoing good practice.
Complete regular system monitoring and reports, on cyber security threats, with mitigating actions.
The Council has been assessed as compliant with PSN standards. Going forwards the Council will undertake this accreditation annually. The process includes penetration testing which highlights new potential risks to be remediated. Training and awareness on cyber security are made available to employees and contractors.
Ensure there are appropriate arrangements in place to manage the risks of Serious Organised Crime.
Internal Audit has commenced the review of Serious Organised Crime, using Police and professional guidance, and has programmed in further work in the Audit plan. The Council has a positive track record in both reviewing and reporting fraud risks.
Contribute to appropriate Combined Authority projects and working groups.
Council Officers have participated on relevant projects and work has been scrutinised by the Strategy and Resources Scrutiny Committee.
The Leader of the Council is a member of the Cambridgeshire and Peterborough Combined Authority Board. In addition the Council has allocated two Councillors, and substitutes, as members of its Overview and Scrutiny Committee.
The Leader of the Council is a member of the Greater Cambridge Partnership Executive Board. This is the local delivery body for a City Deal with Central Government, bringing powers and investment, worth up to £1 billion over 15 years. In addition the Council has appointed three Councillors to a Joint Assembly which advises the Executive Board.
Publish an organisational development strategy and continue to review recruitment and retention policies
The Organisational Development Strategy was published in March 2018. The Recruitment and Retention policies are currently under review. Recruitment continues to be a challenge and this will continue to be recognised in the 2017/18 action plan.
Annual Governance Statement
Statement of Accounts xix
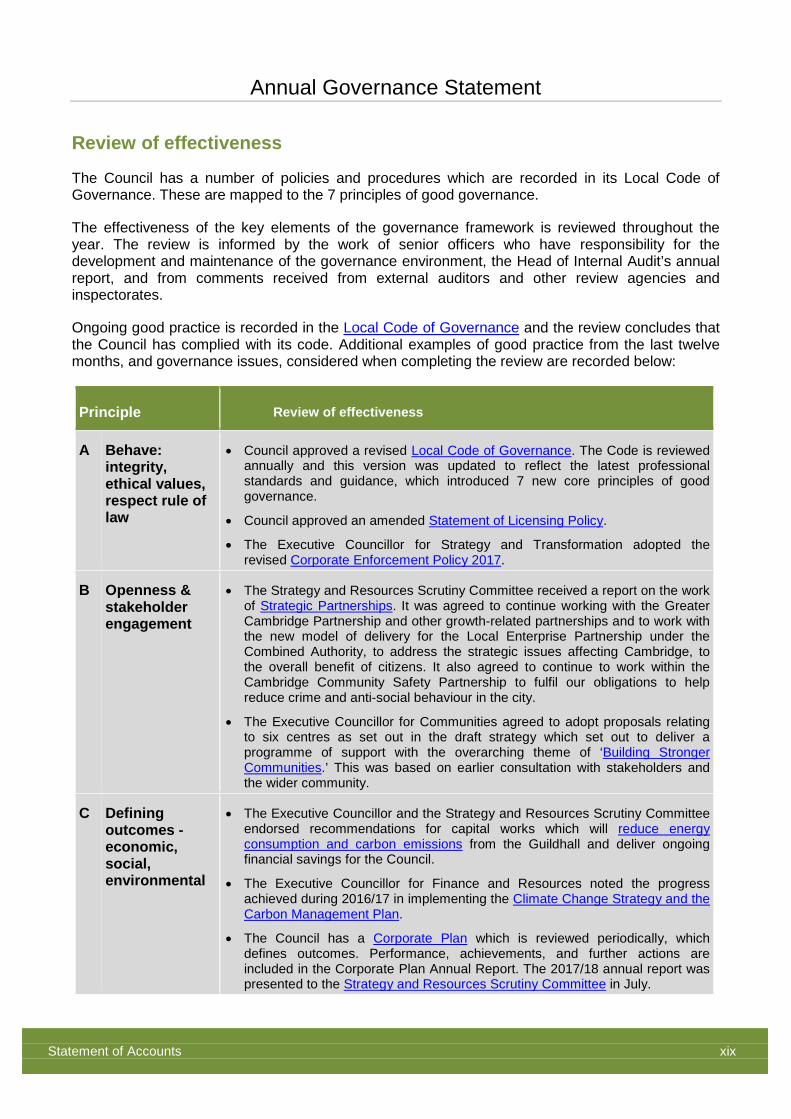
Review of effectiveness
The Council has a number of policies and procedures which are recorded in its Local Code of Governance. These are mapped to the 7 principles of good governance.
The effectiveness of the key elements of the governance framework is reviewed throughout the year. The review is informed by the work of senior officers who have responsibility for the development and maintenance of the governance environment, the Head of Internal Audit’s annual report, and from comments received from external auditors and other review agencies and inspectorates.
Ongoing good practice is recorded in the Local Code of Governance and the review concludes that the Council has complied with its code. Additional examples of good practice from the last twelve months, and governance issues, considered when completing the review are recorded below:
Principle Review of effectiveness
A Behave: integrity, ethical values, respect rule of law
• Council approved a revised Local Code of Governance. The Code is reviewed annually and this version was updated to reflect the latest professional standards and guidance, which introduced 7 new core principles of good governance.
• Council approved an amended Statement of Licensing Policy.
• The Executive Councillor for Strategy and Transformation adopted the revised Corporate Enforcement Policy 2017.
B Openness & stakeholder engagement
• The Strategy and Resources Scrutiny Committee received a report on the work of Strategic Partnerships. It was agreed to continue working with the Greater Cambridge Partnership and other growth-related partnerships and to work with the new model of delivery for the Local Enterprise Partnership under the Combined Authority, to address the strategic issues affecting Cambridge, to the overall benefit of citizens. It also agreed to continue to work within the Cambridge Community Safety Partnership to fulfil our obligations to help reduce crime and anti-social behaviour in the city.
• The Executive Councillor for Communities agreed to adopt proposals relating to six centres as set out in the draft strategy which set out to deliver a programme of support with the overarching theme of ‘Building Stronger Communities.’ This was based on earlier consultation with stakeholders and the wider community.
C Defining outcomes - economic, social, environmental
• The Executive Councillor and the Strategy and Resources Scrutiny Committee endorsed recommendations for capital works which will reduce energy consumption and carbon emissions from the Guildhall and deliver ongoing financial savings for the Council.
• The Executive Councillor for Finance and Resources noted the progress achieved during 2016/17 in implementing the Climate Change Strategy and the Carbon Management Plan.
• The Council has a Corporate Plan which is reviewed periodically, which defines outcomes. Performance, achievements, and further actions are included in the Corporate Plan Annual Report. The 2017/18 annual report was presented to the Strategy and Resources Scrutiny Committee in July.
Annual Governance Statement
Statement of Accounts xx
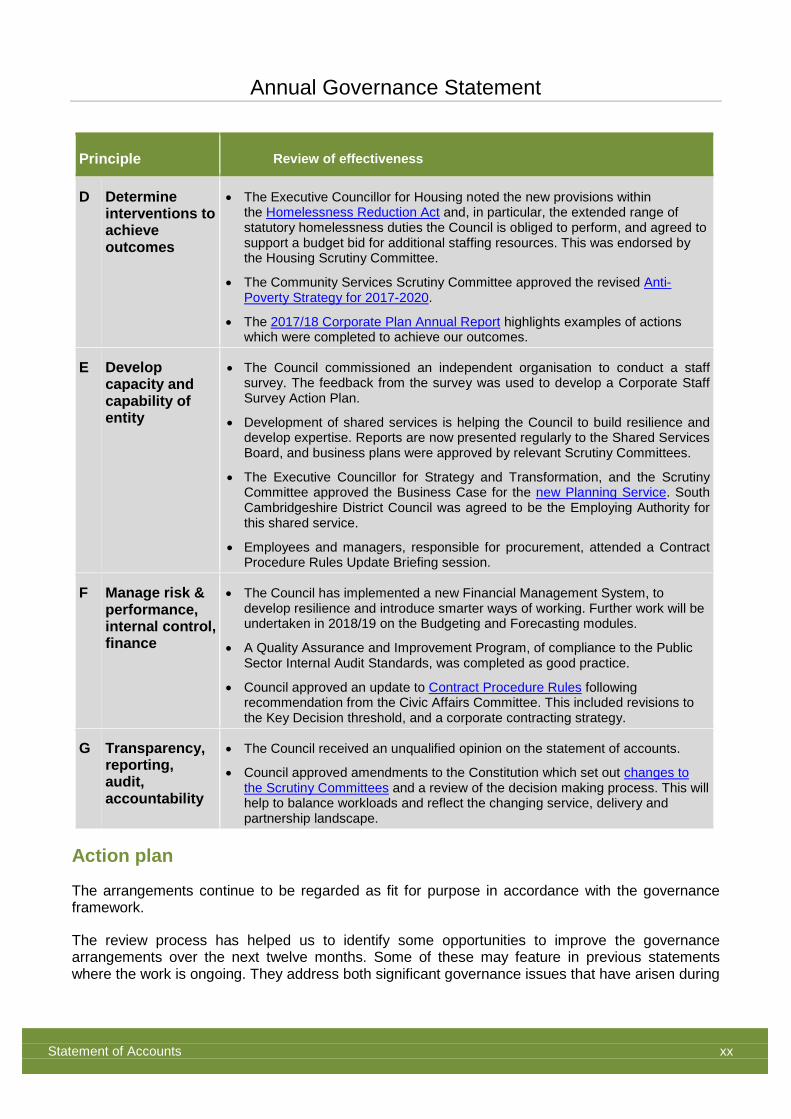
Principle Review of effectiveness
D Determine interventions to achieve outcomes
• The Executive Councillor for Housing noted the new provisions within the Homelessness Reduction Act and, in particular, the extended range of statutory homelessness duties the Council is obliged to perform, and agreed to support a budget bid for additional staffing resources. This was endorsed by the Housing Scrutiny Committee.
• The Community Services Scrutiny Committee approved the revised Anti-Poverty Strategy for 2017-2020.
• The 2017/18 Corporate Plan Annual Report highlights examples of actions which were completed to achieve our outcomes.
E Develop capacity and capability of entity
• The Council commissioned an independent organisation to conduct a staff survey. The feedback from the survey was used to develop a Corporate Staff Survey Action Plan.
• Development of shared services is helping the Council to build resilience and develop expertise. Reports are now presented regularly to the Shared Services Board, and business plans were approved by relevant Scrutiny Committees.
• The Executive Councillor for Strategy and Transformation, and the Scrutiny Committee approved the Business Case for the new Planning Service. South Cambridgeshire District Council was agreed to be the Employing Authority for this shared service.
• Employees and managers, responsible for procurement, attended a Contract Procedure Rules Update Briefing session.
F Manage risk & performance, internal control, finance
• The Council has implemented a new Financial Management System, to develop resilience and introduce smarter ways of working. Further work will be undertaken in 2018/19 on the Budgeting and Forecasting modules.
• A Quality Assurance and Improvement Program, of compliance to the Public Sector Internal Audit Standards, was completed as good practice.
• Council approved an update to Contract Procedure Rules following recommendation from the Civic Affairs Committee. This included revisions to the Key Decision threshold, and a corporate contracting strategy.
G Transparency, reporting, audit, accountability
• The Council received an unqualified opinion on the statement of accounts.
• Council approved amendments to the Constitution which set out changes to the Scrutiny Committees and a review of the decision making process. This will help to balance workloads and reflect the changing service, delivery and partnership landscape.
Action plan
The arrangements continue to be regarded as fit for purpose in accordance with the governance framework.
The review process has helped us to identify some opportunities to improve the governance arrangements over the next twelve months. Some of these may feature in previous statements where the work is ongoing. They address both significant governance issues that have arisen during
Annual Governance Statement
Statement of Accounts xxi
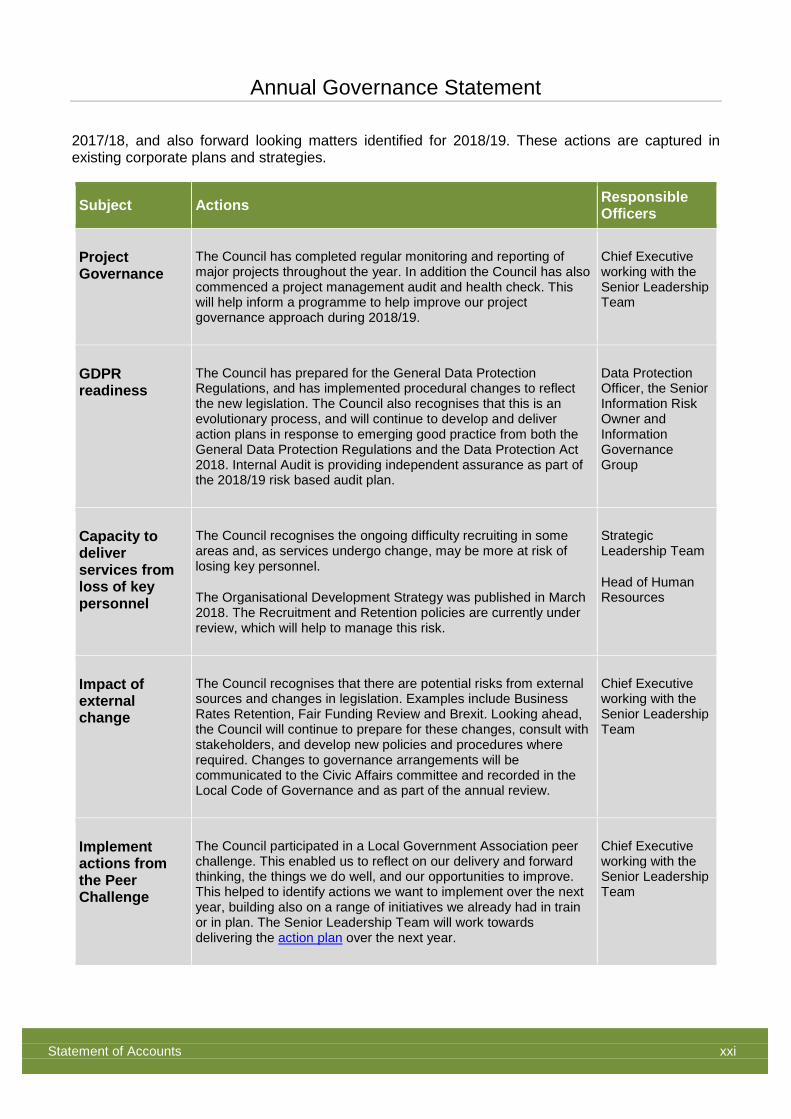
2017/18, and also forward looking matters identified for 2018/19. These actions are captured in existing corporate plans and strategies.
Subject Actions Responsible Officers
Project Governance
The Council has completed regular monitoring and reporting of major projects throughout the year. In addition the Council has also commenced a project management audit and health check. This will help inform a programme to help improve our project governance approach during 2018/19.
Chief Executive working with the Senior Leadership Team
GDPR readiness
The Council has prepared for the General Data Protection Regulations, and has implemented procedural changes to reflect the new legislation. The Council also recognises that this is an evolutionary process, and will continue to develop and deliver action plans in response to emerging good practice from both the General Data Protection Regulations and the Data Protection Act 2018. Internal Audit is providing independent assurance as part of the 2018/19 risk based audit plan.
Data Protection Officer, the Senior Information Risk Owner and Information Governance Group
Capacity to deliver services from loss of key personnel
The Council recognises the ongoing difficulty recruiting in some areas and, as services undergo change, may be more at risk of losing key personnel.
The Organisational Development Strategy was published in March 2018. The Recruitment and Retention policies are currently under review, which will help to manage this risk.
Strategic Leadership Team
Head of Human Resources
Impact of external change
The Council recognises that there are potential risks from external sources and changes in legislation. Examples include Business Rates Retention, Fair Funding Review and Brexit. Looking ahead, the Council will continue to prepare for these changes, consult with stakeholders, and develop new policies and procedures where required. Changes to governance arrangements will be communicated to the Civic Affairs committee and recorded in the Local Code of Governance and as part of the annual review.
Chief Executive working with the Senior Leadership Team
Implement actions from the Peer Challenge
The Council participated in a Local Government Association peer challenge. This enabled us to reflect on our delivery and forward thinking, the things we do well, and our opportunities to improve. This helped to identify actions we want to implement over the next year, building also on a range of initiatives we already had in train or in plan. The Senior Leadership Team will work towards delivering the action plan over the next year.
Chief Executive working with the Senior Leadership Team
Annual Governance Statement
Statement of Accounts xxii
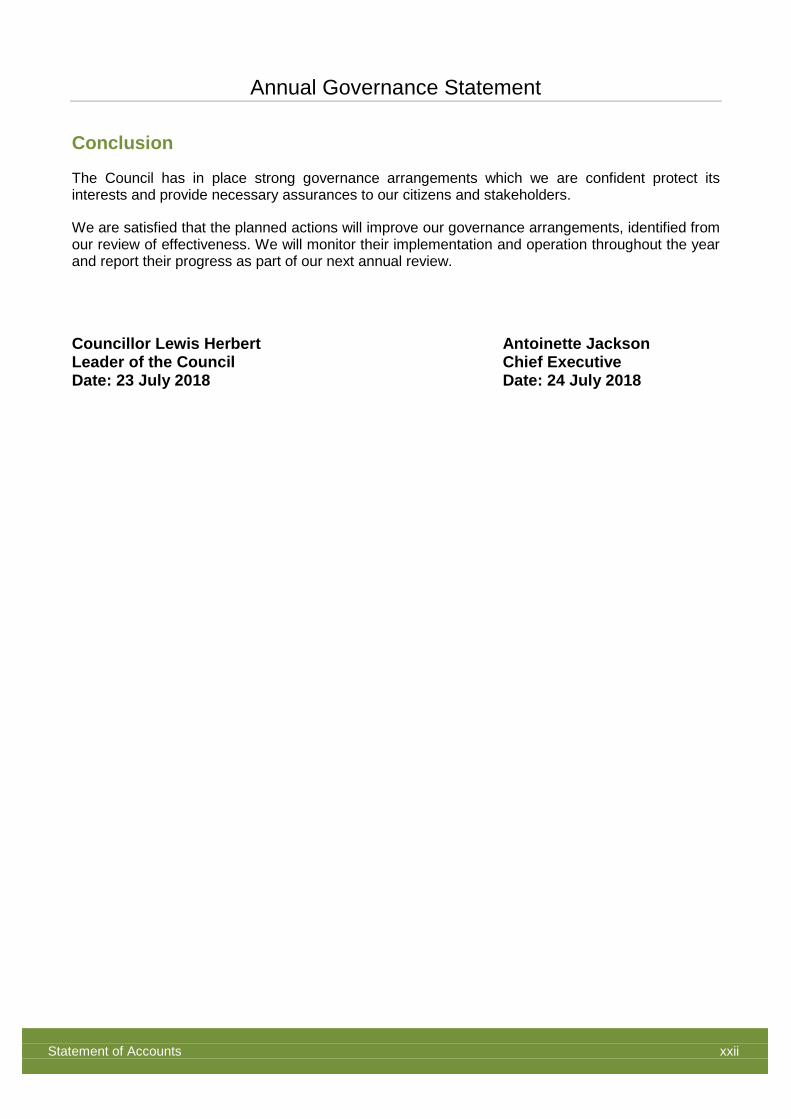
Conclusion
The Council has in place strong governance arrangements which we are confident protect its interests and provide necessary assurances to our citizens and stakeholders.
We are satisfied that the planned actions will improve our governance arrangements, identified from our review of effectiveness. We will monitor their implementation and operation throughout the year and report their progress as part of our next annual review.
Councillor Lewis Herbert Antoinette Jackson Leader of the Council Chief Executive Date: 23 July 2018 Date: 24 July 2018
Independent Auditor’s Report to the Members of Cambridge City Council
Statement of Accounts xxiii
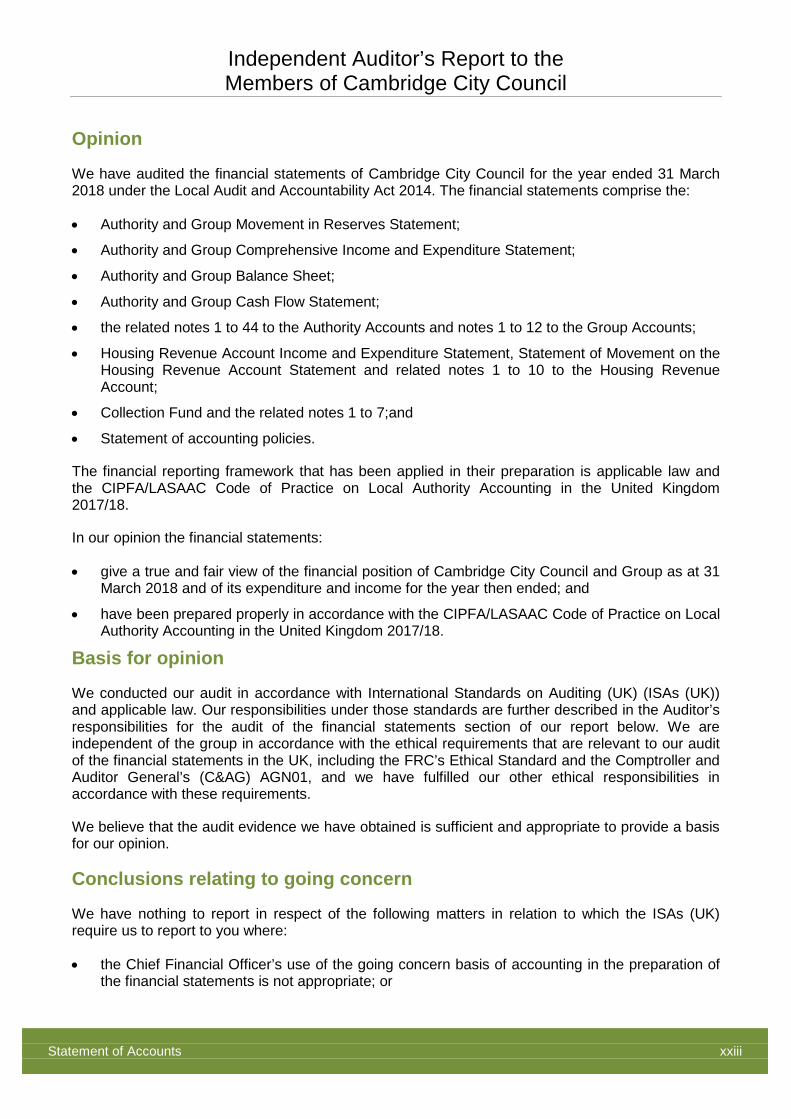
Opinion
We have audited the financial statements of Cambridge City Council for the year ended 31 March 2018 under the Local Audit and Accountability Act 2014. The financial statements comprise the:
• Authority and Group Movement in Reserves Statement;
• Authority and Group Comprehensive Income and Expenditure Statement;
• Authority and Group Balance Sheet;
• Authority and Group Cash Flow Statement;
• the related notes 1 to 44 to the Authority Accounts and notes 1 to 12 to the Group Accounts;
• Housing Revenue Account Income and Expenditure Statement, Statement of Movement on the Housing Revenue Account Statement and related notes 1 to 10 to the Housing Revenue Account;
• Collection Fund and the related notes 1 to 7;and
• Statement of accounting policies.
The financial reporting framework that has been applied in their preparation is applicable law and the CIPFA/LASAAC Code of Practice on Local Authority Accounting in the United Kingdom 2017/18.
In our opinion the financial statements:
• give a true and fair view of the financial position of Cambridge City Council and Group as at 31 March 2018 and of its expenditure and income for the year then ended; and
• have been prepared properly in accordance with the CIPFA/LASAAC Code of Practice on Local Authority Accounting in the United Kingdom 2017/18.
Basis for opinion
We conducted our audit in accordance with International Standards on Auditing (UK) (ISAs (UK)) and applicable law. Our responsibilities under those standards are further described in the Auditor’s responsibilities for the audit of the financial statements section of our report below. We are independent of the group in accordance with the ethical requirements that are relevant to our audit of the financial statements in the UK, including the FRC’s Ethical Standard and the Comptroller and Auditor General’s (C&AG) AGN01, and we have fulfilled our other ethical responsibilities in accordance with these requirements.
We believe that the audit evidence we have obtained is sufficient and appropriate to provide a basis for our opinion.
Conclusions relating to going concern
We have nothing to report in respect of the following matters in relation to which the ISAs (UK) require us to report to you where:
• the Chief Financial Officer’s use of the going concern basis of accounting in the preparation of the financial statements is not appropriate; or
Independent Auditor’s Report to the Members of Cambridge City Council
Statement of Accounts xxiv
• the Chief Financial Officer has not disclosed in the financial statements any identified material uncertainties that may cast significant doubt about the Authority’s ability to continue to adopt the going concern basis of accounting for a period of at least twelve months from the date when the financial statements are authorised for issue.
Other information
The other information comprises the information included in the annual report set out on pages i to x, other than the financial statements and our auditor’s report thereon. The Chief Financial Officer (Head of Finance) is responsible for the other information. Our opinion on the financial statements does not cover the other information and, except to the extent otherwise explicitly stated in this report, we do not express any form of assurance conclusion thereon. In connection with our audit of the financial statements, our responsibility is to read the other information and, in doing so, consider whether the other information is materially inconsistent with the financial statements or our knowledge obtained in the audit or otherwise appears to be materially misstated. If we identify such material inconsistencies or apparent material misstatements, we are required to determine whether there is a material misstatement in the financial statements or a material misstatement of the other information. If, based on the work we have performed, we conclude that there is a material misstatement of the other information, we are required to report that fact. We have nothing to report in this regard. Opinion on other matters prescribed by the Local Audit and Accountability Act 2014
In our opinion, based on the work undertaken in the course of the audit, having regard to the guidance issued by the Comptroller and Auditor General (C&AG) in November 2017, we are satisfied that, in all significant respects, Cambridge City Council put in place proper arrangements to secure economy, efficiency and effectiveness in its use of resources for the year ended 31 March 2018. Matters on which we report by exception
We report to you if: • in our opinion the annual governance statement is misleading or inconsistent with other
information forthcoming from the audit or our knowledge of the Council;
• we issue a report in the public interest under section 24 of the Local Audit and Accountability Act 2014;
• we make written recommendations to the audited body under Section 24 of the Local Audit and Accountability Act 2014;
• we make an application to the court for a declaration that an item of account is contrary to law under Section 28 of the Local Audit and Accountability Act 2014;
• we issue an advisory notice under Section 29 of the Local Audit and Accountability Act 2014; or
Independent Auditor’s Report to the Members of Cambridge City Council
Statement of Accounts xxv
• we make an application for judicial review under Section 31 of the Local Audit and Accountability Act 2014.
We have nothing to report in these respects Responsibility of the Head of Finance
As explained more fully in the Statement of the Head of Finance’s Responsibilities set out on page xi, the Head of Finance is responsible for the preparation of the Statement of Accounts, which includes the financial statements, in accordance with proper practices as set out in the CIPFA/LASAAC Code of Practice on Local Authority Accounting in the United Kingdom 2017/18, and for being satisfied that they give a true and fair view. In preparing the financial statements, the Head of Finance is responsible for assessing the Authority’s ability to continue as a going concern, disclosing, as applicable, matters related to going concern and using the going concern basis of accounting unless the Authority either intends to cease operations, or have no realistic alternative but to do so. The Authority is responsible for putting in place proper arrangements to secure economy, efficiency and effectiveness in its use of resources, to ensure proper stewardship and governance, and to review regularly the adequacy and effectiveness of these arrangements. Auditor’s responsibilities for the audit of the financial statements
Our objectives are to obtain reasonable assurance about whether the financial statements as a whole are free from material misstatement, whether due to fraud or error, and to issue an auditor’s report that includes our opinion. Reasonable assurance is a high level of assurance, but is not a guarantee that an audit conducted in accordance with ISAs (UK) will always detect a material misstatement when it exists. Misstatements can arise from fraud or error and are considered material if, individually or in the aggregate, they could reasonably be expected to influence the economic decisions of users taken on the basis of these financial statements. A further description of our responsibilities for the audit of the financial statements is located on the Financial Reporting Council’s website at https://www.frc.org.uk/auditorsresponsibilities. This description forms part of our auditor’s report. Scope of the review of arrangements for securing economy, efficiency and effectiveness in the use of resources
We have undertaken our review in accordance with the Code of Audit Practice, having regard to the guidance on the specified criterion issued by the C&AG in November 2017, as to whether Cambridge City Council had proper arrangements to ensure it took properly informed decisions and deployed resources to achieve planned and sustainable outcomes for taxpayers and local people. The Comptroller and Auditor General determined this criterion as that necessary for us to consider under the Code of Audit Practice in satisfying ourselves whether Cambridge City Council put in place proper arrangements for securing economy, efficiency and effectiveness in its use of resources for the year ended 31 March 2018. We planned our work in accordance with the Code of Audit Practice. Based on our risk assessment, we undertook such work as we considered necessary to form a view on whether, in all significant
Independent Auditor’s Report to the Members of Cambridge City Council
Statement of Accounts xxvi
respects, Cambridge City Council had put in place proper arrangements to secure economy, efficiency and effectiveness in its use of resources. We are required under Section 20(1)(c) of the Local Audit and Accountability Act 2014 to satisfy ourselves that the Authority has made proper arrangements for securing economy, efficiency and effectiveness in its use of resources. The Code of Audit Practice issued by the National Audit Office (NAO) requires us to report to you our conclusion relating to proper arrangements. We report if significant matters have come to our attention which prevent us from concluding that the Authority has put in place proper arrangements for securing economy, efficiency and effectiveness in its use of resources. We are not required to consider, nor have we considered, whether all aspects of the Authority’s arrangements for securing economy, efficiency and effectiveness in its use of resources are operating effectively. Certificate
We certify that we have completed the audit of the accounts of Cambridge City Council in accordance with the requirements of the Local Audit and Accountability Act 2014 and the Code of Audit Practice issued by the National Audit Office. Use of our report
This report is made solely to the members of Cambridge City Council, as a body, in accordance with Part 5 of the Local Audit and Accountability Act 2014 and for no other purpose, as set out in paragraph 43 of the Statement of Responsibilities of Auditors and Audited Bodies published by Public Sector Audit Appointments Limited. To the fullest extent permitted by law, we do not accept or assume responsibility to anyone other than the Authority and the Authority’s members as a body, for our audit work, for this report, or for the opinions we have formed. Suresh Patel (Key Audit Partner) Ernst & Young LLP (Local Auditor) Cambridge Date: 26 July 2018
The maintenance and integrity of the Cambridge City Council web site is the responsibility of the directors; the work carried out by the auditors does not involve consideration of these matters and, accordingly, the auditors accept no responsibility for any changes that may have occurred to the financial statements since they were initially presented on the web site.
Legislation in the United Kingdom governing the preparation and dissemination of financial statements may differ from legislation in other jurisdictions.

MAIN FINANCIAL STATEMENTS

Main Financial Statements
Statement of Accounts 3
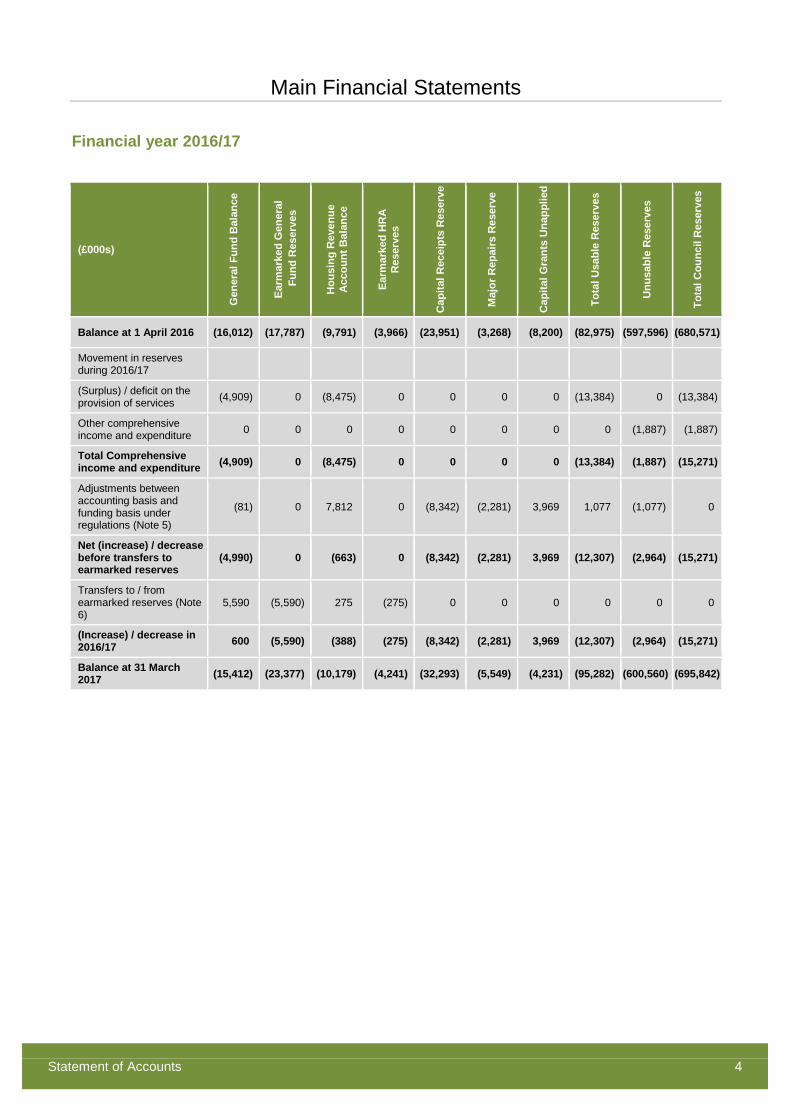
Movement in Reserves Statement
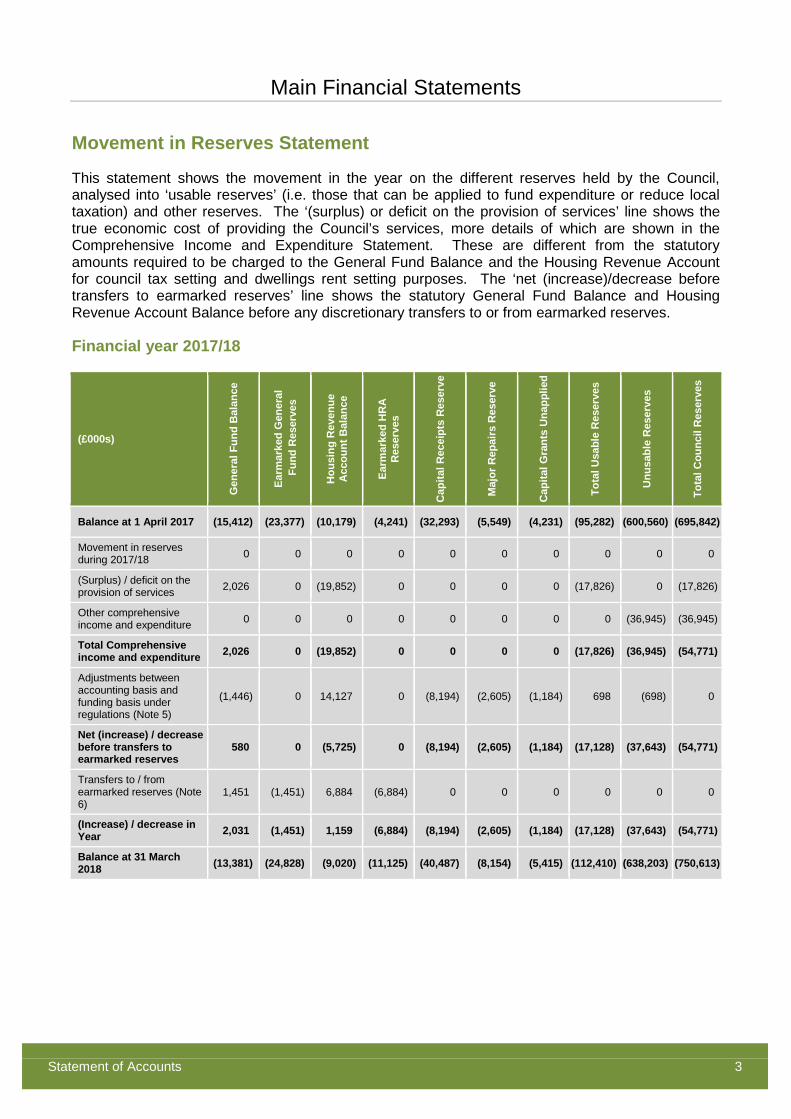
This statement shows the movement in the year on the different reserves held by the Council, analysed into ‘usable reserves’ (i.e. those that can be applied to fund expenditure or reduce local taxation) and other reserves. The ‘(surplus) or deficit on the provision of services’ line shows the true economic cost of providing the Council’s services, more details of which are shown in the Comprehensive Income and Expenditure Statement. These are different from the statutory amounts required to be charged to the General Fund Balance and the Housing Revenue Account for council tax setting and dwellings rent setting purposes. The ‘net (increase)/decrease before transfers to earmarked reserves’ line shows the statutory General Fund Balance and Housing Revenue Account Balance before any discretionary transfers to or from earmarked reserves.
Financial year 2017/18
(£000s)
Gen
eral
Fun
d B
alan
ce
Earm
arke
d G
ener
al
Fun
d R
eser
ves
Hou
sing
Rev
enue
A
ccou
nt B
alan
ce
Earm
arke
d H
RA
R
eser
ves
Cap
ital R
ecei
pts
Res
erve
Maj
or R
epai
rs R
eser
ve
Cap
ital G
rant
s U
napp
lied
Tota
l Usa
ble
Res
erve
s
Unu
sabl
e R
eser
ves
Tota
l Cou
ncil
Res
erve
s
Balance at 1 April 2017 (15,412) (23,377) (10,179) (4,241) (32,293) (5,549) (4,231) (95,282) (600,560) (695,842)
Movement in reserves during 2017/18 0 0 0 0 0 0 0 0 0 0
(Surplus) / deficit on the provision of services 2,026 0 (19,852) 0 0 0 0 (17,826) 0 (17,826)
Other comprehensive income and expenditure 0 0 0 0 0 0 0 0 (36,945) (36,945)
Total Comprehensive income and expenditure 2,026 0 (19,852) 0 0 0 0 (17,826) (36,945) (54,771)
Adjustments between accounting basis and funding basis under regulations (Note 5)
(1,446) 0 14,127 0 (8,194) (2,605) (1,184) 698 (698) 0
Net (increase) / decrease before transfers to earmarked reserves
580 0 (5,725) 0 (8,194) (2,605) (1,184) (17,128) (37,643) (54,771)
Transfers to / from earmarked reserves (Note 6)
1,451 (1,451) 6,884 (6,884) 0 0 0 0 0 0
(Increase) / decrease in Year 2,031 (1,451) 1,159 (6,884) (8,194) (2,605) (1,184) (17,128) (37,643) (54,771)
Balance at 31 March 2018 (13,381) (24,828) (9,020) (11,125) (40,487) (8,154) (5,415) (112,410) (638,203) (750,613)
Main Financial Statements
Statement of Accounts 4
Financial year 2016/17
(£000s) G
ener
al F
und
Bal
ance
Earm
arke
d G
ener
al
Fun
d R
eser
ves
Hou
sing
Rev
enue
A
ccou
nt B
alan
ce
Earm
arke
d H
RA
R
eser
ves
Cap
ital R
ecei
pts
Res
erve
Maj
or R
epai
rs R
eser
ve
Cap
ital G
rant
s U
napp
lied
Tota
l Usa
ble
Res
erve
s
Unu
sabl
e R
eser
ves
Tota
l Cou
ncil
Res
erve
s
Balance at 1 April 2016 (16,012) (17,787) (9,791) (3,966) (23,951) (3,268) (8,200) (82,975) (597,596) (680,571)
Movement in reserves during 2016/17
(Surplus) / deficit on the provision of services (4,909) 0 (8,475) 0 0 0 0 (13,384) 0 (13,384)
Other comprehensive income and expenditure 0 0 0 0 0 0 0 0 (1,887) (1,887)
Total Comprehensive income and expenditure (4,909) 0 (8,475) 0 0 0 0 (13,384) (1,887) (15,271)
Adjustments between accounting basis and funding basis under regulations (Note 5)
(81) 0 7,812 0 (8,342) (2,281) 3,969 1,077 (1,077) 0
Net (increase) / decrease before transfers to earmarked reserves
(4,990) 0 (663) 0 (8,342) (2,281) 3,969 (12,307) (2,964) (15,271)
Transfers to / from earmarked reserves (Note 6)
5,590 (5,590) 275 (275) 0 0 0 0 0 0
(Increase) / decrease in 2016/17 600 (5,590) (388) (275) (8,342) (2,281) 3,969 (12,307) (2,964) (15,271)
Balance at 31 March 2017 (15,412) (23,377) (10,179) (4,241) (32,293) (5,549) (4,231) (95,282) (600,560) (695,842)
Main Financial Statements
Statement of Accounts 5
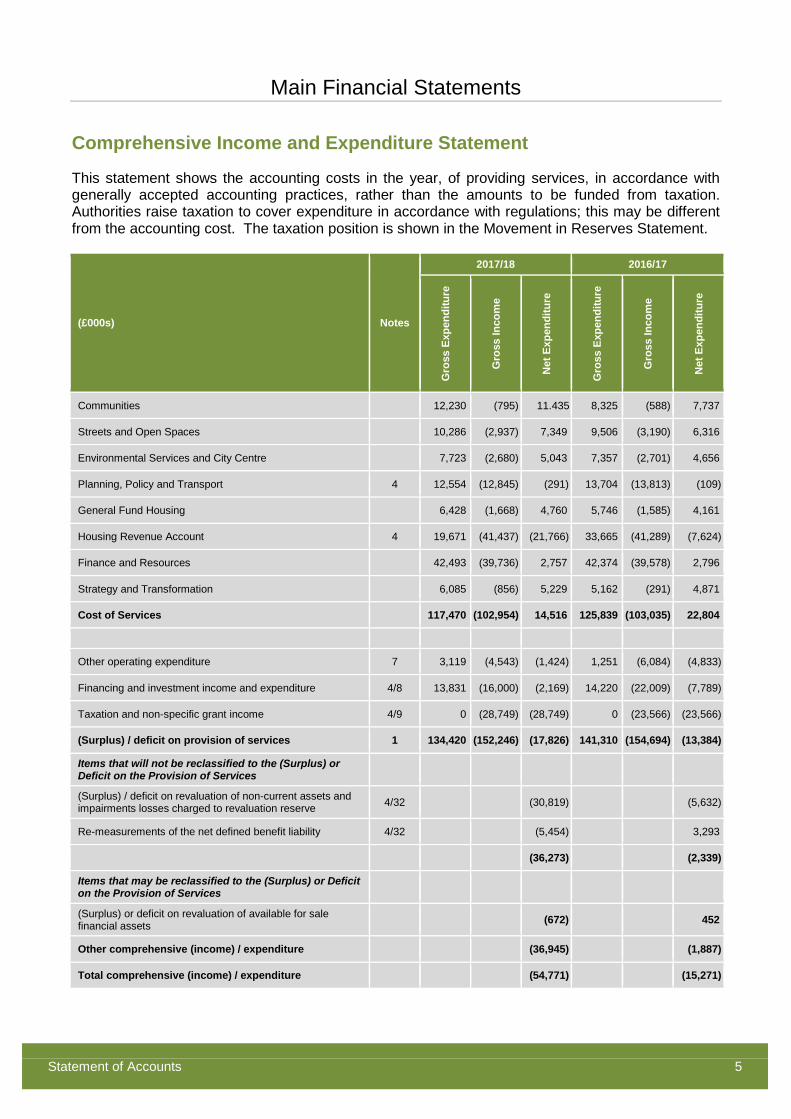
Comprehensive Income and Expenditure Statement
This statement shows the accounting costs in the year, of providing services, in accordance with generally accepted accounting practices, rather than the amounts to be funded from taxation. Authorities raise taxation to cover expenditure in accordance with regulations; this may be different from the accounting cost. The taxation position is shown in the Movement in Reserves Statement.
(£000s) Notes
2017/18 2016/17
Gro
ss E
xpen
ditu
re
Gro
ss In
com
e
Net
Exp
endi
ture
Gro
ss E
xpen
ditu
re
Gro
ss In
com
e
Net
Exp
endi
ture
Communities 12,230 (795) 11.435 8,325 (588) 7,737
Streets and Open Spaces 10,286 (2,937) 7,349 9,506 (3,190) 6,316
Environmental Services and City Centre 7,723 (2,680) 5,043 7,357 (2,701) 4,656
Planning, Policy and Transport 4 12,554 (12,845) (291) 13,704 (13,813) (109)
General Fund Housing 6,428 (1,668) 4,760 5,746 (1,585) 4,161
Housing Revenue Account 4 19,671 (41,437) (21,766) 33,665 (41,289) (7,624)
Finance and Resources 42,493 (39,736) 2,757 42,374 (39,578) 2,796
Strategy and Transformation 6,085 (856) 5,229 5,162 (291) 4,871
Cost of Services 117,470 (102,954) 14,516 125,839 (103,035) 22,804
Other operating expenditure 7 3,119 (4,543) (1,424) 1,251 (6,084) (4,833)
Financing and investment income and expenditure 4/8 13,831 (16,000) (2,169) 14,220 (22,009) (7,789)
Taxation and non-specific grant income 4/9 0 (28,749) (28,749) 0 (23,566) (23,566)
(Surplus) / deficit on provision of services 1 134,420 (152,246) (17,826) 141,310 (154,694) (13,384)
Items that will not be reclassified to the (Surplus) or Deficit on the Provision of Services
(Surplus) / deficit on revaluation of non-current assets and impairments losses charged to revaluation reserve 4/32 (30,819) (5,632)
Re-measurements of the net defined benefit liability 4/32 (5,454) 3,293
(36,273) (2,339)
Items that may be reclassified to the (Surplus) or Deficit on the Provision of Services
(Surplus) or deficit on revaluation of available for sale financial assets (672) 452
Other comprehensive (income) / expenditure (36,945) (1,887)
Total comprehensive (income) / expenditure (54,771) (15,271)
Main Financial Statements
Statement of Accounts 6
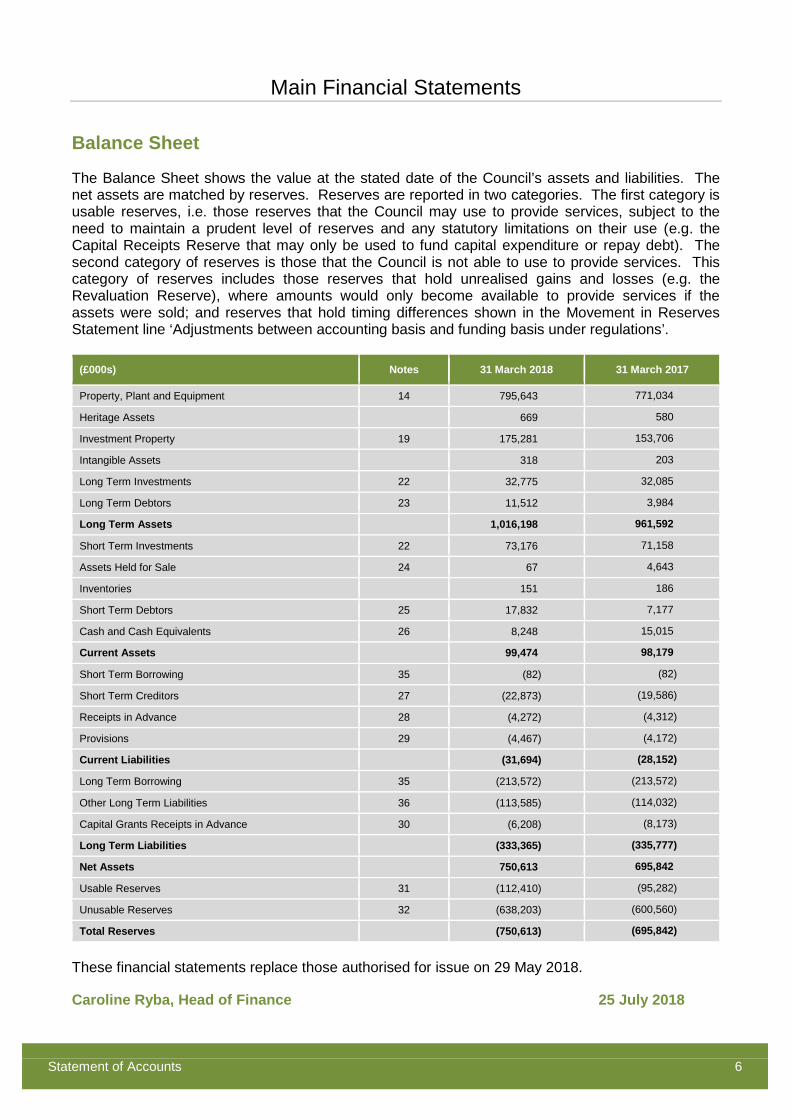
Balance Sheet
The Balance Sheet shows the value at the stated date of the Council’s assets and liabilities. The net assets are matched by reserves. Reserves are reported in two categories. The first category is usable reserves, i.e. those reserves that the Council may use to provide services, subject to the need to maintain a prudent level of reserves and any statutory limitations on their use (e.g. the Capital Receipts Reserve that may only be used to fund capital expenditure or repay debt). The second category of reserves is those that the Council is not able to use to provide services. This category of reserves includes those reserves that hold unrealised gains and losses (e.g. the Revaluation Reserve), where amounts would only become available to provide services if the assets were sold; and reserves that hold timing differences shown in the Movement in Reserves Statement line ‘Adjustments between accounting basis and funding basis under regulations’.
(£000s) Notes 31 March 2018 31 March 2017
Property, Plant and Equipment 14 795,643 771,034
Heritage Assets 669 580
Investment Property 19 175,281 153,706
Intangible Assets 318 203
Long Term Investments 22 32,775 32,085
Long Term Debtors 23 11,512 3,984
Long Term Assets 1,016,198 961,592
Short Term Investments 22 73,176 71,158
Assets Held for Sale 24 67 4,643
Inventories 151 186
Short Term Debtors 25 17,832 7,177
Cash and Cash Equivalents 26 8,248 15,015
Current Assets 99,474 98,179
Short Term Borrowing 35 (82) (82)
Short Term Creditors 27 (22,873) (19,586)
Receipts in Advance 28 (4,272) (4,312)
Provisions 29 (4,467) (4,172)
Current Liabilities (31,694) (28,152)
Long Term Borrowing 35 (213,572) (213,572)
Other Long Term Liabilities 36 (113,585) (114,032)
Capital Grants Receipts in Advance 30 (6,208) (8,173)
Long Term Liabilities (333,365) (335,777)
Net Assets 750,613 695,842
Usable Reserves 31 (112,410) (95,282)
Unusable Reserves 32 (638,203) (600,560)
Total Reserves (750,613) (695,842)
These financial statements replace those authorised for issue on 29 May 2018.
Caroline Ryba, Head of Finance 25 July 2018
Main Financial Statements
Statement of Accounts 7
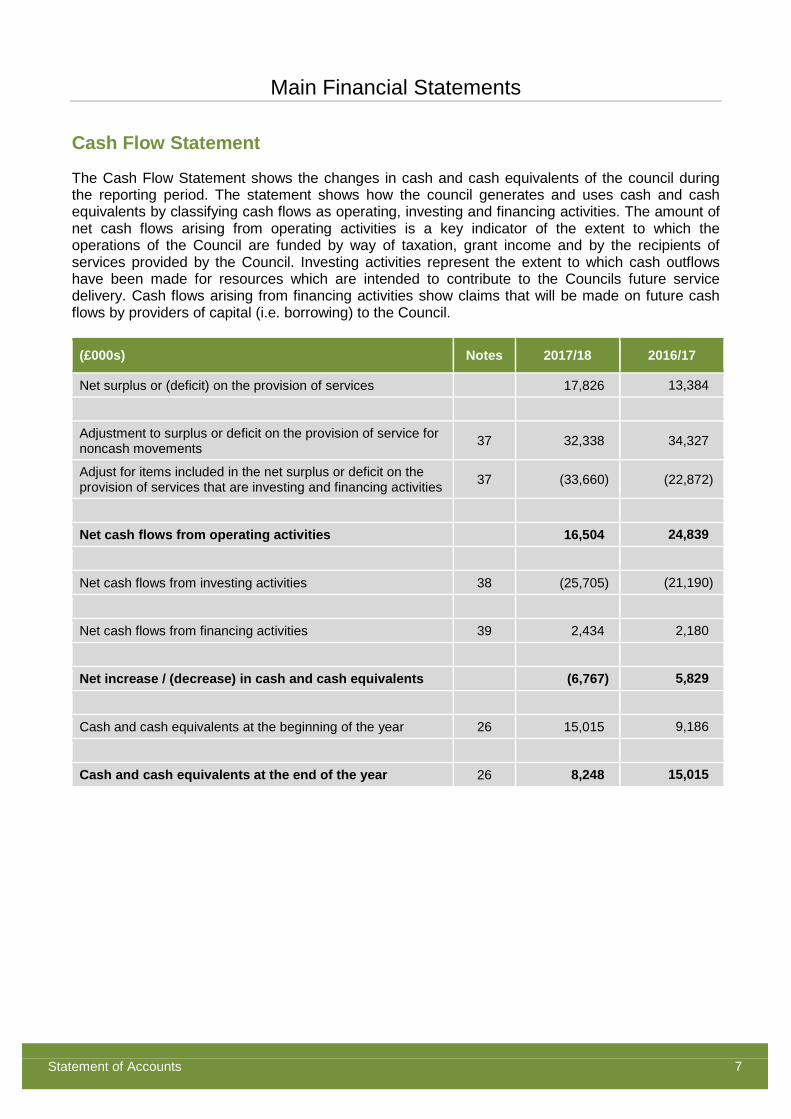
Cash Flow Statement
The Cash Flow Statement shows the changes in cash and cash equivalents of the council during the reporting period. The statement shows how the council generates and uses cash and cash equivalents by classifying cash flows as operating, investing and financing activities. The amount of net cash flows arising from operating activities is a key indicator of the extent to which the operations of the Council are funded by way of taxation, grant income and by the recipients of services provided by the Council. Investing activities represent the extent to which cash outflows have been made for resources which are intended to contribute to the Councils future service delivery. Cash flows arising from financing activities show claims that will be made on future cash flows by providers of capital (i.e. borrowing) to the Council.
(£000s) Notes 2017/18 2016/17
Net surplus or (deficit) on the provision of services 17,826 13,384
Adjustment to surplus or deficit on the provision of service for noncash movements 37 32,338 34,327
Adjust for items included in the net surplus or deficit on the provision of services that are investing and financing activities 37 (33,660) (22,872)
Net cash flows from operating activities 16,504 24,839
Net cash flows from investing activities 38 (25,705) (21,190)
Net cash flows from financing activities 39 2,434 2,180
Net increase / (decrease) in cash and cash equivalents (6,767) 5,829
Cash and cash equivalents at the beginning of the year 26 15,015 9,186
Cash and cash equivalents at the end of the year 26 8,248 15,015


NOTES TO THE MAIN FINANCIAL STATEMENTS
Statement of Accounts 10
INDEX TO THE NOTES TO THE MAIN FINANCIAL STATEMENTS
1 Expenditure and Funding Analysis ........................................................................................................... 11 2 Critical Judgements in Applying Accounting Policies ............................................................................... 14 3 Assumptions Made About the Future and Other Major Sources of Estimation Uncertainty ..................... 14 4 Material Items of Income and Expenditure ............................................................................................... 15 5 Adjustments between Accounting Basis and Funding Basis under Regulations ..................................... 16 6 Movement in Reserves Statement – Transfers to / from Earmarked Reserves ....................................... 24 7 Other Operating Expenditure .................................................................................................................... 25 8 Financing and Investment Income and Expenditure ................................................................................. 25 9 Taxation and Non Specific Grant Incomes ............................................................................................... 25
10 Members’ Allowances ............................................................................................................................... 26 11 Related Party Transactions ....................................................................................................................... 26 12 Employee Remuneration .......................................................................................................................... 30 13 Audit Costs ................................................................................................................................................ 32 14 Property, Plant and Equipment ................................................................................................................. 33 15 Property, Plant and Equipment – Revaluations ........................................................................................ 35 16 Property, Plant and Equipment – Depreciation ......................................................................................... 36 17 Capital Expenditure and Capital Financing ............................................................................................... 37 18 Capital Commitments ................................................................................................................................ 38 19 Investment Properties ............................................................................................................................... 39 20 Fair Value Measurement of Investment Properties .................................................................................. 40 21 Leases ....................................................................................................................................................... 41 22 Short-Term and Long-Term Investments .................................................................................................. 43 23 Long-Term Debtors ................................................................................................................................... 43 24 Assets Held for Sale.................................................................................................................................. 44 25 Debtors ...................................................................................................................................................... 44 26 Cash and Cash Equivalents ...................................................................................................................... 45 27 Short-Term Creditors ................................................................................................................................ 45 28 Receipts in Advance ................................................................................................................................. 45 29 Provisions .................................................................................................................................................. 45 30 Grant Income ............................................................................................................................................ 47 31 Usable Reserves ....................................................................................................................................... 48 32 Unusable Reserves ................................................................................................................................... 48 33 Contingent Liabilities ................................................................................................................................. 51 34 Financial Instruments ................................................................................................................................ 52 35 Nature and extent of risks arising from financial instruments ................................................................... 56 36 Defined Benefit Pension Schemes ........................................................................................................... 62 37 Cashflow Statement – Operating Activities ............................................................................................... 67 38 Cashflow Statement – Investing Activities ................................................................................................ 68 39 Cashflow Statement – Financing Activities ............................................................................................... 69 40 Impact of the adoption of new standards .................................................................................................. 69 41 Changes in accounting estimates ............................................................................................................. 69 42 Changes to the Presentation of the Cashflow Statement and Expenditure and Funding Analysis .......... 69 43 Date the Statement of Accounts were authorised for issue ..................................................................... 70 44 Events after the Reporting Period ............................................................................................................. 70
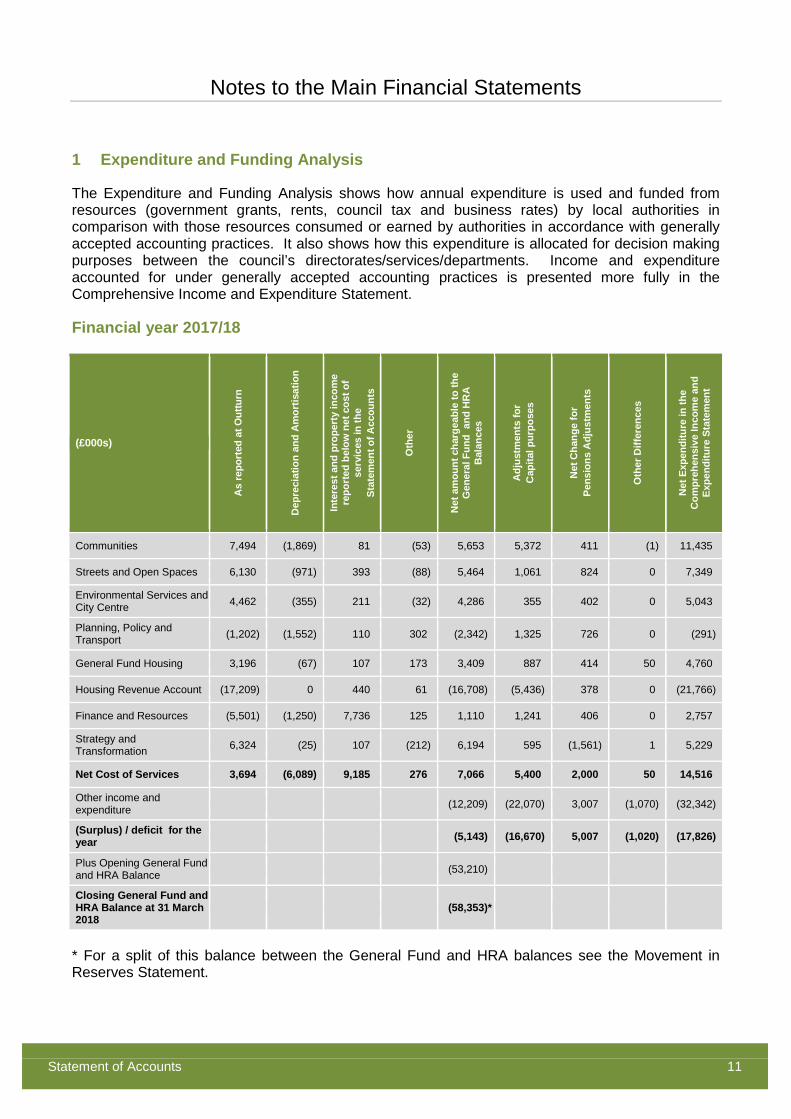
Notes to the Main Financial Statements
Statement of Accounts 11
1 Expenditure and Funding Analysis
The Expenditure and Funding Analysis shows how annual expenditure is used and funded from resources (government grants, rents, council tax and business rates) by local authorities in comparison with those resources consumed or earned by authorities in accordance with generally accepted accounting practices. It also shows how this expenditure is allocated for decision making purposes between the council’s directorates/services/departments. Income and expenditure accounted for under generally accepted accounting practices is presented more fully in the Comprehensive Income and Expenditure Statement.
Financial year 2017/18
(£000s)
As
repo
rted
at O
uttu
rn
Dep
reci
atio
n an
d A
mor
tisat
ion
Inte
rest
and
pro
pert
y in
com
e re
port
ed b
elow
net
cos
t of
serv
ices
in th
e St
atem
ent o
f Acc
ount
s
Oth
er
Net
am
ount
cha
rgea
ble
to th
e G
ener
al F
und
and
HR
A
Bal
ance
s
Adj
ustm
ents
for
Cap
ital p
urpo
ses
Net
Cha
nge
for
Pens
ions
Adj
ustm
ents
Oth
er D
iffer
ence
s
Net
Exp
endi
ture
in th
e C
ompr
ehen
sive
Inco
me
and
Expe
nditu
re S
tate
men
t
Communities 7,494 (1,869) 81 (53) 5,653 5,372 411 (1) 11,435
Streets and Open Spaces 6,130 (971) 393 (88) 5,464 1,061 824 0 7,349
Environmental Services and City Centre 4,462 (355) 211 (32) 4,286 355 402 0 5,043
Planning, Policy and Transport (1,202) (1,552) 110 302 (2,342) 1,325 726 0 (291)
General Fund Housing 3,196 (67) 107 173 3,409 887 414 50 4,760
Housing Revenue Account (17,209) 0 440 61 (16,708) (5,436) 378 0 (21,766)
Finance and Resources (5,501) (1,250) 7,736 125 1,110 1,241 406 0 2,757
Strategy and Transformation 6,324 (25) 107 (212) 6,194 595 (1,561) 1 5,229
Net Cost of Services 3,694 (6,089) 9,185 276 7,066 5,400 2,000 50 14,516
Other income and expenditure (12,209) (22,070) 3,007 (1,070) (32,342)
(Surplus) / deficit for the year (5,143) (16,670) 5,007 (1,020) (17,826)
Plus Opening General Fund and HRA Balance (53,210)
Closing General Fund and HRA Balance at 31 March 2018
(58,353)*
* For a split of this balance between the General Fund and HRA balances see the Movement in Reserves Statement.
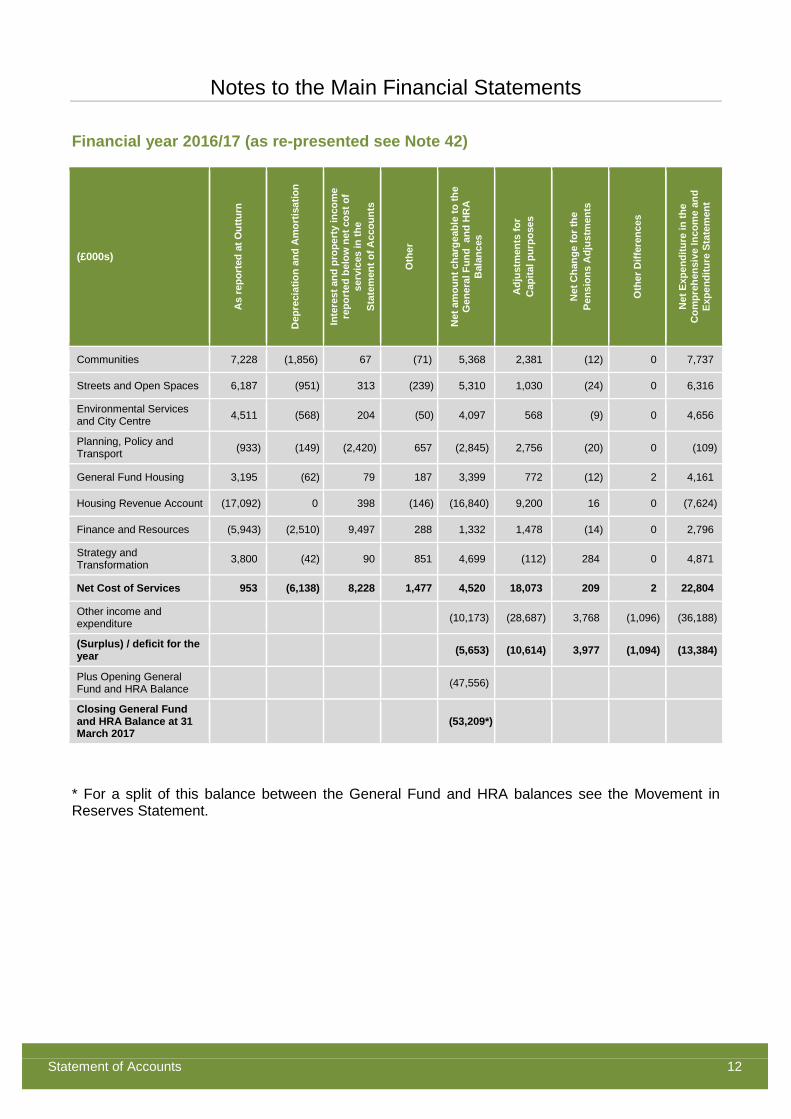
Notes to the Main Financial Statements
Statement of Accounts 12
Financial year 2016/17 (as re-presented see Note 42)
(£000s)
As
repo
rted
at O
uttu
rn
Dep
reci
atio
n an
d A
mor
tisat
ion
Inte
rest
and
pro
pert
y in
com
e re
port
ed b
elow
net
cos
t of
serv
ices
in th
e St
atem
ent o
f Acc
ount
s
Oth
er
Net
am
ount
cha
rgea
ble
to th
e G
ener
al F
und
and
HR
A
Bal
ance
s
Adj
ustm
ents
for
Cap
ital p
urpo
ses
Net
Cha
nge
for t
he
Pens
ions
Adj
ustm
ents
Oth
er D
iffer
ence
s
Net
Exp
endi
ture
in th
e C
ompr
ehen
sive
Inco
me
and
Expe
nditu
re S
tate
men
t
Communities 7,228 (1,856) 67 (71) 5,368 2,381 (12) 0 7,737
Streets and Open Spaces 6,187 (951) 313 (239) 5,310 1,030 (24) 0 6,316
Environmental Services and City Centre 4,511 (568) 204 (50) 4,097 568 (9) 0 4,656
Planning, Policy and Transport (933) (149) (2,420) 657 (2,845) 2,756 (20) 0 (109)
General Fund Housing 3,195 (62) 79 187 3,399 772 (12) 2 4,161
Housing Revenue Account (17,092) 0 398 (146) (16,840) 9,200 16 0 (7,624)
Finance and Resources (5,943) (2,510) 9,497 288 1,332 1,478 (14) 0 2,796
Strategy and Transformation 3,800 (42) 90 851 4,699 (112) 284 0 4,871
Net Cost of Services 953 (6,138) 8,228 1,477 4,520 18,073 209 2 22,804
Other income and expenditure (10,173) (28,687) 3,768 (1,096) (36,188)
(Surplus) / deficit for the year (5,653) (10,614) 3,977 (1,094) (13,384)
Plus Opening General Fund and HRA Balance (47,556)
Closing General Fund and HRA Balance at 31 March 2017
(53,209*)
* For a split of this balance between the General Fund and HRA balances see the Movement in Reserves Statement.
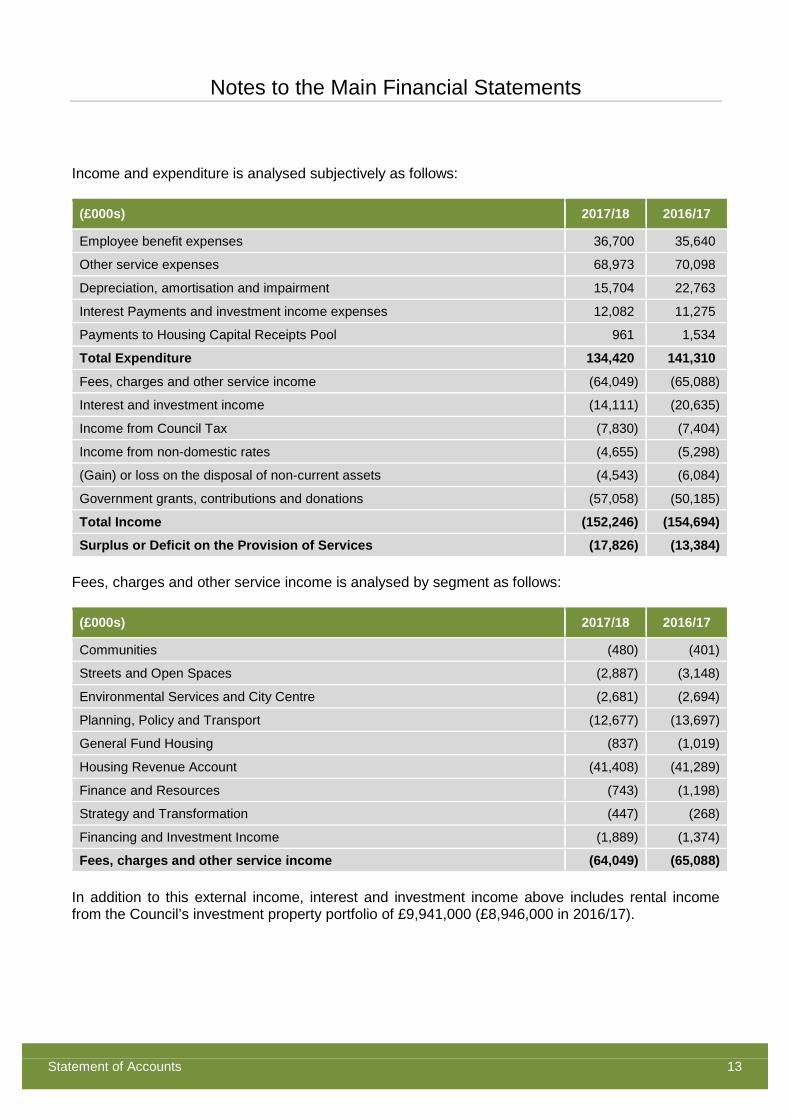
Notes to the Main Financial Statements
Statement of Accounts 13
Income and expenditure is analysed subjectively as follows:
(£000s) 2017/18 2016/17
Employee benefit expenses 36,700 35,640
Other service expenses 68,973 70,098
Depreciation, amortisation and impairment 15,704 22,763
Interest Payments and investment income expenses 12,082 11,275
Payments to Housing Capital Receipts Pool 961 1,534
Total Expenditure 134,420 141,310
Fees, charges and other service income (64,049) (65,088)
Interest and investment income (14,111) (20,635)
Income from Council Tax (7,830) (7,404)
Income from non-domestic rates (4,655) (5,298)
(Gain) or loss on the disposal of non-current assets (4,543) (6,084)
Government grants, contributions and donations (57,058) (50,185)
Total Income (152,246) (154,694)
Surplus or Deficit on the Provision of Services (17,826) (13,384)
Fees, charges and other service income is analysed by segment as follows:
(£000s) 2017/18 2016/17
Communities (480) (401)
Streets and Open Spaces (2,887) (3,148)
Environmental Services and City Centre (2,681) (2,694)
Planning, Policy and Transport (12,677) (13,697)
General Fund Housing (837) (1,019)
Housing Revenue Account (41,408) (41,289)
Finance and Resources (743) (1,198)
Strategy and Transformation (447) (268)
Financing and Investment Income (1,889) (1,374)
Fees, charges and other service income (64,049) (65,088)
In addition to this external income, interest and investment income above includes rental income from the Council’s investment property portfolio of £9,941,000 (£8,946,000 in 2016/17).
Notes to the Main Financial Statements
Statement of Accounts 14
2 Critical Judgements in Applying Accounting Policies
In applying the accounting policies set out on pages 103 to 121, the Council has had to make certain judgements about complex transactions or those involving uncertainty about future events. The critical judgements made in the Statement of Accounts are:
• There is a degree of uncertainty about future levels of funding for local government. However, the Council has determined that this uncertainty is not yet sufficient to provide an indication that the assets of the Council might be impaired as a result of a need to close facilities and significantly reduce levels of service provision.
3 Assumptions Made About the Future and Other Major Sources of Estimation Uncertainty
The preparation of financial statements requires management to make judgements, estimates and assumptions that affect the amounts reported for assets and liabilities as at the balance sheet date and the amounts reported for revenue and expenditure during the year. However, the nature of estimation means that the actual outcomes could differ from those estimates. The key judgements and estimation uncertainty that have a significant risk of causing material adjustment to the carrying amounts of assets and liabilities within the next financial year are as follows:
Pensions Liability
Estimation of the net liability to pay pensions depends on a number of complex judgements relating to the discount rate used, the rate at which salaries are projected to increase, changes in retirement ages, mortality rates and expected returns on pension fund assets. A firm of consulting actuaries is engaged to provide the Council with expert advice about the assumptions to be applied. The net pension liability at 31 March 2018 is estimated to be £116.4 million (£114.0 million at 31 March 2017) and the estimated effects on the liability of changes in individual assumptions is disclosed in Note 36.
Property, Plant and Equipment
Assets are depreciated over useful lives that are dependent on assumptions about the level of repairs and maintenance that will be incurred in relation to individual assets. If the Council did not sustain its current spending on repairs and maintenance the useful lives currently assigned to assets may be reduced. If the useful life of assets is reduced, depreciation increases and the carrying value of the assets fall. It is estimated that the annual depreciation charge for assets would increase by approximately £1,064,000 for every year that useful lives had to be reduced.
Business Rates
Since the introduction of the Business Rates Retention Scheme from 1 April 2013, local authorities are liable for successful appeals against business rates charged to businesses, both in the current financial year and earlier years, in proportion to their local share of business rates income. The Council’s General Fund share of business rates income is 40%.
Notes to the Main Financial Statements
Statement of Accounts 15
A provision has therefore been recognised for the best estimate of the amount that will be repayable in respect of years up to 31 March 2018 following successful rating valuation appeals. The Council’s share of this provision is £4.1 million (£3.7 million as at 31 March 2017) as disclosed in Note 29. The estimate has been calculated using the Valuation Office Agency (VOA) ratings list of appeals and historical data on successful appeals to date for the 2010 list. For the 2017 list the estimate is based on an estimate of the likely average reduction in rateable values over the life of the list. It is possible that appeals will be settled at amounts which differ from the estimate made on historical experience.
Fair Value Measurements
When the fair value of assets and liabilities cannot be measured based on quoted prices in active markets (Level 1 inputs), their fair value is measured using valuation techniques. Where possible, the inputs to these valuation techniques are based on observable data, but where this is not possible judgement is required in establishing fair values. These judgements typically include considerations such as uncertainty and risk. However, changes in the assumptions used could affect the fair value of the Council’s assets and liabilities. Where Level 1 inputs are not available, the Council employs relevant experts to identify the most appropriate valuation techniques to determine fair value. The most significant assets that the Council has measured at fair value in the balance sheet where level 1 inputs are not available are Investment Properties and surplus Property, Plant and Equipment. Significant changes in any of the unobservable inputs used in these valuations would result in significantly higher or lower fair value measurement. Information about the valuation techniques and inputs used in determining the fair value of the Council’s assets and liabilities can be found in Notes 15, 20 and 34.
4 Comprehensive Income and Expenditure Account - Material Items of Income and Expenditure
Material Items of Income and Expenditure
The following material items of income and expenditure are included in the relevant lines of the Comprehensive Income and Expenditure Statement. A net credit for reversal of previous revaluation losses of £6.6 million on council housing stock has been charged to expenditure within the Housing Revenue Account net cost of service line. The comparative figure for 2016/17 includes a net charge of £8.7 million. More detail on the movements in the value of the Council’s housing stock can be found in note 14 to the main financial statements. A net charge for revaluation losses on revaluation of a community centre of £3.1 million has been charged to expenditure within the Communities net cost of service line. A net credit for reversal of previous revaluation losses of £0.4 million (£1.0 million in 2016/17) in respect of car parks has been credited to expenditure within the Planning, Policy and Transport net cost of service line. Financing and investment income includes gains on the value of investment properties of £2.7 million (£10.3 million in 2016/17).
Notes to the Main Financial Statements
Statement of Accounts 16
The Council’s share of non-domestic rates income totalling £39.5 million (£39.1 million in 2016/17) and the tariff of £34.8 million (£33.8 million in 2016/17) payable to central government under the rates retention scheme have been included in taxation and non-specific grant income. The surplus on revaluation of Property, Plant and Equipment includes a net £28.5 million gain (£3.3 million loss in 2016/17) in respect of the Council’s housing stock. There is a total credit for re-measurements of the Council’s net defined benefit pension liability of £5.4 million (total net charge in 2016/17 of £3.3 million). This net figure reflects a number of aspects as detailed in note 36 to the accounts.
5 Movement in Reserves Statement – Adjustments between Accounting Basis and Funding Basis under Regulations
The total comprehensive income and expenditure recognised by the Council in the year, is prepared in accordance with proper accounting practice. This note details the adjustments that are made to income and expenditure to reflect the resources that are specified by statute as being available to the Council to meet future capital and revenue expenditure. The following sets out a description of the reserves that the adjustments are made against:
General Fund Balance
The General Fund is the statutory fund into which all the receipts of an authority are required to be paid and out of which all liabilities of the authority are to be met, except to the extent that statutory rules provide otherwise. These rules can also specify the financial year in which liabilities and payments should impact on the General Fund balance, which is not necessarily in accordance with proper accounting practice. The General Fund balance therefore summarises the resources that the Council is statutorily empowered to spend on its services or on capital investment (or the deficit of resources that the Council is required to recover) at the end of the financial year). The balance is not available to be applied to fund Housing Revenue Account (HRA) services.
Housing Revenue Account (HRA) Balance
The HRA balance reflects the statutory obligation to maintain a revenue account for local authority council housing provision in accordance with Part VI of the Local Government and Housing Act 1989. It contains the balance of income and expenditure as defined by the 1989 Act that is available to fund future expenditure in connection with the Council’s landlord function or (where in deficit) that is required to be recovered from tenants in future years.
Major Repairs Reserve
The Council is required to maintain the Major Repairs Reserve, which controls an element of the capital resources limited to being used on capital expenditure on HRA assets or the financing of historical capital expenditure by the HRA. The balance shows the capital resources that have yet to be applied at the year end.
Capital Receipts Reserve
The Capital Receipts Reserve holds the proceeds from the disposal of land or other assets, which are restricted by statute from being used other than to fund new capital expenditure or to be set aside to finance historical capital expenditure. The balance on the reserve shows the resources that have yet to be applied for these purposes at the year end.
Notes to the Main Financial Statements
Statement of Accounts 17
Capital Grants Unapplied
The Capital Grants Unapplied Account (Reserve) holds the grants and contributions received towards capital expenditure for which there are no outstanding grant conditions but which have yet to be applied to meet expenditure. The balance is restricted by grant terms as to the capital expenditure against which it can be applied.
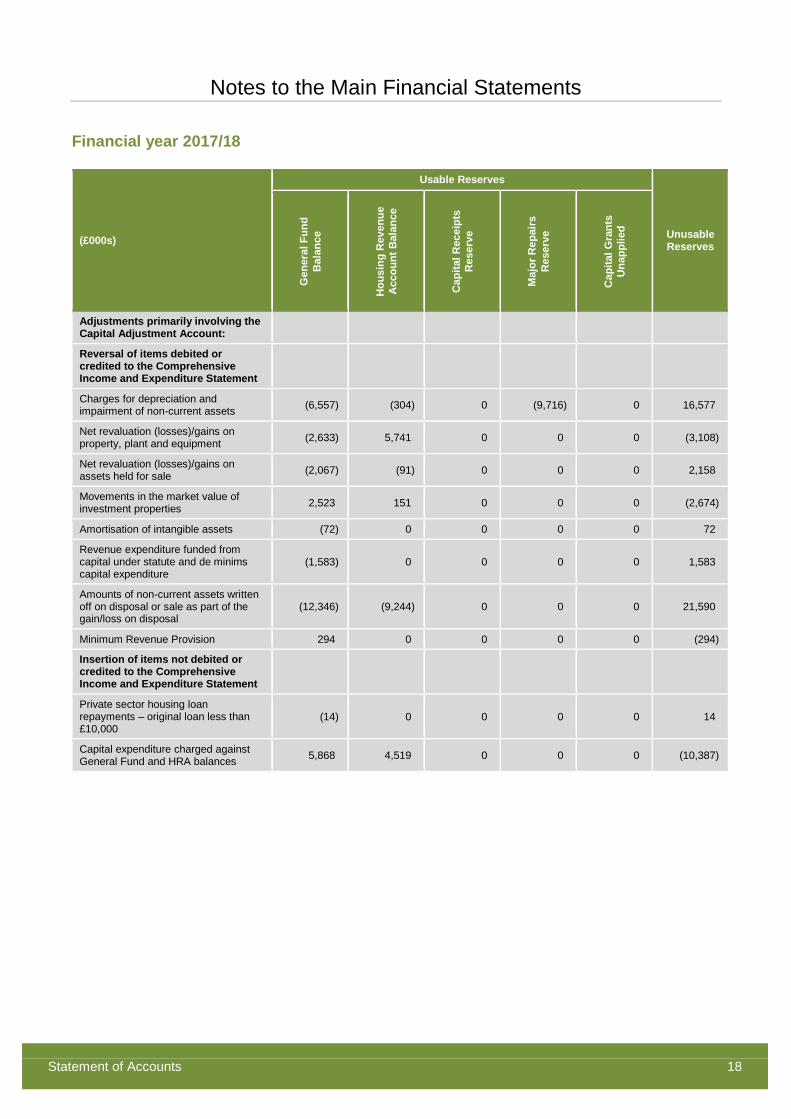
Notes to the Main Financial Statements
Statement of Accounts 18
Financial year 2017/18
(£000s)
Usable Reserves
Unusable Reserves
Gen
eral
Fun
d B
alan
ce
Hou
sing
Rev
enue
A
ccou
nt B
alan
ce
Cap
ital R
ecei
pts
Res
erve
Maj
or R
epai
rs
Res
erve
Cap
ital G
rant
s U
napp
lied
Adjustments primarily involving the Capital Adjustment Account:
Reversal of items debited or credited to the Comprehensive Income and Expenditure Statement
Charges for depreciation and impairment of non-current assets (6,557) (304) 0 (9,716) 0 16,577
Net revaluation (losses)/gains on property, plant and equipment (2,633) 5,741 0 0 0 (3,108)
Net revaluation (losses)/gains on assets held for sale (2,067) (91) 0 0 0 2,158
Movements in the market value of investment properties 2,523 151 0 0 0 (2,674)
Amortisation of intangible assets (72) 0 0 0 0 72
Revenue expenditure funded from capital under statute and de minims capital expenditure
(1,583) 0 0 0 0 1,583
Amounts of non-current assets written off on disposal or sale as part of the gain/loss on disposal
(12,346) (9,244) 0 0 0 21,590
Minimum Revenue Provision 294 0 0 0 0 (294)
Insertion of items not debited or credited to the Comprehensive Income and Expenditure Statement
Private sector housing loan repayments – original loan less than £10,000
(14) 0 0 0 0 14
Capital expenditure charged against General Fund and HRA balances 5,868 4,519 0 0 0 (10,387)

Notes to the Main Financial Statements
Statement of Accounts 19
(£000s)
Usable Reserves
Unusable Reserves
Gen
eral
Fun
d B
alan
ce
Hou
sing
Rev
enue
A
ccou
nt B
alan
ce
Cap
ital R
ecei
pts
Res
erve
Maj
or R
epai
rs
Res
erve
Cap
ital G
rant
s U
napp
lied
Adjustments primarily involving the Capital Grants Unapplied Account:
Capital grants and contributions unapplied credited to the Comprehensive Income and Expenditure Statement
6,088 1,270 0 0 (7,358) 0
Application of grants to capital financing transferred to the Capital Adjustment Account
0 0 0 0 6,174 (6,174)
Adjustments primarily involving the Capital Receipts Reserve:
Transfer of cash sale proceeds credited as part of the gain/loss on disposal to the Comprehensive Income and Expenditure Statement
4,355 12,653 (17,008) 0 0 0
Other capital receipts 0 26 (26) 0 0 0
Transfer of capital receipts to administrative costs of disposal of non-current assets
0 (228) 228 0 0 0
Use of the Capital Receipts Reserve to finance new capital expenditure 0 0 7,662 0 0 (7,662)
Contribution from the Capital Receipts Reserve to finance the payments to the Government capital receipts pool
(961) 0 961 0 0 0
Transfer to capital receipts reserve on receipt of loan payment 0 0 (11) 0 0 11
Transfer from Deferred Capital Receipts Reserve upon receipt of cash 0 0 0 0 0 0
Adjustments primarily involving the Deferred Capital Receipts Reserve:
Transfer of deferred sales proceeds credited to the Comprehensive Income and Expenditure Statement as part of the gain/loss on disposal
9,267 0 0 0 0 (9,267)
Adjustments primarily involving the Major Repairs Reserve:
Transfer allowed by statute between the HRA and Major Repairs Reserve 0 0 0 0 0 0
Use of the Major Repairs Reserve to finance new capital expenditure 0 0 0 7,111 0 (7,111)
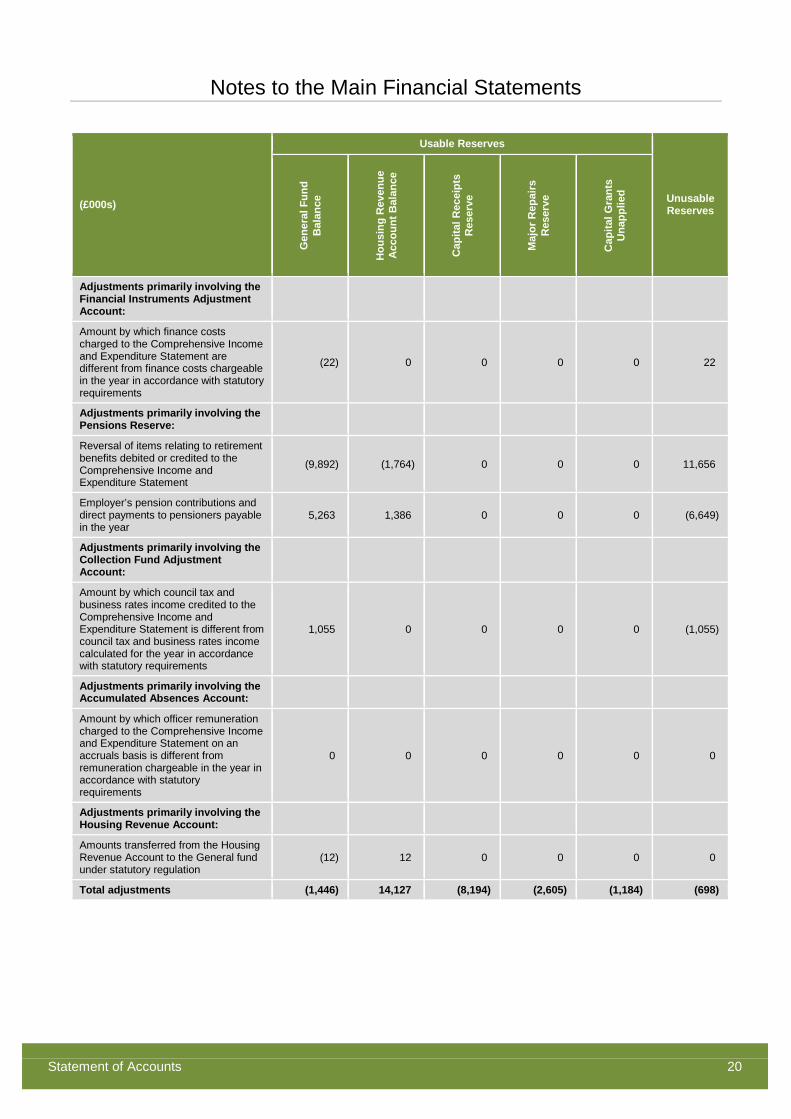
Notes to the Main Financial Statements
Statement of Accounts 20
(£000s)
Usable Reserves
Unusable Reserves
Gen
eral
Fun
d B
alan
ce
Hou
sing
Rev
enue
A
ccou
nt B
alan
ce
Cap
ital R
ecei
pts
Res
erve
Maj
or R
epai
rs
Res
erve
Cap
ital G
rant
s U
napp
lied
Adjustments primarily involving the Financial Instruments Adjustment Account:
Amount by which finance costs charged to the Comprehensive Income and Expenditure Statement are different from finance costs chargeable in the year in accordance with statutory requirements
(22) 0 0 0 0 22
Adjustments primarily involving the Pensions Reserve:
Reversal of items relating to retirement benefits debited or credited to the Comprehensive Income and Expenditure Statement
(9,892) (1,764) 0 0 0 11,656
Employer’s pension contributions and direct payments to pensioners payable in the year
5,263 1,386 0 0 0 (6,649)
Adjustments primarily involving the Collection Fund Adjustment Account:
Amount by which council tax and business rates income credited to the Comprehensive Income and Expenditure Statement is different from council tax and business rates income calculated for the year in accordance with statutory requirements
1,055 0 0 0 0 (1,055)
Adjustments primarily involving the Accumulated Absences Account:
Amount by which officer remuneration charged to the Comprehensive Income and Expenditure Statement on an accruals basis is different from remuneration chargeable in the year in accordance with statutory requirements
0 0 0 0 0 0
Adjustments primarily involving the Housing Revenue Account:
Amounts transferred from the Housing Revenue Account to the General fund under statutory regulation
(12) 12 0 0 0 0
Total adjustments (1,446) 14,127 (8,194) (2,605) (1,184) (698)
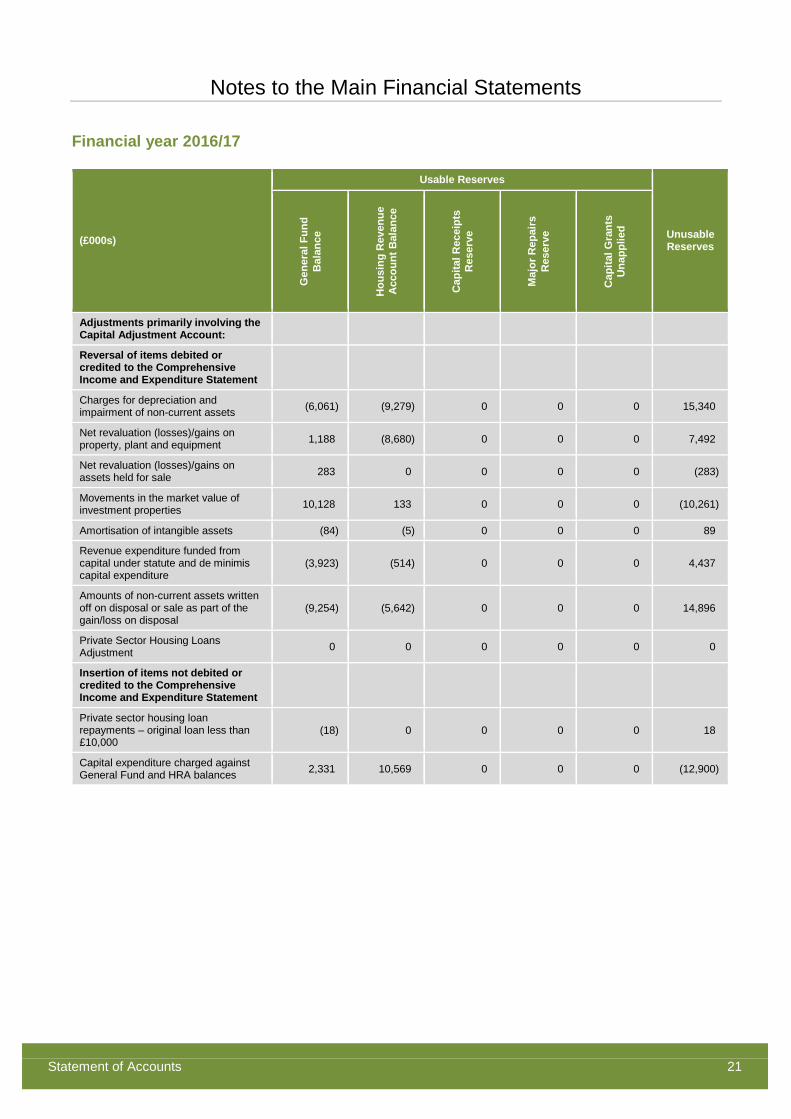
Notes to the Main Financial Statements
Statement of Accounts 21
Financial year 2016/17
(£000s)
Usable Reserves
Unusable Reserves
Gen
eral
Fun
d B
alan
ce
Hou
sing
Rev
enue
A
ccou
nt B
alan
ce
Cap
ital R
ecei
pts
Res
erve
Maj
or R
epai
rs
Res
erve
Cap
ital G
rant
s U
napp
lied
Adjustments primarily involving the Capital Adjustment Account:
Reversal of items debited or credited to the Comprehensive Income and Expenditure Statement
Charges for depreciation and impairment of non-current assets (6,061) (9,279) 0 0 0 15,340
Net revaluation (losses)/gains on property, plant and equipment 1,188 (8,680) 0 0 0 7,492
Net revaluation (losses)/gains on assets held for sale 283 0 0 0 0 (283)
Movements in the market value of investment properties 10,128 133 0 0 0 (10,261)
Amortisation of intangible assets (84) (5) 0 0 0 89
Revenue expenditure funded from capital under statute and de minimis capital expenditure
(3,923) (514) 0 0 0 4,437
Amounts of non-current assets written off on disposal or sale as part of the gain/loss on disposal
(9,254) (5,642) 0 0 0 14,896
Private Sector Housing Loans Adjustment 0 0 0 0 0 0
Insertion of items not debited or credited to the Comprehensive Income and Expenditure Statement
Private sector housing loan repayments – original loan less than £10,000
(18) 0 0 0 0 18
Capital expenditure charged against General Fund and HRA balances 2,331 10,569 0 0 0 (12,900)
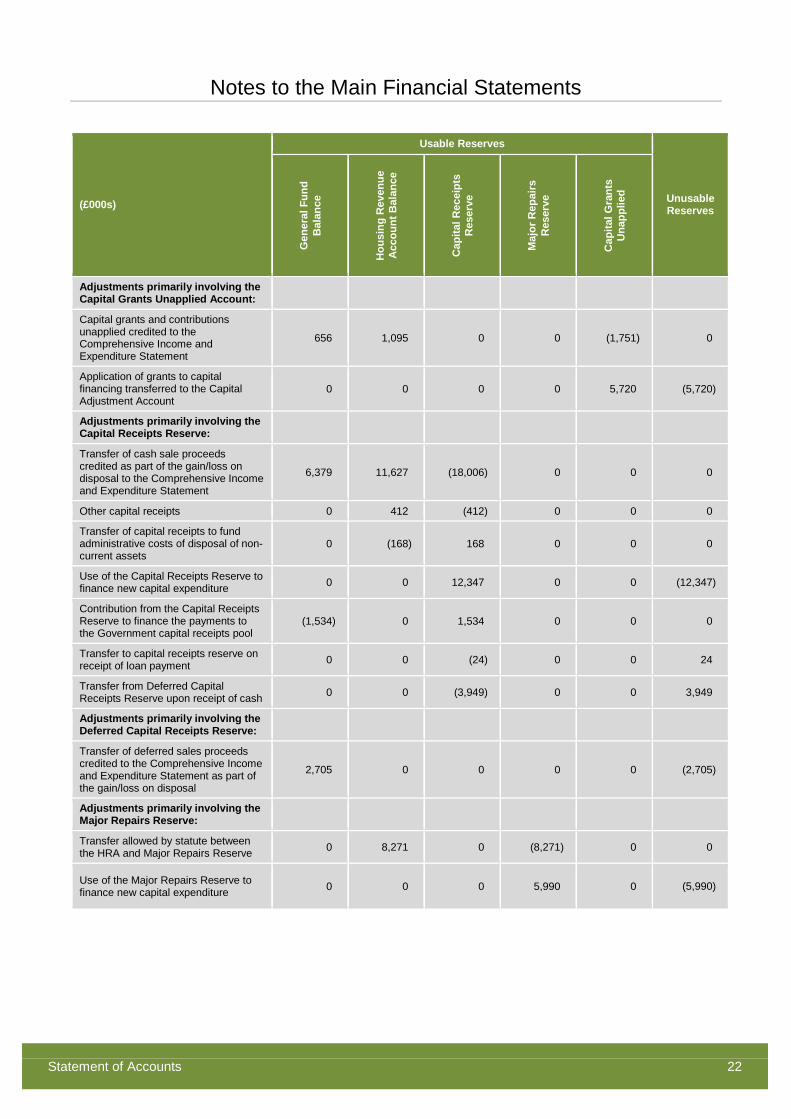
Notes to the Main Financial Statements
Statement of Accounts 22
(£000s)
Usable Reserves
Unusable Reserves
Gen
eral
Fun
d B
alan
ce
Hou
sing
Rev
enue
A
ccou
nt B
alan
ce
Cap
ital R
ecei
pts
Res
erve
Maj
or R
epai
rs
Res
erve
Cap
ital G
rant
s U
napp
lied
Adjustments primarily involving the Capital Grants Unapplied Account:
Capital grants and contributions unapplied credited to the Comprehensive Income and Expenditure Statement
656 1,095 0 0 (1,751) 0
Application of grants to capital financing transferred to the Capital Adjustment Account
0 0 0 0 5,720 (5,720)
Adjustments primarily involving the Capital Receipts Reserve:
Transfer of cash sale proceeds credited as part of the gain/loss on disposal to the Comprehensive Income and Expenditure Statement
6,379 11,627 (18,006) 0 0 0
Other capital receipts 0 412 (412) 0 0 0
Transfer of capital receipts to fund administrative costs of disposal of non-current assets
0 (168) 168 0 0 0
Use of the Capital Receipts Reserve to finance new capital expenditure 0 0 12,347 0 0 (12,347)
Contribution from the Capital Receipts Reserve to finance the payments to the Government capital receipts pool
(1,534) 0 1,534 0 0 0
Transfer to capital receipts reserve on receipt of loan payment 0 0 (24) 0 0 24
Transfer from Deferred Capital Receipts Reserve upon receipt of cash 0 0 (3,949) 0 0 3,949
Adjustments primarily involving the Deferred Capital Receipts Reserve:
Transfer of deferred sales proceeds credited to the Comprehensive Income and Expenditure Statement as part of the gain/loss on disposal
2,705 0 0 0 0 (2,705)
Adjustments primarily involving the Major Repairs Reserve:
Transfer allowed by statute between the HRA and Major Repairs Reserve 0 8,271 0 (8,271) 0 0
Use of the Major Repairs Reserve to finance new capital expenditure 0 0 0 5,990 0
(5,990)
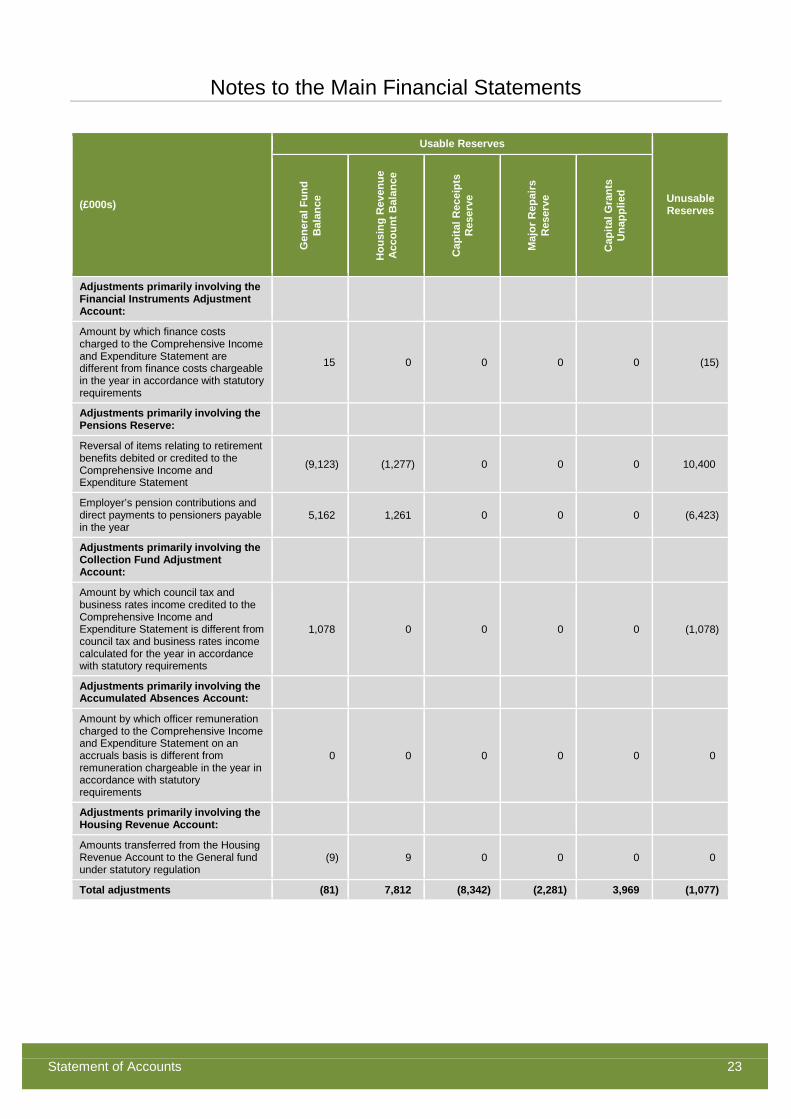
Notes to the Main Financial Statements
Statement of Accounts 23
(£000s)
Usable Reserves
Unusable Reserves
Gen
eral
Fun
d B
alan
ce
Hou
sing
Rev
enue
A
ccou
nt B
alan
ce
Cap
ital R
ecei
pts
Res
erve
Maj
or R
epai
rs
Res
erve
Cap
ital G
rant
s U
napp
lied
Adjustments primarily involving the Financial Instruments Adjustment Account:
Amount by which finance costs charged to the Comprehensive Income and Expenditure Statement are different from finance costs chargeable in the year in accordance with statutory requirements
15 0 0 0 0 (15)
Adjustments primarily involving the Pensions Reserve:
Reversal of items relating to retirement benefits debited or credited to the Comprehensive Income and Expenditure Statement
(9,123) (1,277) 0 0 0 10,400
Employer’s pension contributions and direct payments to pensioners payable in the year
5,162 1,261 0 0 0 (6,423)
Adjustments primarily involving the Collection Fund Adjustment Account:
Amount by which council tax and business rates income credited to the Comprehensive Income and Expenditure Statement is different from council tax and business rates income calculated for the year in accordance with statutory requirements
1,078 0 0 0 0 (1,078)
Adjustments primarily involving the Accumulated Absences Account:
Amount by which officer remuneration charged to the Comprehensive Income and Expenditure Statement on an accruals basis is different from remuneration chargeable in the year in accordance with statutory requirements
0 0 0 0 0 0
Adjustments primarily involving the Housing Revenue Account:
Amounts transferred from the Housing Revenue Account to the General fund under statutory regulation
(9) 9 0 0 0 0
Total adjustments (81) 7,812 (8,342) (2,281) 3,969 (1,077)
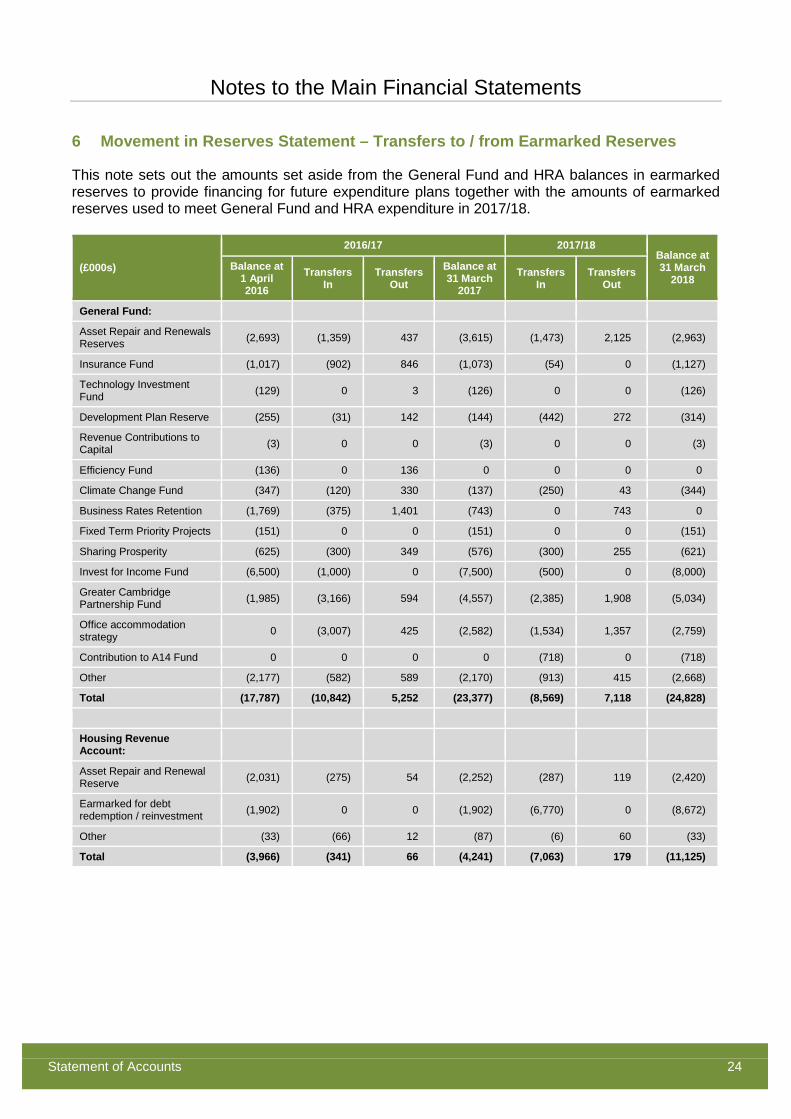
Notes to the Main Financial Statements
Statement of Accounts 24
6 Movement in Reserves Statement – Transfers to / from Earmarked Reserves
This note sets out the amounts set aside from the General Fund and HRA balances in earmarked reserves to provide financing for future expenditure plans together with the amounts of earmarked reserves used to meet General Fund and HRA expenditure in 2017/18.
(£000s)
2016/17 2017/18 Balance at 31 March
2018 Balance at
1 April 2016
Transfers In
Transfers Out
Balance at 31 March
2017 Transfers
In Transfers
Out
General Fund:
Asset Repair and Renewals Reserves (2,693) (1,359) 437 (3,615) (1,473) 2,125 (2,963)
Insurance Fund (1,017) (902) 846 (1,073) (54) 0 (1,127)
Technology Investment Fund (129) 0 3 (126) 0 0 (126)
Development Plan Reserve (255) (31) 142 (144) (442) 272 (314)
Revenue Contributions to Capital (3) 0 0 (3) 0 0 (3)
Efficiency Fund (136) 0 136 0 0 0 0
Climate Change Fund (347) (120) 330 (137) (250) 43 (344)
Business Rates Retention (1,769) (375) 1,401 (743) 0 743 0
Fixed Term Priority Projects (151) 0 0 (151) 0 0 (151)
Sharing Prosperity (625) (300) 349 (576) (300) 255 (621)
Invest for Income Fund (6,500) (1,000) 0 (7,500) (500) 0 (8,000)
Greater Cambridge Partnership Fund (1,985) (3,166) 594 (4,557) (2,385) 1,908 (5,034)
Office accommodation strategy 0 (3,007) 425 (2,582) (1,534) 1,357 (2,759)
Contribution to A14 Fund 0 0 0 0 (718) 0 (718)
Other (2,177) (582) 589 (2,170) (913) 415 (2,668)
Total (17,787) (10,842) 5,252 (23,377) (8,569) 7,118 (24,828)
Housing Revenue Account:
Asset Repair and Renewal Reserve (2,031) (275) 54 (2,252) (287) 119 (2,420)
Earmarked for debt redemption / reinvestment (1,902) 0 0 (1,902) (6,770) 0 (8,672)
Other (33) (66) 12 (87) (6) 60 (33)
Total (3,966) (341) 66 (4,241) (7,063) 179 (11,125)
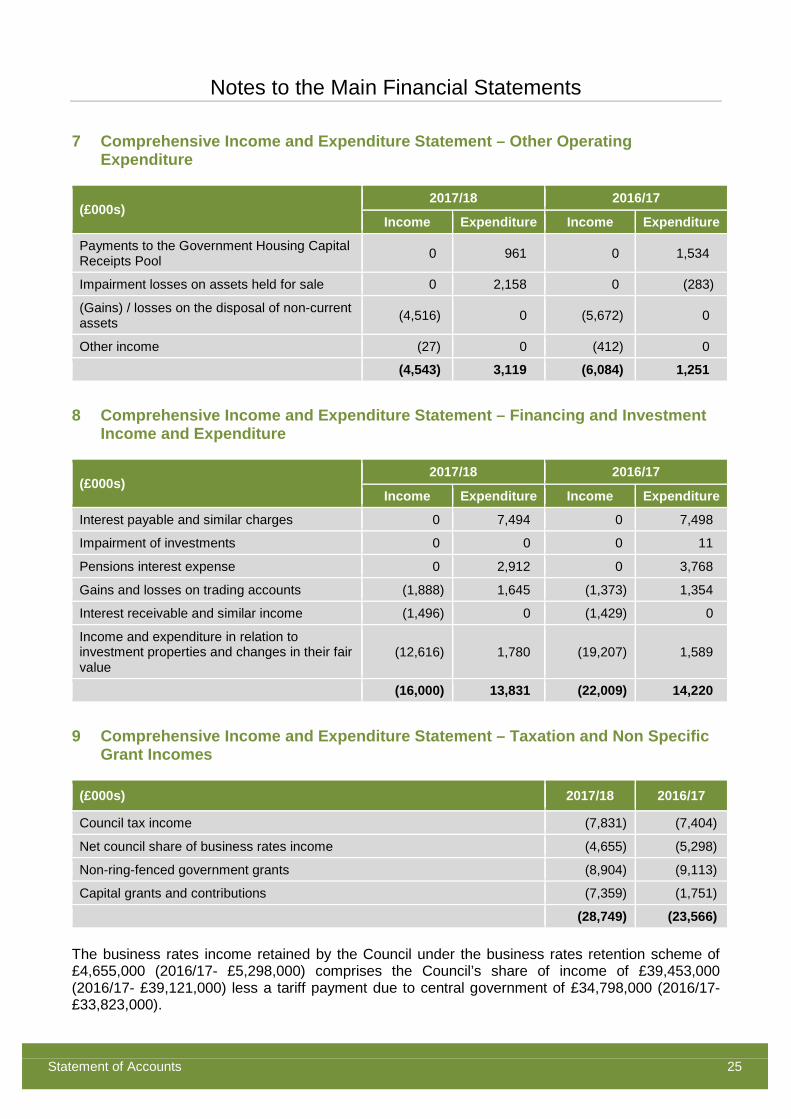
Notes to the Main Financial Statements
Statement of Accounts 25
7 Comprehensive Income and Expenditure Statement – Other Operating Expenditure
(£000s) 2017/18 2016/17
Income Expenditure Income Expenditure
Payments to the Government Housing Capital Receipts Pool 0 961 0 1,534
Impairment losses on assets held for sale 0 2,158 0 (283)
(Gains) / losses on the disposal of non-current assets (4,516) 0 (5,672) 0
Other income (27) 0 (412) 0
(4,543) 3,119 (6,084) 1,251
8 Comprehensive Income and Expenditure Statement – Financing and Investment Income and Expenditure
(£000s) 2017/18 2016/17
Income Expenditure Income Expenditure
Interest payable and similar charges 0 7,494 0 7,498
Impairment of investments 0 0 0 11
Pensions interest expense 0 2,912 0 3,768
Gains and losses on trading accounts (1,888) 1,645 (1,373) 1,354
Interest receivable and similar income (1,496) 0 (1,429) 0
Income and expenditure in relation to investment properties and changes in their fair value
(12,616) 1,780 (19,207) 1,589
(16,000) 13,831 (22,009) 14,220
9 Comprehensive Income and Expenditure Statement – Taxation and Non Specific Grant Incomes
(£000s) 2017/18 2016/17
Council tax income (7,831) (7,404)
Net council share of business rates income (4,655) (5,298)
Non-ring-fenced government grants (8,904) (9,113)
Capital grants and contributions (7,359) (1,751)
(28,749) (23,566) The business rates income retained by the Council under the business rates retention scheme of £4,655,000 (2016/17- £5,298,000) comprises the Council’s share of income of £39,453,000 (2016/17- £39,121,000) less a tariff payment due to central government of £34,798,000 (2016/17- £33,823,000).
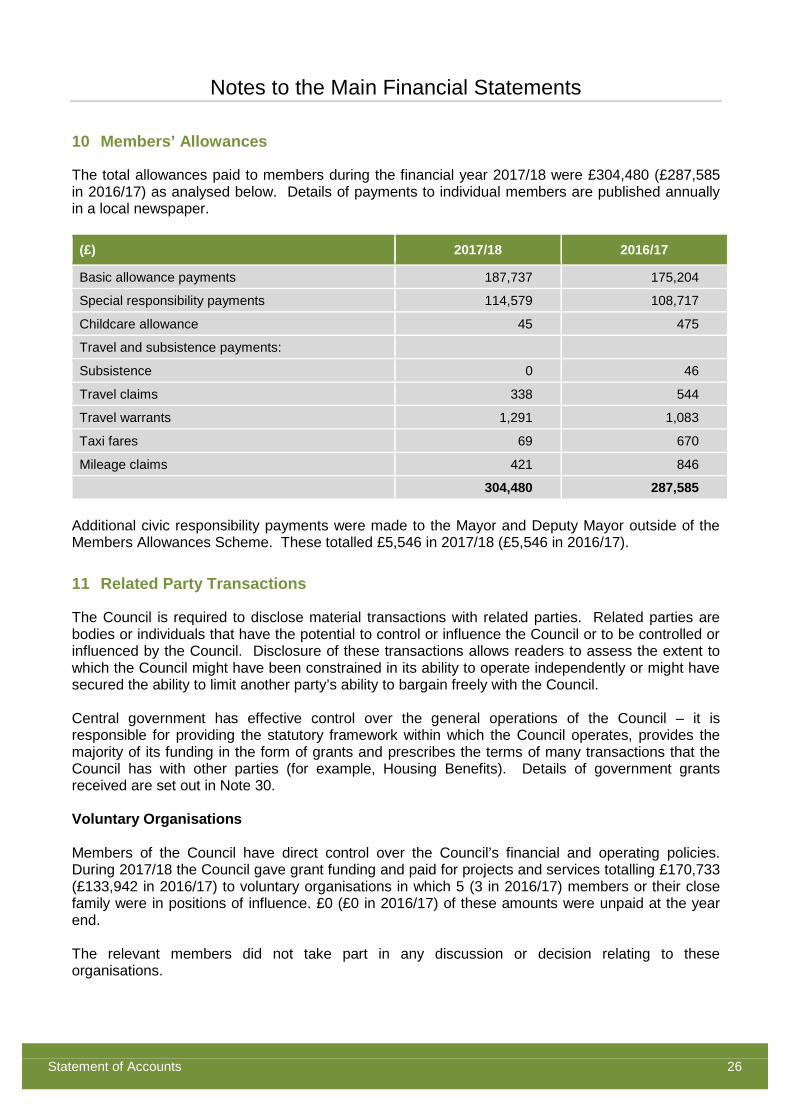
Notes to the Main Financial Statements
Statement of Accounts 26
10 Members’ Allowances
The total allowances paid to members during the financial year 2017/18 were £304,480 (£287,585 in 2016/17) as analysed below. Details of payments to individual members are published annually in a local newspaper.
(£) 2017/18 2016/17
Basic allowance payments 187,737 175,204
Special responsibility payments 114,579 108,717
Childcare allowance 45 475
Travel and subsistence payments:
Subsistence 0 46
Travel claims 338 544
Travel warrants 1,291 1,083
Taxi fares 69 670
Mileage claims 421 846
304,480 287,585 Additional civic responsibility payments were made to the Mayor and Deputy Mayor outside of the Members Allowances Scheme. These totalled £5,546 in 2017/18 (£5,546 in 2016/17).
11 Related Party Transactions
The Council is required to disclose material transactions with related parties. Related parties are bodies or individuals that have the potential to control or influence the Council or to be controlled or influenced by the Council. Disclosure of these transactions allows readers to assess the extent to which the Council might have been constrained in its ability to operate independently or might have secured the ability to limit another party’s ability to bargain freely with the Council. Central government has effective control over the general operations of the Council – it is responsible for providing the statutory framework within which the Council operates, provides the majority of its funding in the form of grants and prescribes the terms of many transactions that the Council has with other parties (for example, Housing Benefits). Details of government grants received are set out in Note 30. Voluntary Organisations Members of the Council have direct control over the Council’s financial and operating policies. During 2017/18 the Council gave grant funding and paid for projects and services totalling £170,733 (£133,942 in 2016/17) to voluntary organisations in which 5 (3 in 2016/17) members or their close family were in positions of influence. £0 (£0 in 2016/17) of these amounts were unpaid at the year end. The relevant members did not take part in any discussion or decision relating to these organisations.
Notes to the Main Financial Statements
Statement of Accounts 27
Cambridge Live The Council transferred the running of the Cambridge Folk Festival, Corn Exchange and other aspects of the arts and recreation service to a new arts trust charity, Cambridge Live, a company limited by guarantee, on 1 April 2015. Two members of the Council are appointed as trustees, and the Articles of Association require a minimum of 11 trustees. At 1 April 2015 the Council granted a lease of relevant premises (The Corn Exchange, Parson’s Court Offices and Wheeler Street Box Office) at a peppercorn rent for 25 years. The Council made a loan to the company for start-up costs. This totals £124,760 at 31 March 2018 (£124,760 at 31 March 2017) and has been 100% provided for in 2017/18. No interest is due on the repayment. The Council paid £441,555 to the company for services in 2017/18 (£372,570 in 2016/17), together with a s106 grant for artwork of £8,500 (£2,000 in 2016/17) and a further payment towards refurbishment works of £0 (£65,948 in 2016/17). The Council has also recharged the company for its share of costs including utilities and has also paid for some services, but on the same basis as other customers of Cambridge Live. At the year-end short term creditors with Cambridge Live and its trading subsidiary were £10,000 (£33,600 at 31 March 2017). At the year-end short term debtors were £2,307 (£1,508 at 31 March 2017). The Council considers that it has significant influence over Cambridge Live and in group accounting terms Cambridge Live is an associate undertaking. However the results of Cambridge Live have not been consolidated into the group financial statements on the basis of materiality. Based on draft results to March 2018 the Council’s share of the deficit for the year would be less than £50,000. Visit Cambridge and Beyond The Council transferred the provision of tourism services to Visit Cambridge and Beyond (VCB), a company limited by guarantee, on 1 February 2016. There are 13 directors, of which one is appointed by the City Council. The Council is therefore not considered to have significant influence over the company. As disclosed in note 23 start-up costs of £90,306 were paid by the Council on behalf of the company and are due for repayment by the company starting in 2019. No interest is due on the repayment. The Council has paid over income due to VCB and recharged it for its share of costs, including utilities and rent for offices at the Guildhall which is determined on a commercial basis. At 31 March 2018 short term debtors were £13,459 (£2,450 in 2016/17) and short term creditors were £0 (£3,291 in 2016/17) The Council paid grant subsidy of £48,130 to VCB (£51,780 in 2016/17). Cambridge Investment Partnership LLP The Council has a 50% stake (£100) in a limited liability partnership, Cambridge Investment Partnership (CIP) LLP, with Hill Investment Partnerships Limited, which was incorporated in December 2016. The partnership redevelops land in the Cambridge area, including for affordable housing. The Council received income of £232,000 from CIP during 2017/18. Including VAT £233,000 was outstanding at 31 March 2018. The Council paid CIP £707,000 (£583,000 for capital works and £124,000 for revenue expenditure) in return for work in respect of housing redevelopment. This was all outstanding at the year end.
Notes to the Main Financial Statements
Statement of Accounts 28
The Council disposed of the former Mill Road depot site to CIP in December 2017. The deferred sales proceeds due from CIP are reflected in a loan note (currently expected to be repaid in 2021) as disclosed in Note 23. Notional interest on the loan is required to be reflected in interest income – this is £45,000 for 2017/18. Hill Investment Partnerships is part of the Hill group of companies. The Council paid £1,799,000 during 2017/18 (£6,267,000 during 2016/17) of which £429,000 (£277,000 at 31 March 2017) was outstanding at the year end to Hill Residential, another Hill Group company, in relation to building of affordable housing and commercial property at Clay Farm. Another Hill group company is also a member of Colokate LLP, to whom the Council paid £2,301,000 during 2016/17 for affordable homes on the Homerton site. Both of these contracts were in place before the CIP was established. In group accounting terms, CIP is a Joint Venture and the Council’s share of CIP’s financial performance has been consolidated into the group financial statements. CIP made a loss of £413,000 for the period to 31 March 2018. Cambridge City Housing Company Limited The Council owns 100% of the share capital of Cambridge City Housing Company Limited (CCHC) which began trading in May 2016. The company provides homes for intermediate market rent in Cambridge. As detailed in Note 22 the Council made a loan to CCHC of £7,500,000 in 2016/17. Interest of £152,000 (£133,000 in 2016/17) on the loan is included in Financing and Investment Income. Interest outstanding at 31 March 2018 was £0 (£133,000 at 31 March 2017). The Council disposed of dwellings under construction to the company of £6,355,000 during 2016/17. Revenues of £25,000 on management and staff services and £9,000 of service charges provided by the Council to the company are included in the Comprehensive Income and Expenditure Statement. (£14,000 at the 31 March 2017). The Council also recharged a number of items to the company at cost. Total debtors at 31 March 2018 are £15,000. The company made a profit of £351,000 for 2017/18 (a loss of £213,000 in 2016/17). The company has been consolidated into the Group Accounts. Storey’s Field Community Trust Storey’s Field Community Trust is a company limited by guarantee established by the University of Cambridge and Cambridge City Council to jointly manage and operate the new community centre in North West Cambridge. The University and the Council each appoint two Trustees. The community centre opened towards the end of the 2017/18 financial year. The Council incurred and recharged staff management costs of £67,684 to the Trust in relation to 2017/18. There is a debtor balance of £20,880 at 31 March 2018.
Notes to the Main Financial Statements
Statement of Accounts 29
In group accounting terms, Storey’s Field Community Trust is a Joint Venture, but the Council has not included the Trust’s results in the consolidated financial statements on the grounds of materiality. The Council’s share of the loss for the period to 31 March 2018 and its share of the net liabilities is in the order of £75,000. Shared services with other local authorities The Council shares a number of services with Huntingdonshire District Council and South Cambridgeshire District Council. These include ICT, Building Control, and Legal, which commenced on 1 October 2015 under the banner of 3Cs Shared Services. In addition the Council shares a waste service with South Cambridgeshire District Council. There is a lead authority for each service and the Council accounts for shared service transactions in its accounts in accordance with The Code of Practice on Local Authority Accounting. No other material transactions have been identified for disclosure which are not already included elsewhere in this Statement of Accounts.
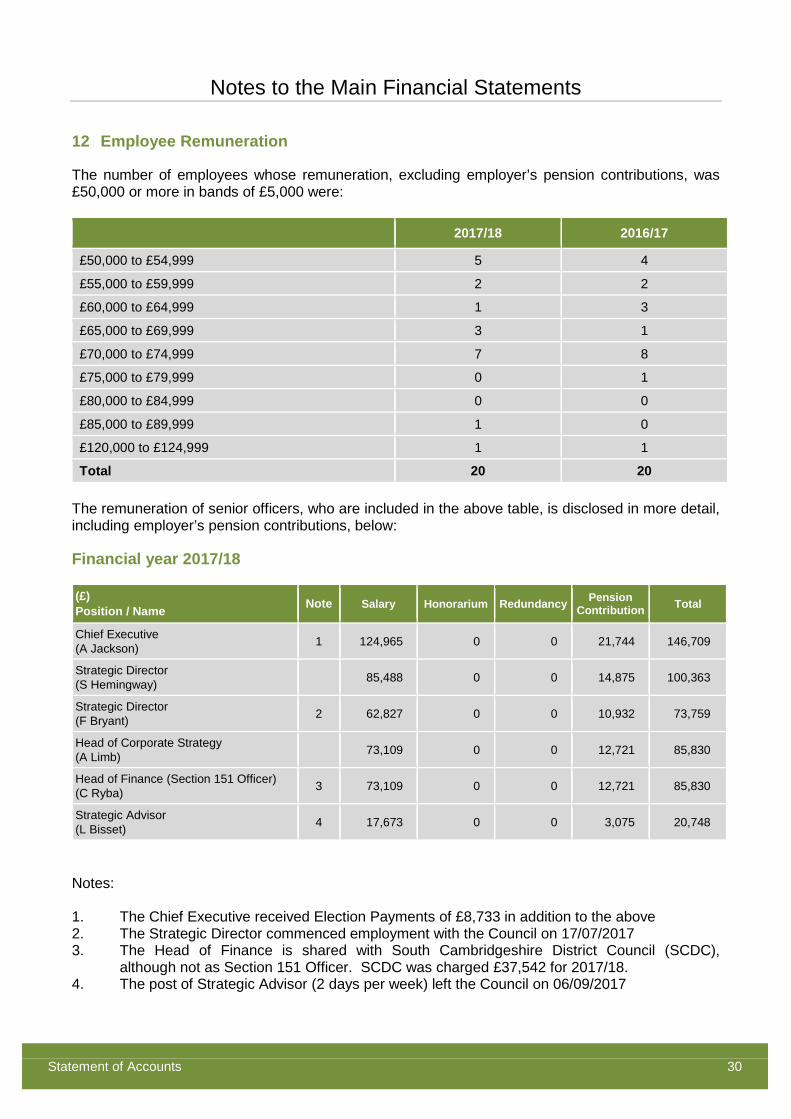
Notes to the Main Financial Statements
Statement of Accounts 30
12 Employee Remuneration
The number of employees whose remuneration, excluding employer’s pension contributions, was £50,000 or more in bands of £5,000 were:
2017/18 2016/17
£50,000 to £54,999 5 4
£55,000 to £59,999 2 2
£60,000 to £64,999 1 3
£65,000 to £69,999 3 1
£70,000 to £74,999 7 8
£75,000 to £79,999 0 1
£80,000 to £84,999 0 0
£85,000 to £89,999 1 0
£120,000 to £124,999 1 1
Total 20 20 The remuneration of senior officers, who are included in the above table, is disclosed in more detail, including employer’s pension contributions, below:
Financial year 2017/18
(£) Position / Name Note Salary Honorarium Redundancy Pension
Contribution Total
Chief Executive (A Jackson) 1 124,965 0 0 21,744 146,709
Strategic Director (S Hemingway) 85,488 0 0 14,875 100,363
Strategic Director (F Bryant) 2 62,827 0 0 10,932 73,759
Head of Corporate Strategy (A Limb) 73,109 0 0 12,721 85,830
Head of Finance (Section 151 Officer) (C Ryba) 3 73,109 0 0 12,721 85,830
Strategic Advisor (L Bisset) 4 17,673 0 0 3,075 20,748
Notes: 1. The Chief Executive received Election Payments of £8,733 in addition to the above 2. The Strategic Director commenced employment with the Council on 17/07/2017 3. The Head of Finance is shared with South Cambridgeshire District Council (SCDC),
although not as Section 151 Officer. SCDC was charged £37,542 for 2017/18. 4. The post of Strategic Advisor (2 days per week) left the Council on 06/09/2017
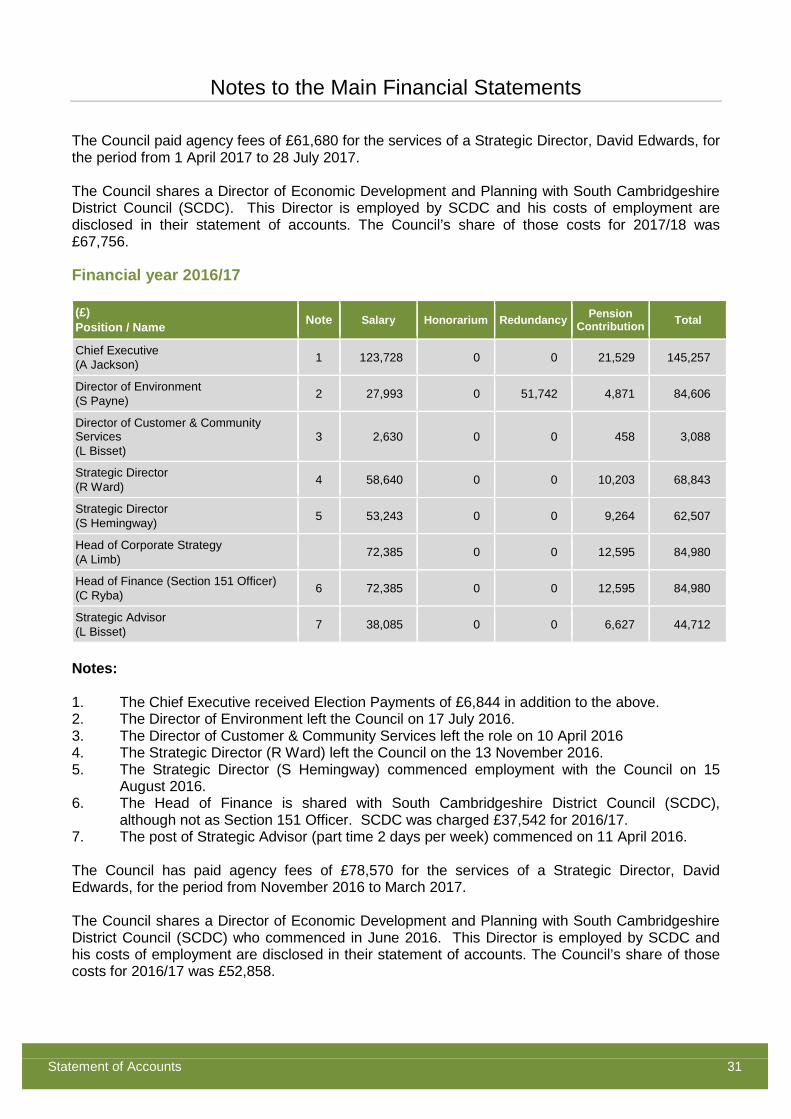
Notes to the Main Financial Statements
Statement of Accounts 31
The Council paid agency fees of £61,680 for the services of a Strategic Director, David Edwards, for the period from 1 April 2017 to 28 July 2017. The Council shares a Director of Economic Development and Planning with South Cambridgeshire District Council (SCDC). This Director is employed by SCDC and his costs of employment are disclosed in their statement of accounts. The Council’s share of those costs for 2017/18 was £67,756.
Financial year 2016/17
(£) Position / Name Note Salary Honorarium Redundancy Pension
Contribution Total
Chief Executive (A Jackson) 1 123,728 0 0 21,529 145,257
Director of Environment (S Payne) 2 27,993 0 51,742 4,871 84,606
Director of Customer & Community Services (L Bisset)
3 2,630 0 0 458 3,088
Strategic Director (R Ward) 4 58,640 0 0 10,203 68,843
Strategic Director (S Hemingway) 5 53,243 0 0 9,264 62,507
Head of Corporate Strategy (A Limb) 72,385 0 0 12,595 84,980
Head of Finance (Section 151 Officer) (C Ryba) 6 72,385 0 0 12,595 84,980
Strategic Advisor (L Bisset) 7 38,085 0 0 6,627 44,712
Notes: 1. The Chief Executive received Election Payments of £6,844 in addition to the above. 2. The Director of Environment left the Council on 17 July 2016. 3. The Director of Customer & Community Services left the role on 10 April 2016 4. The Strategic Director (R Ward) left the Council on the 13 November 2016. 5. The Strategic Director (S Hemingway) commenced employment with the Council on 15
August 2016. 6. The Head of Finance is shared with South Cambridgeshire District Council (SCDC),
although not as Section 151 Officer. SCDC was charged £37,542 for 2016/17. 7. The post of Strategic Advisor (part time 2 days per week) commenced on 11 April 2016. The Council has paid agency fees of £78,570 for the services of a Strategic Director, David Edwards, for the period from November 2016 to March 2017. The Council shares a Director of Economic Development and Planning with South Cambridgeshire District Council (SCDC) who commenced in June 2016. This Director is employed by SCDC and his costs of employment are disclosed in their statement of accounts. The Council’s share of those costs for 2016/17 was £52,858.
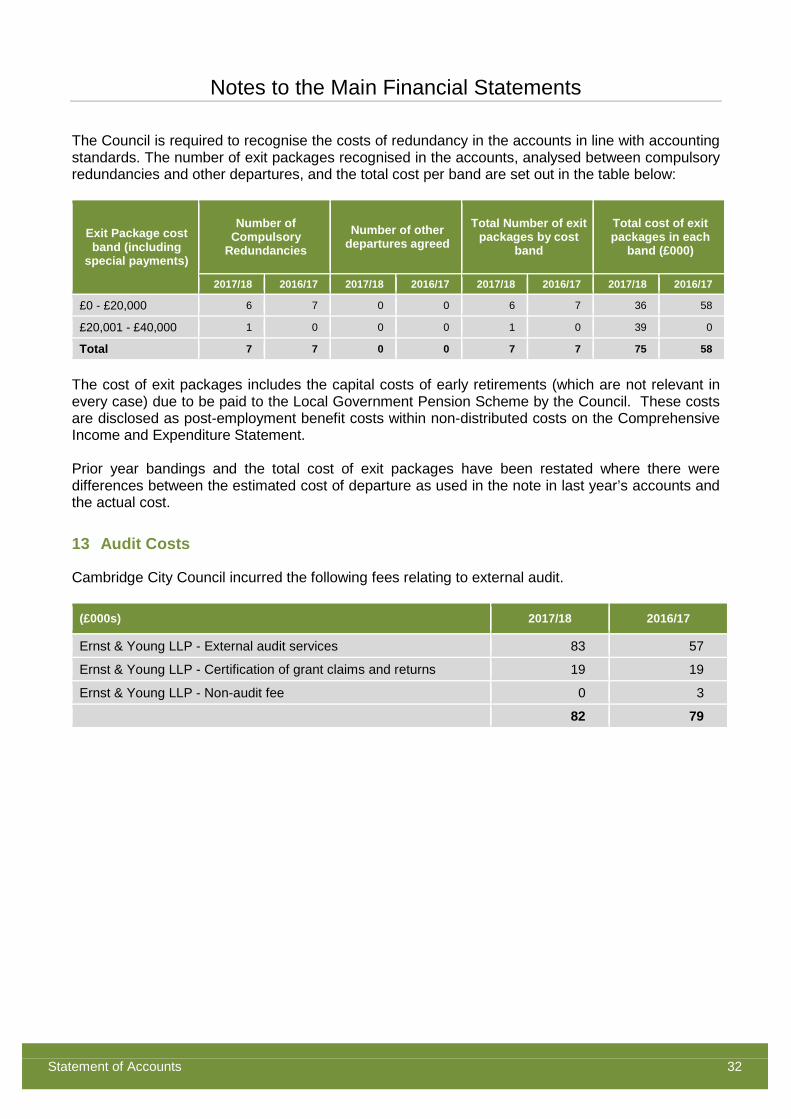
Notes to the Main Financial Statements
Statement of Accounts 32
The Council is required to recognise the costs of redundancy in the accounts in line with accounting standards. The number of exit packages recognised in the accounts, analysed between compulsory redundancies and other departures, and the total cost per band are set out in the table below:
Exit Package cost band (including
special payments)
Number of Compulsory
Redundancies Number of other
departures agreed Total Number of exit
packages by cost band
Total cost of exit packages in each
band (£000)
2017/18 2016/17 2017/18 2016/17 2017/18 2016/17 2017/18 2016/17
£0 - £20,000 6 7 0 0 6 7 36 58
£20,001 - £40,000 1 0 0 0 1 0 39 0
Total 7 7 0 0 7 7 75 58
The cost of exit packages includes the capital costs of early retirements (which are not relevant in every case) due to be paid to the Local Government Pension Scheme by the Council. These costs are disclosed as post-employment benefit costs within non-distributed costs on the Comprehensive Income and Expenditure Statement. Prior year bandings and the total cost of exit packages have been restated where there were differences between the estimated cost of departure as used in the note in last year’s accounts and the actual cost.
13 Audit Costs
Cambridge City Council incurred the following fees relating to external audit.
(£000s) 2017/18 2016/17
Ernst & Young LLP - External audit services 83 57
Ernst & Young LLP - Certification of grant claims and returns 19 19
Ernst & Young LLP - Non-audit fee 0 3
82 79
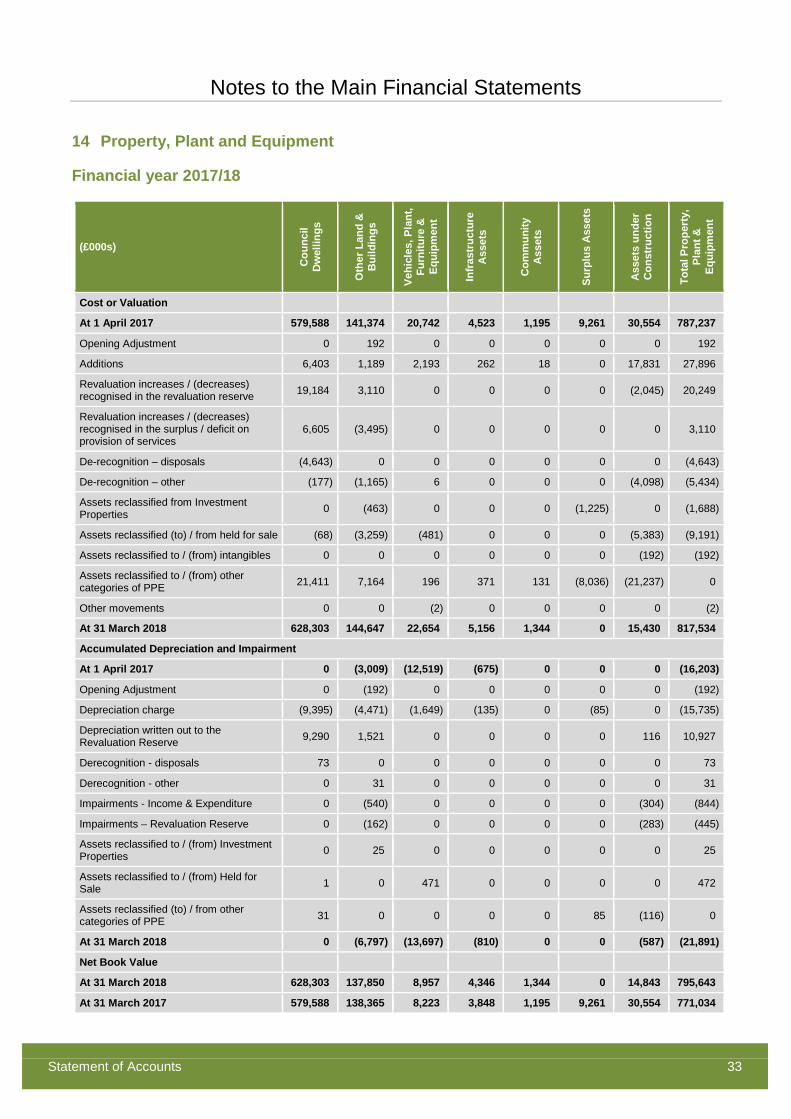
Notes to the Main Financial Statements
Statement of Accounts 33
14 Property, Plant and Equipment
Financial year 2017/18
(£000s)
Cou
ncil
Dw
ellin
gs
Oth
er L
and
&
Bui
ldin
gs
Vehi
cles
, Pla
nt,
Furn
iture
&
Equi
pmen
t
Infr
astr
uctu
re
Ass
ets
Com
mun
ity
Ass
ets
Surp
lus
Ass
ets
Ass
ets
unde
r C
onst
ruct
ion
Tota
l Pro
pert
y,
Plan
t &
Equi
pmen
t
Cost or Valuation
At 1 April 2017 579,588 141,374 20,742 4,523 1,195 9,261 30,554 787,237
Opening Adjustment 0 192 0 0 0 0 0 192
Additions 6,403 1,189 2,193 262 18 0 17,831 27,896
Revaluation increases / (decreases) recognised in the revaluation reserve 19,184 3,110 0 0 0 0 (2,045) 20,249
Revaluation increases / (decreases) recognised in the surplus / deficit on provision of services
6,605 (3,495) 0 0 0 0 0 3,110
De-recognition – disposals (4,643) 0 0 0 0 0 0 (4,643)
De-recognition – other (177) (1,165) 6 0 0 0 (4,098) (5,434)
Assets reclassified from Investment Properties 0 (463) 0 0 0 (1,225) 0 (1,688)
Assets reclassified (to) / from held for sale (68) (3,259) (481) 0 0 0 (5,383) (9,191)
Assets reclassified to / (from) intangibles 0 0 0 0 0 0 (192) (192)
Assets reclassified to / (from) other categories of PPE 21,411 7,164 196 371 131 (8,036) (21,237) 0
Other movements 0 0 (2) 0 0 0 0 (2)
At 31 March 2018 628,303 144,647 22,654 5,156 1,344 0 15,430 817,534
Accumulated Depreciation and Impairment
At 1 April 2017 0 (3,009) (12,519) (675) 0 0 0 (16,203)
Opening Adjustment 0 (192) 0 0 0 0 0 (192)
Depreciation charge (9,395) (4,471) (1,649) (135) 0 (85) 0 (15,735)
Depreciation written out to the Revaluation Reserve 9,290 1,521 0 0 0 0 116 10,927
Derecognition - disposals 73 0 0 0 0 0 0 73
Derecognition - other 0 31 0 0 0 0 0 31
Impairments - Income & Expenditure 0 (540) 0 0 0 0 (304) (844)
Impairments – Revaluation Reserve 0 (162) 0 0 0 0 (283) (445)
Assets reclassified to / (from) Investment Properties 0 25 0 0 0 0 0 25
Assets reclassified to / (from) Held for Sale 1 0 471 0 0 0 0 472
Assets reclassified (to) / from other categories of PPE 31 0 0 0 0 85 (116) 0
At 31 March 2018 0 (6,797) (13,697) (810) 0 0 (587) (21,891)
Net Book Value
At 31 March 2018 628,303 137,850 8,957 4,346 1,344 0 14,843 795,643
At 31 March 2017 579,588 138,365 8,223 3,848 1,195 9,261 30,554 771,034

Notes to the Main Financial Statements
Statement of Accounts 34
Financial year 2016/17
(£000s)
Cou
ncil
Dw
ellin
gs
Oth
er L
and
&
Bui
ldin
gs
Vehi
cles
, Pla
nt,
Furn
iture
&
Equi
pmen
t
Infr
astr
uctu
re
Ass
ets
Com
mun
ity
Ass
ets
Surp
lus
Ass
ets
Ass
ets
unde
r C
onst
ruct
ion
Tota
l Pro
pert
y,
Plan
t &
Equi
pmen
t
Cost or Valuation
At 1 April 2016 586,941 138,449 19,726 4,262 1,173 3,682 31,853 786,086
Additions 7,533 96 1,154 232 22 1,188 19,053 29,278
Revaluation increases/(decreases) recognised in the revaluation reserve
(12,253) 3,460 0 0 0 3,003 (125) (5,915)
Revaluation increases/(decreases) recognised in the surplus / deficit on provision of services
(8,681) 1,376 0 0 0 (321) 0 (7,626)
DE recognition – disposals (5,076) (2,285) 0 0 0 0 0 (7,361)
DE recognition – other (333) (82) 0 0 0 0 0 (415)
Assets reclassified from Investment Properties 0 245 0 0 0 0 0 245
Assets reclassified (to) / from held for sale (285) 0 (415) 0 0 0 (6,355) (7,055)
Assets reclassified to / (from) other categories of property, plant and equipment
11,742 115 277 29 0 1,709 (13,872) 0
At 31 March 2017 579,588 141,374 20,742 4,523 1,195 9,261 30,554 787,237
Accumulated Depreciation and Impairment
At 1 April 2016 0 (1,679) (11,044) (558) 0 0 0 (13,281)
Depreciation charge (9,058) (4,308) (1,857) (117) 0 0 0 (15,340)
Depreciation written out to the Revaluation Reserve 8,949 2,573 0 0 0 26 0 11,548
Derecognition – disposals 76 402 0 0 0 0 0 478
Derecognition – other 3 3 0 0 0 0 0 6
Impairments 0 0 0 0 0 0 0 0
Assets reclassified to / (from) Held for Sale 4 0 382 0 0 0 0 386
Assets reclassified (to) / from other categories of property, plant and equipment
26 0 0 0 0 (26) 0 0
Other movements 0 0 0 0 0 0 0 0
At 31 March 2017 0 (3,009) (12,519) (675) 0 0 0 (16,203)
Net Book Value
At 31 March 2017 579,588 138,365 8,223 3,848 1,195 9,261 30,554 771,034
At 31 March 2016 586,941 136,770 8,682 3,704 1,173 3,682 31,853 772,805
Notes to the Main Financial Statements
Statement of Accounts 35
15 Property - Revaluations
The Council carries out a rolling programme that ensures that Property, Plant and Equipment to be revalued are done so at least every five years. Current year revaluations have been performed in accordance with the RICS Valuation – Professional Standards Global January 2017 including the International Valuation Standards and the RICS valuation – Professional Standards UK (January 2014, as amended) and the Code of Practice on Local Authority Accounting in the United Kingdom 2017/18. The valuations were conducted by external valuers apart from two investment properties which were valued by internal valuers. The RICS registered valuers were: G Harbord MA MRICS IRRV (Hons) (Wilks Head and Eve) M Aldis BSc (Hons) MRICS IRRV (Hons) (Wilks Head and Eve) P Smith BSc (Hons) MRICS IRRV (Hons) (Wilks Head and Eve) Amanda Briggs BA (Hons) MRICS (Bidwells LLP) Anna Groom MA MRICS (Bidwells LLP) Bella Darby MRICS (Bidwells LLP) Stuart Paskins BSc MRICS (Bidwells LLP) Philip Taylor BSc MRICS (Cambridge City Council) Philip Doggett BSc (Hons) MRICS (Cambridge City Council) Investment property is valued on a fair value basis and operational property is valued at current value derived on the basis of existing use value except for specialised operational assets which are assessed on the basis of depreciated replacement cost. The opinion of value was primarily derived using comparable recent market transactions on arm’s length terms. Further detail on the basis for valuation is set out in the statement of accounting policies on page 115. The following statement should be noted with regard to the valuations carried out by Bidwells LLP: In reaching the final valuation figures Bidwells has departed from the RICS Valuation – Professional Standards in that they have not been instructed to inspect the properties or read all the leases. For all the properties they undertook external inspections only and have relied on information provided by Cambridge City Council; the accuracy of the valuation depends on the accuracy of the information provided. In accordance with the Valuation Standards, Bidwells confirms that it last valued the properties in 2017 and has acted as valuer for Cambridge City Council since March 1994. They also confirm that in their last financial year the fees received from Cambridge City Council represented less than 5% of their turnover and they do not expect any material increase in these fees in 2018. Bidwells has a policy of rotating personnel undertaking this valuation so that no single valuer values the portfolio for more than seven consecutive years. This rotation is undertaken in accordance with Bidwells Management System under ISO 9001:2000 The Council has chosen to depart from the Professional Standards on the grounds of achieving best value for money in relation to property valuation work.
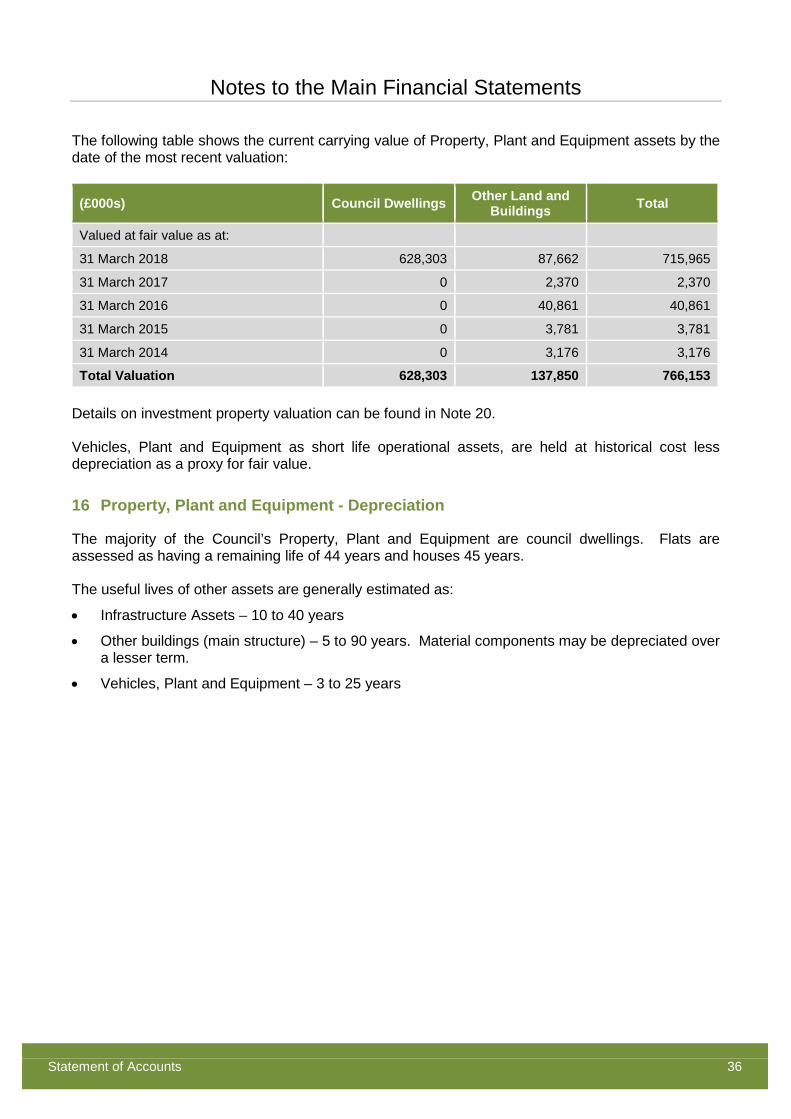
Notes to the Main Financial Statements
Statement of Accounts 36
The following table shows the current carrying value of Property, Plant and Equipment assets by the date of the most recent valuation:
(£000s) Council Dwellings Other Land and Buildings Total
Valued at fair value as at:
31 March 2018 628,303 87,662 715,965
31 March 2017 0 2,370 2,370
31 March 2016 0 40,861 40,861
31 March 2015 0 3,781 3,781
31 March 2014 0 3,176 3,176
Total Valuation 628,303 137,850 766,153 Details on investment property valuation can be found in Note 20. Vehicles, Plant and Equipment as short life operational assets, are held at historical cost less depreciation as a proxy for fair value.
16 Property, Plant and Equipment - Depreciation
The majority of the Council’s Property, Plant and Equipment are council dwellings. Flats are assessed as having a remaining life of 44 years and houses 45 years. The useful lives of other assets are generally estimated as:
• Infrastructure Assets – 10 to 40 years
• Other buildings (main structure) – 5 to 90 years. Material components may be depreciated over a lesser term.
• Vehicles, Plant and Equipment – 3 to 25 years
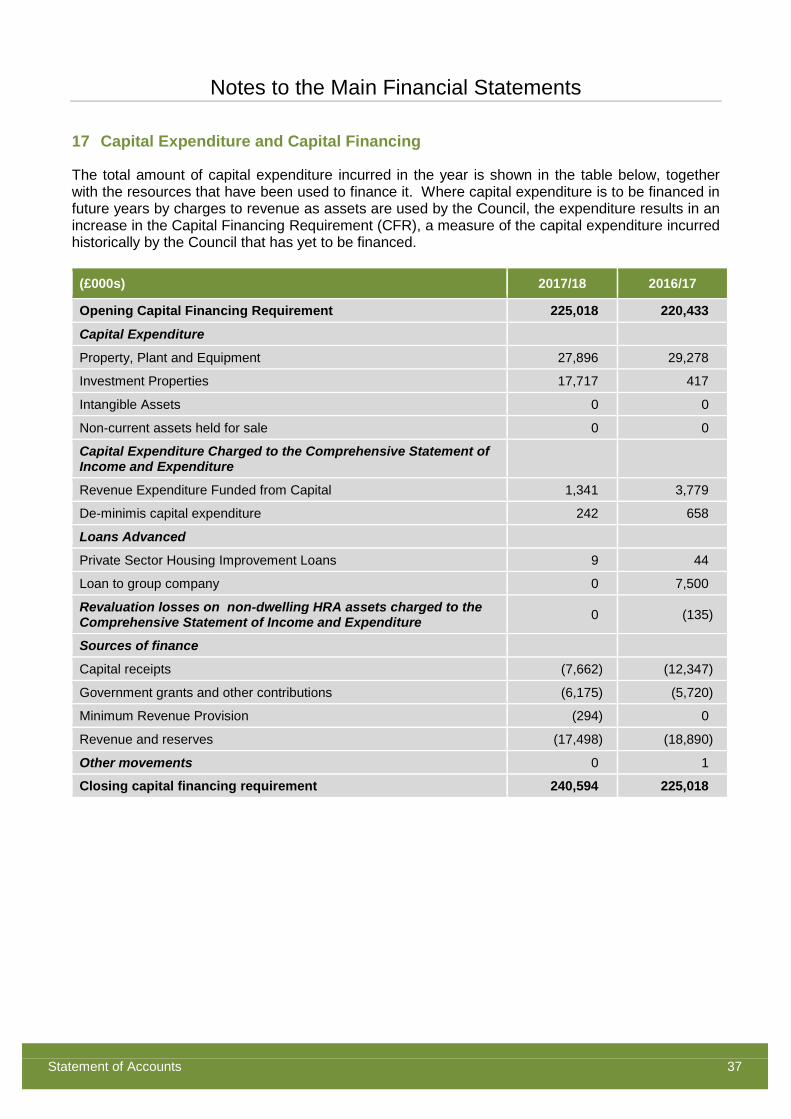
Notes to the Main Financial Statements
Statement of Accounts 37
17 Capital Expenditure and Capital Financing
The total amount of capital expenditure incurred in the year is shown in the table below, together with the resources that have been used to finance it. Where capital expenditure is to be financed in future years by charges to revenue as assets are used by the Council, the expenditure results in an increase in the Capital Financing Requirement (CFR), a measure of the capital expenditure incurred historically by the Council that has yet to be financed.
(£000s) 2017/18 2016/17
Opening Capital Financing Requirement 225,018 220,433
Capital Expenditure
Property, Plant and Equipment 27,896 29,278
Investment Properties 17,717 417
Intangible Assets 0 0
Non-current assets held for sale 0 0
Capital Expenditure Charged to the Comprehensive Statement of Income and Expenditure
Revenue Expenditure Funded from Capital 1,341 3,779
De-minimis capital expenditure 242 658
Loans Advanced
Private Sector Housing Improvement Loans 9 44
Loan to group company 0 7,500
Revaluation losses on non-dwelling HRA assets charged to the Comprehensive Statement of Income and Expenditure 0 (135)
Sources of finance
Capital receipts (7,662) (12,347)
Government grants and other contributions (6,175) (5,720)
Minimum Revenue Provision (294) 0
Revenue and reserves (17,498) (18,890)
Other movements 0 1
Closing capital financing requirement 240,594 225,018
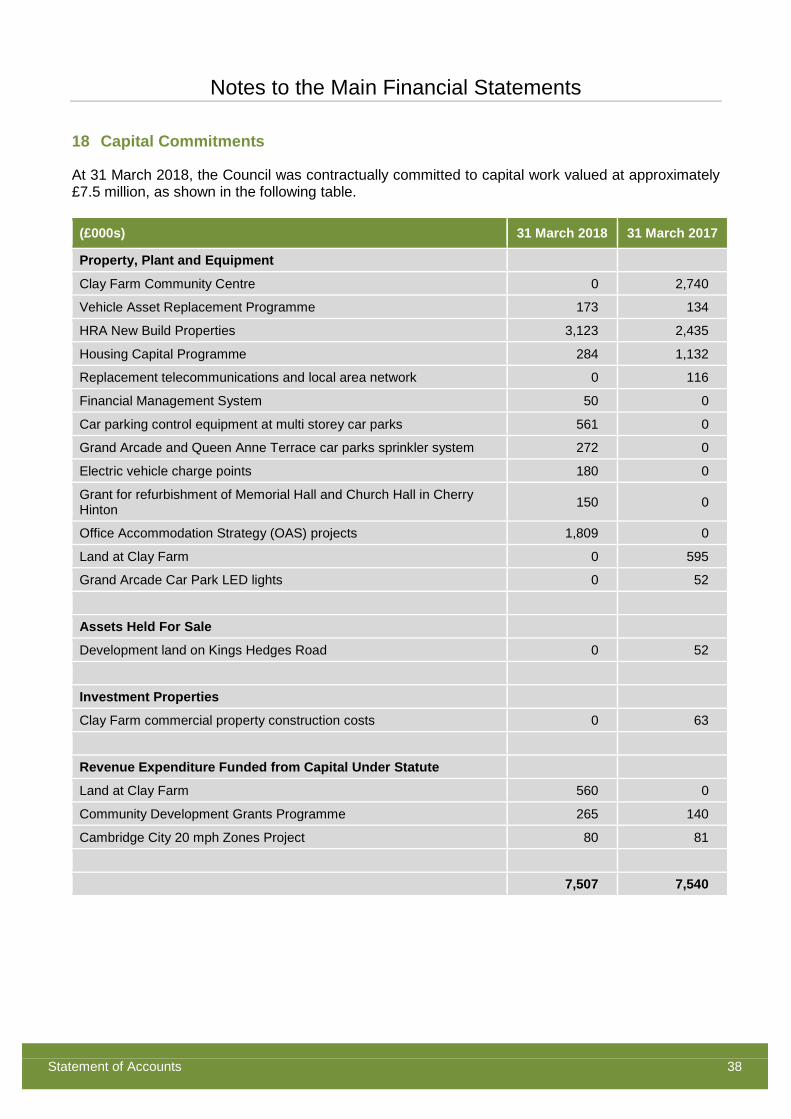
Notes to the Main Financial Statements
Statement of Accounts 38
18 Capital Commitments
At 31 March 2018, the Council was contractually committed to capital work valued at approximately £7.5 million, as shown in the following table.
(£000s) 31 March 2018 31 March 2017
Property, Plant and Equipment
Clay Farm Community Centre 0 2,740
Vehicle Asset Replacement Programme 173 134
HRA New Build Properties 3,123 2,435
Housing Capital Programme 284 1,132
Replacement telecommunications and local area network 0 116
Financial Management System 50 0
Car parking control equipment at multi storey car parks 561 0
Grand Arcade and Queen Anne Terrace car parks sprinkler system 272 0
Electric vehicle charge points 180 0
Grant for refurbishment of Memorial Hall and Church Hall in Cherry Hinton 150 0
Office Accommodation Strategy (OAS) projects 1,809 0
Land at Clay Farm 0 595
Grand Arcade Car Park LED lights 0 52
Assets Held For Sale
Development land on Kings Hedges Road 0 52
Investment Properties
Clay Farm commercial property construction costs 0 63
Revenue Expenditure Funded from Capital Under Statute
Land at Clay Farm 560 0
Community Development Grants Programme 265 140
Cambridge City 20 mph Zones Project 80 81
7,507 7,540
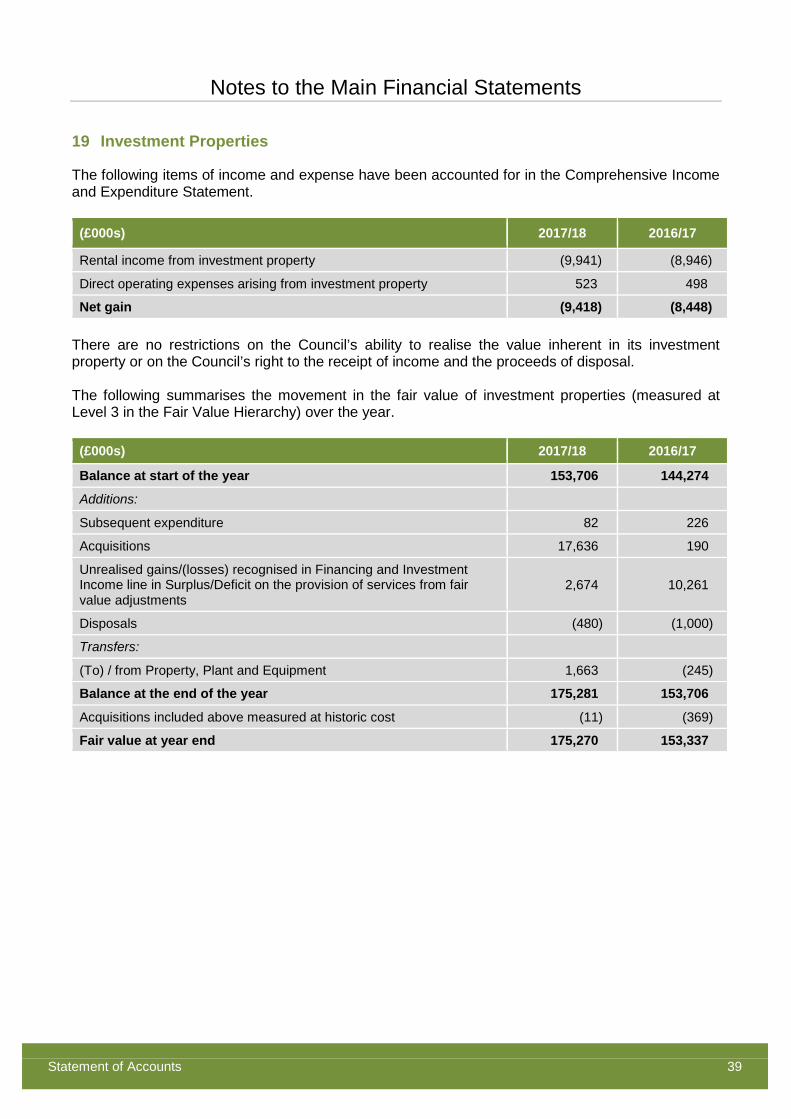
Notes to the Main Financial Statements
Statement of Accounts 39
19 Investment Properties
The following items of income and expense have been accounted for in the Comprehensive Income and Expenditure Statement.
(£000s) 2017/18 2016/17
Rental income from investment property (9,941) (8,946)
Direct operating expenses arising from investment property 523 498
Net gain (9,418) (8,448) There are no restrictions on the Council’s ability to realise the value inherent in its investment property or on the Council’s right to the receipt of income and the proceeds of disposal. The following summarises the movement in the fair value of investment properties (measured at Level 3 in the Fair Value Hierarchy) over the year.
(£000s) 2017/18 2016/17
Balance at start of the year 153,706 144,274
Additions:
Subsequent expenditure 82 226
Acquisitions 17,636 190
Unrealised gains/(losses) recognised in Financing and Investment Income line in Surplus/Deficit on the provision of services from fair value adjustments
2,674 10,261
Disposals (480) (1,000)
Transfers:
(To) / from Property, Plant and Equipment 1,663 (245)
Balance at the end of the year 175,281 153,706
Acquisitions included above measured at historic cost (11) (369)
Fair value at year end 175,270 153,337
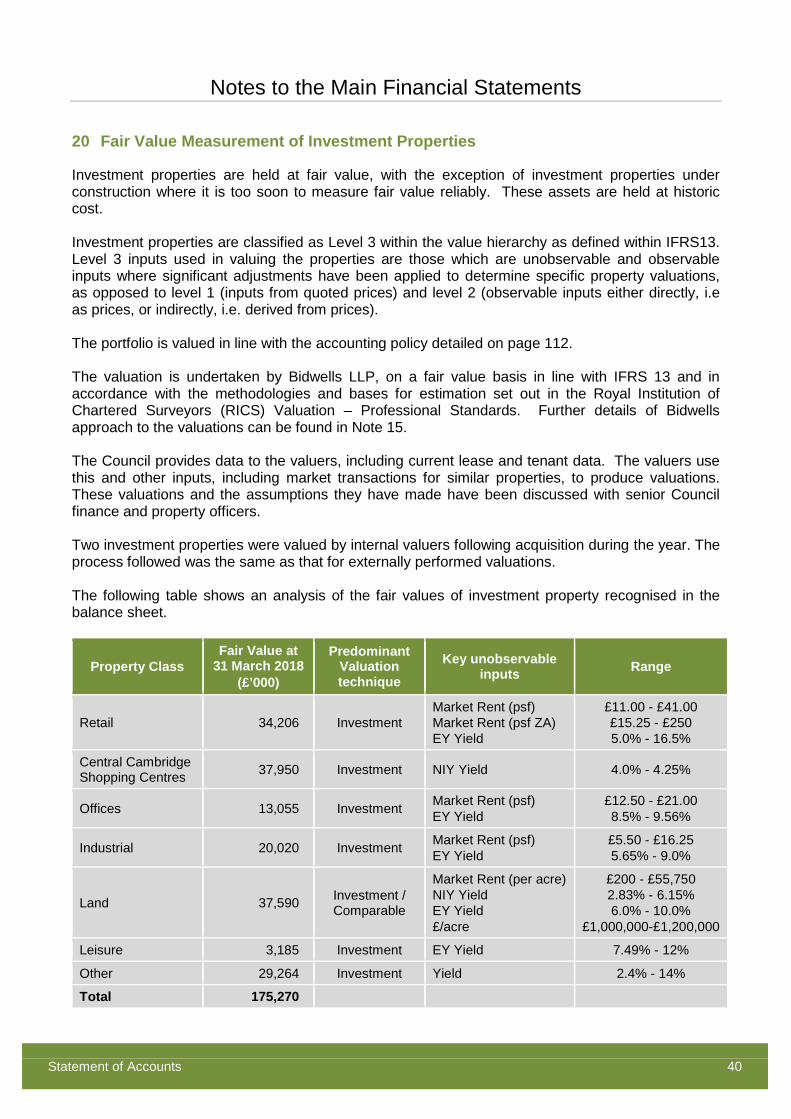
Notes to the Main Financial Statements
Statement of Accounts 40
20 Fair Value Measurement of Investment Properties
Investment properties are held at fair value, with the exception of investment properties under construction where it is too soon to measure fair value reliably. These assets are held at historic cost. Investment properties are classified as Level 3 within the value hierarchy as defined within IFRS13. Level 3 inputs used in valuing the properties are those which are unobservable and observable inputs where significant adjustments have been applied to determine specific property valuations, as opposed to level 1 (inputs from quoted prices) and level 2 (observable inputs either directly, i.e as prices, or indirectly, i.e. derived from prices). The portfolio is valued in line with the accounting policy detailed on page 112. The valuation is undertaken by Bidwells LLP, on a fair value basis in line with IFRS 13 and in accordance with the methodologies and bases for estimation set out in the Royal Institution of Chartered Surveyors (RICS) Valuation – Professional Standards. Further details of Bidwells approach to the valuations can be found in Note 15. The Council provides data to the valuers, including current lease and tenant data. The valuers use this and other inputs, including market transactions for similar properties, to produce valuations. These valuations and the assumptions they have made have been discussed with senior Council finance and property officers. Two investment properties were valued by internal valuers following acquisition during the year. The process followed was the same as that for externally performed valuations. The following table shows an analysis of the fair values of investment property recognised in the balance sheet.
Property Class Fair Value at
31 March 2018 (£’000)
Predominant Valuation technique
Key unobservable inputs Range
Retail 34,206 Investment Market Rent (psf) Market Rent (psf ZA) EY Yield
£11.00 - £41.00 £15.25 - £250 5.0% - 16.5%
Central Cambridge Shopping Centres 37,950 Investment NIY Yield 4.0% - 4.25%
Offices 13,055 Investment Market Rent (psf) EY Yield
£12.50 - £21.00 8.5% - 9.56%
Industrial 20,020 Investment Market Rent (psf) EY Yield
£5.50 - £16.25 5.65% - 9.0%
Land 37,590 Investment / Comparable
Market Rent (per acre) NIY Yield EY Yield £/acre
£200 - £55,750 2.83% - 6.15% 6.0% - 10.0%
£1,000,000-£1,200,000
Leisure 3,185 Investment EY Yield 7.49% - 12%
Other 29,264 Investment Yield 2.4% - 14%
Total 175,270
Notes to the Main Financial Statements
Statement of Accounts 41
The predominant valuation techniques are:
♦ Investment Method
This involves estimating the rental value of each lettable part of the property, making an assessment of void periods and associated costs and then capitalising at an appropriate yield. Hope value is included where there is future reversionary potential such as conversion to residential use.
♦ Comparable Method
The opinion of value was primarily derived using comparable recent market transactions on an arm’s length basis with appropriate adjustments. Sensitivity Analysis The significant unobservable inputs used in the fair value measurement categorised within level 3 of the fair value hierarchy on investment property are:
• Market Rent – this is estimated for each lettable unit by comparison with recent lettings from within the property itself or nearby making appropriate adjustments for size, specification, location and incentives.
• Voids – an estimate of the likely period required to relet vacant property and the likelihood of lease renewal.
• Yield – opinion on the appropriate capitalisation rate to be applied by reference to transactions for comparable properties.
Significant increases/(decreases) in the rental value would result in a higher/(lower) fair value measurement. Significant increases/(decreases) in the long term vacancy rate or yield would result in a lower/(higher) fair value measurement. The current use of investment properties is highest and best use, with the exception of property in the Cambridge Northern Fringe East development area which is let out on a short term basis (with the Council able to exercise break clauses) pending redevelopment.
21 Leases
Council as Lessee
♦ Finance Leases
The carrying value of investment properties held under finance leases was £2,485,000 at 31 March 2018 (£2,430,000 at 31 March 2017). Secondary lease payments of £2,247 are due until 2035. These relate to industrial units held under finance leases which are then leased out under operating leases and the total future minimum lease payments are £156,718 at 31 March 2018 (£54,283 at 31 March 2017).
Notes to the Main Financial Statements
Statement of Accounts 42
The Council leases in three car parks under long-term peppercorn leases. The carrying value of these car parks included in Property, Plant and Equipment was £37,400,000 at 31 March 2017 (£38,100,000 at 31 March 2017).
♦ Operating Leases
The Council leases in a number of operational properties and some equipment under operating leases. The future minimum lease payments due under non-cancellable leases in future years are:
(£000s) 31 March 2018 31 March 2017
Not later than one year 75 205
Later than one year and not later than five years 100 279
Later than five years 0 0
175 484 The expenditure charged to the Comprehensive Income and Expenditure Statement during the year in relation to these leases was:
(£000s) 2017/18 2016/17
Minimum lease payments 254 324 Council as Lessor
♦ Operating Leases
The Council leases out commercial properties across the City under operating leases. The portfolio includes shops, industrial units and shopping centres. The future minimum lease payments receivable, under leases which cannot be cancelled, are:
(£000s) 31 March 2018 31 March 2017
Not later than one year 5,832 3,889
Later than one year and not later than five years 18,529 11,739
Later than five years 105,553 97,436
129,914 113,064 The minimum lease payments receivable do not include contingent rents such as those based on turnover. In 2017/18, £2,265,320 of contingent rents were receivable by the Council (2016/17 - £2,254,764).
Notes to the Main Financial Statements
Statement of Accounts 43
22 Short-Term and Long-Term Investments
(£000s) 2017/18 2016/17
Long Term Short Term Long Term Short Term
Investments in Icelandic banks and their UK subsidiaries 0 41 0 41
Loan to Group company 7,500 0 7,500 0
Other investments 25,275 73,135 24,585 71,117
32,775 73,176 32,085 71,158 Investments in Icelandic Banks and their UK Subsidiaries In October 2008, a number of Icelandic Banks and their UK subsidiaries went into administration. The Council had £4 million deposited with Heritable Bank Plc. The Council has received 98% of its claim to date. The administrators have not given any firm indications as to the likely timing and scale of further dividends, but given the information available to it, the Council has assumed an overall recovery of 99%.
(£000s) 2017/18 2016/17
Heritable Bank Plc Heritable Bank Plc
Balance sheet carrying value
Short term investments 41 41
Increase / (decrease) in impairment recognised in the Comprehensive Income and Expenditure account 0 0
Cash received 0 0
23 Long-Term Debtors
Long-term debtors which fall due after a period of at least one year:
(£000s) 31 March 2018 31 March 2017 Mortgages 1 1
Grand Arcade reverse lease premium 188 194
Private sector housing improvement loans 794 832
Sale of land at Kings Hedges 30 30
Deferred property sale proceeds 2,705 2,705
Cambridge Live 0 125
Visit Cambridge and Beyond 90 90
Loan to Cambridge Investment Partnership LLP - deferred sale proceeds 4,667 0
Pension Deficit Contribution Prepayment 3,030 0
Mortgage Repossessions Loans 7 7
11,512 3,984
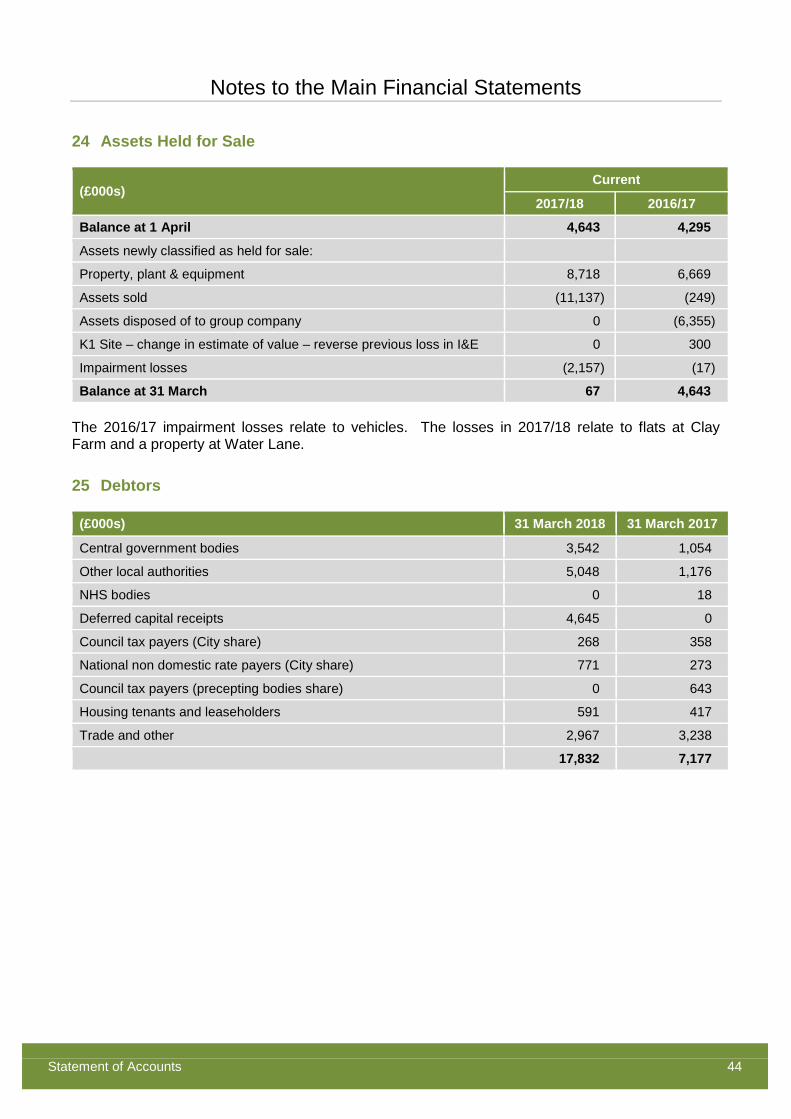
Notes to the Main Financial Statements
Statement of Accounts 44
24 Assets Held for Sale
(£000s) Current
2017/18 2016/17
Balance at 1 April 4,643 4,295
Assets newly classified as held for sale:
Property, plant & equipment 8,718 6,669
Assets sold (11,137) (249)
Assets disposed of to group company 0 (6,355)
K1 Site – change in estimate of value – reverse previous loss in I&E 0 300
Impairment losses (2,157) (17)
Balance at 31 March 67 4,643 The 2016/17 impairment losses relate to vehicles. The losses in 2017/18 relate to flats at Clay Farm and a property at Water Lane.
25 Debtors
(£000s) 31 March 2018 31 March 2017
Central government bodies 3,542 1,054
Other local authorities 5,048 1,176
NHS bodies 0 18
Deferred capital receipts 4,645 0
Council tax payers (City share) 268 358
National non domestic rate payers (City share) 771 273
Council tax payers (precepting bodies share) 0 643
Housing tenants and leaseholders 591 417
Trade and other 2,967 3,238
17,832 7,177
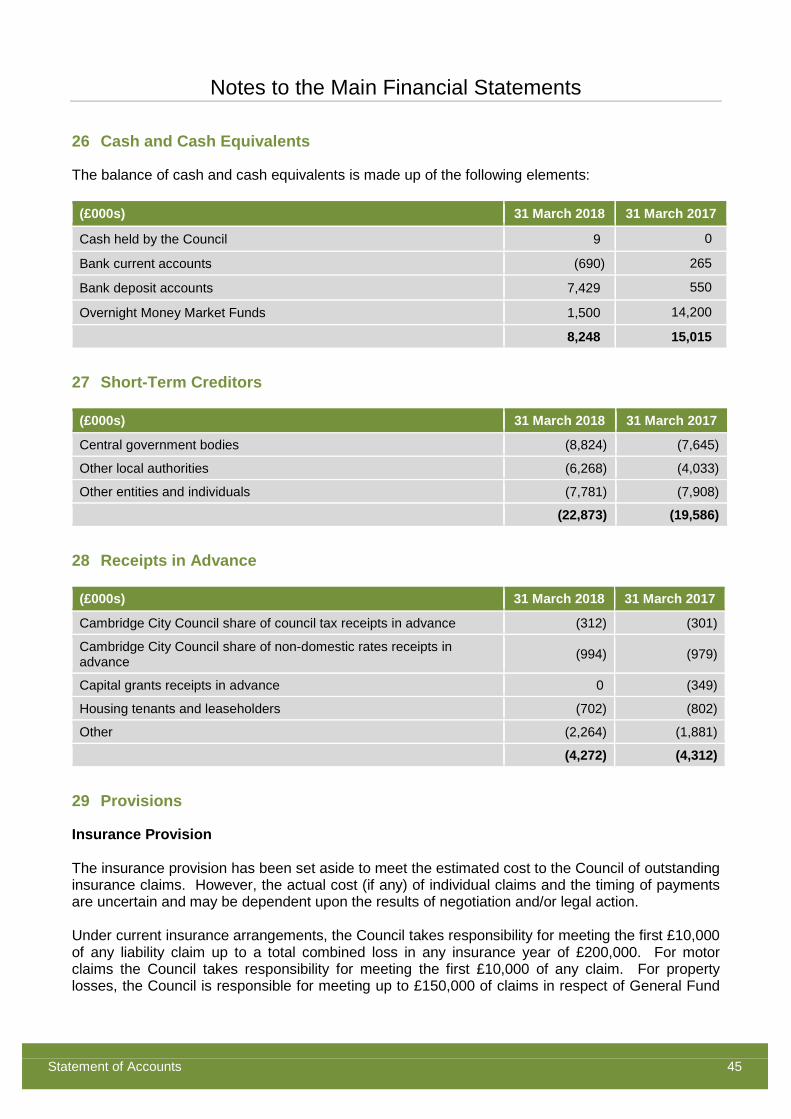
Notes to the Main Financial Statements
Statement of Accounts 45
26 Cash and Cash Equivalents
The balance of cash and cash equivalents is made up of the following elements:
(£000s) 31 March 2018 31 March 2017
Cash held by the Council 9 0
Bank current accounts (690) 265
Bank deposit accounts 7,429 550
Overnight Money Market Funds 1,500 14,200
8,248 15,015
27 Short-Term Creditors
(£000s) 31 March 2018 31 March 2017
Central government bodies (8,824) (7,645)
Other local authorities (6,268) (4,033)
Other entities and individuals (7,781) (7,908)
(22,873) (19,586)
28 Receipts in Advance
(£000s) 31 March 2018 31 March 2017
Cambridge City Council share of council tax receipts in advance (312) (301)
Cambridge City Council share of non-domestic rates receipts in advance (994) (979)
Capital grants receipts in advance 0 (349)
Housing tenants and leaseholders (702) (802)
Other (2,264) (1,881)
(4,272) (4,312)
29 Provisions
Insurance Provision The insurance provision has been set aside to meet the estimated cost to the Council of outstanding insurance claims. However, the actual cost (if any) of individual claims and the timing of payments are uncertain and may be dependent upon the results of negotiation and/or legal action. Under current insurance arrangements, the Council takes responsibility for meeting the first £10,000 of any liability claim up to a total combined loss in any insurance year of £200,000. For motor claims the Council takes responsibility for meeting the first £10,000 of any claim. For property losses, the Council is responsible for meeting up to £150,000 of claims in respect of General Fund
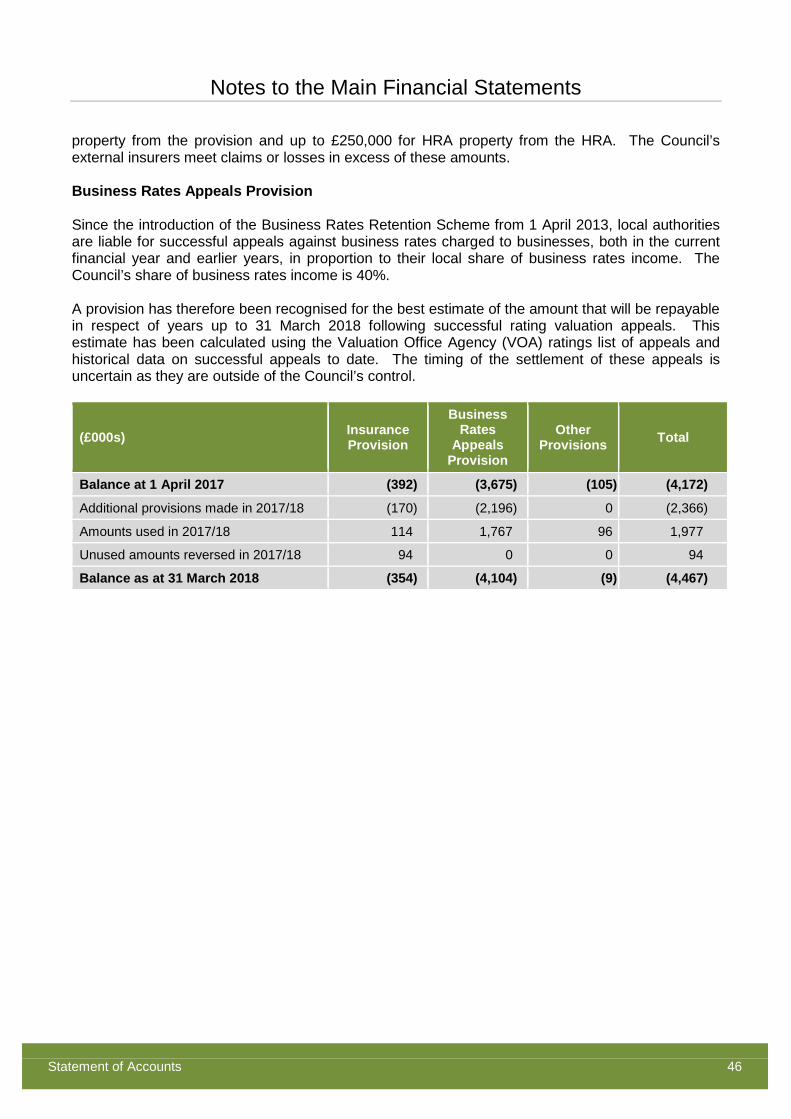
Notes to the Main Financial Statements
Statement of Accounts 46
property from the provision and up to £250,000 for HRA property from the HRA. The Council’s external insurers meet claims or losses in excess of these amounts. Business Rates Appeals Provision Since the introduction of the Business Rates Retention Scheme from 1 April 2013, local authorities are liable for successful appeals against business rates charged to businesses, both in the current financial year and earlier years, in proportion to their local share of business rates income. The Council’s share of business rates income is 40%. A provision has therefore been recognised for the best estimate of the amount that will be repayable in respect of years up to 31 March 2018 following successful rating valuation appeals. This estimate has been calculated using the Valuation Office Agency (VOA) ratings list of appeals and historical data on successful appeals to date. The timing of the settlement of these appeals is uncertain as they are outside of the Council’s control.
(£000s) Insurance Provision
Business Rates
Appeals Provision
Other Provisions Total
Balance at 1 April 2017 (392) (3,675) (105) (4,172)
Additional provisions made in 2017/18 (170) (2,196) 0 (2,366)
Amounts used in 2017/18 114 1,767 96 1,977
Unused amounts reversed in 2017/18 94 0 0 94
Balance as at 31 March 2018 (354) (4,104) (9) (4,467)
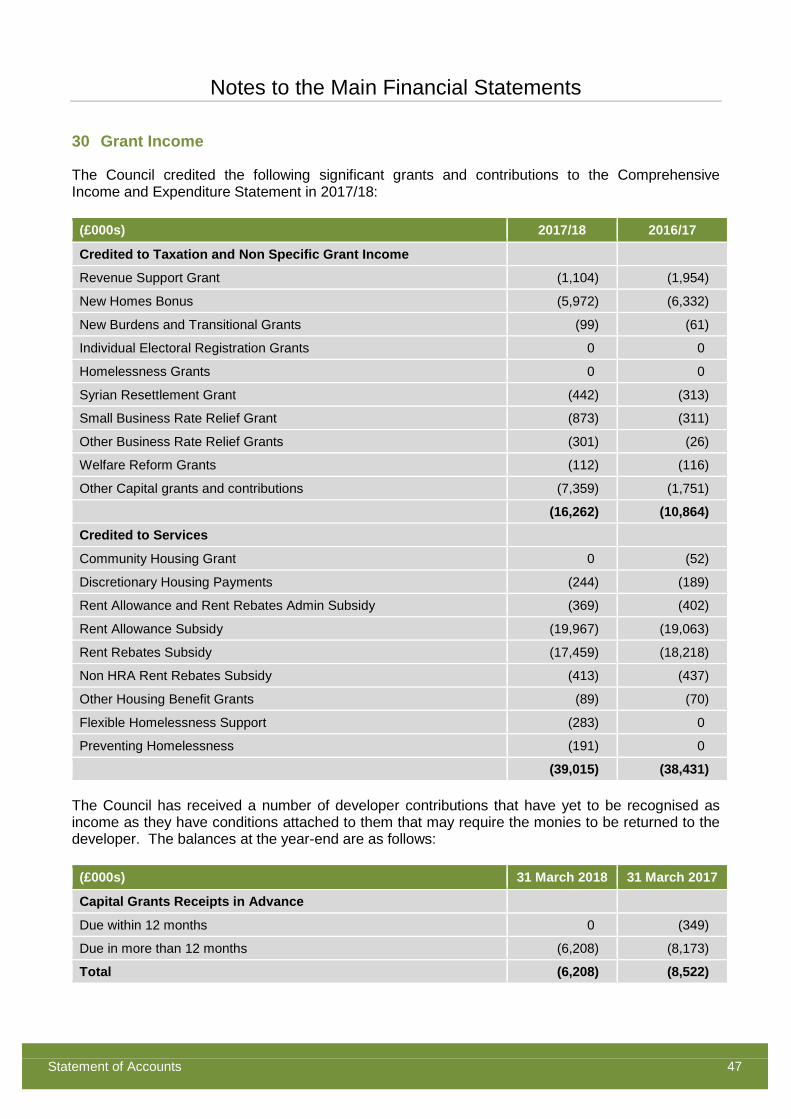
Notes to the Main Financial Statements
Statement of Accounts 47
30 Grant Income
The Council credited the following significant grants and contributions to the Comprehensive Income and Expenditure Statement in 2017/18:
(£000s) 2017/18 2016/17
Credited to Taxation and Non Specific Grant Income
Revenue Support Grant (1,104) (1,954)
New Homes Bonus (5,972) (6,332)
New Burdens and Transitional Grants (99) (61)
Individual Electoral Registration Grants 0 0
Homelessness Grants 0 0
Syrian Resettlement Grant (442) (313)
Small Business Rate Relief Grant (873) (311)
Other Business Rate Relief Grants (301) (26)
Welfare Reform Grants (112) (116)
Other Capital grants and contributions (7,359) (1,751)
(16,262) (10,864)
Credited to Services
Community Housing Grant 0 (52)
Discretionary Housing Payments (244) (189)
Rent Allowance and Rent Rebates Admin Subsidy (369) (402)
Rent Allowance Subsidy (19,967) (19,063)
Rent Rebates Subsidy (17,459) (18,218)
Non HRA Rent Rebates Subsidy (413) (437)
Other Housing Benefit Grants (89) (70)
Flexible Homelessness Support (283) 0
Preventing Homelessness (191) 0
(39,015) (38,431) The Council has received a number of developer contributions that have yet to be recognised as income as they have conditions attached to them that may require the monies to be returned to the developer. The balances at the year-end are as follows:
(£000s) 31 March 2018 31 March 2017
Capital Grants Receipts in Advance
Due within 12 months 0 (349)
Due in more than 12 months (6,208) (8,173)
Total (6,208) (8,522)
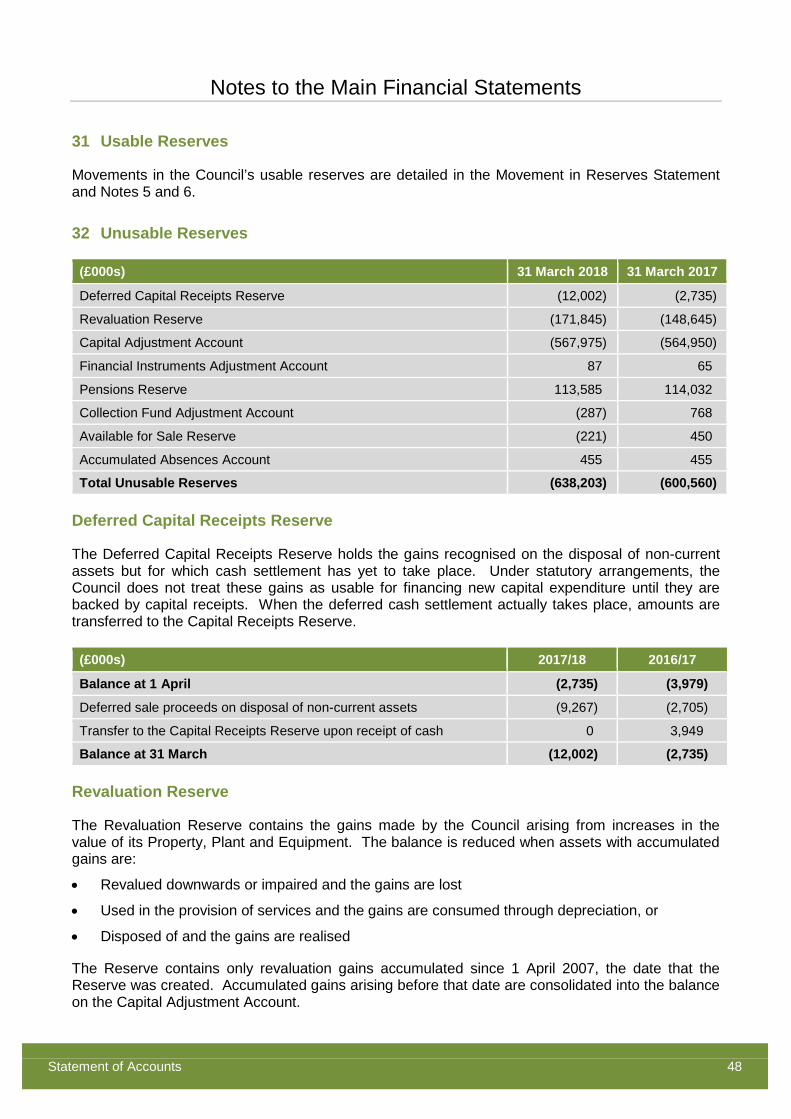
Notes to the Main Financial Statements
Statement of Accounts 48
31 Usable Reserves
Movements in the Council’s usable reserves are detailed in the Movement in Reserves Statement and Notes 5 and 6.
32 Unusable Reserves
(£000s) 31 March 2018 31 March 2017
Deferred Capital Receipts Reserve (12,002) (2,735)
Revaluation Reserve (171,845) (148,645)
Capital Adjustment Account (567,975) (564,950)
Financial Instruments Adjustment Account 87 65
Pensions Reserve 113,585 114,032
Collection Fund Adjustment Account (287) 768
Available for Sale Reserve (221) 450
Accumulated Absences Account 455 455
Total Unusable Reserves (638,203) (600,560)
Deferred Capital Receipts Reserve
The Deferred Capital Receipts Reserve holds the gains recognised on the disposal of non-current assets but for which cash settlement has yet to take place. Under statutory arrangements, the Council does not treat these gains as usable for financing new capital expenditure until they are backed by capital receipts. When the deferred cash settlement actually takes place, amounts are transferred to the Capital Receipts Reserve.
(£000s) 2017/18 2016/17
Balance at 1 April (2,735) (3,979)
Deferred sale proceeds on disposal of non-current assets (9,267) (2,705)
Transfer to the Capital Receipts Reserve upon receipt of cash 0 3,949
Balance at 31 March (12,002) (2,735)
Revaluation Reserve
The Revaluation Reserve contains the gains made by the Council arising from increases in the value of its Property, Plant and Equipment. The balance is reduced when assets with accumulated gains are:
• Revalued downwards or impaired and the gains are lost
• Used in the provision of services and the gains are consumed through depreciation, or
• Disposed of and the gains are realised The Reserve contains only revaluation gains accumulated since 1 April 2007, the date that the Reserve was created. Accumulated gains arising before that date are consolidated into the balance on the Capital Adjustment Account.
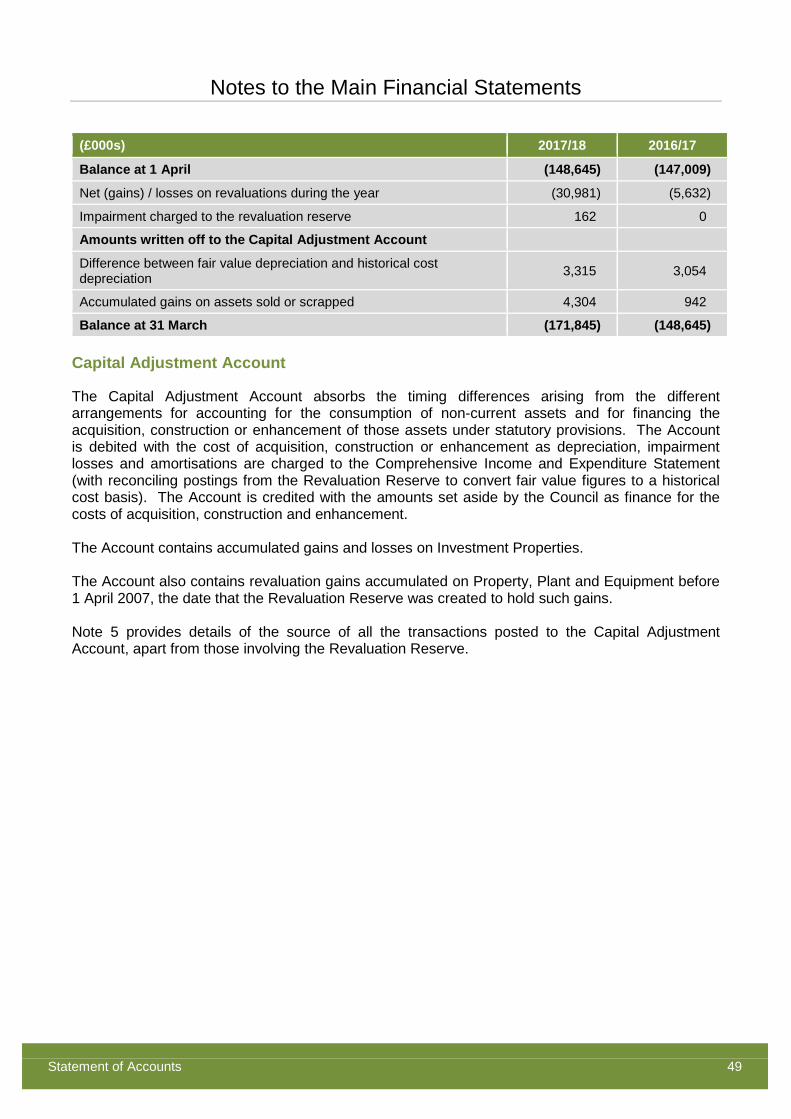
Notes to the Main Financial Statements
Statement of Accounts 49
(£000s) 2017/18 2016/17
Balance at 1 April (148,645) (147,009)
Net (gains) / losses on revaluations during the year (30,981) (5,632)
Impairment charged to the revaluation reserve 162 0
Amounts written off to the Capital Adjustment Account
Difference between fair value depreciation and historical cost depreciation 3,315 3,054
Accumulated gains on assets sold or scrapped 4,304 942
Balance at 31 March (171,845) (148,645)
Capital Adjustment Account
The Capital Adjustment Account absorbs the timing differences arising from the different arrangements for accounting for the consumption of non-current assets and for financing the acquisition, construction or enhancement of those assets under statutory provisions. The Account is debited with the cost of acquisition, construction or enhancement as depreciation, impairment losses and amortisations are charged to the Comprehensive Income and Expenditure Statement (with reconciling postings from the Revaluation Reserve to convert fair value figures to a historical cost basis). The Account is credited with the amounts set aside by the Council as finance for the costs of acquisition, construction and enhancement. The Account contains accumulated gains and losses on Investment Properties. The Account also contains revaluation gains accumulated on Property, Plant and Equipment before 1 April 2007, the date that the Revaluation Reserve was created to hold such gains. Note 5 provides details of the source of all the transactions posted to the Capital Adjustment Account, apart from those involving the Revaluation Reserve.
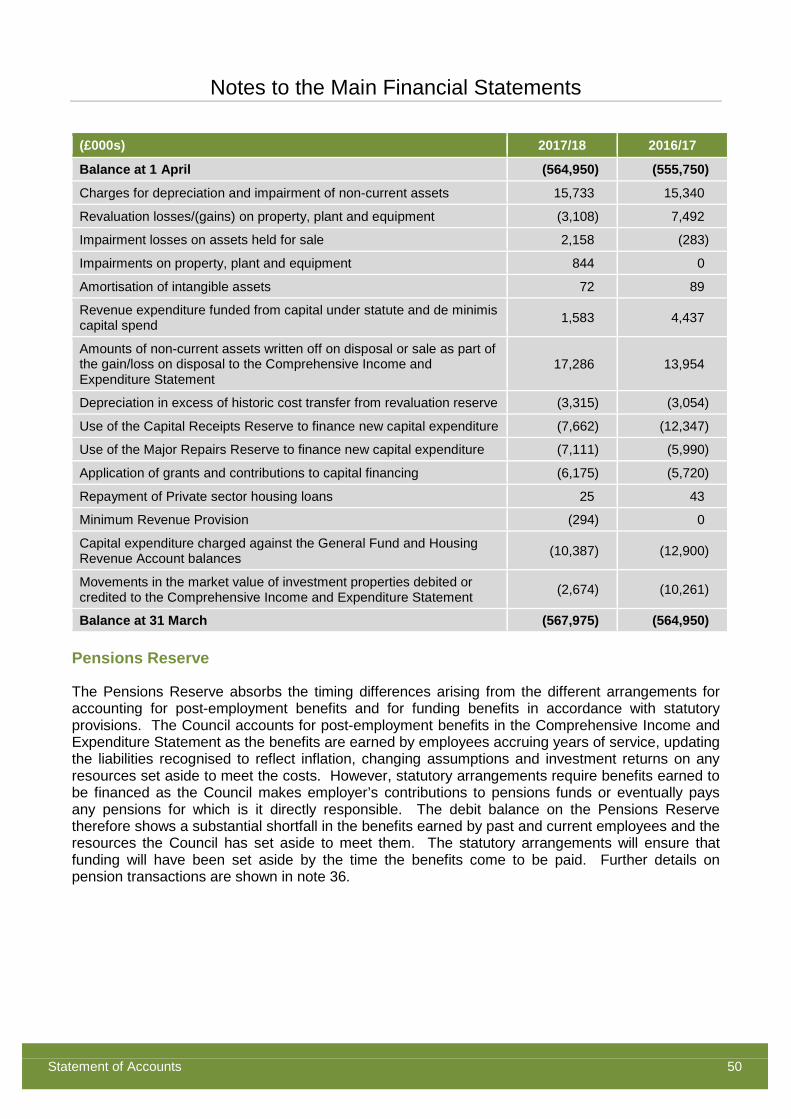
Notes to the Main Financial Statements
Statement of Accounts 50
(£000s) 2017/18 2016/17
Balance at 1 April (564,950) (555,750)
Charges for depreciation and impairment of non-current assets 15,733 15,340
Revaluation losses/(gains) on property, plant and equipment (3,108) 7,492
Impairment losses on assets held for sale 2,158 (283)
Impairments on property, plant and equipment 844 0
Amortisation of intangible assets 72 89
Revenue expenditure funded from capital under statute and de minimis capital spend 1,583 4,437
Amounts of non-current assets written off on disposal or sale as part of the gain/loss on disposal to the Comprehensive Income and Expenditure Statement
17,286 13,954
Depreciation in excess of historic cost transfer from revaluation reserve (3,315) (3,054)
Use of the Capital Receipts Reserve to finance new capital expenditure (7,662) (12,347)
Use of the Major Repairs Reserve to finance new capital expenditure (7,111) (5,990)
Application of grants and contributions to capital financing (6,175) (5,720)
Repayment of Private sector housing loans 25 43
Minimum Revenue Provision (294) 0
Capital expenditure charged against the General Fund and Housing Revenue Account balances (10,387) (12,900)
Movements in the market value of investment properties debited or credited to the Comprehensive Income and Expenditure Statement (2,674) (10,261)
Balance at 31 March (567,975) (564,950)
Pensions Reserve
The Pensions Reserve absorbs the timing differences arising from the different arrangements for accounting for post-employment benefits and for funding benefits in accordance with statutory provisions. The Council accounts for post-employment benefits in the Comprehensive Income and Expenditure Statement as the benefits are earned by employees accruing years of service, updating the liabilities recognised to reflect inflation, changing assumptions and investment returns on any resources set aside to meet the costs. However, statutory arrangements require benefits earned to be financed as the Council makes employer’s contributions to pensions funds or eventually pays any pensions for which is it directly responsible. The debit balance on the Pensions Reserve therefore shows a substantial shortfall in the benefits earned by past and current employees and the resources the Council has set aside to meet them. The statutory arrangements will ensure that funding will have been set aside by the time the benefits come to be paid. Further details on pension transactions are shown in note 36.
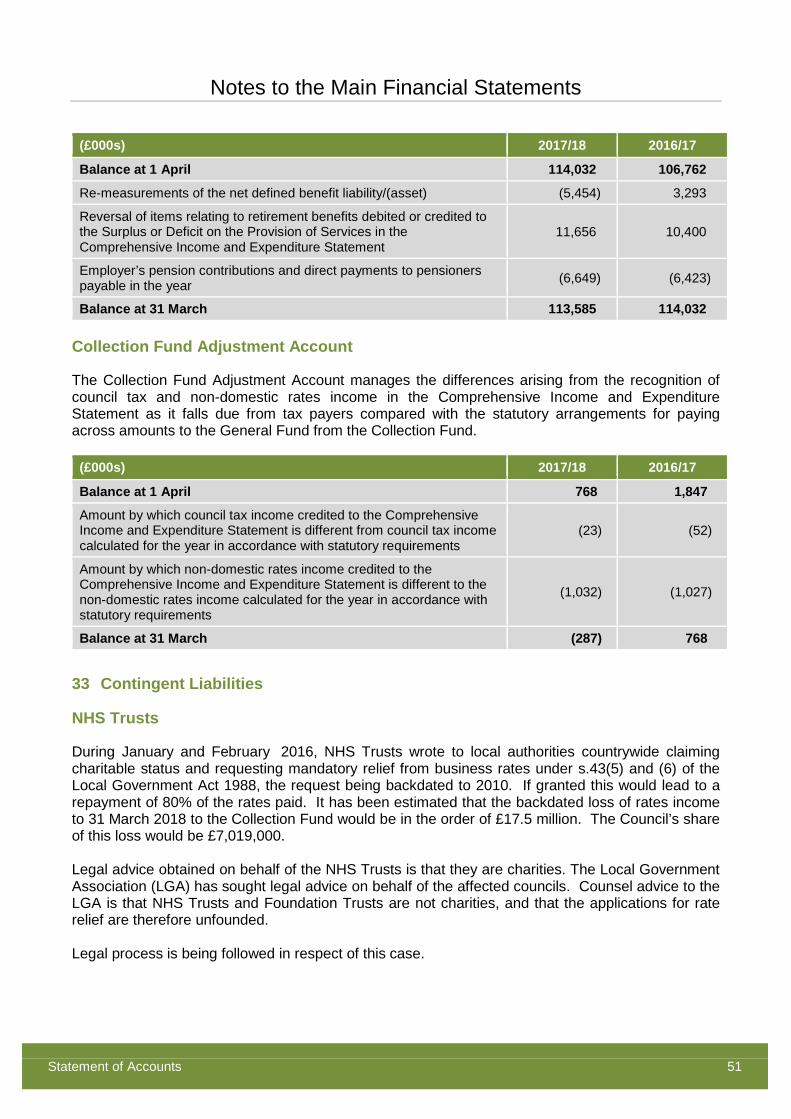
Notes to the Main Financial Statements
Statement of Accounts 51
(£000s) 2017/18 2016/17
Balance at 1 April 114,032 106,762
Re-measurements of the net defined benefit liability/(asset) (5,454) 3,293
Reversal of items relating to retirement benefits debited or credited to the Surplus or Deficit on the Provision of Services in the Comprehensive Income and Expenditure Statement
11,656 10,400
Employer’s pension contributions and direct payments to pensioners payable in the year (6,649) (6,423)
Balance at 31 March 113,585 114,032
Collection Fund Adjustment Account
The Collection Fund Adjustment Account manages the differences arising from the recognition of council tax and non-domestic rates income in the Comprehensive Income and Expenditure Statement as it falls due from tax payers compared with the statutory arrangements for paying across amounts to the General Fund from the Collection Fund.
(£000s) 2017/18 2016/17
Balance at 1 April 768 1,847
Amount by which council tax income credited to the Comprehensive Income and Expenditure Statement is different from council tax income calculated for the year in accordance with statutory requirements
(23) (52)
Amount by which non-domestic rates income credited to the Comprehensive Income and Expenditure Statement is different to the non-domestic rates income calculated for the year in accordance with statutory requirements
(1,032) (1,027)
Balance at 31 March (287) 768
33 Contingent Liabilities
NHS Trusts
During January and February 2016, NHS Trusts wrote to local authorities countrywide claiming charitable status and requesting mandatory relief from business rates under s.43(5) and (6) of the Local Government Act 1988, the request being backdated to 2010. If granted this would lead to a repayment of 80% of the rates paid. It has been estimated that the backdated loss of rates income to 31 March 2018 to the Collection Fund would be in the order of £17.5 million. The Council’s share of this loss would be £7,019,000. Legal advice obtained on behalf of the NHS Trusts is that they are charities. The Local Government Association (LGA) has sought legal advice on behalf of the affected councils. Counsel advice to the LGA is that NHS Trusts and Foundation Trusts are not charities, and that the applications for rate relief are therefore unfounded. Legal process is being followed in respect of this case.
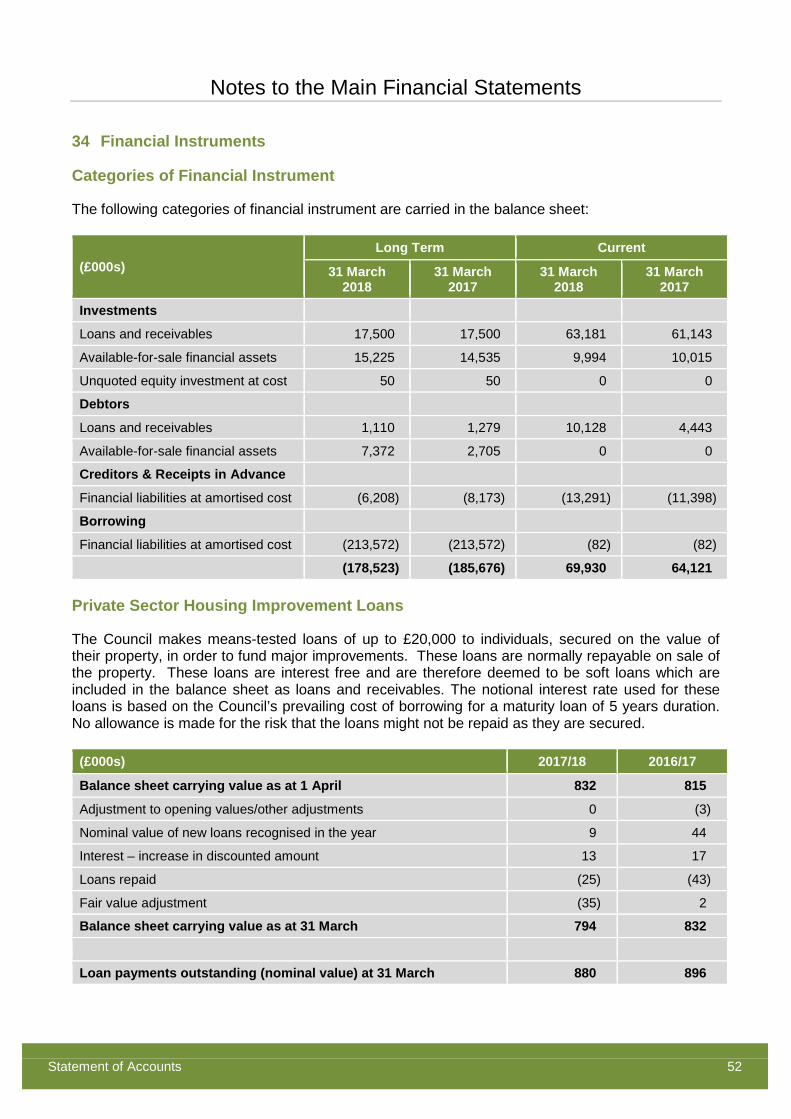
Notes to the Main Financial Statements
Statement of Accounts 52
34 Financial Instruments
Categories of Financial Instrument
The following categories of financial instrument are carried in the balance sheet:
(£000s) Long Term Current
31 March 2018
31 March 2017
31 March 2018
31 March 2017
Investments
Loans and receivables 17,500 17,500 63,181 61,143
Available-for-sale financial assets 15,225 14,535 9,994 10,015
Unquoted equity investment at cost 50 50 0 0
Debtors
Loans and receivables 1,110 1,279 10,128 4,443
Available-for-sale financial assets 7,372 2,705 0 0
Creditors & Receipts in Advance
Financial liabilities at amortised cost (6,208) (8,173) (13,291) (11,398)
Borrowing
Financial liabilities at amortised cost (213,572) (213,572) (82) (82)
(178,523) (185,676) 69,930 64,121
Private Sector Housing Improvement Loans
The Council makes means-tested loans of up to £20,000 to individuals, secured on the value of their property, in order to fund major improvements. These loans are normally repayable on sale of the property. These loans are interest free and are therefore deemed to be soft loans which are included in the balance sheet as loans and receivables. The notional interest rate used for these loans is based on the Council’s prevailing cost of borrowing for a maturity loan of 5 years duration. No allowance is made for the risk that the loans might not be repaid as they are secured.
(£000s) 2017/18 2016/17
Balance sheet carrying value as at 1 April 832 815
Adjustment to opening values/other adjustments 0 (3)
Nominal value of new loans recognised in the year 9 44
Interest – increase in discounted amount 13 17
Loans repaid (25) (43)
Fair value adjustment (35) 2
Balance sheet carrying value as at 31 March 794 832
Loan payments outstanding (nominal value) at 31 March 880 896
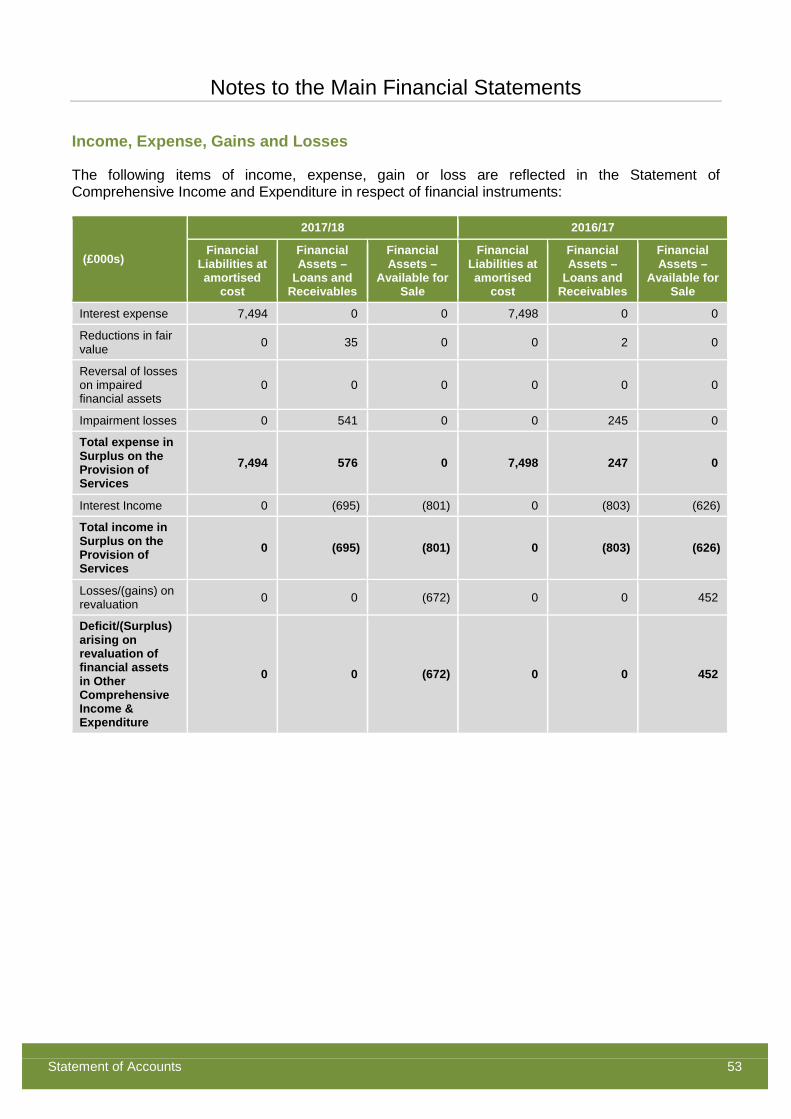
Notes to the Main Financial Statements
Statement of Accounts 53
Income, Expense, Gains and Losses
The following items of income, expense, gain or loss are reflected in the Statement of Comprehensive Income and Expenditure in respect of financial instruments:
(£000s)
2017/18 2016/17
Financial Liabilities at amortised
cost
Financial Assets –
Loans and Receivables
Financial Assets –
Available for Sale
Financial Liabilities at amortised
cost
Financial Assets –
Loans and Receivables
Financial Assets –
Available for Sale
Interest expense 7,494 0 0 7,498 0 0
Reductions in fair value 0 35 0 0 2 0
Reversal of losses on impaired financial assets
0 0 0 0 0 0
Impairment losses 0 541 0 0 245 0
Total expense in Surplus on the Provision of Services
7,494 576 0 7,498 247 0
Interest Income 0 (695) (801) 0 (803) (626)
Total income in Surplus on the Provision of Services
0 (695) (801) 0 (803) (626)
Losses/(gains) on revaluation 0 0 (672) 0 0 452
Deficit/(Surplus) arising on revaluation of financial assets in Other Comprehensive Income & Expenditure
0 0 (672) 0 0 452
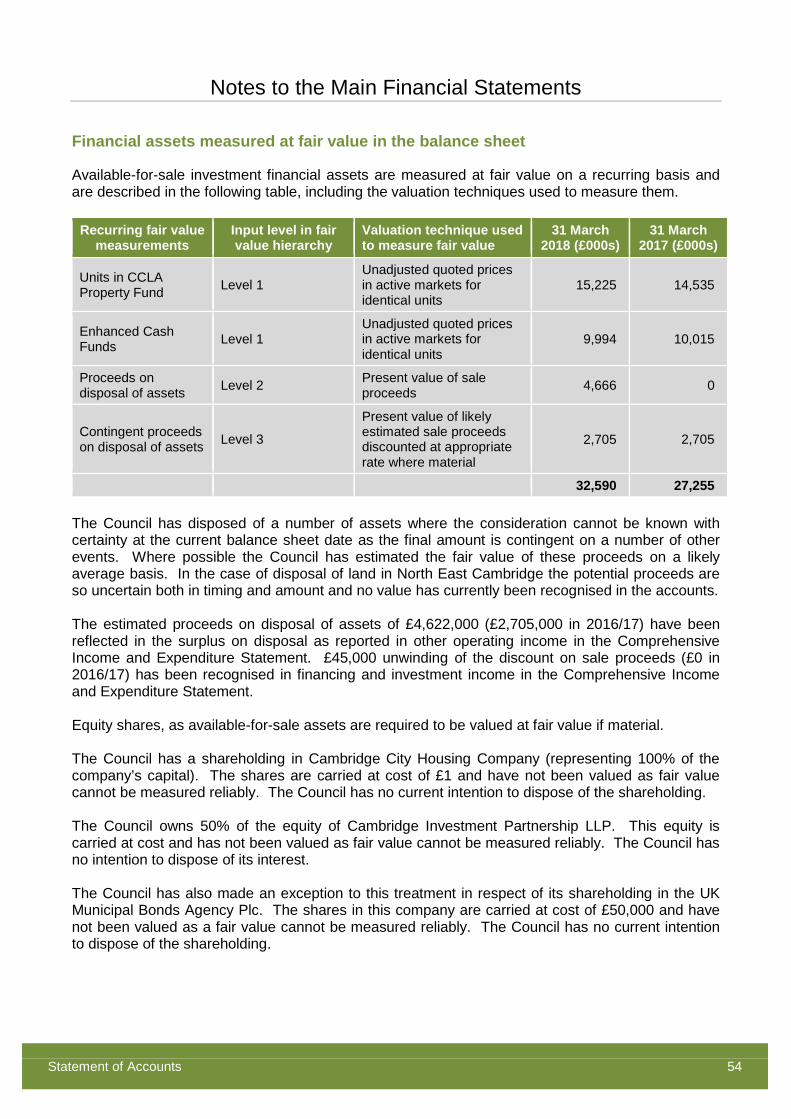
Notes to the Main Financial Statements
Statement of Accounts 54
Financial assets measured at fair value in the balance sheet
Available-for-sale investment financial assets are measured at fair value on a recurring basis and are described in the following table, including the valuation techniques used to measure them.
Recurring fair value measurements
Input level in fair value hierarchy
Valuation technique used to measure fair value
31 March 2018 (£000s)
31 March 2017 (£000s)
Units in CCLA Property Fund Level 1
Unadjusted quoted prices in active markets for identical units
15,225 14,535
Enhanced Cash Funds Level 1
Unadjusted quoted prices in active markets for identical units
9,994 10,015
Proceeds on disposal of assets Level 2 Present value of sale
proceeds 4,666 0
Contingent proceeds on disposal of assets Level 3
Present value of likely estimated sale proceeds discounted at appropriate rate where material
2,705
2,705
32,590 27,255 The Council has disposed of a number of assets where the consideration cannot be known with certainty at the current balance sheet date as the final amount is contingent on a number of other events. Where possible the Council has estimated the fair value of these proceeds on a likely average basis. In the case of disposal of land in North East Cambridge the potential proceeds are so uncertain both in timing and amount and no value has currently been recognised in the accounts. The estimated proceeds on disposal of assets of £4,622,000 (£2,705,000 in 2016/17) have been reflected in the surplus on disposal as reported in other operating income in the Comprehensive Income and Expenditure Statement. £45,000 unwinding of the discount on sale proceeds (£0 in 2016/17) has been recognised in financing and investment income in the Comprehensive Income and Expenditure Statement. Equity shares, as available-for-sale assets are required to be valued at fair value if material. The Council has a shareholding in Cambridge City Housing Company (representing 100% of the company’s capital). The shares are carried at cost of £1 and have not been valued as fair value cannot be measured reliably. The Council has no current intention to dispose of the shareholding. The Council owns 50% of the equity of Cambridge Investment Partnership LLP. This equity is carried at cost and has not been valued as fair value cannot be measured reliably. The Council has no intention to dispose of its interest. The Council has also made an exception to this treatment in respect of its shareholding in the UK Municipal Bonds Agency Plc. The shares in this company are carried at cost of £50,000 and have not been valued as a fair value cannot be measured reliably. The Council has no current intention to dispose of the shareholding.
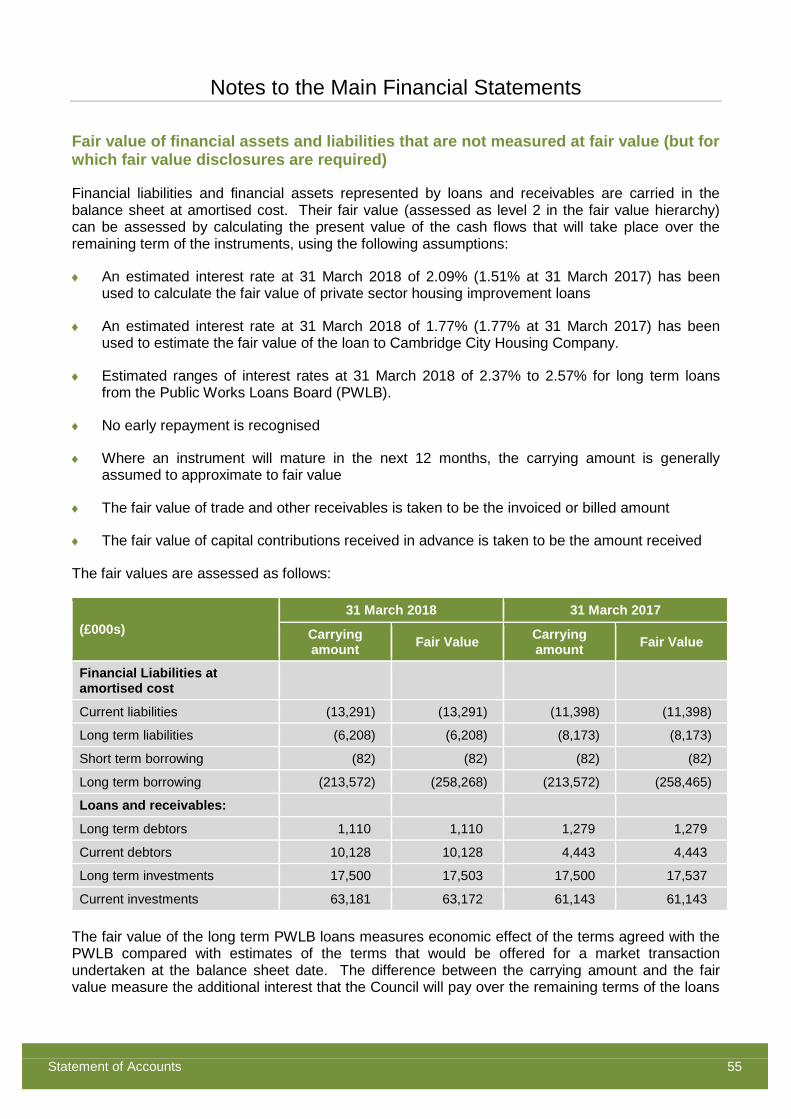
Notes to the Main Financial Statements
Statement of Accounts 55
Fair value of financial assets and liabilities that are not measured at fair value (but for which fair value disclosures are required)
Financial liabilities and financial assets represented by loans and receivables are carried in the balance sheet at amortised cost. Their fair value (assessed as level 2 in the fair value hierarchy) can be assessed by calculating the present value of the cash flows that will take place over the remaining term of the instruments, using the following assumptions:
♦ An estimated interest rate at 31 March 2018 of 2.09% (1.51% at 31 March 2017) has been used to calculate the fair value of private sector housing improvement loans
♦ An estimated interest rate at 31 March 2018 of 1.77% (1.77% at 31 March 2017) has been used to estimate the fair value of the loan to Cambridge City Housing Company.
♦ Estimated ranges of interest rates at 31 March 2018 of 2.37% to 2.57% for long term loans from the Public Works Loans Board (PWLB).
♦ No early repayment is recognised
♦ Where an instrument will mature in the next 12 months, the carrying amount is generally assumed to approximate to fair value
♦ The fair value of trade and other receivables is taken to be the invoiced or billed amount
♦ The fair value of capital contributions received in advance is taken to be the amount received
The fair values are assessed as follows:
(£000s) 31 March 2018 31 March 2017
Carrying amount Fair Value Carrying
amount Fair Value
Financial Liabilities at amortised cost
Current liabilities (13,291) (13,291) (11,398) (11,398)
Long term liabilities (6,208) (6,208) (8,173) (8,173)
Short term borrowing (82) (82) (82) (82)
Long term borrowing (213,572) (258,268) (213,572) (258,465)
Loans and receivables:
Long term debtors 1,110 1,110 1,279 1,279
Current debtors 10,128 10,128 4,443 4,443
Long term investments 17,500 17,503 17,500 17,537
Current investments 63,181 63,172 61,143 61,143 The fair value of the long term PWLB loans measures economic effect of the terms agreed with the PWLB compared with estimates of the terms that would be offered for a market transaction undertaken at the balance sheet date. The difference between the carrying amount and the fair value measure the additional interest that the Council will pay over the remaining terms of the loans
Notes to the Main Financial Statements
Statement of Accounts 56
under the agreements with the PWLB, against what would be paid if the loans were at prevailing rates. The fair value of the loans from the PWLB have been assessed using the new loans rate. IFRS 13 and the Code require that in the absence of a quoted price for a liability, fair value should be measured from the perspective of a market participant. For PWLB loans, measurement is therefore required from the perspective of the PWLB, assessing the price that they would be able to secure if they were to sell the loans in an orderly market transaction. However, it is sometimes not possible to find observable active markets. The Council’s treasury advisors have therefore advised using the PWLB new loan rate as a suitable proxy for a transfer value. This reflects the reality that the Council has a continuing ability to borrow at PWLB rates. However, if the Council were to seek to take advantage of the lower prevailing market rates by repaying current PWLB loans, the PWLB would charge a penalty and the Council would have to pay the early redemption rate. The exit price for PWLB loans including this penalty would be £310,679,000.
35 Nature and extent of risks arising from financial instruments
The Council’s activities expose it to a variety of financial risks:
♦ Credit risk – the possibility that other parties might fail to pay amounts due to the Council
♦ Liquidity risk – the possibility that the Council might not have funds available to meet its commitments to make payments
♦ Market risk – the possibility that financial loss might arise for the Council as a result of changes in such measures as interest rates and stock market movements.
How the Council manages those risks
The Council maintains principles for overall risk management, as well as approved policies covering specific areas, such as Treasury Management. The principles behind how the Council intends to manage overall credit, liquidity and market risk in its investments are contained within the Annual Treasury Management and Investment Strategy report, submitted to full Council before the start of each financial year. This strategy can be amended, but only by full Council. During 2017/18 the Council made no amendments to its investment strategy.
Credit risk
Credit risk arises from investments with banks and other financial institutions, as well as credit exposures to the Council’s customers. The Council seeks through the operation of its Treasury Management and Investment Strategy to minimise its exposure to risks in relation to investments.
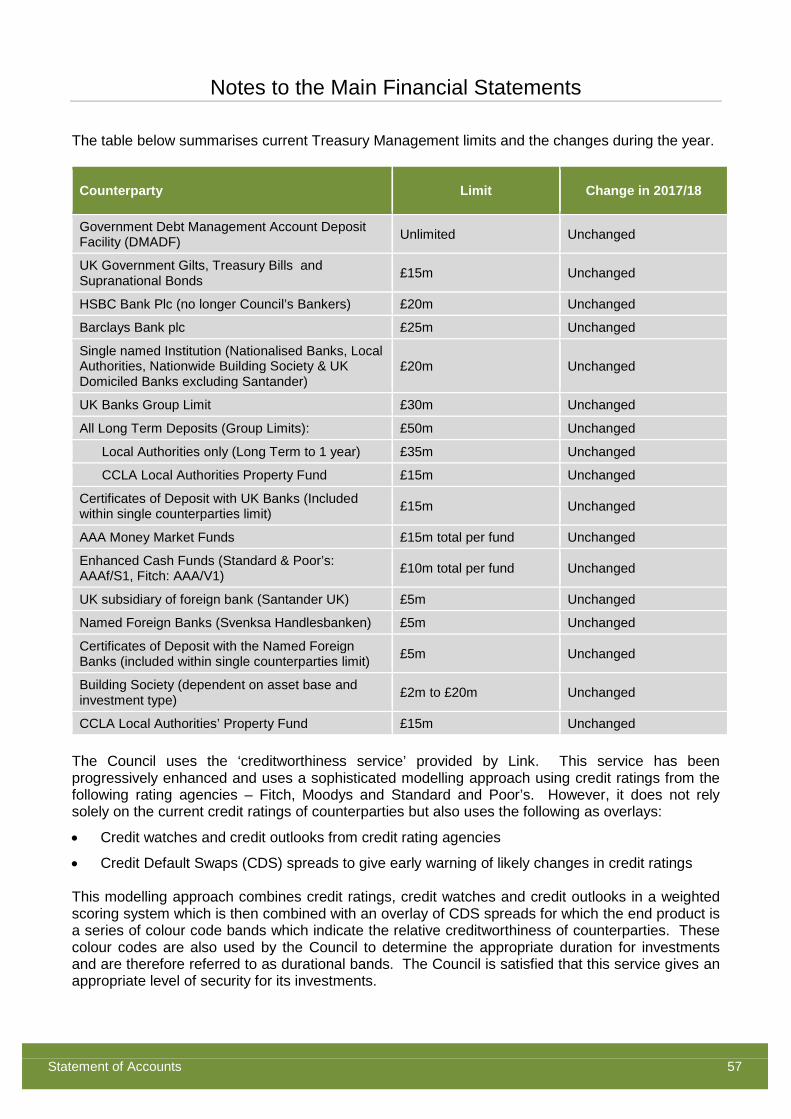
Notes to the Main Financial Statements
Statement of Accounts 57
The table below summarises current Treasury Management limits and the changes during the year.
Counterparty Limit Change in 2017/18
Government Debt Management Account Deposit Facility (DMADF) Unlimited Unchanged
UK Government Gilts, Treasury Bills and Supranational Bonds £15m Unchanged
HSBC Bank Plc (no longer Council’s Bankers) £20m Unchanged
Barclays Bank plc £25m Unchanged
Single named Institution (Nationalised Banks, Local Authorities, Nationwide Building Society & UK Domiciled Banks excluding Santander)
£20m Unchanged
UK Banks Group Limit £30m Unchanged
All Long Term Deposits (Group Limits): £50m Unchanged
Local Authorities only (Long Term to 1 year) £35m Unchanged
CCLA Local Authorities Property Fund £15m Unchanged
Certificates of Deposit with UK Banks (Included within single counterparties limit) £15m Unchanged
AAA Money Market Funds £15m total per fund Unchanged
Enhanced Cash Funds (Standard & Poor’s: AAAf/S1, Fitch: AAA/V1) £10m total per fund Unchanged
UK subsidiary of foreign bank (Santander UK) £5m Unchanged
Named Foreign Banks (Svenksa Handlesbanken) £5m Unchanged
Certificates of Deposit with the Named Foreign Banks (included within single counterparties limit) £5m Unchanged
Building Society (dependent on asset base and investment type) £2m to £20m Unchanged
CCLA Local Authorities’ Property Fund £15m Unchanged The Council uses the ‘creditworthiness service’ provided by Link. This service has been progressively enhanced and uses a sophisticated modelling approach using credit ratings from the following rating agencies – Fitch, Moodys and Standard and Poor’s. However, it does not rely solely on the current credit ratings of counterparties but also uses the following as overlays:
• Credit watches and credit outlooks from credit rating agencies
• Credit Default Swaps (CDS) spreads to give early warning of likely changes in credit ratings This modelling approach combines credit ratings, credit watches and credit outlooks in a weighted scoring system which is then combined with an overlay of CDS spreads for which the end product is a series of colour code bands which indicate the relative creditworthiness of counterparties. These colour codes are also used by the Council to determine the appropriate duration for investments and are therefore referred to as durational bands. The Council is satisfied that this service gives an appropriate level of security for its investments.
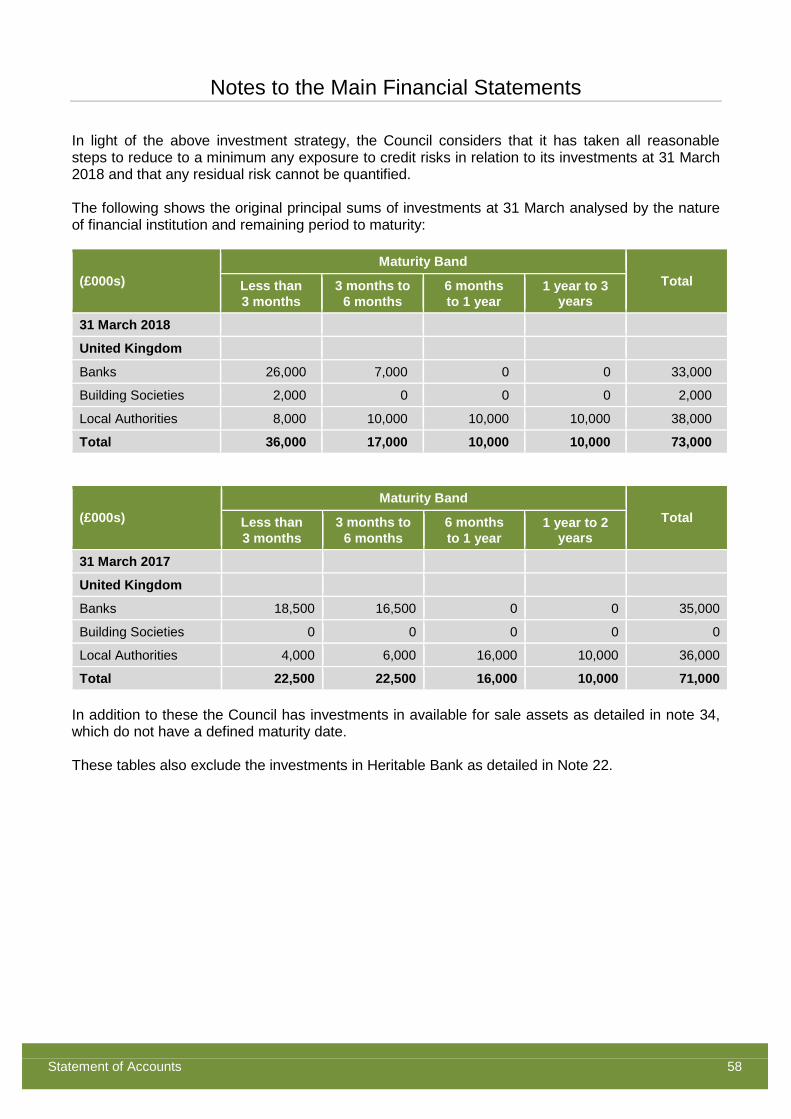
Notes to the Main Financial Statements
Statement of Accounts 58
In light of the above investment strategy, the Council considers that it has taken all reasonable steps to reduce to a minimum any exposure to credit risks in relation to its investments at 31 March 2018 and that any residual risk cannot be quantified. The following shows the original principal sums of investments at 31 March analysed by the nature of financial institution and remaining period to maturity:
(£000s) Maturity Band
Total Less than 3 months
3 months to 6 months
6 months to 1 year
1 year to 3 years
31 March 2018
United Kingdom
Banks 26,000 7,000 0 0 33,000
Building Societies 2,000 0 0 0 2,000
Local Authorities 8,000 10,000 10,000 10,000 38,000
Total 36,000 17,000 10,000 10,000 73,000
(£000s) Maturity Band
Total Less than 3 months
3 months to 6 months
6 months to 1 year
1 year to 2 years
31 March 2017
United Kingdom
Banks 18,500 16,500 0 0 35,000
Building Societies 0 0 0 0 0
Local Authorities 4,000 6,000 16,000 10,000 36,000
Total 22,500 22,500 16,000 10,000 71,000 In addition to these the Council has investments in available for sale assets as detailed in note 34, which do not have a defined maturity date. These tables also exclude the investments in Heritable Bank as detailed in Note 22.
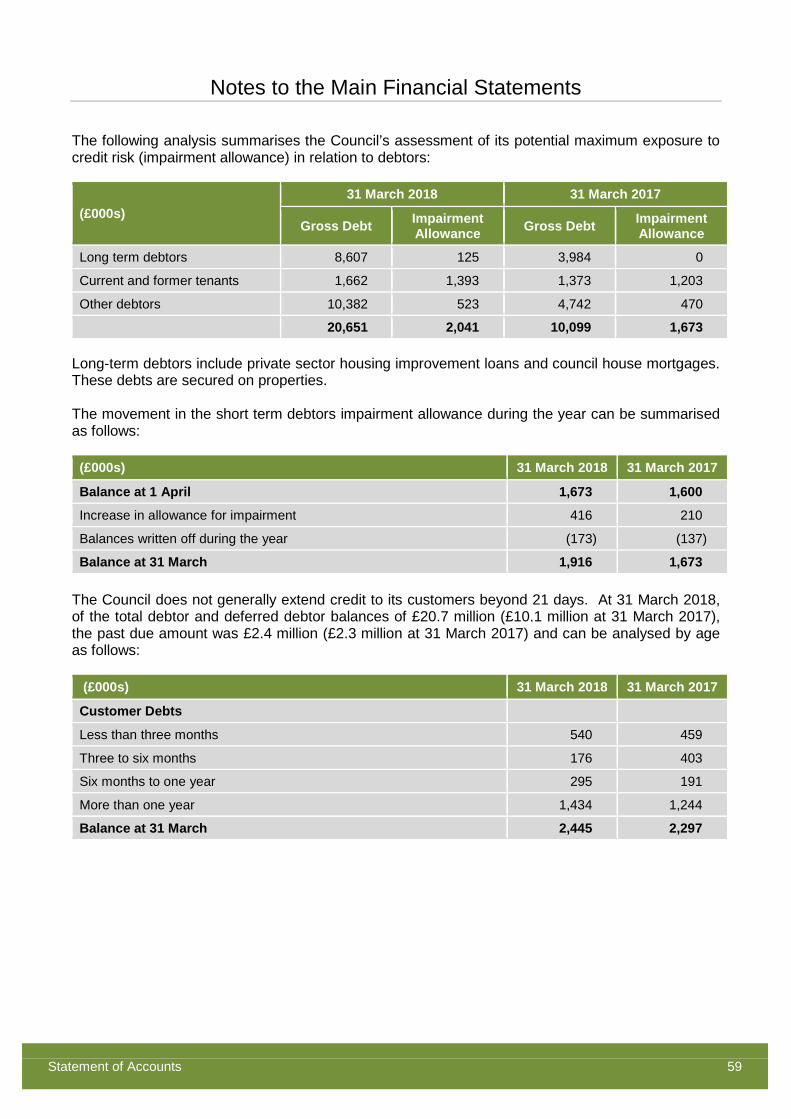
Notes to the Main Financial Statements
Statement of Accounts 59
The following analysis summarises the Council’s assessment of its potential maximum exposure to credit risk (impairment allowance) in relation to debtors:
(£000s) 31 March 2018 31 March 2017
Gross Debt Impairment Allowance Gross Debt Impairment
Allowance
Long term debtors 8,607 125 3,984 0
Current and former tenants 1,662 1,393 1,373 1,203
Other debtors 10,382 523 4,742 470
20,651 2,041 10,099 1,673 Long-term debtors include private sector housing improvement loans and council house mortgages. These debts are secured on properties. The movement in the short term debtors impairment allowance during the year can be summarised as follows:
(£000s) 31 March 2018 31 March 2017
Balance at 1 April 1,673 1,600
Increase in allowance for impairment 416 210
Balances written off during the year (173) (137)
Balance at 31 March 1,916 1,673 The Council does not generally extend credit to its customers beyond 21 days. At 31 March 2018, of the total debtor and deferred debtor balances of £20.7 million (£10.1 million at 31 March 2017), the past due amount was £2.4 million (£2.3 million at 31 March 2017) and can be analysed by age as follows:
(£000s) 31 March 2018 31 March 2017
Customer Debts
Less than three months 540 459
Three to six months 176 403
Six months to one year 295 191
More than one year 1,434 1,244
Balance at 31 March 2,445 2,297
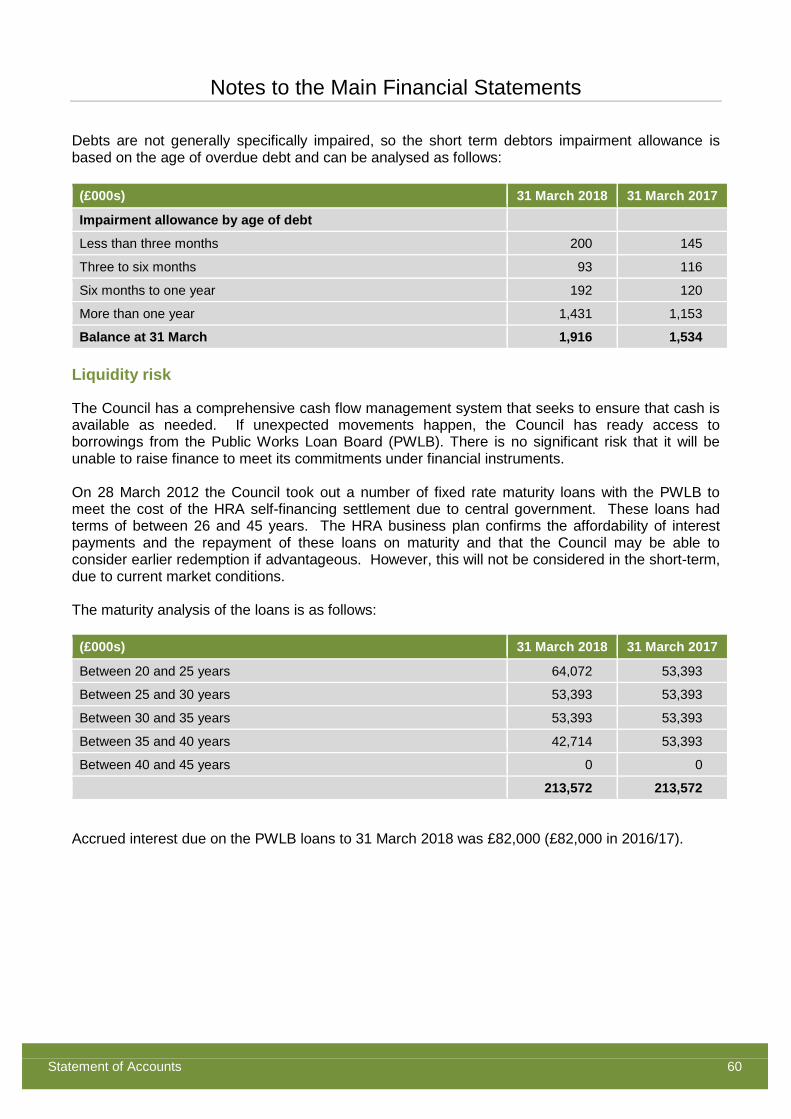
Notes to the Main Financial Statements
Statement of Accounts 60
Debts are not generally specifically impaired, so the short term debtors impairment allowance is based on the age of overdue debt and can be analysed as follows:
(£000s) 31 March 2018 31 March 2017
Impairment allowance by age of debt
Less than three months 200 145
Three to six months 93 116
Six months to one year 192 120
More than one year 1,431 1,153
Balance at 31 March 1,916 1,534
Liquidity risk
The Council has a comprehensive cash flow management system that seeks to ensure that cash is available as needed. If unexpected movements happen, the Council has ready access to borrowings from the Public Works Loan Board (PWLB). There is no significant risk that it will be unable to raise finance to meet its commitments under financial instruments. On 28 March 2012 the Council took out a number of fixed rate maturity loans with the PWLB to meet the cost of the HRA self-financing settlement due to central government. These loans had terms of between 26 and 45 years. The HRA business plan confirms the affordability of interest payments and the repayment of these loans on maturity and that the Council may be able to consider earlier redemption if advantageous. However, this will not be considered in the short-term, due to current market conditions. The maturity analysis of the loans is as follows:
(£000s) 31 March 2018 31 March 2017
Between 20 and 25 years 64,072 53,393
Between 25 and 30 years 53,393 53,393
Between 30 and 35 years 53,393 53,393
Between 35 and 40 years 42,714 53,393
Between 40 and 45 years 0 0
213,572 213,572
Accrued interest due on the PWLB loans to 31 March 2018 was £82,000 (£82,000 in 2016/17).
Notes to the Main Financial Statements
Statement of Accounts 61
Market risk
♦ Interest rate risk
The Council is exposed to minimal risk in terms of its exposure to movements in interest rates. This is because the majority of its investments are at fixed rates. These investments are also of less than one year in duration and so changes to fair value will be minimal. The Council does, however, utilise bank deposit accounts and on-call money market funds for very short term cash deposits and the interest rate on these accounts is variable. In general terms, a rise in interest rates would have the following effects:
♦ Investments at variable rates – the interest income credited to the Income and Expenditure Account will rise
♦ Investments at fixed rates – the fair value of the assets will fall
♦ Loans at fixed rates – the fair value of liabilities will fall.
Borrowings are not carried at fair value, so nominal gains and losses on fixed rate borrowings would not impact on the surplus or deficit on the provision of services. The treasury management team has an active strategy for assessing interest rate exposure that feeds into the setting of the annual budget and which is used to update the budget during the year. During 2017/18, if interest rates on variable rate deposits had been one percentage point higher, with all other variables held constant, the financial effect would have been an additional income of £263,752 (£317,848 in 2016/17).
♦ Price risk
The Council does not generally invest in equity shares in individual companies. However it has investments in Cambridge City Housing Company and the Municipal Bonds Agency as detailed in Note 34. The Council has £15 million invested in the Local Authorities’ Property Fund. These investments are classified as ‘available-for-sale’, meaning that all movements in price will impact on gains and losses recognised in Other Comprehensive Income and Expenditure. The Council is exposed to potential losses arising from future movements in the value of the Municipal Bonds Agency shares and those in Cambridge City Housing Company, but these are not material to the Council. A gain of £690,000 in respect of the Local Authorities’ Property Fund has been recognised in Other Comprehensive Income and Expenditure in 2017/18. This reflects general movements in the value of the shares over 2017/18. A further movement in the bid price of 5% (positive or negative) would have resulted in a £761,000 gain or loss being recognised in Other Comprehensive Income and Expenditure in 2017/18. The Council also holds a number of Enhanced Cash Funds, shown in current investments, which are available-for-sale assets and a loss of £18,000 has been recognised in Other Comprehensive Income and Expenditure in 2017/18 in respect of these assets. The statutory accounting arrangements around all investments treated as available-for-sale mean that any gains or losses arising from price movements recognised in the Comprehensive Income
Notes to the Main Financial Statements
Statement of Accounts 62
and Expenditure Statement are not borne by the General Fund for taxation purposes until the investments are sold. The Council intends to hold the investments in the Municipal Bonds Agency, Cambridge City Council Housing Company, CIP LLP and the Local Authorities’ Property Fund over the long term.
♦ Foreign exchange risk
The Council has no material financial assets or liabilities denominated in foreign currencies.
36 Defined Benefit Pension Schemes
Participation in pension schemes
As part of the terms and conditions of employment of its officers, the Council makes contributions towards the cost of post-employment benefits. Although these benefits will not actually be payable until employees retire, the Council has a commitment to make the payments and this needs to be disclosed at the time that employees earn their future entitlement. The Council participates in the Local Government Pension Scheme, administered locally by Cambridgeshire County Council. This is a funded defined benefit final salary scheme, meaning that the Council and employees pay contributions into a fund, calculated at a level intended to balance the pension liabilities with investment assets. The scheme is operated under the regulatory framework for the Local Government Pension Scheme and the governance of the scheme in 2017/18 was the responsibility of the Cambridgeshire Pension Fund Committee and Investment Sub-Committee. Policy is determined in accordance with the pension fund regulations. The principal risks to the Council of the scheme are the longevity assumptions, statutory changes to the scheme, structural changes to the scheme (i.e. large scale withdrawals from the scheme), changes to inflation, bond yields and the performance of the equity investments held by the scheme. These are mitigated to a certain extent by the statutory requirements to charge to the General Fund and the Housing Revenue Account the amounts required by statute as described in the accounting policies note.
Transactions relating to post-employment benefits
The Council recognises the cost of retirement benefits in the reported cost of services when employees earn them, rather than when the benefits are eventually paid as pensions. However, the charge the Council is required to make against council tax is based on the employer contributions payable in the year, so the real cost of post-employment/retirement benefits is reversed out of the General Fund via the Movement in Reserves Statement. The following transactions have been made in the Comprehensive Income and Expenditure Statement and the General Fund Balance via the Movement in Reserves Statement during the year:
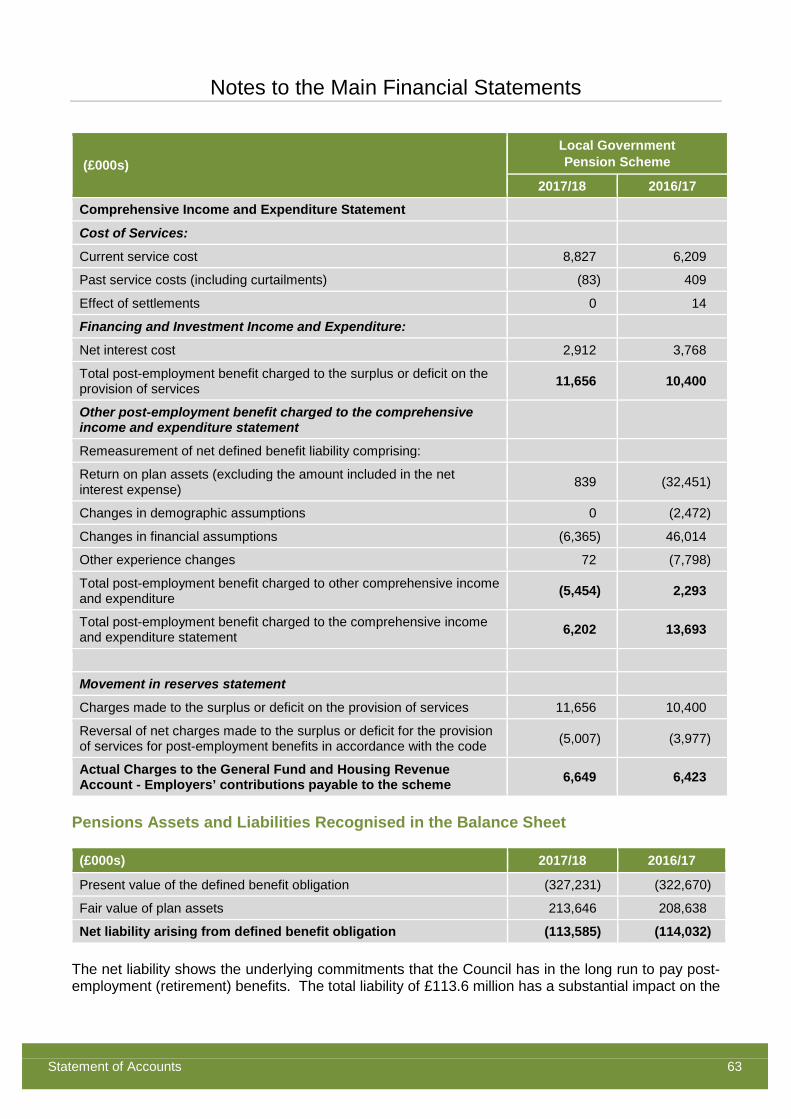
Notes to the Main Financial Statements
Statement of Accounts 63
(£000s) Local Government Pension Scheme
2017/18 2016/17
Comprehensive Income and Expenditure Statement
Cost of Services:
Current service cost 8,827 6,209
Past service costs (including curtailments) (83) 409
Effect of settlements 0 14
Financing and Investment Income and Expenditure:
Net interest cost 2,912 3,768
Total post-employment benefit charged to the surplus or deficit on the provision of services 11,656 10,400
Other post-employment benefit charged to the comprehensive income and expenditure statement
Remeasurement of net defined benefit liability comprising:
Return on plan assets (excluding the amount included in the net interest expense) 839 (32,451)
Changes in demographic assumptions 0 (2,472)
Changes in financial assumptions (6,365) 46,014
Other experience changes 72 (7,798)
Total post-employment benefit charged to other comprehensive income and expenditure (5,454) 2,293
Total post-employment benefit charged to the comprehensive income and expenditure statement 6,202 13,693
Movement in reserves statement
Charges made to the surplus or deficit on the provision of services 11,656 10,400
Reversal of net charges made to the surplus or deficit for the provision of services for post-employment benefits in accordance with the code (5,007) (3,977)
Actual Charges to the General Fund and Housing Revenue Account - Employers’ contributions payable to the scheme 6,649 6,423
Pensions Assets and Liabilities Recognised in the Balance Sheet
(£000s) 2017/18 2016/17
Present value of the defined benefit obligation (327,231) (322,670)
Fair value of plan assets 213,646 208,638
Net liability arising from defined benefit obligation (113,585) (114,032) The net liability shows the underlying commitments that the Council has in the long run to pay post-employment (retirement) benefits. The total liability of £113.6 million has a substantial impact on the
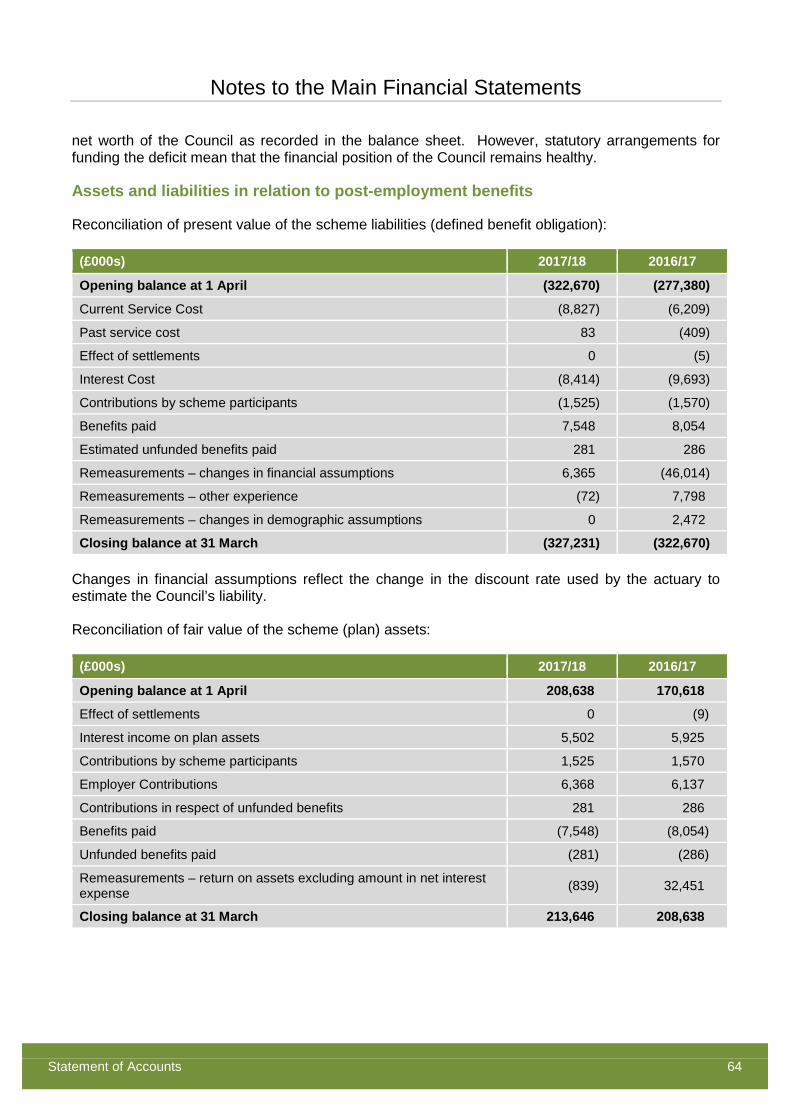
Notes to the Main Financial Statements
Statement of Accounts 64
net worth of the Council as recorded in the balance sheet. However, statutory arrangements for funding the deficit mean that the financial position of the Council remains healthy.
Assets and liabilities in relation to post-employment benefits
Reconciliation of present value of the scheme liabilities (defined benefit obligation):
(£000s) 2017/18 2016/17
Opening balance at 1 April (322,670) (277,380)
Current Service Cost (8,827) (6,209)
Past service cost 83 (409)
Effect of settlements 0 (5)
Interest Cost (8,414) (9,693)
Contributions by scheme participants (1,525) (1,570)
Benefits paid 7,548 8,054
Estimated unfunded benefits paid 281 286
Remeasurements – changes in financial assumptions 6,365 (46,014)
Remeasurements – other experience (72) 7,798
Remeasurements – changes in demographic assumptions 0 2,472
Closing balance at 31 March (327,231) (322,670) Changes in financial assumptions reflect the change in the discount rate used by the actuary to estimate the Council’s liability. Reconciliation of fair value of the scheme (plan) assets:
(£000s) 2017/18 2016/17
Opening balance at 1 April 208,638 170,618
Effect of settlements 0 (9)
Interest income on plan assets 5,502 5,925
Contributions by scheme participants 1,525 1,570
Employer Contributions 6,368 6,137
Contributions in respect of unfunded benefits 281 286
Benefits paid (7,548) (8,054)
Unfunded benefits paid (281) (286)
Remeasurements – return on assets excluding amount in net interest expense (839) 32,451
Closing balance at 31 March 213,646 208,638
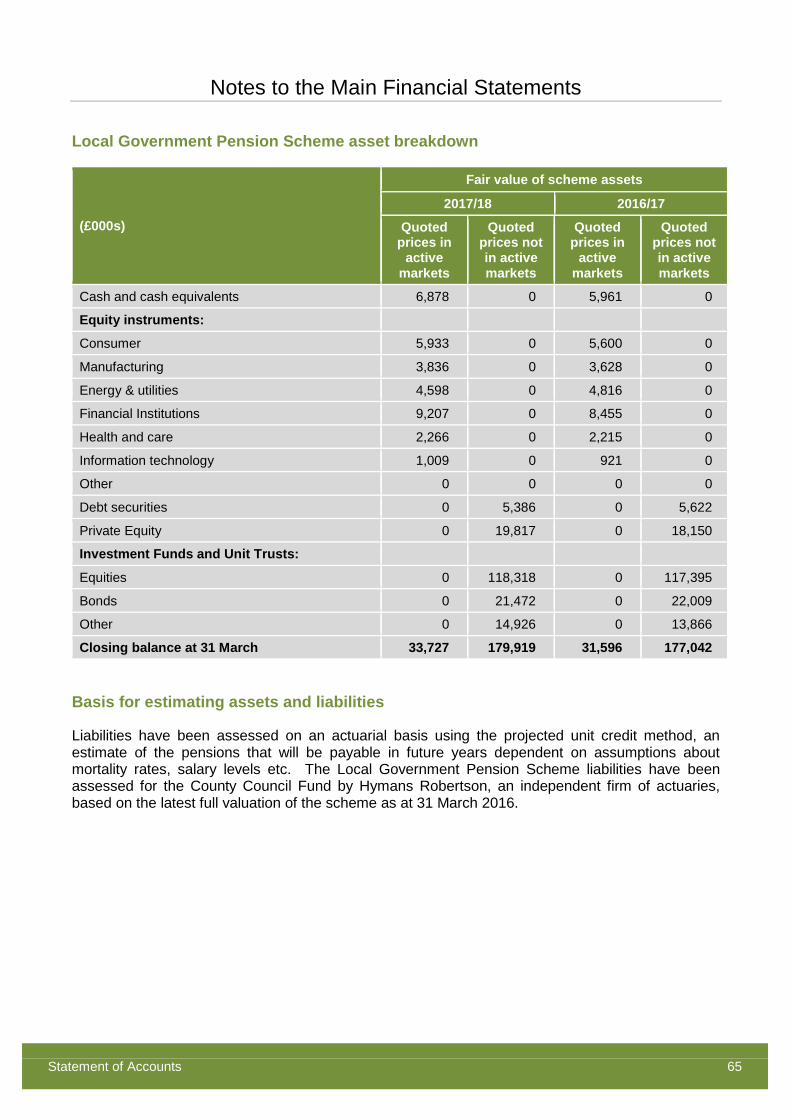
Notes to the Main Financial Statements
Statement of Accounts 65
Local Government Pension Scheme asset breakdown
(£000s)
Fair value of scheme assets
2017/18 2016/17
Quoted prices in
active markets
Quoted prices not in active markets
Quoted prices in
active markets
Quoted prices not in active markets
Cash and cash equivalents 6,878 0 5,961 0
Equity instruments:
Consumer 5,933 0 5,600 0
Manufacturing 3,836 0 3,628 0
Energy & utilities 4,598 0 4,816 0
Financial Institutions 9,207 0 8,455 0
Health and care 2,266 0 2,215 0
Information technology 1,009 0 921 0
Other 0 0 0 0
Debt securities 0 5,386 0 5,622
Private Equity 0 19,817 0 18,150
Investment Funds and Unit Trusts:
Equities 0 118,318 0 117,395
Bonds 0 21,472 0 22,009
Other 0 14,926 0 13,866
Closing balance at 31 March 33,727 179,919 31,596 177,042
Basis for estimating assets and liabilities
Liabilities have been assessed on an actuarial basis using the projected unit credit method, an estimate of the pensions that will be payable in future years dependent on assumptions about mortality rates, salary levels etc. The Local Government Pension Scheme liabilities have been assessed for the County Council Fund by Hymans Robertson, an independent firm of actuaries, based on the latest full valuation of the scheme as at 31 March 2016.
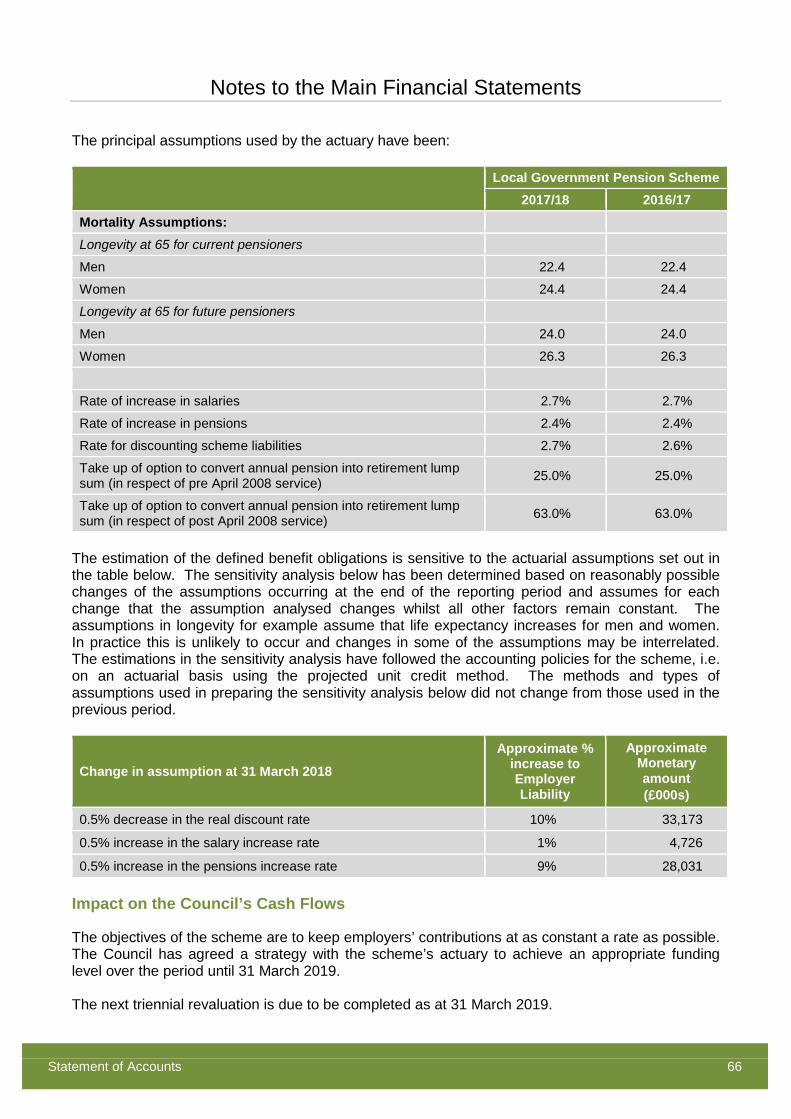
Notes to the Main Financial Statements
Statement of Accounts 66
The principal assumptions used by the actuary have been:
Local Government Pension Scheme
2017/18 2016/17 Mortality Assumptions: Longevity at 65 for current pensioners
Men 22.4 22.4
Women 24.4 24.4
Longevity at 65 for future pensioners
Men 24.0 24.0
Women 26.3 26.3
Rate of increase in salaries 2.7% 2.7%
Rate of increase in pensions 2.4% 2.4%
Rate for discounting scheme liabilities 2.7% 2.6%
Take up of option to convert annual pension into retirement lump sum (in respect of pre April 2008 service) 25.0% 25.0%
Take up of option to convert annual pension into retirement lump sum (in respect of post April 2008 service) 63.0% 63.0%
The estimation of the defined benefit obligations is sensitive to the actuarial assumptions set out in the table below. The sensitivity analysis below has been determined based on reasonably possible changes of the assumptions occurring at the end of the reporting period and assumes for each change that the assumption analysed changes whilst all other factors remain constant. The assumptions in longevity for example assume that life expectancy increases for men and women. In practice this is unlikely to occur and changes in some of the assumptions may be interrelated. The estimations in the sensitivity analysis have followed the accounting policies for the scheme, i.e. on an actuarial basis using the projected unit credit method. The methods and types of assumptions used in preparing the sensitivity analysis below did not change from those used in the previous period.
Change in assumption at 31 March 2018 Approximate %
increase to Employer Liability
Approximate Monetary amount (£000s)
0.5% decrease in the real discount rate 10% 33,173
0.5% increase in the salary increase rate 1% 4,726
0.5% increase in the pensions increase rate 9% 28,031
Impact on the Council’s Cash Flows
The objectives of the scheme are to keep employers’ contributions at as constant a rate as possible. The Council has agreed a strategy with the scheme’s actuary to achieve an appropriate funding level over the period until 31 March 2019. The next triennial revaluation is due to be completed as at 31 March 2019.
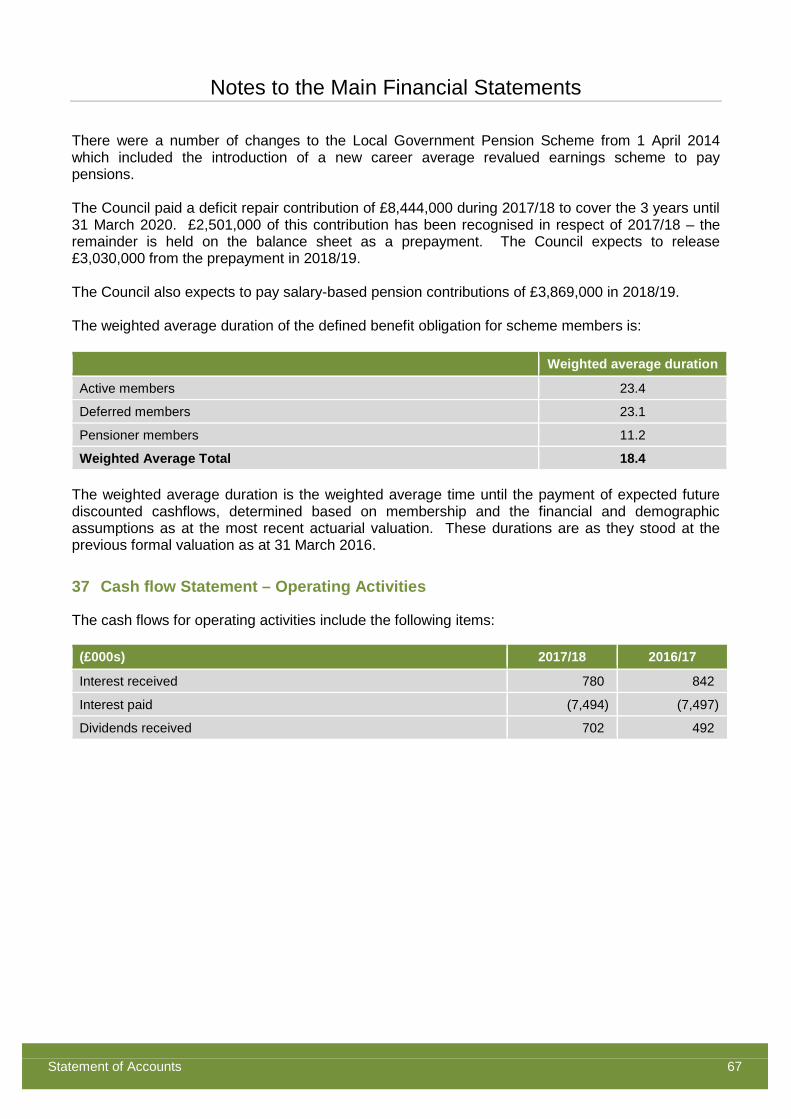
Notes to the Main Financial Statements
Statement of Accounts 67
There were a number of changes to the Local Government Pension Scheme from 1 April 2014 which included the introduction of a new career average revalued earnings scheme to pay pensions. The Council paid a deficit repair contribution of £8,444,000 during 2017/18 to cover the 3 years until 31 March 2020. £2,501,000 of this contribution has been recognised in respect of 2017/18 – the remainder is held on the balance sheet as a prepayment. The Council expects to release £3,030,000 from the prepayment in 2018/19. The Council also expects to pay salary-based pension contributions of £3,869,000 in 2018/19. The weighted average duration of the defined benefit obligation for scheme members is:
Weighted average duration
Active members 23.4
Deferred members 23.1
Pensioner members 11.2
Weighted Average Total 18.4 The weighted average duration is the weighted average time until the payment of expected future discounted cashflows, determined based on membership and the financial and demographic assumptions as at the most recent actuarial valuation. These durations are as they stood at the previous formal valuation as at 31 March 2016.
37 Cash flow Statement – Operating Activities
The cash flows for operating activities include the following items:
(£000s) 2017/18 2016/17
Interest received 780 842
Interest paid (7,494) (7,497)
Dividends received 702 492
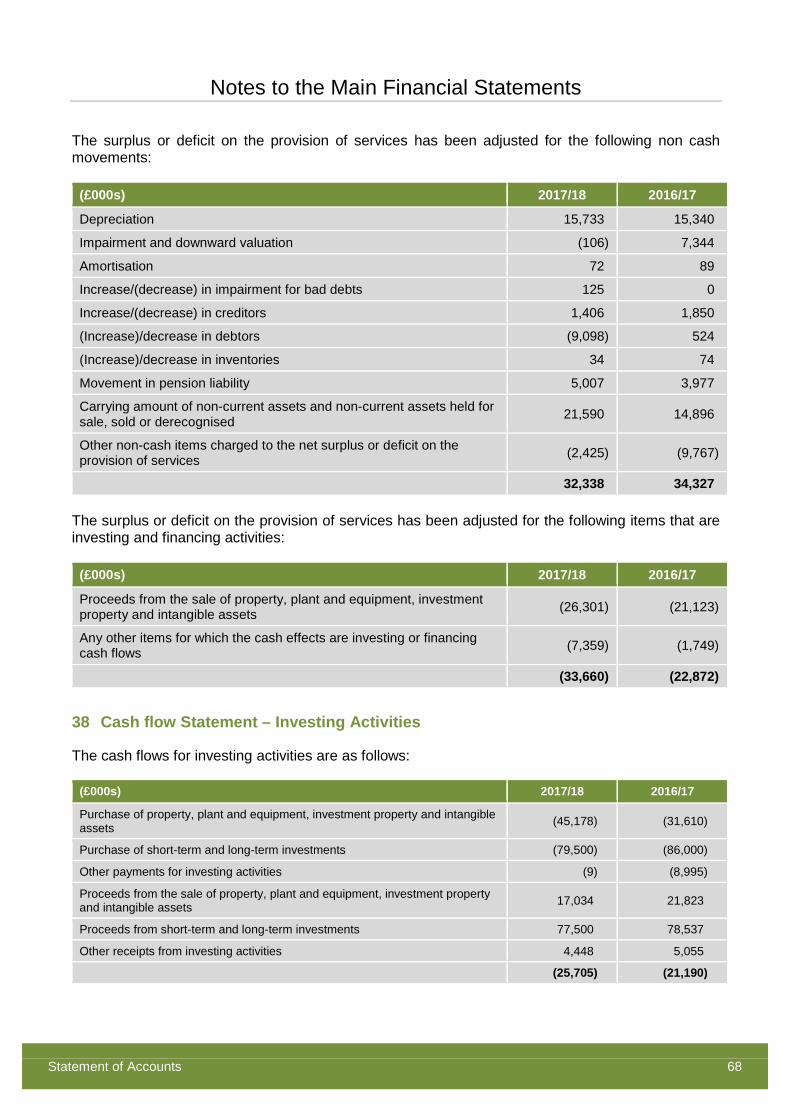
Notes to the Main Financial Statements
Statement of Accounts 68
The surplus or deficit on the provision of services has been adjusted for the following non cash movements:
(£000s) 2017/18 2016/17
Depreciation 15,733 15,340
Impairment and downward valuation (106) 7,344
Amortisation 72 89
Increase/(decrease) in impairment for bad debts 125 0
Increase/(decrease) in creditors 1,406 1,850
(Increase)/decrease in debtors (9,098) 524
(Increase)/decrease in inventories 34 74
Movement in pension liability 5,007 3,977
Carrying amount of non-current assets and non-current assets held for sale, sold or derecognised 21,590 14,896
Other non-cash items charged to the net surplus or deficit on the provision of services (2,425) (9,767)
32,338 34,327
The surplus or deficit on the provision of services has been adjusted for the following items that are investing and financing activities:
(£000s) 2017/18 2016/17
Proceeds from the sale of property, plant and equipment, investment property and intangible assets (26,301) (21,123)
Any other items for which the cash effects are investing or financing cash flows (7,359) (1,749)
(33,660) (22,872)
38 Cash flow Statement – Investing Activities
The cash flows for investing activities are as follows:
(£000s) 2017/18 2016/17
Purchase of property, plant and equipment, investment property and intangible assets (45,178) (31,610)
Purchase of short-term and long-term investments (79,500) (86,000)
Other payments for investing activities (9) (8,995)
Proceeds from the sale of property, plant and equipment, investment property and intangible assets 17,034 21,823
Proceeds from short-term and long-term investments 77,500 78,537
Other receipts from investing activities 4,448 5,055
(25,705) (21,190)
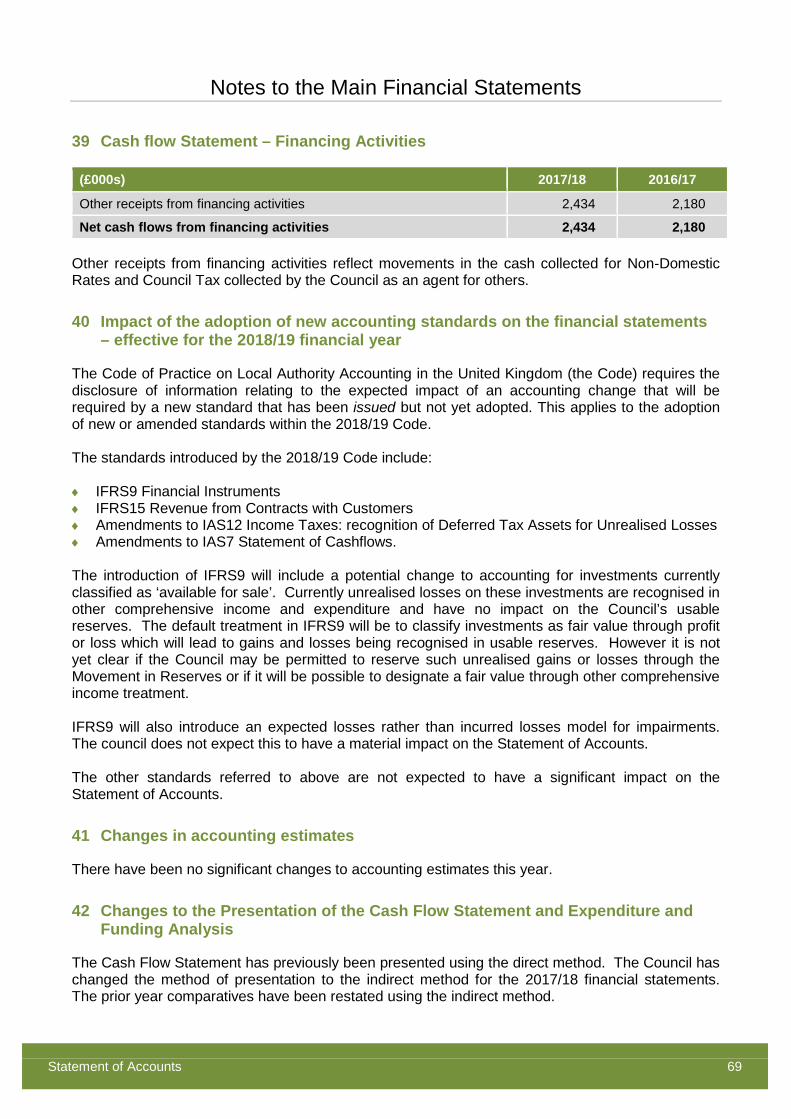
Notes to the Main Financial Statements
Statement of Accounts 69
39 Cash flow Statement – Financing Activities
(£000s) 2017/18 2016/17
Other receipts from financing activities 2,434 2,180
Net cash flows from financing activities 2,434 2,180 Other receipts from financing activities reflect movements in the cash collected for Non-Domestic Rates and Council Tax collected by the Council as an agent for others.
40 Impact of the adoption of new accounting standards on the financial statements – effective for the 2018/19 financial year
The Code of Practice on Local Authority Accounting in the United Kingdom (the Code) requires the disclosure of information relating to the expected impact of an accounting change that will be required by a new standard that has been issued but not yet adopted. This applies to the adoption of new or amended standards within the 2018/19 Code. The standards introduced by the 2018/19 Code include: ♦ IFRS9 Financial Instruments ♦ IFRS15 Revenue from Contracts with Customers ♦ Amendments to IAS12 Income Taxes: recognition of Deferred Tax Assets for Unrealised Losses ♦ Amendments to IAS7 Statement of Cashflows. The introduction of IFRS9 will include a potential change to accounting for investments currently classified as ‘available for sale’. Currently unrealised losses on these investments are recognised in other comprehensive income and expenditure and have no impact on the Council’s usable reserves. The default treatment in IFRS9 will be to classify investments as fair value through profit or loss which will lead to gains and losses being recognised in usable reserves. However it is not yet clear if the Council may be permitted to reserve such unrealised gains or losses through the Movement in Reserves or if it will be possible to designate a fair value through other comprehensive income treatment. IFRS9 will also introduce an expected losses rather than incurred losses model for impairments. The council does not expect this to have a material impact on the Statement of Accounts. The other standards referred to above are not expected to have a significant impact on the Statement of Accounts.
41 Changes in accounting estimates
There have been no significant changes to accounting estimates this year.
42 Changes to the Presentation of the Cash Flow Statement and Expenditure and Funding Analysis
The Cash Flow Statement has previously been presented using the direct method. The Council has changed the method of presentation to the indirect method for the 2017/18 financial statements. The prior year comparatives have been restated using the indirect method.
Notes to the Main Financial Statements
Statement of Accounts 70
In the 2016/17 Statement of Accounts the Expenditure and Funding Analysis (EFA) was presented with the primary financial statements. This analysis has been moved to Note 1 to the financial statements. The EFA has also been expanded to include an additional reconciliation to the outturn reported to Members. This additional reconciliation has been added to the prior year comparative.
43 Date the Statement of Accounts were authorised for issue
The audited accounts were authorised for issue by the Council’s Section 151 officer on 25 July 2018. This is the date up to which events after the balance sheet date have been considered.
44 Events after the Reporting Period
As noted above the unaudited accounts were authorised for issue on 25 July 2018. Events taking place after this date are not reflected in the financial statements or notes. Where events taking place before this date provided information about conditions existing at 31 March 2018, the figures in the financial statements and notes have been adjusted in all material respects to reflect the impact of this information. In June 2018 the Council agreed to provide additional financial support to Cambridge Live, conditional upon approval of a new business plan in summer 2018. The Council therefore considers that it is likely that it will control Cambridge Live and it will therefore be consolidated as a subsidiary from the effective date of control in the 2018/19 accounts. In June 2018 the Council purchased a former Ridgeon’s site off Cromwell Road in Cambridge for £27 million. This site already has outline planning permission for homes and will be developed by the Cambridge Investment Partnership (CIP) LLP, a joint venture with Hill Partnerships. The plan is to build more than 200 homes, of which at least 90 will be affordable.

ADDITIONAL FINANCIAL STATEMENTS AND INFORMATION

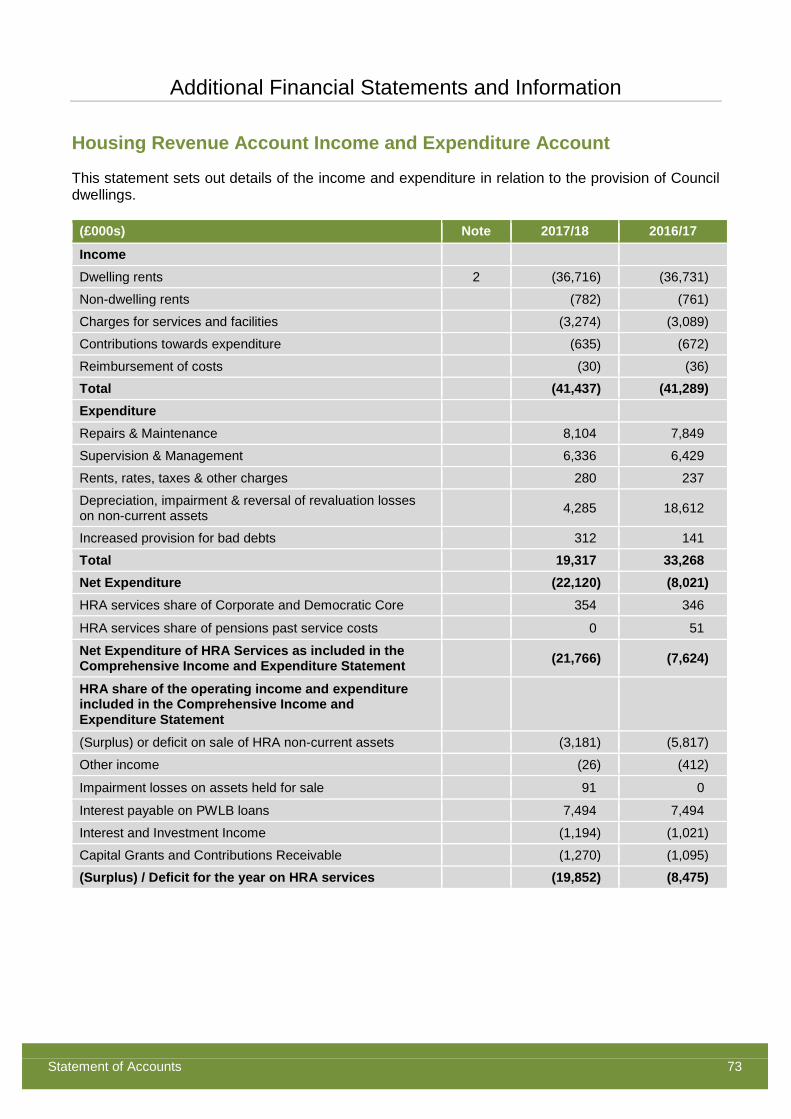
Additional Financial Statements and Information
Statement of Accounts 73
Housing Revenue Account Income and Expenditure Account
This statement sets out details of the income and expenditure in relation to the provision of Council dwellings.
(£000s) Note 2017/18 2016/17
Income Dwelling rents 2 (36,716) (36,731)
Non-dwelling rents (782) (761)
Charges for services and facilities (3,274) (3,089)
Contributions towards expenditure (635) (672)
Reimbursement of costs (30) (36)
Total (41,437) (41,289) Expenditure Repairs & Maintenance 8,104 7,849
Supervision & Management 6,336 6,429
Rents, rates, taxes & other charges 280 237
Depreciation, impairment & reversal of revaluation losses on non-current assets 4,285 18,612
Increased provision for bad debts 312 141
Total 19,317 33,268 Net Expenditure (22,120) (8,021) HRA services share of Corporate and Democratic Core 354 346
HRA services share of pensions past service costs 0 51
Net Expenditure of HRA Services as included in the Comprehensive Income and Expenditure Statement (21,766) (7,624)
HRA share of the operating income and expenditure included in the Comprehensive Income and Expenditure Statement
(Surplus) or deficit on sale of HRA non-current assets (3,181) (5,817)
Other income (26) (412)
Impairment losses on assets held for sale 91 0
Interest payable on PWLB loans 7,494 7,494
Interest and Investment Income (1,194) (1,021)
Capital Grants and Contributions Receivable (1,270) (1,095)
(Surplus) / Deficit for the year on HRA services (19,852) (8,475)
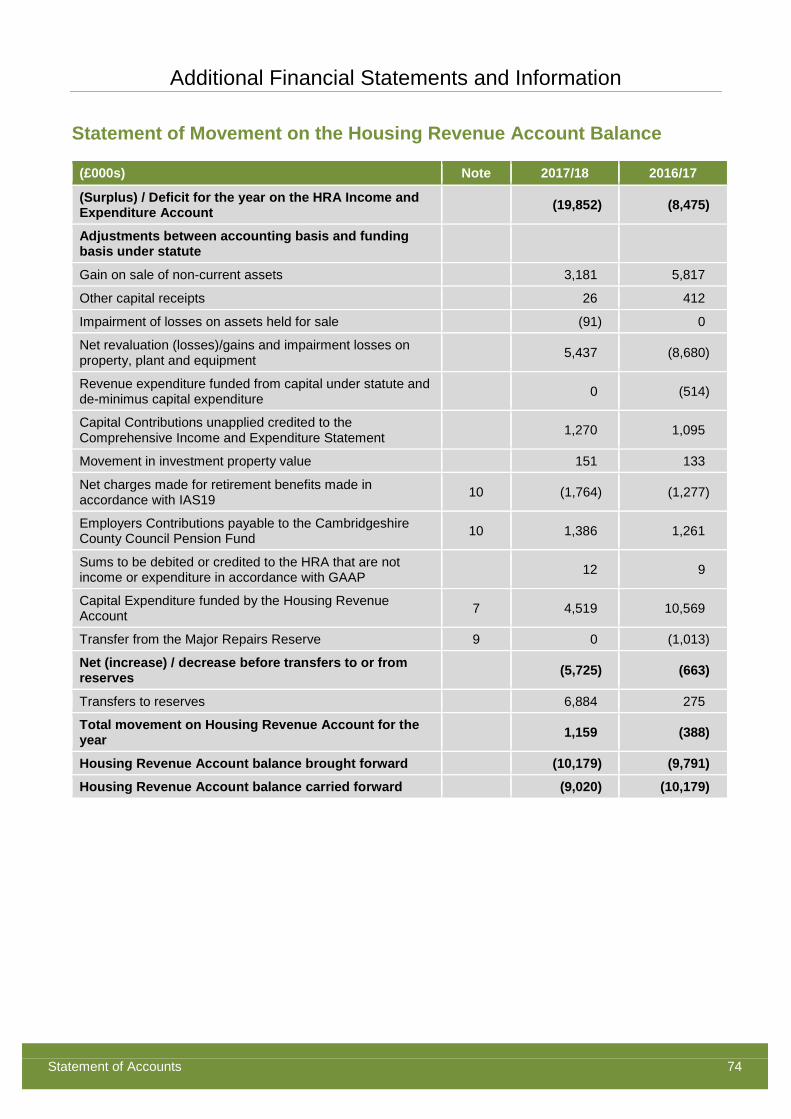
Additional Financial Statements and Information
Statement of Accounts 74
Statement of Movement on the Housing Revenue Account Balance
(£000s) Note 2017/18 2016/17
(Surplus) / Deficit for the year on the HRA Income and Expenditure Account (19,852) (8,475)
Adjustments between accounting basis and funding basis under statute
Gain on sale of non-current assets 3,181 5,817
Other capital receipts 26 412
Impairment of losses on assets held for sale (91) 0
Net revaluation (losses)/gains and impairment losses on property, plant and equipment 5,437 (8,680)
Revenue expenditure funded from capital under statute and de-minimus capital expenditure 0 (514)
Capital Contributions unapplied credited to the Comprehensive Income and Expenditure Statement 1,270 1,095
Movement in investment property value 151 133
Net charges made for retirement benefits made in accordance with IAS19 10 (1,764) (1,277)
Employers Contributions payable to the Cambridgeshire County Council Pension Fund 10 1,386 1,261
Sums to be debited or credited to the HRA that are not income or expenditure in accordance with GAAP 12 9
Capital Expenditure funded by the Housing Revenue Account 7 4,519 10,569
Transfer from the Major Repairs Reserve 9 0 (1,013)
Net (increase) / decrease before transfers to or from reserves (5,725) (663)
Transfers to reserves 6,884 275
Total movement on Housing Revenue Account for the year 1,159 (388)
Housing Revenue Account balance brought forward (10,179) (9,791)
Housing Revenue Account balance carried forward (9,020) (10,179)
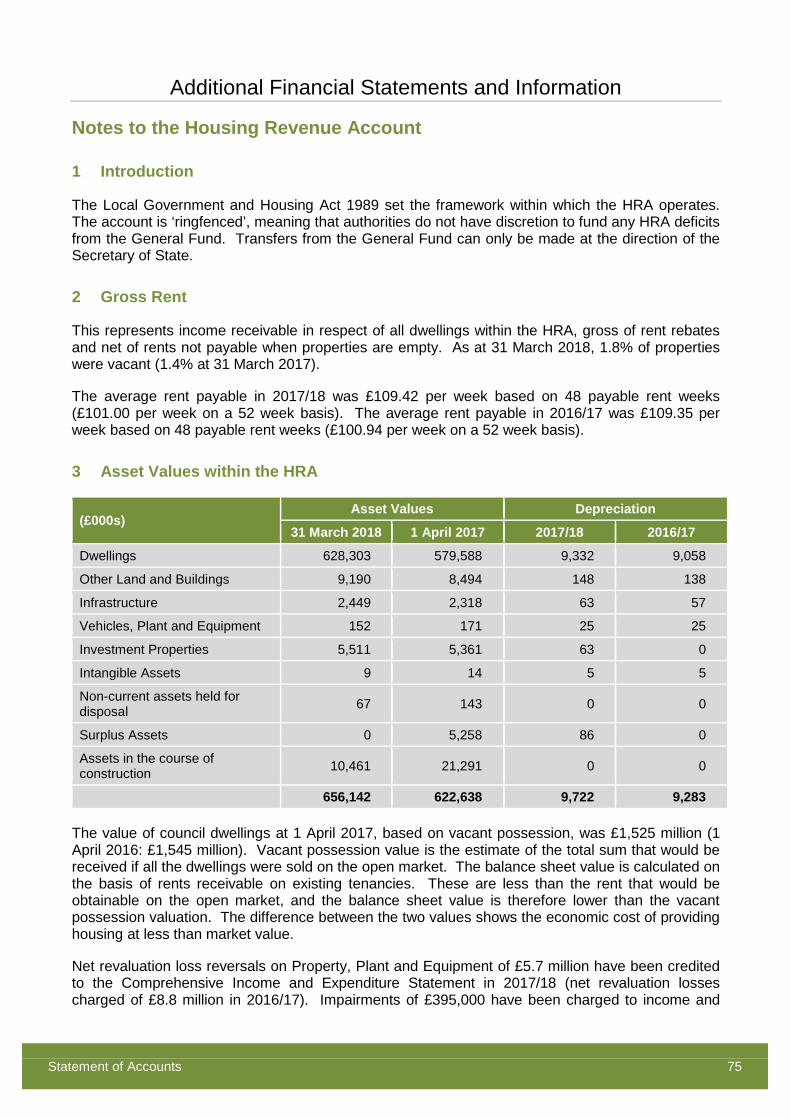
Additional Financial Statements and Information
Statement of Accounts 75
Notes to the Housing Revenue Account
1 Introduction
The Local Government and Housing Act 1989 set the framework within which the HRA operates. The account is ‘ringfenced’, meaning that authorities do not have discretion to fund any HRA deficits from the General Fund. Transfers from the General Fund can only be made at the direction of the Secretary of State.
2 Gross Rent
This represents income receivable in respect of all dwellings within the HRA, gross of rent rebates and net of rents not payable when properties are empty. As at 31 March 2018, 1.8% of properties were vacant (1.4% at 31 March 2017). The average rent payable in 2017/18 was £109.42 per week based on 48 payable rent weeks (£101.00 per week on a 52 week basis). The average rent payable in 2016/17 was £109.35 per week based on 48 payable rent weeks (£100.94 per week on a 52 week basis).
3 Asset Values within the HRA
(£000s) Asset Values Depreciation
31 March 2018 1 April 2017 2017/18 2016/17
Dwellings 628,303 579,588 9,332 9,058
Other Land and Buildings 9,190 8,494 148 138
Infrastructure 2,449 2,318 63 57
Vehicles, Plant and Equipment 152 171 25 25
Investment Properties 5,511 5,361 63 0
Intangible Assets 9 14 5 5
Non-current assets held for disposal 67 143 0 0
Surplus Assets 0 5,258 86 0
Assets in the course of construction 10,461 21,291 0 0
656,142 622,638 9,722 9,283 The value of council dwellings at 1 April 2017, based on vacant possession, was £1,525 million (1 April 2016: £1,545 million). Vacant possession value is the estimate of the total sum that would be received if all the dwellings were sold on the open market. The balance sheet value is calculated on the basis of rents receivable on existing tenancies. These are less than the rent that would be obtainable on the open market, and the balance sheet value is therefore lower than the vacant possession valuation. The difference between the two values shows the economic cost of providing housing at less than market value. Net revaluation loss reversals on Property, Plant and Equipment of £5.7 million have been credited to the Comprehensive Income and Expenditure Statement in 2017/18 (net revaluation losses charged of £8.8 million in 2016/17). Impairments of £395,000 have been charged to income and
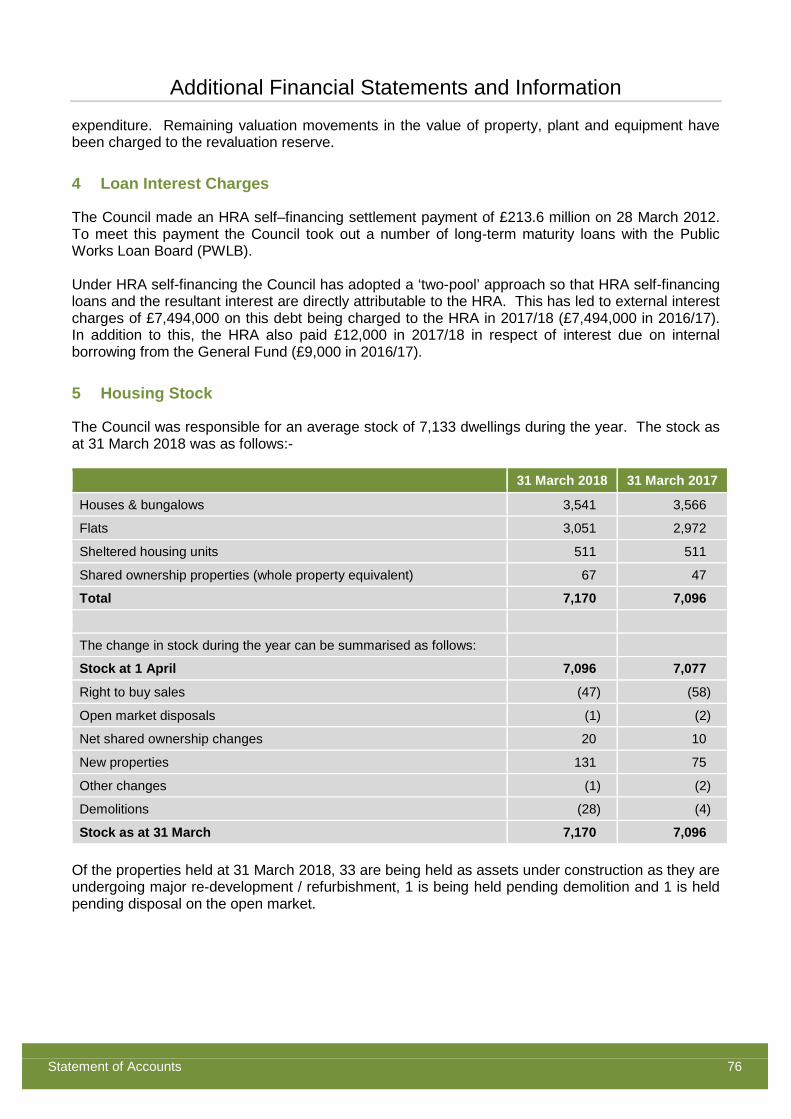
Additional Financial Statements and Information
Statement of Accounts 76
expenditure. Remaining valuation movements in the value of property, plant and equipment have been charged to the revaluation reserve.
4 Loan Interest Charges
The Council made an HRA self–financing settlement payment of £213.6 million on 28 March 2012. To meet this payment the Council took out a number of long-term maturity loans with the Public Works Loan Board (PWLB). Under HRA self-financing the Council has adopted a ‘two-pool’ approach so that HRA self-financing loans and the resultant interest are directly attributable to the HRA. This has led to external interest charges of £7,494,000 on this debt being charged to the HRA in 2017/18 (£7,494,000 in 2016/17). In addition to this, the HRA also paid £12,000 in 2017/18 in respect of interest due on internal borrowing from the General Fund (£9,000 in 2016/17).
5 Housing Stock
The Council was responsible for an average stock of 7,133 dwellings during the year. The stock as at 31 March 2018 was as follows:-
31 March 2018 31 March 2017
Houses & bungalows 3,541 3,566
Flats 3,051 2,972
Sheltered housing units 511 511
Shared ownership properties (whole property equivalent) 67 47
Total 7,170 7,096
The change in stock during the year can be summarised as follows:
Stock at 1 April 7,096 7,077
Right to buy sales (47) (58)
Open market disposals (1) (2)
Net shared ownership changes 20 10
New properties 131 75
Other changes (1) (2)
Demolitions (28) (4)
Stock as at 31 March 7,170 7,096 Of the properties held at 31 March 2018, 33 are being held as assets under construction as they are undergoing major re-development / refurbishment, 1 is being held pending demolition and 1 is held pending disposal on the open market.
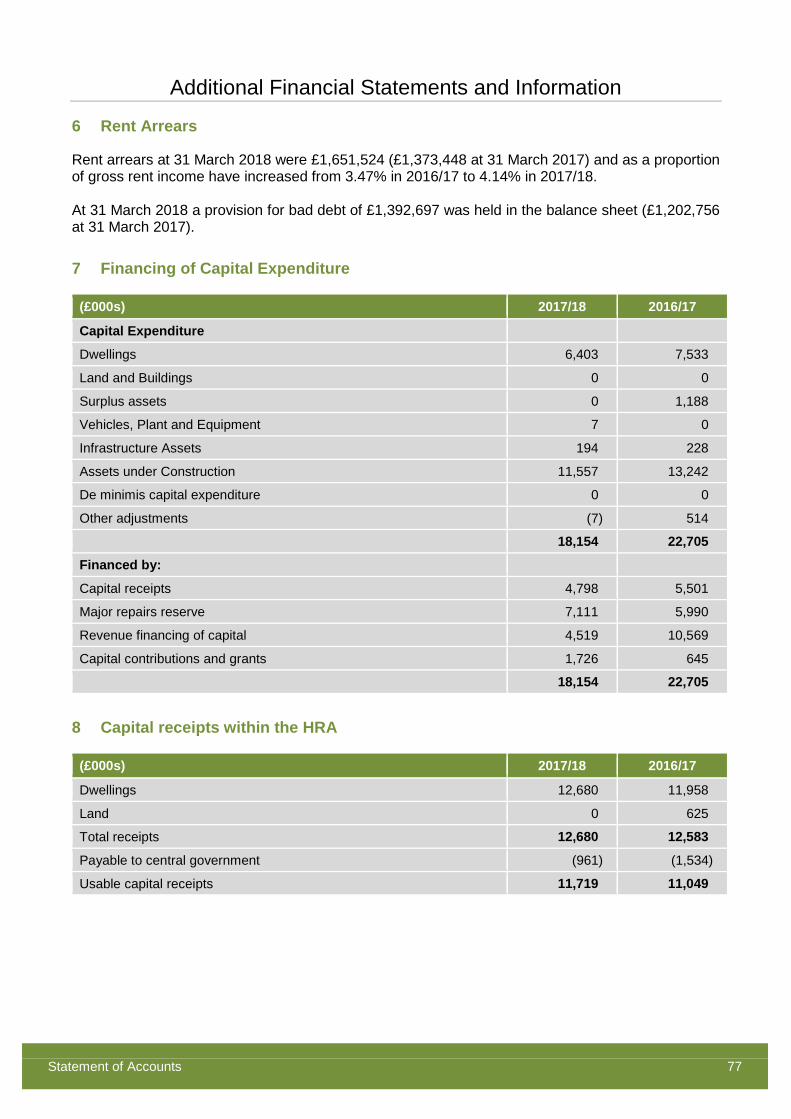
Additional Financial Statements and Information
Statement of Accounts 77
6 Rent Arrears
Rent arrears at 31 March 2018 were £1,651,524 (£1,373,448 at 31 March 2017) and as a proportion of gross rent income have increased from 3.47% in 2016/17 to 4.14% in 2017/18. At 31 March 2018 a provision for bad debt of £1,392,697 was held in the balance sheet (£1,202,756 at 31 March 2017).
7 Financing of Capital Expenditure
(£000s) 2017/18 2016/17
Capital Expenditure
Dwellings 6,403 7,533
Land and Buildings 0 0
Surplus assets 0 1,188
Vehicles, Plant and Equipment 7 0
Infrastructure Assets 194 228
Assets under Construction 11,557 13,242
De minimis capital expenditure 0 0
Other adjustments (7) 514
18,154 22,705
Financed by:
Capital receipts 4,798 5,501
Major repairs reserve 7,111 5,990
Revenue financing of capital 4,519 10,569
Capital contributions and grants 1,726 645
18,154 22,705
8 Capital receipts within the HRA
(£000s) 2017/18 2016/17
Dwellings 12,680 11,958
Land 0 625
Total receipts 12,680 12,583
Payable to central government (961) (1,534)
Usable capital receipts 11,719 11,049
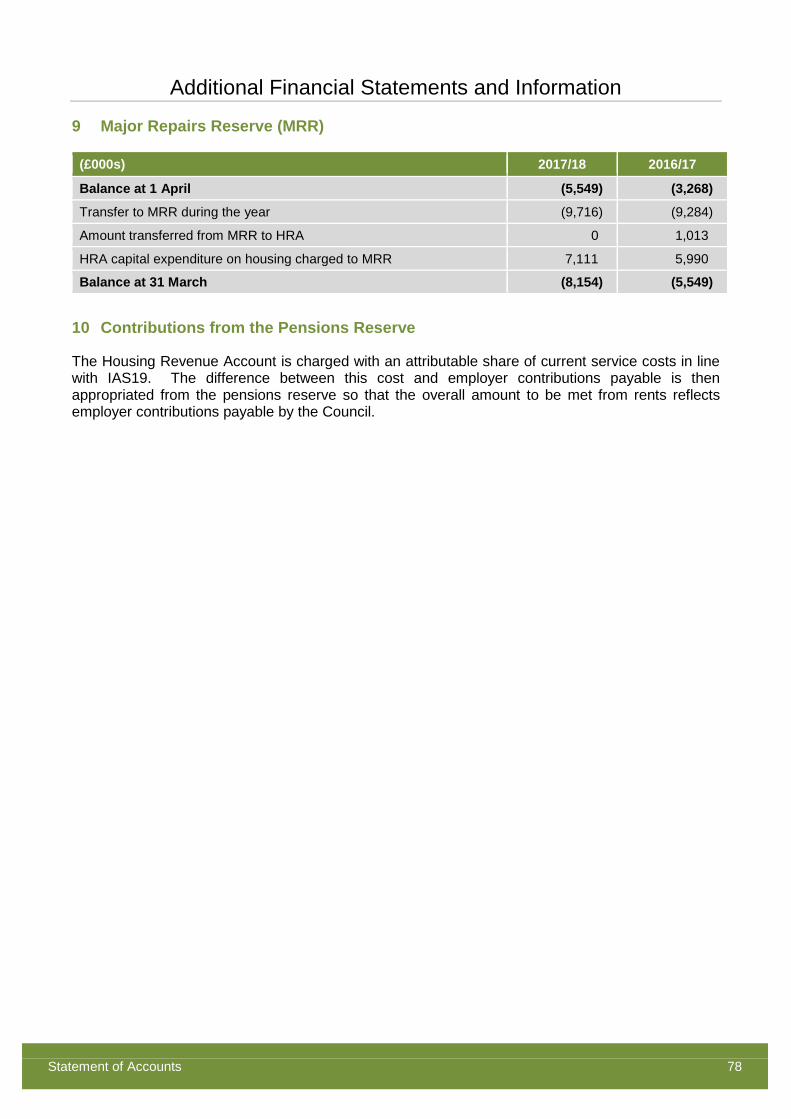
Additional Financial Statements and Information
Statement of Accounts 78
9 Major Repairs Reserve (MRR)
(£000s) 2017/18 2016/17
Balance at 1 April (5,549) (3,268)
Transfer to MRR during the year (9,716) (9,284)
Amount transferred from MRR to HRA 0 1,013
HRA capital expenditure on housing charged to MRR 7,111 5,990
Balance at 31 March (8,154) (5,549)
10 Contributions from the Pensions Reserve
The Housing Revenue Account is charged with an attributable share of current service costs in line with IAS19. The difference between this cost and employer contributions payable is then appropriated from the pensions reserve so that the overall amount to be met from rents reflects employer contributions payable by the Council.
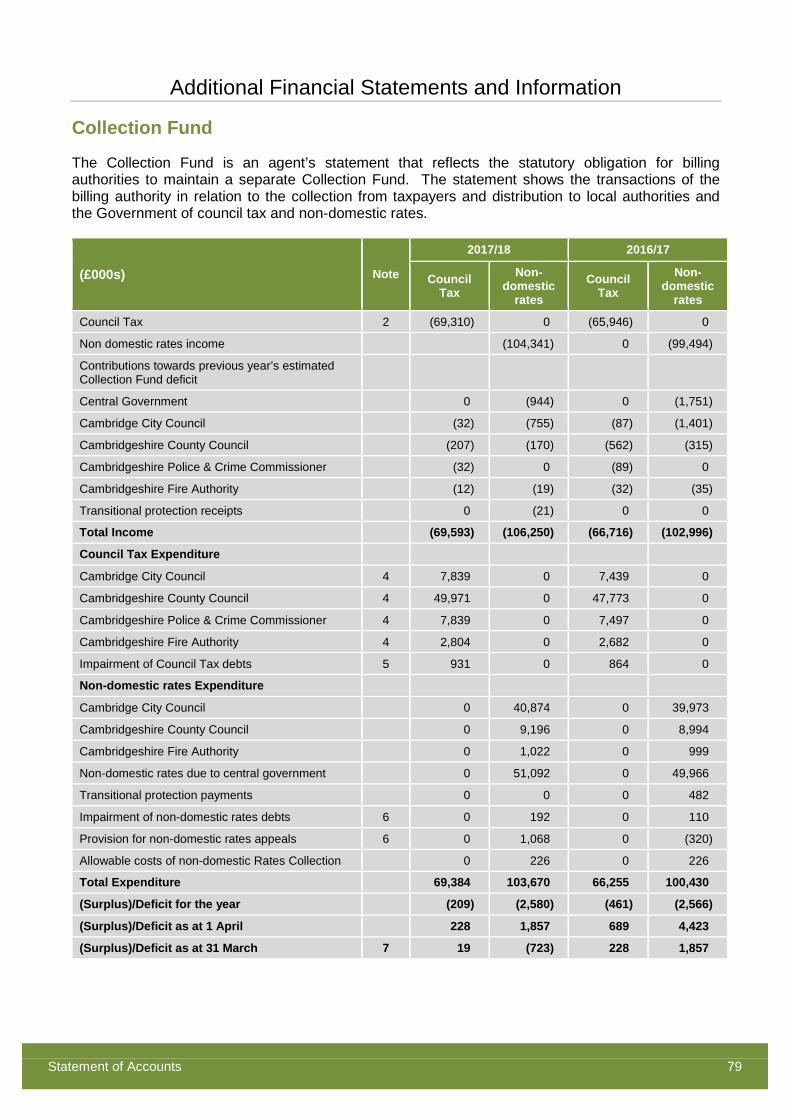
Additional Financial Statements and Information
Statement of Accounts 79
Collection Fund
The Collection Fund is an agent’s statement that reflects the statutory obligation for billing authorities to maintain a separate Collection Fund. The statement shows the transactions of the billing authority in relation to the collection from taxpayers and distribution to local authorities and the Government of council tax and non-domestic rates.
(£000s) Note
2017/18 2016/17
Council Tax
Non-domestic
rates Council
Tax Non-
domestic rates
Council Tax 2 (69,310) 0 (65,946) 0
Non domestic rates income (104,341) 0 (99,494)
Contributions towards previous year’s estimated Collection Fund deficit
Central Government 0 (944) 0 (1,751)
Cambridge City Council (32) (755) (87) (1,401)
Cambridgeshire County Council (207) (170) (562) (315)
Cambridgeshire Police & Crime Commissioner (32) 0 (89) 0
Cambridgeshire Fire Authority (12) (19) (32) (35)
Transitional protection receipts 0 (21) 0 0
Total Income (69,593) (106,250) (66,716) (102,996)
Council Tax Expenditure
Cambridge City Council 4 7,839 0 7,439 0
Cambridgeshire County Council 4 49,971 0 47,773 0
Cambridgeshire Police & Crime Commissioner 4 7,839 0 7,497 0
Cambridgeshire Fire Authority 4 2,804 0 2,682 0
Impairment of Council Tax debts 5 931 0 864 0
Non-domestic rates Expenditure
Cambridge City Council 0 40,874 0 39,973
Cambridgeshire County Council 0 9,196 0 8,994
Cambridgeshire Fire Authority 0 1,022 0 999
Non-domestic rates due to central government 0 51,092 0 49,966
Transitional protection payments 0 0 0 482
Impairment of non-domestic rates debts 6 0 192 0 110
Provision for non-domestic rates appeals 6 0 1,068 0 (320)
Allowable costs of non-domestic Rates Collection 0 226 0 226
Total Expenditure 69,384 103,670 66,255 100,430
(Surplus)/Deficit for the year (209) (2,580) (461) (2,566)
(Surplus)/Deficit as at 1 April 228 1,857 689 4,423
(Surplus)/Deficit as at 31 March 7 19 (723) 228 1,857
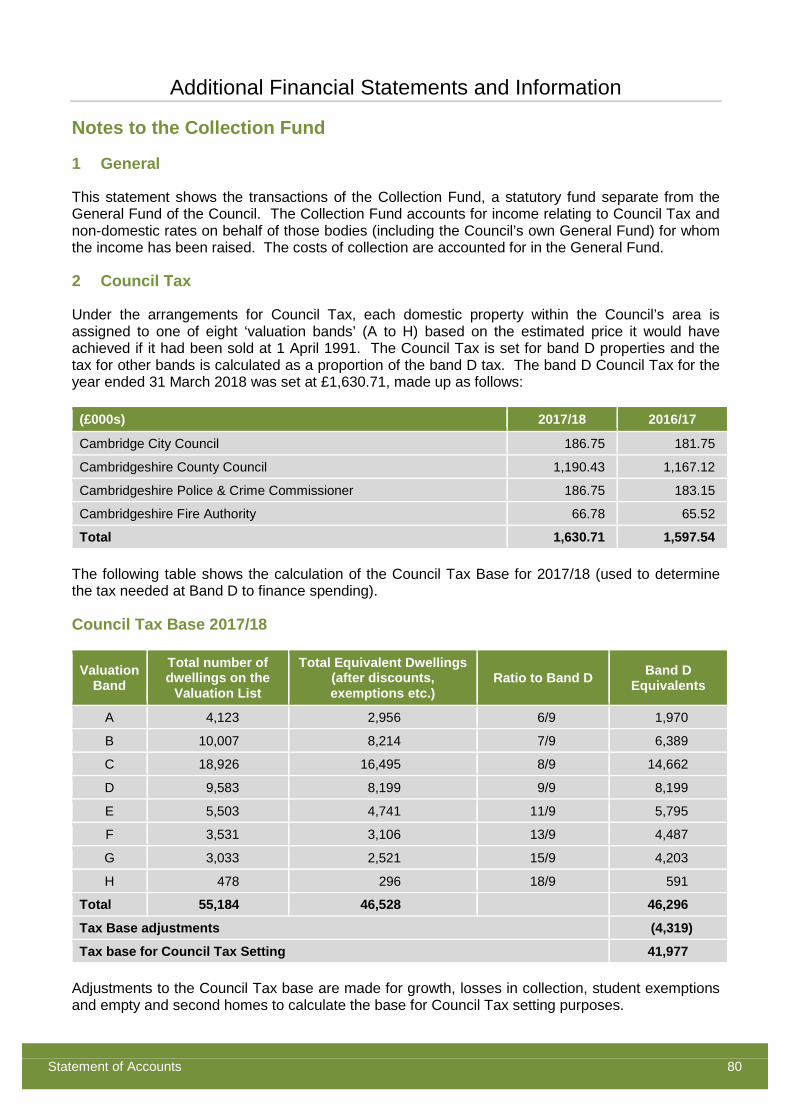
Additional Financial Statements and Information
Statement of Accounts 80
Notes to the Collection Fund
1 General
This statement shows the transactions of the Collection Fund, a statutory fund separate from the General Fund of the Council. The Collection Fund accounts for income relating to Council Tax and non-domestic rates on behalf of those bodies (including the Council’s own General Fund) for whom the income has been raised. The costs of collection are accounted for in the General Fund.
2 Council Tax
Under the arrangements for Council Tax, each domestic property within the Council’s area is assigned to one of eight ‘valuation bands’ (A to H) based on the estimated price it would have achieved if it had been sold at 1 April 1991. The Council Tax is set for band D properties and the tax for other bands is calculated as a proportion of the band D tax. The band D Council Tax for the year ended 31 March 2018 was set at £1,630.71, made up as follows:
(£000s) 2017/18 2016/17
Cambridge City Council 186.75 181.75
Cambridgeshire County Council 1,190.43 1,167.12
Cambridgeshire Police & Crime Commissioner 186.75 183.15
Cambridgeshire Fire Authority 66.78 65.52
Total 1,630.71 1,597.54
The following table shows the calculation of the Council Tax Base for 2017/18 (used to determine the tax needed at Band D to finance spending).
Council Tax Base 2017/18
Valuation Band
Total number of dwellings on the
Valuation List
Total Equivalent Dwellings (after discounts, exemptions etc.)
Ratio to Band D Band D Equivalents
A 4,123 2,956 6/9 1,970
B 10,007 8,214 7/9 6,389
C 18,926 16,495 8/9 14,662
D 9,583 8,199 9/9 8,199
E 5,503 4,741 11/9 5,795
F 3,531 3,106 13/9 4,487
G 3,033 2,521 15/9 4,203
H 478 296 18/9 591
Total 55,184 46,528 46,296
Tax Base adjustments (4,319)
Tax base for Council Tax Setting 41,977
Adjustments to the Council Tax base are made for growth, losses in collection, student exemptions and empty and second homes to calculate the base for Council Tax setting purposes.
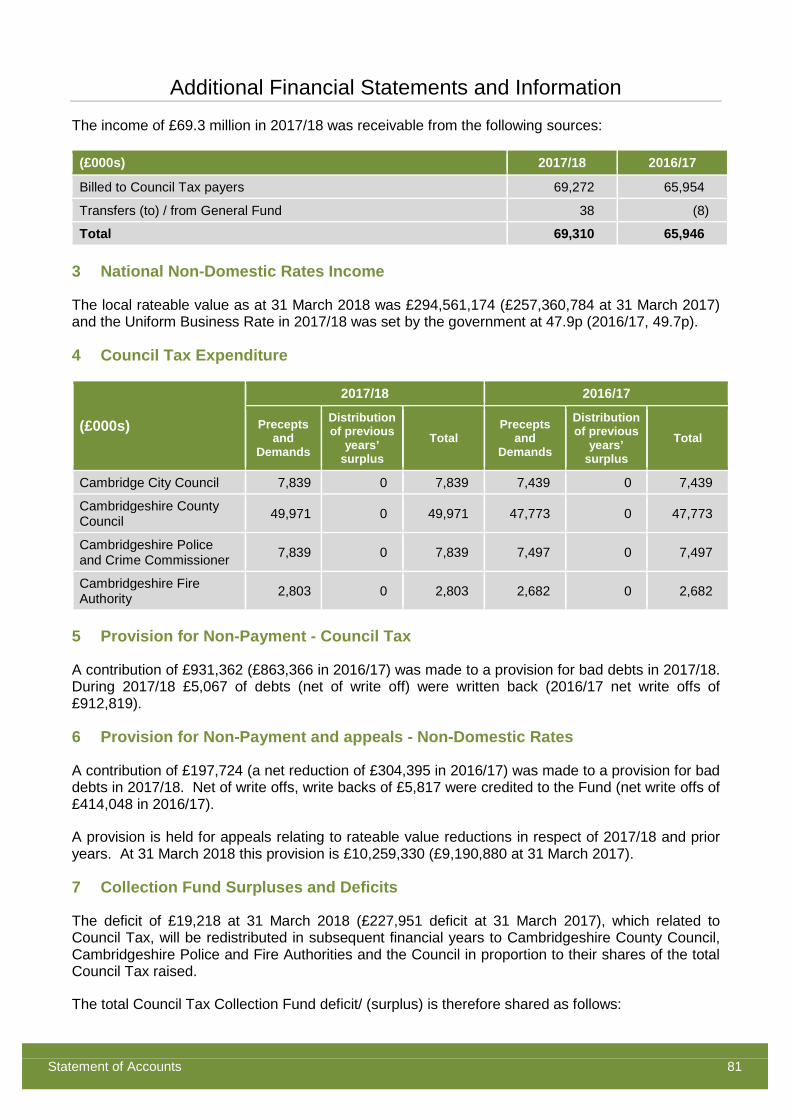
Additional Financial Statements and Information
Statement of Accounts 81
The income of £69.3 million in 2017/18 was receivable from the following sources:
(£000s) 2017/18 2016/17
Billed to Council Tax payers 69,272 65,954
Transfers (to) / from General Fund 38 (8)
Total 69,310 65,946
3 National Non-Domestic Rates Income
The local rateable value as at 31 March 2018 was £294,561,174 (£257,360,784 at 31 March 2017) and the Uniform Business Rate in 2017/18 was set by the government at 47.9p (2016/17, 49.7p).
4 Council Tax Expenditure
(£000s)
2017/18 2016/17
Precepts and
Demands
Distribution of previous
years’ surplus
Total Precepts
and Demands
Distribution of previous
years’ surplus
Total
Cambridge City Council 7,839 0 7,839 7,439 0 7,439
Cambridgeshire County Council 49,971 0 49,971 47,773 0 47,773
Cambridgeshire Police and Crime Commissioner 7,839 0 7,839 7,497 0 7,497
Cambridgeshire Fire Authority 2,803 0 2,803 2,682 0 2,682
5 Provision for Non-Payment - Council Tax
A contribution of £931,362 (£863,366 in 2016/17) was made to a provision for bad debts in 2017/18. During 2017/18 £5,067 of debts (net of write off) were written back (2016/17 net write offs of £912,819).
6 Provision for Non-Payment and appeals - Non-Domestic Rates
A contribution of £197,724 (a net reduction of £304,395 in 2016/17) was made to a provision for bad debts in 2017/18. Net of write offs, write backs of £5,817 were credited to the Fund (net write offs of £414,048 in 2016/17).
A provision is held for appeals relating to rateable value reductions in respect of 2017/18 and prior years. At 31 March 2018 this provision is £10,259,330 (£9,190,880 at 31 March 2017).
7 Collection Fund Surpluses and Deficits
The deficit of £19,218 at 31 March 2018 (£227,951 deficit at 31 March 2017), which related to Council Tax, will be redistributed in subsequent financial years to Cambridgeshire County Council, Cambridgeshire Police and Fire Authorities and the Council in proportion to their shares of the total Council Tax raised.
The total Council Tax Collection Fund deficit/ (surplus) is therefore shared as follows:
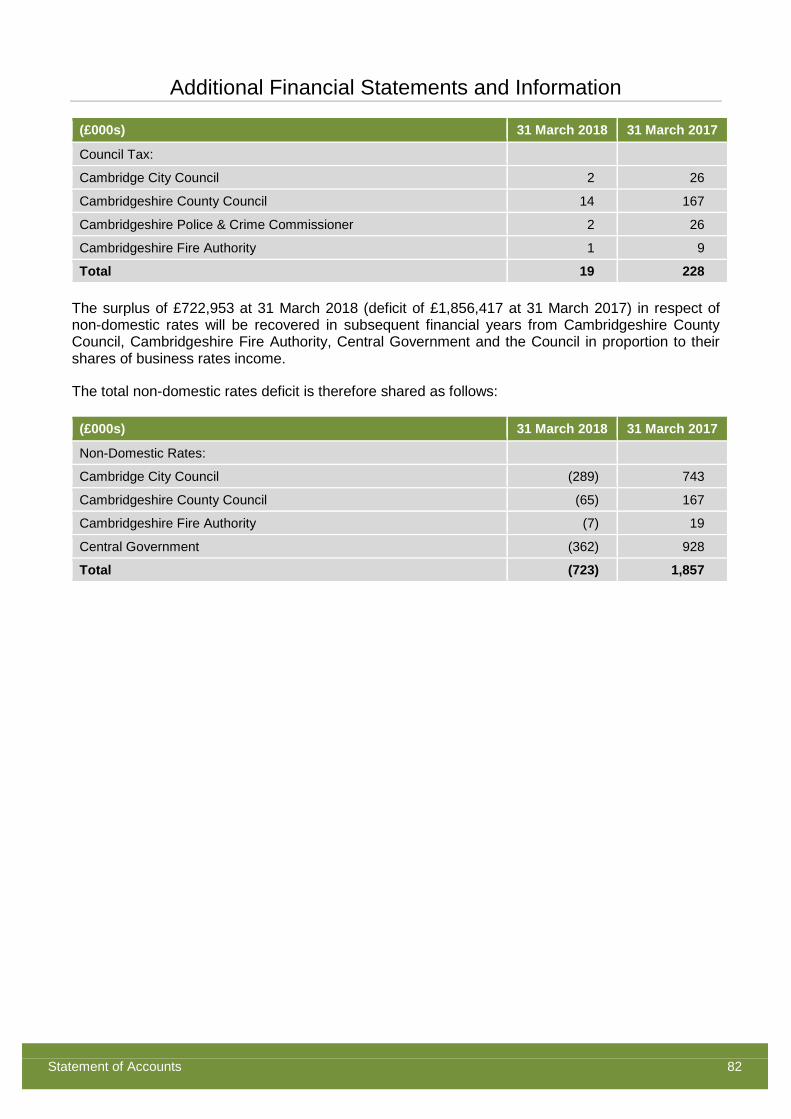
Additional Financial Statements and Information
Statement of Accounts 82
(£000s) 31 March 2018 31 March 2017
Council Tax:
Cambridge City Council 2 26
Cambridgeshire County Council 14 167
Cambridgeshire Police & Crime Commissioner 2 26
Cambridgeshire Fire Authority 1 9
Total 19 228
The surplus of £722,953 at 31 March 2018 (deficit of £1,856,417 at 31 March 2017) in respect of non-domestic rates will be recovered in subsequent financial years from Cambridgeshire County Council, Cambridgeshire Fire Authority, Central Government and the Council in proportion to their shares of business rates income.
The total non-domestic rates deficit is therefore shared as follows:
(£000s) 31 March 2018 31 March 2017
Non-Domestic Rates:
Cambridge City Council (289) 743
Cambridgeshire County Council (65) 167
Cambridgeshire Fire Authority (7) 19
Central Government (362) 928
Total (723) 1,857
Statement of Accounts 83
GROUP FINANCIAL STATEMENTS
Group Financial Statements
Statement of Accounts 84
Group Financial Statements for the year ended 31 March 2018
Introduction
In order to provide a full picture of the Council’s economic activities and financial position, Group Accounts are presented in addition to the Council’s single entity financial statements and have been prepared in accordance with the Code of Practice on Local Authority Accounting (The Code). They comprise:
♦ Group Movement in Reserves Statement ♦ Group Comprehensive Income and Expenditure Statement ♦ Group Balance Sheet ♦ Group Cash Flow Statement
These statements are set out on the following pages, together with accompanying disclosure notes. Disclosure notes have only been restated in the group accounts section where they are materially different from those of the Council’s single entity accounts.
In addition to the financial performance of the Council, the Group accounts comprise:
♦ Cambridge City Housing Company Limited ♦ Cambridge Investment Partnership LLP
Cambridge City Housing Company Limited (CCHC) was incorporated on 15 February 2016 and began trading in May 2016.
The objective of the company is to provide and manage housing that is affordable for those in housing need and any other property related activity in Cambridge and neighbouring districts that also generates a financial return for the Council.
As the company is wholly owned by Cambridge City Council, it has been consolidated as a subsidiary in the group accounts.
Cambridge Investment Partnership LLP (CIP) was incorporated on 22 December 2016. CIP is a Joint Venture between the Council and Hill Investment Partnerships formed with the objective of redeveloping sites in Cambridge for housing, including the provision of affordable housing. CIP’s first major project is the redevelopment of the Council’s former depot on Mill Road. As applicable the Council’s share (50%) of CIP’s results are incorporated into the group financial statements.
Accounting Policies
The results of CCHC and CIP are adjusted where applicable to align their accounting policies with those of the Council. Both entities have a financial year end of 31 March.
CCHC holds properties for rent as Investment Properties in its accounts, however under The Code these properties fall to be recognised as Property, Plant and Equipment. Consolidation adjustments have therefore been made to charge depreciation and deal with revaluations appropriately.
As a subsidiary, the accounts of CCHC have been consolidated with those of the Council on a line by line basis, and any balances and transactions between parties have been eliminated in full. CCHC expenditure and income, adjusted for transactions with the council, is included on the relevant services lines in the Comprehensive Income and Expenditure Statement; and balance
Group Financial Statements
Statement of Accounts 85
sheet values are similarly incorporated into the relevant heading of the Balance Sheet, removing balances owed between the two parties.
Although CIP’s financial statements cover the period from incorporation until 31 March 2018 (so a period of approximately 15 months) there were no material transactions in CIP prior to 1 April 2017.
In line with the requirements of The Code, the Council accounts for its interest in CIP using the equity method. This requires an investor to bring the investment into the Group Balance Sheet at cost and then to adjust the carrying value by the change in the investor’s share of net assets. The share of CIP’s operating results are included in the Group Income and Expenditure Statement. Unrealised profits on transactions between the Joint Venture are also eliminated to the extent that they do not reduce the carrying value of the investment below zero.
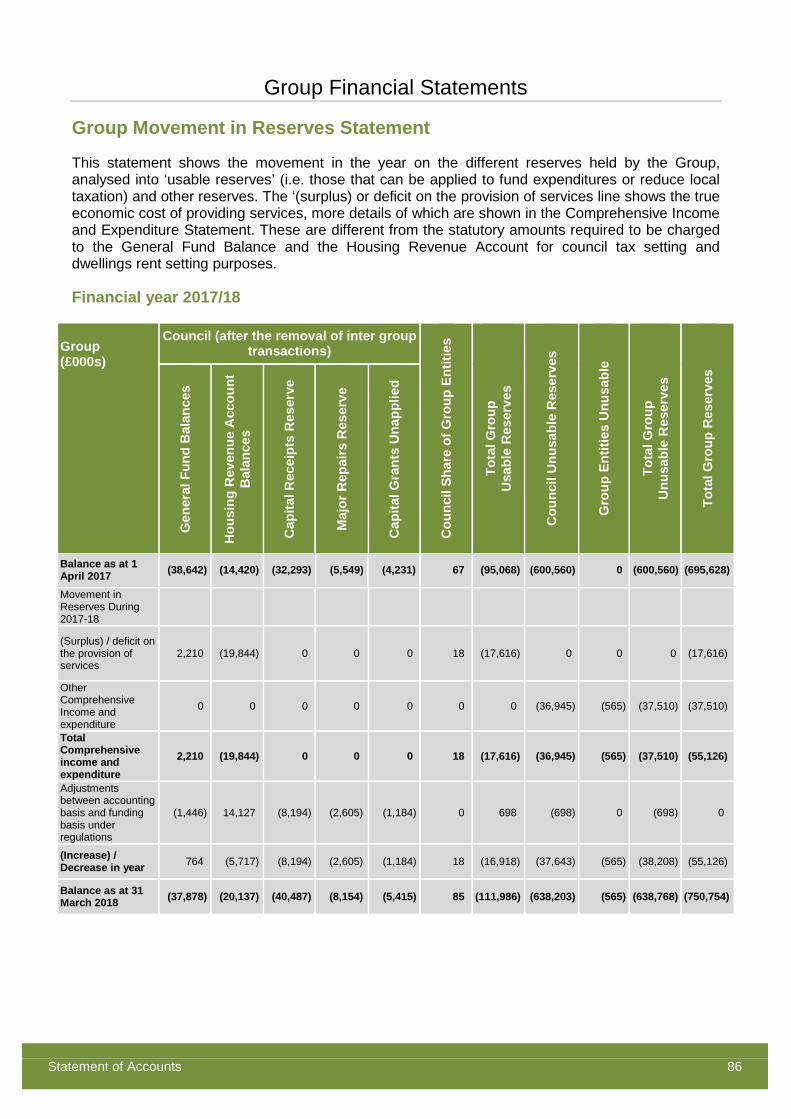
Group Financial Statements
Statement of Accounts 86
Group Movement in Reserves Statement
This statement shows the movement in the year on the different reserves held by the Group, analysed into ‘usable reserves’ (i.e. those that can be applied to fund expenditures or reduce local taxation) and other reserves. The ‘(surplus) or deficit on the provision of services line shows the true economic cost of providing services, more details of which are shown in the Comprehensive Income and Expenditure Statement. These are different from the statutory amounts required to be charged to the General Fund Balance and the Housing Revenue Account for council tax setting and dwellings rent setting purposes.
Financial year 2017/18
Group (£000s)
Council (after the removal of inter group transactions)
Cou
ncil
Shar
e of
Gro
up E
ntiti
es
Tota
l Gro
up
Usa
ble
Res
erve
s
Cou
ncil
Unu
sabl
e R
eser
ves
Gro
up E
ntiti
es U
nusa
ble
Tota
l Gro
up
Unu
sabl
e R
eser
ves
Tota
l Gro
up R
eser
ves
Gen
eral
Fun
d B
alan
ces
Hou
sing
Rev
enue
Acc
ount
B
alan
ces
Cap
ital R
ecei
pts
Res
erve
Maj
or R
epai
rs R
eser
ve
Cap
ital G
rant
s U
napp
lied
Balance as at 1 April 2017 (38,642) (14,420) (32,293) (5,549) (4,231) 67 (95,068) (600,560) 0 (600,560) (695,628)
Movement in Reserves During 2017-18
(Surplus) / deficit on the provision of services
2,210 (19,844) 0 0 0 18 (17,616) 0 0 0 (17,616)
Other Comprehensive Income and expenditure
0 0 0 0 0 0 0 (36,945) (565) (37,510) (37,510)
Total Comprehensive income and expenditure
2,210 (19,844) 0 0 0 18 (17,616) (36,945) (565) (37,510) (55,126)
Adjustments between accounting basis and funding basis under regulations
(1,446) 14,127 (8,194) (2,605) (1,184) 0 698 (698) 0 (698) 0
(Increase) / Decrease in year 764 (5,717) (8,194) (2,605) (1,184) 18 (16,918) (37,643) (565) (38,208) (55,126)
Balance as at 31 March 2018 (37,878) (20,137) (40,487) (8,154) (5,415) 85 (111,986) (638,203) (565) (638,768) (750,754)
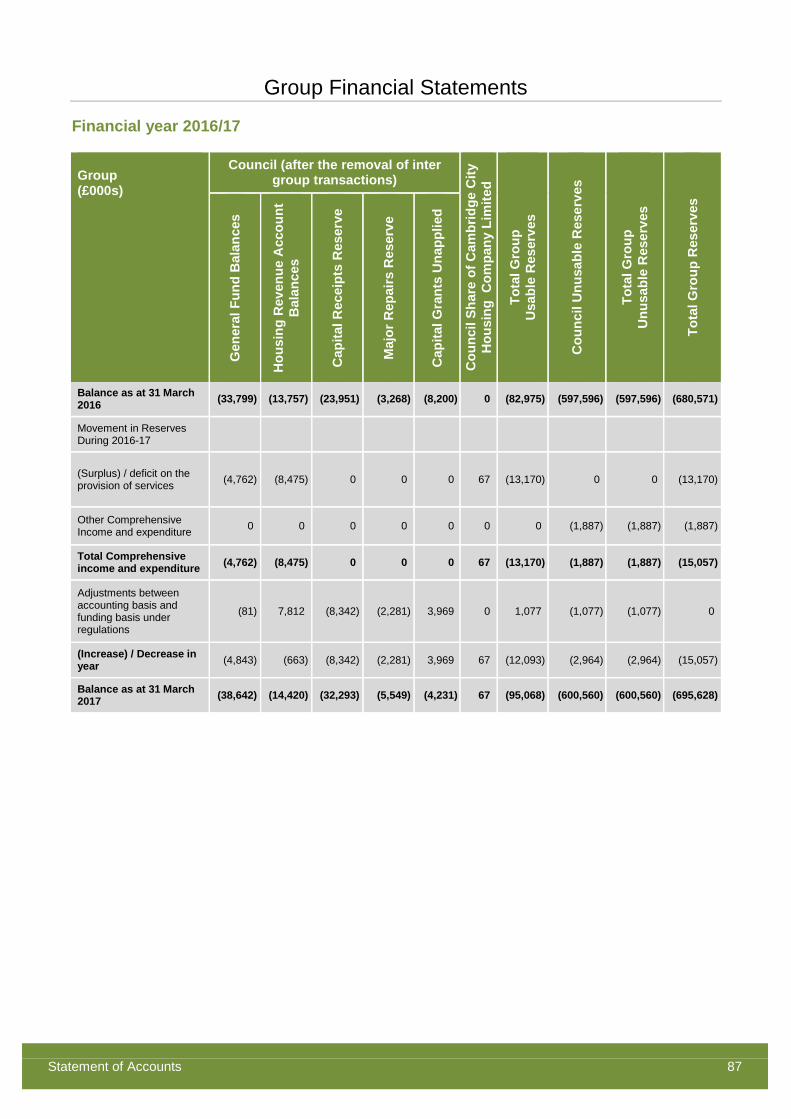
Group Financial Statements
Statement of Accounts 87
Financial year 2016/17
Group (£000s)
Council (after the removal of inter group transactions)
Cou
ncil
Shar
e of
Cam
brid
ge C
ity
Hou
sing
Com
pany
Lim
ited
Tota
l Gro
up
Usa
ble
Res
erve
s
Cou
ncil
Unu
sabl
e R
eser
ves
Tota
l Gro
up
Unu
sabl
e R
eser
ves
Tota
l Gro
up R
eser
ves
Gen
eral
Fun
d B
alan
ces
Hou
sing
Rev
enue
Acc
ount
B
alan
ces
Cap
ital R
ecei
pts
Res
erve
Maj
or R
epai
rs R
eser
ve
Cap
ital G
rant
s U
napp
lied
Balance as at 31 March 2016 (33,799) (13,757) (23,951) (3,268) (8,200) 0 (82,975) (597,596) (597,596) (680,571)
Movement in Reserves During 2016-17
(Surplus) / deficit on the provision of services (4,762) (8,475) 0 0 0 67 (13,170) 0 0 (13,170)
Other Comprehensive Income and expenditure 0 0 0 0 0 0 0 (1,887) (1,887) (1,887)
Total Comprehensive income and expenditure (4,762) (8,475) 0 0 0 67 (13,170) (1,887) (1,887) (15,057)
Adjustments between accounting basis and funding basis under regulations
(81) 7,812 (8,342) (2,281) 3,969 0 1,077 (1,077) (1,077) 0
(Increase) / Decrease in year (4,843) (663) (8,342) (2,281) 3,969 67 (12,093) (2,964) (2,964) (15,057)
Balance as at 31 March 2017 (38,642) (14,420) (32,293) (5,549) (4,231) 67 (95,068) (600,560) (600,560) (695,628)
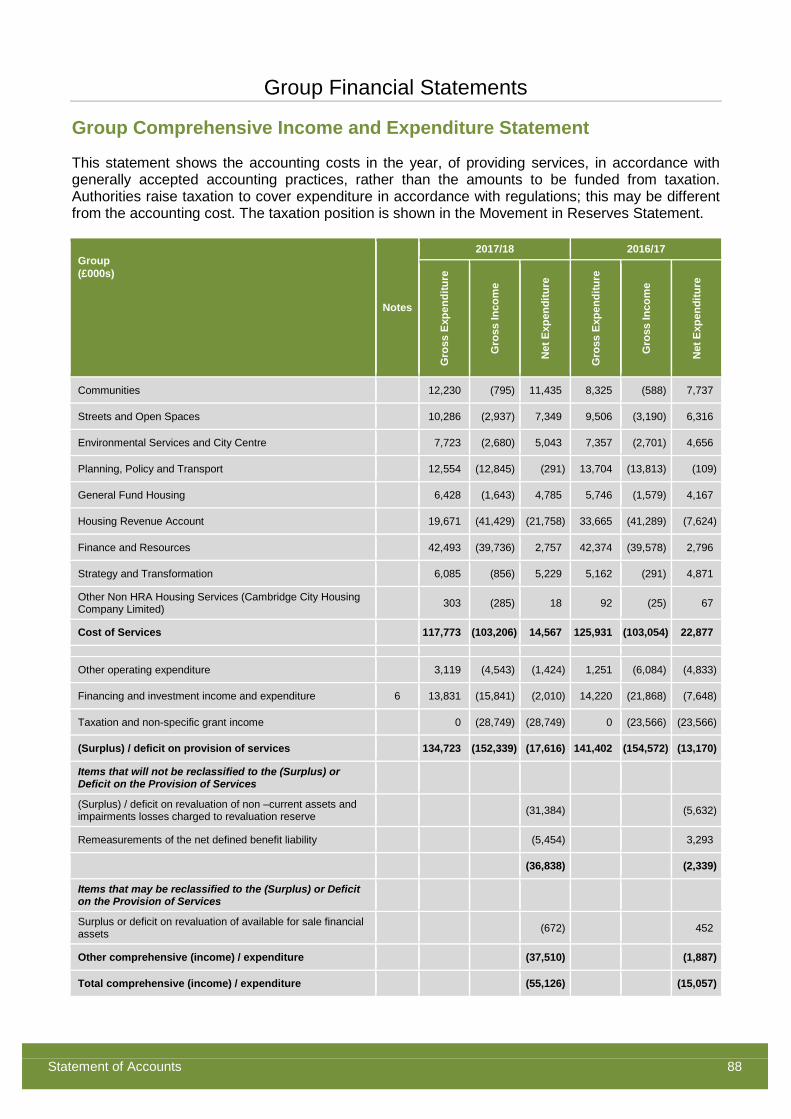
Group Financial Statements
Statement of Accounts 88
Group Comprehensive Income and Expenditure Statement
This statement shows the accounting costs in the year, of providing services, in accordance with generally accepted accounting practices, rather than the amounts to be funded from taxation. Authorities raise taxation to cover expenditure in accordance with regulations; this may be different from the accounting cost. The taxation position is shown in the Movement in Reserves Statement.
Group (£000s)
Notes
2017/18 2016/17
Gro
ss E
xpen
ditu
re
Gro
ss In
com
e
Net
Exp
endi
ture
Gro
ss E
xpen
ditu
re
Gro
ss In
com
e
Net
Exp
endi
ture
Communities 12,230 (795) 11,435 8,325 (588) 7,737
Streets and Open Spaces 10,286 (2,937) 7,349 9,506 (3,190) 6,316
Environmental Services and City Centre 7,723 (2,680) 5,043 7,357 (2,701) 4,656
Planning, Policy and Transport 12,554 (12,845) (291) 13,704 (13,813) (109)
General Fund Housing 6,428 (1,643) 4,785 5,746 (1,579) 4,167
Housing Revenue Account 19,671 (41,429) (21,758) 33,665 (41,289) (7,624)
Finance and Resources 42,493 (39,736) 2,757 42,374 (39,578) 2,796
Strategy and Transformation 6,085 (856) 5,229 5,162 (291) 4,871
Other Non HRA Housing Services (Cambridge City Housing Company Limited) 303 (285) 18 92 (25) 67
Cost of Services 117,773 (103,206) 14,567 125,931 (103,054) 22,877
Other operating expenditure 3,119 (4,543) (1,424) 1,251 (6,084) (4,833)
Financing and investment income and expenditure 6 13,831 (15,841) (2,010) 14,220 (21,868) (7,648)
Taxation and non-specific grant income 0 (28,749) (28,749) 0 (23,566) (23,566)
(Surplus) / deficit on provision of services 134,723 (152,339) (17,616) 141,402 (154,572) (13,170)
Items that will not be reclassified to the (Surplus) or Deficit on the Provision of Services
(Surplus) / deficit on revaluation of non –current assets and impairments losses charged to revaluation reserve (31,384) (5,632)
Remeasurements of the net defined benefit liability (5,454) 3,293
(36,838) (2,339)
Items that may be reclassified to the (Surplus) or Deficit on the Provision of Services
Surplus or deficit on revaluation of available for sale financial assets (672) 452
Other comprehensive (income) / expenditure (37,510) (1,887)
Total comprehensive (income) / expenditure (55,126) (15,057)
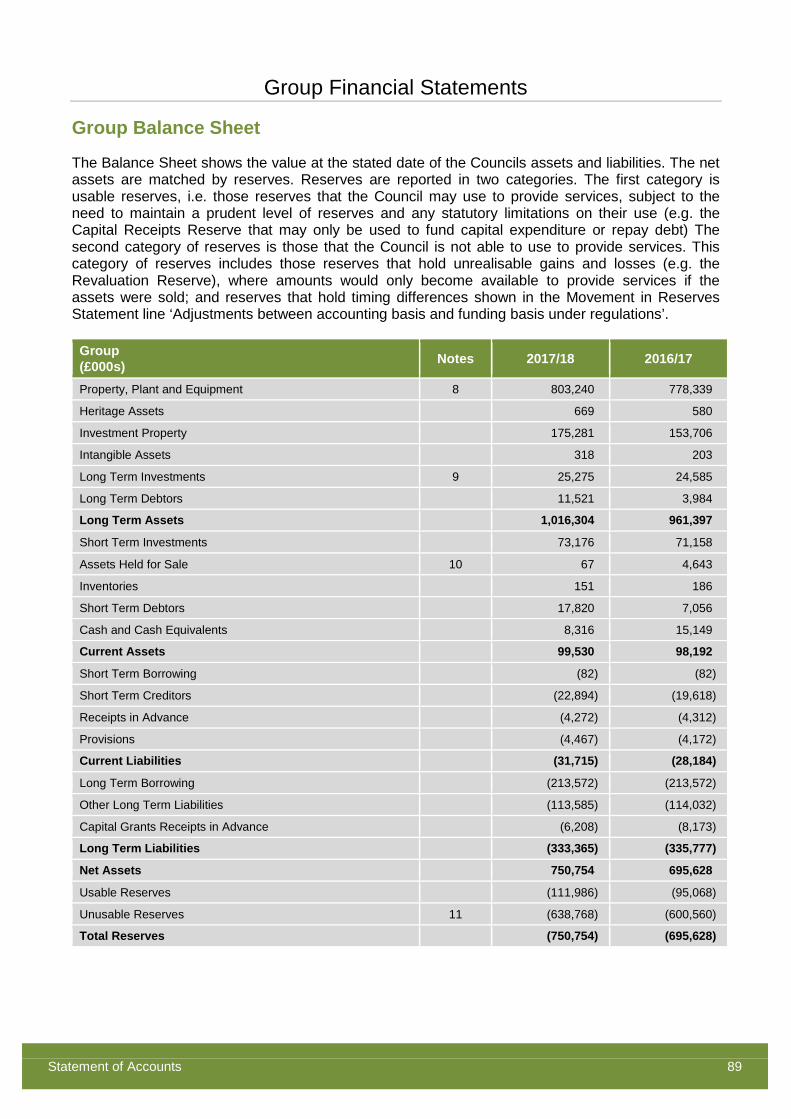
Group Financial Statements
Statement of Accounts 89
Group Balance Sheet
The Balance Sheet shows the value at the stated date of the Councils assets and liabilities. The net assets are matched by reserves. Reserves are reported in two categories. The first category is usable reserves, i.e. those reserves that the Council may use to provide services, subject to the need to maintain a prudent level of reserves and any statutory limitations on their use (e.g. the Capital Receipts Reserve that may only be used to fund capital expenditure or repay debt) The second category of reserves is those that the Council is not able to use to provide services. This category of reserves includes those reserves that hold unrealisable gains and losses (e.g. the Revaluation Reserve), where amounts would only become available to provide services if the assets were sold; and reserves that hold timing differences shown in the Movement in Reserves Statement line ‘Adjustments between accounting basis and funding basis under regulations’.
Group (£000s) Notes 2017/18 2016/17
Property, Plant and Equipment 8 803,240 778,339
Heritage Assets 669 580
Investment Property 175,281 153,706
Intangible Assets 318 203
Long Term Investments 9 25,275 24,585
Long Term Debtors 11,521 3,984
Long Term Assets 1,016,304 961,397
Short Term Investments 73,176 71,158
Assets Held for Sale 10 67 4,643
Inventories 151 186
Short Term Debtors 17,820 7,056
Cash and Cash Equivalents 8,316 15,149
Current Assets 99,530 98,192
Short Term Borrowing (82) (82)
Short Term Creditors (22,894) (19,618)
Receipts in Advance (4,272) (4,312)
Provisions (4,467) (4,172)
Current Liabilities (31,715) (28,184)
Long Term Borrowing (213,572) (213,572)
Other Long Term Liabilities (113,585) (114,032)
Capital Grants Receipts in Advance (6,208) (8,173)
Long Term Liabilities (333,365) (335,777)
Net Assets 750,754 695,628
Usable Reserves (111,986) (95,068)
Unusable Reserves 11 (638,768) (600,560)
Total Reserves (750,754) (695,628)
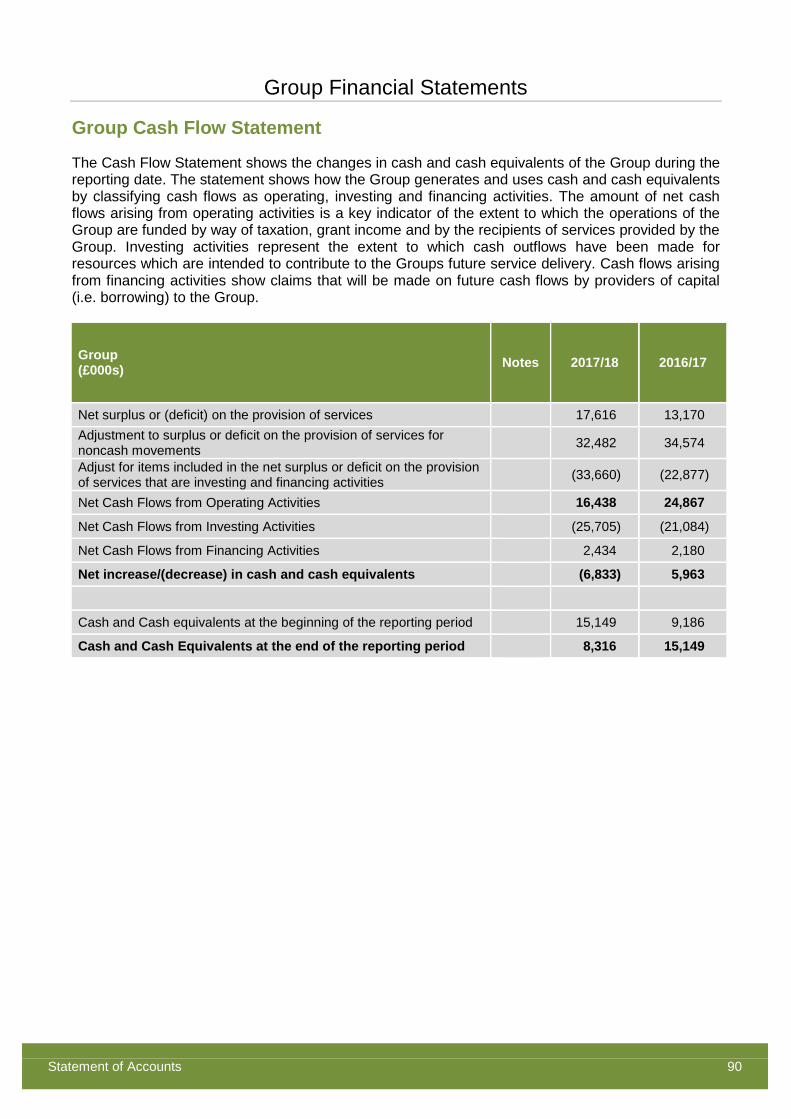
Group Financial Statements
Statement of Accounts 90
Group Cash Flow Statement
The Cash Flow Statement shows the changes in cash and cash equivalents of the Group during the reporting date. The statement shows how the Group generates and uses cash and cash equivalents by classifying cash flows as operating, investing and financing activities. The amount of net cash flows arising from operating activities is a key indicator of the extent to which the operations of the Group are funded by way of taxation, grant income and by the recipients of services provided by the Group. Investing activities represent the extent to which cash outflows have been made for resources which are intended to contribute to the Groups future service delivery. Cash flows arising from financing activities show claims that will be made on future cash flows by providers of capital (i.e. borrowing) to the Group.
Group (£000s) Notes 2017/18 2016/17
Net surplus or (deficit) on the provision of services 17,616 13,170 Adjustment to surplus or deficit on the provision of services for noncash movements 32,482 34,574
Adjust for items included in the net surplus or deficit on the provision of services that are investing and financing activities (33,660) (22,877)
Net Cash Flows from Operating Activities 16,438 24,867
Net Cash Flows from Investing Activities (25,705) (21,084)
Net Cash Flows from Financing Activities 2,434 2,180
Net increase/(decrease) in cash and cash equivalents (6,833) 5,963
Cash and Cash equivalents at the beginning of the reporting period 15,149 9,186
Cash and Cash Equivalents at the end of the reporting period 8,316 15,149
Statement of Accounts 91
NOTES TO THE GROUP FINANCIAL STATEMENTS
Notes to the Group Financial Statements
Statement of Accounts 92
INDEX TO THE NOTES TO THE GROUP FINANCIAL STATEMENTS
1 Group Expenditure and Funding Analysis ...................................................................................... 93 2 Group Boundary ............................................................................................................................. 94 3 Basis of Consolidation .................................................................................................................... 94 4 Business Activity of the Subsidiary and Joint Venture ................................................................... 94 5 Accounting Policies ........................................................................................................................ 94 6 Financing and Investment Income and Expenditure ...................................................................... 94 7 Audit Costs ..................................................................................................................................... 95 8 Property Plant and Equipment ........................................................................................................ 96 9 Long Term Investments .................................................................................................................. 98 10 Current Assets held for sale ........................................................................................................... 98 11 Unusable Reserves ........................................................................................................................ 99 12 Investing Activities .......................................................................................................................... 99
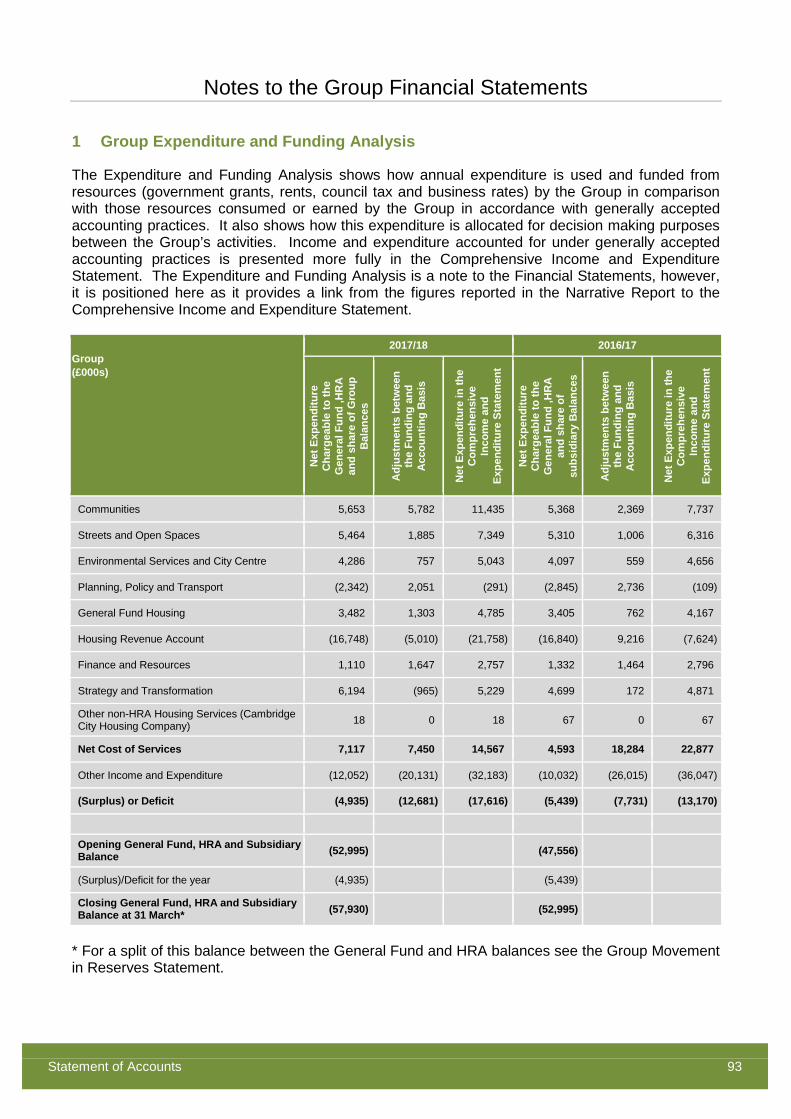
Notes to the Group Financial Statements
Statement of Accounts 93
1 Group Expenditure and Funding Analysis
The Expenditure and Funding Analysis shows how annual expenditure is used and funded from resources (government grants, rents, council tax and business rates) by the Group in comparison with those resources consumed or earned by the Group in accordance with generally accepted accounting practices. It also shows how this expenditure is allocated for decision making purposes between the Group’s activities. Income and expenditure accounted for under generally accepted accounting practices is presented more fully in the Comprehensive Income and Expenditure Statement. The Expenditure and Funding Analysis is a note to the Financial Statements, however, it is positioned here as it provides a link from the figures reported in the Narrative Report to the Comprehensive Income and Expenditure Statement.
Group (£000s)
2017/18 2016/17
Net
Exp
endi
ture
C
harg
eabl
e to
the
Gen
eral
Fun
d ,H
RA
an
d sh
are
of G
roup
B
alan
ces
Adj
ustm
ents
bet
wee
n th
e Fu
ndin
g an
d A
ccou
ntin
g B
asis
Net
Exp
endi
ture
in th
e C
ompr
ehen
sive
In
com
e an
d Ex
pend
iture
Sta
tem
ent
Net
Exp
endi
ture
C
harg
eabl
e to
the
Gen
eral
Fun
d ,H
RA
an
d sh
are
of
subs
idia
ry B
alan
ces
Adj
ustm
ents
bet
wee
n th
e Fu
ndin
g an
d A
ccou
ntin
g B
asis
Net
Exp
endi
ture
in th
e C
ompr
ehen
sive
In
com
e an
d Ex
pend
iture
Sta
tem
ent
Communities 5,653 5,782 11,435 5,368 2,369 7,737
Streets and Open Spaces 5,464 1,885 7,349 5,310 1,006 6,316
Environmental Services and City Centre 4,286 757 5,043 4,097 559 4,656
Planning, Policy and Transport (2,342) 2,051 (291) (2,845) 2,736 (109)
General Fund Housing 3,482 1,303 4,785 3,405 762 4,167
Housing Revenue Account (16,748) (5,010) (21,758) (16,840) 9,216 (7,624)
Finance and Resources 1,110 1,647 2,757 1,332 1,464 2,796
Strategy and Transformation 6,194 (965) 5,229 4,699 172 4,871
Other non-HRA Housing Services (Cambridge City Housing Company) 18 0 18 67 0 67
Net Cost of Services 7,117 7,450 14,567 4,593 18,284 22,877
Other Income and Expenditure (12,052) (20,131) (32,183) (10,032) (26,015) (36,047)
(Surplus) or Deficit (4,935) (12,681) (17,616) (5,439) (7,731) (13,170)
Opening General Fund, HRA and Subsidiary Balance (52,995) (47,556)
(Surplus)/Deficit for the year (4,935) (5,439)
Closing General Fund, HRA and Subsidiary Balance at 31 March* (57,930) (52,995)
* For a split of this balance between the General Fund and HRA balances see the Group Movement in Reserves Statement.
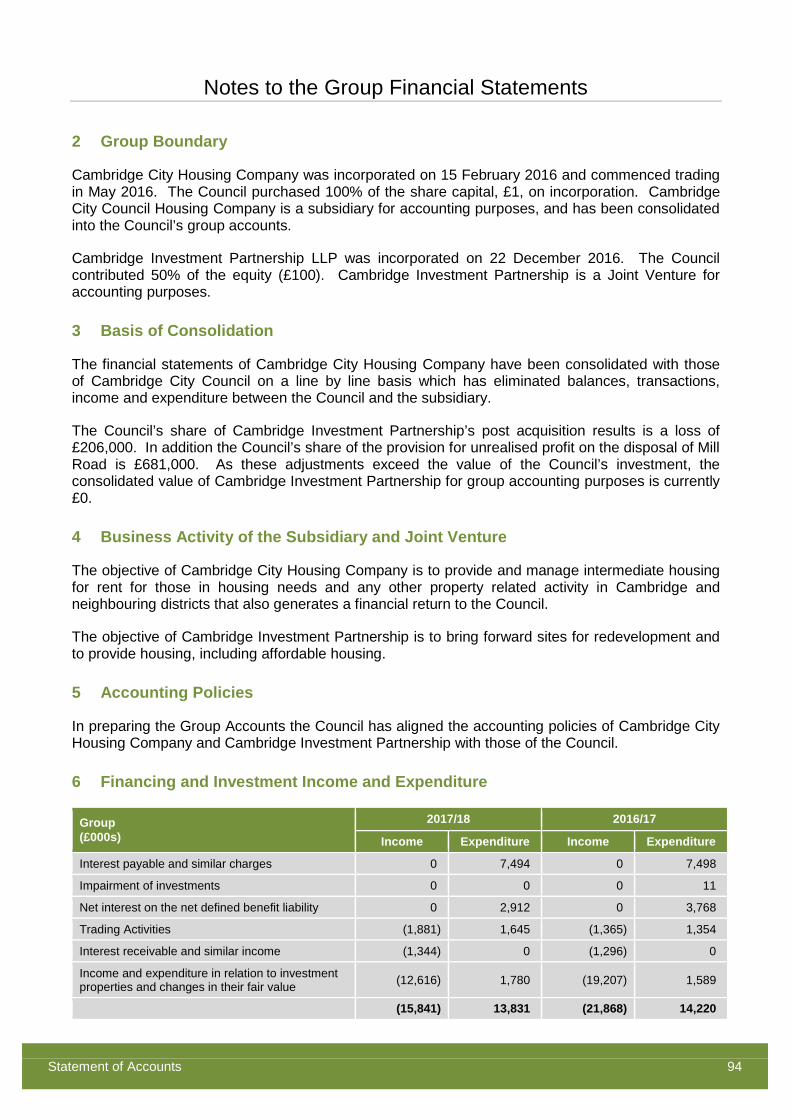
Notes to the Group Financial Statements
Statement of Accounts 94
2 Group Boundary
Cambridge City Housing Company was incorporated on 15 February 2016 and commenced trading in May 2016. The Council purchased 100% of the share capital, £1, on incorporation. Cambridge City Council Housing Company is a subsidiary for accounting purposes, and has been consolidated into the Council’s group accounts.
Cambridge Investment Partnership LLP was incorporated on 22 December 2016. The Council contributed 50% of the equity (£100). Cambridge Investment Partnership is a Joint Venture for accounting purposes.
3 Basis of Consolidation
The financial statements of Cambridge City Housing Company have been consolidated with those of Cambridge City Council on a line by line basis which has eliminated balances, transactions, income and expenditure between the Council and the subsidiary.
The Council’s share of Cambridge Investment Partnership’s post acquisition results is a loss of £206,000. In addition the Council’s share of the provision for unrealised profit on the disposal of Mill Road is £681,000. As these adjustments exceed the value of the Council’s investment, the consolidated value of Cambridge Investment Partnership for group accounting purposes is currently £0.
4 Business Activity of the Subsidiary and Joint Venture
The objective of Cambridge City Housing Company is to provide and manage intermediate housing for rent for those in housing needs and any other property related activity in Cambridge and neighbouring districts that also generates a financial return to the Council.
The objective of Cambridge Investment Partnership is to bring forward sites for redevelopment and to provide housing, including affordable housing.
5 Accounting Policies
In preparing the Group Accounts the Council has aligned the accounting policies of Cambridge City Housing Company and Cambridge Investment Partnership with those of the Council.
6 Financing and Investment Income and Expenditure
Group (£000s)
2017/18 2016/17
Income Expenditure Income Expenditure
Interest payable and similar charges 0 7,494 0 7,498
Impairment of investments 0 0 0 11
Net interest on the net defined benefit liability 0 2,912 0 3,768
Trading Activities (1,881) 1,645 (1,365) 1,354
Interest receivable and similar income (1,344) 0 (1,296) 0
Income and expenditure in relation to investment properties and changes in their fair value (12,616) 1,780 (19,207) 1,589
(15,841) 13,831 (21,868) 14,220
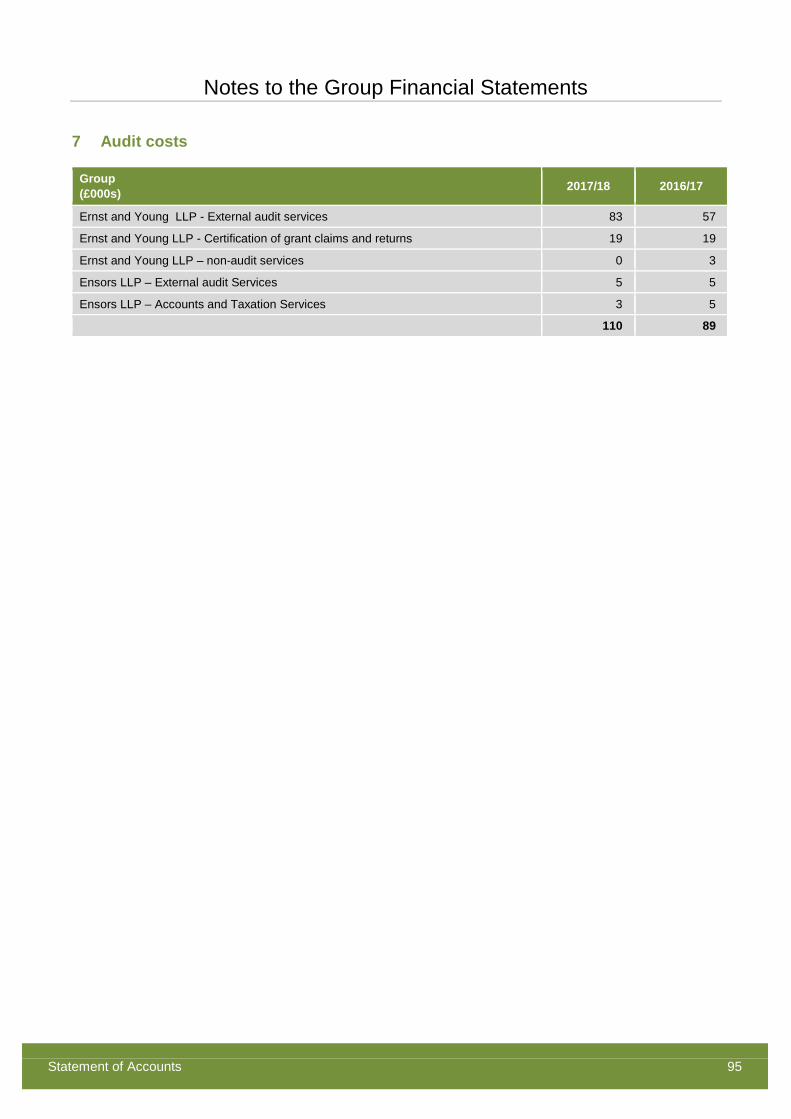
Notes to the Group Financial Statements
Statement of Accounts 95
7 Audit costs
Group (£000s) 2017/18 2016/17
Ernst and Young LLP - External audit services 83 57
Ernst and Young LLP - Certification of grant claims and returns 19 19
Ernst and Young LLP – non-audit services 0 3
Ensors LLP – External audit Services 5 5
Ensors LLP – Accounts and Taxation Services 3 5
110 89
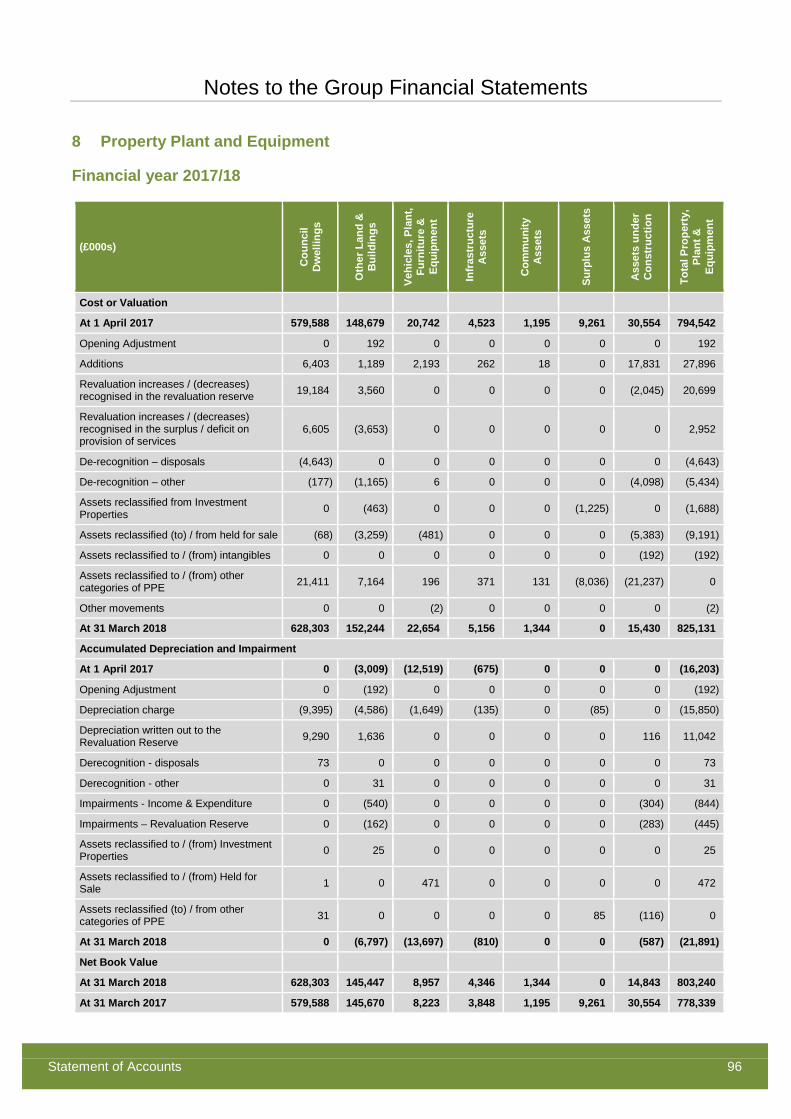
Notes to the Group Financial Statements
Statement of Accounts 96
8 Property Plant and Equipment
Financial year 2017/18
(£000s)
Cou
ncil
Dw
ellin
gs
Oth
er L
and
&
Bui
ldin
gs
Vehi
cles
, Pla
nt,
Furn
iture
&
Equi
pmen
t
Infr
astr
uctu
re
Ass
ets
Com
mun
ity
Ass
ets
Surp
lus
Ass
ets
Ass
ets
unde
r C
onst
ruct
ion
Tota
l Pro
pert
y,
Plan
t &
Equi
pmen
t
Cost or Valuation
At 1 April 2017 579,588 148,679 20,742 4,523 1,195 9,261 30,554 794,542
Opening Adjustment 0 192 0 0 0 0 0 192
Additions 6,403 1,189 2,193 262 18 0 17,831 27,896
Revaluation increases / (decreases) recognised in the revaluation reserve 19,184 3,560 0 0 0 0 (2,045) 20,699
Revaluation increases / (decreases) recognised in the surplus / deficit on provision of services
6,605 (3,653) 0 0 0 0 0 2,952
De-recognition – disposals (4,643) 0 0 0 0 0 0 (4,643)
De-recognition – other (177) (1,165) 6 0 0 0 (4,098) (5,434)
Assets reclassified from Investment Properties 0 (463) 0 0 0 (1,225) 0 (1,688)
Assets reclassified (to) / from held for sale (68) (3,259) (481) 0 0 0 (5,383) (9,191)
Assets reclassified to / (from) intangibles 0 0 0 0 0 0 (192) (192)
Assets reclassified to / (from) other categories of PPE 21,411 7,164 196 371 131 (8,036) (21,237) 0
Other movements 0 0 (2) 0 0 0 0 (2)
At 31 March 2018 628,303 152,244 22,654 5,156 1,344 0 15,430 825,131
Accumulated Depreciation and Impairment
At 1 April 2017 0 (3,009) (12,519) (675) 0 0 0 (16,203)
Opening Adjustment 0 (192) 0 0 0 0 0 (192)
Depreciation charge (9,395) (4,586) (1,649) (135) 0 (85) 0 (15,850)
Depreciation written out to the Revaluation Reserve 9,290 1,636 0 0 0 0 116 11,042
Derecognition - disposals 73 0 0 0 0 0 0 73
Derecognition - other 0 31 0 0 0 0 0 31
Impairments - Income & Expenditure 0 (540) 0 0 0 0 (304) (844)
Impairments – Revaluation Reserve 0 (162) 0 0 0 0 (283) (445)
Assets reclassified to / (from) Investment Properties 0 25 0 0 0 0 0 25
Assets reclassified to / (from) Held for Sale 1 0 471 0 0 0 0 472
Assets reclassified (to) / from other categories of PPE 31 0 0 0 0 85 (116) 0
At 31 March 2018 0 (6,797) (13,697) (810) 0 0 (587) (21,891)
Net Book Value
At 31 March 2018 628,303 145,447 8,957 4,346 1,344 0 14,843 803,240
At 31 March 2017 579,588 145,670 8,223 3,848 1,195 9,261 30,554 778,339
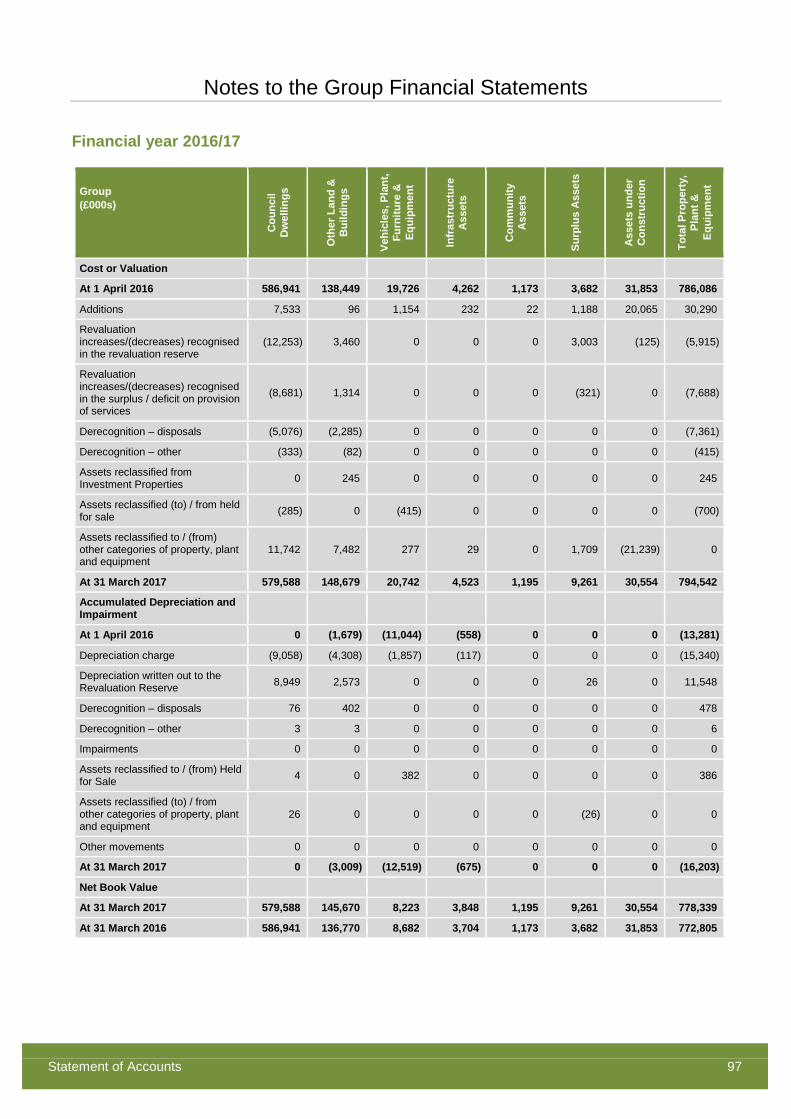
Notes to the Group Financial Statements
Statement of Accounts 97
Financial year 2016/17
Group (£000s)
Cou
ncil
Dw
ellin
gs
Oth
er L
and
&
Bui
ldin
gs
Vehi
cles
, Pla
nt,
Furn
iture
&
Equi
pmen
t
Infr
astr
uctu
re
Ass
ets
Com
mun
ity
Ass
ets
Surp
lus
Ass
ets
Ass
ets
unde
r C
onst
ruct
ion
Tota
l Pro
pert
y,
Plan
t &
Equi
pmen
t
Cost or Valuation
At 1 April 2016 586,941 138,449 19,726 4,262 1,173 3,682 31,853 786,086
Additions 7,533 96 1,154 232 22 1,188 20,065 30,290
Revaluation increases/(decreases) recognised in the revaluation reserve
(12,253) 3,460 0 0 0 3,003 (125) (5,915)
Revaluation increases/(decreases) recognised in the surplus / deficit on provision of services
(8,681) 1,314 0 0 0 (321) 0 (7,688)
Derecognition – disposals (5,076) (2,285) 0 0 0 0 0 (7,361)
Derecognition – other (333) (82) 0 0 0 0 0 (415)
Assets reclassified from Investment Properties 0 245 0 0 0 0 0 245
Assets reclassified (to) / from held for sale (285) 0 (415) 0 0 0 0 (700)
Assets reclassified to / (from) other categories of property, plant and equipment
11,742 7,482 277 29 0 1,709 (21,239) 0
At 31 March 2017 579,588 148,679 20,742 4,523 1,195 9,261 30,554 794,542
Accumulated Depreciation and Impairment
At 1 April 2016 0 (1,679) (11,044) (558) 0 0 0 (13,281)
Depreciation charge (9,058) (4,308) (1,857) (117) 0 0 0 (15,340)
Depreciation written out to the Revaluation Reserve 8,949 2,573 0 0 0 26 0 11,548
Derecognition – disposals 76 402 0 0 0 0 0 478
Derecognition – other 3 3 0 0 0 0 0 6
Impairments 0 0 0 0 0 0 0 0
Assets reclassified to / (from) Held for Sale 4 0 382 0 0 0 0 386
Assets reclassified (to) / from other categories of property, plant and equipment
26 0 0 0 0 (26) 0 0
Other movements 0 0 0 0 0 0 0 0
At 31 March 2017 0 (3,009) (12,519) (675) 0 0 0 (16,203)
Net Book Value
At 31 March 2017 579,588 145,670 8,223 3,848 1,195 9,261 30,554 778,339
At 31 March 2016 586,941 136,770 8,682 3,704 1,173 3,682 31,853 772,805
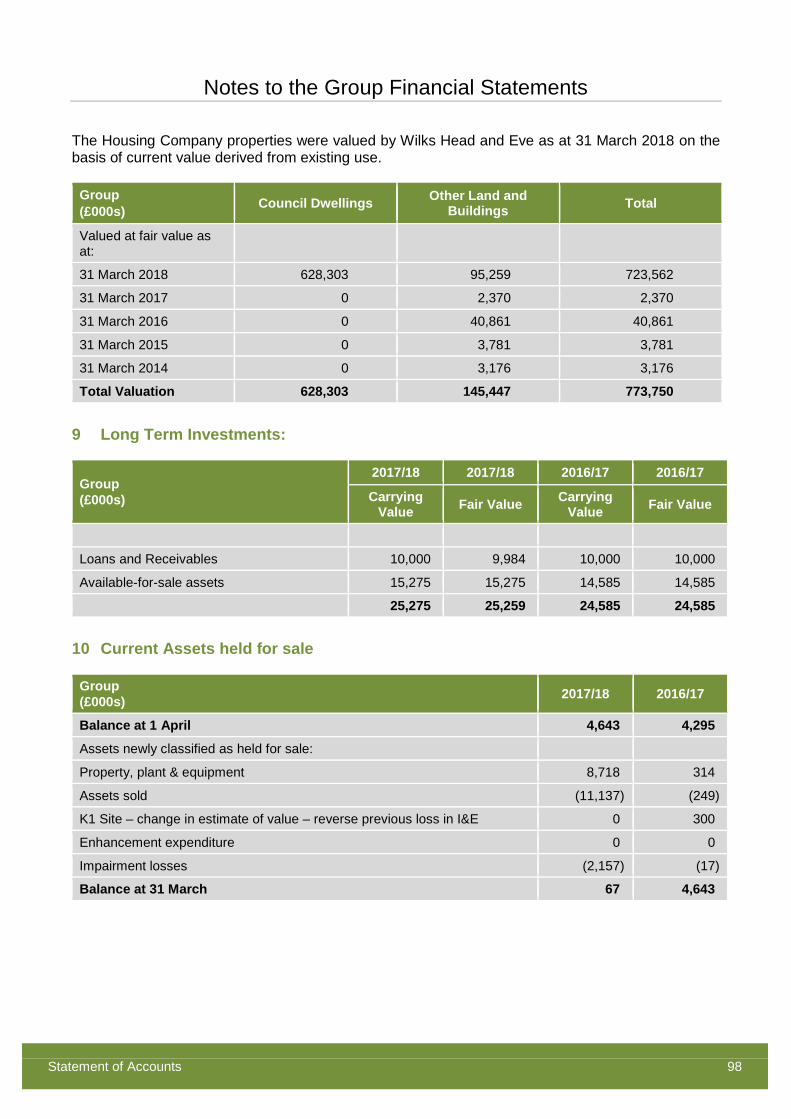
Notes to the Group Financial Statements
Statement of Accounts 98
The Housing Company properties were valued by Wilks Head and Eve as at 31 March 2018 on the basis of current value derived from existing use.
Group (£000s) Council Dwellings Other Land and
Buildings Total
Valued at fair value as at:
31 March 2018 628,303 95,259 723,562
31 March 2017 0 2,370 2,370
31 March 2016 0 40,861 40,861
31 March 2015 0 3,781 3,781
31 March 2014 0 3,176 3,176
Total Valuation 628,303 145,447 773,750
9 Long Term Investments:
Group (£000s)
2017/18 2017/18 2016/17 2016/17
Carrying Value Fair Value Carrying
Value Fair Value
Loans and Receivables 10,000 9,984 10,000 10,000
Available-for-sale assets 15,275 15,275 14,585 14,585
25,275 25,259 24,585 24,585
10 Current Assets held for sale
Group (£000s) 2017/18 2016/17
Balance at 1 April 4,643 4,295
Assets newly classified as held for sale:
Property, plant & equipment 8,718 314
Assets sold (11,137) (249)
K1 Site – change in estimate of value – reverse previous loss in I&E 0 300
Enhancement expenditure 0 0
Impairment losses (2,157) (17)
Balance at 31 March 67 4,643
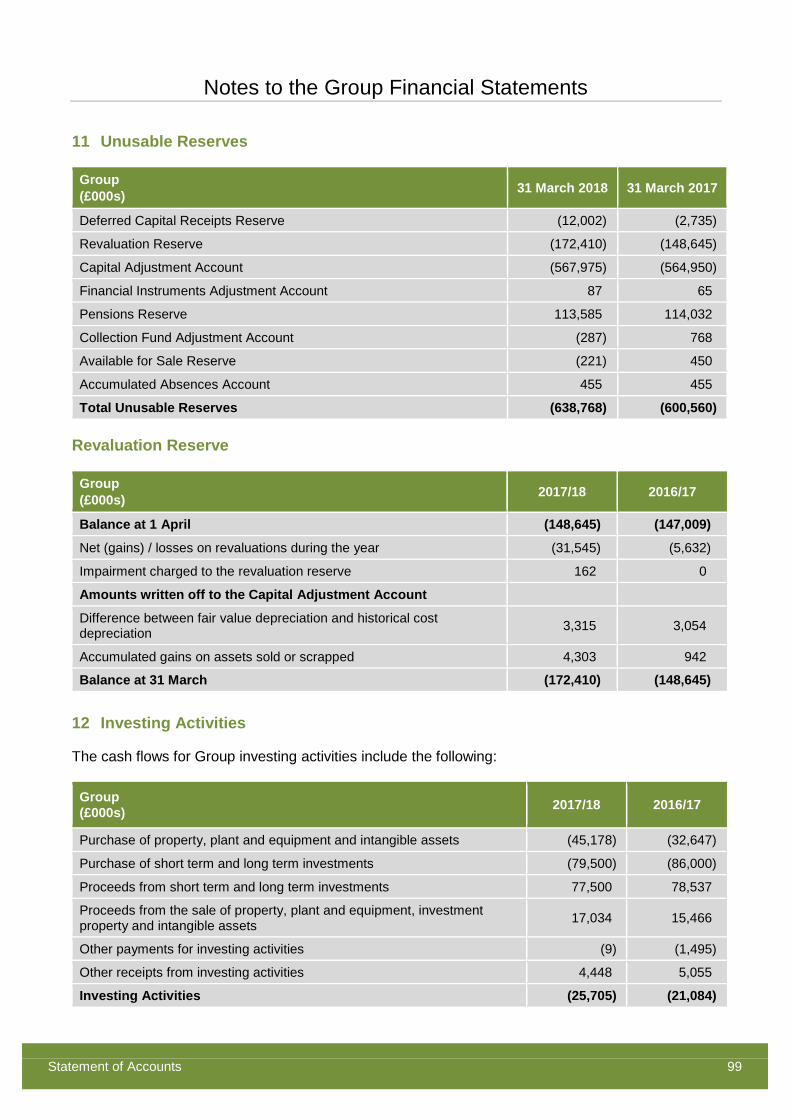
Notes to the Group Financial Statements
Statement of Accounts 99
11 Unusable Reserves
Group (£000s) 31 March 2018 31 March 2017
Deferred Capital Receipts Reserve (12,002) (2,735)
Revaluation Reserve (172,410) (148,645)
Capital Adjustment Account (567,975) (564,950)
Financial Instruments Adjustment Account 87 65
Pensions Reserve 113,585 114,032
Collection Fund Adjustment Account (287) 768
Available for Sale Reserve (221) 450
Accumulated Absences Account 455 455
Total Unusable Reserves (638,768) (600,560)
Revaluation Reserve
Group (£000s) 2017/18 2016/17
Balance at 1 April (148,645) (147,009)
Net (gains) / losses on revaluations during the year (31,545) (5,632)
Impairment charged to the revaluation reserve 162 0
Amounts written off to the Capital Adjustment Account
Difference between fair value depreciation and historical cost depreciation 3,315 3,054
Accumulated gains on assets sold or scrapped 4,303 942
Balance at 31 March (172,410) (148,645)
12 Investing Activities
The cash flows for Group investing activities include the following:
Group (£000s) 2017/18 2016/17
Purchase of property, plant and equipment and intangible assets (45,178) (32,647)
Purchase of short term and long term investments (79,500) (86,000)
Proceeds from short term and long term investments 77,500 78,537
Proceeds from the sale of property, plant and equipment, investment property and intangible assets 17,034 15,466
Other payments for investing activities (9) (1,495)
Other receipts from investing activities 4,448 5,055
Investing Activities (25,705) (21,084)

STATEMENT OF ACCOUNTING POLICIES AND GLOSSARY OF FINANCIAL TERMS AND ABBREVIATIONS

Statement of Accounting Policies & Glossary of Financial Terms and Abbreviations
Statement of Accounts 103
Statement of Accounting Policies
1 General Principles
The Statement of Accounts summarises the Council's transactions for the 2017/18 financial year and its position at the year-end of 31 March 2018. The Council is required to prepare an annual Statement of Accounts by the Accounts and Audit Regulations 2015, which those regulations require to be prepared in accordance with proper accounting practices. These practices primarily comprise the Code of Practice on Local Authority Accounting in the United Kingdom 2017/18, supported by International Financial Reporting Standards (IFRS).
The accounting convention adopted in the Statement of Accounts is principally historical cost, modified by the revaluation of certain categories of non-current assets and financial instruments.
The accounts are prepared on a going concern basis; that is, on the assumption that the functions of the Council will continue in operational existence for the foreseeable future.
2 Accruals of Income and Expenditure
Activity is accounted for in the year that it takes place, not simply when cash payments are made or received. In particular:
• Revenue from the sale of goods is recognised when the Council transfers the significant risks and rewards of ownership to the purchaser and it is probable that economic benefits or service potential associated with the transaction will flow to the Council.
• Revenue from the provision of services is recognised when the Council can measure reliably the percentage of completion of the transaction and it is probable that economic benefits or service potential associated with the transaction will flow to the Council.
• Supplies are recorded as expenditure when they are consumed - where there is a gap between the date supplies are received and their consumption, they are carried as inventories on the Balance Sheet.
• Expenses in relation to services received (including those rendered by the Council's officers) are recorded as expenditure when the services are received, rather than when payments are made.
• Interest payable on borrowings and receivable on investments is accounted for on the basis of the effective interest rate for the relevant financial instrument rather than the cash flows fixed or determined by the contract.
• Where revenue and expenditure have been recognised but cash has not been received or paid, a debtor or creditor for the relevant amount is recorded in the Balance Sheet. Where there is evidence that debts are unlikely to be settled, the balance of debtors is written down and a charge made to revenue for the income that might not be collected.
Where the Council is acting as an agent for another party (e.g. in the collection of non-domestic rates and council tax), income and expenditure are recognised only to the extent that commission is receivable by the Council for the agency services rendered or the Council incurs expenses directly on its own behalf in rendering the services.
Statement of Accounting Policies & Glossary of Financial Terms and Abbreviations
Statement of Accounts 104
3 Cash and Cash Equivalents
Cash is represented by cash in hand and deposits with financial institutions repayable without penalty on notice of not more than 24 hours. Cash equivalents are highly liquid investments that mature in less than three months from the date of acquisition and that are convertible to known amounts of cash with an insignificant risk of change in value (no loss of interest). The Council therefore treats all fixed term deposits, which have no contractual provision for early redemption, and if they were redeemed early would suffer a penalty of at least a loss of interest, as investments.
In the Cash Flow Statement, cash and cash equivalents are shown net of bank overdrafts that are repayable on demand and form an integral part of the Council’s cash management.
4 Changes in Accounting Policies and Estimates and Errors
Changes in accounting policies are only made when required by proper accounting practices or the change provides more reliable or relevant information about the effect of transactions, other events and conditions on the Council's financial position or financial performance. Where a change is made, it is applied retrospectively by adjusting opening balances and comparative amounts for the prior period as if the new policy had always been applied.
Changes in accounting estimates are accounted for prospectively, ie, in the current and future years affected by the change.
Material errors discovered in prior period figures are corrected retrospectively by amending opening balances and comparative amounts for the prior period.
5 Charges to Revenue for Non-Current Assets
Services, support services and trading accounts are debited with the following amounts to record the cost of holding non-current assets during the year:
• depreciation attributable to the assets used by the relevant service
• revaluation and impairment losses on assets used by the service where there are no accumulated gains in the Revaluation Reserve against which the losses can be written off
• amortisation of intangible assets attributable to the service
The Council is not required to raise council tax to cover depreciation, revaluation and impairment losses or amortisations. However, it is required to make an annual provision from revenue to contribute towards the reduction in its overall borrowing requirement. This provision, known as Minimum Revenue Provision (MRP), is equal to an amount calculated on a prudent basis determined by the Council in accordance with statutory guidance. Depreciation, revaluation and impairment losses and amortisations are therefore replaced by the contribution in the General Fund Balance, by way of an adjusting transaction with the Capital Adjustment Account in the Movement in Reserves Statement for the difference between the two. .
The provisions for depreciation charges to revenue for non-current assets in the HRA are different. The Major Repairs Reserve is credited and the HRA balance is debited with a sum equal to depreciation on all HRA non-current assets. This means that depreciation is a charge to the HRA,
Statement of Accounting Policies & Glossary of Financial Terms and Abbreviations
Statement of Accounts 105
but that balances are held in the Major repairs reserve for future spend on the housing stock. HRA revaluation and impairment losses are reversed in the same manner as for the General Fund.
6 Employee Benefits
Benefits Payable During Employment
Short-term employee benefits (those that fall due wholly within 12 months of the year-end), such as wages and salaries, paid annual leave and paid sick leave, flexi-leave and time off in lieu for current employees, are recognised as an expense in the year in which employees render service to the Council. An accrual is made against services in the Surplus or Deficit on the Provision of Services for the cost of holiday entitlements and other forms of leave earned by employees but not taken before the year-end and which employees can carry forward into the next financial year. The accrual is made at the remuneration rates applicable in the following financial year. Any accrual made is required under statute to be reversed out of the General Fund Balance by a credit to the Accumulating Compensated Absences Adjustment Account in the Movement in Reserves Statement.
Termination Benefits
Termination benefits are amounts payable as a result of a decision by the Council to terminate an officer’s employment before the normal retirement date or an officer’s decision to accept voluntary redundancy and are charged on an accruals basis to the Comprehensive Income and Expenditure Statement at the earlier of when the Council can no longer withdraw the offer of those benefits or when the Council recognises costs for a restructuring..
Where termination benefits involve the enhancement of pensions, statutory provisions require the General Fund balance to be charged with the amount payable by the Council to the pension fund or pensioner in the year, not the amount calculated according to the relevant accounting standards. In the Movement in Reserves Statement, appropriations are required to and from the Pensions Reserve to remove the notional debits and credits for termination benefits related to pensions enhancements and replace them with debits for the cash paid to the pension fund and pensioners.
Post-Employment Benefits
Employees of the Council are members of the Local Government Pension Scheme, administered by Cambridgeshire County Council.
The scheme provides defined benefits to members (retirement lump sums and pensions), earned as employees worked for the Council.
♦ The Local Government Pension Scheme
The Local Government Pension Scheme is accounted for as a defined benefits scheme:
• The liabilities of the Cambridgeshire County Council pension fund attributable to the Council are included in the Balance Sheet on an actuarial basis using the projected unit method – i.e. an assessment of the future payments that will be made in relation to retirement benefits earned to date by employees, based on assumptions about mortality rates, employee turnover rates, etc, and projections of projected earnings for current employees.
Statement of Accounting Policies & Glossary of Financial Terms and Abbreviations
Statement of Accounts 106
• Liabilities are discounted to their value at current prices, using a discount rate of 2.7% (based on the yields of the constituents of the iBoxx £ Corporates AA index, gilts yields, and the Council’s weighted average duration).
• The assets of the Cambridgeshire County Council pension fund attributable to the Council are included in the Balance Sheet at their fair value:
o Quoted securities – current bid price
o Unquoted securities – professional estimate
o Unitised securities – current bid price
o Property – market value
• The change in the net pensions liability is analysed into the following components:
Service Cost comprising:
o Current service cost – the increase in liabilities as a result of years of service earned this year – allocated in the Comprehensive Income and Expenditure Statement to the services for which the employees worked
o Past service cost – the increase in liabilities as a result of a scheme amendment or curtailment whose effect relates to years of service earned in earlier years – debited to the Surplus/Deficit on the Provision of Services in the Comprehensive Income and Expenditure Statement as part of Non Distributed Costs
o Net Interest on the net defined benefit liability – ie the net interest expense for the Council. This is the change during the period in the net defined benefit liability that arises from the passage of time charged to the Financing and Investment Income and Expenditure line of the Comprehensive Income and Expenditure Statement. This is calculated by applying the discount rate used to measure the defined benefit obligation at the beginning of the period to the net defined benefit liability at the beginning of the period – taking into account any changes in the net defined benefit liability during the period as a result of contribution and benefit payments.
Remeasurements comprising:
o The return on plan assets excluding amounts included in net interest on the net defined benefit liability. This is charged to the Pensions Reserve as Other Comprehensive Income and Expenditure.
o Actuarial gains and losses – changes in the net pensions liability that arise because events have not coincided with assumptions made at the last actuarial valuation or because the actuaries have updated their assumptions – charged to the Pensions Reserve as Other Comprehensive Income and Expenditure.
Contributions paid to the Cambridge City Council pension fund – cash paid as employer’s contributions to the pension fund in settlement of liabilities; not accounted for as an expense
In relation to retirement benefits, statutory provisions require the General Fund balance to be charged with the amount payable by the Council to the pension fund or directly to pensioners in the year, not the amount calculated according to the relevant accounting standards. In the Movement in Reserves Statement, this means that there are appropriations to and from the Pensions Reserve to remove the notional debits and credits for retirement benefits and replace them with debits for the cash paid to the pension fund and pensioners and any such amounts payable but unpaid at the
Statement of Accounting Policies & Glossary of Financial Terms and Abbreviations
Statement of Accounts 107
year-end. The balance that arises on the Pensions Reserve thereby measures the beneficial impact on the General Fund of being required to account for retirement benefits on the basis of cash flows than as benefits are earned by employees.
7 Events after the Reporting Period
Events after the reporting period are those events, both favourable and unfavourable, that occur between the end of the reporting period and the date when the Statement of Accounts is authorised for issue. Two types of events can be identified:
• Those that provide evidence of conditions that existed at the end of the reporting period – the Statement of Accounts is adjusted to reflect such events
• Those that are indicative of conditions that arose after the reporting period – the Statement of Accounts is not adjusted to reflect such events, but where a category of events would have a material effect disclosure is made in the notes of the nature of the events and their estimated financial effect
Events taking place after the date of authorisation for issue are not reflected in the Statement of Account.
8 Exceptional Items
When items of income and expense are material, their nature and amount is disclosed separately, either on the face of the Comprehensive Income and Expenditure Statement or in the notes to the account.
9 Fair value measurement
The Council measures some of its non-financial assets such as surplus assets and investment properties and some of its financial instruments such as available for sale financial assets at fair value at each reporting date. Fair value is the price that would be received to sell an asset or paid to transfer a liability in an orderly transaction between market participants at the measurement date. The fair value measurement assumes that the transaction to sell the asset or transfer the liability takes place either
a) in the principal market for the asset or liability, or
b) in the absence of a principal market, in the most advantageous market for the asset or liability.
The Council measures the fair value of an asset or liability using the assumptions that market participants would use when pricing the asset or liability, assuming that the participants act in their economic best interest.
When measuring the fair value of a non-financial asset, the Council takes into account a market participant’s ability to generate economic benefits by using the asset in its highest and best use or by selling it to another market participant that would use the asset in its highest and best use.
Statement of Accounting Policies & Glossary of Financial Terms and Abbreviations
Statement of Accounts 108
The Council uses valuation techniques that are appropriate in the circumstances and for which sufficient data is available, maximising the use of relevant observable inputs and minimising the use of unobservable inputs.
Inputs to the valuation techniques in respect of assets and liabilities for which fair value is measured or disclosed in the Council’s financial statements are categorised within the fair value hierarchy, as follows:
• Level 1 – quoted prices (unadjusted) in active markets for identical assets or liabilities that the authority can access at the measurement date.
• Level 2 – inputs other than quoted prices included within level 1 that are observable for the asset or liability, either directly or indirectly.
• Level 3 – unobservable inputs for the asset or liability.
10 Financial Liabilities
Financial liabilities are recognised on the Balance Sheet when the Council becomes a party to the contractual provisions of a financial instrument and initially measured at fair value and carried at their amortised cost. Annual charges to the Financing and Investment Income and Expenditure line in the Comprehensive Income and Expenditure Statement for interest payable are based on the carrying amount of the liability, multiplied by the effective rate of interest for the instrument. The effective interest rate is the rate that exactly discounts estimated future cash payments over the life of the instrument to the amount at which it was originally recognised.
This means that the amount presented in the Balance Sheet is the outstanding principal repayable (plus accrued interest) and interest charged to the Comprehensive Income and Expenditure Statement is the amount payable for the year according to the loan agreement.
Gains and losses on the repurchase or early settlement of borrowing are credited and debited to the Financing and Investment Income and Expenditure line in the Comprehensive Income and Expenditure Statement in the year of repurchase/settlement.
Where premiums and discounts have been charged to the Comprehensive Income and Expenditure Statement, regulations allow the impact on the General Fund Balance to be spread over future years. The Council has a policy of spreading the gain/loss over the term that was remaining on the loan against which the premium was payable or discount receivable when it was repaid. The reconciliation of amounts charged to the Comprehensive Income and Expenditure Statement to the net charge required against the General Fund Balance is managed by a transfer to or from the Financial Instruments Adjustment Account in the Movement in Reserves Statement.
11 Financial Assets
Financial assets are classified into two types:
• Loans and receivables – assets that have fixed or determinable payments but are not quoted in an active market
• Available-for-sale assets – assets that have a quoted market price and/or do not have fixed or determinable payments
Statement of Accounting Policies & Glossary of Financial Terms and Abbreviations
Statement of Accounts 109
Loans and Receivables
Loans and receivables are recognised on the Balance Sheet when the Council becomes a party to the contractual provisions of a financial instrument and are initially measured at fair value. They are then measured at their amortised cost. Annual credits to the Financing and Investment Income and Expenditure line in the Comprehensive Income and Expenditure Statement for interest receivable are based on the carrying amount of the asset multiplied by the effective rate of interest for the instrument. For most of the loans that the Council has made, this means that the amount presented in the Balance Sheet is the outstanding principal receivable (plus accrued interest) and interest credited to the Comprehensive Income and Expenditure Statement is the amount receivable for the year in the loan agreement.
The Council has made interest-free loans for private sector housing improvements (soft loans). When soft loans are made, a loss is recorded in the Comprehensive Income and Expenditure Statement (debited to the appropriate service) for the present value of the interest that will be foregone over the life of the instrument, resulting in a lower amortised cost than the outstanding principal. Interest is credited to the Financing and Investment Income and Expenditure line in the Comprehensive Income and Expenditure Statement at a marginally higher effective rate of interest than the rate receivable from the voluntary organisations, with the difference serving to increase the amortised cost of the loan in the Balance Sheet. Statutory provisions require that the impact of soft loans on the General Fund Balance is the interest receivable for the financial year – the reconciliation of amounts debited and credited to the Comprehensive Income and Expenditure Statement to the net gain required against the General Fund Balance is managed by a transfer to or from the Financial Instruments Adjustment Account in the Movement in Reserves Statement.
Where assets are identified as impaired because of a likelihood arising from a past event that payments due under the contract will not be made, the asset is written down and a charge made to the relevant service (for items specific to a service) or the Financing and Investment Income and Expenditure line in the Comprehensive Income and Expenditure Statement. The impairment loss is measured as the difference between the carrying amount and the present value of the revised future cash flows discounted at the asset’s original effective interest rate.
Any gains and losses that arise on the derecognition of an asset are credited/debited to the Financing and Investment Income and Expenditure line in the Comprehensive Income and Expenditure Statement.
Available-for-Sale Assets
Available-for-sale assets are recognised on the balance sheet when the Council becomes a party to the contractual provisions of a financial instrument and are initially measured and carried at fair value. Where the asset has fixed or determinable payments, annual credits to the Financing and Investment Income and Expenditure line in the Comprehensive Income and Expenditure Statement for interest receivable are based on the amortised cost of the asset multiplied by the effective rate of interest for the instrument. Where there are no fixed or determinable payments, income (eg dividends) is credited to the Comprehensive Income and Expenditure Statement when it becomes receivable by the Council.
Assets are maintained in the balance sheet at fair value. Values are based on the following principles:
• Instruments with quoted market prices – the market price
Statement of Accounting Policies & Glossary of Financial Terms and Abbreviations
Statement of Accounts 110
• Other instruments with fixed and determinable payments – discounted cash flow analysis
• Equity shares with no quoted market prices – independent appraisal of company valuations
The inputs to the measurement techniques are categorised in accordance with the following three levels:
• Level 1 inputs – quoted prices (unadjusted) in active markets for identical assets that the authority can access at the measurement date.
• Level 2 inputs – inputs other than quoted prices included within Level 1 that are observable for the asset, either directly or indirectly.
• Level 3 inputs – unobservable inputs for the asset.
Changes in fair value are balanced by an entry in the Available-for-Sale Reserve and the gain or loss is recognised in the surplus or deficit on revaluation of available-for-sale financial assets. The exception is where impairment losses have been incurred – these are debited to the Financing and Investment Income and Expenditure line in the Comprehensive Income and Expenditure Statement, along with any net gain or loss for the asset accumulated in the Available-for-Sale Reserve.
Where assets are identified as impaired because of a likelihood arising from a past event that payments due under the contract will not be made (fixed or determinable payments) or fair value falls below cost, the asset is written down and a charge made to the Financing and Investment Income and Expenditure line in the Comprehensive Income and Expenditure Statement. If the asset has fixed or determinable payments, the impairment loss is measured as the difference between the carrying amount and the present value of the revised future cash flows discounted at the asset’s original effective interest rate. Otherwise, the impairment loss is measured as any shortfall of fair value against the acquisition cost of the instrument (net of any principal repayment and amortisation).
Any gains or losses that arise on the derecognition of the asset are credited or debited to the Financing and Investment Income and Expenditure line in the Comprehensive Income and Expenditure Statement, along with any accumulated gains or losses previously recognised in the Available-for-Sale Reserve.
Where fair value cannot be measured reliably, the instrument is measured at cost (less any impairment losses).
12 Government Grants and Contributions
Whether paid on account, by instalments or in arrears, government grants and third party contributions and donations are recognised as due to the Council when there is reasonable assurance that:
• The Council will comply with the conditions attached to the payments, and
• The grants or contributions will be received
Amounts recognised as due to the Council are not credited to the Comprehensive Income and Expenditure Statement until conditions attaching to the grant or contribution have been satisfied. Conditions are stipulations that specify that the future economic benefits or service potential embodied in the asset acquired using the grant or contribution are required to be consumed by the
Statement of Accounting Policies & Glossary of Financial Terms and Abbreviations
Statement of Accounts 111
recipient as specified or future economic benefits or service potential must be returned to the transferor.
Monies advanced as grants and contributions for which conditions have not been satisfied are carried in the Balance Sheet as receipts in advance. When conditions are satisfied, the grant or contribution is credited to the relevant service line (attributable revenue grants/contributions) or Taxation and Non-Specific Grant Income (non-ring-fenced revenue grants and all capital grants) in the Comprehensive Income and Expenditure Statement.
Where capital grants are credited to the Comprehensive Income and Expenditure Statement, they are reversed out of the General Fund Balance in the Movement in Reserves Statement. Where the grant has yet to be used to finance capital expenditure, it is posted to the Capital Grants Unapplied Account. Where it has been applied, it is posted to the Capital Adjustment Account. Amounts in the Capital Grants Unapplied Account are transferred to the Capital Adjustment Account once they have been applied.
13 Intangible Assets
Expenditure on non-monetary assets that do not have physical substance but are controlled by the Council as a result of past events (e.g. software licence) is capitalised when it is expected that future economic benefits or service potential will flow from the intangible asset to the Council.
Internally generated assets are capitalised where it is demonstrable that the project is technically feasible and is intended to be completed (with adequate resources being available) and the Council will be able to generate future economic benefits or deliver service potential by being able to sell or use the asset. Expenditure is capitalised where it can be measured reliably as attributable to the asset and restricted to that incurred during the development phase (research expenditure is not capitalised).
Expenditure on the development of websites is not capitalised if the website is solely or primarily intended to promote or advertise the Council’s goods or services.
Intangible assets are measured initially at cost. Amounts are only revalued where the fair value of the assets held by the Council can be determined by reference to an active market. The depreciable amount of an intangible asset is amortised over its useful life to the relevant service line(s) in the Comprehensive Income and Expenditure Statement. An asset is tested for impairment whenever there is an indication that the asset might be impaired – any losses recognised are posted to the relevant service line(s) in the Comprehensive Income and Expenditure Statement. Any gain or loss arising on the disposal or abandonment of an intangible asset is posted to the Other Operating Expenditure line in the Comprehensive Income and Expenditure Statement.
Where expenditure on intangible assets qualifies as capital expenditure for statutory purposes, amortisation, impairment losses and disposal gains and losses are not permitted to have an impact on the General Fund Balance. The gains and losses are therefore reversed out of the General Fund Balance in the Movement in Reserves Statement and posted to the Capital Adjustment Account and (for any sale proceeds greater than £10,000) the Capital Receipts Reserve.
Statement of Accounting Policies & Glossary of Financial Terms and Abbreviations
Statement of Accounts 112
14 Inventories
Inventories are included in the Balance Sheet at the lower of cost and net realisable value. The cost of inventories is assigned using the first-in first-out (FIFO) costing formula.
15 Investment Properties
Investment properties are those that are used solely to earn rentals and/or for capital appreciation. The definition is not met if the property is used in any way to facilitate the delivery of services or production of goods or is held for sale.
Investment properties are measured initially at a cost and subsequently at fair value, being the price that would be received to sell such an asset in an orderly transactions between market participants at the measurement date. As a non-financial asset, investment properties are measured at highest and best use. Properties are not depreciated, but assets included in the Balance Sheet at fair value are revalued sufficiently regularly to ensure that their carrying amount is not materially different from their fair value at the year-end, but as a minimum every five years. Gains and losses on revaluation are posted to the Financing and Investment Income and Expenditure line in the Comprehensive Income and Expenditure Statement. The same treatment is applied to gains and losses on disposal.
Rentals received in relation to investment properties are credited to the Financing and Investment Income line and result in a gain for the General Fund Balance.
However, revaluation and disposal gains and losses are not permitted by statutory arrangements to have an impact on the Balance. The gains and losses are therefore reversed out of the General Fund Balance in the Movement in Reserves Statement and posted to the Capital Adjustment Account and (for any sale proceeds greater than £10,000) the Capital Receipts Reserve.
16 Leases
Leases are classified as finance leases where the terms of the lease transfer substantially all the risks and rewards incidental to ownership of the property, plant or equipment from the lessor to the lessee and the fair value of the property, plant or equipment at lease inception is above the Council’s de-minimis levels of £2,000 for vehicles and £15,000 for other items. All other leases are classified as operating leases.
Where a lease covers both land and buildings, the land and buildings elements are considered separately for classification.
Arrangements that do not have the legal status of a lease but convey a right to use an asset in return for payment are accounted for under this policy where fulfilment of the arrangement is dependent on the use of specific assets.
The Council as Lessee
♦ Finance Leases
Property, plant and equipment held under finance leases is recognised on the Balance Sheet at the commencement of the lease at its fair value measured at the lease’s inception (or the present value
Statement of Accounting Policies & Glossary of Financial Terms and Abbreviations
Statement of Accounts 113
of the minimum lease payments, if lower). The asset recognised is matched by a liability for the obligation to pay the lessor. Initial direct costs of the Council are added to the carrying amount of the asset. Premiums paid on entry into a lease are applied to writing down the lease liability. Contingent rents are charged as expenses in the years in which they are incurred.
Lease payments are apportioned between:
• A charge for the acquisition of the interest in the property, plant or equipment – applied to write down the lease liability, and
• A finance charge (debited to the Financing and Investment Income and Expenditure line in the Comprehensive Income and Expenditure Statement)
Property, Plant and Equipment recognised under finance leases is accounted for using the policies applied generally to such assets, subject to depreciation being charged over the lease term if this is shorter than the asset’s estimated useful life.
The Council is not required to raise council tax to cover depreciation or revaluation and impairment losses arising on leased assets. Instead, a prudent annual provision is made from revenue towards the deemed capital investment in accordance with statutory requirements. Depreciation and revaluation and impairment losses are therefore replaced by revenue provision in the General Fund Balance, by way of an adjusting transaction with the Capital Adjustment Account in the Movement in Reserves Statement for the difference between the two.
♦ Operating Leases
Rentals paid under operating leases are charged to the Comprehensive Income and Expenditure Statement as an expense of the services benefiting from use of the leased property, plant or equipment. Charges are made on a straight-line basis over the life of the lease, even if this does not match the pattern of payments (e.g. there is a rent-free period at the commencement of the lease).
The Council as Lessor
♦ Finance Leases
Where the Council grants a finance lease over a property or an item of plant or equipment, the relevant asset is written out of the Balance Sheet as a disposal. At the commencement of the lease, the carrying amount of the asset in the Balance Sheet (whether Property, Plant and Equipment or Assets Held for Sale) is written off to the Other Operating Expenditure line in the Comprehensive Income and Expenditure Statement as part of the gain or loss on disposal. A gain, representing the Council’s net investment in the lease, is credited to the same line in the Comprehensive Income and Expenditure Statement also as part of the gain or loss on disposal (i.e. netted off against the carrying value of the asset at the time of disposal), matched by a lease asset in the Balance Sheet.
Lease rentals receivable are apportioned between:
• A charge for the acquisition of the interest in the property – applied to write down the lease liability (together with any premiums received), and
Statement of Accounting Policies & Glossary of Financial Terms and Abbreviations
Statement of Accounts 114
• Finance income (credited to the Financing and Investment Income and Expenditure line in the Comprehensive Income and Expenditure Statement)
The gain credited to the Comprehensive Income and Expenditure Statement on disposal is not permitted by statute to increase the General Fund Balance and will be required to be treated as a capital receipt. Where a premium has been received, this is posted out of the General Fund Balance to the Capital Receipts Reserve in the Movement in Reserves Statement. Where the amount due in relation to the lease asset is to be settled by the payment of rentals in future financial years, this is posted out of the General Fund Balance to the Deferred Capital Receipts Reserve in the Movement in Reserves Statement. When the future rentals are paid, the element for the charge for the acquisition of the interest in the property is used to write down the lease asset. At this point, the deferred capital receipts are transferred to the Capital Receipts Reserve.
The written-off value of disposals is not a charge against council tax, as the cost of non-current assets is fully provided for under separate arrangements for capital financing. Amounts are appropriated to the Capital Adjustment Account from the General Fund Balance in the Movement in Reserves Statement.
♦ Operating Leases
Where the Council grants an operating lease over a property or an item of plant or equipment, the asset is retained in the Balance Sheet. Rental income is credited to the Other Operating Expenditure line in the Comprehensive Income and Expenditure Statement. Credits are made on a straight-line basis over the life of the lease, even if this does not match the pattern of payments (e.g. there is a premium paid at the commencement of the lease). Initial direct costs incurred in negotiating and arranging the lease are added to the carrying amount of the relevant asset and charged as an expense over the lease term on the same basis as rental income.
17 Overheads and Support Services
The costs of overheads and support services are charged to service segments in accordance with the Council’s arrangements for accountability and financial performance.
18 Property, Plant and Equipment
Assets that have physical substance and are held for use in the production or supply of goods or services, for rental to others or for administrative purposes and that are expected to be used during more than one financial year are classified as Property, Plant and Equipment.
Recognition
Expenditure on the acquisition, creation or enhancement of Property, Plant and Equipment is capitalised on an accruals basis, provided that it is probable that the future economic benefits or service potential associated with the item will flow to the Council and the cost of the item can be measured reliably. Expenditure that maintains but does not add to an asset’s potential to deliver future economic benefits or service potential (i.e. repairs and maintenance) is charged as an expense when it is incurred.
A de-minimis level of £2,000 has been adopted for vehicles and £15,000 for all other items. Assets that cost less than these limits are classified as revenue, rather than capital expenditure.
Statement of Accounting Policies & Glossary of Financial Terms and Abbreviations
Statement of Accounts 115
The Council is paying 7% of the infrastructure costs of Clay Farm, which is being developed for housing, net of the contributions made towards these costs by affordable housing providers. The Council is paying the infrastructure costs gross and receiving a credit in relation to the contribution made by affordable housing providers separately, which is estimated to be about 25% of the gross costs. The Council accounts for 75% of the gross costs as an enhancement to its land, recognising a net debtor or receipt in advance at the end of each financial year dependant on the credits received in respect of affordable housing providers. The Council does not consider the accounting for these costs net of affordable housing contributions leads to any material misstatement.
Measurement
Assets are initially measured at cost, comprising:
• The purchase price
• Any costs attributable to bringing the asset to the location and condition necessary for it to be capable of operating in the manner intended by management
• The initial estimate of the costs of dismantling and removing the item and restoring the site on which it is located
The cost of assets acquired other than by purchase is deemed to be its fair value, unless the acquisition does not have commercial substance and therefore will not increase the cash flows of the Council. In the latter case, where an asset is acquired via an exchange, the cost of the acquisition is the carrying amount of the asset given up by the Council.
Donated assets are measured initially at fair value. The difference between fair value and any consideration paid is credited to the Taxation and Non-Specific Grant Income line of the Comprehensive Income and Expenditure Statement, unless the donation has been made conditionally. Until conditions are satisfied, the gain is held in the Donated Assets Account. Where gains are credited to the Comprehensive Income and Expenditure Statement, they are reversed out of the General Fund Balance to the Capital Adjustment Account in the Movement in Reserves Statement.
Assets are then carried in the Balance Sheet using the following measurement bases:
• Infrastructure, community assets and assets under construction – depreciated historical cost
• Dwellings – current value, determined using the basis of existing use value for social housing (EUV-SH)
• Operational land and buildings – current value, determined as the amount that would be for the asset in its existing use (EUV). Where there is no market-based evidence of current value because of the specialist nature of an asset, depreciated replacement cost (DRC) is used as an estimate of current value.
• Surplus assets – the current value measurement basis is fair value, estimated at highest and best use from a market participant’s perspective.
• Vehicles, Plant & Equipment – as these assets have short lives or low values (or both), depreciated historical cost basis is used as a proxy for current value.
Assets included in the Balance Sheet at current value are revalued sufficiently regularly to ensure that their carrying amount is not materially different from their fair value at the year-end, but as a
Statement of Accounting Policies & Glossary of Financial Terms and Abbreviations
Statement of Accounts 116
minimum every five years. Increases in valuations are matched by credits to the Revaluation Reserve to recognise unrealised gains. Exceptionally, gains might be credited to the Comprehensive Income and Expenditure Statement where they arise from the reversal of a revaluation or impairment loss previously charged to a service.
Where decreases in value are identified, the revaluation loss is accounted for by:
• Where there is a balance of revaluation gains for the asset in the Revaluation Reserve, the carrying amount of the asset is written down against that balance (up to the amount of the accumulated gains)
• Where there is no balance in the Revaluation Reserve or insufficient balance, the carrying amount of the asset is written down against the relevant service line(s) in the Comprehensive Income and Expenditure Statement
The Revaluation Reserve contains revaluation gains recognised since 1 April 2007 only, the date of its formal implementation. Gains arising before that date have been consolidated into the Capital Adjustment Account.
Impairment
Assets are assessed each year-end as to whether there is any indication that an asset may be impaired. Where indications exist and any possible differences are estimated to be material, the recoverable amount of the asset is estimated and, where this is less than the carrying amount of the asset, an impairment loss is recognised for the shortfall.
Where impairment losses are identified, they are accounted for by:
• Where there is a balance of revaluation gains for the asset in the Revaluation Reserve, the carrying amount of the asset is written down against that balance (up to the amount of the accumulated gains)
• Where there is no balance in the Revaluation Reserve or insufficient balance, the carrying amount of the asset is written down against the relevant service line(s) in the Comprehensive Income and Expenditure Statement
Where an impairment loss is reversed subsequently, the reversal is credited to the relevant service line(s) in the Comprehensive Income and Expenditure Statement, up to the amount of the original loss, adjusted for depreciation that would have been charged if the loss had not been recognised.
Disposals and non-current assets held for sale
When it becomes probable that the carrying amount of an asset will be recovered principally through a sale transaction rather than through its continuing use, it is reclassified as an Asset Held for Sale. The asset is revalued immediately before reclassification and then carried at the lower end of this amount and fair value less costs to sell. Where there is a subsequent decrease to fair value less costs to sell, the loss is posted to the Other Operating Expenditure line in the Comprehensive Income and Expenditure Statement. Gains in fair value are recognised only up to the amount of any previously recognised losses. Depreciation is not charged on Assets Held for Sale.
The Council is undertaking a number of housing redevelopments where part of the cost of building social housing units is being ‘paid’ by the transfer of land on which the developer will build and sell
Statement of Accounting Policies & Glossary of Financial Terms and Abbreviations
Statement of Accounts 117
market units. The Council assesses that it transfers the risks and rewards of ownership of this land at the point that the agreement with the developer becomes unconditional rather than at legal disposal (once the value of social housing build work equals the value of the land).
If assets no longer meet the criteria to be classified as Assets Held for Sale, they are reclassified back to non-current assets and valued at the lower of their carrying amount before they were classified as held for sale; adjusted for depreciation, amortisation or revaluations that would have been recognised had they not been classified as Held for Sale, and their recoverable amount at the date of the decision not to sell.
Assets that are to be abandoned or scrapped are not reclassified as Assets Held for Sale. Housing sold under the Right to Buy legislation is not reclassified as Assets Held for Sale as its primary purpose remains as a dwelling until the point of disposal and it is only considered significantly more likely than probable that a disposal will actually occur very close to the disposal itself. The carrying value of housing sold under right to buy remains the same as if it had been transferred to assets held for sale.
When an asset is disposed of or decommissioned, the carrying amount of the asset in the Balance Sheet (whether Property, Plant and Equipment or Assets Held for Sale) is written off to the Other Operating Expenditure line in the Comprehensive Income and Expenditure Statement also as part of the gain or loss on disposal. Receipts from disposals (if any) are credited to the same line in the Comprehensive Income and Expenditure Statement also as part of the gain or loss on disposal (i.e. netted off against the carrying value of the asset at the time of disposal). Any revaluation gains accumulated for the asset in the Revaluation Reserve are transferred to the Capital Adjustment Account.
Amounts received for a disposal in excess of £10,000 are categorised as capital receipts. A proportion of receipts relating to housing disposals are payable to the Government. The balance of receipts is required to be credited to the Capital Receipts Reserve, and can then only be used for new capital investment or set aside to reduce the Council’s underlying need to borrow (the capital financing requirement). Receipts are appropriated to the Reserve from the General Fund Balance in the Movement in Reserves Statement.
The written-off value of disposals is not a charge against council tax, as the cost of non-current assets is fully provided for under separate arrangements for capital financing. Amounts are appropriated to the Capital Adjustment Account from the General Fund Balance in the Movement in Reserves Statement.
Depreciation
Depreciation is provided for on all Property, Plant and Equipment assets by the systematic allocation of their depreciable amounts over their useful lives. An exception is made for assets without a determinable finite useful life (i.e. freehold land and certain Community Assets) and assets that are not yet available for use (i.e. assets under construction).
Depreciation is calculated on the following bases:
• Dwellings and other buildings – straight-line allocation over the useful life of the property as estimated by the valuer
• Vehicles, plant and equipment – a percentage of the value of each class of assets in the Balance Sheet, as advised by a suitably qualified officer
Statement of Accounting Policies & Glossary of Financial Terms and Abbreviations
Statement of Accounts 118
• Infrastructure – a percentage of the value of each class of assets in the Balance Sheet, as advised by a suitably qualified officer
Depreciation is based on the value of assets as at 1 April, so no charge is made in the year of acquisition and a full charge is made in the year of disposal.
Where an item of Property, Plant and Equipment asset has major components whose cost is significant in relation to the total cost of the item, the components are depreciated separately.
Revaluation gains are also depreciated, with an amount equal to the difference between current value depreciation charged on assets and the depreciation that would have been chargeable based on their historical cost being transferred each year from the Revaluation Reserve to the Capital Adjustment Account.
19 Heritage Assets
Heritage assets are assets with historical, artistic, scientific, technological, geophysical or environmental qualities which are held and maintained principally for their contribution to knowledge and culture.
Heritage assets are recognised and measured (including the treatment of revaluation gains and losses) in accordance with the Council’s accounting policies on property, plant and equipment. However, some of the measurement rules are relaxed in relation to heritage assets as detailed below.
Civic Regalia
The collection of civic regalia includes ceremonial maces, chains of office and other civic items. These items are reported in the balance sheet at insurance valuation which is based on market values. Further information on the most significant items in the collection can be found on the Council’s website.
Art Collection
The art collection (both oil and watercolour) includes portraits of historic figures with links to the city (many of them previous mayors and MPs) and paintings of the city. These items are reported in the balance sheet at insurance valuation which is based on market values. These items are deemed to have indeterminate lives and high residual values so the Council does not consider it appropriate to charge depreciation.
The civic regalia and art collection are deemed to have indeterminate lives and high residual values so the Council does not consider it appropriate to charge depreciation. The Council does not normally make any purchases or disposals of these items. The carrying amounts of heritage assets are reviewed where there is evidence of impairment, for example where there is physical deterioration, breakage or doubts as to authenticity. Any impairment is recognised and measured in accordance with the Council’s general policy on impairment of non-current assets.
Cellarer’s Chequer
The Council owns Cellarer’s Chequer on the site of Barnwell Priory. The Cellarer was the second most important position in a monastery after the Abbot, dealing with the sourcing of provisions and
Statement of Accounting Policies & Glossary of Financial Terms and Abbreviations
Statement of Accounts 119
supplies for the community. The Chequer is constructed from Barnack Stone with a tiled roof. It is in Early English style and is thought to be mid 13th century, retaining a doorway, windows and fireplace from this period. Further details can be found on the Council’s website.
The Council considers that obtaining an accurate valuation for the Chequer would involve a disproportionate cost in comparison to the benefits to users of the accounts. This is because of the lack of comparable values. Consequently this asset is not recognised on the balance sheet.
20 Provisions, Contingent Liabilities and Contingent Assets
Provisions
Provisions are made where an event has taken place that gives the Council a legal or constructive obligation that probably requires settlement by a transfer of economic benefits or service potential, and a reliable estimate can be made of the amount of the obligation. For instance, the Council may be involved in a court case that could eventually result in the making of a settlement or the payment of compensation.
Provisions are charged as an expense to the appropriate service line in the Comprehensive Income and Expenditure Statement in the year that the Council becomes aware of the obligation, and measured at the best estimate at the balance sheet date of the expenditure required to settle the obligation, taking into account relevant risks and uncertainties.
When payments are eventually made, they are charged to the provision carried in the Balance Sheet. Estimated settlements are reviewed at the end of each financial year – where it becomes less than probable that a transfer of economic benefits will now be required (or a lower settlement than anticipated is made), the provision is reversed and credited back to the relevant service.
Where some or all of the payment required to settle a provision is expected to be recovered from another party (e.g. from an insurance claim), this is only recognised as income for the relevant service if it is virtually certain that reimbursement will be received if the Council settles the obligation.
Contingent Liabilities
A contingent liability arises where an event has taken place that gives the Council a possible obligation whose existence will only be confirmed by the occurrence or otherwise of uncertain future events not wholly within the control of the Council. Contingent liabilities also arise in circumstances where a provision would otherwise be made but either it is not probable that an outflow of resources will be required or the amount of the obligation cannot be measured reliably.
Contingent liabilities are not recognised in the Balance Sheet but disclosed in a note to the accounts.
Contingent Assets
A contingent asset arises where an event has taken place that gives the Council a possible asset whose existence will only be confirmed by the occurrence or otherwise of uncertain future events not wholly within the control of the Council.
Statement of Accounting Policies & Glossary of Financial Terms and Abbreviations
Statement of Accounts 120
Contingent assets are not recognised in the Balance Sheet but disclosed in a note to the accounts where it is probable that there will be an inflow of economic benefits or service potential.
21 Reserves
The Council sets aside specific amounts as reserves for future policy purposes or to cover contingencies. Reserves are created by appropriating amounts out of the General Fund Balance in the Movement in Reserves Statement. When expenditure to be financed from a reserve is incurred, it is charged to the appropriate service in that year to score against the surplus/deficit on the provision of services in the Comprehensive Income and Expenditure Statement. The reserve is then appropriated back into the General Fund Balance in the Movement in Reserves Statement so that there is no net charge against council tax for the expenditure.
Certain reserves are kept to manage the accounting processes for non-current assets, financial instruments and retirement benefits and do not represent usable resources for the Council – these reserves are explained in the relevant policies.
22 Revenue Expenditure Funded from Capital under Statute
Expenditure incurred during the year that may be capitalised under statutory provisions but does not result in the creation of a non-current asset has been charged as expenditure to the relevant service in the Comprehensive Income and Expenditure Statement in the year. Where the Council has determined to meet the cost of this expenditure from existing capital resources or by borrowing, a transfer in the Movement in Reserves Statement from the General Fund Balance to the Capital Adjustment Account then reverses out the amounts charged so that there is no impact on the level of council tax.
23 Value Added Tax (VAT)
VAT payable is included as an expense only to the extent that it is not recoverable from Her Majesty’s Revenue and Customs. VAT receivable is excluded from income.
24 Foreign Exchange Translation
Where the Council has entered into a transaction denominated in a foreign currency, the transaction is converted into sterling at the exchange rate on the date that the transaction was effective. Where amounts in foreign currency are outstanding at the year-end they are converted at the spot exchange rate at 31 March. Resulting gains or losses are recognised in the Financing and Investment Income and Expenditure line in the Comprehensive Income and Expenditure Statement.
25 Group Accounts
Subsidiary entities are those over which the Council is exposed to, or has rights to, variable returns from its involvement with the entity and has the ability to affect those returns through its power over the entity. The income, expense, assets, liabilities, equity and reserves of subsidiaries are consolidated in full into the appropriate financial statement lines. Appropriate adjustments are made to align the accounting policies of subsidiaries with those of the Council.
Statement of Accounting Policies & Glossary of Financial Terms and Abbreviations
Statement of Accounts 121
Joint ventures are arrangements in which the Council has joint control with one or more other parties, and where it has the rights to the net assets of the arrangement.
Joint ventures are recognised in the group accounts using the equity method. The investment is initially recognised at cost. It is increased it decreased subsequently to reflect the Council’s share of the entity’s profit or loss or other gains and losses following acquisition. Once the value of the investment reaches zero it is not reduced further.
Unrealised profits on transactions with Joint Ventures are only eliminated against the investment to the extent that it reduces the carrying value of the investment in the group accounts to zero. The Council does not then recognise further profits in the Joint Venture until they exceed unrecognised unrealised profits.
Where the impact of entities on the group accounts is considered to be immaterial they are not consolidated.

Statement of Accounting Policies & Glossary of Financial Terms and Abbreviations
Statement of Accounts 123
Glossary of Financial Terms and Abbreviations
Accounting Period
The period of time covered by the accounts, normally 12 months commencing on 1 April for local authorities.
Accruals
Sums included in the final accounts to cover income or expenditure attributable to the accounting period but for which payment has not been made/received at the balance sheet date.
Amortisation
A measure of the consumption of the value of intangible assets, based on the remaining economic life.
Capital Expenditure
Expenditure on new assets such as land and buildings, or on enhancements to existing assets which significantly prolong their useful life or increase their value.
Capital Receipt
Income from the sale of capital assets such as council houses, land or other buildings.
Cash Equivalents
Cash equivalents are investments that mature in 30 days or less from the date of acquisition and that are readily convertible to known amounts of cash with insignificant risk of change in value.
Contingent Liabilities
Potential liabilities which are either dependent on a future event or cannot be reliably estimated.
Creditors
Amounts owed by the Council at 31 March for goods received or services rendered but not yet paid for.
Current Assets
Assets which can be expected to be consumed or realised during the next accounting period.
Current Liabilities
Amounts which will become due or could be called upon during the next accounting period.
Statement of Accounting Policies & Glossary of Financial Terms and Abbreviations
Statement of Accounts 124
Debtors
Amounts owed to the Council which are collectable or outstanding at 31 March.
Depreciation
A measure of the consumption of the value of non-current assets, based on the remaining economic life.
Effective rate of interest
The rate of interest that will discount the estimated cash flows over the life of a financial instrument to the amount in the balance sheet at initial measurement.
Equity instrument
A contract that evidences a residual interest in the assets of an entity after deducting all of its liabilities (e.g. an equity share in a company.)
Fair Value
The amount for which an asset could be exchanged, or a liability settled, between knowledgeable, willing parties in an arm’s length transaction.
Finance Lease
A lease that transfers substantially all of the risks and rewards of ownership of a non-current asset to the lessee.
Financial Asset
A right to future economic benefits controlled by the Council. Examples include bank deposits, investments, trade receivables and loans receivable.
Financial Liability
An obligation to transfer economic benefits controlled by the Council. Examples include borrowings, financial guarantees and amounts owed to trade creditors.
Financial Instrument
Any contract that gives rise to a financial asset of one entity and a financial liability or equity instrument of another.
Government Grants
Payments by central government towards local council expenditure. They may be specific, for example Housing Benefit subsidy, or general such as Revenue Support Grant.
Statement of Accounting Policies & Glossary of Financial Terms and Abbreviations
Statement of Accounts 125
Heritage Assets
Heritage Assets are assets with historical, artistic, scientific, technological, geophysical or environmental qualities which are held and maintained principally for their contribution to knowledge and culture.
Impairment
The term used where the estimated recoverable amount from an asset is less than the amortised cost at which the asset is being carried on the balance sheet.
Non-current assets
Assets which can be expected to be of use or benefit the Council in providing its service for more than one accounting period.
Operating Lease
A lease under which the ownership of the asset remains with the lessor; for practical purposes it is equivalent to contract hiring.
Outturn
Refers to actual income and expenditure or balances as opposed to budgeted amounts.
Precepts
The amount which a local council which cannot levy a council tax directly on the public (for example a County Council or Police &) requires to be collected on its behalf.
Provisions
Monies set aside for liabilities which are likely to be incurred but where exact amounts or dates are uncertain.
Reserves
Amounts set aside in the accounts for the purpose of meeting particular future expenditure. A distinction is drawn between reserves and provisions which are set up to meet known liabilities.
Revenue Expenditure
Spending on day to day items including employees’ pay, premises costs and supplies and services.
Revenue Expenditure Funded From Capital Under Statute
Expenditure which legislation allows to be classified as capital for funding purposes when it does not result in the expenditure being carried on the Balance Sheet as a non-current asset. The purpose of this is to enable it to be funded from capital resources rather than be charged to the General Fund and impact on that year’s council tax.
Statement of Accounting Policies & Glossary of Financial Terms and Abbreviations
Statement of Accounts 126
Revenue Support Grant
Grant paid by central government to a local council towards the costs of its services.
The Code
The Code of Practice on Local Authority Accounting in the United Kingdom 2017/18. This specifies the principals and practices of accounting required to give a ‘true and fair’ view of the financial position and transactions of a local authority.
Statement of Accounting Policies & Glossary of Financial Terms and Abbreviations
Statement of Accounts 127
Abbreviations used in the accounts CIPFA Chartered Institute of Public Finance and Accountancy
GAAP Generally Accepted Accounting Practice
HRA Housing Revenue Account
IAS International Accounting Standard
IFRS International Financial Reporting Standard
LAAP Local Authority Accounting Panel
LGPS Local Government Pension Scheme
MRP Minimum Revenue Provision
NNDR National Non-Domestic Rates
SERCOP Service Reporting Code of Practice
SOLACE Society of Local Authority Chief Executives and Senior Managers