Embed Size (px)
Citation preview

Statement of Accounts for the year ended 31st March 2019


CONTENTS Page Narrative Report 2 Independent Auditor’s Report 13 Statement of Responsibilities for the Statement of Accounts 16 Group Accounts 17 Movement in Reserves Statement 23 Comprehensive Income and Expenditure Statement 25 Balance Sheet 26 Cash Flow Statement 27 Notes to Core Financial Statements 28 Pension Fund Account 90 Glossary of Terms Used in the Accounts 92

TABLE OF NOTES & PAGE NUMBERS Note Page 1 Accounting policies 28 1.1 General principles 28 1.2 Accruals of income and expenditure 29 1.3 Cash and cash equivalents 29 1.4 Prior period adjustments, changes in accounting policies and
estimates and errors 30
1.5 Charges to revenue for non-current assets 30 1.6 Employee benefits 30 1.7 Events after the balance sheet date 32 1.8 Financial instruments 33 1.9 Government grants and contributions 34 1.10 Property, plant and equipment 34 1.11 Donated assets 37 1.12 Intangible assets 38 1.13 Basis of valuation of inventories 38 1.14 Accounting for leases – authority as lessee 38 1.15 Overheads and support services 38 1.16 Private Financing Initiative (PFI) 38 1.17 Provisions, contingent liabilities and contingent assets 39 1.18 Reserves 40 1.19 Revenue expenditure funded from capital under statute
(REFCUS) 40
1.20 VAT 40 1.21 Group accounts 40 1.22 Council tax income 40 2 Accounting standards that have been issued but have not
yet been adopted 41
3 Critical judgements in applying accounting policies 41 4 Assumptions made about the future and other major
sources of estimation uncertainty 41
4.1 Property, plant and equipment 42 4.2 Pension liability 42 5 5.1 5.2 6
Expenditure and Funding Analysis Expenditure and Funding Analysis Note to Expenditure and Funding Analysis Movement in Reserves Statement
43 43 43 46
6.1 Adjustments between accounting basis and funding basis under regulations
46

7 Comprehensive Income and Expenditure Statement 47 7.1 Non distributed costs 47 7.2 Gain / Loss on the disposal of property, plant and equipment 47 7.3 Members’ allowances 48 7.4 Employee remuneration 48 7.5 Exit packages 49 7.6 Termination benefits 50 7.7 External audit fees 50 7.8 Minimum revenue provision (MRP) 50 7.9 Operating leases 50 7.10 Amounts reported for resource allocation decisions 51 7.11 Grant income 51 7.12 Related parties 51 7.13 Community Interest Company 54 7.14 Vital Fire Solutions Limited 54 8 Balance Sheet 55 8.1 Intangible Assets 55 8.2 Operational Assets 56 8.3 Non-operational Assets 58 8.4 Sources of funds to meet capital expenditure and other plans 58 8.5 Capital expenditure and capital financing 58 8.6 Capital commitments 59 8.7 Information on assets held 59 8.8 Inventories 60 8.9 Debtors 60 8.10 Cash and cash equivalents 60 8.11 Creditors 61 8.12 Financial instruments 61 8.13 Provisions 64 8.14 Deferred liabilities 65 8.15 Private financing initiative (PFI) scheme 66 8.16 International accounting standard 19 (IAS19) defined benefit
pension schemes 67
8.17 Reserves 80 8.18 Movement in earmarked reserves 83 8.19 Earmarked reserves 83 8.20 Unusable reserves 84 8.21 General reserve 87 8.22 Contingent assets and contingent liabilities 87 8.23 Authorisation of accounts for issue/post balance sheet events 87 9 Cash Flow Statement 88 9.1 Adjustments to net surplus or deficit on the provision of services
for non-cash movements 88
9.2 Operating activities 88 9.3 Investing activities 88 9.4 Financing activities 89 9.5 Reconciliation of Liabilities Arising From Financing Activities 89 9.6 Net increase in cash and cash equivalents 89


NARRATIVE REPORT
2
1. Message from Anthony Hope CPFA – Treasurer to County Durham and
Darlington Fire and Rescue Authority.
County Durham and Darlington Fire and Rescue Authority remains committed to protecting front line services to the public however this is becoming increasingly difficult as the reductions in funding from government continue. 2019/20 is the last year of the government’s four-year funding settlement and the funding position from 2020/21 onwards is currently unknown. In order to balance the budget going forward the Authority will be required to make operational changes to front line service provision for the first time since the beginning of austerity in 2010. These changes will be managed through the Emergency Response Review which will ensure that the impact of operational changes on emergency response standards is kept to a minimum.
The Authority has set a balanced budget for the forthcoming financial year (2019/20) and needs to identify a further £1.5M of savings during the period 2020/21 to 2022/23. Work is ongoing through the Emergency Response Review to identify further savings options to assist in balancing the budget in future years.
This document (the “Statement of Accounts”) presents the published accounts for County Durham and Darlington Fire and Rescue Authority (referred to as the “Authority” throughout this document) for the year ended 31st March 2019. It is my intention to provide the readers of these accounts with information about the money that the Authority has received and spent during the financial year, that it has been accounted for properly, that the financial standing of the Authority continues to be secure and that the service delivered by the Authority continues to meet the principles of value for money at all times.
The presentation of the accounts has been designed to assist readers in understanding and interpreting the financial statements, which follow accounting standards and are, by their nature, complex in some areas. I would like to take this opportunity to thank officers of the Fire and Rescue Authority and Durham County Council, who have co-operated to produce this Statement of Accounts.
I hope that this document proves to be both informative and of interest to readers, the Authority is keen to improve both the quality and suitability of the information provided, so your feedback would be welcome. If you have any suggestions or comments on either the format of the report or its contents, or if you would like any further information, please contact my office:
Telephone 0191 375 5554 E-mail [email protected] Write to: The Treasurer
County Durham and Darlington Fire and Rescue Authority Fire and Rescue Service Headquarters Belmont Business Park Durham DH1 1TW
Anthony Hope CPFA Treasurer to County Durham and Darlington Fire and Rescue Authority

NARRATIVE REPORT
3
2. Introduction
The purpose of the Statement of Accounts is to give electors, those subject to locally levied taxes and charges, members of the Authority, employees and other interested parties clear information about the finances of the Authority. It is important in demonstrating the stewardship of public money and shows the resources available and how they have been used to deliver services. The purpose of this Narrative Report is to provide a clear guide to the most significant matters reported in the accounts. It explains the purpose of the financial statements that follow and provides a summary of the Authority’s financial activities during 2018/19 and its financial position at 31 March 2019. This report focuses on the matters that are of relevance to the principal users of the accounts. In addition to complementing and supplementing the information provided in the accounts, it also provides a forward look at the issues that have affected the development, performance and position of the Authority during the financial year, which are likely to have an impact in the future. The Narrative Report includes:
1. Message from the Treasurer
2. Introduction
3. Background to County Durham and Darlington Fire and Rescue Authority
4. Financial Performance 2018/19
5. Non-Financial Performance 2018/19
6. Operating Environment and Future Plans
7. Going Concern
8. Statement of Accounts
3. Background to County Durham and Darlington Fire and Rescue Authority
The Authority was established as a separate corporate body covering the County of Durham and Darlington Borough under the provisions of the Durham Fire Services (Combination Scheme) Order 1996. The Authority comprises members appointed by Durham County Council and Darlington Borough Council. With effect from 1 April 2004, the Fire and Rescue Authority became a precepting authority as defined under the Local Government Finance Act 1992.
4. Financial Performance 2018/19
Review of the Financial Year
The Authority’s spending is planned and controlled by a rigorous budget and financial management process. The Authority received resources direct from the Government in the form of Revenue Support Grant and Non-Domestic Rates, with the balance of funding coming from precepts on billing authorities for amounts chargeable to local taxpayers. During 2018/19, the Authority’s net revenue expenditure, which was met from the above sources, was £28.654m, while spending on capital projects totalled £1.060m.

NARRATIVE REPORT
4
The Authority’s general reserve balance, which represents the sum set aside to meet unforeseen future circumstances, was £1.425m at 31 March 2019. This equates to 5% of the 2019/20 net expenditure budget and is in line with the Authority’s policy on reserves to maintain a general reserve of 5% of net expenditure. Financial performance against the approved budget is reported to elected members on a quarterly basis throughout the year. Further information on the Authority’s financial performance is available on our website: www.ddfire.gov.uk. Revenue Income and Expenditure The estimated net revenue expenditure for 2018/19, to be met from Government Grants and local taxpayers, was approved at £28.507m. The following table summarises the actual revenue financial position for the year in comparison with the budget:
Budget Heading Original Budget Actual Variance
Expenditure
£000 £000 £000 %
Employees 21,542 21,546 4 0.02
Premises 2,624 2,677 53 2.02
Transport 599 640 41 6.84
Supplies & Services 4,096 4,106 10 0.24
Contingencies 335 - -335 -100.00
Capital Financing 1,544 2,346 802 51.94
Transfers to Reserves - 635 635 100.00
Total Expenditure
30,740 31,950 1,210 3.94
Income
Government Grants -1,584 -1,702 -118 7.45
Other Income -387 -924 -537 138.76
Transfers from Earmarked Reserves -262 -670 -408 155.73
Total Income -2,233 -3,296 -1,063 47.60
Net Expenditure Taxation and Non Specific Grants Income Outturn
28,507
-28,507
28,654
-28,691
147
-184
0.52
0.65
- -37 -37

NARRATIVE REPORT
5
An explanation of the major variances is provided in the table below:
Over spend / Under
spend (-)
Over spend / Under
spend (-)
Explanation for major variances
£m %
Employees 0.004 0.02 Employee costs are generally in line with budget.
Premises 0.053 2.02 An increase in premises insurance is partially offset by savings achieved as a result in the reduction of the cost of the cleaning contract.
Transport 0.042 6.84 The amounts paid in vehicle insurance excesses have increased, following a decision to increase the excess payable in the event of an incident, in order to reduce insurance premiums. There has been an additional overspend on materials used for vehicle repairs and maintenance.
Supplies & Services
0.009 0.24 Supplies & Services costs are generally in line with budget.
Contingencies -0.335 -100.00 The contingencies budget includes an allowance for inflation and pay awards which was not required.
Capital Financing 0.802 51.94 An additional revenue contribution to finance capital expenditure was made at the year end to reduce the need for future borrowing
Transfers to Reserves
0.635 100.00 Grant money received for the Emergency Services Mobile Communications Programme (ESMCP) Project has been transferred to the Earmarked Reserve in order to fund future project work. In addition, a transfer of the underspend against budget has been made to the Modernisation in reserve in order to fund future capital and reduce the need for borrowing.
Government Grants Other Income Taxation & Non-specific grants
-0.118
-0.537
-0.184
7.45
138.76
0.65
Additional grant income was received in relation to the Emergency Services Mobile Communications Programme (ESMCP) and The New Risks Programme which was not anticipated when the original budget was set. The increase in other income was due to an increase in investment interest, income from secondments and the contribution to the service from the Community Interest Company and Vital Fire Solutions Limited for work carried out by Service employees. Additional grant income was received in relation to the business rates retention scheme which was not anticipated when the original budget was set.
Contributions from Reserves
-0.408 155.73 Transfers were made from the Community Safety Reserve, Mobilisation Reserve and Civil Resilience Reserve in order to meet the costs of projects undertaken during the year.
Total -0.037

NARRATIVE REPORT
6
Capital Expenditure The Authority approved a capital programme for 2018/19 of £4.874m. The actual capital expenditure for the year was £1.060m; £3.814m less than the original budget. The following table analyses the expenditure:
Project Original Budget
Actual Variance
£m £m £m Vehicles, Plant & Equipment 0.624 0.353 -0.271 Land & Buildings 4.250 0.707 -3.543
Total Expenditure 4.874 1.060 -3.814
The variances are set out in the table below:
Over spend / Under
spend (-)
Over spend / Under
spend (-)
Explanation for major variances
Vehicles, Plant & Equipment
£m
-0.271
%
-43.43
The underspend was due to changes to the planned timing of the replacement of some items of vehicles, plant and equipment.
Land & Buildings -3.543 -83.36 Changes to the estimated build times of capital projects resulted in expenditure originally planned for 2018/19 slipping into the next financial year.
Total -3.814 -78.25
Capital expenditure was financed by revenue contributions and capital receipts. The Authority’s Capital Financing Requirement was £8.444m at 31 March 2019. Further details are set out in Note 8.5 to the accounts. Future Capital Commitments The Authority has agreed to replace Darlington fire station with a new building on the existing site and work will commence on the project during 2019/20. ICT, vehicles, plant and operational equipment will continue to be renewed in accordance with agreed replacement programmes. Current Borrowing Facilities and Capital Borrowing Provision The Budget Report, incorporating Prudential Indicators and the Treasury Management Strategy, submitted to the Authority meeting on 13 February 2018, detailed the 2018/19 borrowing limits for the Authority.

NARRATIVE REPORT
7
The specific borrowing limits, set under the requirements of the Prudential Code, were as follows:
• Authorised Limit for External Debt for 2018/19 of £12.192m;
• Operational Boundary for External Debt for 2018/19 of £11.083m.
Pension Liability
The Authority’s accounts are compliant with International Accounting Standard 19 (IAS19) which is based on the principle that an organisation should account for retirement benefits when it is committed to giving them, even if the actual payment of those benefits will be many years into the future.
The net overall impact of IAS19 accounting entries is neutral in the accounts. However, the overall financial position is in effect being distorted by future years’ pension deficits. The fact that all pension costs would never be incurred in one year (as implied by IAS19) means the Balance Sheet Net Worth is effectively being distorted by this reporting standard. If this element is removed then the Authority has a “real” net worth of £42.126m. The Authority also has assets worth £54.0m and cash backed reserves of £7.3m, which support the view that the Authority’s Balance Sheet and finance are in fact healthier than implied by the published accounts.
Further details of the impact of IAS19 are set out in note 8.16 to the accounts.
5. Non- Financial Performance 2018/19
Performance is monitored by management on an on-going basis and considered in detail by elected members at the end of each quarter. A comprehensive suite of performance indicators (PI’s) are employed to measure both operational and corporate performance and targets are set with the aim of achieving continuous improvement. During 2018/19, 60% of the strategic PI’s met or exceeded their target level and 66% either maintained or improved when compared to the previous year’s performance. Information on current performance is reported to the Fire Authority on a quarterly basis and further information is available on our website: www.ddfire.gov.uk.
6. Operating Environment and Future Plans
The plans of the Authority have been developed in a very challenging economic climate and during a time of significant change for local government. Looking ahead, the Authority’s revenue expenditure for 2019/20 is estimated at £28.409m, together with a capital programme of £5.659m. The Authority will continue to face significant reductions in Government funding over the Medium-Term Financial Plan period of 2019/20 to 2022/23. The 2019/20 budget has been prepared taking this funding reduction into account. Significant efficiency savings and service transformational savings have been identified to enable the Authority to set a balanced budget.

NARRATIVE REPORT
8
The Medium-Term Financial Plan outlines the financial position of the Authority over the next 4 years, and is set out in the table below:
2019/20 2020/21 2021/22 2022/23
£m £m £m £m
Net Expenditure 28.409 28.851 29.520 30.223
Total Government Funding 9.024 8.573 8.144 7.737
Local Business Rates 1.409 1.409 1.409 1.409
Council Tax 17.865
18.409 18.969 19.546
Surplus on Collection Fund 0.111 - - -
Total Funding 28.409 28.391 28.522 28.692
Shortfall - -0.460 -0.998 -1.531
The Authority needs to identify a further £1.531m of savings during the period 2020/21 to 2022/23. Work is ongoing through the Authority’s Emergency Response Review to identify further savings options to assist in balancing the budget in future years. During this continued period of austerity, the main priority of the Authority continues to be the protection of front-line services to the public. Over the medium term, this needs to be balanced with the need for the Authority to reduce expenditure. The Policing and Crime Act has significant implications for Fire and Rescue Authorities. The Act requires fire, police and ambulance services to collaborate, where the proposed collaboration would be in the interests of their own efficiency and effectiveness and one or more of the other services take the same view. The legislation also makes provision for a Police and Crime Commissioner (PCC) to take responsibility for the fire and rescue service in their area where a local business case is made, as well as to take the additional step to create a single employer for police and fire. County Durham and Darlington Fire and Rescue Service has an excellent track record of collaboration and has secured government funding to progress a number of innovative collaboration projects. This included funding for the building of a new quad station at Barnard Castle which provides a joint facility for the Fire, Police, Ambulance and Mountain Rescue Services. Going forward, the service will continue to work with collaboratively with partners in order to secure further efficiencies to assist in protecting front line service provision.
7. Going Concern
Each year, the Authority makes an assessment of whether it should be considered a “Going Concern”, and whether the accounts should be prepared on that basis. This assessment covers the period of at least 18 months from the Balance Sheet date. The Code requires that a local authority’s Statement of Accounts is prepared on a Going Concern basis; that is the accounts should be prepared on the assumption that the functions of the Authority will continue in operational existence for the foreseeable future.

NARRATIVE REPORT
9
In assessing its ability to continue as a Going Concern, an organisation must consider its financial performance. This should consider factors relating to historical, current and future performance. The future plans of the Authority are set out in Section 6 and demonstrate that:
• the Authority has set a balanced budget for 2019/20 and has a plan in place to continue to deliver local services until at least 2021. On this basis, it is apparent that the Authority remains a Going Concern;
• the Authority has demonstrated robust financial management through the level of reserves it holds. This underpins its Going Concern status;
• throughout the process for the Medium-Term Financial Plan, no risks were identified which would indicate that the Authority cannot continue as a Going Concern.
Based on the assessment undertaken and reported to those charges with governance of the Authority:
• the Authority has a history of financial stability and ready access to financial resources in the future;
• there are no significant financial, operating or other risks that would threaten the continuing operation of the Authority.
On this basis, the Authority is a Going Concern and it is appropriate for the Statement of Accounts to be prepared on that basis.
8. Statement of Accounts
The Statement of Accounts for the financial year 2018/19 is prepared in accordance with the Code of Practice on Local Authority Accounting in the UK (the Code) 2018/19. The Code is based on International Financial Reporting Standards (IFRS) and has been developed by the CIPFA/ LASAAC Code Board which is overseen by the Financial Reporting Advisory Board. The Code is based on approved accounting standards issued by the International Accounting Standards Board and interpretations of the International Financial Reporting Interpretations Committee, except where these are inconsistent with specific statutory requirements. The Code also draws on approved accounting standards issued by the International Public Sector Accounting Standards Board and the UK Accounting Standards Board where these provide additional guidance. The Code has been prepared on the basis of accounting standards and interpretations in effect for accounting periods commencing on or before 1 January 2018. This edition of the Code applies for accounting periods commencing on or after 1 April 2018. It supersedes the edition published on 1st April 2017 (the 2017/18 Code). The overriding requirement of the Code remains that the Statement of Accounts gives a ‘true and fair’ view of the financial position and transactions of the Authority.

NARRATIVE REPORT
10
The Statement of Accounts for the year ended 31 March 2019 include the following:
• Independent Auditor’s Report
The report of the independent, external auditor on the Fire Authority’s Statement of
Accounts.
• Statement of Responsibilities for the Statement of Accounts
This sets out the responsibilities of the Authority and the Treasurer and includes the
Treasurer’s certificate.
• Group Accounts
The Group Financial Statements consolidate the performance and balances that
relate to the Authority’s subsidiary companies (County Durham and Darlington Fire
and Rescue Community Interest Company and Vital Fire Solutions Limited) into the
Authority’s Statements. This allows the full picture of the Group activities to be
presented.
• Movement in Reserves Statement
This statement shows the movement in the year on the various reserves held by the
Authority. This is analysed into “usable reserves” (those that can be applied to fund
expenditure or reduce local taxation) and “unusable reserves”. The Surplus or Deficit
on the Provision of Services line shows the true economic cost of providing services;
more details of which are shown in the Comprehensive Income and Expenditure
Statement. This is different from the statutory amounts required to be charged to the
General Fund for the purposes of council tax setting. The Net Increase / Decrease
before Transfers to Earmarked Reserves line shows the statutory General Fund
balance before any discretionary transfers to or from Earmarked Reserves are made.
• Comprehensive Income and Expenditure Statement
This discloses the income receivable and expenditure incurred in operating the
Authority for the year. This is the accounting cost of providing services in accordance
with generally accepted accounting practices, rather than the amount to be funded
from taxation. Authorities raise taxation to cover expenditure in accordance with
regulations, which may be different from the accounting cost. The taxation position
is reflected in the Movement in Reserves Statement.
• Balance Sheet
This shows the financial position of the Authority at the year end. The net assets of
the Authority (assets less liabilities) are matched by the Reserves held. Reserves are
reported under two categories:
Usable Reserves - those reserves which may be used to provide services,
subject to the need to maintain a prudent level of reserves and any statutory
limitations on their use (for example, the Capital Receipts Reserve may only be used
to fund capital expenditure or repay debt).

NARRATIVE REPORT
11
Unusable Reserves – those reserves which cannot be used to provide
services. This category of reserves includes reserves that hold unrealised gains and
losses (for example the Revaluation Reserve), where amounts would only become
available to provide services if the assets were sold. It also includes reserves that
hold timing differences shown in the Movement in Reserves Statement line
“Adjustments between accounting basis and funding basis under regulations”.
• Cash Flow Statement
This summarises the inflows and outflows of cash arising from the transactions with
other parties for revenue and capital purposes. It shows how the Authority generates
and uses cash and cash equivalents by classifying cash flows as operating, investing
and financing activities. The amount of net cash flows arising from operating activities
is a key indicator of the extent to which the operations of the Authority are funded
from taxation and grant income or from the receipts from services provided. Investing
activities represent the extent to which cash outflows have been made for resources
which are intended to contribute to the future service delivery of the Authority. Cash
flows arising from financing activities are useful in predicting claims on the future
cash flows by providers of capital (i.e. borrowing) to the Authority.
• Notes to the Accounts
The notes to the accounts are fundamentally important in the presentation of a true
and fair view. They aim to assist understanding and have three significant roles:
o presenting information about the basis of preparation of the financial
statements and the specific accounting policies used;
o disclosing information required by the Code that is not presented elsewhere
in the financial statements;
o providing information that is not provided elsewhere in the financial
statements but is relevant to the understanding of them. This applies to
information that is material in a qualitative rather than quantitative sense (for
example transactions with Related Parties).
• Pension Fund Account
This sets out the financial position of the Fire Pension Fund at the year end and the
expenditure and income throughout the financial year. Notes providing additional
information follow the accounts.
• Glossary of Terms
A glossary of financial terms is provided to assist the reader’s understanding.

NARRATIVE REPORT
12

INDEPENDENT AUDITOR’S REPORT
13
Independent auditor’s report to the members of County Durham and Darlington Fire and Rescue Authority and Group Report on the financial statements Opinion
We have audited the financial statements of County Durham and Darlington Fire and Rescue Authority (‘the Authority’) and its subsidiaries (‘the Group’) for the year ended 31 March 2019, which comprise the Authority and Group Movement in Reserves Statements, the Authority and Group Comprehensive Income and Expenditure Statements, the Authority and Group Balance Sheets, the Authority and Group Cash Flow Statements, the Firefighters’ Pension Fund Account and notes to the financial statements, including a summary of significant accounting policies. The financial reporting framework that has been applied in their preparation is applicable law and the CIPFA / LASAAC Code of Practice on Local Authority Accounting in the United Kingdom 2018/19. In our opinion, the financial statements: • give a true and fair view of the financial position of County Durham and Darlington Fire & Rescue Authority and the Group as at 31st March 2019 and of the Authority and the Group’s expenditure and income for the year then ended; and • have been properly prepared in accordance with the CIPFA/LASAAC Code of Practice on Local Authority Accounting in the United Kingdom 2018/19. Basis for opinion
We conducted our audit in accordance with International Standards on Auditing (UK) (ISAs (UK)) and applicable law. Our responsibilities under those standards are further described in the Auditor’s responsibilities section of our report. We are independent of the Authority in accordance with the ethical requirements that are relevant to our audit of the financial statements in the UK, including the FRC’s Ethical Standard as applicable to public interest entities, and we have fulfilled our other ethical responsibilities in accordance with these requirements. We believe that the audit evidence we have obtained is sufficient and appropriate to provide a basis for our opinion. Conclusions relating to going concern
We have nothing to report in respect of the following matters in relation to which the ISAs (UK) require us to report to you where: • the Treasurer’s use of the going concern basis of accounting in the preparation of the financial statements is not appropriate; or • the Treasurer has not disclosed in the financial statements any identified material uncertainties that may cast significant doubt about the Authority and Group’s ability to continue to adopt the going concern basis of accounting for a period of at least twelve months from the date when the financial statements are authorised for issue. Other information
The Treasurer is responsible for the other information. The other information comprises the Annual Governance Statement and information included in the Statement of Accounts, other than the financial statements and our auditor’s report thereon. Our opinion on the financial statements does not cover the other information and, except to the extent otherwise explicitly stated in our report, we do not express any form of assurance conclusion thereon. In connection with our audit of the financial statements, our responsibility is to read the other information and, in doing so, consider whether the other information is materially inconsistent with the financial statements or our knowledge obtained in the audit or otherwise appears to be materially misstated. If we identify such material inconsistencies or apparent material misstatements, we are required to determine whether there is a material misstatement in the financial statements or a material misstatement of the other information. If, based on the work we have performed, we conclude that there is a material misstatement of this other information, we are required to report that fact. We have nothing to report in this regard.

INDEPENDENT AUDITOR’S REPORT
14
Responsibilities of the Treasurer for the financial statements
As explained more fully in the Statement of Responsibilities for the Statement of Accounts, the Treasurer is responsible for the preparation of the Statement of Accounts, which includes the financial statements, in accordance with proper practices as set out in the CIPFA/LASAAC Code of Practice on Local Authority Accounting in the United Kingdom 2018/19, and for being satisfied that they give a true and fair view. The Treasurer is also responsible for such internal control as the Treasurer determines is necessary to enable the preparation of financial statements that are free from material misstatement, whether due to fraud or error.
The Treasurer is required to comply with the CIPFA/LASAAC Code of Practice on Local Authority Accounting in the United Kingdom 2018/19 and prepare the financial statements on a going concern basis, unless the Authority is informed of the intention for dissolution without transfer of services or function to another entity. The Treasurer is responsible for assessing each year whether or not it is appropriate for the Authority and Group to prepare its accounts on the going concern basis and disclosing, as applicable, matters related to going concern. Auditor’s responsibilities for the audit of the financial statements
Our objectives are to obtain reasonable assurance about whether the financial statements as a whole are free from material misstatement, whether due to fraud or error, and to issue an auditor’s report that includes our opinion. Reasonable assurance is a high level of assurance, but is not a guarantee that an audit conducted in accordance with ISAs (UK) will always detect a material misstatement when it exists. Misstatements can arise from fraud or error and are considered material if, individually or in the aggregate, they could reasonably be expected to influence the economic decisions of users taken on the basis of these financial statements. A further description of our responsibilities for the audit of the financial statements is located on the Financial Reporting Authority’s website at www.frc.org.uk/auditorsresponsibilities. This description forms part of our auditor’s report. Matters on which we are required to report by exception under the Code of Audit Practice
We are required by the Code of Audit Practice to report to you if: • we issue a report in the public interest under section 24 of the Local Audit and Accountability Act 2014;
• we make a recommendation under section 24 of the Local Audit and Accountability Act 2014; or
• we exercise any other special powers of the auditor under sections 28, 29 or 31 of the Local Audit and Accountability Act 2014. We have nothing to report in these respects. Conclusion on County Durham and Darlington Fire and Rescue Authority’s arrangements for securing economy, efficiency and effectiveness in the use of resources
Conclusion
On the basis of our work, having regard to the guidance on the specified criterion issued by the Comptroller and Auditor General in November 2017, we are satisfied that, in all significant respects, County Durham and Darlington Fire and Rescue Authority has put in place proper arrangements to secure economy, efficiency and effectiveness in its use of resources for the year ended 31 March 2019.
Basis for conclusion
We have undertaken our review in accordance with the Code of Audit Practice issued by the Comptroller and Auditor General, having regard to the guidance on the specified criterion issued in November 2017, as to whether the Authority had proper arrangements to ensure it took properly informed decisions and deployed resources to achieve planned and sustainable outcomes for taxpayers and local people. The Comptroller and Auditor General determined this criterion as that

INDEPENDENT AUDITOR’S REPORT
15
necessary for us to consider in satisfying ourselves whether the Authority put in place proper arrangements for securing economy, efficiency and effectiveness in its use of resources for the year ended 31 March 2019.
We planned our work in accordance with the Code of Audit Practice. Based on our risk assessment, we undertook such work as we considered necessary to form a view on whether, in all significant respects, the Authority had put in place proper arrangements to secure economy, efficiency and effectiveness in its use of resources. Responsibilities of the Authority
The Authority is responsible for putting in place proper arrangements to secure economy, efficiency and effectiveness in its use of resources, to ensure proper stewardship and governance, and to review regularly the adequacy and effectiveness of these arrangements.
Auditor’s responsibilities for the review of arrangements for securing economy, efficiency and effectiveness in the use of resources
We are required under section 20(1)(c) of the Local Audit and Accountability Act 2014 to satisfy ourselves that the Authority has made proper arrangements for securing economy, efficiency and effectiveness in its use of resources. The Code of Audit Practice requires us to report to you our conclusion relating to proper arrangements. We are not required to consider, nor have we considered, whether all aspects of the Authority’s arrangements for securing economy, efficiency and effectiveness in its use of resources are operating effectively. Use of the audit report
This report is made solely to the members of County Durham and Darlington Fire and Rescue Authority and Group, as a body, in accordance with part 5 of the Local Audit and Accountability Act 2014 and as set out in paragraph 44 of the Statement of Responsibilities of Auditors and Audited Bodies published by Public Sector Audit Appointments Limited. Our audit work has been undertaken so that we might state to the members of the Authority and Group those matters we are required to state to them in an auditor’s report and for no other purpose. To the fullest extent permitted by law, we do not accept or assume responsibility to anyone other than the members of the Authority and Group, as a body, for our audit work, for this report, or for the opinions we have formed. Certificate
We certify that we have completed the audit of County Durham and Darlington Fire and Rescue Authority and Group in accordance with the requirements of the Local Audit and Accountability Act 2014 and the Code of Audit Practice.
Gavin Barker Director For and on behalf of Mazars LLP Salvus House Aykley Heads Durham 31 July 2019
STATEMENT OF RESPONSIBILITIES FOR THE STATEMENT OF
ACCOUNTS
16
STATEMENT OF RESPONSIBILITIES FOR THE STATEMENT OF ACCOUNTS
The Authority’s Responsibilities
The Authority is required to:
• make arrangements for the proper administration of its financial affairs and to secure that one of its officers has the responsibility for the administration of those affairs. For the Fire and Rescue Authority that officer is the Treasurer;
• manage its affairs to secure economic, efficient and effective use of resources and safeguard it’s assets;
• approve the Statement of Accounts.
The Treasurer’s Responsibilities
The Treasurer is responsible for the preparation of the Authority’s Statement of Accounts in accordance with proper practices as set out in the CIPFA/ LASAAC Code of Practice on Local Authority Accounting in UK 2018/19.
In preparing this Statement of Accounts, the Treasurer has:
• selected suitable accounting policies and then applied them consistently;
• made judgements and estimates that were reasonable and prudent; and
• complied with the Code.
The Treasurer has also:
• kept proper accounting records which were up to date; and
• taken reasonable steps for the prevention and detection of fraud and other irregularities.
Treasurer’s Certificate
I certify that these accounts present a true and fair view of the financial position of the Authority as at 31 March 2019 and its income and expenditure for the year ended 31 March 2019.
Anthony Hope CPFA Date 31/07/2019 Treasurer to County Durham and Darlington Fire and Rescue Authority Chairman’s Certificate I can confirm that these accounts were approved by the Authority at a meeting on 31 July 2019.
Chairman of the meeting approving the accounts Date 31/07/2019

GROUP ACCOUNTS
17
INTRODUCTION County Durham and Darlington Fire and Rescue Community Interest Company was incorporated in 2013/14 and commenced trading during 2014/15. Vital Fire Solutions Limited was incorporated in 2015/16, and the Authority purchased £15,000 of share capital. County Durham and Darlington Fire and Rescue Service Community Interest Company and Vital Fire Solutions Limited are both 100% owned subsidiaries of County Durham and Darlington Fire and Rescue Authority. The Directors of both companies are also senior managers and members of the Authority. The Authority does not have any associates. The Group Financial Statements consolidate the performance and balances that relate to the two companies into the statements of County Durham and Darlington Fire and Rescue Authority, which allows the full picture of the activities of the group to be presented. The financial year ended 31st March 2019 is the first year for which group accounts have been prepared. The Group Financial Statements include:
• Group Movement in Reserves Statement
• Group Comprehensive Income and Expenditure Statement
• Group Balance Sheet
• Group Cash Flow Statement
The group financial statements are presented in accordance with International Financial Reporting Standards (IFRS). The financial statements of both companies are presented under FRS102; their accounts have been restated to comply with IFRS.

GROUP ACCOUNTS
18
GROUP MOVEMENT IN RESERVES STATEMENT This statement shows the movement in the year on the Authority’s single entity usable and unusable reserves, and the Authority’s share of the Group Reserves.
(a) (b) (c) (d) (e) (f) (g) (h)
General Fund
Balance
Earmarked Reserves
Capital Receipts
Unapplied
Total Usable
Reserves
Unusable Reserves
Total Authority Reserves
Authority’s Share of
Subsidiary Reserves
Total Group
Reserves
£000 £000 £000 £000 £000 £000 £000 £000
Balance at 31 March 2017 2,824 3,865 - 6,689 -349,454 -342,765 -17 -342,782
Movement in reserves 2017/18 Surplus/Deficit (-) on provision of services
-13,211 - - -13,211 - -13,211 3 -13,208
Other Comprehensive Expenditure and Income
- - - - 7,361 7,361 - 7,361
Total Comprehensive Expenditure and Income
-13,211 - - -13,211 7,361 -5,850 3 -5,847
Adjustments between accounting basis and funding under regulations
13,839 - -
13,839 -13,839 - - -
Net Increase/Decrease(-) before Transfers to Earmarked Reserves
628 - - 628 -6,478 -5,850 3 -5,847
Transfers to (-) / from Earmarked Reserves
-2,064 2,064 - - - - - -
Increase/Decrease (-) in year -1,436 2,064 - 628 -6,478 -5,850 3 -5,847 Balance at 31 March 2018
1,388 5,929 - 7,317 -355,932 -348,615 -14 -348,629
Movement in reserves 2018/19 Surplus/Deficit (-) on provision of services
-31,448 - - -31,448 - -31,448 -54 -31,502
Other Comprehensive Expenditure and Income
- - - - -1,775 -1,775 - -1,775
Total Comprehensive Expenditure and Income
-31,448 - - -31,448 -1,775 -33,223 -54 -33,277
Adjustments between accounting basis and funding under regulations
31,421 - - 31,421 -31,421 - - -
Net Increase/Decrease(-) before Transfers to Earmarked Reserves
-27 - - -27 -33,196 -33,223 -54 -33,277
Transfers to (-) / from Earmarked Reserves
64 -64 - - - - - -
Increase/Decrease (-) in year 37 -64 - -27 -33,196 -33,223 -54 -33,277 Balance at 31 March 2019
1,425 5,865 - 7,290 -389,128 -381,838 -68 -381,906

GROUP ACCOUNTS
19
GROUP COMPREHENSIVE INCOME AND EXPENDITURE STATEMENT This statement summarises the resources that have been generated and consumed in providing services and managing the Group during the last year. It includes all day to day expenses and related income on an accruals basis.
2017/18 Gross
Expenditure
2017/18 Income
2017/18
Net Expenditure
Gross Expenditure, Gross Income and Net Expenditure on
continuing operations
2018/19 Gross
Expenditure
2018/19 Income
2018/19
Net Expenditure
£000 £000 £000 £000 £000 £000 25,039 - 25,039 Employees 41,134 - 41,134 2,604 - 2,604 Premises 2,677 - 2,677
656 -8 648 Transport 645 -5 640 4,038 - 4,038 Supplies & Services 4,172 - 4,172
98 - 98 Provisions - - - 1,162 - 1,162 Capital Financing 2,920 - 2,920
- -3,546 -3,546 Income - -2,572 -2,572
33,597 -3,554 30,043 Net Cost of Service 51,548 -2,577 48,971
Other Operating Income & Expenditure
1 - 1 Gain (-) / Loss on disposal of non-current assets: Property, Plant & Equipment
19 - 19
1 - 1 19 - 19
Financing and Investment Income & Expenditure
36 - 36 Interest payable on debt 136 - 136 813 - 813 Interest payable on PFI 792 - 792 96 - 96 Contingent Rents – PFI 113 - 113
10,176 - 10,176 Net interest on the defined benefit liability
9,929 - 9,929
- -26 -26 Investment interest income - -57 -57
11,121 -26 11,095 10,970 -57 10,913
Taxation & Non-specific Grants Income
- Recognised capital grants and contributions
-
-16,602 Precepts -17,201 -6,609 NNDR -6,908
-190 Non Ring-fenced Government Grants
-449
-4,529 RSG -3,843
-27,930 -28,401
13,209 Surplus (-) / Deficit on Provision of Services
31,502
-8,107 Re-measurements of the net defined benefit liability
2,524
746 Deficit(-)/Surplus on revaluation of Property, Plant & Equipment
-749
-7,361 Other Comprehensive Income and Expenditure Total Comprehensive Income and Expenditure
1,775
5,848 33,277

GROUP ACCOUNTS
20
GROUP BALANCE SHEET The Balance Sheet shows the value as at the Balance Sheet date of the asset and liabilities recognised by the Group. The net assets of the Group (assets less liabilities) are matched by the reserves held by the Group.
As at 31 March 2018
As at 31 March 2019
£000 £000 £000 £000 279 Intangible Assets 225
Property, Plant & Equipment
36,711 Land & Buildings 36,673
7,583 Vehicle, Plant, Furniture & Equipment 6,628
23 Surplus Assets 23
97 Assets Under Construction -
- Long-term Investments -
1 Long-term Debtors 1
44,694 Total Long-term Assets 43,550
421 Inventories 541
4,068 Short-term Debtors 4,363
7,263 Cash & Cash Equivalents 5,496 10,400 11,752 Total Current Assets
-5 Short-term Borrowing -
-3,605 Short-term Creditors -3,365
-3,610 Total Current Liabilities -3,365
52,836 Total Assets less Current Liabilities 50,585
-384 Provisions -431
-728 Long-term Borrowing -
-7,176 Deferred Liability – PFI Other Deferred Liabilities
-6,961 -1,136
-1,233
-391,944 Pension Liability (IAS19) -423,963
-401,465 Total Long-term Liabilities -432,491
-348,629 Net Assets -381,906
7,303 Usable Reserves 7,222
-355,932 Unusable Reserves -389,128
-348,629 Total Reserves -381,906

GROUP ACCOUNTS
21
GROUP STATEMENT OF CASH FLOWS The Cash Flow Statement shows the changes in cash and cash equivalents of the Group during the reporting period. The statement shows how the Group generates and uses cash and cash equivalents by classifying cash flows as operating, investing and financing activities.
2017/18 OPERATING ACTIVITIES
2018/19
£000 Net surplus (-) or deficit on the provision of services
£000 13,208 31,502
-15,197 Adjustments to net surplus or deficit on the provision of services
for non-cash movements -31,728
33 Adjust for items received in the net surplus or deficit on the
provision of services that are investing and financing activities 13
-1,956 Net cash flows from operating activities -213
357 Investing Activities 1,047
234 Financing Activities 933
-1,365 Net increase (-) or decrease in cash and cash equivalents 1,767
5,898 Cash and cash equivalents at the beginning of the reporting period 7,263
7,263 Cash and cash equivalents at the end of the reporting period 5,496

GROUP ACCOUNTS
22
NOTES TO THE GROUP ACCOUNTS
1. Group Accounting Policies
The Group Financial Statements have been prepared in accordance with the Code of Practice for Local Authority Accounting in the United Kingdom 2018/19 issued by the Chartered Institute of Public Finance and Accountancy (CIPFA). The accounting policies used in preparing the Group Accounts are largely those used by County Durham and Darlington Fire and Rescue Authority. In order to align the accounting policies of group entities with those used by the Authority and ensure consistency of accounting treatment across the group, the following policies have been adopted: Consolidation of Subsidiaries Subsidiaries have been consolidated using the acquisition accounting basis. This is a full line by line consolidation of the financial transactions and balances of the Authority and its subsidiaries. To avoid overstating the figures in the group financial statement, all transactions and balances between the members of the group have been eliminated. International Financial Reporting Standards The Authority produces its financial statements in accordance with IFRS. As the companies produce their financial statements in accordance with UK GAAP, their financial statements have been adjusted to reflect IFRS where any changes have a material effect on the presentation of the Group Financial Statements.
2. Officers’ Remuneration
There is no remuneration for Directors of County Durham and Darlington Fire and Rescue Service Community Interest Company or Vital Fire Solutions Limited.
3. Audit Fees
Audit fees owing to additional work required for the audit of the group accounts are disclosed in Note 7.7. Group Adjustments The following transactions have been eliminated from the Group Financial Statements: During 2018/19, County Durham and Darlington Fire and Rescue Authority supplied goods and services with a value of £6,932 to County Durham and Darlington Fire and Rescue Community Interest Company. In addition, the Authority has provided £7,500 of funding to the CIC as match funding for a community project. Goods and services with a value of £251,442 were supplied by County Durham and Darlington Fire and Rescue Authority to Vital Fire Solutions Limited during 2018/19. Vital Fire Solutions provided £1,581 of goods and services to the Authority. These transactions have been eliminated from the Consolidated Income and Expenditure Statement in the Group Accounts. In addition, intra company debtors and creditors have been adjusted for in the Balance Sheet.

MOVEMENT IN RESERVES
23
MOVEMENT IN RESERVES STATEMENT This statement shows the movement in the year on the different reserves held by the Authority, analysed into ‘usable reserves’ (i.e. those that can be applied to fund expenditure or reduce local taxation) and ‘unusable reserves’. The Surplus/ Deficit (-) on the Provision of Services line shows the true economic cost of providing the Authority’s services, more details of which are shown in the Comprehensive Income and Expenditure Statement. These are different from the statutory amounts required to be charged to the General Fund Balance for Council Tax setting. The Net Increase/ Decrease before Transfers to Earmarked Reserves line shows the statutory General Fund balance before discretionary transfers to or from Earmarked Reserves are undertaken by the Authority.
Movement in Reserves Statement 2018/19
(a) (b) (c) (d) (e) (f) (g)
General Fund
Balance
Earmarked Reserves
Capital Grants
Unapplied
Capital Receipts
Unapplied
Total Usable
Reserves
Unusable Reserves
Total Authority Reserves
£000 £000 £000 £000 £000 £000 £000
Balance at 31 March 2018 1,388 5,929 - - 7,317 -355,932 -348,615 Surplus/Deficit (-) on provision
of services -31,448 - - - -31,448 - -31,448
Other Comprehensive Expenditure and Income
- - - - - -1,775 -1,775
Total Comprehensive Expenditure and Income
-31,448 - - - -31,448 -1,775 -33,223
Adjustments between accounting basis and funding under regulations (Note 6.1)
31,421 - - - 31,421 -31,421 -
Net Increase/Decrease (-) before Transfers to Earmarked Reserves
-27 - - - -27 -33,196 -33,223
Transfers to (-) / from Earmarked Reserves (Note 8.18)
64
-64 - - - - -
Increase/Decrease (-) in year 37 -64 - - -27 -33,196 -33,223
Balance at 31 March 2019 1,425 5,865 - - 7,290 -389,128 -381,838

MOVEMENT IN RESERVES
24
Comparatives for 2017/18 are as follows:
Movement in Reserves Statement 2017/18
(a) (b) (c) (d) (e) (f) (g)
General Fund
Balance
Earmarked Reserves
Capital Grants
Unapplied
Capital Receipts
Unapplied
Total Usable
Reserves
Unusable Reserves
Total Authority Reserves
£000 £000 £000 £000 £000 £000 £000
Balance at 31 March 2017 2,824 3,865 - - 6,689 -349,454 -342,765 Surplus/Deficit (-) on provision
of services -13,211 - - - -13,211 - -13,211
Other Comprehensive Expenditure and Income
- - - - - 7,361 7,361
Total Comprehensive Expenditure and Income
-13,211 - - - -13,211 7,361 -5,850
Adjustments between accounting basis and funding under regulations (Note 6.1)
13,839 - - - 13,839 -13,839 -
Net Increase/Decrease (-) before Transfers to Earmarked Reserves
628 - - - 628 -6,478 -5,850
Transfers to (-) / from Earmarked Reserves (Note 8.18)
-2,064 2,064 - - - - -
Increase/Decrease (-) in year -1,436 2,064 - - 628 -6,478 -5,850
Balance at 31 March 2018 1,388 5,929 - - 7,317 -355,932 -348,615

COMPREHENSIVE INCOME AND EXPENDITURE STATEMENT
25
COMPREHENSIVE INCOME AND EXPENDITURE STATEMENT
This statement shows the accounting cost in the year of providing services in accordance with generally accepted accounting practices, rather than the amount to be funded from taxation. Authorities raise taxation to cover expenditure in accordance with regulations; this may be different from the accounting cost. The taxation position is shown in the Movement in Reserves Statement.
The presentation of the Comprehensive Income and Expenditure Statement is based upon the organisational structure that reflects the way the business is managed and operated. For the Authority, this means that income and expenditure included in the net cost of services has been analysed across subjective headings.
2017/18 Gross
Expenditure
2017/18 Income
2017/18
Net Expenditure
Gross Expenditure, Gross Income and Net Expenditure on
continuing operations
2018/19 Gross
Expenditure
2018/19 Income
2018/19
Net Expenditure
£000 £000 £000 £000 £000 £000 25,011 - 25,011 Employees 41,113 - 41,113 2,604 - 2,604 Premises 2,677 - 2,677
656 -8 648 Transport 645 -5 640 3,961 - 3,961 Supplies & Services 4,106 - 4,106
98 - 98 Provisions - - - 1,161 - 1,161 Capital Financing 2,920 - 2,920
- -3,437 -3,437 Income - -2,540 -2,540
33,491 -3,445 30,046 Net Cost of Service 51,461 -2,545 48.916
Other Operating Income & Expenditure
1 - 1 Gain (-) / Loss on disposal of non-current assets: Property, Plant & Equipment (Note 7.2)
19 - 19
1 - 1 19 - 19
Financing and Investment Income & Expenditure
36 - 36 Interest payable on debt 136 - 136 813 - 813 Interest payable on PFI 792 - 792 96 - 96 Contingent Rents – PFI 113 - 113
10,176 - 10,176 Net interest on the defined benefit liability
9,929 - 9,929
- -26 -26 Investment interest income - -56 -56
11,121 -26 11,095 10,970 -56 10,914
Taxation & Non-specific Grants Income
- Recognised capital grants and contributions
-
-16,602 Precepts (Note 7.12) -17,201 -6,610 NNDR -6,908
-190 Non Ring-fenced Government Grants
-449
-4,529 RSG -3,843
-27,931 -28,401
13,211 Surplus (-) / Deficit on Provision of Services
31,448
-8,107 Re-measurements of the net defined benefit liability (Note 8.20)
2,524
746 Deficit(-)/Surplus on revaluation of Property, Plant & Equipment
-749
-7,361 Other Comprehensive Income and Expenditure Total Comprehensive Income and Expenditure
1,775
5,850 33,223

BALANCE SHEET
26
BALANCE SHEET
The Balance Sheet shows the value as at the Balance Sheet date of the assets and liabilities recognised by the Authority. The net assets of the Authority (assets less liabilities) are matched by the reserves held by the Authority. Reserves are reported in two categories.
The first category of reserves are usable reserves, i.e. those reserves that the Authority may use to provide services, subject to the need to maintain a prudent level of reserves and any statutory limitations on their use (for example the Capital Receipts Reserve that may only be used to fund capital expenditure or repay debt).
The second category of reserves are those that the Authority is not able to use to provide services. This category of reserves includes:
• reserves that hold unrealised gains and losses (for example the Revaluation Reserve), where amounts would only become available to provide services if the assets are sold;
• reserves that hold timing differences shown in the Movement in Reserves Statement line ‘Adjustments between accounting basis and funding basis under regulations’.
As at 31 March 2018
As at 31 March 2019
£000 £000 £000 £000 279 Intangible Assets (Note 8.1) 225
Property, Plant & Equipment
36,711 Land & Buildings (Note 8.2) 36,673
7,583 Vehicle, Plant, Furniture & Equipment (Note 8.2) 6,628
23 Surplus Assets (Note 8.2) 23
97 Assets Under Construction (Note 8.3) -
15 Long-term Investments (Note 8.12) 15
1 Long-term Debtors (Note 8.9) 1
44,709 Total Long-term Assets 43,565
419 Inventories (Note 8.8) 538
4,119 Short-term Debtors (Note 8.9) 4,468
7,139 Cash & Cash Equivalents (Note 8.10) 5,436
11,677 Total Current Assets 10,442
-5 Short-term Borrowing (Note 8.11) -
-3,531 -3,536
Short-term Creditors (Note 8.11) -3,354
Total Current Liabilities -3,354
52,850 Total Assets less Current Liabilities 50,653
-384 Provisions (Note 8.13) -431
-728 Long-term Borrowing (Note 8.14) -
-7,176 -1,233
Deferred Liability – PFI (Note 8.14) Other Deferred Liabilities (Note 8.14)
-6,961 -1,136
-391,944 -401,465
Pension Liability (IAS19) (Note 8.16) -423,963
Total Long-term Liabilities -432,491
-348,615 Net Assets -381,838
7,317 Usable Reserves (Note 8.17) 7,290
-355,932 Unusable Reserves (Note 8.17) -389,128
-348,615 Total Reserves -381,838

CASH FLOW STATEMENT
27
CASH FLOW STATEMENT
The Cash Flow Statement shows the changes in cash and cash equivalents of the Authority during the reporting period. The statement shows how the Authority generates and uses cash and cash equivalents by classifying cash flows as operating, investing and financing activities. The amount of net cash flows arising from operating activities is a key indicator of the extent to which the operations of the Authority are funded by way of taxation and grant income or from the recipients of services provided by the Authority.
Investing activities represent the extent to which cash outflows have been made for resources which are intended to contribute to the Authority’s future service delivery. Cash flows arising from financing activities are useful in predicting claims on future cash flows by providers of capital (i.e. borrowing) to the Authority.
Indirect Method
2017/18 OPERATING ACTIVITIES
2018/19
£000 £000 13,211 Net surplus (-) or deficit on the provision of services 31,448
-15,080 Adjustments to net surplus or deficit on the provision of services
for non-cash movements (Note 9.1) -31,738
33 Adjust for items received in the net surplus or deficit on the
provision of services that are investing and financing activities 13
-1,836 Net cash flows from operating activities -277
357 Investing Activities (Note 9.3) 1,047
234 Financing Activities (Note 9.4) 933
-1,245 Net increase (-) or decrease in cash and cash equivalents 1,703
5,894 Cash and cash equivalents at the beginning of the reporting period 7,139
7,139 Cash and cash equivalents at the end of the reporting period (Note 8.10)
5,436

NOTES TO CORE FINANCIAL STATEMENTS
28
1 ACCOUNTING POLICIES 1.1 General Principles The Statement of Accounts summarises the Authority’s transactions for the 2018/19 financial year and its position at the year end of 31 March 2019. The Authority is required to prepare an annual Statement of Accounts by the Accounts and Audit Regulations 2015, which require accounts to be prepared in accordance with proper accounting practices. These practices primarily comprise the Code of Practice on Local Authority Accounting in the United Kingdom 2018/19, supported by International Financial Reporting Standards (IFRS). The accounting convention adopted in the Statement of Accounts is principally historical cost, modified by the revaluation of certain categories of non-current assets and financial instruments. The Statements reflect the requirements of general accounting principles and concepts of:
• Relevance - the financial statements provide information about the Authority’s performance and position that is useful to the users of the accounts to assess the stewardship of public funds and for making economic decisions.
• Reliability - the financial information faithfully represents the substance of the transactions, the activities underlying them and other events that have taken place are free from deliberate or systematic bias and material error and have been prudently prepared.
• Comparability - the information has been prepared consistently and with adequate disclosures so that it can be compared with prior years and other Fire Authorities.
• Understandability – the statements have been prepared to ensure they are as easy to understand as possible.
• Materiality - the statements disclose items of a certain size and nature such that they provide a fair presentation of the financial position and transactions of the Authority.
• Accruals - other than the cash flow statement, the financial statements report transactions that have been recorded in the accounting period for which the goods and services were received or supplied rather than in which the cash was received or paid.
• Going Concern - the financial statements have been prepared on the assumption that the Authority will continue in operational existence for the foreseeable future.
• Legality - where the accounting principles and specific legislation requirements are in conflict, the financial statements have been prepared to reflect legislative requirements.
The accounting policies are the principles, bases, conventions, rules and practices that specify how the effects of transactions and other events are reflected in the financial statements of the Authority. Consistent accounting policies have been applied both within

NOTES TO CORE FINANCIAL STATEMENTS
29
the year and between years. Where accounting policies are changed, this has been disclosed separately. 1.2 Accruals of Income and Expenditure Activity is accounted for in the year that it takes place, not simply when cash payments are made or received. In particular:
• revenue from the sale of goods is recognised when the Authority transfers the significant risks and rewards of ownership to the purchaser and it is probable that economic benefits or service potential associated with the transaction will flow to the Authority;
• revenue from the provision of services is recognised when the Authority can reliably measure the percentage of completion of the transaction and it is probable that economic benefits or service potential associated with the transaction will flow to the Authority;
• supplies are recorded as expenditure when they are consumed – where there is a gap between the date supplies are received and their consumption, they are carried as inventories on the Balance Sheet;
• expenses in relation to services received (including services provided by employees) are recorded as expenditure when the services are received rather than when payments are made;
• interest receivable on investments and payable on borrowings is accounted for respectively as income and expenditure on the basis of the effective interest rate for the relevant financial instrument rather that the cash flows fixed or determined by the contract;
• where income and expenditure have been recognised but cash has not been received or paid, a debtor or creditor for the relevant amount is recorded in the Balance Sheet. Where debts may not be settled, the balance of debtors is written down and a charge made to revenue for the income that might not be collected;
• a de minimus level of £1,000 is set for the recognition of accruals;
• there is no accrual made for petty cash at the year end. This is because the value of petty cash transactions remains consistent and of low value month on month. The Authority ensures that 12 accounting periods are included within each financial year.
• Under International Financial Reporting Standard 15 (IFRS15) Revenue From Contracts with Customers, the Authority recognises revenue from any contracts with service recipients in the financial year in which the service is provided, in accordance with the performance obligations of the contract.
1.3 Cash and Cash Equivalents Cash is represented by cash in hand and deposits with financial institutions repayable without penalty on notice of not more than 24 hours. Cash equivalents are investments that

NOTES TO CORE FINANCIAL STATEMENTS
30
mature within three months or less from the date of acquisition and that are readily convertible to known amounts of cash with insignificant risk of change in value. In the Cash Flow Statement, cash and cash equivalents are shown net of bank overdrafts that are repayable on demand and form an integral part of the Authority’s cash management. 1.4 Prior Period Adjustments, Changes in Accounting Policies and Estimates
and Errors Prior period adjustments may arise as a result of a change in accounting policies or to correct a material error. Changes in accounting estimates are accounted for prospectively, i.e. in the current and future years affected by the change and do not give rise to a prior period adjustment. Changes in accounting policies are only made when required by proper accounting practices or the change provides more reliable or relevant information about the effect of transactions, other events and conditions on the Authority’s financial position or financial performance. Where a change is made, it is applied retrospectively (unless stated otherwise) by adjusting opening balances and comparative amounts for the prior period as if the new policy had always been applied. Material errors discovered in prior period figures are corrected retrospectively by amending opening balances and comparative amounts for the prior period. 1.5 Charges to Revenue for Non-Current Assets The Comprehensive Income and Expenditure Statement is debited with the following amounts to record the cost of holding property, plant and equipment during the year:
• depreciation attributable to the assets used by the Authority;
• revaluation and impairment losses on assets used by the Authority where there are no accumulated gains in the Revaluation Reserve against which the losses can be written off;
• amortisation of intangible assets attributable to the Authority. The Authority is not required to raise Council Tax to fund depreciation, revaluation and impairment losses or amortisations. However, it is required to make an annual contribution from revenue towards the reduction in its overall borrowing requirement (equal to an amount calculated on a prudent basis determined by the Authority in accordance with statutory guidance). Depreciation, revaluation, impairment losses and amortisations are therefore replaced by the contribution in the General Fund Balance by Minimum Revenue Provision (MRP), by way of an adjusting transaction with the Capital Adjustment Account in the Movement in Reserves Statement for the difference between the two. 1.6 Employee Benefits
Benefits Payable during Employment
Short-term employee benefits are those due to be settled within 12 months of the year end. They include benefits such as wages and salaries, paid annual leave and paid sick leave,

NOTES TO CORE FINANCIAL STATEMENTS
31
bonuses and non-monetary benefits for current employees. They are recognised as an expense in the year in which the employee renders service to the Authority. An accrual is made for the cost of holiday entitlements (or any form of leave) earned by an employee but not taken before the year end. The accrual is charged to the Surplus or Deficit on the Provision of Services, but then reversed out through the Movement in Reserves Statement so that benefits are charged to revenue in the financial year in which the holiday absence occurs. Termination Benefits
Termination benefits are amounts payable as a result of a decision by the Authority to terminate an officer’s employment before the normal retirement date or an officer’s decision to accept voluntary redundancy. They are charged on an accruals basis to the Net Cost of Service in the Comprehensive Income and Expenditure Statement when the Authority is demonstrably committed to the termination of the employment of an officer or making an offer to encourage voluntary redundancy. When termination benefits involve the enhancement of pensions, statutory provisions require the General Fund to be charged with the amount payable by the Authority to the pension fund or pensioner in the year, not the amount calculated according to the relevant accounting standards. In the Movement in Reserves Statement, appropriations are required to and from the Pensions Reserve to remove the notional debits and credits for pension enhancement termination benefits and replace them with debits for the cash paid to the pension fund and pensioners and any such amounts payable but unpaid at the year end. Post Employment Benefits
Employees of the Authority are members of four separate pension schemes:
• the 1992 Fire Pension Scheme for Firefighters which is unfunded;
• the 2006 Fire Pension Scheme for Firefighters (including the Retained Modified Scheme) which is unfunded;
• the 2015 Fire Pension Scheme for Firefighters which is unfunded;
• the Local Government Pension Scheme, administered by Durham County Council. All four schemes provide defined benefits to members (retirement lump sums and pensions), earned as employees working for the Authority. Discretionary Benefits (Local Government Pension Scheme)
The Authority also has restricted powers to make discretionary awards of retirement benefits in the event of early retirement. Any liabilities, estimated to arise as a result of an award to any member of staff, are accrued in the year of the decision to make the award and accounted for using the same policies as are applied to the Local Government Pension Scheme.

NOTES TO CORE FINANCIAL STATEMENTS
32
The Fire Pension Scheme for Firefighters The Firefighter’s Pension Scheme for fire officers is an unfunded defined benefit scheme administered by County Durham and Darlington Fire and Rescue Authority, meaning that there are no investment assets built up to meet the pensions liabilities, and cash has to be generated to meet actual pensions payments as they eventually fall due. Under the Firefighter’s Pension Scheme Order 2006, if the amounts receivable by the pension fund for the year are less than amounts payable, the Fire Authority must annually transfer an amount to meet the deficit to the pension fund. This cost is then met by Central Government. If, however, the pension fund is in surplus for the year, the surplus is required to be transferred from the pension fund to the Fire Authority. This surplus is then repaid to Central Government. The Local Government Pension Scheme The Local Government Pension Scheme for support staff, administered by Durham County Council, is a funded defined benefit career average scheme, with any benefits earned up to 31 March 2014 continuing to be calculated on a final salary basis. This means that the Authority and employees pay contributions into a fund, calculated at a level intended to balance the pension liabilities with investment assets. The Authority recognises the costs of retirement benefits in the Net Cost of Services section of the Comprehensive Income and Expenditure Statement when they are earned by employees, rather than when the benefits are eventually paid as pensions. However, the charge required to be made against Council Tax is based on the cash payable in the year, so the real cost of retirement benefits is reversed out in the Movement in Reserves Statement. The negative balance that arises on the Pensions Reserve measures the beneficial impact to the General Fund of being required to account for retirement benefits on the basis of cash flows rather than as benefits are earned by employees. 1.7 Events after the Balance Sheet Date Events after the Balance Sheet date are those events, both favourable and unfavourable, that occur between the end of the reporting period and the date when the Statement of Accounts is authorised for issue. Two types of events can be identified:
• those that provide evidence of conditions that existed at the end of the reporting period – the Statement of Accounts is adjusted to reflect such events;
• those that are indicative of conditions that arose after the reporting period – the Statement of Accounts is not adjusted to reflect such events, but where a category of events would have a material effect, disclosure is made in the notes showing the nature of the events and their estimated financial effect.
Events taking place after the date of authorisation for issue are not reflected in the Statement of Accounts.

NOTES TO CORE FINANCIAL STATEMENTS
33
1.8 Financial Instruments The accounting treatment of Financial Instruments reflects the requirements resulting from the implementation of International Reporting Standard 9 (IFRS9) Financial Instruments. Fair value measurements are based upon the following valuation techniques:
• Level 1 – the financial instrument has an active market, with quoted prices for similar
instruments
• Level 2 - there is some directly observable market information, other than that
available for Level 1 instruments
• Level 3 – no market information is available, so valuation requires significant
judgement by management.
Financial Liabilities Financial liabilities are recognised on the Balance Sheet when the Authority becomes a party to the contractual provisions of a financial instrument, or, in the case of creditors, when the goods or service have been received. Financial liabilities are de-recognised when the liability has been paid or otherwise discharged. They are initially measured at fair value and are carried at their amortised cost. For the borrowings that the Authority has, this means that the amount presented in the Balance Sheet is the outstanding principal repayable (plus accrued interest); and interest charged to the Financing and Investment Income and Expenditure line in the Comprehensive Income and Expenditure Statement is the amount payable for the year to which it relates, according to the loan agreement. Financial Assets Financial assets are categorised according to the intention of use when the asset was purchased:
• Amortised Cost – held to collect contractual cash flows of principle and interest on
specific dates;
• Fair Value Through Other Comprehensive Income – held to collect contractual cash
flows and sell the financial asset on specified dates;
• Fair Value Through Profit or Loss – Achieve objectives other than to collect
contractual cash flows.
The financial assets of the Authority are recognised on the Balance Sheet when the Authority becomes a party to the contractual provisions of a financial instrument, or, in the case of debtors, when the goods or services have been provided or delivered. Financial assets are derecognised when the contractual rights have expired or the asset has been transferred. Loans and receivables are measured at amortised cost. Financial assets are reviewed and any expected losses are calculated annually for any assets with a significant credit risk. The

NOTES TO CORE FINANCIAL STATEMENTS
34
subsequent impairment / loss allowance, where material, is then treated according to the asset classification:
• Amortised Cost – assets are reduced by the value of the expected losses and
reflected in their carrying amount;
• Fair Value Through Other Comprehensive Income - assets have their loss allowance
recognised in the Financial Instruments Revaluation Reserve;
• Fair Value Through Profit or Loss – assets have their loss allowance recognised in
the Surplus or Deficit on Provision of Services.
1.9 Government Grants and Contributions Whether paid on account, by instalments or in arrears, government grants and third party contributions and donations are recognised as due to the Authority when there is reasonable assurance that:
• the Authority will comply with the conditions attached to the payments; and
• the grants or contributions will be received. Amounts recognised as due to the Authority are not credited to the Comprehensive Income and Expenditure Statement until conditions attached to the grant or contribution have been satisfied. Conditions are stipulations that specify that the future economic benefits or service potential embodied in the asset acquired using the grant or contribution are required to be consumed by the recipient as specified, or future economic benefits or service potential must be returned to the transferor. Monies advanced as grants and contributions for which conditions have not been satisfied are carried in the Balance Sheet as creditors. When conditions are satisfied, the grant or contribution is credited to the relevant service line (attributable revenue grants and contributions) or Taxation and Non-Specific Grant Income (non-ring fenced revenue grants and all capital grants) in the Comprehensive Income and Expenditure Statement. Where capital grants are credited to the Comprehensive Income and Expenditure Statement, they are reversed out of the General Fund Balance in the Movement in Reserves Statement. Where the grant has yet to be used to finance capital expenditure, it is posted to the Capital Grants Unapplied Reserve. Where it has been applied, it is posted to the Capital Adjustment Account. Amounts in the Capital Grants Unapplied Reserve are transferred to the Capital Adjustment Account once they have been applied to fund capital expenditure. 1.10 Property, Plant and Equipment
Assets that have physical substance and are held for use in production or supply of goods or services, for rental to others, or for administrative purposes and that are expected to be used during more than one financial year are classified as Property, Plant and Equipment.

NOTES TO CORE FINANCIAL STATEMENTS
35
Recognition Expenditure on the acquisition, creation or enhancement of assets is capitalised on an accruals basis, provided that it is probable that the future economic benefits or service potential associated with the item will flow to the Authority and the cost of the item can be measured reliably. Expenditure that maintains but does not add to an asset’s potential to deliver future economic benefits or service potential (i.e. repairs and maintenance) is charged as an expense when it is incurred. A de minimis level of £5,000 is in place for the recognition of Property, Plant and Equipment. Measurement Assets are initially measured at historic cost, comprising all expenditure that is directly attributable to bringing the asset into working condition for its intended use. Property, Plant and Equipment are valued on the basis recommended by CIPFA and in accordance with the Statements of Asset Valuation Principles and Guidance Notes issued by the Royal Institution of Chartered Surveyors (RICS). Property, Plant and Equipment are classified into the following groupings:
• Operational Assets Land and buildings Vehicles, plant and equipment
• Non–Operational Assets Assets under construction Surplus assets held for disposal
Assets held for sale Assets are then carried in the Balance Sheet using the following measurement bases:
• operational land and buildings and other operational assets at current value, determined as the amount that would be paid for the assets in its existing use;
• surplus assets held for disposal at current value, determined as the amount that would be paid for the assets for its highest and best use from a market participant’s perspective and;
• assets under construction at depreciated historical cost until brought into commission.
Where there is no market-based evidence of current value because of the specialist nature of an asset, depreciated replacement cost is used as an estimate of current value. Where non-property assets have short useful lives or low values (or both), depreciated historical cost basis is used as an estimate of current value. Increases in valuations are matched by a credit to the Revaluation Reserve to recognise unrealised gains.

NOTES TO CORE FINANCIAL STATEMENTS
36
Where decreases in value are identified, they are accounted for as follows:
• where there is a balance of revaluation gains for the asset in the Revaluation Reserve, the carrying amount of the asset is written down against that balance (up to the amount of the accumulated gains) and;
• where there is no balance in the Revaluation Reserve or an insufficient balance, the carrying amount of the asset is written down against the relevant service line(s) in the Comprehensive Income and Expenditure Statement.
The Revaluation Reserve contains revaluation gains recognised since 1 April 2007 only, the date of its formal implementation. Gains arising before that date have been consolidated into the Capital Adjustment Account. Impairment An assessment is made at the year end to determine whether an asset may be impaired. If it may, and any possible differences are estimated to be material, the recoverable amount of the asset is estimated and, where this is less than the carrying amount of the asset, an impairment loss is recognised for the shortfall. Where impairment losses are identified, the accounting entries are as follows:
• where there is a balance of revaluation gains for the asset in the Revaluation Reserve, the carrying amount of the asset is written down against the balance (up to the amount of the accumulated balance);
• where there is no balance in the Revaluation Reserve or an insufficient balance, the carrying amount of the asset is written down against the relevant service line in the Comprehensive Income and Expenditure Statement.
Where the impairment loss is reversed subsequently, the reversal is credited to the relevant line in the Comprehensive Income and Expenditure Statement, up to the amount of the original loss, adjusted for depreciation that would have been charged if the loss had not been recognised. Disposals When it becomes probable that the carrying amount of an asset will be recovered principally through a sale transaction rather than through its continuing use, it is reclassified as an Asset Held for Sale. The asset is revalued immediately before reclassification and then carried at the lower of this amount and current value less costs to sell. Where there is subsequent decrease to current value less costs to sell, the loss is posted to the Other Operating Expenditure line in the Comprehensive Income and Expenditure Statement. Gains in current value are recognised only up to the amount of any previous losses recognised in the Surplus or Deficit on Provisions of Services. Depreciation is not charged on Assets Held for Sale. If assets no longer meet the criteria to be classified as an Asset Held for Sale, they are reclassified back to non-current assets and valued at the lower of their carrying amount before they were classified as held for sale; adjusted for depreciation, amortisation or

NOTES TO CORE FINANCIAL STATEMENTS
37
revaluations that would have been recognised had they not been classified as Held for Sale, and their recoverable amount at the date of the decision not to sell. Assets that are to be abandoned or scrapped are not reclassified as Assets Held for Sale. When an asset is disposed of or decommissioned, the value of the asset in the Balance Sheet is written off to the Comprehensive Income and Expenditure Statement as part of the gain or loss on disposal. Receipts from disposals are credited to the Comprehensive Income and Expenditure Statement as part of the gain or loss on disposal, so netted off against the carrying value of the asset at the time of disposal. The written-off value of the disposal is appropriated to the Capital Adjustment Account in the Movement in Reserves Statement so as not to impact on Council Tax. Any revaluation gains in the Revaluation Reserve are transferred to the Capital Adjustment Account. Receipts from disposal of assets are categorised as Capital Receipts and credited to the Usable Capital Receipts Reserve to finance new capital investment. Depreciation
Depreciation is provided for on all Property, Plant and Equipment with a determinable finite life by allocating the value of the asset in the Balance Sheet over the periods expected to benefit from their use. Freehold land, assets with an estimated life in excess of 50 years and assets under construction are not depreciated. Annual depreciation is calculated on a straight line basis as valuation less residual value, divided by the estimated useful life of the asset. The useful lives of properties vary from 15 to 100 years; and that of vehicles, plant and equipment between 3 and 15 years. In rare cases, certain specialised equipment may be attributed a longer useful economic life. Where an item of Property, Plant and Equipment asset has major components whose cost is significant in relation to the total cost of the item, the components are depreciated separately. Revaluation gains are also depreciated, with an amount equal to the difference between current value depreciation charged on assets and the depreciation that would have been chargeable based on their historical cost being transferred each year from the Revaluation Reserve to the Capital Adjustment Account. 1.11 Donated Assets Donated assets received by the Authority are recognised immediately on receipt at current value as Property, Plant and Equipment. The opposite entry to this transaction (i.e. the gain to the Authority on receipt of the asset) is recognised as income in the relevant service line in the Comprehensive Income and Expenditure Statement. The Code notes that the exception to this is to the extent that the Authority might not meet the conditions attached to the donated asset. In such circumstances, the income relating to the assets will need to be recognised in the Donated Asset Account. The income will subsequently be recognised in

NOTES TO CORE FINANCIAL STATEMENTS
38
the Comprehensive Income and Expenditure Statement when the Authority has satisfied the conditions of donation. 1.12 Intangible Assets
Expenditure on assets that do not have physical substance but are identifiable and controlled by the Authority (e.g. software licences) is capitalised when it will bring benefits to the Authority for more than one financial year. Intangible assets are measured initially at cost. The depreciable amount of an intangible asset is amortised over its useful life to the relevant service line(s) in the Comprehensive Income and Expenditure Statement. 1.13 Basis of Valuation of Inventories Inventories are included in the Balance Sheet at the lower of cost and net realisable value and include uniforms, operational equipment, catering stock, smoke alarms, furniture stock, stationery, oil, diesel and vehicle spares. The cost of inventories is assigned using the weighted average costing formula. 1.14 Accounting for Leases – Authority as Lessee
Operating Leases Leases that do not meet the definition of finance leases are accounted for as operating leases. Rentals payable are charged to the Comprehensive Income and Expenditure Statement as an expense of the services benefiting from use of the leased assets. Charges are made on a straight-line basis over the term of the lease. Where the operating lease includes a rent free period, the benefit is carried forward as a deferred liability to be released evenly over the life of the lease. 1.15 Overheads and Support Services The costs of overheads and support services are charged to those that benefit from the supply or service, in accordance with the Authority’s arrangements for accountability and financial performance. 1.16 Private Finance Initiative (PFI) PFI and similar contracts are agreements to receive services, where the responsibility for making available the Property, Plant and Equipment needed to provide the services passes to the PFI contractor. As the Authority is deemed to control the services that are provided under its PFI schemes, and as ownership of the Property, Plant and Equipment will pass to the Authority at the end of the contracts for no additional charge, the Authority carries the assets used under the contracts on its Balance Sheet as part of Property, Plant and Equipment. The original recognition of these assets at fair value, based on the cost to purchase the Property, Plant and Equipment, is balanced by the recognition of a liability for amounts due to the scheme operator to pay for the capital investment.

NOTES TO CORE FINANCIAL STATEMENTS
39
The annual amounts payable to the PFI operators are analysed into five elements:
• fair value of the services received during the year – debited to the relevant service in the Comprehensive Income and Expenditure Statement;
• finance cost – an interest charge of 10.74% on the outstanding Balance Sheet liability, debited to the Financing and Investment Income and Expenditure line in the Comprehensive Income and Expenditure Statement;
• contingent rent – increases in the amount to be paid for the property arising during the contract, debited to the Financing and Investment Income and Expenditure line in the Comprehensive Income and Expenditure Statement;
• payment towards liability – applied to write down the Balance Sheet liability towards the PFI operator (the profile of write downs is calculated using the same principles as for a finance lease) and;
• lifecycle replacement costs – proportion of the amounts payable is posted to the Balance Sheet as a prepayment and then recognised as additions to Property, Plant and Equipment when the relevant works are eventually carried out.
1.17 Provisions, Contingent Liabilities and Contingent Assets
Provisions
Provisions are made where an event has taken place that gives the Authority a legal or constructive obligation that probably requires settlement by a transfer of economic benefits or service potential, and a reliable estimate can be made of the amount of the obligation. For example, potential legal liabilities arising from claims.
Provisions are charged as an expense to the appropriate service line in the Comprehensive Income and Expenditure Statement in the year that the Authority becomes aware of the obligation, and are measured at the best estimate at the Balance Sheet date of the expenditure required to settle the obligation, taking into account relevant risks and uncertainties.
When payments are eventually made, they are charged to the provision carried in the Balance Sheet. Estimated settlements are reviewed at the end of each financial year – where it becomes less than probable that a transfer of economic benefits will now be required (or a lower settlement than anticipated is made) the provision is reversed and credited back to the relevant service.
Contingent Liabilities
A contingent liability arises where an event has taken place that gives the Authority a possible obligation whose existence will only be confirmed by the occurrence or otherwise of uncertain future events not wholly within the control of the Authority. Contingent liabilities also arise in circumstances where a provision would otherwise be made but either it is not probable that an outflow of resources will be required, or the amount of the obligation cannot be measured reliably. Contingent liabilities are not recognised in the Balance Sheet but disclosed in a note to the accounts.

NOTES TO CORE FINANCIAL STATEMENTS
40
1.18 Reserves The Authority sets aside specific amounts as reserves for future policy purposes or to cover contingencies. Reserves are created by appropriating amounts out of the General Fund Balance in the Movement in Reserves Statement. When expenditure to be financed from a reserve is incurred, it is charged to the appropriate service in that year against the Surplus or Deficit on the Provision of Services in the Comprehensive Income and Expenditure Statement. The reserve is then appropriated back into the General Fund Balance in the Movement in Reserves Statement so that there is no net charge against Council Tax for the expenditure. The Authority’s policy for reserves is that the Authority will:
• set aside sufficient sums in Earmarked Reserves as it considers prudent to do so;
• aim to maintain General Reserves of 5% of the Net Expenditure; currently £1.425m Earmarked reserves relating to Pensions, Modernisation, Civil Resilience, Community Safety, Resilience, Insurance, Emergency Services Mobile Communications Programme, New Risks and Replacement Mobilisation System were held as at 31 March 2019 together with a General Revenue Reserve. 1.19 Revenue Expenditure Funded from Capital under Statute (REFCUS) Where the Authority has received capital grants which have been applied to REFCUS, they have been accounted for as revenue grants in the Comprehensive Income and Expenditure Statement, even if described as capital grants by the giver of the grant. Income is posted to the line(s) that the qualifying expenditure is charged to, in the Net Cost of Service. Transactions are transparent in the note detailing the components of the Adjustments between Accounting Basis and Funding Basis under Regulations line in the Movement in Reserves Statement. 1.20 VAT VAT payable is included as an expense only to the extent that it is not recoverable from Her Majesty’s Revenue and Customs. VAT receivable is excluded from income. 1.21 Group Accounts The Authority has interests in subsidiary companies and therefore group accounts have been prepared. In the Authority’s single entity accounts, the interests are recorded as financial assets at cost, less any provision for losses. 1.22 Council Tax Income The Code requires that the Council Tax income included in the Comprehensive Income and Expenditure Statement is the accrued income for the year. The difference between the income included in the Comprehensive Income and Expenditure Statement and the amount

NOTES TO CORE FINANCIAL STATEMENTS
41
required by regulation to be credited to the General Fund is taken to the Collection Fund Adjustment Account and included as a reconciling item in the Movement in Reserves Statement. The Balance Sheet includes a Collection Fund Adjustment Account to reflect the Collection Fund relationship between the Authority and Billing Authorities. The offset to this account is included in debtors/creditors. Debtor and creditor accounts are also included in the Balance Sheet to reflect the amounts due from Council Tax payers. 2 ACCOUNTING STANDARDS THAT HAVE BEEN ISSUED BUT HAVE NOT YET
BEEN ADOPTED The Authority is required to disclose the impact of an accounting change that will be required by a new standard that has been issued but not yet adopted in the CIPFA Accountancy Code of Practice for the relevant financial year. There are a number of new standards anticipated to be introduced in the 2019/20 Code, but they will not come into effect until 2020. These changes relate to:
• IFRS 16 Accounting Arrangements for Leases – replaces IAS 17 and establishes a
new model for lessees;
• IAS 40 Investment Property;
• IFRIC 22 Foreign Currency Transactions and;
• IFRIC 23 Uncertainty over income tax treatments.
It is not anticipated that these amendments will have a material impact upon the information provided in the financial statements, but it will be dependent upon arrangements in place at that time and further details of the potential impact will be disclosed when more information becomes available. 3 CRITICAL JUDGEMENTS IN APPLYING ACCOUNTING POLICIES In applying the accounting policies set out in Note 1 the Authority has had to make certain judgements about uncertainty of future events. There is a high degree of uncertainty about future levels of funding for fire authorities. However, it has been determined that this uncertainty is not yet sufficient to provide an indication that the assets of the Authority might be impaired as a result of the need to reduce levels of service provision. 4 ASSUMPTIONS MADE ABOUT THE FUTURE AND OTHER MAJOR SOURCES OF
ESTIMATION UNCERTAINTY
The Statement of Accounts contains estimated figures that are based on assumptions made by the Authority about the future or that are otherwise uncertain. Estimates are made taking into account historical experience, current trends and other relevant factors. However, as balances cannot be determined with certainty, actual results could be materially different from the assumptions and estimates.

NOTES TO CORE FINANCIAL STATEMENTS
42
The items in the Authority’s Balance Sheet at 31 March 2019 for which there is a significant risk of material adjustment in the forthcoming financial year are as follows: 4.1 Property, Plant and Equipment
Uncertainty
Assets are depreciated over useful lives that are dependent on assumptions about the level of repairs and maintenance that will be incurred in relation to individual assets. The current economic climate makes it uncertain that the Authority will be able to sustain its current spending on repairs and maintenance, bringing into doubt the useful lives assigned to assets. Effect if actual results differ from assumptions
If the useful life of assets is reduced, depreciation increases and the carrying amount of the asset falls.
It is estimated that the annual depreciation charge for buildings would increase by approximately £0.064m for every year that useful lives had to be reduced.
4.2 Pension Liability
Uncertainty
Estimation of the net liability to pay pensions depends on a number of complex judgements relating to the discount rate used, the rate at which salaries are projected to increase, changes in retirement ages, mortality rates and expected returns on pension fund assets. Actuaries are engaged to provide the Authority with expert advice about the assumptions to be applied.
Effect if actual results differ from assumptions
The effects of changes in individual assumptions on the total pension liability can be measured. Examples of how changes in assumptions would impact upon the Firefighters’ pension liability are shown in the table below:
Change in assumption * Increase in Liability
% £m
Rate of return:
in excess of earnings – reduction of 0.5% per annum 1.5 6
in excess of pensions – reduction of 0.5% per annum 8.0 31
Pensioner mortality
pensioners living (on average) 1 year longer 2.5 10
* Opposite changes in assumptions would produce equal and opposite changes in the liability.

NOTES TO CORE FINANCIAL STATEMENTS
43
5 EXPENDITURE AND FUNDING ANALYSIS 5.1 Expenditure and Funding Analysis The Expenditure and Funding Analysis shows how annual expenditure is used and funded from resources (government grants, council tax and business rates) by local authorities in comparison with those resources consumed or earned by authorities in accordance with generally accepted accounting practices. Income and expenditure accounted for under generally accepted accounting practices is presented more fully in the Comprehensive Income and Expenditure Statement.
2017/18 2018/19
Net Expenditure Chargeable
to the General
Fund
Adjustments Between the Funding and Accounting
Basis
Net Expenditure in the
Comprehensive Income and Expenditure Statement
Net Expenditure Chargeable
to the General
Fund
Adjustments Between the Funding and Accounting
Basis
Net Expenditure
in the Comprehensive
Income and Expenditure Statement
£000 £000 £000 £000 £000 £000 21,332 3,679 25,011 Employees 21,545 19,568 41,113 2,604 - 2,604 Premises 2,677 - 2,677
648 - 648 Transport 640 - 640 3,961 - 3,961 Supplies & Services 4,106 - 4,106
98 - 98 Provisions - - - 1,073 88 1,161 Capital Financing 1,305 1,615 2,920
-3,437 - -3,437 Income -2,540 - -2,540
26,279
3,767
30,046
Net Cost of Services
27,733
21,183
48,916
-
919
1
10,176
1
11,095
Other Operating Income & Expenditure Financing and Investment Income & expenditure
-
985
19
9,929
19
10,914
-27,826 -105 -27,931 Taxation & Non Specific Grants Income
-28,691 290 -28,401
-628
13,839
13,211
Surplus (-) or Deficit on Provisions of Services
27
31,421
31,448
-2,824 Opening General Fund
Balance -1,388
Surplus on General Fund Balance in the year
-37
2,064 Transfers to / from (-) earmarked reserves
-27
-1,388
Closing General Fund Balance
-1,425
5.2 Note to the Expenditure and Funding Analysis This note provides a reconciliation of the main adjustments to the Net Expenditure chargeable to the General Fund to arrive at the amounts in the Comprehensive Income and Expenditure Statement. The relevant transfers between reserves are explained in the Movement in Reserves Statement.

NOTES TO CORE FINANCIAL STATEMENTS
44
• Adjustments for Capital Purposes
This column adjusts for depreciation, impairment and revaluation gains / losses in the Net Cost of Services line, along with the statutory charges for capital financing (minimum revenue provision and revenue contributions) as these are not chargeable under generally accepted accounting practices.
Capital disposals with a transfer of income on disposal of assets and the amounts written off for those assets are adjusted within other operating expenditure.
The Taxation and Non Specific Grant Income and Expenditure line is credited with capital grants receivable in the year without conditions, or for which conditions were satisfied in the year.
• Net Change for the Pensions Adjustments
This column includes the net change for the removal of pension contributions and the addition of IAS19 Employee Benefits pension related expenditure and income.
Within Net Cost of Services, this represents the removal of the employer pension contributions made by the Authority as allowed by statute and the replacement with current service costs and past service costs.
Within Financing and Investment Income and Expenditure, the net interest in the defined benefit liability is charged to the CIES.
• Other Differences
Other differences between amounts debited / credited to the Comprehensive Income and Expenditure Statement and amounts payable / receivable to be recognised under statute are included in this column.
The Net Cost of Services line includes adjustments in respect of the accrual for compensated absences earned but not taken in the year, such as annual leave entitlement carried forward at the year end.
The charge under Taxation and Non Specific Grant Income and Expenditure represents the difference between what is chargeable under statutory regulations for council tax and non-domestic rates that was anticipated to be received at the start of the year, and the income recognised under generally accepted accounting practices in the Code. This is a timing difference as any difference will be brought forward in future Surpluses or Deficits on the Collection Fund.

NOTES TO CORE FINANCIAL STATEMENTS
45
The comparatives for 2017/18 are shown in the table below:
2018/19
Adjustments from General Fund to arrive at the Comprehensive Income and Expenditure Statement amounts
Adjustments for Capital Purposes
Net Change for the
Pensions Adjustments
Other Differences
Total Adjustments
£000 £000 £000 £000 Employees - 19,566 2 19,568 Premises - - - - Transport - - - - Supplies & Services - - - - Provisions - - - - Capital Financing 1,615 - - 1,615 Income - - - -
Net Cost of Services
1,615
19,566
2
21,183
Other Operating Income & Expenditure Financing and Investment Income & Expenditure
19 -
- 9,929
- -
19 9,929
Taxation & Non Specific Grants Income - - 290 290
Difference between General Fund Surplus or Deficit and Comprehensive Income and Expenditure Statement Surplus or Deficit on the Provision of Services
1,634
29,495
292
31,421
2017/18
Adjustments from General Fund to arrive at the Comprehensive Income and Expenditure Statement amounts
Adjustments for Capital Purposes
Net Change for the
Pensions Adjustments
Other Differences
Total Adjustments
£000 £000 £000 £000 Employees - 3,684 -5 3,679 Premises - - - - Transport - - - - Supplies & Services - - - - Provisions - - - - Capital Financing 88 - - 88 Income - - - -
Net Cost of Services
88
3,684
-5
3,767
Other Operating Income & Expenditure Financing and Investment Income & Expenditure
1 -
- 10,176
- -
1 10,176
Taxation & Non Specific Grants Income - - -105 -105
Difference between General Fund Surplus or Deficit and Comprehensive Income and Expenditure Statement Surplus or Deficit on the Provision of Services
89
13,860
-110
13,839

NOTES TO CORE FINANCIAL STATEMENTS
46
6 MOVEMENT IN RESERVES STATEMENT
6.1 Adjustments between Accounting Basis and Funding Basis under Regulations
This note details the adjustments that are made to the total comprehensive income and expenditure recognised by the Authority in the year, in accordance with proper accounting practice, to the resources that are specified by statutory provisions as being available to the Authority to meet future capital and revenue expenditure.
2018/19 USABLE RESERVES
General Fund
Balance
Capital Receipts Reserve
Capital Grants
Unapplied
Movement in Unusable Reserves
Charges for depreciation, impairment and downward revaluations of non-current assets
-2,866 2,866
Amortisation of Intangible Assets -54 54
Capital Grants and Contributions - -
Amounts of non-current assets written off on disposal or sale as part of the gain/loss on disposal to the Comprehensive Income and Expenditure Statement
-32 32
Use of Capital Receipts Reserve to finance new capital 13 -13
Transfer of cash proceeds credited as part of the gain on disposal to the Comprehensive Income and Expenditure Statement
13 -13
Statutory provision for the financing of Capital Investment 258 -258
Capital expenditure charged against the General Fund 1,047 -1,047
Reversal of items relating to retirement benefits debited or credited to the Comprehensive Income and Expenditure Statement
-32,624 32,624
Employer’s pensions contributions and direct payments to pensioners payable in the year
3,129 -3,129
Adjustments by which Council Tax income credited to the Comprehensive Income and Expenditure Statement is different from Council Tax income calculated for the year in accordance with statutory requirements
-290 290
Amount by which officer remuneration charged to the Comprehensive Income and Expenditure Statement on an accruals basis is different from remuneration chargeable in the year in accordance with statutory requirements
-2 2
Total Adjustments -31,421 - - 31,421

NOTES TO CORE FINANCIAL STATEMENTS
47
Comparatives for 2017/18 are as follows:
2017/18 USABLE RESERVES
General Fund
Balance
Capital Receipts Reserve
Capital Grants
Unapplied
Movement in Unusable Reserves
£000 £000 £000 £000 Charges for depreciation, impairment and downward revaluations of non-current assets
-1,092 1,092
-70 70
Amortisation of Intangible Assets - -
Capital Grants and Contributions
Amounts of non-current assets written off on disposal or sale as part of the gain/loss on disposal to the Comprehensive Income and Expenditure Statement
-34 34
Use of Capital Receipts Reserve to finance new capital 33 -33 Transfer of cash proceeds credited as part of the gain on disposal to the Comprehensive Income and Expenditure Statement
33 -33
Statutory provision for the financing of Capital Investment 256 -256
Capital expenditure charged against the General Fund 818 -818
Reversal of items relating to retirement benefits debited or credited to the Comprehensive Income and Expenditure Statement
-17,066 17,066
Employer’s pensions contributions and direct payments to pensioners payable in the year
3,206 -3,206
Adjustments by which Council Tax income credited to the Comprehensive Income and Expenditure Statement is different from Council Tax income calculated for the year in accordance with statutory requirements
105 -105
Amount by which officer remuneration charged to the Comprehensive Income and Expenditure Statement on an accruals basis is different from remuneration chargeable in the year in accordance with statutory requirements
5 -5
Total Adjustments -13,839 - - 13,839
7 COMPREHENSIVE INCOME AND EXPENDITURE 7.1 Non Distributed Costs Pension costs relating to past service are treated as non distributed costs. There are no exceptional items in 2018/19. 7.2 Gain / Loss on the Disposal of Property, Plant and Equipment In accordance with the Code, any gain or loss on disposal of an asset is to be included in the Comprehensive Income and Expenditure Statement. The gain or loss is shown as a

NOTES TO CORE FINANCIAL STATEMENTS
48
reconciling item in the Movement in Reserves Statement. The loss shown in the Comprehensive Income and Expenditure Account for 2018/19 amounts to £0.019 m. 7.3 Members’ Allowances
Members’ allowances are paid under a scheme introduced by the Fire and Rescue Authority in December 2003. Expenses for conference and other non-routine meetings are also paid by the Fire and Rescue Authority. The total amounts for allowances and expenses paid in relation to Members are as follows:
2017/18 2018/19
£000 £000
Allowances Expenses
53 7
54 10
Total 60 64
7.4 Employee Remuneration In accordance with the Accounts and Audit (England) Regulations 2012, disclosure is required for employees whose remuneration, excluding pension contributions, during the period exceeded £50,000. Individual remuneration details are required for senior employees; and in accordance with the Regulations, senior employees are included by job title.
2018/19
Salary
(including fees &
allowances)
Expense Allowances
Benefits in Kind (e.g.
Car Allowances)
Total Remuneration
excluding pension
contributions
Pension contributions
Total Remuneration
including pension
contributions
£ £ £ £ £ £
Chief Fire Officer – S. Errington 141,277 120 - 141,397 20,203 161,600
Deputy Chief Fire Officer 37,458 290 - 37,748 8,128 45,876
Assistant Chief Fire Officer 105,831 130 - 105,961 15,134 121,095
Assistant Chief Fire Officer 108,577 122 - 108,699 6,937 115,636
Director of Corporate Resources and Treasurer 89,900 - - 89,900 14,923 104,823
483,043 662 - 483,705 65,325 549,030
In February 2018, the senior leadership team was restructured in response to the Fire Reform Programme and the new inspection regime. The revised structure comprises of the Chief Fire Officer, two Assistant Chief Fire Officers and the Director of Corporate Resources/Treasurer. The Deputy Chief Fire Officer post remained in place until July 2018 in order to provide continuity during the transition. The Assistant Chief Fire Officers previously held different roles within the Fire Authority and the remuneration details shown in the 2017/18 comparative below only relate to the period spent in the new role.

NOTES TO CORE FINANCIAL STATEMENTS
49
Comparative figures for 2017/18 are as follows:
2017/18
Salary
(including fees &
allowances)
Expense Allowances
Benefits in Kind (e.g. Car Allowances)
Total Remuneration
excluding pension
contributions
Pension contributions
Total Remuneration
including pension
contributions
£ £ £ £ £ £
Chief Fire Officer – S. Errington 138,850 120 - 138,970 19,855 158,825
Deputy Chief Fire Officer 110,444 - - 110,444 23,966 134,410
Assistant Chief Fire Officer 13,294 - - 13,294 1,901 15,195
Assistant Chief Fire Officer 9,409 - - 9,409 1,048 10,457
Director of Corporate Resources and Treasurer
88,355 - - 88,355 14,667 103,022
360,352 120 - 360,472 61,437 421,909
Other employees, whose remuneration is in excess of £50,000, are included within the bandings of £5,000.
Remuneration Band Number of Employees
2017/18 2018/19
£50,000-£54,999 6 17 £55,000-£59,999 2 4
£60,000-£64,999 4 4
£65,000-£69,999 2 1
£70,000-£74,999 - 1
£75,000-£79,999 2 1
Note: No redundancy payments are included in the 2017/18 or 2018/19 salary bands shown above. 7.5 Exit Packages The numbers and total cost of exit packages agreed in 2017/18 and 2018/19 are set out below:
Exit Package cost band
Number of compulsory
redundancies
Number of other departures
agreed
Total number of exit packages
agreed
Total cost of exit packages agreed
2017/18 2018/19 2017/18 2018/19 2017/18 2018/19 2017/18 2018/19
£ £
£0-£20,000 - - - 1 - 1 - 13 £20,001-£40,000 - - - - - - - - £40,001-£60,000 - - - - - - - - £60,001-£80,000 - - - - - - - - £80,001-£100,000 - - - - - - - - £100,001-£150,000 - - - - - - - -
Total - - - 1 - 1 - 13
The exit package disclosed in the table above relates to a compensation payment made during the year.

NOTES TO CORE FINANCIAL STATEMENTS
50
7.6 Termination Benefits The ‘Employee’ Line of the comprehensive income and expenditure statement for 2018/19 includes £12,500 in respect of compensation payment. In concluding the organisational restructure, undertaken in the previous year, the Authority terminated an employment contract, by mutual agreement, in 2017/18. The ‘Employee’ line of the Comprehensive Income and Expenditure Statement for 2017/18 includes redundancy payment costs of £38,750 which had been agreed in the previous year. 7.7 External Audit Fees The accounts of the Authority are audited by Mazars LLP. In accordance with the Code, authorities are required to disclose payment of fees. The fees payable to Mazars LLP for 2017/18 and 2018/19 are set out below:
2017/18 2018/19
£000 £000 Fees payable to auditors with regard to external audit services carried out by the appointed auditor
29 22
Additional fees payable to auditors for work required for the audit of Group Accounts
- 2
Fees payable to auditors in respect of other services provided by the appointed auditor
- -
29 24
7.8 Minimum Revenue Provision (MRP) The Local Authorities Capital Finance and Accounting (England) (Amendment) Regulations 2011 requires the Authority to provide for an amount of MRP which it considers to be prudent. MRP has been prepared on the basis of 4% of the capital finance requirement at the end of the preceding year, relating to assets held prior to 2008 and 2% of the capital financing requirement at the end of the preceding year for all other assets. The MRP relating to the Private Finance Initiative scheme has been calculated as a sum equivalent to the principal repayment of the outstanding liability. The amount of MRP charged to the accounts is disclosed in Note 8.5. 7.9 Operating Leases During 2012/13, the Authority took over the lease of the former Regional Control Centre in Belmont, Durham, to use as its Headquarters. The Authority entered into this lease for 15 years. During 2013/14, the Authority entered into a lease for its new Technical Services Centre at Bowburn, Durham. The Authority has entered into this lease for 15 years.

NOTES TO CORE FINANCIAL STATEMENTS
51
The future minimum lease payments due under non-cancellable leases in future years are:
31 March 2018 31 March 2019
Within one year Later than one year and not later than five years Later than 5 years
Property Property
£000 £000
458 458
1,882 1,948
2,268 1,744
4,608 4,150
The expenditure charged to the Comprehensive Income and Expenditure Statement during the year in relation to these property leases was £458,216 (2017/18: £442,813). 7.10 Amounts Reported for Resource Allocation Decisions The analysis of income and expenditure on the face of the Comprehensive Income and Expenditure Statement reflects the internal financial management reporting, as required by the Code. The Code recommends that, where appropriate, “segmental” reporting information is detailed. Reporting segments are those used by resource decision makers when determining budgets and financial control. With regard to County Durham and Darlington Fire and Rescue Authority, as the costs relate to one major type of service expenditure, segmental reporting is not identified. 7.11 Grant Income The Authority credited the following grants and contributions to the Comprehensive Income and Expenditure Statement in 2018/19:
2017/18 2018/19
£000 £000 Private Finance Initiative 1,130 1,130 Central Government 1,204 572 Credited to Services 2,334 1,702 Revenue Support Grant 4,529 3,843 National Non-Domestic Rates 6,610 6,908 Small Business Rates Relief Grant 190 449 Capital Grants - - Capital Contributions - - Credited to Taxation and Non-Specific Grant Income 11,329 11,200
Total Grant Income 13,663 12,902
7.12 Related Parties The Authority is required to disclose material transactions with related parties i.e. bodies or individuals that have the potential to control or influence or be controlled/ influenced by the Authority. Disclosure of these transactions allows readers to assess the extent to which the Authority may have been constrained in its ability to operate independently or might have secured the ability to limit another party’s ability to bargain freely with the Authority.

NOTES TO CORE FINANCIAL STATEMENTS
52
Transactions should be disclosed where material to either the organisation or individual with whom the transaction has been incurred. Central Government Central Government has effective control over the general operations of the Authority. It is responsible for providing the statutory framework within which the Authority operates, provides funding in the form of grants and prescribes the terms of many of the transactions that the Authority has with other parties. Grants received from Government Departments are included within the Comprehensive Income & Expenditure Statement. An analysis of Government grants is shown above in Note 7.11. Members Members of the Authority have direct control over the Authority’s financial and operating policies. Details of transactions relating to members’ interests are recorded in the Register of Members’ Interest which is accessible on the Authority’s website. Following a review of the register and the Related Party Transactions Declarations, it was established that there were no material related party transactions involving members, bar those relating to the Community Interest Company and Vital Fire Solutions Limited, which is disclosed further below. The total of members’ allowances paid in 2018/19 is shown in Note 7.3. A number of Members of the Authority are also Members of Durham County Council and Darlington Borough Council. It is not considered that there have been any material transactions that could have been affected by this relationship. Officers Helen Lynch is Clerk to the Authority and also Head of Legal and Democratic Services for Durham County Council. There were no related party transactions involving senior employees except those relating to the Community Interest Company and Vital Fire Solutions Limited which are disclosed further below. Other Public Bodies Durham County Council administers the Durham County Council Pension Fund of which the Authority is a member. Formal agreements are in place between the Authority and Durham County Council for the provision of legal services, financial services and technical services. The agreements are signed by both parties and regularly reviewed by the Authority’s Director of Corporate Resources and Treasurer. The value of these agreements is £0.217m (2017/18: £0.193m).

NOTES TO CORE FINANCIAL STATEMENTS
53
The Authority obtains part of its income from precepts levied on the collection authorities in its area. During the year, transactions with related parties, excluding those disclosed elsewhere in the accounts, were as follows:
Receipts
Precepts 2017/18
Precepts 2018/19
£000 £000 Durham County Council 13,393 14,228 Darlington Borough Council 3,124 3,255
Adjustment for share of Collection Fund
16,517 85
17,483 -282
16,602 17,201
At 31 March 2019, the Authority owes Durham County Council £0.119m (2017/18: £0.056m) relating to amounts due from Council Tax Payers. Durham County Council owes the Authority £0.117m (2017/18: £0.410m) in respect of the Collection Fund and £0.300m (2017/18: £0.265m) in respect of amounts due from Non-Domestic Rates Payers. In addition, £0.290m (2017/18: £0.250m) is due to the Authority from Durham County Council relating to VAT claimed on the Authority’s behalf. At 31 March 2019, the Authority owes Darlington Borough Council £0.298m (2017/18: £0.285m) in respect of amounts due from Council Tax Payers and £0.012m (2017/18: £0.016m) in respect of the Collection Fund. Darlington Borough Council owes the Authority £0.011m (2017/18: £0.016m) in respect of amounts due from Non Domestic Rates Payers. County Durham and Darlington Community Interest Company In 2013/14, County Durham and Darlington Community Interest Company was incorporated and commenced trading during 2014/15. The Community Interest Company is a 100% owned subsidiary of the Authority. The Directors of the company are also senior managers and members of the Authority. As at 31 March 2019, £5,516 (2017/18: £27,909) was due to the Fire Authority from the company in respect of management and administration recharges. The Authority owes the company £7,500 (2017/18: £nil) in respect of funding for a community project. A summary of the company’s accounts are shown in Note 7.13. Vital Fire Solutions Limited In 2015/16, Vital Fire Solutions Limited was incorporated, and the Authority purchased £15,000 of share capital. The company is a 100% owned subsidiary of the Authority. The Directors of the company are also senior managers and members of the Authority. As at 31 March 2019, £84,004 (2017/18: £87,394) was due to the Fire Authority from the company in respect of management and administration recharges. A summary of the company’s accounts are shown in Note 7.14.

NOTES TO CORE FINANCIAL STATEMENTS
54
7.13 Community Interest Company
The Fire Authority has set up a Community Interest Company for trading purposes. The company is registered as County Durham and Darlington Fire and Rescue Community Interest Company. The company is wholly owned by the Fire Authority. The accounts of the company are summarised below. The prior year figures have been restated following completion of the audit. The changes relate to the tax on profit and are not material. Group Accounts have been produced for 2018/19 and are presented on pages 17 to 22 of this Statement of Accounts.
2017/18
Restated £000
2018/19
£000
Turnover Cost of Sales Gross Profit Administrative Expenses Profit/(Loss) for the year before taxation Tax on profit
68 -32
6 -1
36 -29
5 -7
7 -2
-2 -
Profit/(Loss) for the financial year 5 -2
7.14 Vital Fire Solutions Limited The Fire Authority has created Vital Fire Solutions Limited for trading purposes. This is registered as a Limited Company and wholly owned by the Fire Authority, who purchased £15,000 of share capital. The accounts of the company are summarised below. The prior year figures have been restated following completion of the audit. The changes are not material. Group Accounts have been produced for 2018/19 and are presented on pages 17 to 22 of this Statement of Accounts.

NOTES TO CORE FINANCIAL STATEMENTS
55
2017/18
Restated £000
2018/19
£000
Turnover Cost of Sales Gross Profit Administrative Expenses Other Income Profit/(Loss) for the year before taxation Tax on profit
300 -154
286 -189
146 -149
1
97 -150
1
- 2 -
-52 -
Profit/(Loss) for the financial year - 2 -52
8 BALANCE SHEET 8.1 Intangible Assets Intangible assets are assets that continue to provide an economic benefit to the Authority but which do not have physical form. The following shows the movement on intangible assets during the year:
£000 Original Cost 595 Amortisations to 31 March 2018 -316
Balance at 1 April 2018 279 Expenditure in year - Disposals -20
Amortisation during year -54 Amortisation on disposals 20
Balance at 31 March 2019 225
Comparatives for 2017/18 are as follows:
£000 Original Cost 610 Amortisations to 31 March 2017 -265
Balance at 1 April 2017 345 Expenditure in year 4 Disposals -19
Amortisation during year -70 Amortisation on disposals 19
Balance at 31 March 2018 279

NOTES TO CORE FINANCIAL STATEMENTS
56
8.2 Operational Assets
All valuations of buildings are undertaken by or under the supervision of a fully qualified Chartered Surveyor, who is an employee of a related party, Durham County Council. Full fixed asset revaluations are undertaken once every five years, unless the changes in the BCIS index during the year would have a material impact on the asset portfolio. The most recent valuation of Land and Buildings is effective from 1 April 2018. These values have been used to determine the 31 March 2019 valuations. A full valuation as part of the agreed 5 year rolling programme has been undertaken in 2018/19.
Property, Plant & Equipment
Vehicles, Plant &
Equipment
Land & Buildings
Surplus Assets
Total
£000 £000 £000 £000 Cost or Valuation
At 1 April 2018 16,575 38,086 24 54,685 Additions 353 283 - 636 Derecognition - Disposals / Demolitions -558 - - -558 Reclassifications - 521 - 521 Assets reclassified as held for sale - - - - Accumulated depreciation and impairment written off to GCA
- -1,192 - -1,192
Revaluation increases recognised in the Surplus on the Provision of Services
- 1,074 - 1,074
Revaluation decreases recognised in the Surplus on the Provision of Services
- -1,387 - -1,387
Revaluation increases recognised in the Revaluation Reserve
- 4,284 - 4,284
Revaluation decreases recognised in the Revaluation Reserve
- -3,284 - -3,284
At 31 March 2019 16,370 38,385 24 54,779
Depreciation and Impairments At 1 April 2018 -8,992 -1,375 -1 -10,368 Charge for 2018/19 -1,276 -1,246 - -2,522 Derecognition - Disposals / Demolitions 526 - - 526 Depreciation written off to GCA - 932 - 932 Impairment written off to GCA - 260 - 260 Impairment losses recognised in the Surplus on the Provision of Services
- -31 - -31
Impairment losses recognised in the Revaluation Reserve
- -252 - -252
At 31 March 2019 -9,742 -1,712 -1 -11,455
Balance Sheet amount at 31 March 2019 6,628 36,673 23 43,324
Balance Sheet amount at 01 April 2018 7,583 36,711 23 44,317

NOTES TO CORE FINANCIAL STATEMENTS
57
Comparatives for 2017/18 are as follows:
Property, Plant & Equipment
Vehicles, Plant &
Equipment
Land & Buildings
Surplus Assets
Total
£000 £000 £000 £000 Cost or Valuation
At 1 April 2017 16,583 38,248 24 54,855 Additions 202 73 - 275 Derecognition - Disposals / Demolitions -265 - - -265 Reclassifications 55 - - 55 Assets reclassified as held for sale - - - - Accumulated depreciation and impairment written off to GCA
- -972 - -972
Revaluation increases recognised in the Surplus on the Provision of Services
- 1,459 - 1,459
Revaluation decreases recognised in the Surplus on the Provision of Services
- -9 - -9
Revaluation increases recognised in the Revaluation Reserve
- 712 - 712
Revaluation decreases recognised in the Revaluation Reserve
- -1,425 - -1,425
At 31 March 2018 16,575 38,086 24 54,685
Depreciation and Impairments At 1 April 2017 -7,886 -1,110 -1 -8,997 Charge for 2017/18 -1,337 -1,164 - -2,501 Derecognition - Disposals / Demolitions 231 - - 231 Depreciation written off to GCA - 851 - 851 Impairment written off to GCA - 121 - 121 Impairment losses recognised in the Surplus on the Provision of Services
- -40 - -40
Impairment losses recognised in the Revaluation Reserve
- -33 - -33
At 31 March 2018 -8,992 -1,375 -1 -10,368
Balance Sheet amount at 31 March 2018 7,583 36,711 23 44,317
Balance Sheet amount at 01 April 2017 8,697 37,138 23 45,858

NOTES TO CORE FINANCIAL STATEMENTS
58
The carrying value of operational assets is analysed according to the year in which they were valued as follows:
Vehicles, Plant &
Equipment
Land & Buildings
Surplus Assets
Total
£000 £000 £000 £000 Carried at historical cost 16,370 10,000 24 26,394 Valued at fair value as at: 31 March 2018 31 March 2019
- -
42
28,343
- -
42
28,343
Total Cost or Valuation 16,370 38,385 24 54,779
8.3 Non-Operational Assets
Non-Operational Assets
Assets Under Construction
2017/18
Assets Under Construction
2018/19
£000 £000 Cost or valuation At 1 April 40 97 Additions 112 424 Disposals - - Reclassifications -55 -521
At 31 March 97 -
Depreciation and impairments At 1 April - - Charge for year - - Disposals - - Reclassifications - - Revaluation increases / (decreases) recognised in the Revaluation Reserve
- -
At 31 March - -
Balance Sheet amount at 31 March 97 -
Balance Sheet amount at 01 April 40 97
8.4 Sources of Funds to Meet Capital Expenditure and Other Plans Resources and borrowing estimated to arise in future years will be used to finance the Authority’s approved capital programme which is subject to a rolling review. 8.5 Capital Expenditure and Capital Financing The total amount of capital expenditure incurred in the year is shown in the table below together with the resources that have been used to finance it. The capital financing requirement represents that part of the value of Property, Plant and Equipment and Intangible Assets that is to be met from external borrowing and capital cash overdrawn.

NOTES TO CORE FINANCIAL STATEMENTS
59
The requirement has decreased by £0.258m from £8.702m to £8.444m as follows:
2017/18 2018/19
£000 £000
Opening Capital Financing Requirement 9,419 8,702
Capital Investment Property, Plant & Equipment 275 636 Non-Operational Assets 111 424 Intangible Assets 4 - Assets Held for Sale - - Investment in share capital - - Revenue Expenditure Funded from Capital Under Statute - - Donated Assets - -
Sources of Finance Capital Receipts -33 -13 Government Grants and Contributions - - Minimum Revenue Provision -65 -53 Minimum Revenue Provision – PFI -191 -205 Direct Revenue Provision -818 -1,047 Closing Capital Financing Requirement 8,702 8,444
Explanation of movements in the year Reduction in underlying need to borrow (supported by Government financial assistant)
-717 -258
Increase in underlying need to borrow (unsupported by Government financial assistance)
- -
Increase/decrease (-) in Capital Financing Requirement -717 -258
8.6 Capital Commitments Major capital commitments as at 31 March 2019 are shown in the table below:
2017/18 £m
2018/19 £m
Stanhope Fire Station alterations Darlington Fire Station Replacement
0.413 -
- 4.006
8.7 Information on Assets Held Details concerning assets held by the Fire and Rescue Authority are shown below:
Asset Type Number as at 31 March 2018
Number as at 31 March 2019
Fire Stations Standby Accommodation Blocks
15 2
15 2
Training Centre Vehicles
1 136
1 142

NOTES TO CORE FINANCIAL STATEMENTS
60
8.8 Inventories
2017/18 2018/19
£000 £000 Balance outstanding at 1 April 486 419 Purchases 494 604 Recognised as an expenses in the year -561 -485
Balance outstanding at 31 March 419 538 Provision for obsolete stock - -
Balance outstanding at 31 March after provision 419 538
8.9 Debtors These are sums of money due to the Authority but unpaid as at 31 March 2019. The Authority seeks to recover sums due to it as soon as possible and actively pursues outstanding accounts rendered upon debtors.
Debtors have been reviewed for impairment and the provision for doubtful debts reflects any uncertainty about amounts receivable.
31 March 2018
31 March 2019
£000 £000 Amounts falling due within one year: Debtors
Government Departments 151 486 Other Local Authorities 1,378 1,148 Other Debtors 1,814 2,009 Payments in Advance 776 825 Impairment for Doubtful Debts - -
4,119 4,468 Amounts falling due after one year: 1 1
4,120 4,469
8.10 Cash and Cash Equivalents The balance of Cash and Cash Equivalents is made up of the following elements:
31 March 2018 31 March 2019
£000 £000 Cash held by the Authority 15 15 Bank current accounts 682 118 Short term deposits with banks and building societies 6,442 5,303
Total Cash and Cash Equivalents 7,139 5,436
During the year information is provided to the Authority regarding short term deposits. In accordance with the Authority’s adopted Treasury Policy Statement, the Authority is informed of transactions made with UK clearing banks, money markets and major building societies. The accrued interest relating to short term deposits included in the figure above amounts to £3,061 as at 31 March 2019 (£1,793 as at 31 March 2018).

NOTES TO CORE FINANCIAL STATEMENTS
61
8.11 Creditors These are amounts owed by the Authority for works done, goods received or services rendered which have not been paid for as at 31 March 2019.
31 March 2018 31 March 2019
£000 £000 Creditors Government Departments 594 475 Other Local Authorities 847 1,072 Other Creditors 1,377 1,106 Receipts in Advance
713 701
3,531 3,354
Short-term Borrowing 5 -
3,536 3,354
During 2018/19, the Authority settled its outstanding loans. As a result, the accrued interest relating to short-term borrowing, included above, is £nil as at 31 March 2019 (£4,684 as at 31 March 2018). 8.12 Financial Instruments
A financial instrument is any contract that gives rise to a financial asset of one entity and a financial liability or equity instrument of another. Under IFRS9, the Authority recognises expected losses for Financial Instruments, rather than actual losses. Any expected losses for 2018/19 are immaterial, and therefore, the Authority has elected not to reflect them in the financial statements, in accordance with CIPFA guidance.

NOTES TO CORE FINANCIAL STATEMENTS
62
Financial Instruments Balances
The carrying amount of financial instruments is shown below:
31 March 2018 31 March 2019
Long-term
Current Long-term
Current
£000 £000 £000 £000 Financial Liabilities at amortised cost PWLB Borrowing 728 5 - - Bank Overdraft - - - - Trade Creditors Other Creditors
- -
74 1,446
- -
158 824
Private Finance Initiative 7,176 205 6,961 215
Total Borrowing 7,904 1,730 6,961 1,197 Loans and Receivables at amortised cost Short-term Deposits Bank Deposits
- -
6,442 698
- -
5,303 133
Long-term Debtors 1 - 1 - Trade Debtors Other Debtors
- -
777 1,063
- -
1,053 823
Total Loans and Receivables at amortised cost 1 8,980 1 7,312 Loans and Receivables at FVPL Long-term Investments 15 - 15 -
Total Investments 16 8,980 16 7,312
Financial Instruments Gains and Losses The gains and losses recognised in the 2018/19 Comprehensive Income and Expenditure Statement in relation to financial instruments are made up as follows:
2018/19 Financial Liabilities
measured at Amortised Cost Financial Assets Loans
and Receivables
£000 £000 Interest expense 1,041 - Interest income - -56
Net gain(-)/loss for the year 985
Comparative figures as at 31 March 2018 are as follows:
2017/18 Financial Liabilities
measured at Amortised Cost Financial Assets Loans
and Receivables
£000 £000 Interest expense 944 - Interest income - -26
Net gain(-)/loss for the year 918

NOTES TO CORE FINANCIAL STATEMENTS
63
Nature and Extent of Risks Arising from Financial Instruments The Authority’s activities expose it to a variety of financial risks:
• Credit risk – the possibility that other parties might fail to pay amounts due to the Authority;
• Liquidity risk – the possibility that the Authority might not have funds available to meet its commitments to make payments;
• Market risk – the possibility that financial loss might arise for the Authority as a result of changes in such measures as interest rates.
The Authority’s overall risk management procedures focus on the unpredictability of financial markets, and implementing restrictions to minimise these risks. The procedures for risk management are set out through a legal framework set out in the Local Government Act 2003 and the associated regulations. These require the Authority to comply with the CIPFA Prudential Code, the CIPFA Treasury Management in the Public Services Code of Practice and Investment Guidance issued through the Act. Overall these procedures require the Authority to manage risk in the following ways:
• by formally adopting the requirements of the Code of Practice;
• by approving annually in advance prudential indicators for the following three years limiting:
- the Authority’s overall borrowing; - its maximum and minimum exposures to fixed and variable rates; - its maximum and minimum exposures the maturity structure of its debt; - its maximum annual exposures to investments maturing beyond a year;
• by approving an investment strategy for the forthcoming year setting out its criteria for both investing and selecting investment counterparties in compliance with the Government Guidance.
These are required to be reported and approved at or before the Authority’s annual Council Tax setting budget. The items are reported within the annual Treasury Management Strategy that outlines the detailed approach to managing risk in relation to the Authority’s financial instrument exposure. Actual performance is also reported annually to Members. The Treasurer is responsible for implementing the policies outlined above. The Authority maintains written principles for overall risk management, as well as written policies covering specific areas, such as interest rate risk, credit risk, and the investment of surplus cash through Treasury Management Practices (TMPs). These TMPs are a requirement of the Code of Practice and are reviewed regularly. (a) Credit Risk
Credit risk arises from deposits with banks and financial institutions as well as credit exposures to the Authority’s customers. Deposits are not made to banks and financial institutions unless they meet the minimum requirements of the investment

NOTES TO CORE FINANCIAL STATEMENTS
64
criteria outlined above. The Authority has a policy of not lending more than £4m to any one institution. Customers are assessed on their financial position, past experience and other factors.
(b) Liquidity Risk
The Authority has a comprehensive cash flow management system which ensures cash is available as needed. As the Authority has ready access to borrowings from the PWLB, there is no significant risk that it will be unable to raise finance to meet its commitments under financial instruments. The table in note 8.14 analyses the scheduled repayments of long-term borrowings over time.
(c) Market Risk
The Authority has a number of strategies for managing interest rate risk. The Authority’s policy is to aim to keep a maximum of 50% of its borrowing in variable rate loans. During periods of falling interest rates, fixed rate loans could be repaid early to limit exposure to losses. Any further reduction in interest rates would have a negligible impact on the interest earned on the Authority’s investments.
8.13 Provisions Insurance Provision An insurance provision has been established to meet the identified potential cost to the Authority of insurance policy excesses for claims of negligence from employees for personal injury sustained during the course of their employment and from third parties for personal injury or damage to their property. This provision is based on the Insurance Company’s estimates of outstanding claims and settlement of the claims is likely to be spread over a number of years. Provision for Non-Domestic Rates Appeals A provision for Non-Domestic Rates appeals has been established to meet the identified potential costs to the Authority of appeals in relation to the valuations used in the calculation of Business Rates. The provision is based on the best estimate of the expenditure that will be required to settle successful appeals, and the settlement of these appeals may be spread over a number of years. Movement in Provisions
Insurance
Provision Non-Domestic Rates Appeals
Provision
Total Provisions
£000 £000 £000 Balance at 1 April 2018 120 264 384 Additional provisions made in 2018/19 - 47 47 Amounts used in 2018/19 - - -
Balance at 31 March 2019 120 311 431

NOTES TO CORE FINANCIAL STATEMENTS
65
Comparatives for 2017/18 are as follows:
Insurance Provision
Non-Domestic Rates Appeals
Provision
Total Provisions
£000 £000 £000 Balance at 1 April 2017 22 193 215 Additional provisions made in 2017/18 100 71 171 Amounts used in 2017/18 -2 - -2
Balance at 31 March 2018 120 264 384
8.14 Deferred Liabilities The carrying amount of deferred liabilities is shown below:
31 March 2018 31 March 2019
£000 £000 Debt 728 - Private Finance Initiative (PFI) Other lease arrangements Deferred income – training centre
7,176 716 517
6,961 643 493
9,137 8,097
Deferred liabilities disclosed within other lease arrangements relate to lease incentives for the Technical Services Centre and Headquarters buildings. These are accounted for as a deferred liability and released over the life of the lease. Deferred income relates to the income received from Durham Police towards the Training Centre. This enables them to use the building for training purposes over a period of 26 years from 2015/16 and as such the income is treated as deferred and released to the Comprehensive Income and Expenditure Statement over the term of the agreement. Deferred Liability – Debt The balance relates to long-term borrowings from the PWLB, further analysed as follows:
31 March 2018 31 March 2019
£000 £000 Long-term Borrowings
Repayable within 1 – 2 years - - Repayable within 2 – 5 years 405 - Repayable within 5 – 10 years 323 - Repayable over 10 years - -
728 -
During the year, the Authority took the decision to settle the outstanding balance due to the PWLB in full.

NOTES TO CORE FINANCIAL STATEMENTS
66
8.15 Private Finance Initiative (PFI) Scheme The Authority has two community fire stations, which are financed by a Private Finance Initiative (PFI) Scheme. The stations at Bishop Auckland and Spennymoor became operational during 2010/11. The PFI contract is for the design, construction and finance of the stations and their maintenance for 25 years after commencement of operations. At the end of this period the contractor is required to transfer the buildings to the Authority in a good state of repair and at nil cost. In return for providing the buildings the contractor receives monthly payments from the Authority and the Government provides a specific grant over the life of the scheme. The Authority’s Balance Sheet includes both assets and liabilities arising from the contract. The value of PFI assets at 31 March 2019 The Fire Stations were initially valued on the basis of the capital expenditure provided for by the contractor in pricing the contract. Subsequently the stations were revalued on the basis of depreciated replacement cost as an estimate of fair value, and these values are included in the Authority’s Balance Sheet. The new valuations are being depreciated on a straight line basis over 50 years. Movements in the values in 2018/19 are summarised below:
Bishop Auckland
Spennymoor Total
£000 £000 £000
Initial value of assets financed by contractor 4,638 4,133 8,771
Accumulated Revaluations -135 346 211
Revaluations in 2018/19 -797 -608 -1,405
Gross Book Value after impairment 3,706 3,871 7,577
Accumulated Depreciation -190 -192 -382
2018/19 Depreciation -38 -38 -76
Net Book Value at 31 March 2019 3,478 3,641 7,119
Comparatives for 2017/18 are as follows:
Bishop Auckland
Spennymoor Total
£000 £000 £000
Initial value of assets financed by contractor 4,638 4,133 8,771
Accumulated Revaluations 296 772 1,068
Revaluations in 2017/18 -431 -426 -857
Gross Book Value after impairment 4,503 4,479 8,982
Accumulated Depreciation -152 -154 -306
2017/18 Depreciation -38 -38 -76
Net Book Value at 31 March 2018 4,313 4,287 8,600

NOTES TO CORE FINANCIAL STATEMENTS
67
The value of liabilities at 31 March 2019 The assets included in the Balance Sheet are offset by a liability equal to the initial value of the assets (the capital expenditure provided for by the contractor in pricing the contract). This liability is written down over the life of the contract by charging part of the annual payments to the contractor against the liability. Movements in the values in 2018/19 are summarised below:
2017/18 2018/19
£000 £000
Liability outstanding at 1 April 7,572 7,381
Less: Value of liability written down -191 -205
Liability outstanding at 31 March 7,381 7,176
Estimates of future payments due:
Period Repayment
Liability Interest
Service Charges
Lifecycle Replacement
£000 £000 £000 £000
2019/20 215 770 304 71 2020/21 to 2023/24 1,008 2,837 1,217 377 2024/25 to 2028/29 1,890 2,831 1,521 558 2029/30 to 2033/34 3,078 1,590 1,521 611 2034/35 to 2035/36 985 117 328 101
Total 7,176 8,145 4,891 1,718
The estimates do not include any allowance for inflation. 8.16 International Accounting Standard 19 (IAS19) Defined Benefit Pension Schemes
Participation in Pension Schemes
As part of the terms and conditions of employment of its officers and other employees, the Authority offers retirement benefits. Although these benefits will not actually be payable until employees retire, the Authority has a commitment to make the payments, that needs to be disclosed at the time that employees earn their future entitlement. The Authority participates in the following pension schemes:
• the Local Government Pension Scheme for corporate employees and fire control staff, administered by Durham County Council - this is a funded defined benefit scheme, meaning that the Authority and employees pay contributions into a fund, calculated at a level intended to balance the pensions liabilities with investment assets.
• the Firefighter’s Pension Scheme for fire officers - this is an unfunded defined benefit scheme administered by County Durham and Darlington Fire and Rescue Authority,

NOTES TO CORE FINANCIAL STATEMENTS
68
meaning that there are no investment assets built up to meet the pensions liabilities, and cash has to be generated to meet actual pensions payments as they eventually fall due. Under the Firefighter’s Pension Scheme Order 2006, if the amounts receivable by the pensions fund for the year are less than amounts payable, the Fire Authority must annually transfer an amount to meet the deficit to the pension fund. This cost is then met by Central Government. If, however, the pension fund is in surplus for the year, the surplus is required to be transferred from the pension fund to the Fire Authority which then must repay the amount to Central Government.
Transactions Relating to Post-employment Benefits
The Authority recognises the costs of retirement benefits in the Net Cost of Services section of the Comprehensive Income and Expenditure Statement when they are earned by employees, rather than when the benefits are eventually paid as pensions. However, the charge required to be made against Council Tax is based on the cash payable in the year, so the real cost of retirement benefits is reversed out of the General Fund via the Movement in Reserves Statement. Claims have been made in relation in respect of alleged unlawful discrimination arising from the Transitional Provisions in the Firefighters Pension Regulations 2015 and in December 2018 the Court of Appeal (McCloud / Sargeant) ruled that the ‘transitional protection’ offered to some members as part of the reform to public sector pensions amounts to unlawful discrimination. The Government were unsuccessful in seeking permission to appeal this decision. There is still some uncertainty over the potential nature of any compensation, but it is expected to result in an increase in pension scheme liabilities. The actuaries have calculated this potential increase and it has been included in the accounts as a past service cost in the 2018/19 financial statements.
The impact of an increase in scheme liabilities arising from McCloud / Sargeant judgment will be measured through the pension valuation process, which determines employer and employee contribution rates. The next Firefighters Pension valuation is due to take place in 2020 with implementation of the results planned for 2023/24 and authorities will need to plan for the impact of this on employer contribution rates alongside other changes identified through the valuation process.
The impact of an increase in annual pension payments arising from McCloud / Sargeant is determined through The Firefighters Pension Scheme (England) Order 2006. These require a fire authority to maintain a pension fund into which employee and employer contributions are paid and out of which pension payments to retirees are made. If the pension fund does not have enough funds to meet the cost of pensions in year the amount required to meet the deficit is then paid by the Secretary of State to the fire authority in the form of a central government top-up grant.

NOTES TO CORE FINANCIAL STATEMENTS
69
The following transactions have been made in the Comprehensive Income and Expenditure Statement and the General Fund via the Movement in Reserves Statement during the year:
2018/19
Local Government
Pension Scheme
Fire Fighter’s Pension Scheme
Total
£000 £000 £000 Comprehensive Income and Expenditure Statement
Cost of Services:
Current service cost
902 5,310 6,212
Past service costs
573 15,910 16,483
Financing and Investment Income and Expenditure:
Net interest expense
259 9,670 9,929
Total Post Employment Benefits charged to the Surplus/ Deficit on the Provision of Services
1,734 30,890 32,624
Other Post Employment Benefits:
Remeasurement of the net defined benefit liability comprising:
Return on plan assets (excluding the amount included in the net interest expense)
-1,227 - -1,227
Actuarial gains / losses (-) arising on changes in demographic assumptions
-1,270 - -1,270
Actuarial gains / losses (-) arising on changes in financial assumptions
1,312 11,070 12,382
Other
62 -7,423 -7,361
Total Other Post Employment Benefits charged to the Comprehensive Income and Expenditure Statement
-1,123 3,647 2,524
Total Post Employment Benefits charged to the Comprehensive Income and Expenditure Statement
611 34,537 35,148
Movement in Reserves Statement
Reversal of net charges made to the Surplus/ Deficit for the Provision of Services for post-employment benefits in accordance with IAS19
-1,734 -30,890 -32,624
Actual amount charged against the General Fund Balance for pensions in the year:
Employer’s contributions payable to the scheme
577 2,077 2,654
Retirement benefits payable to pensioners
5 470 475

NOTES TO CORE FINANCIAL STATEMENTS
70
The comparative figures for 2017/18 are:
2017/18
Local Government
Pension Scheme
Fire Fighter’s Pension Scheme
Total
£000 £000 £000 Comprehensive Income and Expenditure Statement
Cost of Services:
Current service cost
833 5,650 6,483
Past service costs
177 230 407
Financing and Investment Income and Expenditure:
Net interest expense
236 9,940 10,176
Total Post Employment Benefits charged to the Surplus/ Deficit on the Provision of Services
1,246 15,820 17,066
Other Post Employment Benefits:
Remeasurement of the net defined benefit liability comprising:
Return on plan assets (excluding the amount included in the net interest expense)
93 - 93
Actuarial gains / losses (-) arising on changes in demographic assumptions
- -9,520 -9,520
Actuarial gains / losses (-) arising on changes in financial assumptions
- 11,170 11,170
Other
-18 -9,832 -9,850
Total Other Post Employment Benefits charged to the Comprehensive Income and Expenditure Statement
75 -8,182 -8,107
Total Post Employment Benefits charged to the Comprehensive Income and Expenditure Statement
1,321 7,638 8,959
Movement in Reserves Statement
Reversal of net charges made to the Surplus/ Deficit for the Provision of Services for post-employment benefits in accordance with IAS19
-1,246 -15,820 -17,066
Actual amount charged against the General Fund Balance for pensions in the year:
Employer’s contributions payable to the scheme
504 2,218 2,722
Retirement benefits payable to pensioners
4 480 484
The cumulative amount of actuarial losses to 31 March 2019 is £116.51m (2017/18 £114.01m), made up as follows:
• Local Government Pension Scheme £3.30m (2017/18 £4.44m)
• Firefighter’s Pension Scheme £113.21m (2017/18 £109.57m)

NOTES TO CORE FINANCIAL STATEMENTS
71
Basis for Estimating Assets and Liabilities in relation to Post-employment Benefits Liabilities have been assessed on an actuarial basis using the projected unit credit method; an estimate of the pensions that will be payable in future years dependent on assumptions about mortality rates, salary levels, etc. Both the Firefighter’s Scheme and the County Council Fund liabilities have been assessed by independent actuaries; estimates for the County Council Fund being based on the latest full valuation of the scheme as at 31 March 2016. The pension increase assumption as at 31 March 2019 is based on the Consumer Price Index (CPI) expectation of inflation. This is a consequence of the Government’s announcement that CPI is to be used for the indexation of public service pensions from April 2011. Under IAS19, any obligation arising from long-term employee benefits that depend upon length of service need to be recognised when service is rendered. As injury awards under the Firefighter’s schemes are dependent on service, the liability expected to arise due to injury awards has been valued in respect of service prior to the valuation date. The liability arising from injury awards has been restated for previous years. The principal assumptions used by the actuary have been:
Local Government Funded Pension
Scheme
Local Government Unfunded Pension
Scheme
Firefighter’s Pension Scheme
2017/18 2018/19 2017/18 2018/19 2017/18 2018/19
Mortality assumptions: Longevity at 65 for current pensioners:
• Men 23.3 22.6 23.3 22.6 21.9 22.0
• Women 25.0 24.1 25.0 24.1 21.9 22.0
Longevity at 65 for future pensioners:
• Men 25.5 24.3 n/a n/a 23.9 23.9
• Women 27.3 25.9 n/a n/a 23.9 23.9
Rate of Inflation:
• RPI 3.1 3.2 3.1 3.2 3.45 3.50
• CPI 2.0 2.1 2.0 2.1 2.30 2.35
Rate of increase in salaries 3.5 3.6 n/a n/a 4.30 4.35 Rate of increase to pensions in payment 2.0 2.1 2.0 2.1 2.30 2.35 Rate of increase to deferred pensions 2.0 2.1 n/a n/a 2.30 2.35 Rate for discounting scheme liabilities 2.6 2.5 2.6 2.5 2.55 2.45 Take-up of option to convert annual pension into retirement lump sum:
• Including any accrued lump sum from pre 2008 service
80 80 n/a n/a n/a n/a
The Firefighter’s Pension Scheme has no assets to cover its liabilities. The Authority employs a building block approach in determining the rate of return on the Local Government Pension Scheme’s assets. Historical markets are studied and assets with high volatility are assumed to generate higher returns consistent with widely accepted capital market principles. The weighted average duration of the defined benefit obligation is 21 years for Firefighter Pension Scheme and 21.2 years for the Local Government Pension Scheme.
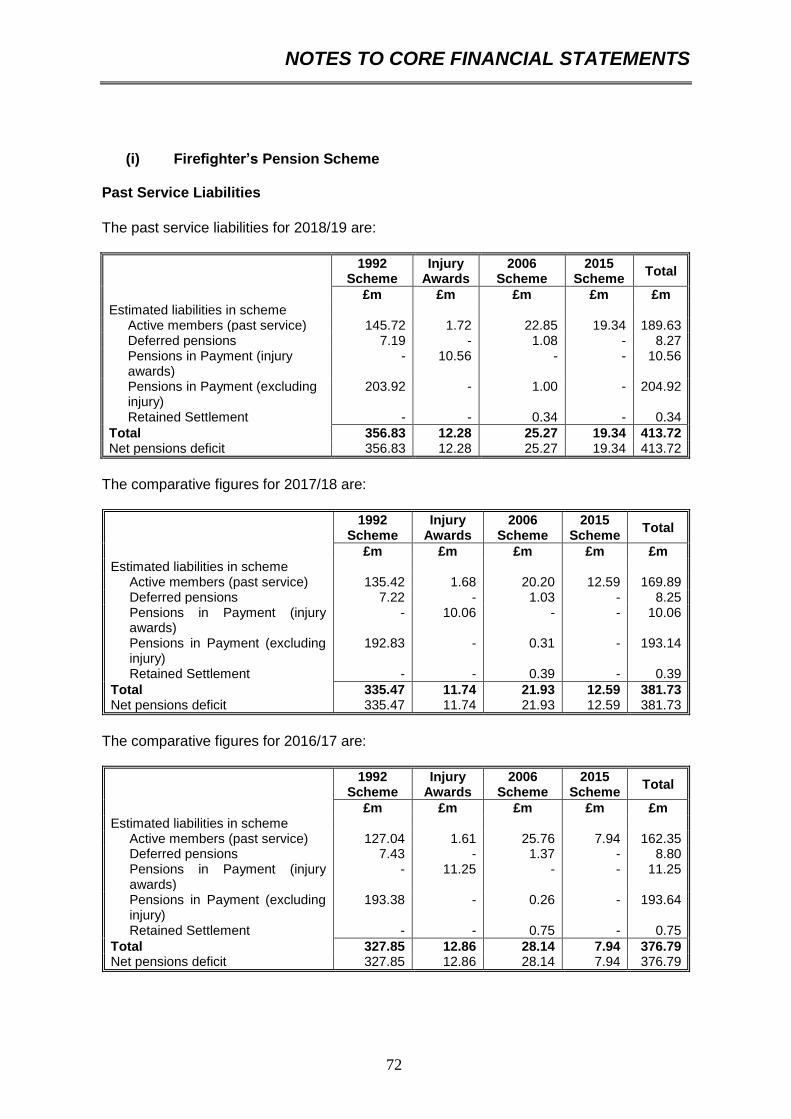
NOTES TO CORE FINANCIAL STATEMENTS
72
(i) Firefighter’s Pension Scheme
Past Service Liabilities
The past service liabilities for 2018/19 are:
1992 Scheme
Injury Awards
2006 Scheme
2015 Scheme
Total
£m £m £m £m £m Estimated liabilities in scheme
Active members (past service) 145.72 1.72 22.85 19.34 189.63 Deferred pensions 7.19 - 1.08 - 8.27 Pensions in Payment (injury awards)
- 10.56 - - 10.56
Pensions in Payment (excluding injury)
203.92 - 1.00 - 204.92
Retained Settlement - - 0.34 - 0.34
Total 356.83 12.28 25.27 19.34 413.72 Net pensions deficit 356.83 12.28 25.27 19.34 413.72
The comparative figures for 2017/18 are:
1992 Scheme
Injury Awards
2006 Scheme
2015 Scheme
Total
£m £m £m £m £m Estimated liabilities in scheme
Active members (past service) 135.42 1.68 20.20 12.59 169.89 Deferred pensions 7.22 - 1.03 - 8.25 Pensions in Payment (injury awards)
- 10.06 - - 10.06
Pensions in Payment (excluding injury) Retained Settlement
192.83
-
-
-
0.31
0.39
-
-
193.14
0.39
Total 335.47 11.74 21.93 12.59 381.73 Net pensions deficit 335.47 11.74 21.93 12.59 381.73
The comparative figures for 2016/17 are:
1992 Scheme
Injury Awards
2006 Scheme
2015 Scheme
Total
£m £m £m £m £m Estimated liabilities in scheme
Active members (past service) 127.04 1.61 25.76 7.94 162.35 Deferred pensions 7.43 - 1.37 - 8.80 Pensions in Payment (injury awards)
- 11.25 - - 11.25
Pensions in Payment (excluding injury) Retained Settlement
193.38
-
-
-
0.26
0.75
-
-
193.64
0.75
Total 327.85 12.86 28.14 7.94 376.79 Net pensions deficit 327.85 12.86 28.14 7.94 376.79

NOTES TO CORE FINANCIAL STATEMENTS
73
Analysis of Movement in Gross Scheme Liabilities
Firefighters’ Pension Fund
1992 Scheme
Injury Awards
2006 Scheme
2015 Scheme
Total
£m £m £m £m £m Net deficit at the start of current year 335.47 11.74 21.93 12.59 381.73 Movement in the year:
Current service cost (net of employee contributions)
1.35 0.08 0.08 3.80 5.31
Cost covered by employee contributions 0.31 - 0.05 1.20 1.56 Past service cost 13.75 - 2.16 - 15.91 Pension Transfers - - - - - Interest on pension liabilities 8.44 0.29 0.56 0.38 9.67 Total benefits paid -10.39 -0.72 -0.09 -0.02 -11.22 Curtailment and settlements - - - - - Actuarial gain (-)/loss – demographic assumptions
- - - - -
Actuarial gain (-)/loss – financial assumptions
8.76 0.23 1.12 0.96 11.07
Actuarial gain (-)/loss – other -0.86 0.66 -0.54 0.43 -0.31
Net deficit at the end of year 356.83 12.28 25.27 19.34 413.72
The comparative figures for 2017/18 are:
Firefighters’ Pension Fund
1992 Scheme
Injury Awards
2006 Scheme
2015 Scheme
Total
£m £m £m £m £m Net deficit at the start of current year 327.85 12.86 28.14 7.94 376.79 Movement in the year:
Current service cost (net of employee contributions)
1.86 0.11 0.08 3.60 5.65
Cost covered by employee contributions 0.46 - 0.05 1.07 1.58 Past service cost 0.23 - - - 0.23 Pension Transfers - - - 0.03 0.03 Interest on pension liabilities 8.58 0.34 0.75 0.27 9.94 Total benefits paid -10.70 -0.60 -0.06 -0.01 -11.37 Curtailment and settlements - - - - - Actuarial gain (-)/loss – demographic assumptions
-8.30 -0.39 -0.37 -0.46 -9.52
Actuarial gain (-)/loss – financial assumptions
9.45 0.09 1.57 0.06 11.17
Actuarial gain (-)/loss – other 6.04 -0.67 -8.23 0.09 -2.77
Net deficit at the end of year 335.47 11.74 21.93 12.59 381.73

NOTES TO CORE FINANCIAL STATEMENTS
74
Analysis of Movement in Scheme Assets
1992 Scheme
Injury Awards
2006 Scheme
2015 Scheme
Total
£m £m £m £m £m Opening fair value of asset - - - - - Movement in the year:
Interest income - - - - - The return on plan assets, excluding the amount included in the net interest expense
- - - - -
Other -9.63 - -0.01 2.52 -7.12 Contributions by employer -0.45 -0.72 -0.03 -1.34 -2.54 Contributions by participants -0.31 - -0.05 -1.20 -1.56 Net benefits paid out 10.39 0.72 0.09 0.02 11.22
Closing fair value of assets - - - - -
The comparative figures for 2017/18 are:
1992 Scheme
Injury Awards
2006 Scheme
2015 Scheme
Total
£m £m £m £m £m Opening fair value of asset - - - - - Movement in the year: - - - - -
Interest income The return on plan assets, excluding the amount included in the net interest expense
- - - - -
Other -9.42 - 0.03 2.30 -7.09 Contributions by employer -0.82 -0.60 -0.04 -1.27 -2.73 Contributions by participants -0.46 - -0.05 -1.04 -1.55 Net benefits paid out 10.70 0.60 0.06 0.01 11.37
Closing fair value of assets - - - - -

NOTES TO CORE FINANCIAL STATEMENTS
75
Analysis of Movement in Net Obligations
1992 Scheme
Injury Awards
2006 Scheme
2015 Scheme
Total
£m £m £m £m £m Net deficit at the start of current year 335.47 11.74 21.93 12.59 381.73 Movement in the year:
Current service cost (net of employee contributions)
1.35 0.08 0.08 3.80 5.31
Contributions by employer -0.45 -0.72 -0.03 -1.34 -2.54 Contributions by participants - - - - - Past service cost 13.75 - 2.16 - 15.91 Pension transfers - - - - - Interest on net defined benefit liability 8.44 0.29 0.56 0.38 9.67 Return on plan assets in excess of/ below that recognised in net interest
- - - - -
Actuarial gain (-)/loss – change in financial assumptions
8.76 0.23 1.12 0.96 11.07
Actuarial gain (-)/loss – change in demographic assumptions
- - - - -
Actuarial gain (-)/ loss - other -10.49 0.66 -0.55 2.95 -7.43 Net benefits paid - - - - -
Net deficit at the end of year 356.83 12.28 25.27 19.34 413.72
The comparative figures for 2017/18 are:
1992 Scheme
Injury Awards
2006 Scheme
2015 Scheme
Total
£m £m £m £m £m Net deficit at the start of current year 327.85 12.86 28.14 7.94 376.79 Movement in the year:
Current service cost (net of employee contributions)
1.86 0.11 0.08 3.60 5.65
Contributions by employer -0.82 -0.60 -0.04 -1.27 -2.73 Contributions by participants - - - 0.03 0.03 Past service cost 0.23 - - - 0.23 Pension transfers - - - 0.03 0.03 Interest on net defined benefit liability 8.58 0.34 0.75 0.27 9.94 Return on plan assets in excess of/ below that recognised in net interest
- - - - -
Actuarial gain (-)/loss – change in financial assumptions
9.45 0.09 1.57 0.06 11.17
Actuarial gain (-)/loss – change in demographic assumptions
-8.30 -0.39 -0.37 -0.46 -9.52
Actuarial gain (-)/ loss - other -3.38 -0.67 -8.20 2.39 -9.86 Net benefits paid - - - - -
Net deficit at the end of year 335.47 11.74 21.93 12.59 381.73

NOTES TO CORE FINANCIAL STATEMENTS
76
(ii) Durham County Council Pension Fund Analysis of Movement in Gross Scheme Liabilities
Funded Unfunded Total
£m £m £m Opening Present Value of Liabilities
31.60 0.04 31.64
Current service cost (net of employee contributions)
0.90 - 0.90
Interest cost
0.82 - 0.82
Contributions from scheme participants
0.20 - 0.20
Remeasurement gains (-)/ losses:
• Actuarial gains/ losses arising from changes in demographic assumptions
-1.27 - -1.27
• Actuarial gains/ losses arising from changes in financial assumptions
1.32 - 1.32
• Other
0.07 - 0.07
Past service costs
0.57 - 0.57
Benefits paid -0.69 -0.01 -0.70
Closing present value of liabilities 33.52 0.03 33.55
The comparative figures for 2017/18 are:
Funded Unfunded Total
£m £m £m Opening Present Value of Liabilities
30.09 0.04 30.13
Current service cost (net of employee contributions)
0.83 - 0.83
Interest cost
0.78 - 0.78
Contributions from scheme participants
0.18 - 0.18
Remeasurement gains (-)/ losses:
• Actuarial gains/ losses arising from changes in demographic assumptions
- - -
• Actuarial gains/ losses arising from changes in financial assumptions
- - -
• Other
0.14 - 0.14
Past service costs
0.18 - 0.18
Benefits paid -0.60 - -0.60
Closing present value of liabilities 31.60 0.04 31.64

NOTES TO CORE FINANCIAL STATEMENTS
77
Analysis of Movement in Scheme Assets Reconciliation of fair value of the scheme assets:
Local Government Pension Scheme
Funded Unfunded Total
£m £m £m Opening fair value
21.43 - 21.43
Interest income
0.56 - 0.56
Remeasurement gain/loss:
• The return on plan assets (excluding the amount included in net interest expense)
1.23 - 1.23
• Other
- - -
Contributions from employer
0.58 0.01 0.59
Contributions by employees into the scheme
0.20 - 0.20
Benefits paid
-0.69 -0.01 -0.70
Closing fair value 23.31 - 23.31
The comparative figures for 2017/18 are:
Local Government Pension Scheme
Funded Unfunded Total
£m £m £m Opening fair value
20.73 - 20.73
Interest income
0.54 - 0.54
Remeasurement gain/loss:
• The return on plan assets (excluding the amount included in net interest expense)
-0.09 - -0.09
• Other
- - -
Contributions from employer
0.67 - 0.67
Contributions by employees into the scheme
0.18 - 0.18
Benefits paid
-0.60 - -0.60
Closing fair value 21.43 - 21.43

NOTES TO CORE FINANCIAL STATEMENTS
78
The actual return on scheme assets in the year was a gain of £1.79m (2017/18: £0.45m gain) The expected return on scheme assets is determined by considering the expected returns available on the assets underlying the current investment policy. Expected yields on fixed interest investments are based on gross redemption yields as at the Balance Sheet date. Expected returns on equity investments reflect long-term real rates of return experienced in the respective markets. Fair Value of Scheme Assets The Local Government Pension Scheme assets are comprised of the following categories:
2018/19 2017/18
Quoted £m
Unquoted £m
Total £m
Quoted £m
Unquoted £m
Total £m
Equity Investments 11.63 - 11.63 10.72 - 10.72 Property 0.31 1.42 1.73 0.26 1.22 1.48 Government Bonds 6.08 - 6.08 6.30 - 6.30 Corporate Bonds 2.70 - 2.70 1.91 - 1.91 Cash 1.17 - 1.17 1.03 - 1.03
Total 21.89 1.42 23.31 20.22 1.22 21.44
Analysis of Movement in Net Obligations
Funded Unfunded Total
£m £m £m Net deficit at the beginning of year 10.17 0.04 10.21 Current service cost
0.90 - 0.90
Contributions towards funded liabilities
-0.58 -0.01 -0.59
Past service cost
0.57 - 0.57
Interest on net defined benefit liability
0.26 - 0.26
Return on plan assets in excess of/ below that recognised in net interest
-1.23 - -1.23
Actuarial gains/ losses due to changes in financial assumptions
1.32 - 1.32
Actuarial gains/ losses due to changes in demographic assumptions
-1.27 - -1.27
Actuarial gains/ losses due to other changes
0.07 - 0.07
Net deficit at the end of year 10.21 0.03 10.24

NOTES TO CORE FINANCIAL STATEMENTS
79
The comparative figures for 2017/18 are:
Funded Unfunded Total
£m £m £m Net deficit at the beginning of year 9.36 0.04 9.40 Current service cost
0.83 - 0.83
Contributions towards funded liabilities
-0.67 - -0.67
Past service cost
0.18 - 0.18
Interest on net defined benefit liability
0.24 - 0.24
Return on plan assets in excess of/ below that recognised in net interest
0.09 - 0.09
Actuarial gains/ losses due to changes in financial assumptions
- - -
Actuarial gains/ losses due to changes in demographic assumptions
- - -
Actuarial gains/ losses due to other changes
0.14 - 0.14
Net deficit at the end of year 10.17 0.04 10.21
Scheme History for the Firefighter Pension Schemes and the Local Government Pension Scheme
2014/15 Restated
2015/16
2016/17 2017/18
2018/19
£m £m £m £m £m Present value of liabilities:
Local Government Pension Scheme 24.31 23.64 30.13 31.64 33.55 Firefighter’s Pension Scheme
Total Present Value of Liabilities 342.18 308.73 376.79 381.73 413.72
366.49 332.37 406.92 413.37 447.27
Fair value of assets
Local Government Pension Scheme 16.82 16.73 20.73 21.43 23.31 Firefighter’s Pension Scheme
Total Fair Value of Assets - - - - -
16.82 16.73 20.73 21.43 23.31
Surplus/ deficit (-) in the scheme:
Local Government Pension Scheme -7.49 -6.91 -9.40 -10.21 -10.24
Firefighter’s Pension Scheme -342.18 -308.73 -376.79 -381.73 -413.72
Total Deficit -349.67 -315.64 -386.19 -391.94 -423.96

NOTES TO CORE FINANCIAL STATEMENTS
80
The liabilities show the underlying commitments that the Authority has in the long run to pay retirement benefits. The total liability of £423.963m has a substantial impact on the net worth of the Authority as recorded in the Balance Sheet, resulting in a negative overall balance of £381.838m. However, statutory arrangements for funding the deficit mean that the financial position of the Authority remains unaffected:
• the deficit on the local government scheme will be made good by increased contributions over the remaining working life of employees, as assessed by the scheme actuary;
• finance is only required to be raised to cover fire pensions when the pensions are actually paid.
The figures shown as restated in the table above were revised in 2014/15 as a result of a ruling by the Pension Ombudsman, relating to the frequency of commutation factor reviews between 1998 and 2006, which would have resulted in a higher cash sum on retirement or a higher residual pension for the same amount of lump sum. All compensation payments relating to the ruling were made during 2015/16, with the costs of the liability being met by the Government, via additional Top-Up Grant. Employer Contributions The total contributions expected to be made to the Local Government Pension Scheme by the Authority in the year to 31 March 2020 are £0.58m. Expected contributions to the Firefighter’s Pension Scheme in the year to 31 March 2020 are £3.11m. 8.17 Reserves
The Authority holds a number of reserves on the Balance Sheet. Some are required to be held for statutory reasons, some are needed to comply with proper accounting practices, and others have been set up voluntarily to earmark resources for future spending plans.

NOTES TO CORE FINANCIAL STATEMENTS
81
The movement in reserves is set out in the following table:
Reserve Balance 1 April 2018
Net Movement
in Year
Balance 31 March 2019
Purpose of Reserve Further
details of Movement
£000 £000 £000 Usable Reserves
General Fund 1,388 37 1,425
Resources available to meet future running costs
Movement in Reserves Statement
Earmarked Reserves
5,929 -64 5,865 Detailed below Note 8.19 to
the accounts
Capital Grants Unapplied - - -
Grants to be used to finance capital expenditure in future years
Movement in Reserves Statement
Capital Receipts Unapplied
- - -
Receipts from the sale of capital assets to be used to finance capital expenditure in future years
Movement in Reserves Statement
Total Usable Reserves
7,317 -27 7,290
Unusable Reserves
Revaluation Reserve 10,114 254 10,368 Gains on revaluation of Property, Plant and Equipment not yet realised through sales
Note 8.20 (i) to the accounts
Capital Adjustment Account
25,515 -1,139 24,376 Capital resources set aside to meet capital expenditure
Note 8.20 (ii) to the accounts
Collection Fund Adjustment Account
394 -290 104 Share of Collection Fund Balance outstanding
Note 8.20 (iii) to the accounts
Pensions Reserve (IAS19)
-391,944 -32,019 -423,963 Balancing account to allow inclusion of Pensions Liability in the Balance Sheet
Note 8.20 (iv) to the accounts
Short-term Accumulating Absences
-11 -2 -13 Balancing account to allow inclusion of employees liability in the Balance Sheet
Note 8.20 (v) to the accounts
Total Unusable Reserves
-355,932 -33,196 -389,128
Total Reserves -348,615 -33,223 -381,838

NOTES TO CORE FINANCIAL STATEMENTS
82
Comparatives for 2017/18 are as follows:
Reserve Balance 1 April 2017
Net Movement
in Year
Balance 31 March 2018
Purpose of Reserve Further
details of Movement
£000 £000 £000 Usable Reserves General Fund
2,824
-1,436
1,388
Resources available to meet future running costs
Movement in Reserves Statement
Earmarked Reserves
3,865 2,064 5,929 Detailed below Note 8.19 to the accounts
Capital Grants Unapplied - - - Grants to be used to finance capital expenditure in future years
Movement in Reserves Statement
Capital Receipts Unapplied
- - - Receipts from the sale of capital assets to be used to finance capital expenditure in future years
Movement in Reserves Statement
Total Usable Reserves
6,689
628 7,317
Unusable Reserves
Revaluation Reserve 11,275 -1,161 10,114 Gains on revaluation of Property, Plant and Equipment not yet realised through sales
Note 8.20 (i) to the accounts
Capital Adjustment Account
25,189 326 25,515 Capital resources set aside to meet capital expenditure
Note 8.20 (ii) to the accounts
Collection Fund Adjustment Account
289 105 394 Share of Collection Fund Balance outstanding
Note 8.20 (iii) to the accounts
Pensions Reserve (IAS19)
-386,191 -5,753 -391,944 Balancing account to allow inclusion of Pensions Liability in the Balance Sheet
Note 8.20 (iv) to the accounts
Short-term Accumulating Absences
-16 5 -11 Balancing account to allow inclusion of employees liability in the Balance Sheet
Note 8.20 (v) to the accounts
Total Unusable Reserves
-349,454 -6,478 -355,932
Total Reserves -342,765 -5,850 -348,615

NOTES TO CORE FINANCIAL STATEMENTS
83
8.18 Movement in Earmarked Reserves
The following contributions have been made to / from (-) the earmarked reserves:
1 April 2018
Increase / decrease (-)
in year
31 March 2019
£000 £000 £000 Pensions 500 - 500 Community Safety 312 -170 142 Insurance 250 - 250 Civil Resilience (New Dimensions) 156 -156 - Replacement Mobilisation System 363 -263 100 Resilience 500 - 500 Modernisation 2,821 586 3,407 ESMCP 959 -28 931 New Risks 68 -33 35
Total 5,929 -64 5,865
Comparatives for 2017/18 are as follows:
1 April 2017
Increase / decrease (-)
in year
31 March 2018
£000 £000 £000 Pensions 500 - 500 Community Safety 236 76 312 Insurance 250 - 250 Civil Resilience (New Dimensions) 141 15 156 Replacement Mobilisation System 363 - 363 Resilience Modernisation
100 1,821
400 1,000
500 2,821
ESMCP 334 625 959 New Risks 120 -52 68
Total 3,865 2,064 5,929
8.19 Earmarked Reserves
Earmarked reserves at 31 March 2019 were as follows:
Pensions Reserve To meet any unforeseen pension costs which may arise as a result of changes to pension schemes.
Modernisation Reserve To meet any one-off costs associated with service transformation.
Community Safety Reserve To enable specific community safety improvements to be undertaken. Insurance To meet any unexpected increase in the level of excesses paid on insurance claims.

NOTES TO CORE FINANCIAL STATEMENTS
84
Civil Resilience (New Dimensions) The balance of unspent grant, earmarked for Civil Resilience expenditure.
Replacement Mobilisation System Reserve The balance of unspent grant, earmarked to fund the replacement mobilisation system.
Resilience Reserve To fund continuity of service provision, following an unforeseen event. Emergency Services Mobile Communications Programme (ESMCP) The balance of unspent grant, earmarked to fund the replacement mobile communications systems. New Risks The balance of unspent grant, earmarked to fund the response to emerging new risks.
8.20 Unusable Reserves (i) Revaluation Reserve The Revaluation Reserve contains the gains made by the Authority arising from increases in the value of its Property, Plant and Equipment and Intangible Assets. The balance is reduced when assets with accumulated gains are:
• revalued downwards or impaired and the gains are lost;
• used in the provision of services and the gains are consumed through depreciation, or
• disposed of and the gains are realised. The Reserve contains only revaluation gains accumulated since 1 April 2007, the date that the Reserve was created. Accumulated gains arising before that date are consolidated into the balance on the Capital Adjustment Account
2017/18 2018/19
£000 £000 Opening Balance at 1 April 11,275 10,114 Revaluation gains/losses -746 749 Excess of current cost depreciation -415 -495 Balance written off on disposal of asset - -
Closing Balance at 31 March 10,114 10,368
(ii) Capital Adjustment Account The Capital Adjustment Account absorbs the timing differences arising from the different arrangements for accounting for the consumption of non-current assets and for financing the acquisition, construction or enhancement of those assets under statutory provisions. The Account is debited with the cost of acquisition, construction or enhancement as depreciation, impairment losses and amortisations are charged to the Comprehensive Income and Expenditure Statement (with reconciling postings from the Revaluation Reserve to convert fair value figures to a historical cost basis). The Account is credited with the amounts set aside by the Authority as finance for the costs of acquisition, construction and enhancement.

NOTES TO CORE FINANCIAL STATEMENTS
85
The Account also contains revaluation gains accumulated on Property, Plant and Equipment before 1 April 2007, the date that the Revaluation Reserve was created to hold such gains.
2017/18 2018/19
£000 £000 £000 £000
Opening Balance at 1 April 25,189 25,515
Reversal of items relating to capital expenditure debited or credited to the Comprehensive Income and Expenditure Statement
Charges for depreciation, impairment and downward revaluations of non-current assets
-1,092 -2,866
Amortisation of intangible assets -70 -54
Revenue Expenditure funded from Capital under Statute
- -
Amounts of non-current assets written off on disposal or sale as part of the gain/loss on disposal to the Comprehensive Income and Expenditure Statement
-34 -32
-1,196 -2,952
Adjusting amounts written out of the Revaluation Reserve
415 495
Net written out amount of the cost of non-current assets consumed in the year
-781 -2,457
Capital financing applied in the year
Use of Capital Receipts Reserve to finance new capital expenditure
33 13
Application of grants to capital financing from the Capital Grants Unapplied Account
- -
Capital Grants and Contributions credited to the Comprehensive Income and Expenditure Statement
- -
Statutory provision for the financing for capital investment charged against the General Fund
256 258
Capital expenditure charged against the General Fund
818 1,047
1,107 1,318
Closing Balance at 31 March 25,515 24,376

NOTES TO CORE FINANCIAL STATEMENTS
86
(iii) Collection Fund Adjustment The Collection Fund Adjustment Account manages the differences arising from the recognition of Council Tax and Non-Domestic Rates income in the Comprehensive Income and Expenditure Statement as it falls due from council tax payers and business rates payers compared with the statutory arrangements for paying across amounts to the General Fund from the Collection Fund.
2017/18 2018/19
£000 £000 Opening Balance at 1 April
289
394
Amount by which Council Tax and Non-Domestic Rates income credited to the Comprehensive Income and Expenditure Statement is different from the council tax and non-domestic rates income calculated for the year in accordance with statutory requirements
105
-290
Closing Balance at 31 March 394 104
(iv) Pensions Reserve (IAS 19)
The Pensions Reserve absorbs the timing differences arising from the different arrangements for accounting for post-employment benefits and for funding benefits in accordance with statutory provisions. The Authority accounts for post-employment benefits in the Comprehensive Income and Expenditure Statement as the benefits are earned by employees accruing years of service, updating the liabilities recognised to reflect inflation, changing assumptions and investment returns on any resources set aside to meet the costs. However, statutory arrangements require benefits earned to be financed as the Authority makes employer’s contributions to pension funds or eventually pay any pensions for which it is directly responsible. The statutory arrangements will ensure that funding will have been set aside by the time benefits come to be paid.
2017/18 2018/19
£000 £000
Opening Balance at 1 April -386,191 -391,944
Remeasurements of the net defined benefit liability/ asset (-) 8,107 -2,524
Reversal of items relating to retirement benefits debited or credited to the Surplus or Deficit on the Provision of Services in the Comprehensive Income and Expenditure Statement
-17,066 -32,624
Employers pension contributions and direct payments to pensioners payable in the year
3,206 3,129
Closing Balance at 31 March -391,944 -423,963

NOTES TO CORE FINANCIAL STATEMENTS
87
(v) Short-term Accumulating Absences The Accumulated Absences Account absorbs the differences that would otherwise arise on the General Fund Balance from accruing for compensated absences earned but not taken in the year, e.g. annual leave entitlement carried forward at 31 March. Statutory arrangements require that the impact on the General Fund Balance is neutralised by transfers to or from the Account.
2017/18 2018/19
£000 £000 Opening Balance at 1 April -16 -11
Settlement or cancellation of accrual made at the year end of the preceding year
16 11
Amounts accrued at the end of the current year -11 -13
Closing Balance at 31 March -11 -13
8.21 General Reserve The net accumulated unapplied General Fund Revenue balance is £1.425m as at 31 March 2019 which equates to 5% of the 2018/19 Net Expenditure Budget. This is in line with the Authority’s policy on reserves which is to maintain a General Reserve of 5% of the Net Expenditure Budget for the short to medium term. 8.22 Contingent Assets and Contingent Liabilities
• Contingent Liability - Subsidiary Companies
The Fire Authority has provided a financial guarantee to its subsidiary companies; County Durham and Darlington Fire and Rescue Community Interest Company and Vital Fire Solutions Limited. As there is no certainty that this guarantee would need to be utilised or the value of such a guarantee, it has been included as a contingent liability.
• Contingent Assets
There are no contingent assets for 2018/19. 8.23 Authorisation of Accounts for Issue/Post Balance Sheet Events The Statement of Accounts was authorised for issue by the Treasurer, Anthony Hope, on 31st July 2019. This is the date up to which events after the Balance Sheet date have been considered. No such events have been identified for 2018/19.

NOTES TO CORE FINANCIAL STATEMENTS
88
9 CASH FLOW STATEMENT
9.1 Adjustments to Net Surplus or Deficit on the Provision of Services for Non-Cash Movements
2017/18 2018/19
£000 £000 1,092 Depreciation, impairment and downward revaluations 2,866
70 Amortisation 54 - Increase/Decrease(-) Interest Creditors -5
-39 Increase/Decrease(-) in Creditors -186 -73 Increase(-)/Decrease in Debtors -349 -2 Increase(-)/Decrease in Impairment of Debtors - 67 Increase(-)/Decrease in Inventories -119
-98 Increase/Decrease(-) in Deferred Liabilities -97 13,860 Movement in Pension Liability 29,495
169 Contributions to/from (-) Provisions 47
34 Carrying amount of non-current assets held for sale, sold or derecognised
32
15,080 31,738
9.2 Operating Activities
The cash flows for operating activities include the following items:
2017/18 2018/19
£000
21,332
Employee Costs
£000
21,545
-16,602 Council Tax Receipts -17,201
-4,529 Revenue Support Grant -3,843
-6,610 Redistributed NNDR -6,908
-26 Interest receivable -56
36 Interest payable in respect of borrowing 136
813 Interest payable in respect of PFI 792
9.3 Investing Activities
2017/18 2018/19
£000 £000
390 Purchase of property, plant and equipment, investment property and intangible assets
1,060
-33 Proceeds from the sale of property, plant and equipment, investment property and intangible assets
-13
- Other receipts from investing activities -
357 1,047

NOTES TO CORE FINANCIAL STATEMENTS
89
9.4 Financing Activities
2017/18 2018/19
£000 £000
191 Cash payments for the reductions of outstanding liabilities relating to on-balance sheet PFI contract
205
43 Repayment of short and long term borrowing 728
234 933
9.5 Reconciliation of Liabilities Arising From Financing Activities
Balance at 1 April
2018
Financing cash flows
Balance at 31 March
2019
£000 £000 £000
Long-term borrowings 728 -728 0 On Balance Sheet PFI Liabilities 7,381 -205 7,176
8,109 -933 7,176
9.6 Net Increase in Cash and Cash Equivalents
Under IFRS, cash and cash equivalents include the Authority’s cash in hand, bank overdrafts and short-term investments. The movement in cash and cash equivalents was as follows:
2017/18 2018/19 Increase/ Decrease in
year
£000 £000 £000
Cash 697 133 -564 Cash Equivalents 6,442 5,303 -1,139
7,139 5,436 -1,703

PENSION FUND ACCOUNT
90
FIRE PENSION FUND ACCOUNT The Firefighter’s Pension Scheme for fire officers is an unfunded defined benefit scheme administered by County Durham and Darlington Fire and Rescue Authority, meaning that there are no investment assets built up to meet the pensions liabilities, and cash has to be generated to meet actual pensions payments as they eventually fall due. Under the Firefighter’s Pension Scheme (Amendment) (England) Order 2006, if the amounts receivable by the pensions fund for the year are less than amounts payable, the Fire Authority must annually transfer an amount to meet the deficit to the pension fund. This cost is then met by Central Government. If, however, the pension fund is in surplus for the year, the surplus is required to be transferred from the pension fund to the Fire Authority which then must repay the amount to Central Government. There are no investment assets relating to the Fire Pension Fund. Details of the Authority’s long-term pension obligations can be found in Note 8.16 of the financial statements. The transactions of the Fire Pension Fund, together with a Net Assets Statement, are as follows: Fire Pension Fund Account Dealings with members, employers and others directly involved in the scheme
2017/18 2018/19
£000 £000 Contributions receivable Fire Authority contributions in relation to pensionable pay
Normal -1,933 -1,831 Early retirement - -
Firefighter’s contributions -1,573 -1,554
Transfers in from other schemes -29 - Ill health capital contributions -204 -165 Benefits payable Pensions 8,703 8,929 Commutation and lump sum retirement benefits
Lump sum death benefits Refund of contributions
2,260 - -
1,562 - -
Transfers out to other schemes - -
Net amount payable for the year 7,224 6,941 Top-up grant payable by the Government -7,224 -6,941
Year end balance - -

PENSION FUND ACCOUNT
91
Net Assets Statement
At 31 March 2018
At 31 March 2019
£000 £000 Net current assets and liabilities Amount due to (-) / from the Authority’s General Fund
-901 -1,081
Amount due to (-) / from Central Government 901 1,081
Total - -
1. Basis of Preparation
The pension fund accounts have been prepared in accordance with the CIPFA Code of Practice on Local Authority Accounting in the United Kingdom 2018/19 (there were no material changes to the Pension Fund Account as a result of the IFRS transition).
The financial statements do not take account of liabilities to pay pensions and other benefits which fall due after the end of the financial year.
2. Accounting Policies
The principal accounting policies are as follows:
Contributions
Contributions represent the total amount receivable from the Authority and pensionable employees. The contributions are made at rates determined by the Government Actuary's Department. The employer’s contributions are set at a Retained Modified Scheme rate of 21.7% of pensionable pay for the 1992 Firefighter’s Pension Scheme, 11.9% for the 2006 Firefighter’s Pension Scheme and 14.3% for the 2015 Firefighter’s Pension Scheme. The employee’s contributions are set on a sliding scale of 11.0% to 17.0%, 8.5% to 12.5% and 11% to 14.5% respectively.
The Authority is also required to make payments into the Pension Fund in respect of ill-health retirements when they are granted.
Benefits
Benefits are accounted for in the year in which they become due for payment.
Transfer Values
Transfer values are those sums payable by or receivable from other pension schemes and relate to periods of previous pensionable employment.
Transfers are accounted for on a receipts and payments basis.

GLOSSARY OF TERMS
92
Accruals
The concept that income and expenditure are recognised as they are earned or incurred, not as money happens to be received or paid.
Actuarial Gains and Losses
For a defined benefit scheme, the changes in actuarial deficits or surpluses that arise because events have not coincided with the actuarial assumptions made for the last valuation (experience gains or losses) or the actuarial assumptions have changed.
Actuarial Valuation
A valuation by an actuary on behalf of a pension fund of assets held, estimate of the present value of benefits to be paid and estimate of required future contributions.
Amortisation
The measure of the wearing out, consumption, or other reduction in the useful economic life of an intangible asset, whether arising from use, effluxion of time or obsolescence through technical or other changes.
Budget
The Authority’s plans and policies expressed in financial terms.
Capital Adjustment Account
A capital reserve that reflects the difference between the cost of property, plant and equipment consumed and the capital financing set aside to pay for them.
Capital Charge
A charge to the revenue account to reflect the cost of property, plant and equipment used.
Capital Expenditure
Expenditure on the acquisition of property, plant and equipment or expenditure which adds to and not merely maintains the value of existing property, plant and equipment.
Capital Grant
Grant from Central Government used to finance capital schemes.
Capital Receipts
Proceeds from the sale of capital assets.
Cash
Cash is represented by cash in hand and deposits with financial institutions repayable without penalty on notice of not more than 24 hours.
Cash Equivalents
Cash equivalents are investments that mature within three months or less from the date of acquisition and that are readily convertible to known amounts of cash with insignificant risk of change in value.

GLOSSARY OF TERMS
93
Chartered Institute of Public Finance and Accountancy (CIPFA)
The principal accountancy body dealing with local authority finance.
Collection Fund
A fund administered by Durham County Council and Darlington Borough Council in which individuals’ Council Tax payments are paid. The Authority raises precepts on the funds to finance part of net revenue expenditure.
Collection Fund Adjustment Account
The account through which to implement the accruals basis for recording the precept without affecting the bottom line for taxpayers.
Component Accounting
Component accounting requires that where an asset has several components, which can be physically separated from the principal asset and which have significantly different useful lives, these should be recognised separately and should be depreciated based on their respective useful lives. Component accounting aims to improve depreciation accounting and improve the measurement of operating results.
Contingency
The sum of money set aside to meet unforeseen expenditure or liability.
Contingent Liabilities
A contingent liability arises where an event has taken place that gives the Authority a possible obligation whose existence will only be confirmed by the occurrence or otherwise of uncertain future events not wholly within the control of the Authority, or where a provision would otherwise be made, but either it is not probable that an outflow of resources will be required, or the amount of the obligation cannot be measured reliably.
Contingent Assets
A contingent asset arises where an event has taken place that gives the Authority a possible asset whose existence will only be confirmed by the occurrence or otherwise of uncertain future events not wholly within the control of the Authority.
Council Tax
The local tax levied on householders, based on the relative market values of property, which helps to fund local services.
Creditors
Persons or bodies to whom sums are owed by the Authority.
Current Assets
Items that can be readily converted into cash.
Current Liabilities
Items that are due immediately or in the short-term.
Debtors
Persons or bodies who owe sums to the Authority.

GLOSSARY OF TERMS
94
Deferred Liabilities
Liabilities which by arrangement are payable beyond the next year at some point in the future or paid off by an annual sum over a period of time.
Depreciation
The measure of the wearing out, consumption or other reduction in the useful economic life of a property, plant or equipment, whether arising from use, effluxion of time or obsolescence through technical or other changes.
Earmarked Reserves
These represent monies set aside that can only be used for a specific purpose.
Employee Benefits
Short-term employee benefits are those due to be settled within 12 months of the year end. They include salary, paid annual leave, paid sick leave, bonuses and non-monetary benefits for current employees and are recognised as an expense in the year in which the employee renders service to the Authority. An accrual is made for the cost of the benefit earned by an employee but not taken before the year end. The accrual is charged to the surplus or deficit on the provision of Services, but then reversed out through the Movement in Reserves Statement.
Financial Instruments
Any contract that gives rise to a financial asset of one entity and a financial liability or equity instrument of another.
Financial Regulations
A written code of procedures approved by the Authority intended to provide a framework for proper financial management.
GAD - The Government Actuaries Department
They provide estimates of the liabilities of the Firefighter’s Pension Scheme.
Government Grants
Assistance by Government in the form of cash in return for past or future compliance with certain conditions relating to the activities of the Authority.
Impairment
A reduction in the value of an asset from the Balance Sheet value occurring as a result of a change in the condition and consumption of the asset or as a result of market conditions.
Interest Income
The money earned from the investment of surplus cash.
International Financial Reporting Standards (IFRS)
The Authority’s financial statements have been prepared in accordance with the following statutory accounting standards adopted by the International Accounting Standards Board (IASB):
• International Financial Reporting Standards (IFRS)
• International Accounting Standards (IAS)

GLOSSARY OF TERMS
95
• Interpretations of the International Financial Reporting Interpretations Committee (IFRIC)
• Interpretations of the Standing Interpretations Committee (SIC)
Leasing
A method of financing capital expenditure where a rental charge for an asset is paid for a specific period. There are two main types of lease: ‘finance leases’ which transfer substantially all the risks and rewards of ownership to the lessee, and other leases, which are known as ‘operating leases’. With finance leases, assets acquired are included within the property, plant and equipment in the Balance Sheet at the market value of the asset involved; monies owing to the lessor are included within deferred liabilities on the Balance Sheet. With an operating lease an annual rent is charged to the relevant service revenue account.
Minimum Revenue Provision
The minimum amount which must be charged in year for the repayment of debt.
National Non-Domestic Rates (NNDR)
The business rate in the pound is the same for all non-domestic ratepayers and is set annually by the government. Income from business rates goes into a Central Government pool that is then distributed to authorities according to resident population.
Net Book Value
The amount at which fixed assets are included in the Balance Sheet, i.e. their historical cost or current value less the cumulative amounts provided for depreciation.
Net Current Replacement Cost
The cost of replacing or recreating the particular asset in its existing condition and in its existing use; i.e. the cost of replacement or of the nearest equivalent asset adjusted to reflect the current condition of the existing asset.
Non-Operational Assets
Property, plant and equipment not directly occupied, used or consumed in the delivery of services. These are assets under construction and surplus assets held for disposal.
Operational Assets
Property, plant and equipment held and occupied, used or consumed by the Authority in the direct delivery of those services for which it has either a statutory or discretionary responsibility.
Outturn
The actual amount spent in the financial year.
Payments in Advance
These represent payments prior to 31st March for supplies and services received after 1st April.
Precept Income
The Authority obtains part of its income from precepts levied on its billing authorities (Durham County Council and Darlington Borough Council). Precepts, based on the

GLOSSARY OF TERMS
96
Council Tax base of each council, are levied on a collection fund, administered separately by each council.
Private Finance Initiative (PFI)
PFI contracts are agreements to receive services where the responsibility for making available the assets needed to provide the services passes to the PFI contractor. Where the Authority controls the services that are provided under a PFI scheme, and ownership of the assets will pass to the Authority at the end of the contract, for no additional charge, the Authority carries the assets used under the contract on its Balance Sheet as part of Property, Plant and Equipment. The original recognition of these assets at fair value is balanced by the recognition of a liability for amounts due to the scheme operator to pay for the capital investment.
Property, Plant and Equipment
Tangible and intangible assets that yield benefits to the authority and the services it provides for a period of more than one year.
Provisions
Sums set aside to meet any liabilities or losses which are likely or certain to be incurred, but uncertain as to the amounts or dates on which they will arise.
Receipts in Advance
These represent income received prior to 31st March for supplies and services provided after 1st April.
Reserves
Sums set aside for purposes falling outside the definition of a ‘provision’. There are two categories of reserves - see ‘Usable Reserves’ and ‘Unusable Reserves’ for further definition.
Retirement Benefits
All forms of consideration given by an employer in exchange for services rendered by employees that are payable after the completion of employment.
Revaluation Reserve
Capital reserve to hold unrealised revaluation gains arising (since 1 April 2007) from holding property, plant and equipment.
Revenue Contributions to Capital
Contribution from revenue to finance capital expenditure, thus reducing the requirement to borrow.
Revenue Expenditure and Income
Expenditure and income arising from the day to day operation of the Authority’s service.
Revenue Expenditure Funded from Capital Under Statute (REFCUS)
Any grants receivable, including capital, that are applied to REFCUS will be accounted for as revenue grants in the Comprehensive Income and Expenditure Statement. Income is posted to the line that the qualifying expenditure is charged to.

GLOSSARY OF TERMS
97
Revenue Support Grant (RSG)
General government grant to assist in financing the overall net cost of services.
Running Expenses
All expenses other than those relating to employees and the financing costs of capital expenditure (capital financing costs and revenue contributions). Running expenses include expenditure on maintenance of buildings, consumable supplies, transport etc.
Termination Benefits
Amounts payable as a result of a decision to terminate an officer’s employment before the normal retirement date or an officer’s decision to accept voluntary redundancy. They are charged on an accruals basis to the Net Cost of Service in the Comprehensive Income and Expenditure Statement.
UK GAAP – Generally Accepted Accounting Standards
As IFRS is primarily drafted for the commercial sector and therefore does not address all accounting issues relevant to local government in the UK, the Code prescribes a hierarchy of alternative standards on which the accounting treatment and disclosures should be based where appropriate. The hierarchy comprises:
• Financial Reporting Standards (FRS)
• Statements of Standard Accounting Practice (SSAP)
• Pronouncements of the Urgent Issues Task Force (UITF)
Unusable Reserves
Reserves the Authority is not able to use to provide services e.g. reserves that hold unrealised gains and losses, e.g. the Revaluation Reserve, where amounts would only become available to provide services if the assets are sold.
Usable Reserves
Reserves that may be used to provide services, subject to the need to maintain a prudent level of reserves and any statutory limitations on their use, e.g. Capital Modernisation Reserve.