Embed Size (px)
Citation preview

1
The following is a reprint of Statement 3, Economic Outlook, from Budget PaperNo. 1: Budget Strategy and Outlook 2001-02.
Economic outlook
Part I: Overview
Economic growth in Australia in 2001-02 is forecast to rebound quite strongly, drivenby a turn around in residential construction. Employment growth is expected to besubdued with the unemployment rate averaging around 7 per cent, while inflation isforecast to decline and the current account deficit to be well below the average of thelast decade. World growth is expected to weaken in 2001 to a little below historicalaverages, although there are significant downside risks.
In 2001-02, economic growth in Australia is forecast to be around 3¼ per centin year-average terms and a strong 4 per cent through the year to the Junequarter 2002. Residential construction is expected to contribute strongly togrowth in 2001-02, with moderate growth in household consumption, businessinvestment and net exports. Average unemployment rates are forecast to beslightly higher than recent levels, with inflation declining and the currentaccount deficit well below its decade average.
Following three years of very strong economic growth in excess of 4 per centper annum, the Australian economy slowed sharply in the second half of 2000.The weakness was concentrated in the residential construction sector, in partreflecting an unwinding of the bring-forward of residential construction intothe first half of 2000, ahead of the introduction of The New Tax System. Thedownturn in this sector had flow-on effects to other parts of the economythrough its impact on employment, consumer spending and consumer andbusiness sentiment. At the same time, net exports contributed strongly togrowth in 2000-01, buoyed by the lower exchange rate and the Olympics,despite a deteriorating international outlook and adverse seasonal conditionsin the farm sector.
Given the weakness in the second half of 2000 and subdued growth expectedin the first half of 2001, economic growth is now expected to be around2 per cent in 2000-01 in year-average terms, and around 1 per cent inthrough-the-year terms.
2
The outlook for world growth has deteriorated since late 2000, led by a sharpslowdown in the United States (US) and weaker conditions in Japan. Theoutlook for growth in countries with close linkages to the US — such as thenon-Japan East Asian economies — has also weakened. Europe is likely to beless affected by a slowdown in the US and is expected to continue to grow at asolid pace. Overall, the global economy is expected to grow by around3¼ per cent in 2001, down sharply from 4.8 per cent in 2000, although only alittle below the long-run historical average. Nevertheless, there are significantdownside risks to growth in the US and Japan. Slower than forecast growth inthese countries would result in weaker growth in East Asia and a morebroadly based global slowdown.
Despite the slower world growth expected in 2001, net exports are estimated tocontribute strongly to overall economic growth in Australia in 2000-01, with afurther modest positive contribution expected in 2001-02. The exchange ratehas helped boost the competitiveness of many of Australia’s export and importcompeting industries. Australia’s current account deficit (CAD) is forecast tobe around 3 per cent of gross domestic product (GDP) in both 2000-01 and2001-02. At these forecast levels, the CAD will be down markedly from5.3 per cent of GDP in 1999-2000 and well below its average of the 1990s. Inaddition to the stronger balance of trade, the lower CAD also reflects a declinein the net income deficit (NID) in response to lower world and domesticinterest rates and reduced margins between Australian and world investmentreturns.
Gross national expenditure is forecast to grow at a moderate rate of around3 per cent in 2001-02, compared with less than 1 per cent in 2000-01.Residential construction is expected to grow by around 5 per cent inyear-average terms in 2001-02, following a marked decline of around25 per cent in 2000-01, with the turn around supported by recent reductions ininterest rates and the Government’s more generous First Home OwnersScheme. The recovery in this sector is expected to gather strength as 2001-02proceeds, with through-the-year growth of around 14 per cent. Modest growthis also expected to resume in non-residential construction, particularlyengineering construction, following several years of decline since the recentpeak in 1998-99.

3
Household consumption expenditure is forecast to increase by around3 per cent in 2001-02, a little faster than in 2000-01 but well below the veryrapid growth experienced in the latter part of the 1990s (which was buoyed bystrong growth in asset prices and household wealth). Household consumptionwill be supported by lower interest rates and a forecast gradual easing inpetrol prices.
Employment growth in 2001-02 is expected to be slower than in recent yearsbut grow at around 1 per cent in year-average terms and around 1½ per centthrough the year. This largely reflects the lagged effects of slower overalleconomic growth in 2000-01, particularly the downturn in the labour intensiveconstruction sector. The unemployment rate is expected to increase slightly, toaverage around 7 per cent in 2001-02 and in the June quarter 2002. This followsa period of declining unemployment which carried the unemployment ratedown to around decade lows. Prospects are sound for a resumption in thedownward trend in unemployment over the medium term as the constructionsector recovers and overall economic growth strengthens.
Inflation is forecast to decline in 2001-02, with the headline consumer priceindex (CPI) rising by around 2 per cent in both year-average andthrough-the-year terms. The abolition of Financial Institutions Duty and otherelements of The New Tax System will put downward pressure on consumerprices in 2001-02 and the forecasts also incorporate a slight easing in petrolprices in line with an expected downward trend in world oil prices.
From a domestic perspective, a key uncertainty relates to the possibility thatthe recent downward trend in business and consumer sentiment is sustainedover coming quarters. This poses a downside risk to the forecasts for businessinvestment and consumption. On the other hand, there is a possibility that thelower exchange rate and reductions in interest rates will provide a greaterstimulus to economic growth than has been incorporated into the forecasts.

4
Table 1: Domestic economy forecasts(a)
Outcomes(b) Estimates Forecasts1999-00 2000-01 2001-02 Four
Year Year Year Quarters toAverage Average Average June 2002
Panel A - Demand and output(c)
Household consumption 4.5 2 3/4 3 3 1/4Private investment Dwellings 12.4 -25 5 14 Total business investment(d) 3.6 0 5 9 Other buildings and structures(d) -11.0 -22 6 10 Machinery and equipment(d) 8.8 5 3 7
Private final demand(d) 5.0 0 3 1/2 4 3/4Public final demand(d) 5.6 2 1/4 2 1/4 0Total final demand 5.1 1/2 3 1/4 3 3/4
Change in inventories(e) Private non-farm -0.6 1/4 - 1/4 1/4 Farm and public authorities 0.0 0 0 0
Gross national expenditure 4.5 1/2 3 4
Exports of goods and services 9.2 6 5 7Imports of goods and services 12.5 0 4 7 Net exports(e) -0.9 1 1/4 1/4 0
Gross domestic product 4.3 2 3 1/4 4 Non-farm product 4.4 2 1/4 3 3 3/4 Farm product (at basic prices) 4.0 -6 7 13
Panel B - Other selected economic measures
External accounts Terms of trade 4.3 4 - 3/4 - 1/2 Current account balance $billion -33.7 -20 1/2 -20 Percentage of GDP -5.3 -3 -3
Labour marketEmployment (labour force survey basis) 2.7 2 1 1 1/2Unemployment rate (per cent)(f) 6.6 6 1/4 7 7Participation rate (per cent)(f) 63.4 63 3/4 63 3/4 63 3/4
Prices and wages Consumer price index - headline 2.4 6 2 2 Consumer price index - 'ongoing'(g) 2.4 3 1/4 2 1/2 2 1/4 Gross non-farm product deflator 1.8 4 1 1/2 1 1/2 Average earnings (national accounts basis) 2.8 3 1/2 3 3/4 3 3/4
(a) Percentage change on preceding year unless otherwise indicated.(b) Calculated using original data.(c) Chain volume measure.(d) Excluding private sector net purchases of second-hand public sector assets.(e) Percentage point contribution to growth in GDP.(f) The estimate in the final column represents the forecast level in the June quarter 2002.(g) The ‘ongoing’ CPI is the headline measure abstracting from the impact of The New Tax System.

5
Part II: The outlook for the international economy
The world economy grew by an estimated 4.8 per cent in 2000, up from3.5 per cent growth in 1999 and well above long-term average growth rates.However, economic growth slowed through the second half of 2000 and isexpected to be significantly weaker in 2001 at about 3¼ per cent, although thisis only a little below the long-run historical average. The pace of growth isexpected to pick up later in 2001 and increase to around 4 per cent in 2002(Chart 1).
Chart 1: Annual growth in world GDP(a)
0
1
2
3
4
5
6
7
8
1972 1974 1976 1978 1980 1982 1984 1986 1988 1990 1992 1994 1996 1998 2000 20020
1
2
3
4
5
6
7
8
Average world growth (1972-2000)
Fore
cast
Per cent Per cent
(a) World GDP growth rates are calculated using GDP weights based on purchasing power parity.
Source: Various national statistical publications, International Monetary Fund (IMF) and Treasury.
The slowing in world economic growth in the second half of 2000 reflected therestraining influence of earlier monetary tightenings, the rise in oil prices thatreduced business and household purchasing power, and falls in equity prices,particularly in high-technology stocks.
The slowing in growth was particularly pronounced in the US. Following veryrapid growth in the first half of 2000, household consumption slowed andproduction and investment eased in manufacturing industries following thebuild-up of inventories and capacity earlier in the year. Growth also softenedin Europe, and the nascent recovery in Japan stalled. Activity in non-JapanEast Asia was adversely affected by slowing US growth as the year ended.
6
World growth is expected to pick up as 2001 progresses, supported by arecovery in the US economy over the course of the year, solid growth inEurope and continued, albeit slower, growth in East Asian economies,particularly China. With the Japanese economy remaining sluggish, economicgrowth in Australia’s main export markets is expected to be around2¾ per cent in 2001, down sharply from 5 per cent in 2000, but well abovethe fall of 0.5 per cent recorded in 1998, during the Asian financial crisis.
In 2002, world growth is expected to rise to around 4 per cent, underpinned bygathering momentum in the US and stronger growth in the East Asianeconomies. However, the slow pace of growth expected in Japan points toAustralia’s export market growth being around 3½ per cent.
World inflation is expected to remain subdued with slower growth in themajor economies easing capacity constraints and moderating price pressures.Ongoing productivity gains and increasingly competitive tradingenvironments should also help contain inflation as growth picks up in 2002.
World oil prices have declined significantly over the past six months,suggesting that the risks to world activity and inflation from this source haveabated somewhat. Prices are expected to continue to ease, in line with theweaker outlook for the world economy in 2001. Crude oil prices are nowexpected to decline from a world trade weighted1 average of US$27.6 per barrelin 2000 to around US$23¼ per barrel in 2001, and US$22 per barrel in 2002.
Oil prices are likely to remain volatile in the short term, reflecting uncertaintyabout the action of key producers and the strength of world demand. Inparticular, the actions of the Organisation of Petroleum Exporting Countries —which has already cut production by 2.5 million barrels per day thus far in2001 — in the face of falling demand and prices, create some uncertaintyaround the forecast.
Growth in the United States was 5 per cent in 2000, although the rapid growthof the first half gave way abruptly to very modest rates in the second half ofthe year. Growth is expected to average around 1½ per cent in 2001 beforerising to around 3¼ per cent in 2002.
The first half of 2000 was marked by a surge in business and consumerspending and a continuation of the same supply-side forces that have
1 The world trade weighted oil price is the average of the contract price of different types ofoil, weighted by their share of the world oil trade (that is, between countries).

7
propelled the economy over the past few years: ongoing realisation ofsynergies from new technology and improved business practices, high levelsof investment and elevated rates of productivity growth. In the second half of2000, the situation changed. Equity markets adjusted downwards (particularlyin high technology), consumption slowed, inventories grew, productionweakened particularly in the manufacturing sector, and some capital spendingwas put on hold. The new technologies and business practices, which hadunderpinned the expansion, appeared to contribute to a more rapid passthrough of the change in conditions than in the past.
The extent and duration of the slowdown in the US is expected to be mildcompared with previous episodes, moderated by relatively sound underlyingmacroeconomic conditions and supportive policy settings. Growth is expectedto be weak in the first half of 2001 as inventories and excess capacity in someindustries are worked off, but should recover quickly in the second half of theyear and into 2002. Consumer spending is expected to be supported byongoing growth in income, still relatively high levels of consumer confidence,and by recent interest rate cuts and the prospect of tax cuts later in the year.Investment in housing appears to have picked up in the first part of 2001 andother investment should be supported in the longer term by productivitygrowth and prospects of attractive returns on high-tech investment.Nevertheless, risks around the US growth forecasts are substantial, with anysignificant deviations in US growth from the forecast levels having thepotential to markedly affect overall world growth (Box 1).
Table 2: Annual growth in GDP for selected countries and groupings(a)(b)
1997 1998 1999 2000(c) 2001 2002Actual Actual Actual Estimate Forecast Projection
World 4.2 2.8 3.5 4.8 3 1/4 4
OECD(d) 3.5 2.7 3.2 4.1 2 1/4 3Main Trading Partners(e) 4.1 -0.5 4.0 5.0 2 3/4 3 1/2
United States 4.4 4.4 4.2 5.0 1 1/2 3 1/4Japan 1.9 -1.1 0.8 1.7 3/4 1 1/2European Union 2.6 2.9 2.6 3.4 2 1/2 2 3/4Non-Japan East Asia(f) 6.7 1.1 6.3 7.4 5 3/4 6 1/2
(a) Percentage change on previous year.(b) Growth rates for the World, the Organisation for Economic Co-operation and Development (OECD), the
European Union (EU), and non-Japan East Asia are calculated using GDP weights based on purchasingpower parity.
(c) Treasury estimates of World, OECD and EU growth rates.(d) The OECD comprises the United States, Japan, Germany, France, Italy, the United Kingdom, Canada,
Australia, Austria, Belgium, the Czech Republic, Denmark, Finland, Greece, Hungary, Iceland, Ireland,Korea, Luxembourg, Mexico, the Netherlands, New Zealand, Norway, Poland, Portugal, Spain, Sweden,Switzerland, Turkey and includes Slovakia from 2001.
(e) Export trade-weighted basis.(f) Non-Japan East Asia comprises Korea, Singapore, Taiwan, Hong Kong, China, Indonesia, Malaysia,
Thailand, and the Philippines.Source: Various national statistical publications, IMF and Treasury.

8
Japan’s economy grew by 1.7 per cent in 2000, although uncertainty about thesustainability of the expansion remains. Growth is expected to be uneven in2001 with last year’s fiscal package likely to raise public investment during thefirst half of the year, but with the boost to activity tapering off in the secondhalf of the year as public spending declines. Consumption is likely to remainsubdued and investment is expected to ease through 2001 as slower worldgrowth and weaker demand for high-tech products reduce exports andweaken the outlook for corporate profits. The sharp decline in equity pricesover the past year is also likely to undermine business confidence and theinvestment outlook. For 2001 as a whole, growth is expected to average around¾ per cent, before picking up to around 1½ per cent in 2002 as the globaleconomy strengthens. Sustained recovery in Japan continues to be constrainedby high levels of bad debts in the banking system. The new Government hasexpressed a commitment to progressing further reforms, including in thefinancial sector.
Growth in the euro area strengthened in 2000, rising to 3.4 per cent, buoyed bystrong domestic and external demand. For 2001, growth is expected tomoderate in the face of a less supportive global environment. However, theeuro area appears to be less affected by the downturn in the US than someother regions and the effects are likely to be more muted. Consumption isexpected to be underpinned by rising incomes, recent tax cuts and relativelyhigh levels of consumer confidence. Investment, although adversely affectedby weaker export earnings and higher energy prices, is likely to be supportedby recent corporate tax cuts and relatively high levels of capacity utilisation. In2001, growth in the euro area is expected to be around 2½ per cent, withslightly higher growth expected in 2002 at around 2¾ per cent, as worldeconomic conditions improve. Growth in the United Kingdom is expected tobe more affected by the slowdown in the US and problems associated with footand mouth disease, with growth slowing to 2¼ per cent in 2001, before pickingup to 2¾ per cent in 2002 on the back of stronger world growth and supportivemacroeconomic policy.
The non-Japan East Asia region grew strongly in 2000, supported by strongexport demand and rising domestic demand. The region benefited from thestrong growth in the world economy and particularly from the upturn indemand for electronics in the US, Europe and Japan.
Growth is expected to slow in 2001 with the slowdown in the US andcontinued weakness in Japan expected to reduce demand for exports,particularly electronics, industrial machinery and automobiles which havebeen a cornerstone of the expansion. The impact is likely to be more

9
pronounced for countries such as Taiwan, Singapore and Korea which have ahigh electronics component in their export base.
Unfavourable domestic factors are also likely to weigh heavily on theimmediate outlook for the region, particularly in Indonesia, Thailand and thePhilippines. However, foreign exchange reserves are generally higher thanimmediately preceding the Asian crisis, external positions have improved, andspeculative capital inflow has been limited, leaving countries less vulnerable tounfavourable shifts of sentiment and capital flight.
Growth in non-Japan East Asia is forecast to decline from 7.4 per cent in 2000to around 5¾ per cent in 2001 before picking up to 6½ per cent in 2002, in linewith the expected recovery in the US. Excluding China (which continues togrow strongly), growth in the region is forecast to be 3½ per cent in 2001 beforerising to 4¾ per cent in 2002.
Other emerging market economies grew strongly in 2000, but growth is likelyto moderate in 2001. Financial and economic conditions remain fragile andthey remain vulnerable to any further weakening in global conditions and/or adeterioration in sentiment towards emerging markets.

10
Box 1: Risks to the US and global outlook
The path of the global economy over the next year depends heavily ondevelopments in the US economy. The most likely outcome in the US is thatgrowth will slow through the first half of 2001 as excess inventories arereduced and surplus capital stock is unwound through lower investmentand modest growth, but pick up strongly in the latter part of the year. Thisrelatively benign outcome would be consistent with the generally soundunderlying fundamentals of the US economy and the stimulative impact oflower interest rates and foreshadowed tax cuts.
It is possible, however, that business conditions and business and consumerconfidence will fall further during the adjustment process leading to adeeper and more prolonged slowdown than currently envisaged. Energyprices have risen sharply in the US reflecting in part domestic capacityconstraints in the energy sector which could put further pressure on pricesand incomes. Other factors, including a reassessment of the wealth andincome gains from investment in new technology areas, could also adverselyaffect incomes and sentiment.
In these circumstances, there would likely be a sharp reduction inconsumption and investment spending. Increased uncertainty with respectto employment and incomes would see consumption weaken, and thiswould be reflected in lower profit prospects and a further decline in equityprices. With household debt already at high levels and savings rates low,household consumption would likely be pared back further. Reduced salesand earnings prospects and increased risk would also likely see firms delayinvestment, using funds to repair extended balance sheets instead. In thisscenario, equity returns would fall, capital inflows would ease, the largecurrent account deficit would unwind, and the exchange rate woulddepreciate.
A weaker US economy accompanied by a rapid adjustment in financialmarkets would adversely affect other countries, including East Asianeconomies. The outlook for Japan has already deteriorated, partly as a resultof weaker global conditions, but also due to domestic factors including weakconsumer and business confidence and unresolved problems in the financialsector. Further deterioration in the economy and weaker confidence wouldexpose vulnerabilities in the financial and corporate sectors, exacerbating theadverse affects of weaker external conditions.
Continued…

11
Box 1: Risks to the US and global outlook (continued)
Both Japan and other East Asian economies are particularly vulnerable to amore severe downturn in the US because of their specialisation in electronicproducts. However, there could be some offsetting effects from lowerinterest rates, lower exchange rates, and increased capital inflow whereattractive investment opportunities arise.
Other countries would also be adversely affected by further weakness in theUS and Japan, through the usual trade linkages and through confidenceeffects.
On the upside, recent policy adjustments in several countries may forestall afurther downturn. If confidence were to turn up quickly there may be someupside risks to the forecasts.

12
Part III: The outlook for the domestic economy
Key assumptions
In framing the forecasts for the domestic economy the exchange rate isassumed, as is usual practice, to remain unchanged from the average levelsreached in recent months, at around US52½c and around 50 against the tradeweighted index (TWI). On the basis of these assumptions, the exchange ratewould be lower on average in 2001-02 than in 2000-01, and significantly lowerthan its average level of around US63c and 55 against the TWI in 1999-2000,helping to produce a solid net export performance in the face of slower worldgrowth.
The forecasts take into account the reductions in official interest rates sinceFebruary 2001. The reductions in interest rates are expected to be supportive ofdomestic demand, especially residential investment and householdconsumption spending (in particular, on consumer durables). Although thetiming and magnitude of this effect is uncertain, most of the impact from lowerinterest rates is expected to be felt in 2001-02.
The forecast fall in farm production in 2000-01 largely reflects a combination ofvery dry conditions in some areas and severe flooding in others. An assumedreturn to normal seasonal conditions in 2001-02 would see stronger farmproduction contributing to overall economic growth.
Demand and output
In 2001-02, economic growth in Australia is forecast to be around 3¼ per centin year-average terms and a strong 4 per cent through the year to the Junequarter 2002. Average unemployment rates are forecast to be slightly higherthan recent levels at around 7 per cent, with inflation declining relative to2000-01 and the CAD well below its average level of the 1990s.
Gross national expenditure is forecast to grow at a moderate rate of around3 per cent in 2001-02, following growth of less than 1 per cent in 2000-01.Residential construction is expected to contribute strongly to growth, withmoderate growth in household consumption, business investment and netexports (Chart 2).
Residential construction is expected to grow by around 5 per cent inyear-average terms in 2001-02, following a large decline of around 25 per centin 2000-01, with the turn around supported by recent reductions in interest

13
rates and the Government’s more generous First Home Owners Scheme. Therecovery in this sector is expected to gather strength as 2001-02 proceeds, withthrough-the-year growth of around 14 per cent. Modest growth is alsoexpected to resume in non-residential construction, particularly engineeringconstruction, following several years of decline since the recent peak in1998-99.
Following the weakness in the second half of 2000 and subdued growthexpected in the first half of 2001, economic growth is now expected to bearound 2 per cent in 2000-01 in year-average terms and around 1 per cent inthrough-the-year terms.
Chart 2: Contributions to GDP growth
GDP
Exports
Inventories
Public final demand(a)Dwelling
investment
Businessinvestment(a)
Household consumption
-3
-2
-1
0
1
2
3
4
5
-3
-2
-1
0
1
2
3
4
5
1999-00 2000-01 (estimate) 2001-02 (forecast)
Imports
Percentage points Percentage points
(a) Excluding private sector net purchases of second-hand public sector assets.Source: Australian Bureau of Statistics (ABS) Cat. No. 5206.0 and Treasury.

14
Household consumption
Household consumption is forecast to increase by around 3 per cent in 2001-02,a little stronger than the estimate of 2¾ per cent for 2000-01 (Chart 3). Thisfollows a six year period where consumption growth averaged a very strong4½ per cent per annum.
Chart 3: Annual growth in real household consumption
0
1
2
3
4
5
6
1989-90 1991-92 1993-94 1995-96 1997-98 1999-00 2001-020
1
2
3
4
5
6Per cent Per cent
Long-run average (30 year)
Fore
cast
Source: ABS Cat. No. 5206.0 and Treasury.
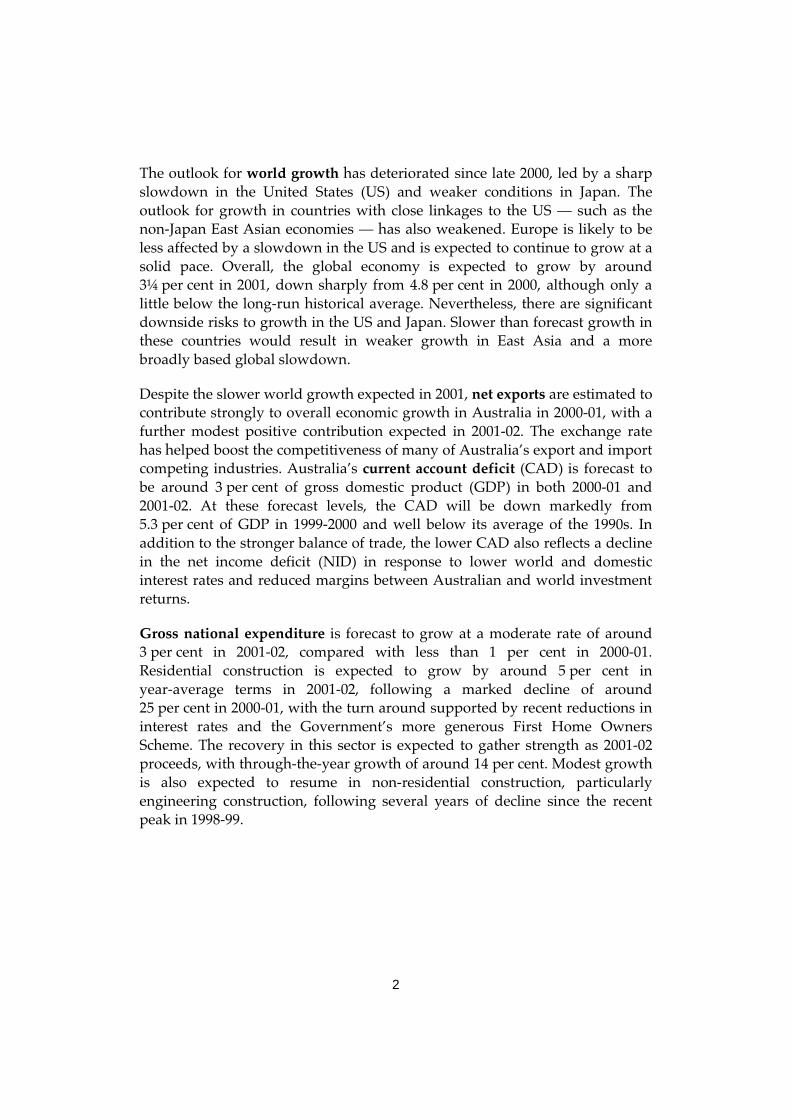
Real household disposable income in 2000-01 has been boosted by the incometax cuts and increases in benefits flowing from The New Tax System (after anallowance for the associated increases in indirect taxes). However, thebeneficial impact of these tax cuts on consumption expenditure was offset tosome extent in the latter part of 2000 by the effects of rising interest ratesduring 2000 and rising petrol prices. Slower employment growth in 2000-01also had a moderating effect on the growth in real household income andconsumption. In addition, the strong accumulation of wealth experienced overrecent years (Chart 4) did not continue to the same extent in 2000-01, withrelatively steady share prices, and with house prices declining in some areasand rising less quickly than previously in other areas.
The significant interest rate reductions since early 2001 are likely to give someboost to consumption growth in 2001-02, as will the expected gradualdownward trend in petrol prices. On the other hand, subdued employmentgrowth will continue to have a moderating effect on the growth in realhousehold income in 2001-02.
15
Chart 4: Annual growth in private sector wealth(a)
-10
-5
0
5
10
15
20
25
1980 1982 1984 1986 1988 1990 1992 1994 1996 1998 2000-10
-5
0
5
10
15
20
25Nominal
Real
Average real growth, 1960-2000
Per cent Per cent
(a) June 30 estimates.Source: Treasury.
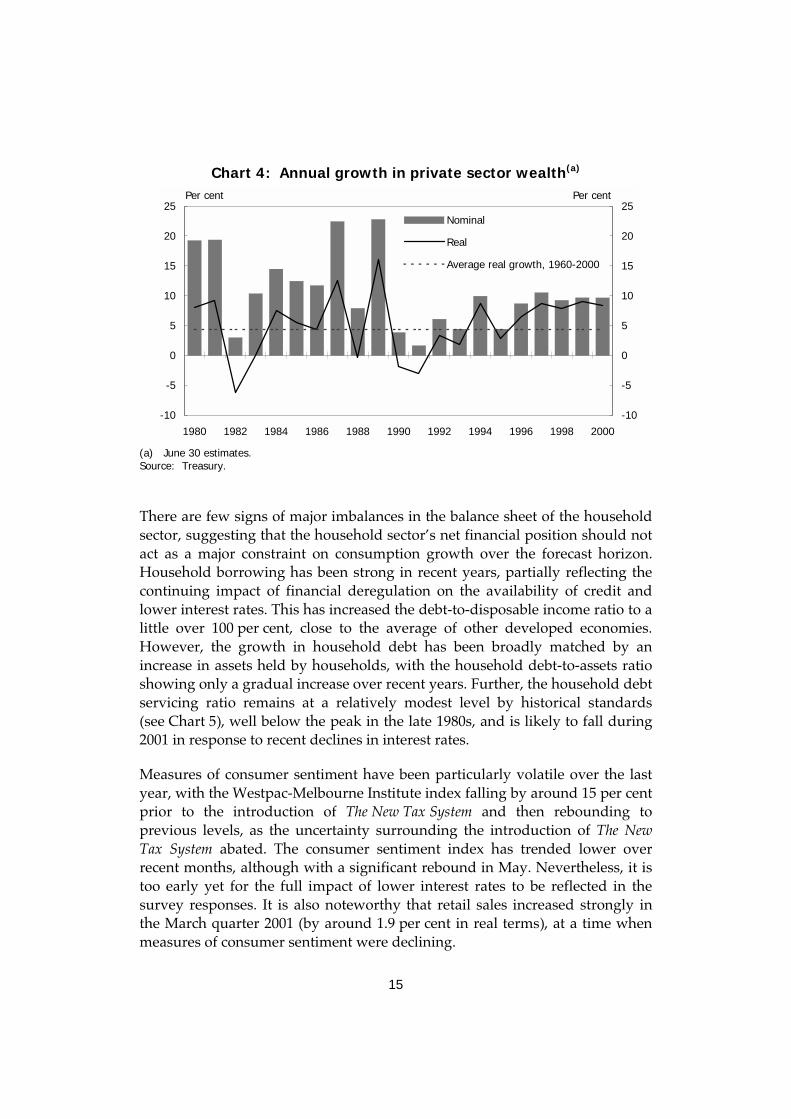
There are few signs of major imbalances in the balance sheet of the householdsector, suggesting that the household sector’s net financial position should notact as a major constraint on consumption growth over the forecast horizon.Household borrowing has been strong in recent years, partially reflecting thecontinuing impact of financial deregulation on the availability of credit andlower interest rates. This has increased the debt-to-disposable income ratio to alittle over 100 per cent, close to the average of other developed economies.However, the growth in household debt has been broadly matched by anincrease in assets held by households, with the household debt-to-assets ratioshowing only a gradual increase over recent years. Further, the household debtservicing ratio remains at a relatively modest level by historical standards(see Chart 5), well below the peak in the late 1980s, and is likely to fall during2001 in response to recent declines in interest rates.
Measures of consumer sentiment have been particularly volatile over the lastyear, with the Westpac-Melbourne Institute index falling by around 15 per centprior to the introduction of The New Tax System and then rebounding toprevious levels, as the uncertainty surrounding the introduction of The NewTax System abated. The consumer sentiment index has trended lower overrecent months, although with a significant rebound in May. Nevertheless, it istoo early yet for the full impact of lower interest rates to be reflected in thesurvey responses. It is also noteworthy that retail sales increased strongly inthe March quarter 2001 (by around 1.9 per cent in real terms), at a time whenmeasures of consumer sentiment were declining.

16
An extended period of low consumer sentiment represents a downside risk tothe consumption growth forecasts, although the recent reductions in interestrates should be supportive of higher confidence levels.
Chart 5: Household debt servicing ratio
4
6
8
10
12
14
Dec-80 Dec-82 Dec-84 Dec-86 Dec-88 Dec-90 Dec-92 Dec-94 Dec-96 Dec-98 Dec-004
6
8
10
12
14Per cent Per cent
(a) Household (including unincorporated enterprises) debt interest payments as a proportion of household
disposable income.
Source: ABS Cat. No. 5206.0.
Dwelling investment
Following several years of strong growth, dwelling investment is expected tofall by around 25 per cent in 2000-01 in year-average terms, before returning toa positive rate of growth later in 2001.
In 1999-2000, building activity rose strongly to its highest level as a share ofGDP in almost 20 years, as home builders and renovators brought forwardactivity ahead of the introduction of The New Tax System. This bring-forward ofactivity was unwound in the second half of 2000 which, combined with theeffects of higher interest rates, saw activity in this sector decline by around35 per cent over the September and December quarters of 2000 (Chart 6). Thisdecline in building activity, in turn, contributed to weaker employment andhousehold consumption spending.
In 2001-02, dwelling investment is expected to rebound significantly, withforecast growth of around 5 per cent in year-average terms and around14 per cent in through-the-year terms. Strong growth is expected to be driven

17
largely by improved housing affordability and by the Government’s moregenerous First Home Owners Scheme. Recent declines in interest rates shouldsee housing affordability improve through 2001. The First Home OwnersScheme, which encourages the construction of new dwellings through thepayment of a $14,000 grant to first home buyers, should also provide atargeted, short-term boost to building activity in 2001-02.
There is a greater than normal degree of uncertainty surrounding the timingand extent of the recovery in dwelling investment. The Government’s moregenerous First Home Owners Scheme and the recent reductions in interestrates should provide a significant boost to activity in the sector, although thetiming and magnitude of this boost is difficult to assess. Early indicationssuggest strong interest from home buyers resulting from the First HomeOwners Scheme.
Chart 6: Growth in dwelling investment
-30
-20
-10
0
10
20
30
Dec-90 Dec-92 Dec-94 Dec-96 Dec-98 Dec-00-30
-20
-10
0
10
20
30
Through-the-year growth
Quarterly growth
Per cent Per cent
Source: ABS Cat. No. 5206.0.

18
Business investment
New business investment2 is expected to grow by around 5 per cent in 2001-02,following approximately zero growth in 2000-01 (Chart 7). Through the year tothe June quarter 2002, new business investment is expected to grow by around9 per cent. The solid outlook for business investment reflects soundfundamentals: short and long-term interest rates are near historical lows;corporate profitability (despite recent declines) remains around historicallyhigh levels as a share of GDP, and is particularly strong in the mining sectorwhich is highly capital intensive; and the decline in the exchange rate overrecent quarters will give many Australian industries an important bufferagainst the effects of slower world growth. Despite the forecast solid increasein business investment in 2001-02, the level of business investment wouldremain slightly below longer run averages as a share of GDP, following a smallfall in 2000-01.
New investment in plant and equipment is expected to grow by around3 per cent in 2001-02, and a strong 7 per cent through the year to the Junequarter 2002, following estimated growth of around 5 per cent in 2000-01. Theoutlook for investment in plant and equipment is partially underpinned byexpected investment in the mining sector. After a couple of very weak yearsduring and immediately following the Asian crisis, conditions in the miningsector are conducive to investment, with record levels of profitability boostedby higher prices for a range of commodities and the decline in the exchangerate. Firms’ first investment intentions for 2001-02, as reported in theABS capital expenditure survey, were quite strong, although early estimatesonly provide a broad indication of likely outcomes. Allowing for some impactfrom lower levels of business confidence experienced over recent quarters onrealisation ratios applied to investment intentions, the investment intentionsdata point to solid growth in plant and equipment investment in 2001-02.
2 Private sector net purchases of second-hand public sector assets can have a significant impacton estimates of business investment and public final demand, despite the fact that these assetpurchases have no impact on aggregate economic activity. Accordingly, the forecasts of newbusiness investment abstract from these transactions.

19
Chart 7: Annual growth in new business investment(a)
-30
-20
-10
0
10
20
30
1989-90 1991-92 1993-94 1995-96 1997-98 1999-2000 2001-02-30
-20
-10
0
10
20
30
Total business investment Plant and equipment Buildings and structures
Fore
cast
Per cent Per cent
(a) Excluding net purchases of second-hand public sector assets.
Source: ABS Cat No. 5206.0 and Treasury.
The risks around the outlook for plant and equipment investment in 2001-02appear to be balanced. On the one hand, slower domestic and world growthmay point to a weaker outlook than forecast, particularly if businessconfidence falls in response to this uncertain outlook. While profits inaggregate have been around historically high levels, there is anecdotalevidence that margins in some sectors may have been affected by the lowerAustralian dollar, high energy and fuel costs, new tax payment arrangementsand weaker demand. On the other hand, relatively low short and long-terminterest rates, lower plant and equipment prices as a result of the introductionof The New Tax System, and the potential for investment by the mining andresource sectors over the medium term are supportive of strong investment.There is also some potential for stronger than forecast investment in 2001-02 ifbusiness confidence rebounds sharply from its current level.
New investment in buildings and structures is expected to grow by around6 per cent in 2001-02 and a strong 10 per cent through the year to the Junequarter 2002. This follows an estimated decline of 22 per cent in 2000-01,mainly associated with the completion of Olympics-related projects. Stronggrowth in engineering construction is expected to underpin growth ininvestment in buildings and structures in 2001-02, as a number of new projectsin the mining and resource sectors, and several power generation projects,

20
commence during the year. A stabilisation in the level of non-residentialbuilding approvals, commencements and work-yet-to-be-done suggests thatactivity in this sector may have bottomed, following two years of decline.
Investment in intangible fixed assets (that is, computer software, mineralexploration rights and artistic originals) is expected to grow strongly in2001-02, although at a slower rate than in 1999-2000 and 2000-01. The outlookfor intangible fixed assets is dominated by expected strong growth in softwareinvestment, which now comprises over 10 per cent of total new businessinvestment. Some easing in growth of software investment is expected in2001-02, following the completion of work relating to the new taxarrangements in 2000, and Y2K-related work in 1999.
Inventories
Private non-farm inventories are expected to contribute around a ¼ of apercentage point to growth in 2000-01. In the first half of 2000, there appears tohave been an unanticipated run-down in inventories, especially in the retailsector, as sales were brought forward ahead of the introduction ofThe New Tax System. In turn, there was some rebuilding of inventory levels inthe second half of 2000 as this net bring-forward of sales was unwound.However, after making an allowance for this effect, there appears to have beena modest build-up in inventory levels in the second half of 2000, due to weakerthan expected growth in sales.
Private non-farm inventories are expected to subtract around a ¼ of apercentage point from GDP growth in 2001-02, as the modest build-up ininventories in the second half of 2000 is gradually unwound over 2001, andmore generally as firms continue to manage down inventory-to-sales ratios toincrease profitability. However, there is a risk that the build-up in inventoriesmay be unwound more quickly, especially if the recent falls in businesssentiment are sustained.
Public final demand
In 2001-02, real public final expenditure3 is anticipated to grow by around2¼ per cent in year-average terms, similar to the outcome expected in 2000-01,but well below the 5.6 per cent growth recorded in 1999-2000. The moderationrelative to 1999-2000 reflects the winding down of expenditure related to the
3 The forecasts of public final expenditure abstract from private sector net purchases ofsecond-hand public sector assets — see footnote 2.

21
peacekeeping mission in East Timor; the start-up costs associated with taxreform; and the completion of large infrastructure projects in some States(including the Olympics). This has been partially offset at the Commonwealthlevel by the new spending initiatives on research and development, roads anddefence that are expected to commence in 2001-02.
Growth in consumption at the State level is expected to be steady, with a fall inconsumption following the Olympics offset by increased spending on roadsand wage costs. An expected fall in State underlying investment reflects thecompletion of a large number of infrastructure projects in 2000-01 anddecreased investment spending in 2001-02.
Net exports and the current account balance
The CAD is forecast to decline sharply from 5.3 per cent of GDP in 1999-2000to around 3 per cent of GDP in 2000-01 and 2001-02. The decline in the CADrelative to 1999-2000 is expected to be driven by a stronger tradingperformance in volume terms, a rise in the terms of trade and a lower NID. Atthese levels, the CAD would be well below its average level as a share of GDPduring the 1990s, and around half its earlier peaks.
Net exports
Net exports are expected to contribute a large 1¼ percentage points to GDPgrowth in 2000-01, but slower world growth in 2001 will have a significantimpact on exports in 2001-02. However, net exports are still expected tocontribute around ¼ of a percentage point to GDP growth in 2001-02, reflectingthe assumed lower average exchange rate in 2001-02 and the impact of modestgrowth in domestic demand on imports.
In 2001-02, export volume growth is expected to be a solid 5 per cent, followingan estimated 6 per cent growth in 2000-01. These growth rates are only a littlebelow trend, reflecting the impact of slower world growth in 2001 onAustralia’s export volumes being substantially offset by a lower averageexchange rate. Export growth in 2001-02 is expected to be underpinned bystrong growth in non-rural commodity exports, reflecting the continuedramp-up of production from recently completed projects.
Farm production is expected to fall by around 6 per cent in 2000-01 due toadverse seasonal conditions. In 2001-02, farm production is expected to growstrongly, by around 7 per cent (well above trend), due to the assumed return toaverage seasonal conditions. Rural export volumes are not expected to fall by

22
as much as farm production in 2000-01, as stocks — particularly wool andwheat — are drawn down to meet demand. As a result, rural export volumesare not expected to rebound as strongly as farm production in 2001-02.
The impact of slower world growth — in particular in Australia’s majortrading partners — is expected to be most apparent in lower growth inelaborately transformed manufactures (ETMs) and services exports. However,the lower average exchange rate should partially offset this by providing aboost to Australia’s competitiveness, enabling Australian exporters to increasetheir market share. As a result, both services (abstracting from the Olympics)and ETM export volumes are expected to continue to grow solidly in 2001-02,albeit at rates somewhat below trend.
Import volumes are expected to grow by 4 per cent in 2001-02, up from aroundzero growth in 2000-01, reflecting strengthening — but still below trend —domestic demand growth and more modest growth in import prices inAustralian dollar terms than in 2000-01. Nevertheless, in both years, importvolume growth is expected to be well below trend growth rates.
The terms of trade
The terms of trade are expected to increase by a strong 4 per cent in 2000-01, tobe around the highest level in a decade. Only a slight decline (¾ per cent) fromthese levels is forecast in 2001-02, despite slower expected world growth. Thisslight decline reflects a modest fall in the world price of Australia’s exports,partly offset by continued weakness in the world price of Australia’s imports.
In currency neutral (Special Drawing Rights (SDR)) terms, Australia’snon-rural commodity export prices — as measured by the Reserve Bank ofAustralia’s commodity price index — are expected to continue to grow in2001-02, following strong growth in 2000-01. Underlying this forecast arestrong increases in negotiated contract prices for bulk commodities beingpartially offset by weaker prices for base metals and mineral fuels. Contractprices for steaming coal have recently increased by around 20 per cent in USdollar terms, coking coal by around 11 per cent and iron ore by around4 per cent.
Some moderation in aggregate rural prices in SDR terms from recent highlevels is anticipated, reflecting an expected rise in world agriculturalproduction in 2001-02 (in part driven by the continued high level ofagricultural subsidies in developed countries) and continued high levels ofworld stocks. This points to subdued world prices in 2001-02, particularly forwheat and cotton. Nevertheless, world prices for beef and wool — two of
23
Australia’s key rural exports — are expected to increase slightly in 2001-02,building on strong gains in 2000-01, to be at their highest level in two decadesin Australian dollar terms. This reflects a relatively tight supply/demandbalance in both markets.
In Australian dollar terms, rural commodity prices are expected to remainaround historically high levels over the forecast period. While adverse seasonalconditions have seen farm production fall by around 6 per cent in 2000-01, areturn to average seasonal conditions is expected to see farm productionincrease by 7 per cent in 2001-02. The relatively unusual combination of highprices and strong production should see farm incomes increase to historicallyhigh levels in 2001-02.
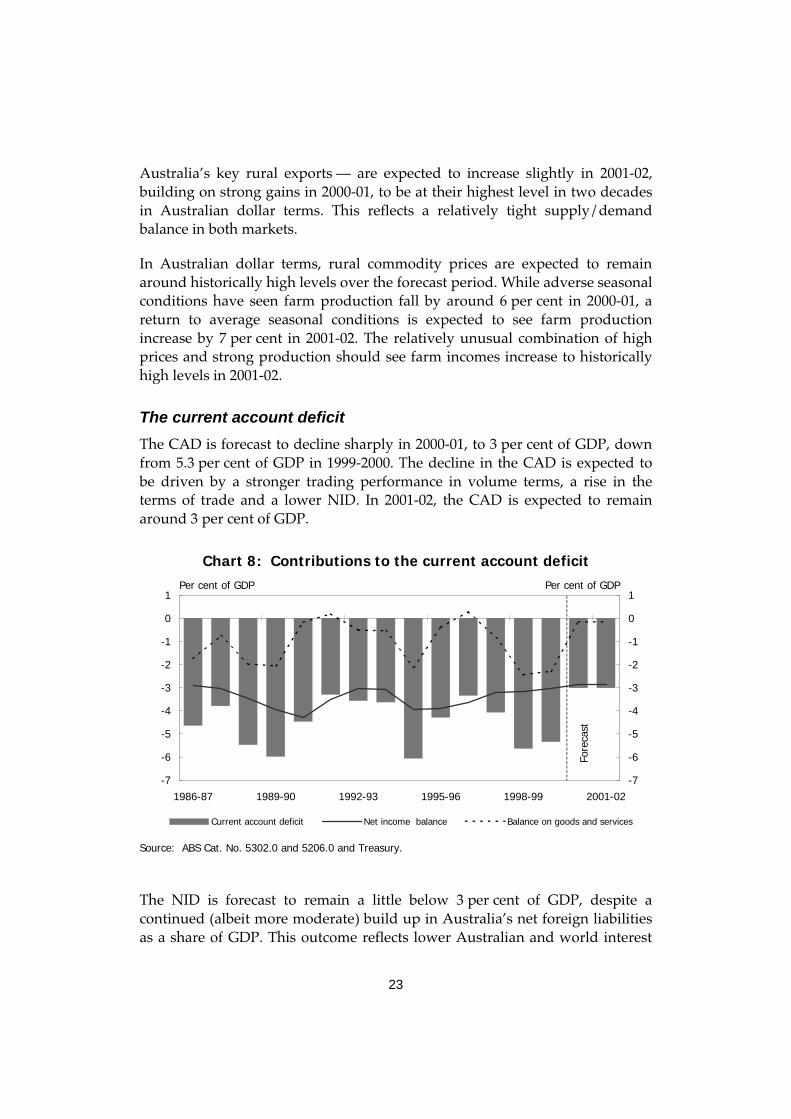
The current account deficit
The CAD is forecast to decline sharply in 2000-01, to 3 per cent of GDP, downfrom 5.3 per cent of GDP in 1999-2000. The decline in the CAD is expected tobe driven by a stronger trading performance in volume terms, a rise in theterms of trade and a lower NID. In 2001-02, the CAD is expected to remainaround 3 per cent of GDP.
Chart 8: Contributions to the current account deficit
-7
-6
-5
-4
-3
-2
-1
0
1
1986-87 1989-90 1992-93 1995-96 1998-99 2001-02-7
-6
-5
-4
-3
-2
-1
0
1
Current account deficit Net income balance Balance on goods and services
Fore
cast
Per cent of GDP Per cent of GDP
Source: ABS Cat. No. 5302.0 and 5206.0 and Treasury.
The NID is forecast to remain a little below 3 per cent of GDP, despite acontinued (albeit more moderate) build up in Australia’s net foreign liabilitiesas a share of GDP. This outcome reflects lower Australian and world interest
24
rates, and the significant narrowing in the difference between the yield onforeign investment in Australia and the yield on Australian investment abroadover recent years. Recent trends in the NID are discussed in more detail in theCentenary edition of the Economic Roundup.
The labour market
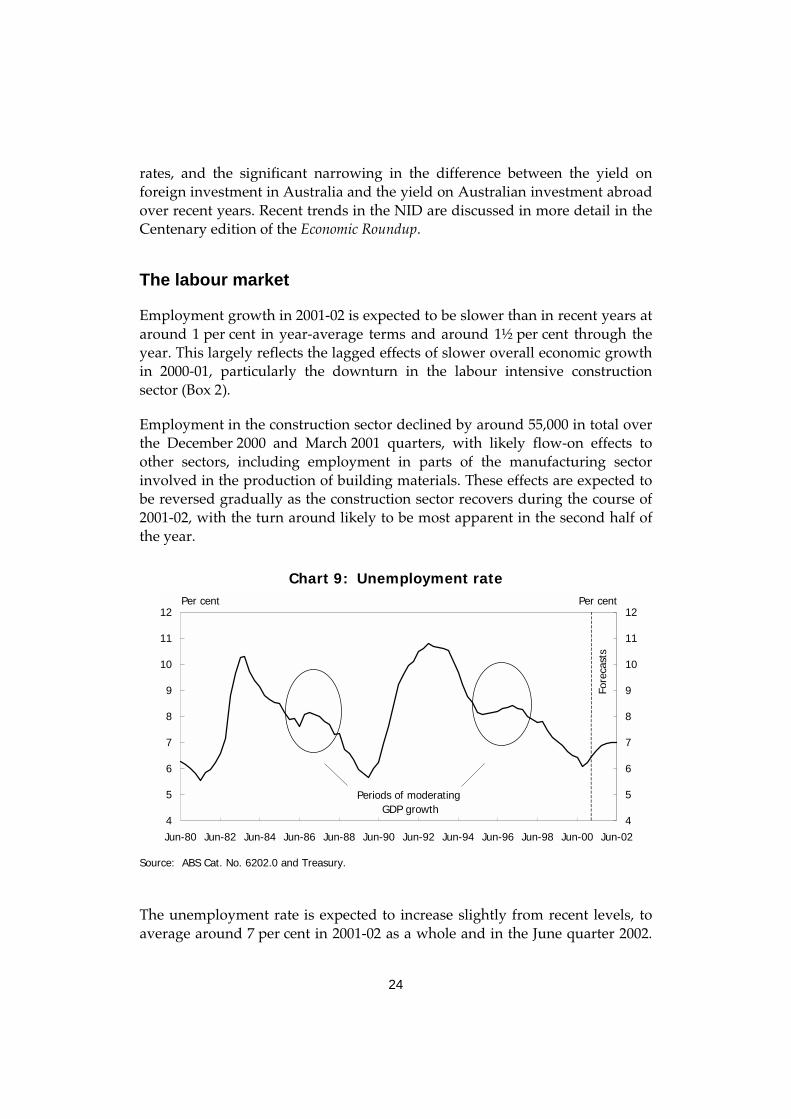
Employment growth in 2001-02 is expected to be slower than in recent years ataround 1 per cent in year-average terms and around 1½ per cent through theyear. This largely reflects the lagged effects of slower overall economic growthin 2000-01, particularly the downturn in the labour intensive constructionsector (Box 2).
Employment in the construction sector declined by around 55,000 in total overthe December 2000 and March 2001 quarters, with likely flow-on effects toother sectors, including employment in parts of the manufacturing sectorinvolved in the production of building materials. These effects are expected tobe reversed gradually as the construction sector recovers during the course of2001-02, with the turn around likely to be most apparent in the second half ofthe year.
Chart 9: Unemployment rate
4
5
6
7
8
9
10
11
12
Jun-80 Jun-82 Jun-84 Jun-86 Jun-88 Jun-90 Jun-92 Jun-94 Jun-96 Jun-98 Jun-00 Jun-024
5
6
7
8
9
10
11
12Fo
reca
sts
Per cent Per cent
Periods of moderating GDP growth
Source: ABS Cat. No. 6202.0 and Treasury.
The unemployment rate is expected to increase slightly from recent levels, toaverage around 7 per cent in 2001-02 as a whole and in the June quarter 2002.
25
Monthly data are likely to vary significantly around these averages. Recentfalls in the various job vacancy series suggest that weak employment outcomesare likely over coming months, which is expected to put some upwardpressure on the unemployment rate. However, as in previous short periods ofslower GDP growth (identified by the circled periods in Chart 9), the increasein the unemployment rate is expected to be relatively small and quite brief.Continued moderate growth in wages will help to limit the extent andduration of the rise in unemployment. Prospects are sound for a resumption ofthe downward trend in unemployment over the medium term as theconstruction sector recovers, overall economic growth strengthens and thebenefits from earlier labour market reforms and more general microeconomicreforms, including taxation reform, continue to accrue.
Productivity growth (on a heads basis) is forecast to reach a cyclical low in2000-01 before rebounding solidly in 2001-02 to 2¼ per cent. Some of thefactors likely to influence the medium-term trends in productivity arediscussed in Budget Paper No. 1, Statement 4.
26
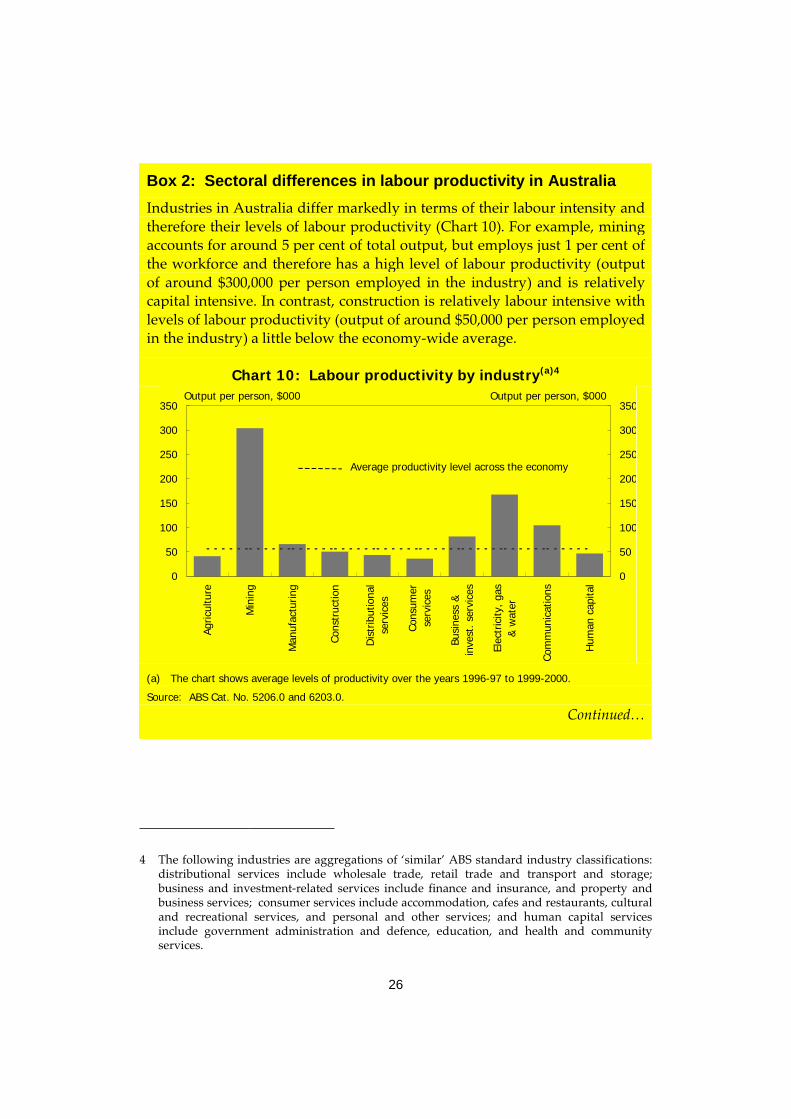
Box 2: Sectoral differences in labour productivity in Australia
Industries in Australia differ markedly in terms of their labour intensity andtherefore their levels of labour productivity (Chart 10). For example, miningaccounts for around 5 per cent of total output, but employs just 1 per cent ofthe workforce and therefore has a high level of labour productivity (outputof around $300,000 per person employed in the industry) and is relativelycapital intensive. In contrast, construction is relatively labour intensive withlevels of labour productivity (output of around $50,000 per person employedin the industry) a little below the economy-wide average.
Chart 10: Labour productivity by industry(a)4
0
50
100
150
200
250
300
350
Agric
ultu
re
Min
ing
Man
ufac
turin
g
Cons
truc
tion
Dis
trib
utio
nal
serv
ices
Cons
umer
serv
ices
Busi
ness
&in
vest
. ser
vice
s
Elec
tric
ity, g
as&
wat
er
Com
mun
icat
ions
Hum
an c
apita
l0
50
100
150
200
250
300
350Output per person, $000 Output per person, $000
Average productivity level across the economy
(a) The chart shows average levels of productivity over the years 1996-97 to 1999-2000.
Source: ABS Cat. No. 5206.0 and 6203.0.
Continued…
4 The following industries are aggregations of ‘similar’ ABS standard industry classifications:distributional services include wholesale trade, retail trade and transport and storage;business and investment-related services include finance and insurance, and property andbusiness services; consumer services include accommodation, cafes and restaurants, culturaland recreational services, and personal and other services; and human capital servicesinclude government administration and defence, education, and health and communityservices.
27
Box 2: Sectoral differences in labour productivity in Australia(continued)
In 2000-01, as the composition of economic activity shifted away fromrelatively labour intensive industries such as construction, and towardsrelatively capital intensive industries such as mining, the impact of theslower overall economic growth on the labour market was morepronounced. As the construction industry recovers during 2001-02, thiseffect will be unwound gradually.
Wages
Wages have continued to grow at a moderate pace in 2000-01, consistent withslower economic and employment growth and the moderate increase inunemployment. Importantly, there has been little evidence to date ofwidespread wage increases in response to price changes following theintroduction of The New Tax System.
Average earnings growth on a national accounts basis (AENA) is expected tobe a moderate 3½ per cent in 2000-01. Abstracting from the increase in thesuperannuation guarantee charge on 1 July 2000, AENA is expected to grow by3 per cent in 2000-01.
In 2001-02, growth in AENA is expected to increase to 3¾ per cent, as economicgrowth strengthens and is reflected in slightly firmer labour market outcomesas the year progresses. The forecast incorporates the recent ‘Living Wage Case’decision.
The pace of the pick up in economic activity and the timing of its impact on thelabour market represent a key source of uncertainty around the wages outlook.
While the introduction of The New Tax System does not appear to haveinfluenced wages growth to date, there remains a residual risk to wages overthe forecast period (for example, if union campaigns were to be successful).Recent enterprise bargaining data indicate that the proportion of employeescovered by agreements that include inflation-related clauses has increased.However, there is no rationale for higher wages to compensate for the priceeffects of The New Tax System, given the significant personal income tax cutsand increases in benefits contained in the package.

28
Prices
In 2000-01, ‘ongoing’ inflation (that is, inflation excluding the impact of TheNew Tax System) is expected to be around 3¼ per cent in both year-average andthrough-the-year terms. The increase in ‘ongoing’ inflation relative to the1999-2000 outcome of 2.4 per cent in year-average terms largely reflects theeffect of the increase in petrol prices over calendar year 2000.
The New Tax System is expected to increase the CPI by around 2½ per centthrough the year to the June quarter 2001, with this effect having been feltlargely in the September quarter 2000. Taking together the estimates of‘ongoing’ inflation and the impact of The New Tax System, the CPI is expectedto increase by 6 per cent in year-average terms in 2000-01 and by 5¾ per centthrough the year to the June quarter 2001.
The CPI increased by 1.1 per cent in the March quarter of 2001. This higherthan expected outcome largely reflected the effect of flooding in northern NewSouth Wales and southern Queensland on fruit and vegetable prices and theeffect of increased world demand for Australian meat products. The sharp risein fruit and vegetable prices is likely to be at least partly reversed in comingquarters as supply returns to more normal levels. There were also the usualseasonal increases in the price of education, pharmaceuticals and childcare.Petrol prices fell 3.7 per cent in the quarter, in response to lower world oilprices and the Government’s decision to reduce excise on petrol (and abolishindexation) in early March. Looking through these influences, the CPIincreased by a moderate 0.6 per cent in the March quarter, following the verylow increase of 0.3 per cent in the December quarter.
Inflation is forecast to decline in 2001-02, with the headline CPI rising byaround 2 per cent in both year-average and through-the-year terms. Theabolition of Financial Institutions Duty (FID) and other elements of TheNew Tax System will put downward pressure on consumer prices in 2001-02and the forecasts also incorporate an allowance for a slight easing in petrolprices in line with an expected downward trend in world oil prices. Wagesgrowth is expected to remain moderate, at around 3¾ per cent, helping toensure that growth in labour costs remains well contained. The inflationforecasts also make an allowance for some impact on consumer prices of thedecline in the Australian dollar over recent quarters.
Measures introduced as part of The New Tax System (including the abolition ofFID and stamp duty on marketable securities from 1 July 2001, as well as theearly introduction of input tax credits for motor vehicles) are expected toreduce the CPI by between a ¼ and a ½ of a percentage point in both
29
year-average and through-the-year terms. Leaving aside this effect, ‘ongoing’inflation is expected to be around 2¼ per cent in the year to the June quarter2002.
A number of key uncertainties surround the inflation outlook, particularly for2001-02. If world oil prices or the value of the Australian dollar differsubstantially from their assumed levels, this could pose risks to the inflationforecasts on both sides. The inflation forecasts are also based on the historicalpass-through from exchange rates into the CPI. However, in recent years,exchange rate movements appear to have had less impact on the CPI than wasthe case on average over recent decades. If this reduced pass-through from theexchange rate to the CPI were to continue, inflation could be lower thanforecast.

30
Part IV: Uncertainties
From a domestic perspective, a key uncertainty relates to the possibility thatthe recent downward trend in business and consumer sentiment is sustainedover coming quarters. While the relationship between business and consumersentiment measures and actual growth outcomes can be loose, if the recentfalls in these measures were sustained there may be downside risk to theforecasts for business investment and consumption.
On the other hand, there is a possibility that the lower dollar and lower interestrates will provide a greater stimulus to economic growth than has beenincorporated into the forecasts. There is also the potential for stronger thanforecast investment and consumption in 2001-02 if business and consumerconfidence were to rebound sharply from their current levels.
The dwelling sector is expected to rebound strongly in 2001-02, although, thereis a greater than normal degree of uncertainty surrounding the timing andextent of this recovery. In particular, while the Government’s more generousFirst Home Owners Scheme and the recent reductions in interest rates shouldprovide a significant boost to activity in the sector, the timing and magnitudeof this boost is difficult to assess.
The key international uncertainty is how the US economy will evolve over thenext few quarters. The most likely outcome is that growth will slow in the firsthalf of 2001 as excess inventories are unwound and excess capacity is paredback, but will pick up quickly once the adjustment is complete. In this case theimpact on the rest of the world would be relatively mild and transitory.However, if falls in consumer and business confidence were to translate intoweaker demand then the deterioration in confidence would likely becomeself-reinforcing and the outcome would be a deeper and more prolongedperiod of weakness than currently envisaged.
Japan and the non-Japan East Asian region would be adversely affected if asharp and severe downturn in the US were to occur. The Japanese economyhas been weak for some time, unable to gather momentum despite substantialfiscal stimulus. With short-term policy options now limited and unresolvedproblems in the financial and corporate sectors continuing to weigh heavily onconsumer and business sentiment, Japan is exposed to any furtherdeterioration in global economic conditions. Weaker external demand wouldsee a further erosion of confidence and increase the chance that the economywould fall back into recession.

31
A sharper than forecast slowdown in the US and in Japan would adverselyaffect several regions, but especially non-Japan East Asia. Asian economieshave relied heavily on export-led growth to support recovery over the past fewyears and are vulnerable to a broad based slowdown in global demand. TheAsian economies have also become increasingly integrated with the USeconomy through the information technology production chain, and areexposed to a weaker US economy through this channel. With several Asianeconomies facing domestic problems and further progress on structuralreforms necessary to strengthen their resilience to external shocks, there is arisk of substantial spillover effects in the region if economic conditions eitherin the US or Japan were to deteriorate substantially. However, the lowerinterest rates provide some relief and the gradual decline in oil prices is alsohelpful for oil importing countries.
A significant slowdown in the US economy, combined with weaker growth inEast Asia would result in a more broadly based global slowdown. This wouldtranslate into some downside risk to the outlook for Australia’s export growth,especially in 2001-02 and hence represents a downside risk to the outlook forAustralia’s GDP growth in that year.