Embed Size (px)
Citation preview
State/Local Public State/Local Public Health Planning Health Planning
RetreatRetreatOctober 2, 2008October 2, 2008
Pre-meeting Survey ResultsPre-meeting Survey Results
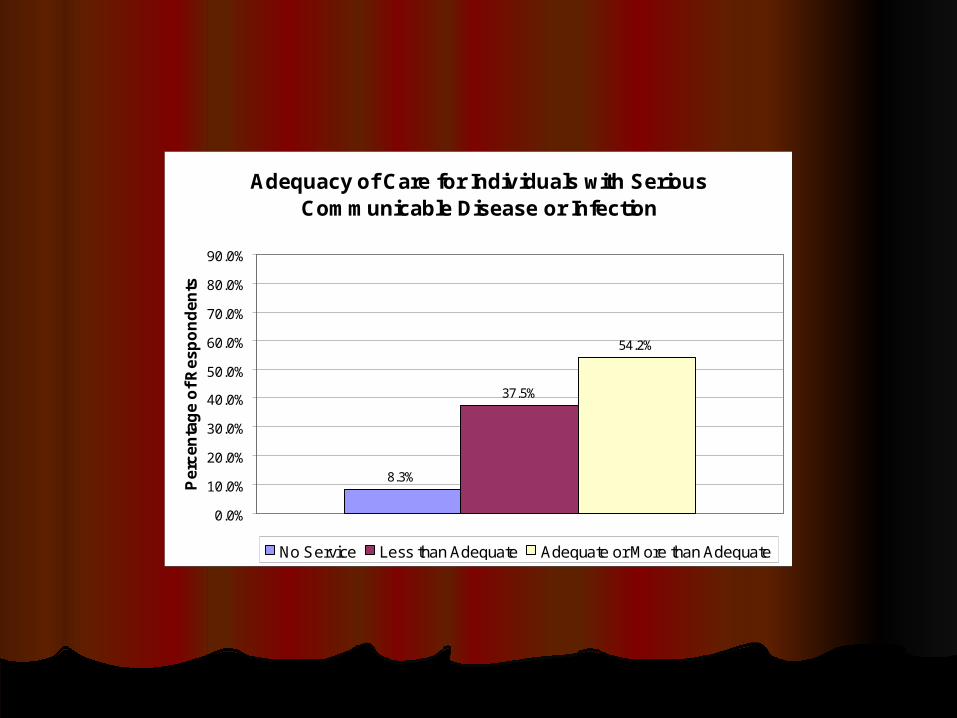
Adequacy of Care for Individuals with Serious Communicable Disease or Infection
8.3%
37.5%
54.2%
0.0%
10.0%
20.0%
30.0%
40.0%
50.0%
60.0%
70.0%
80.0%
90.0%
Pe
rce
nta
ge
of
Re
sp
on
de
nts
No Service Less than Adequate Adequate or More than Adequate
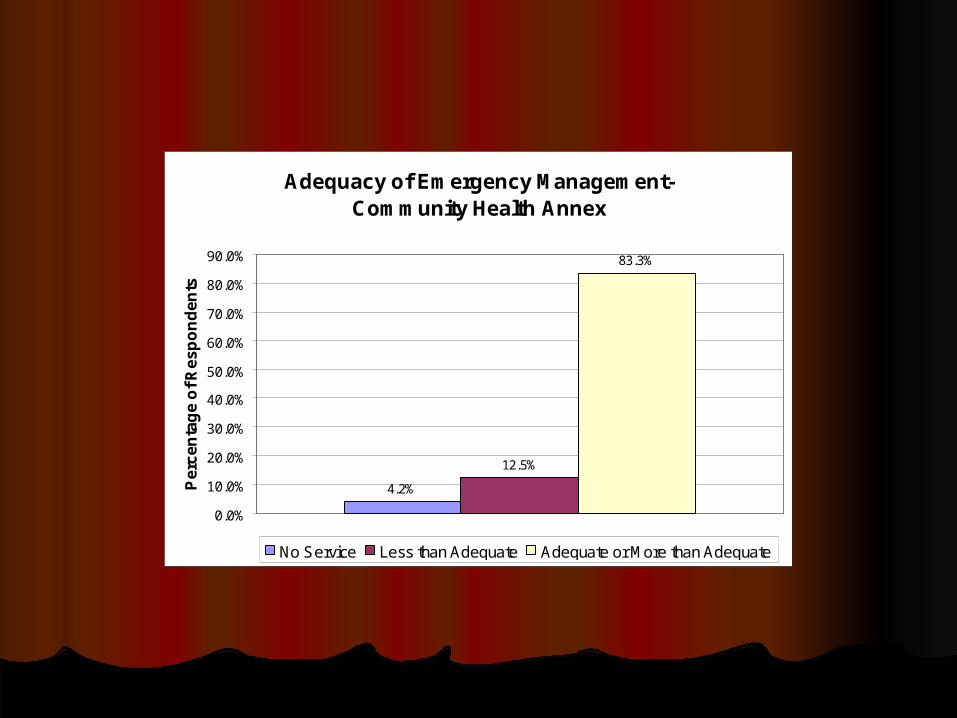
Adequacy of Emergency Management-Community Health Annex
4.2%
12.5%
83.3%
0.0%
10.0%
20.0%
30.0%
40.0%
50.0%
60.0%
70.0%
80.0%
90.0%
Pe
rce
nta
ge
of
Re
sp
on
de
nts
No Service Less than Adequate Adequate or More than Adequate
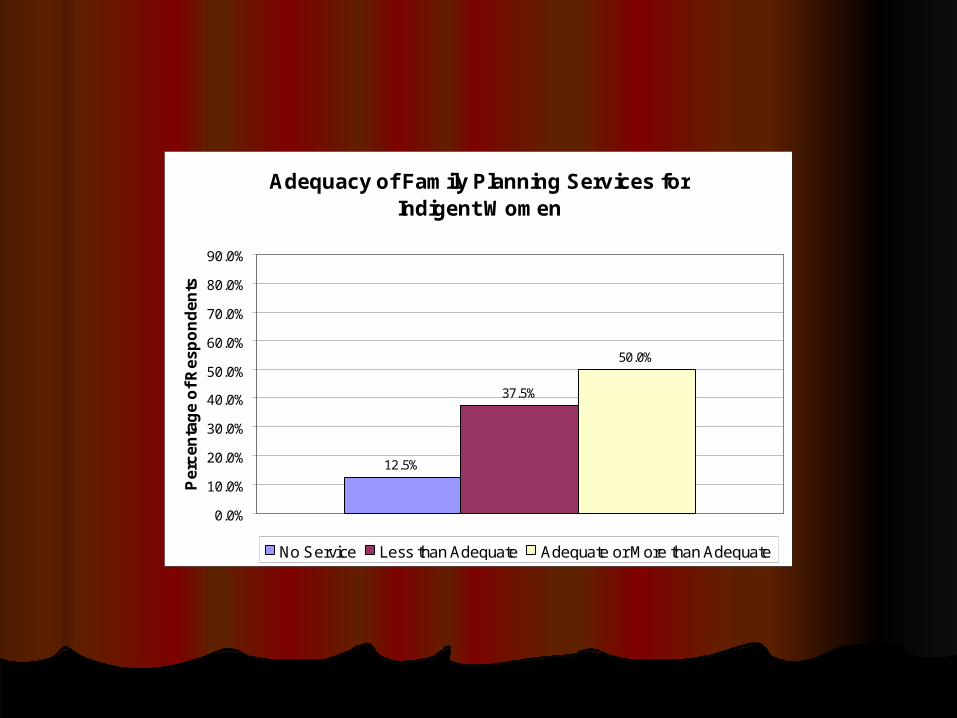
Adequacy of Family Planning Services for Indigent Women
12.5%
37.5%
50.0%
0.0%
10.0%
20.0%
30.0%
40.0%
50.0%
60.0%
70.0%
80.0%
90.0%
Pe
rce
nta
ge
of
Re
sp
on
de
nts
No Service Less than Adequate Adequate or More than Adequate
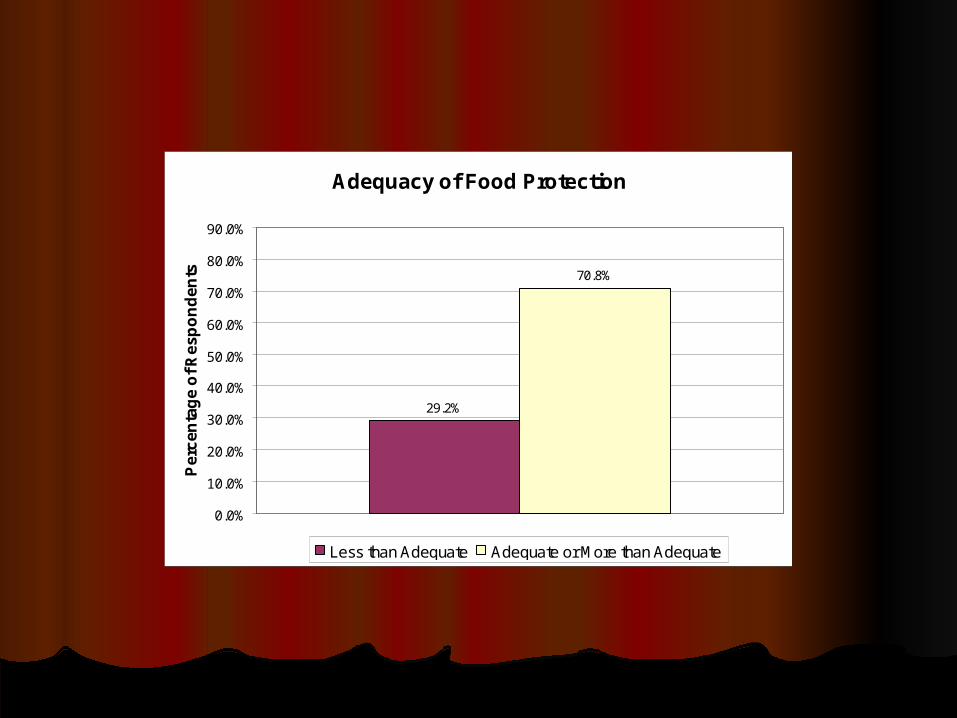
Adequacy of Food Protection
29.2%
70.8%
0.0%
10.0%
20.0%
30.0%
40.0%
50.0%
60.0%
70.0%
80.0%
90.0%
Pe
rce
nta
ge
of
Re
sp
on
de
nts
Less than Adequate Adequate or More than Adequate
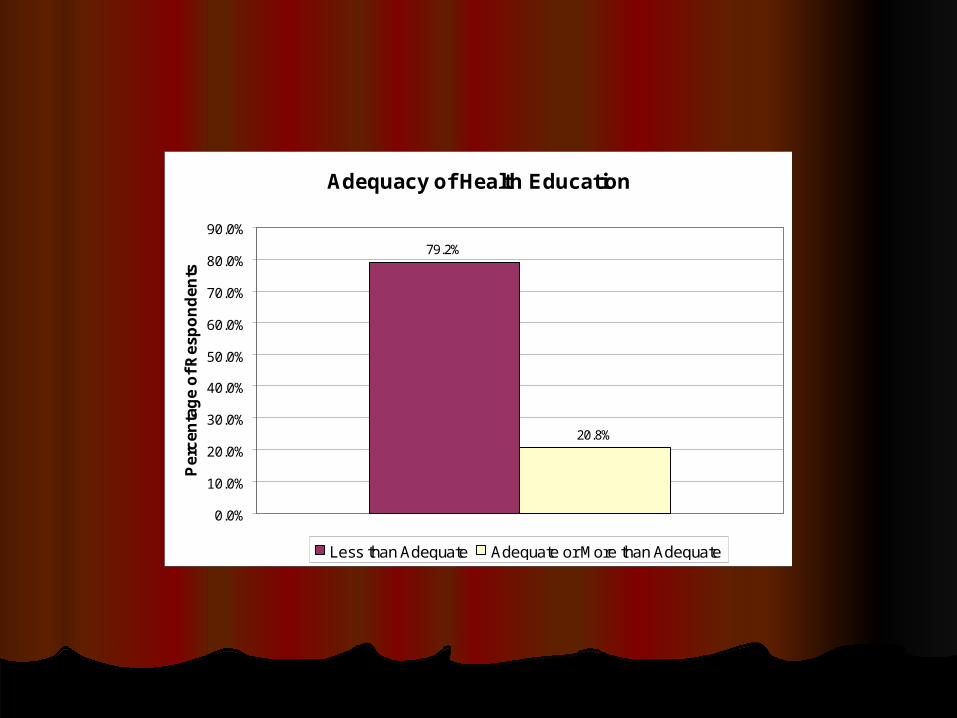
Adequacy of Health Education
79.2%
20.8%
0.0%
10.0%
20.0%
30.0%
40.0%
50.0%
60.0%
70.0%
80.0%
90.0%
Pe
rce
nta
ge
of
Re
sp
on
de
nts
Less than Adequate Adequate or More than Adequate
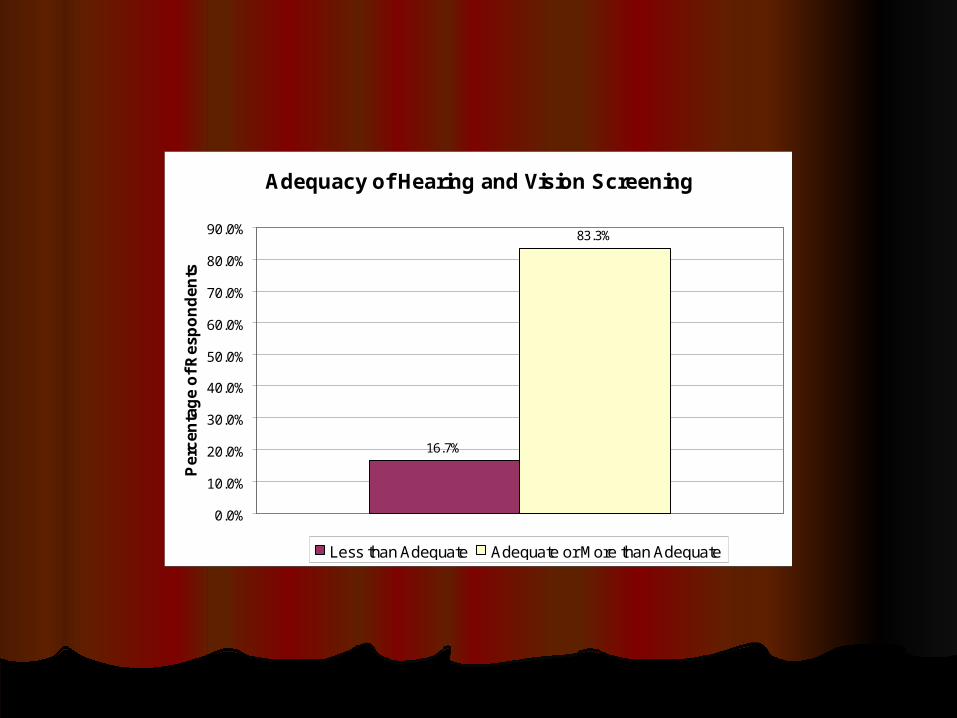
Adequacy of Hearing and Vision Screening
16.7%
83.3%
0.0%
10.0%
20.0%
30.0%
40.0%
50.0%
60.0%
70.0%
80.0%
90.0%
Pe
rce
nta
ge
of
Re
sp
on
de
nts
Less than Adequate Adequate or More than Adequate

Adequacy of HIV/AIDS Services: Reporting, Counseling, and Partner Notification
16.7%
41.7% 41.7%
0.0%
10.0%
20.0%
30.0%
40.0%
50.0%
60.0%
70.0%
80.0%
90.0%
Pe
rce
nta
ge
of
Re
sp
on
de
nts
No Service Less than Adequate Adequate or More than Adequate
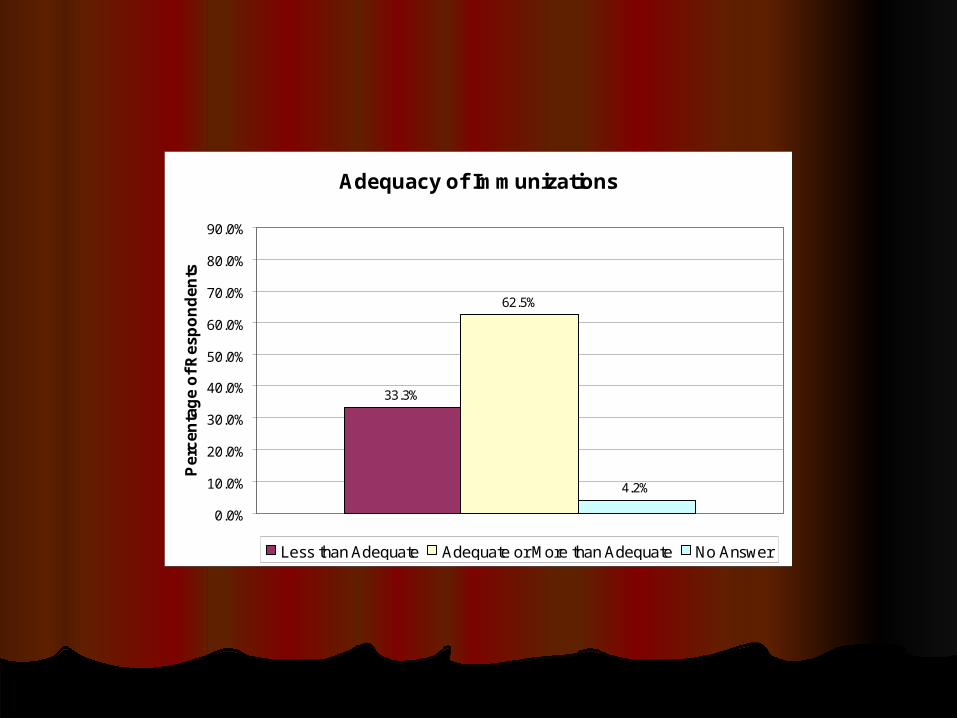
Adequacy of Immunizations
33.3%
62.5%
4.2%
0.0%
10.0%
20.0%
30.0%
40.0%
50.0%
60.0%
70.0%
80.0%
90.0%
Pe
rce
nta
ge
of
Re
sp
on
de
nts
Less than Adequate Adequate or More than Adequate No Answer
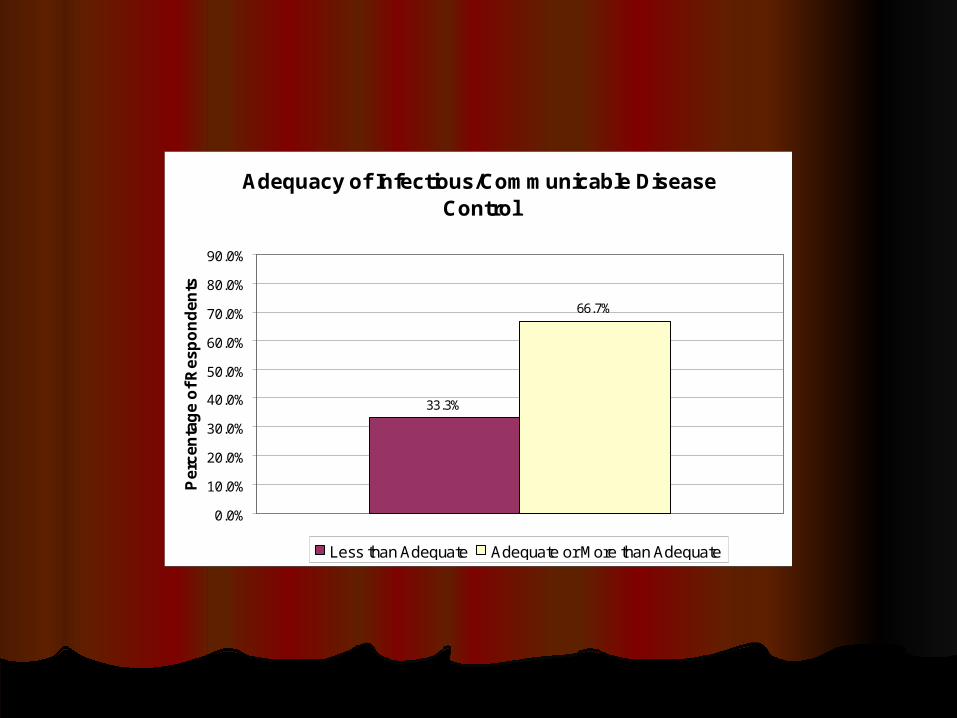
Adequacy of Infectious/Communicable Disease Control
33.3%
66.7%
0.0%
10.0%
20.0%
30.0%
40.0%
50.0%
60.0%
70.0%
80.0%
90.0%
Pe
rce
nta
ge
of
Re
sp
on
de
nts
Less than Adequate Adequate or More than Adequate
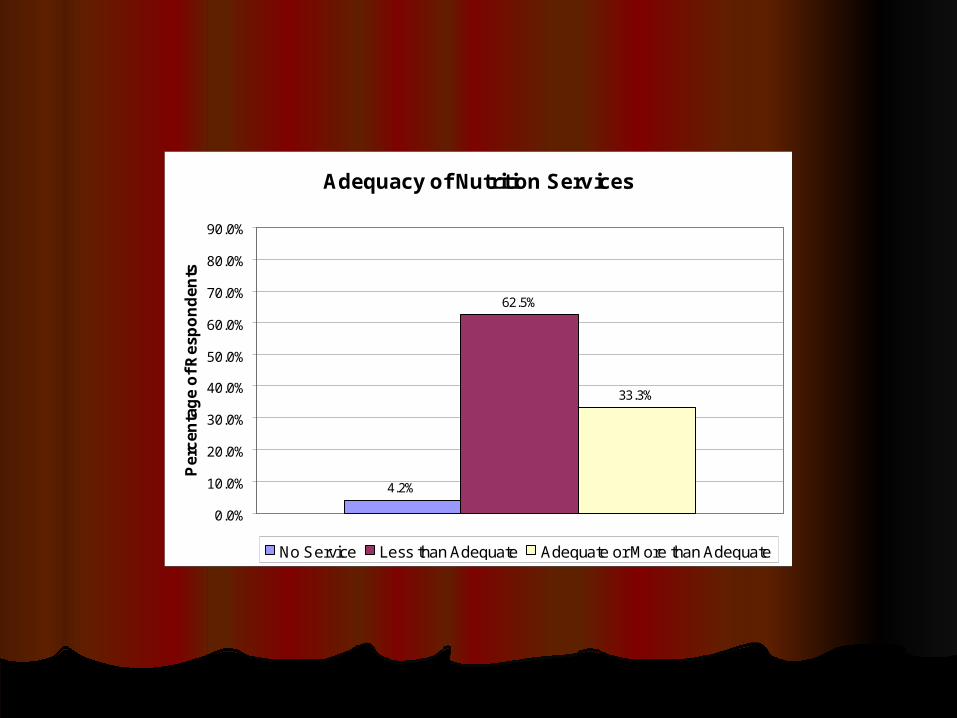
Adequacy of Nutrition Services
4.2%
62.5%
33.3%
0.0%
10.0%
20.0%
30.0%
40.0%
50.0%
60.0%
70.0%
80.0%
90.0%
Pe
rce
nta
ge
of
Re
sp
on
de
nts
No Service Less than Adequate Adequate or More than Adequate
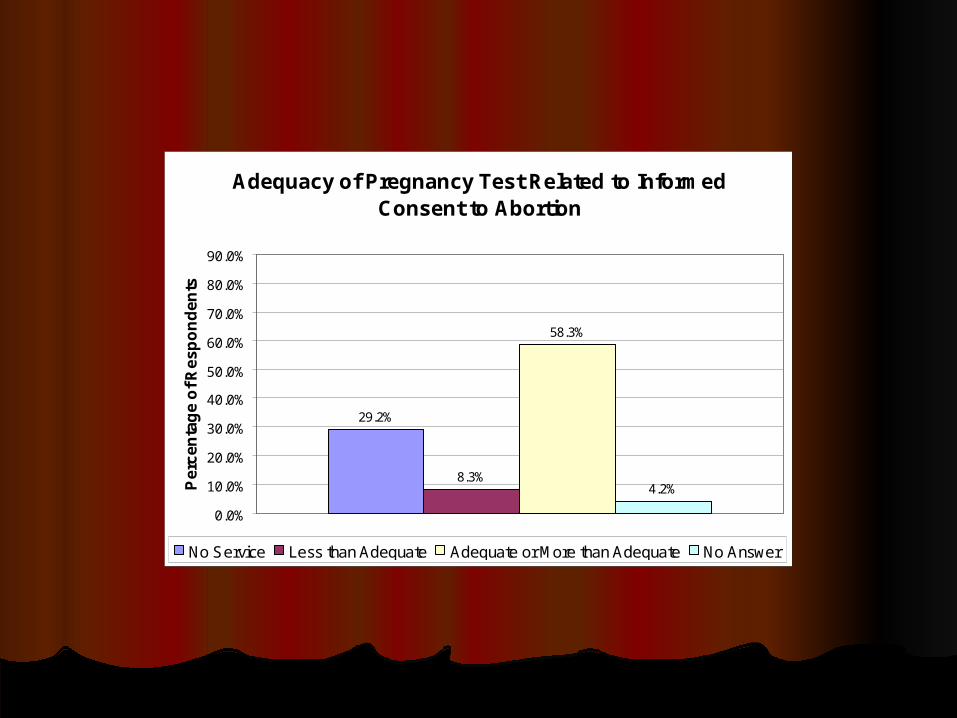
Adequacy of Pregnancy Test Related to Informed Consent to Abortion
29.2%
8.3%
58.3%
4.2%
0.0%
10.0%
20.0%
30.0%
40.0%
50.0%
60.0%
70.0%
80.0%
90.0%
Pe
rce
nta
ge
of
Re
sp
on
de
nts
No Service Less than Adequate Adequate or More than Adequate No Answer
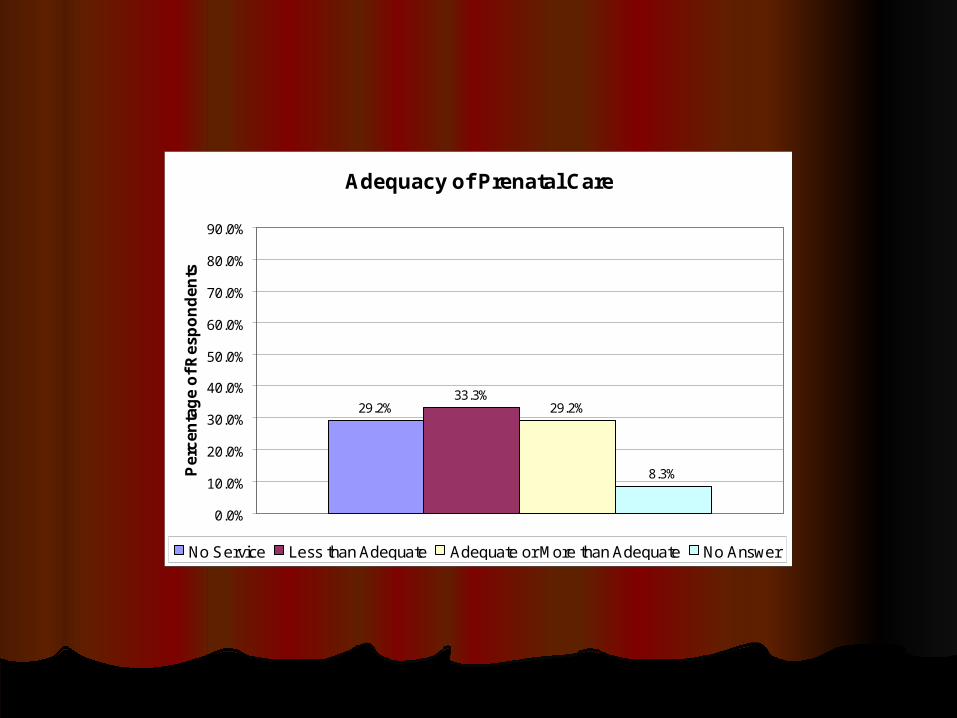
Adequacy of Prenatal Care
29.2%33.3%
29.2%
8.3%
0.0%
10.0%
20.0%
30.0%
40.0%
50.0%
60.0%
70.0%
80.0%
90.0%
Pe
rce
nta
ge
of
Re
sp
on
de
nts
No Service Less than Adequate Adequate or More than Adequate No Answer
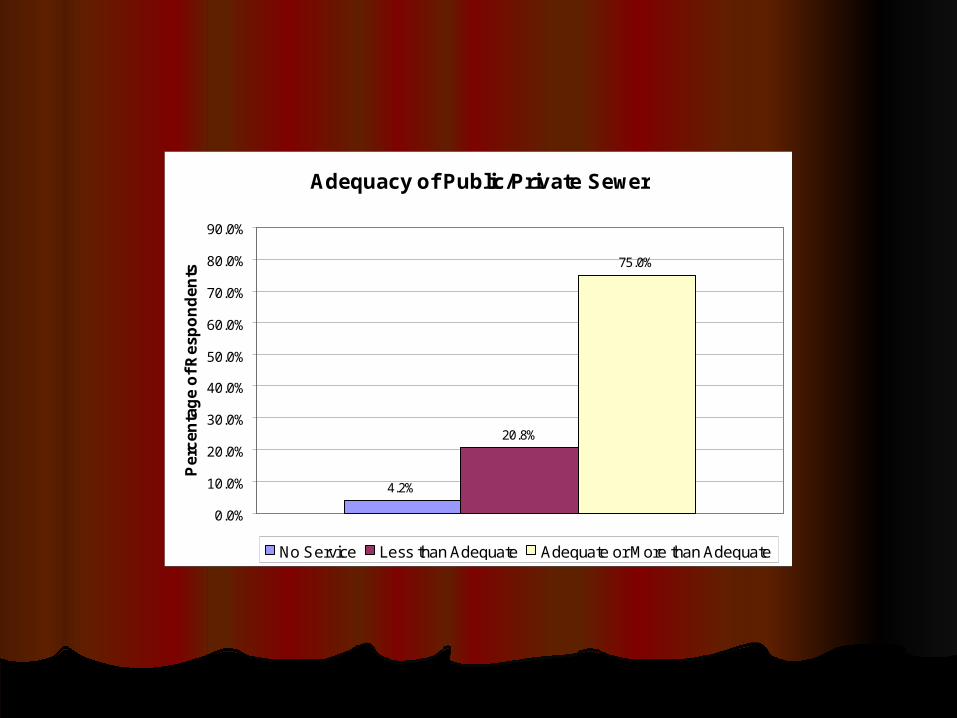
Adequacy of Public/Private Sewer
4.2%
20.8%
75.0%
0.0%
10.0%
20.0%
30.0%
40.0%
50.0%
60.0%
70.0%
80.0%
90.0%
Pe
rce
nta
ge
of
Re
sp
on
de
nts
No Service Less than Adequate Adequate or More than Adequate
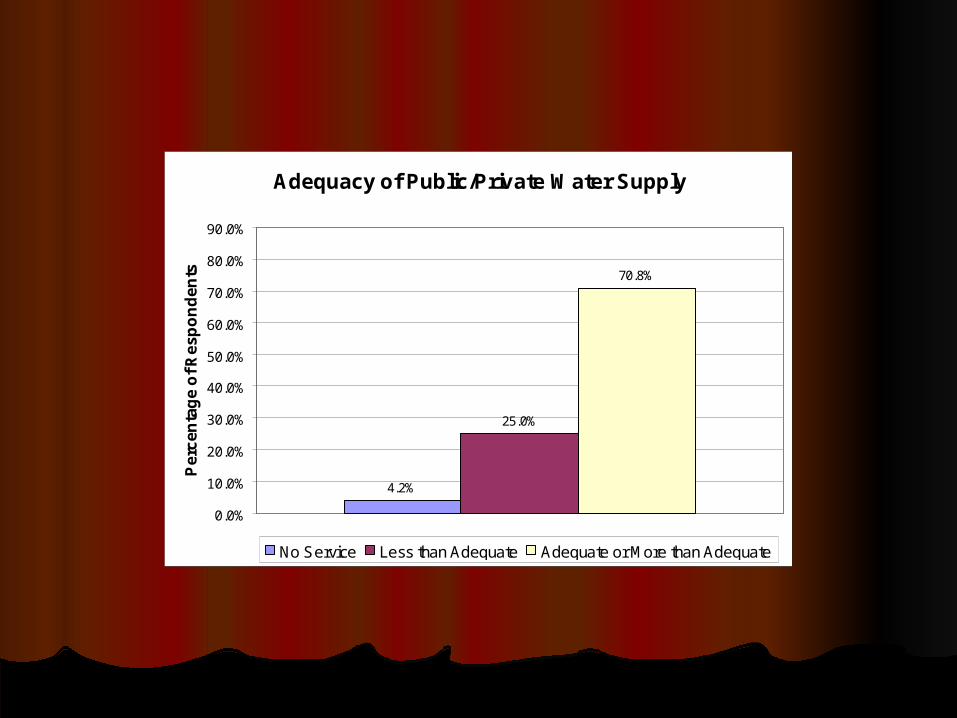
Adequacy of Public/Private Water Supply
4.2%
25.0%
70.8%
0.0%
10.0%
20.0%
30.0%
40.0%
50.0%
60.0%
70.0%
80.0%
90.0%
Pe
rce
nta
ge
of
Re
sp
on
de
nts
No Service Less than Adequate Adequate or More than Adequate
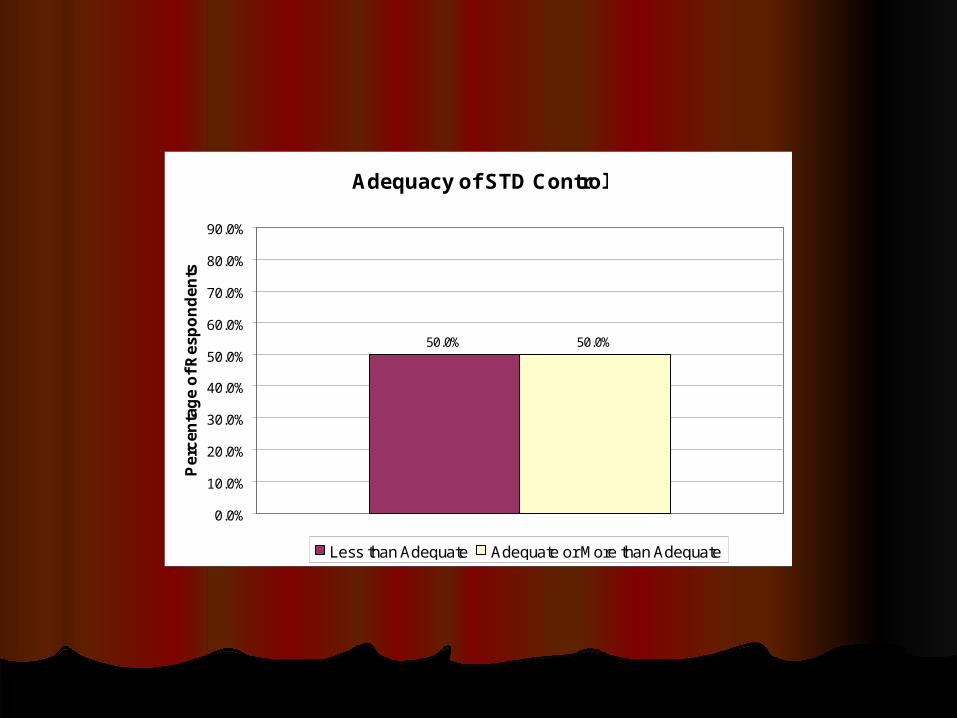
Adequacy of STD Control
50.0% 50.0%
0.0%
10.0%
20.0%
30.0%
40.0%
50.0%
60.0%
70.0%
80.0%
90.0%
Pe
rce
nta
ge
of
Re
sp
on
de
nts
Less than Adequate Adequate or More than Adequate
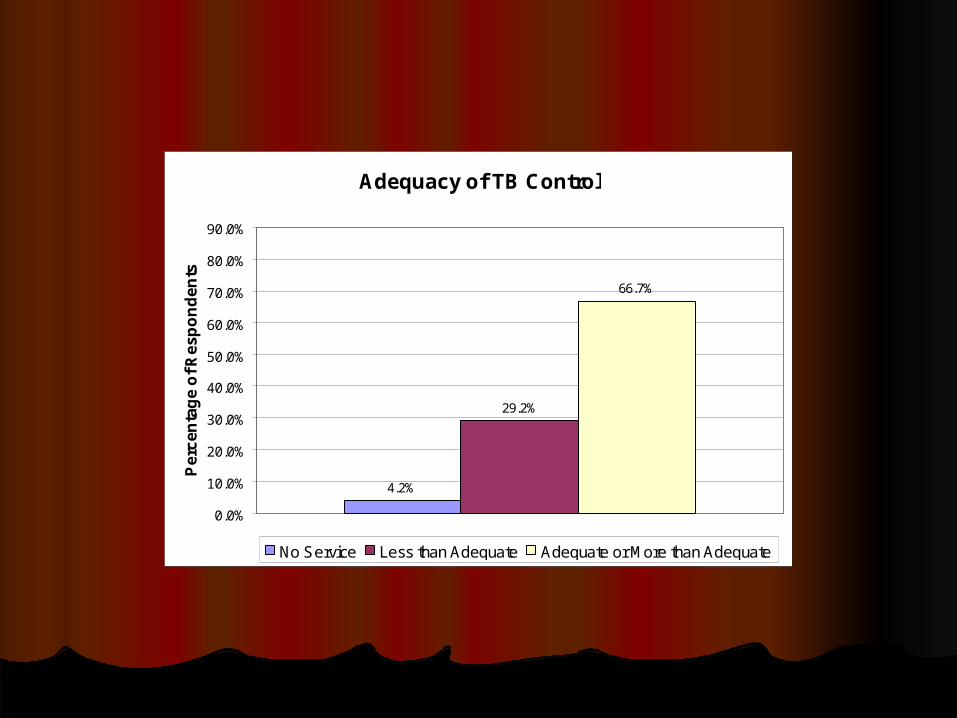
Adequacy of TB Control
4.2%
29.2%
66.7%
0.0%
10.0%
20.0%
30.0%
40.0%
50.0%
60.0%
70.0%
80.0%
90.0%
Pe
rce
nta
ge
of
Re
sp
on
de
nts
No Service Less than Adequate Adequate or More than Adequate
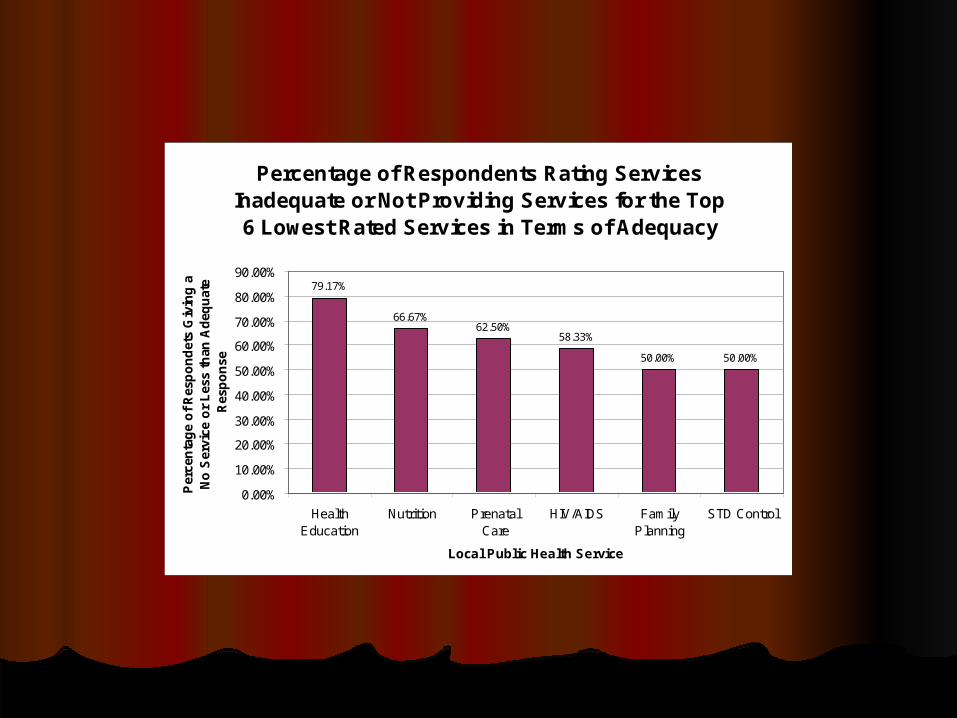
Percentage of Respondents Rating Services Inadequate or Not Providing Services for the Top 6 Lowest Rated Services in Terms of Adequacy
79.17%
66.67%62.50%
58.33%
50.00% 50.00%
0.00%
10.00%
20.00%
30.00%
40.00%
50.00%
60.00%
70.00%
80.00%
90.00%
HealthEducation
Nutrition PrenatalCare
HIV/AIDS FamilyPlanning
STD Control
Local Public Health Service
Per
cen
tag
e o
f R
esp
on
det
s G
ivin
g a
N
o S
ervi
ce o
r L
ess
than
Ad
equ
ate
Res
po
nse
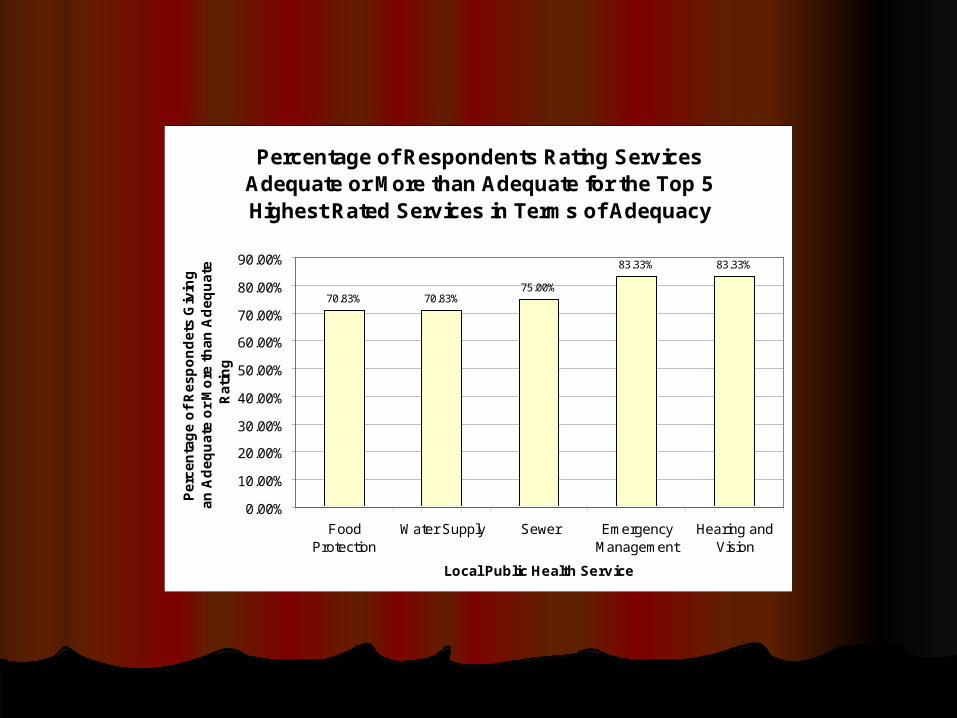
Percentage of Respondents Rating Services Adequate or More than Adequate for the Top 5 Highest Rated Services in Terms of Adequacy
70.83% 70.83%75.00%
83.33% 83.33%
0.00%
10.00%
20.00%
30.00%
40.00%
50.00%
60.00%
70.00%
80.00%
90.00%
FoodProtection
Water Supply Sewer EmergencyManagement
Hearing andVision
Local Public Health Service
Pe
rce
nta
ge
of
Re
sp
on
de
ts G
ivin
g
an
Ad
eq
ua
te o
r M
ore
th
an
Ad
eq
ua
te
Ra
tin
g
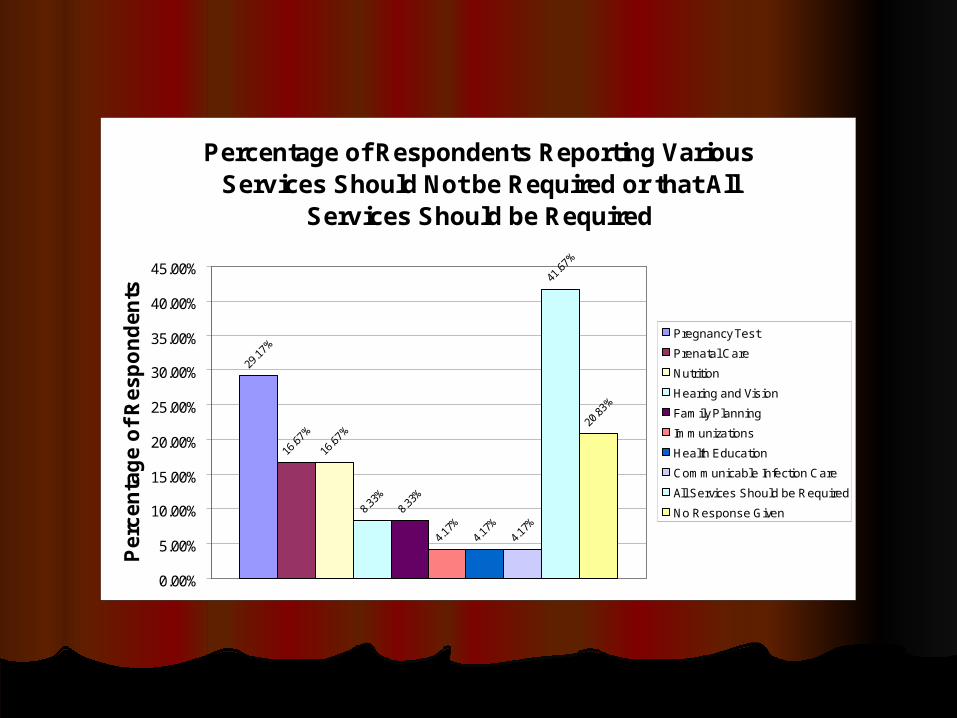
Percentage of Respondents Reporting Various Services Should Not be Required or that All
Services Should be Required
29.1
7%
16.6
7%
16.6
7%
8.33
%8.
33%
4.17
%4.
17%
4.17
%
41.6
7%
20.8
3%
0.00%
5.00%
10.00%
15.00%
20.00%
25.00%
30.00%
35.00%
40.00%
45.00%
Pe
rce
nta
ge
of
Re
sp
on
de
nts
Pregnancy Test
Prenatal Care
Nutrition
Hearing and Vision
Family Planning
Immunizations
Health Education
Communicable Infection Care
All Services Should be Required
No Response Given
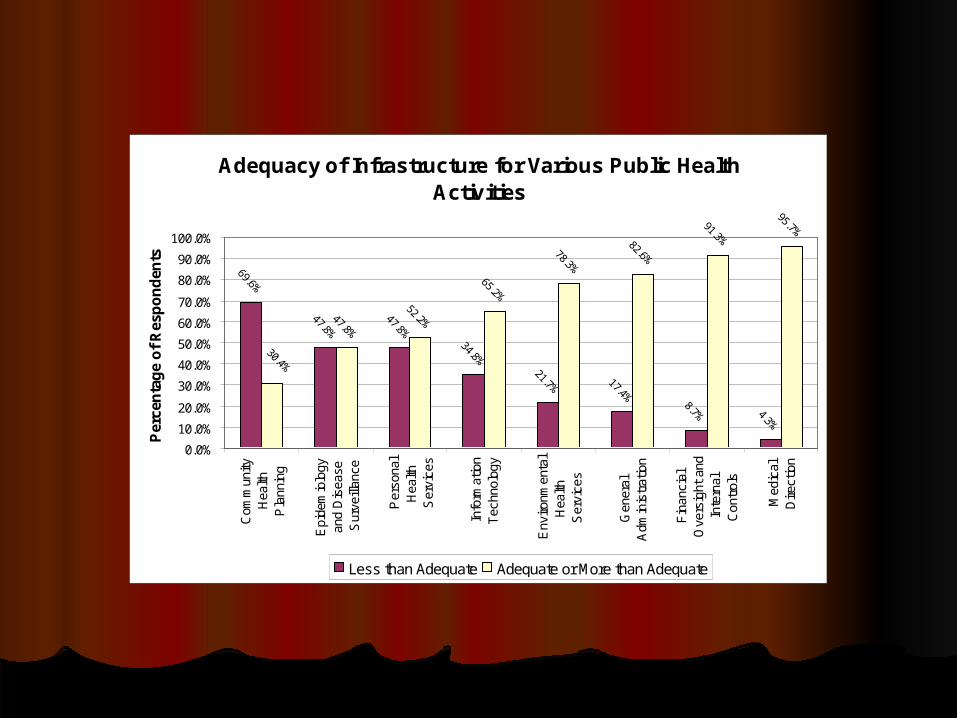
Adequacy of Infrastructure for Various Public Health Activities
69.6%
47.8%
47.8%
34.8%
21.7% 17.4%
8.7% 4.3%
47.8%
52.2%
65.2%
78.3%
82.6%
91.3%
95.7%
30.4%
0.0%
10.0%
20.0%
30.0%
40.0%
50.0%
60.0%
70.0%
80.0%
90.0%
100.0%C
omm
unity
Hea
lthP
lann
ing
Epi
dem
iolo
gyan
d D
isea
seS
urve
illan
ce
Per
sona
lH
ealth
Ser
vice
s
Info
rmat
ion
Tec
hnol
ogy
Env
ironm
enta
lH
ealth
Ser
vice
s
Gen
eral
Adm
inis
trat
ion
Fin
anci
alO
vers
ight
and
Inte
rnal
Con
trol
s
Med
ical
Dire
ctio
n
Per
cen
tag
e o
f R
esp
on
den
ts
Less than Adequate Adequate or More than Adequate
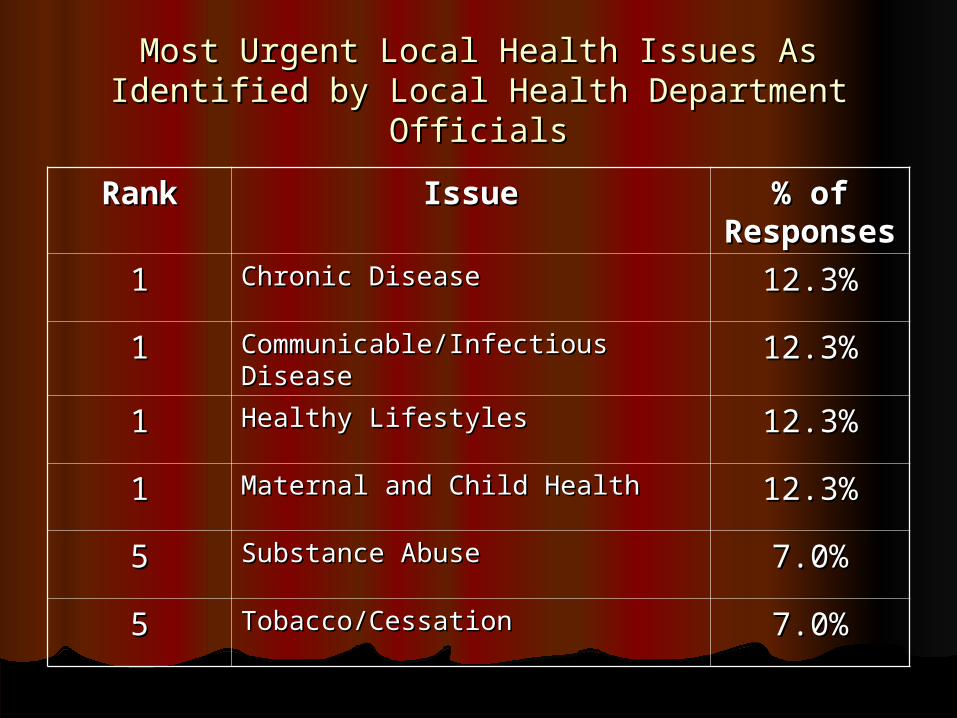
Most Urgent Local Health Issues As Identified by Most Urgent Local Health Issues As Identified by Local Health Department OfficialsLocal Health Department Officials
RankRank IssueIssue % of % of ResponseResponse
ss
11 Chronic DiseaseChronic Disease 12.3%12.3%
11 Communicable/Infectious DiseaseCommunicable/Infectious Disease 12.3%12.3%
11 Healthy LifestylesHealthy Lifestyles 12.3%12.3%
11 Maternal and Child HealthMaternal and Child Health 12.3%12.3%
55 Substance AbuseSubstance Abuse 7.0%7.0%
55 Tobacco/CessationTobacco/Cessation 7.0%7.0%
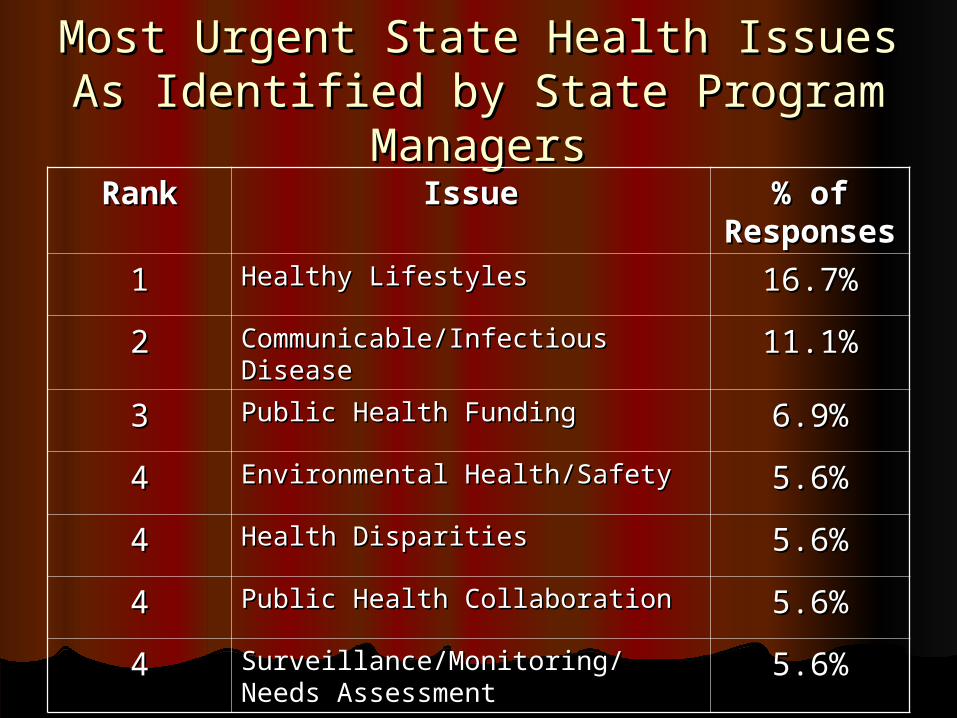
Most Urgent State Health Issues As Most Urgent State Health Issues As Identified by State Program Identified by State Program
ManagersManagersRankRank IssueIssue % of % of
ResponseResponsess
11 Healthy LifestylesHealthy Lifestyles 16.7%16.7%
22 Communicable/Infectious DiseaseCommunicable/Infectious Disease 11.1%11.1%
33 Public Health FundingPublic Health Funding 6.9%6.9%
44 Environmental Health/SafetyEnvironmental Health/Safety 5.6%5.6%
44 Health DisparitiesHealth Disparities 5.6%5.6%
44 Public Health CollaborationPublic Health Collaboration 5.6%5.6%
44 Surveillance/Monitoring/Needs Surveillance/Monitoring/Needs AssessmentAssessment
5.6%5.6%
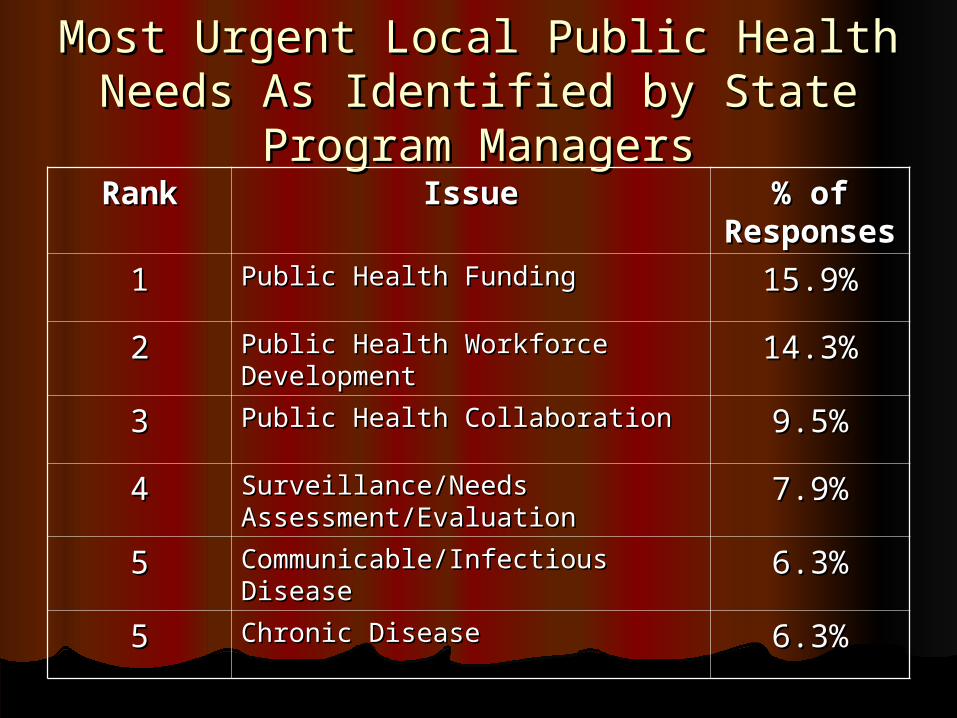
Most Urgent Local Public Health Most Urgent Local Public Health Needs As Identified by State Needs As Identified by State
Program ManagersProgram ManagersRankRank IssueIssue % of % of
ResponseResponsess
11 Public Health FundingPublic Health Funding 15.9%15.9%
22 Public Health Workforce Public Health Workforce DevelopmentDevelopment
14.3%14.3%
33 Public Health CollaborationPublic Health Collaboration 9.5%9.5%
44 Surveillance/Needs Surveillance/Needs Assessment/EvaluationAssessment/Evaluation
7.9%7.9%
55 Communicable/Infectious DiseaseCommunicable/Infectious Disease 6.3%6.3%
55 Chronic DiseaseChronic Disease 6.3%6.3%