Embed Size (px)
Citation preview

BOARD ofGOVERNORS State University System of Florida 1www.flbog.edu
BOARD ofGOVERNORSState University System of Florida
Gap Analysis for Health Occupations:Methods and Initial Figures
Amy Beaven, Director for STEM and Health Initiatives January 21, 2015
www.flbog.edu

BOARD ofGOVERNORS State University System of Florida 2www.flbog.edu
Part 1. Background and Purpose
Part 2.Which Health Occupations are Undersupplied?
• Gap Analysis Methodology• Initial Figures
Part 3.Which Health Occupations are Emerging or Evolving?
• Identifying Demand Shifts• Three Professional Practice Doctorates
Gap Analysis: Workshop Agenda
www.flbog.edu BOARD ofGOVERNORS State University System of Florida 3
The Health Initiatives Committee year-long three-pronged Environmental Scan:
1. Health Care Delivery
2. Health-related Research
3. Health Programs and Workforce Demand
Part 1. Background and Purpose

www.flbog.edu BOARD ofGOVERNORS State University System of Florida 4
The Initial StepsFollows gap analysis methods established by the Commission on Higher Education Access and Attainment
Additional Steps are Still Necessary
Part 2. Which Occupations are Undersupplied?

www.flbog.edu BOARD ofGOVERNORS State University System of Florida 5
Introduction to the Commission’s Gap Analysis
Supply DemandGap
AnalysisContextual
Metricsvs.

www.flbog.edu BOARD ofGOVERNORS State University System of Florida 6
Gap Analysis Methodology: Supply
vs.Supply DemandGap
AnalysisContextual
Metrics
• SOURCE: Supply is based on 2012-13 degrees awarded data as reported by 402 Florida institutions to the National Center for Education Statistics.
• PRIOR LIMITATION: The Commission’s methodology includes all graduates, including those who left Florida. Since the Commission’s work, additional data has become available to estimate out-migration.
• LIMITATION: The methodology currently does not include any consideration of occupational in-migration, occupational retention, and attrition.
www.flbog.edu BOARD ofGOVERNORS State University System of Florida 7
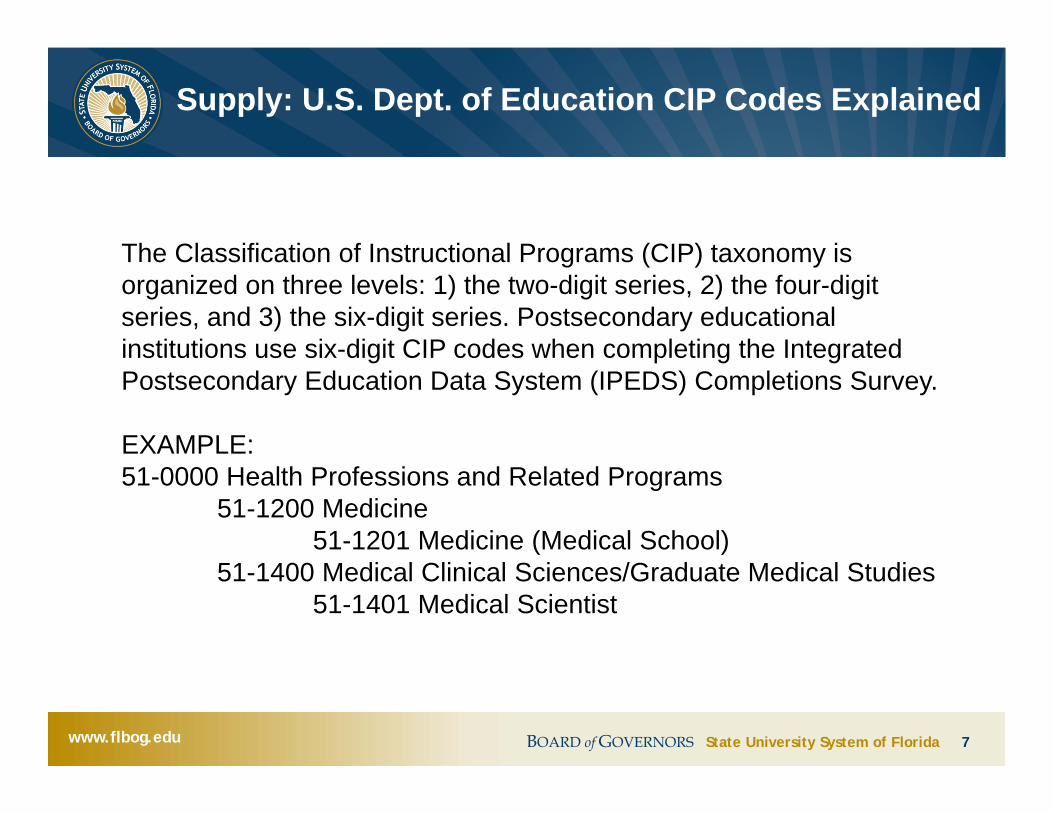
The Classification of Instructional Programs (CIP) taxonomy is organized on three levels: 1) the two-digit series, 2) the four-digit series, and 3) the six-digit series. Postsecondary educational institutions use six-digit CIP codes when completing the Integrated Postsecondary Education Data System (IPEDS) Completions Survey.
EXAMPLE:51-0000 Health Professions and Related Programs
51-1200 Medicine51-1201 Medicine (Medical School)
51-1400 Medical Clinical Sciences/Graduate Medical Studies51-1401 Medical Scientist
Supply: U.S. Dept. of Education CIP Codes Explained

www.flbog.edu BOARD ofGOVERNORS State University System of Florida 8
Supply DemandGap
AnalysisContextual
Metrics
Gap Analysis Methodology: Demand
vs.
• SOURCE: Demand is based on the long-term (2014-2022) occupational employment projections of annual job openings (growth and replacements) by the Florida Department of Economic Opportunity (DEO) Labor Market Statistics Center.
• KEY DECISION: Previously, the Commission on Access and Attainment agreed that the educational attainment levels for the occupational data would be based on the Bureau of Labor Statistics (BLS) national taxonomy of educational levels.

www.flbog.edu BOARD ofGOVERNORS State University System of Florida 9
Demand: U.S. Dept. of Labor SOC Codes Explained
Standard Occupational Classification and Coding StructureTo suit the needs of various data users, the occupations in the SOC are classified at four levels of aggregation: major group, minor group, broad occupation, and detailed occupation. Each lower level of detail identifies a more specific group of occupations.
EXAMPLE:29-0000 Healthcare Practitioners and Technical Occupations
29-1000 Health Diagnosing and Treating Practitioners29-1060 Physicians and Surgeons
29-1062 Family and General Practitioners
BOARD ofGOVERNORS State University System of Florida 10www.flbog.edu
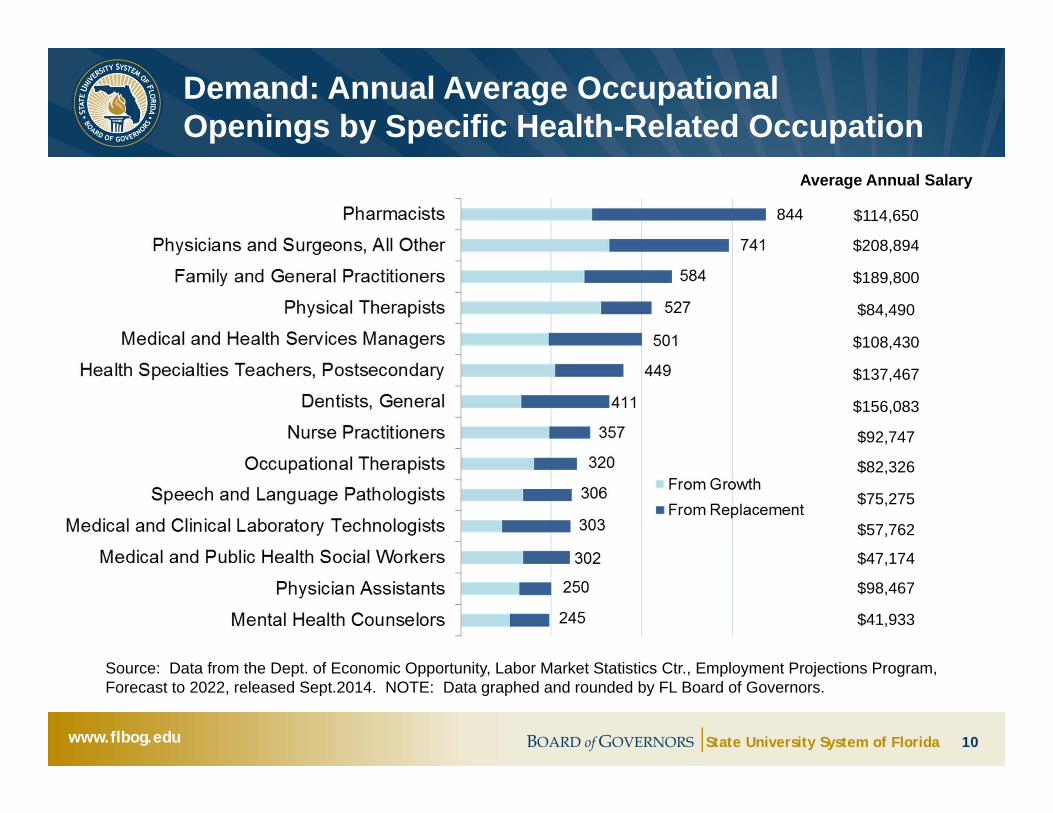
Demand: Annual Average OccupationalOpenings by Specific Health-Related Occupation
844
Average Annual Salary
$114,650
$208,894
$189,800
$84,490
$108,430
$137,467
$156,083
$92,747
$82,326
$75,275
$57,762
$47,174
$98,467
$41,933
Source: Data from the Dept. of Economic Opportunity, Labor Market Statistics Ctr., Employment Projections Program, Forecast to 2022, released Sept.2014. NOTE: Data graphed and rounded by FL Board of Governors.
www.flbog.edu BOARD ofGOVERNORS State University System of Florida 11
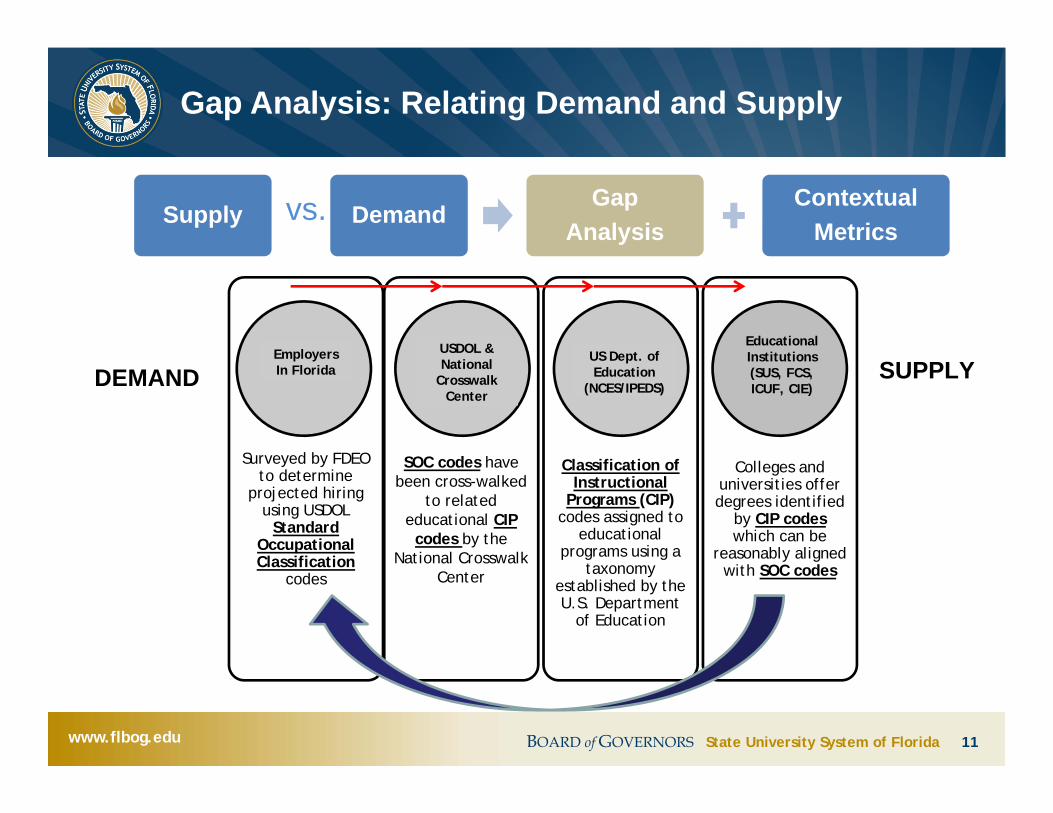
Supply DemandGap
AnalysisContextual
Metrics
Surveyed by FDEO to determine
projected hiring using USDOL
Standard Occupational Classification
codes
SOC codes have been cross-walked
to related educational CIP codes by the
National Crosswalk Center
Classification of Instructional
Programs (CIP) codes assigned to
educational programs using a
taxonomy established by the U.S. Department
of Education
Colleges and universities offerdegrees identified
by CIP codes which can be
reasonably aligned with SOC codes
Educational Institutions(SUS, FCS, ICUF, CIE)
US Dept. of Education
(NCES/IPEDS)
USDOL & National
Crosswalk Center
Employers In FloridaDEMAND SUPPLY
Gap Analysis: Relating Demand and Supply
vs.

www.flbog.edu BOARD ofGOVERNORS State University System of Florida 12
Gap Analysis: A Sample of Initial Figures
Occupation Annual Demand
AdjustedSupply
Initial Difference
Needs Additional
Steps
Physicians 1,934 975 -959 Physical Therapists 527 340 -187 Dentists 511 205 -306 Occupational Therapists 320 215 -105 Medical Technologists 303 74 -229
Medical and Public Health Social Workers 302 184 -118
Veterinarians 162 94 -68

www.flbog.edu BOARD ofGOVERNORS State University System of Florida 13
Gap Analysis Methodology: Contextual Metrics
Supply DemandGap
AnalysisContextual
Metricsvs.
• Average Wage
• Projected 2014-2022 Annual Growth Rates
• Completions from Florida Residency and Internship Programs (When Required for Licensing or Credentialing)
• Number of Graduates from Post-Professional Programs
• Estimates of Supply from New and Planned Programs
• Estimates of In- and Out-Migration
• Practice Patterns from Licensing Data and Surveys
• Additional Models of Healthcare Demand

www.flbog.edu BOARD ofGOVERNORS State University System of Florida 14
Today’s Discussion of Specific Health Occupations
Discuss Handout on 18 Occupation Groups
Generally Discuss Demand and Supply Issues for Nursing

www.flbog.edu BOARD ofGOVERNORS State University System of Florida 15
Discussion Questions for Part 2. Which Health Occupations are Undersupplied?
1. Are the methods and data we’ve considered up to this point appropriate for answering our environmental scan question?
2. What are the priority contextual factors to consider next?
3. Once we answer the undersupply question, should we gather data on the cost and quality of programs that may need to grow? Is that part of an implementation plan to come later?
www.flbog.edu BOARD ofGOVERNORS State University System of Florida 16
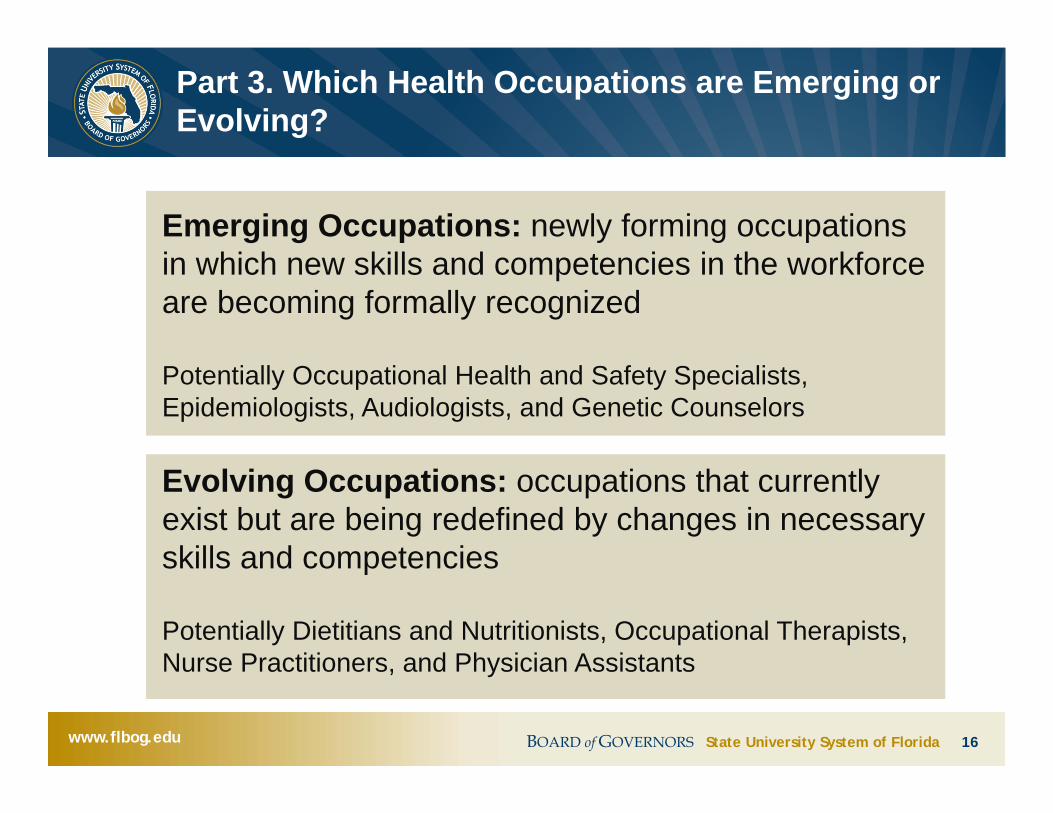
Emerging Occupations: newly forming occupations in which new skills and competencies in the workforce are becoming formally recognized
Potentially Occupational Health and Safety Specialists, Epidemiologists, Audiologists, and Genetic Counselors
Evolving Occupations: occupations that currently exist but are being redefined by changes in necessary skills and competencies
Potentially Dietitians and Nutritionists, Occupational Therapists, Nurse Practitioners, and Physician Assistants
Part 3. Which Health Occupations are Emerging or Evolving?

www.flbog.edu BOARD ofGOVERNORS State University System of Florida 17
The IssueNeed to determine demand for programs where the degree proposed is higher than the typical education level for a given occupation
Proposals for March 2015Doctorate in Clinical Nutrition at UNFDoctor of Social Work (Clinical/Medical Specialty) at FAUDoctor of Nursing Practice at FGCU
Professional Practice Doctorates for PotentiallyEvolving Occupations

www.flbog.edu BOARD ofGOVERNORS State University System of Florida 18
Discussion Questions for Part 3. Which Occupations are Emerging or Evolving?
1. Can we identify evolving or emerging health occupations from those considered in the gap analysis? Have we left out any emerging occupations?
2. For the professional practice doctorates, is there evidence that graduates of these programs will benefit from a hiring preference, promotion potential, or higher earnings?
3. Are changes in the practice environment driving the transition to a higher credential? What are other drivers of credential change?
4. Are the proposed programs likely to enroll students and be sustainable? If the market demand remains small, will the market become saturated quickly even in the presence of high student demand?

www.flbog.edu BOARD ofGOVERNORS State University System of Florida 19
Dietitians and Nutritionists
See Handout
www.flbog.edu BOARD ofGOVERNORS State University System of Florida 20
Medical and Public Health Social Workers
See Handout

www.flbog.edu BOARD ofGOVERNORS State University System of Florida 21
The MSN to DNP Transition
School NameMSN –Nurse
Practitioner
MSN –Nurse
Educator
MSN –Nurse
Leadership
MSN –Clinical Nurse
Specialist
MSN –Certified
Registered Nurse
Anesthetist
MSN –Nurse
Midwife
Doctoral - PhD
Doctoral - DNP
FGCU 9 -- -- -- 14 -- -- --UWF -- 1 -- -- -- -- -- --USF 140 36 -- -- 16 -- 10 5FAU 89 22 23 -- -- -- 4 14UCF 7 26 37 1 -- -- 9 3UF 59 -- -- -- -- 8 6 46FIU 141 -- -- -- 38 -- 1 --FSU -- 4 -- -- -- -- -- 15UNF 21 -- -- 2 27 -- -- 5FAMU 11 -- -- -- -- -- -- --TOTAL 477 89 60 3 95 8 30 88
Number of Graduates by Program for Academic Year 2012-2013 as Reported on the Florida Center for Nursing Annual Survey
Source: Florida Center for Nursing, Nurse Education Program Survey Results, Academic Year 2012-2013

www.flbog.edu BOARD ofGOVERNORS State University System of Florida 22
BOARD ofGOVERNORSState University System of Florida
www.flbog.edu
Rev. 2014

www.flbog.edu BOARD ofGOVERNORS State University System of Florida 23
Supply: Top Degrees Awarded in Florida (in 2012-2013)By Discipline Groups and Degree Level
ACADEMIC DISCIPLINE GROUPS ASSOCIATE'S BACHELOR'S MASTER'S DOCTORAL & PROF. TOTAL
STATE TOTAL 100,910 98,358 32,944 9,028 241,240BUSINESS, MANAGEMENT, MARKETING, SUPPORT SERVS. 4,300 23,711 11,024 121 39,156HEALTH PROFESSIONS AND RELATED PROGRAMS 21,168 9,880 4,599 2,870 38,517EDUCATION 473 5,346 4,331 850 11,000HOMELAND SECURITY, LAW ENFORCEMENT, FIREFIGHTING AND RELATED PROTECTIVE SERVICES 3,469 4,604 774 * 8,852
SOCIAL SCIENCES * 8,153 540 110 8,803PSYCHOLOGY * 6,626 1,175 353 8,164VISUAL AND PERFORMING ARTS 952 5,246 725 72 6,995ENGINEERING * 4,066 2,108 407 6,589BIOLOGICAL AND BIOMEDICAL SCIENCES 72 4,985 863 256 6,176COMPUTER AND INFORMATION SCIENCES 2,657 2,703 589 99 6,048LEGAL PROFESSIONS AND STUDIES 1,485 771 324 3,207 5,787COMMUNICATION, JOURNALISM, & RELATED PROGRAMS 14 4,043 415 24 4,496TRANSPORTATION AND MATERIALS MOVING 664 1,827 1,221 * 3,712PUBLIC ADMINISTRATION AND SOCIAL SERVICE PROFESSIONALS 35 1,388 1,422 31 2,876
ALL OTHERS1 65,603 15,009 2,834 623 84,069Note 1: All Others include 61,221 Associate’s degrees assigned to ‘General Studies’ . Note 2: An asterisk (*) indicates ten or fewer.
BOARD ofGOVERNORS State University System of Florida 24www.flbog.edu
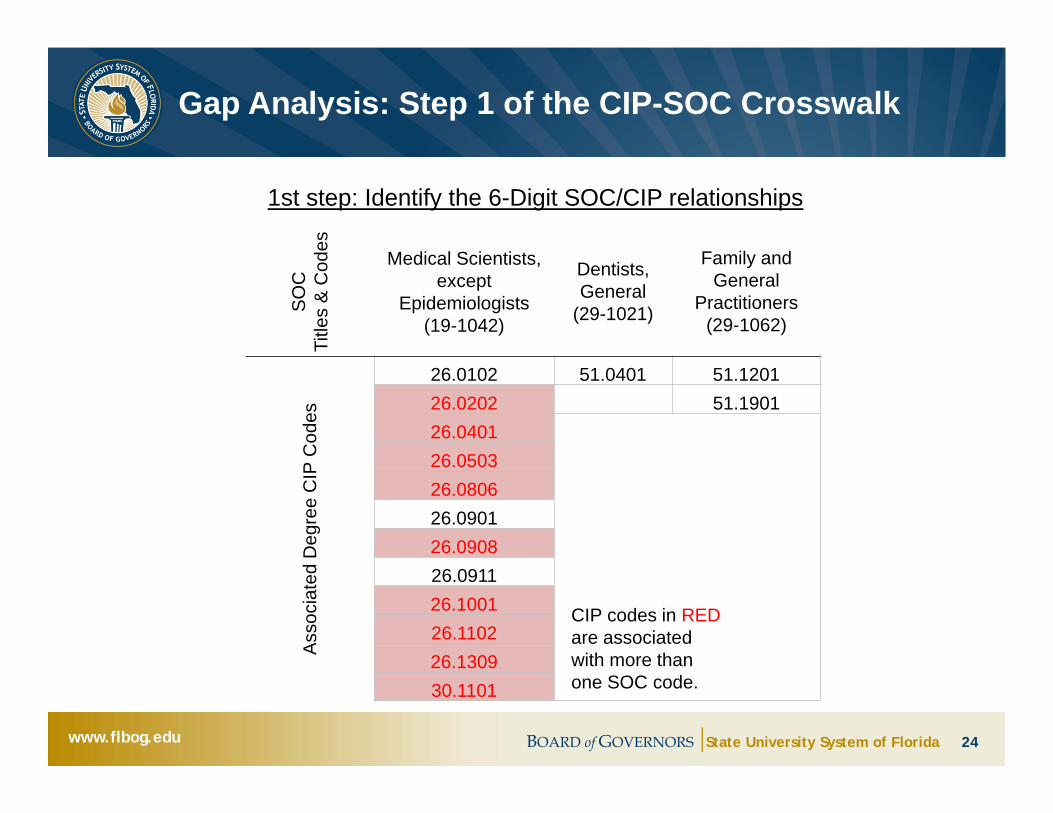
SO
CTi
tles
& C
odes
Medical Scientists, except
Epidemiologists(19-1042)
Dentists, General
(29-1021)
Family and General
Practitioners(29-1062)
Ass
ocia
ted
Deg
ree
CIP
Cod
es
26.0102 51.0401 51.120126.0202 51.190126.040126.050326.080626.090126.090826.091126.100126.110226.130930.1101
1st step: Identify the 6-Digit SOC/CIP relationships
CIP codes in REDare associated with more than one SOC code.
Gap Analysis: Step 1 of the CIP-SOC Crosswalk
www.flbog.edu BOARD ofGOVERNORS State University System of Florida 25
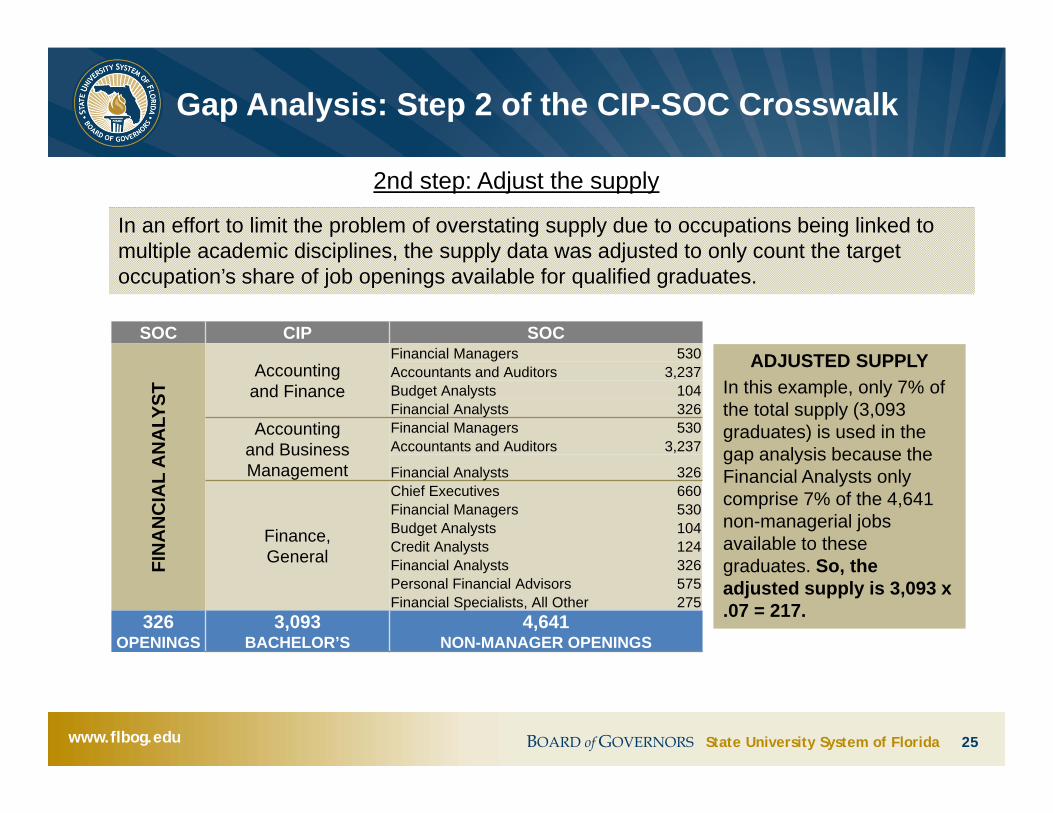
Gap Analysis: Step 2 of the CIP-SOC Crosswalk
2nd step: Adjust the supply
In an effort to limit the problem of overstating supply due to occupations being linked to multiple academic disciplines, the supply data was adjusted to only count the target occupation’s share of job openings available for qualified graduates.
SOC CIP SOC
FIN
AN
CIA
L A
NA
LYST
Accounting and Finance
Financial Managers 530Accountants and Auditors 3,237Budget Analysts 104Financial Analysts 326
Accounting and BusinessManagement
Financial Managers 530Accountants and Auditors 3,237
Financial Analysts 326
Finance,General
Chief Executives 660Financial Managers 530Budget Analysts 104Credit Analysts 124Financial Analysts 326Personal Financial Advisors 575Financial Specialists, All Other 275
326OPENINGS
3,093BACHELOR’S
4,641NON-MANAGER OPENINGS
ADJUSTED SUPPLYIn this example, only 7% of the total supply (3,093 graduates) is used in the gap analysis because the Financial Analysts only comprise 7% of the 4,641 non-managerial jobs available to these graduates. So, the adjusted supply is 3,093 x .07 = 217.