Embed Size (px)
Citation preview

STATE UNIVERSITY OF NEW YORK AT OSWEGO
MASTERS THESIS
Biomedical and Health Informatics
Analysis of Epigenetics and Epidemiology of Acute Myeloid Leukemia with
Machine Learning
Author: Supervisor:
Sarah Mason Isabelle Bichindaritz
Committee:
ii
TABLE OF CONTENTS
INTRODUCTION ............................................................................................................................ 1
SCOPE ........................................................................................................................................... 1
AIMS ............................................................................................................................................. 2
RELATED WORK ............................................................................................................................ 3
MATERIALS AND METHODS .......................................................................................................... 4
PREPROCESSING METHODS ............................................................................................................ 4 PROCESSING METHODS ................................................................................................................... 4
RANDOM FOREST ........................................................................................................................ 5 MULTILAYER PERCEPTRON ......................................................................................................... 5 SUPPORT VECTOR MACHINE ....................................................................................................... 5
DATASETS ..................................................................................................................................... 6
RESULTS ........................................................................................................................................ 7
RANDOM SET ................................................................................................................................... 7 RANDOM FOREST ........................................................................................................................ 8 MULTILAYER PERCEPTRON ......................................................................................................... 8 SEQUENTIAL MINIMAL OPTIMIZATION ...................................................................................... 9
TRAINING SET .................................................................................................................................. 9 RANDOM FOREST ........................................................................................................................ 9 MULTILAYER PERCEPTRON ....................................................................................................... 10 SEQUENTIAL MINIMAL OPTIMIZATION .................................................................................... 11
LOOCV SET ..................................................................................................................................... 12 RANDOM FOREST ...................................................................................................................... 13 MULTILAYER PERCEPTRON ....................................................................................................... 14 SEQUENTIAL MINIMAL OPTIMIZATION .................................................................................... 15
DISCUSSION ................................................................................................................................ 16
CONCLUSION .............................................................................................................................. 18
BIBLIOGRAPHY ............................................................................................................................ 19
TABLE OF TABLES ........................................................................................................................ 21
ACKNOWLEDGEMENTS ............................................................................................................... 21
ABSTRACT
Epidemiology of Acute Myeloid Leukemia shows strong genetic and
epigenetic links by types and severity. To study the disease, patient samples
are translated into data. Using advanced data analytics techniques,
supervised machine learning, epigenetic research acquires efficiency for
synthesis and building knowledge based on clinical data. There are known
factors supported by research. The combination of factor produces higher
severity in Acute Myeloid Leukemia by clinical considerations, AML subclass,
and methylation.


1
INTRODUCTION
Cancer is one of the leading causes of death and impairment in the United States.
As of 2018, an estimated 1,735,350 new cases of cancer will be diagnosed in the
United States and 609,640 people will die from the disease (www.cancer.gov).
Approximately 38.4% of men and women will be diagnosed with cancer at some
point during their lifetimes (based on 2013–2015 data). Estimated national
expenditures for cancer care in the United States in 2017 were $147.3 billion. In
future years, costs are likely to increase as the population ages and
cancer prevalence increases. Costs are also likely to increase as new, and often
more expensive; treatments are adopted as standards of care.
Understanding the progression of cancer is an important factor in developing
treatment plans to prevent or reverse progression. Acute Myeloid Leukemia is a
blood disorder that is a cancer of the blood cells. Without treatment, it becomes
severe and often fatal. This is a disease where platelet, red, or white blood cells can
be abnormal.
To study the biochemical process and features of Acute Myeloid Leukemia, we
can use preexisting clinical and methylation data to apply techniques to compare
based on patient statistics to form a conclusion of tools and application of
knowledge of Acute Myeloid Leukemia. The costs of cancer are high, financial, and
personal. Finding better ways to treat and manage to reduce impact on people and
society requires better knowledge of how cancer develops.
SCOPE
Creating a plan to analyze cancer epigenetics to assist in academic understanding
the nature of cancer, is significant if repeatable. This can create a guide of how to
determine the path of tumor progression for accurate prognosis and treatments for
a positive outcome.
Two tumors with the same genetics can have different progressions. This makes
research difficult to provide therapies and complicates decisions regarding
2
treatment for patients. Epigenetics includes methylation of the DNA ladder. This
pattern is a difference in cells and influences gene expression. Current thought in
oncology is that the changes in methylation of DNA impact the behavior of tumors
causing one tumor to be more aggressive and another tumor to be a more positive
prognosis (Angermueller, Lee, Reik, and Stegle 2017). There are different subtypes
of epigenetics. Methylation, which is the quantity of methyl molecules attached to
the ladder of DNA, can change and vary between individuals and over time.
Methylation can change and influence the action of genetic expression. This is a
current area of cancer research. Is there correlation between methylation, type, and
survival of AML.
Epigenetics can change over time due to many factors such as lifestyle and
environment. It reflects the effect of change due to factors by comparing recurrent
data samples from the same patient and large sets of similar patients. This allows
synthesis of connections between factors yielding wisdom about cancer
progression. There are several known regions associated with Acute Myeloid
Leukemia and methylation, three main regions are selected for analysis of
methylation by differentiation of AML.
Genetic Epidemiology has changed over time. “The concept of ‘disease’ used in
epidemiology is no longer limited to infectious diseases (Frérot, M., Lefebvre, A.,
Aho, S., Callier, P., Astruc, K., & Aho Glélé, L. S. 2018).” Epidemiology is regarded as
the study of health in a population. Epigenetic Epidemiology is the same with
epigenetics. The analytics of the methylation data shows validity for the field.
Studying epigenetics typically involves large datasets. Machine Learning and
Analytics Tools like Weka are targeting to this type of application, working with large
and dense datasets.
AIMS
Results of this research are to define and analyze methylation comparing
different methods. The outcomes and prognosis in relationship to methylation and
gender within the sample set show tool implementation and health data. This will
yield a positive or negative hypothesis that methylation contributes to the fatality
of AML and will give insight to relationship with subtype of this blood disorder. Not
3
only is this a study of epigenetic epidemiology, the work will show effectiveness of
Machine Learning in Weka for the tasks involved. Finally, this will provide data-based
guidance for health screenings based on prediction of health based on features.
RELATED WORK
Previous works include predicting genetic and epigenetic structure based on
machine learning (C. Angermueller, H. Lee, W. Reik, and O. Stegle 2017), correlation
of methylation patterns and cancer (Jelinic, P. and Shaw, P. 2007). Neither paper is
specific to AML and cancer. However, they show link between cancer progression
and methylation.
Looking at the study of Leukemias, academic research is prolific. There is one very
similar article: “DNA Methylation Events as Markers for Diagnosis and Management
of Acute Myeloid Leukemia and Myelodysplastic Syndrome,” by Geórgia Muccillo
Dexheimer, Jayse Alves, Laura Reckziegel, Gabrielle Lazzaretti, and Ana Lucia
Abujamra. However, there are different articles basing their work on this publication
by refining and focusing on different regions of genetic data. I will focus on the
quantity of methylation, variation of recurrence, mortality and survival by age and
gender. This will be a study to show the relationships and influencers that change
the outcome of the mutations involved in Acute Myeloid Leukemia.
Developing a proper study with people is time intensive and costly. By using
available data, we can eliminate bioethics concerns over live participants with less
time to create and maintain an experiment. This also means that There is high value
to these methods and translational research using pre-existing data via
computational analytics.
4
MATERIALS AND METHODS
PREPROCESSING METHODS
In R, using code, the data from the clinical is merged with methylation data to
create a large dataset. By selecting the rows to include within the merge, only the
data required for this project is retained. Empty entries are removed. This produces
a dataset that is useful and manageable.
Preprocessing in Weka is a multi-step process. First, the arff viewer is used to
import the comma separated value file and convert to Attribute-Relation File
Format. After importing the file from WEKA Explorer, selecting preprocessing filters
for data, and reviewing the plot matrix to validate the files, the next step is
processing data.
PROCESSING METHODS
Weka is used in this study of the LAML Datasets from FireBrowse. Within Weka,
there are many selections in multiple menus. These are all mathematically based on
classification and statistics techniques for data analysis. All classifiers used are
Machine Learning tools. There are three types of classifiers representing three
divisions of machine learning, statistical, tree, and neural network. These are
Machine Learning techniques because they are coded supervised learning by Weka
to resolve large scale data to a true or false hypothesis. Due to scale of the project,
training set, LOOCV was used in the menu for classification.

5
RANDOM FOREST
Random forest is a method for classification that creates a multitude
of decision trees at training time and finds the mode of the classes
(classification) of the individual trees. Method used in Weka is
RandomForest. For the research, only classification was included for
results and analysis.
MULTILAYER PERCEPTRON
In Weka, MultiLayer Perceptron is a variant of Long short-term
memory (LSTM) an artificial recurrent neural network (RNN) method that
is supervised machine learning. Unlike standard feedforward neural
networks, LSTM has feedback connections. It can not only process single
data points (such as images), but also entire sequences of data (such as
speech or video).
LSTM networks are well-suited to classifying, processing and making
decisions based on time series data, since there can be lags of unknown
duration between important events in a time series. LSTMs were
developed to deal with the exploding and vanishing gradient
problems that can be encountered when training traditional RNNs.
Relative insensitivity to gap length is an advantage of LSTM over
RNNs, hidden Markov models and other sequence learning methods in
numerous applications (Wikipedia).
SUPPORT VECTOR MACHINE
Support-vector machines are supervised learning models with
associated learning algorithms that analyze data used
for classification and regression analysis. Given a set of training examples,
each marked as belonging to one or the other of two categories, an SVM
training algorithm builds a model that assigns new examples to one
category or the other with classification occurring due mapping above or
below a linear boundary set within the model. An SVM model is a
representation of the examples as points in space, mapped so that the
examples of the separate categories are divided by a clear gap that is as

6
wide as possible. New examples are then mapped into that same space
and predicted to belong to a category based on the side of the gap on
which they fall. SMO was used in Weka for support-vector machine
analysis. SMO is usually seen as a preprocessing for SVM in Weka. SMO is
adequate for small dataset processing for SVM analysis.
DATASETS
Dataset including data and metadata for epigenetics, genetics, and clinical
information was obtained from Firebrowser. The dataset used is a union of the
LAML Preprocess data and Clinical file under the methylation data tab. This
includes more than needed for the analysis, so set used was simplified to have
necessary data only the smaller set was run with normalization and classification
in WEKA.
In computational terms, the sets are made of attributes, or factors, and
instances. Attributes are columns of the tables. The instances in computational
analytics are rows in each table. Files were manipulated from comma separated
value files to the .arff file that is associated with WEKA via the .arff viewer, which
is a conversion tool.
DATA SOURCES
SAMPLES FACTORS SIZE
PREPROCESS.CSV 195 38557 127.79MB
CLINICAL_CLIN.CSV 201 167 222KB
Table 1: Data File Description

7
DATA DESCRIPTION FOR ANALYSIS
Label Quantity Description
Samples 192 Unique Samples
Count of Genes 3 TET2, TPMT,
DNMT3A
Clinical Factors 1 Morphology
Morphology
Values
8 m0, m1, m2, m3, m4,
m5, m6, m7
Table 2: Subset Data Description
RESULTS
Three different types of supervised learning were used to classify the dataset:
Random Forest (RF), MultiLayer Perceptron (MLP), and Sequential Minimal
Optimization (SMO). Each type was run three times in Weka to show accuracy of the
algorithms. Each run of the three types were the same output. There is variation in
results from processing between the types of classification and modeling. Training set
and leave one out cross validation, LOOCV, options are used in modeling with a split
training set option for a set of random data.
RANDOM SET
Random dataset was created by selecting a portion of the dataset and
performing preprocessing functions. The accuracy is high where an acceptable
result is better than 1/8th of the set or 12.5%. This is based on the eight morphology
values for classification. The random datasets were each created by sampling the
set by using a 90% training 10% testing.
8
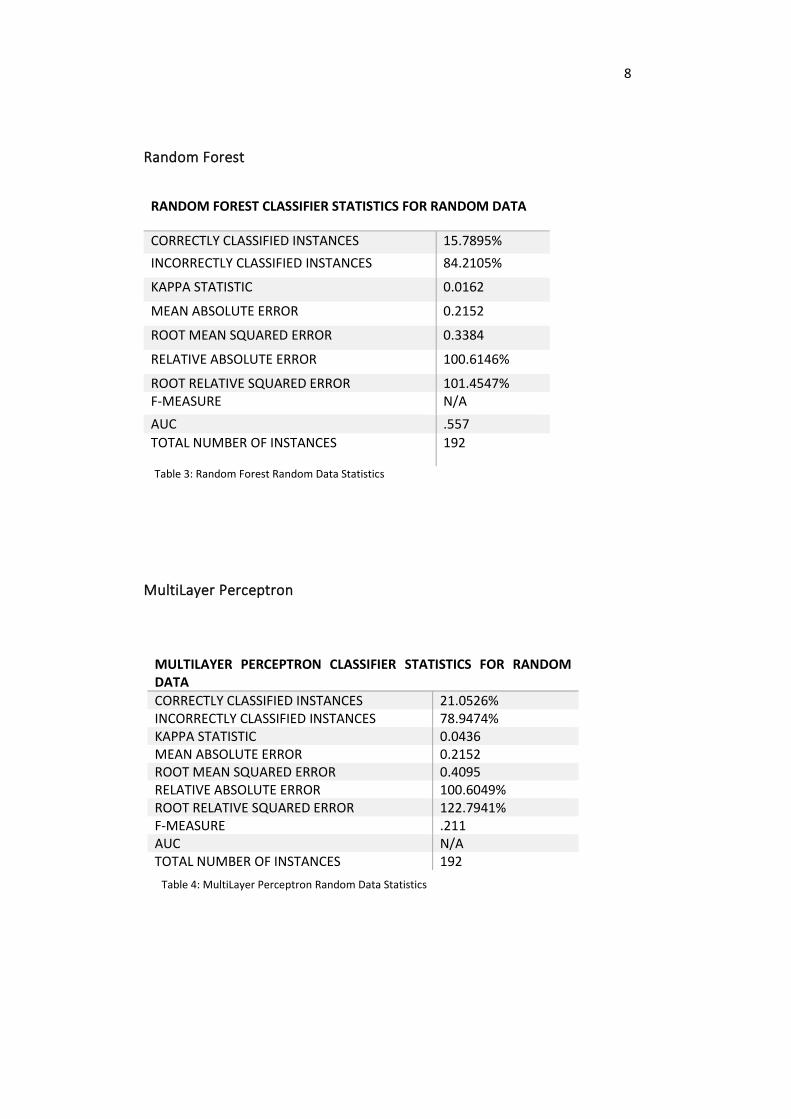
Random Forest
RANDOM FOREST CLASSIFIER STATISTICS FOR RANDOM DATA
CORRECTLY CLASSIFIED INSTANCES 15.7895%
INCORRECTLY CLASSIFIED INSTANCES 84.2105%
KAPPA STATISTIC 0.0162
MEAN ABSOLUTE ERROR 0.2152
ROOT MEAN SQUARED ERROR 0.3384
RELATIVE ABSOLUTE ERROR 100.6146%
ROOT RELATIVE SQUARED ERROR 101.4547% F-MEASURE N/A
AUC .557
TOTAL NUMBER OF INSTANCES 192
Table 3: Random Forest Random Data Statistics
MultiLayer Perceptron
MULTILAYER PERCEPTRON CLASSIFIER STATISTICS FOR RANDOM DATA
CORRECTLY CLASSIFIED INSTANCES 21.0526% INCORRECTLY CLASSIFIED INSTANCES 78.9474% KAPPA STATISTIC 0.0436 MEAN ABSOLUTE ERROR 0.2152 ROOT MEAN SQUARED ERROR 0.4095 RELATIVE ABSOLUTE ERROR 100.6049% ROOT RELATIVE SQUARED ERROR 122.7941% F-MEASURE .211 AUC N/A TOTAL NUMBER OF INSTANCES 192
Table 4: MultiLayer Perceptron Random Data Statistics
9
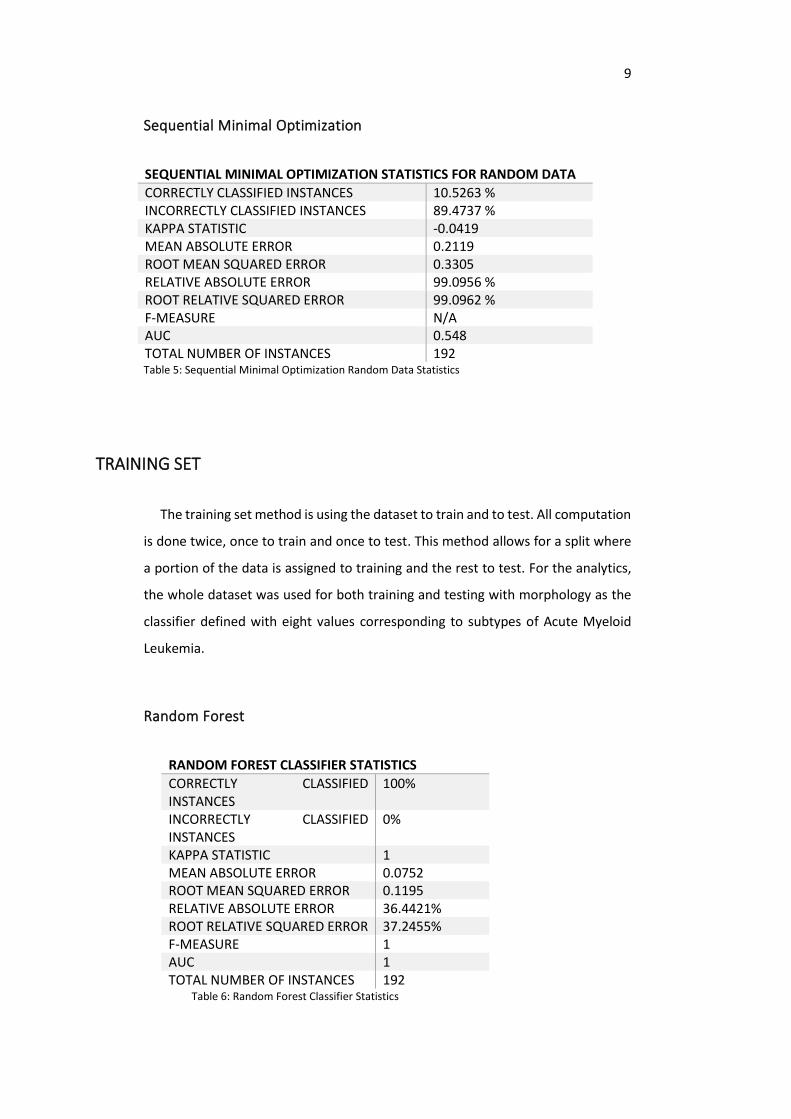
Sequential Minimal Optimization
SEQUENTIAL MINIMAL OPTIMIZATION STATISTICS FOR RANDOM DATA
CORRECTLY CLASSIFIED INSTANCES 10.5263 % INCORRECTLY CLASSIFIED INSTANCES 89.4737 % KAPPA STATISTIC -0.0419 MEAN ABSOLUTE ERROR 0.2119 ROOT MEAN SQUARED ERROR 0.3305 RELATIVE ABSOLUTE ERROR 99.0956 % ROOT RELATIVE SQUARED ERROR 99.0962 % F-MEASURE N/A AUC 0.548 TOTAL NUMBER OF INSTANCES 192 Table 5: Sequential Minimal Optimization Random Data Statistics
TRAINING SET
The training set method is using the dataset to train and to test. All computation
is done twice, once to train and once to test. This method allows for a split where
a portion of the data is assigned to training and the rest to test. For the analytics,
the whole dataset was used for both training and testing with morphology as the
classifier defined with eight values corresponding to subtypes of Acute Myeloid
Leukemia.
Random Forest
RANDOM FOREST CLASSIFIER STATISTICS
CORRECTLY CLASSIFIED INSTANCES
100%
INCORRECTLY CLASSIFIED INSTANCES
0%
KAPPA STATISTIC 1 MEAN ABSOLUTE ERROR 0.0752 ROOT MEAN SQUARED ERROR 0.1195 RELATIVE ABSOLUTE ERROR 36.4421% ROOT RELATIVE SQUARED ERROR 37.2455% F-MEASURE 1 AUC 1 TOTAL NUMBER OF INSTANCES 192
Table 6: Random Forest Classifier Statistics
10
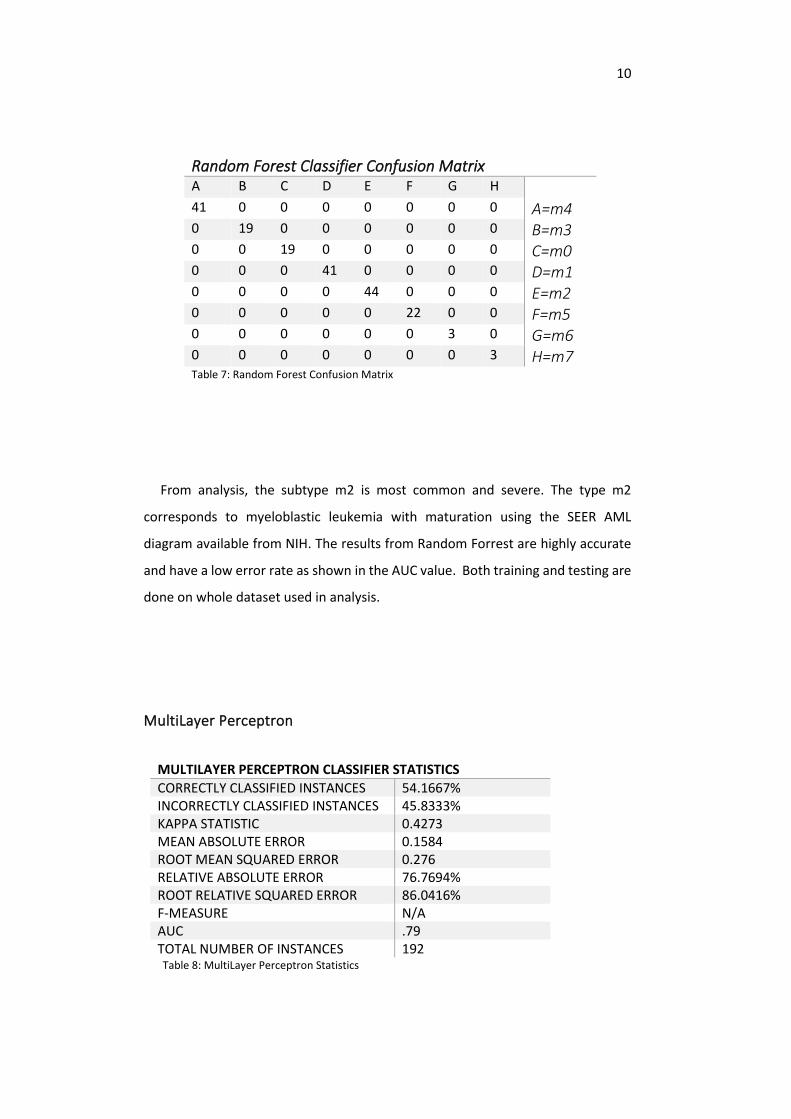
Random Forest Classifier Confusion Matrix A B C D E F G H 41 0 0 0 0 0 0 0 A=m4 0 19 0 0 0 0 0 0 B=m3 0 0 19 0 0 0 0 0 C=m0 0 0 0 41 0 0 0 0 D=m1 0 0 0 0 44 0 0 0 E=m2 0 0 0 0 0 22 0 0 F=m5 0 0 0 0 0 0 3 0 G=m6 0 0 0 0 0 0 0 3 H=m7 Table 7: Random Forest Confusion Matrix
From analysis, the subtype m2 is most common and severe. The type m2
corresponds to myeloblastic leukemia with maturation using the SEER AML
diagram available from NIH. The results from Random Forrest are highly accurate
and have a low error rate as shown in the AUC value. Both training and testing are
done on whole dataset used in analysis.
MultiLayer Perceptron
MULTILAYER PERCEPTRON CLASSIFIER STATISTICS
CORRECTLY CLASSIFIED INSTANCES 54.1667% INCORRECTLY CLASSIFIED INSTANCES 45.8333% KAPPA STATISTIC 0.4273 MEAN ABSOLUTE ERROR 0.1584 ROOT MEAN SQUARED ERROR 0.276 RELATIVE ABSOLUTE ERROR 76.7694% ROOT RELATIVE SQUARED ERROR 86.0416% F-MEASURE N/A AUC .79 TOTAL NUMBER OF INSTANCES 192
Table 8: MultiLayer Perceptron Statistics
11
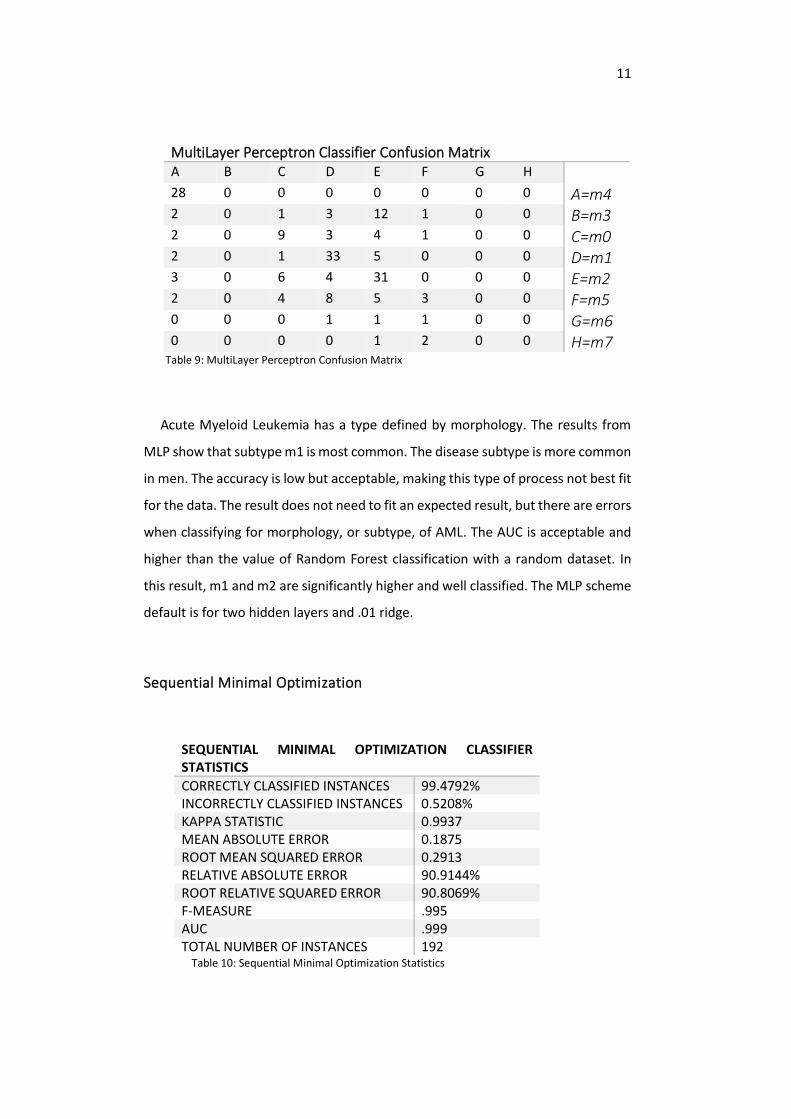
MultiLayer Perceptron Classifier Confusion Matrix A B C D E F G H 28 0 0 0 0 0 0 0 A=m4 2 0 1 3 12 1 0 0 B=m3 2 0 9 3 4 1 0 0 C=m0 2 0 1 33 5 0 0 0 D=m1 3 0 6 4 31 0 0 0 E=m2 2 0 4 8 5 3 0 0 F=m5 0 0 0 1 1 1 0 0 G=m6 0 0 0 0 1 2 0 0 H=m7
Table 9: MultiLayer Perceptron Confusion Matrix
Acute Myeloid Leukemia has a type defined by morphology. The results from
MLP show that subtype m1 is most common. The disease subtype is more common
in men. The accuracy is low but acceptable, making this type of process not best fit
for the data. The result does not need to fit an expected result, but there are errors
when classifying for morphology, or subtype, of AML. The AUC is acceptable and
higher than the value of Random Forest classification with a random dataset. In
this result, m1 and m2 are significantly higher and well classified. The MLP scheme
default is for two hidden layers and .01 ridge.
Sequential Minimal Optimization
SEQUENTIAL MINIMAL OPTIMIZATION CLASSIFIER STATISTICS
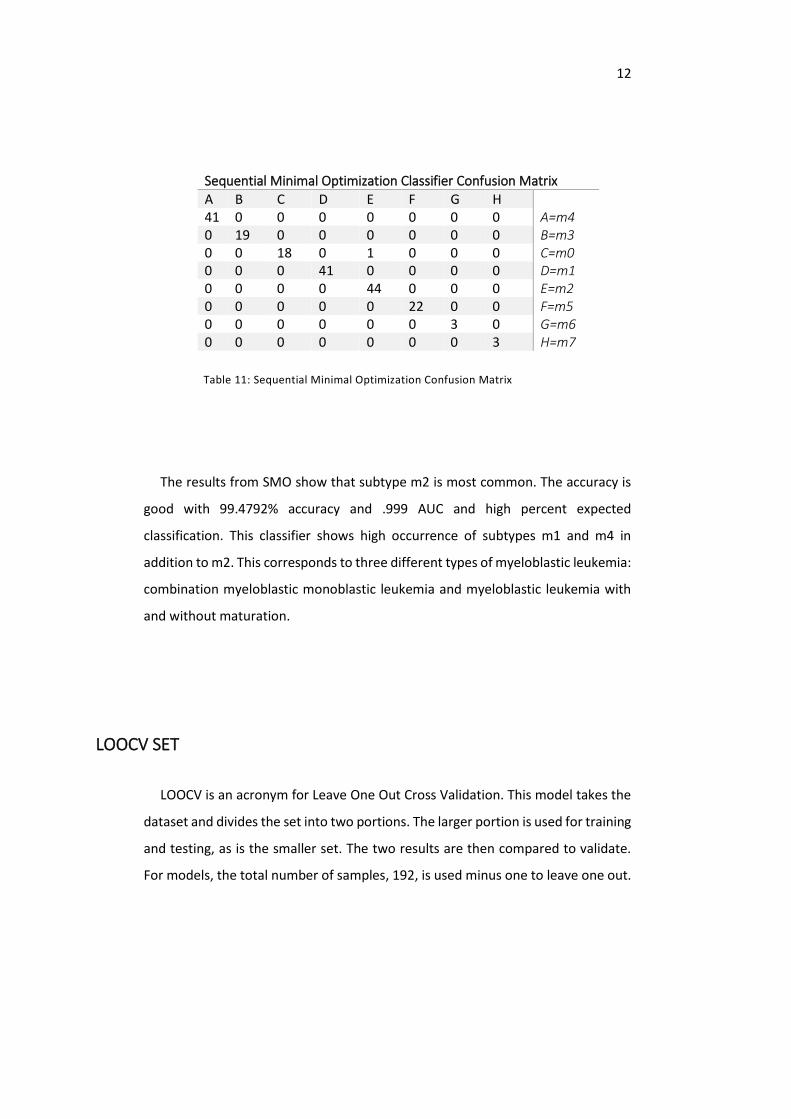
CORRECTLY CLASSIFIED INSTANCES 99.4792% INCORRECTLY CLASSIFIED INSTANCES 0.5208% KAPPA STATISTIC 0.9937 MEAN ABSOLUTE ERROR 0.1875 ROOT MEAN SQUARED ERROR 0.2913 RELATIVE ABSOLUTE ERROR 90.9144% ROOT RELATIVE SQUARED ERROR 90.8069% F-MEASURE .995 AUC .999 TOTAL NUMBER OF INSTANCES 192
Table 10: Sequential Minimal Optimization Statistics
12
Sequential Minimal Optimization Classifier Confusion Matrix
A B C D E F G H 41 0 0 0 0 0 0 0 A=m4 0 19 0 0 0 0 0 0 B=m3 0 0 18 0 1 0 0 0 C=m0 0 0 0 41 0 0 0 0 D=m1 0 0 0 0 44 0 0 0 E=m2 0 0 0 0 0 22 0 0 F=m5 0 0 0 0 0 0 3 0 G=m6 0 0 0 0 0 0 0 3 H=m7
Table 11: Sequential Minimal Optimization Confusion Matrix
The results from SMO show that subtype m2 is most common. The accuracy is
good with 99.4792% accuracy and .999 AUC and high percent expected
classification. This classifier shows high occurrence of subtypes m1 and m4 in
addition to m2. This corresponds to three different types of myeloblastic leukemia:
combination myeloblastic monoblastic leukemia and myeloblastic leukemia with
and without maturation.
LOOCV SET
LOOCV is an acronym for Leave One Out Cross Validation. This model takes the
dataset and divides the set into two portions. The larger portion is used for training
and testing, as is the smaller set. The two results are then compared to validate.
For models, the total number of samples, 192, is used minus one to leave one out.
13
Random Forest
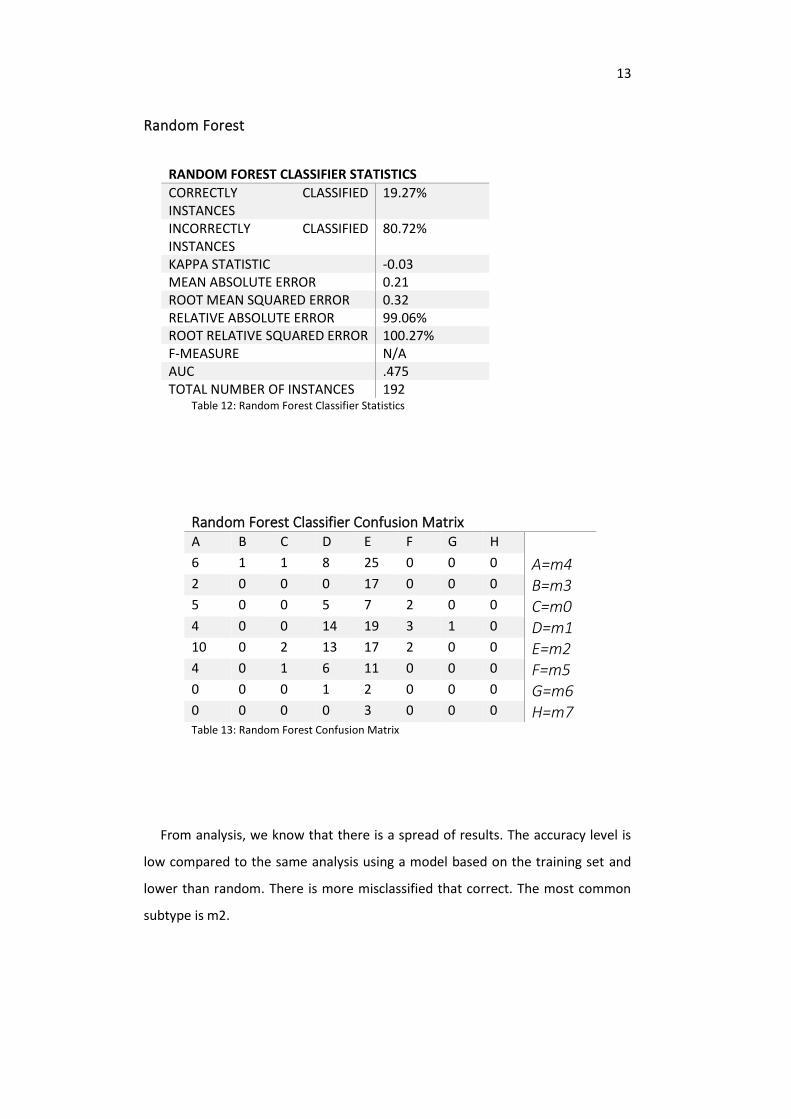
RANDOM FOREST CLASSIFIER STATISTICS
CORRECTLY CLASSIFIED INSTANCES
19.27%
INCORRECTLY CLASSIFIED INSTANCES
80.72%
KAPPA STATISTIC -0.03 MEAN ABSOLUTE ERROR 0.21 ROOT MEAN SQUARED ERROR 0.32 RELATIVE ABSOLUTE ERROR 99.06% ROOT RELATIVE SQUARED ERROR 100.27% F-MEASURE N/A AUC .475 TOTAL NUMBER OF INSTANCES 192
Table 12: Random Forest Classifier Statistics
Random Forest Classifier Confusion Matrix A B C D E F G H 6 1 1 8 25 0 0 0 A=m4 2 0 0 0 17 0 0 0 B=m3 5 0 0 5 7 2 0 0 C=m0 4 0 0 14 19 3 1 0 D=m1 10 0 2 13 17 2 0 0 E=m2 4 0 1 6 11 0 0 0 F=m5 0 0 0 1 2 0 0 0 G=m6 0 0 0 0 3 0 0 0 H=m7 Table 13: Random Forest Confusion Matrix
From analysis, we know that there is a spread of results. The accuracy level is
low compared to the same analysis using a model based on the training set and
lower than random. There is more misclassified that correct. The most common
subtype is m2.

14
MultiLayer Perceptron
MULTILAYER PERCEPTRON CLASSIFIER STATISTICS
CORRECTLY CLASSIFIED INSTANCES 23.43% INCORRECTLY CLASSIFIED INSTANCES 76.56% KAPPA STATISTIC 0.05 MEAN ABSOLUTE ERROR 0.20 ROOT MEAN SQUARED ERROR 0.39 RELATIVE ABSOLUTE ERROR 94.54% ROOT RELATIVE SQUARED ERROR 122.45% F-MEASURE N/A AUC .527 TOTAL NUMBER OF INSTANCES 192
Table 14: MultiLayer Perceptron Statistics
MultiLayer Perceptron Classifier Confusion Matrix A B C D E F G H 9 2 5 11 11 3 0 0 A=m4 4 4 0 3 6 2 0 0 B=m3 5 1 2 6 4 1 0 0 C=m0 10 1 1 17 6 6 0 0 D=m1 8 8 3 9 12 4 0 0 E=m2 6 2 2 7 4 1 0 0 F=m5 1 0 0 1 1 0 0 0 G=m6 1 0 0 0 2 0 0 0 H=m7 Table 15: MultiLayer Perceptron Confusion Matrix
Acute Myeloid Leukemia has a type defined by morphology. The results from
MLP show that subtype m1 and m2 are the most common predictions. The
accuracy is lower than with the training set, however much higher than the
results for MultiLayer Perceptron Random Set. However, using the LOOCV
method seems to provide higher effectiveness than training testing set-up for
classification by morphology, which defines leukemia subtype. The results are
obtained from a 191 Training and 1 Testing set-up. The MLP scheme default is for
two hidden layers and .01 ridge.
15
Sequential Minimal Optimization
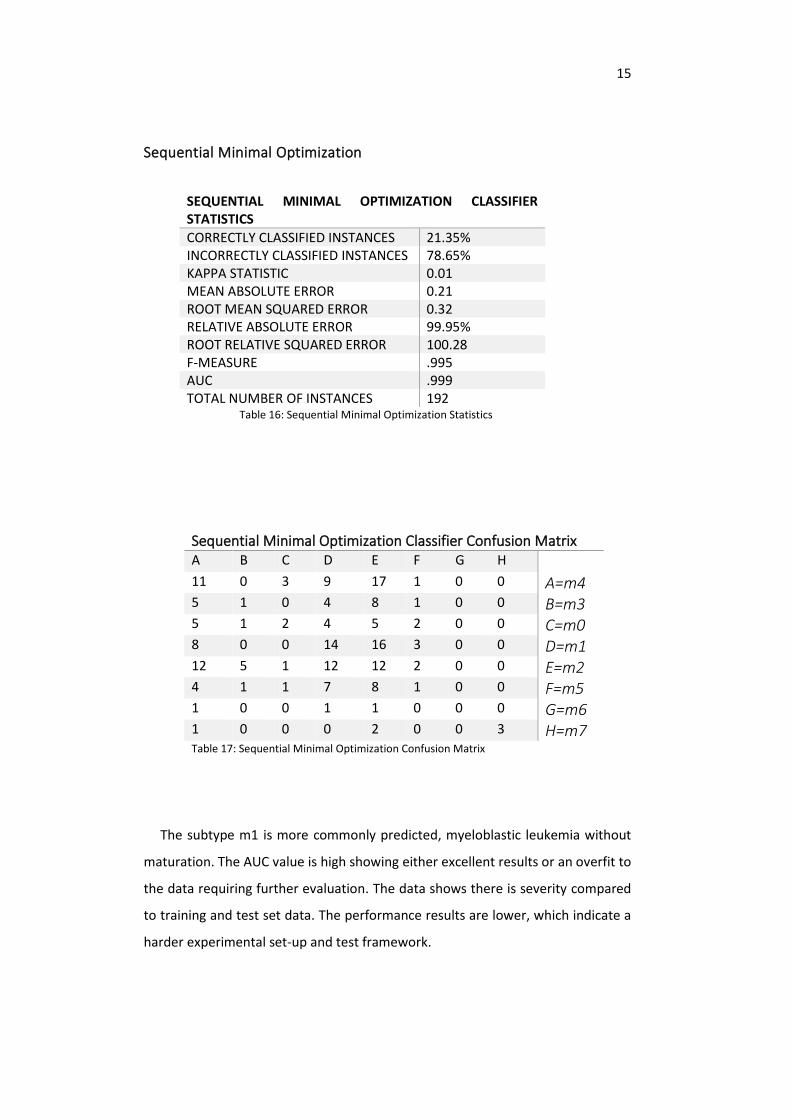
SEQUENTIAL MINIMAL OPTIMIZATION CLASSIFIER STATISTICS
CORRECTLY CLASSIFIED INSTANCES 21.35% INCORRECTLY CLASSIFIED INSTANCES 78.65% KAPPA STATISTIC 0.01 MEAN ABSOLUTE ERROR 0.21 ROOT MEAN SQUARED ERROR 0.32 RELATIVE ABSOLUTE ERROR 99.95% ROOT RELATIVE SQUARED ERROR 100.28 F-MEASURE .995 AUC .999 TOTAL NUMBER OF INSTANCES 192
Table 16: Sequential Minimal Optimization Statistics
Sequential Minimal Optimization Classifier Confusion Matrix A B C D E F G H 11 0 3 9 17 1 0 0 A=m4 5 1 0 4 8 1 0 0 B=m3 5 1 2 4 5 2 0 0 C=m0 8 0 0 14 16 3 0 0 D=m1 12 5 1 12 12 2 0 0 E=m2 4 1 1 7 8 1 0 0 F=m5 1 0 0 1 1 0 0 0 G=m6 1 0 0 0 2 0 0 3 H=m7 Table 17: Sequential Minimal Optimization Confusion Matrix
The subtype m1 is more commonly predicted, myeloblastic leukemia without
maturation. The AUC value is high showing either excellent results or an overfit to
the data requiring further evaluation. The data shows there is severity compared
to training and test set data. The performance results are lower, which indicate a
harder experimental set-up and test framework.
16
DISCUSSION
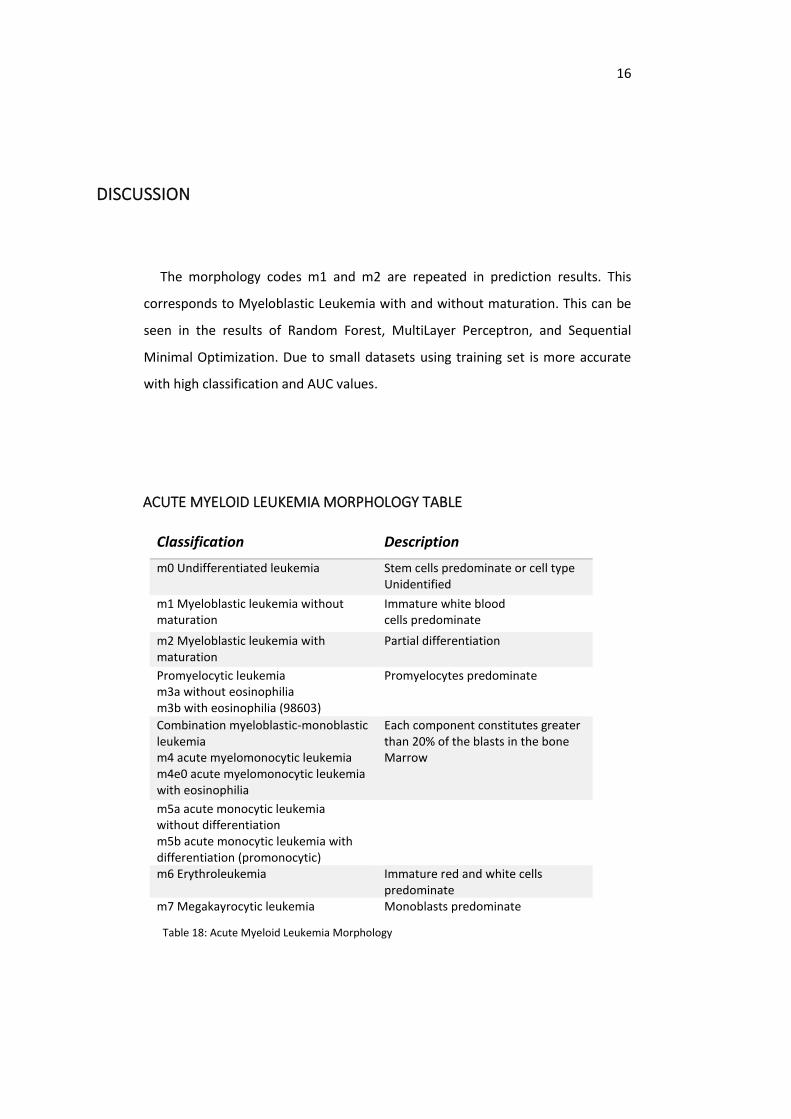
The morphology codes m1 and m2 are repeated in prediction results. This
corresponds to Myeloblastic Leukemia with and without maturation. This can be
seen in the results of Random Forest, MultiLayer Perceptron, and Sequential
Minimal Optimization. Due to small datasets using training set is more accurate
with high classification and AUC values.
ACUTE MYELOID LEUKEMIA MORPHOLOGY TABLE
Classification Description
m0 Undifferentiated leukemia Stem cells predominate or cell type Unidentified
m1 Myeloblastic leukemia without maturation
Immature white blood cells predominate
m2 Myeloblastic leukemia with maturation
Partial differentiation
Promyelocytic leukemia m3a without eosinophilia m3b with eosinophilia (98603)
Promyelocytes predominate
Combination myeloblastic-monoblastic leukemia m4 acute myelomonocytic leukemia m4e0 acute myelomonocytic leukemia with eosinophilia
Each component constitutes greater than 20% of the blasts in the bone Marrow
m5a acute monocytic leukemia without differentiation m5b acute monocytic leukemia with differentiation (promonocytic)
m6 Erythroleukemia Immature red and white cells predominate
m7 Megakayrocytic leukemia Monoblasts predominate
Table 18: Acute Myeloid Leukemia Morphology
17
Classifying into eight classes, the main subclasses of AML, with a small number
of samples is a very difficult task, which explains why many accuracy results are
below 50%. The classes are m0, m1, m2, m3, m4, m5, m6, m7 with the a, b, and e
subtypes not differentiated in the dataset. However, the results using eight classes
is above the random classification rate of 12.5% in most analysis runs. Therefore,
they provide useful predictions. Two morphology subtypes, m1 and m2, are more
correlated with the methylation profiles. From the table, this is a higher incidence
of myeloblastic leukemia with or without maturation.
Methylation appears correlated for occurrence and severity of Acute Myeloid
Leukemia by comparing predictions of status, years lived after diagnosis, and
methylation. Recent literature in oncology states known gene and methylation
groups that play a role in causing malignancy to develop into Acute Myeloid
Leukemia. Changes in the pattern compared to random sets shows higher
methylation in regions yields strong connection to patients with AML, and this also
shows links to subtypes.
Weka is a good choice for epigenetic and genetic computing. It is graphical
interface for Machine Learning with good capability for big data. There are
description of offerings and menus in Weka to help assist in picking proper
functions such as picking preprocessing filters based on data type.
The three classifiers used are supervised machine learning. Using Weka, the
algorithm can be modified by using terms to fit, such as “-m” with SMO to yield
AUC (Area Under the Curve). Classification in small sets is often difficult with
classification due to not enough variance to select a pattern. Using the approaches
with small set clinical and methylation data, high accuracy can be obtained with
checking required to sort misclassification.
Full dataset of whole genome methylation was not used. Only a portion
containing data related to three known leukemic regions due to resource
limitations for processing. Interestingly, errors occur when processing goes to
failure due to hardware issues and settings that cannot be changed due to my
operating system.

18
CONCLUSION
The methylation pattern is different between subtypes of AML within known
leukemic regions. Myeloblastic Leukemia is aggressive and more common with
more methylation and myeloblastic leukemias are strongly correlated with
methylation patterns. When considering tools for analytics in big data genetics,
Weka provides more native tools for quantitative research and the graphical
interface with panels is more organized with heavy resource requirements. An area
of further research is setting up comparisons of binary classification and classifying
on a larger quantity of features.

19
BIBLIOGRAPHY
1. Understanding Cancer, Davis C., 2016,
www.onhealth.com/content/1/cancer_types_treatments
2. Tumor Origin Detection with Tissue-specific Mirna and Dna Methylation Markers
Wei Tang-Shixiang Wan-Zhen Yang-Andrew Teschendorff-Quan Zou -
https://www.ncbi.nlm.nih.gov/pubmed/29028927
3. Yuriy Gusev & Daniel J Brackett (2007) MicroRNA expression profiling in cancer
from a bioinformatics prospective, Expert Review of Molecular
Diagnostics, 7:6, 787-792, DOI: 10.1586/14737159.7.6.787
4. Marlyn Gonzalez & Fei Li (2012) DNA replication, RNAi and epigenetic
inheritance, Epigenetics,7:1, 14-19, DOI: 10.4161/epi.7.1.18545
5. Lim, S. J., Tan, T. W., & Tong, J. C. (2010). Computational Epigenetics: the new
scientific paradigm. Bioinformation, 4(7), 331–337.
6. Jelinic, P. and Shaw, P. (2007), Loss of imprinting and cancer. J. Pathol., 211: 261-
268. doi:10.1002/path.2116
7. R. Fakoor, F. Ladhak, A. Nazi, and M. Huber, “Using deep learning to enhance
cancer diagnosis and classification,” in Proc. Int. Conf. Mach. Learn., 2013, pp. 1–
7.
8. C. Angermueller, H. Lee, W. Reik, and O. Stegle, “Accurate prediction of single-cell
dna methylation states using deep learning,” bioRxiv, 2016, Art. no. 055715.
9. D. de Ridder, J. de Ridder, and M. J. Reinders, “Pattern recognition in
bioinformatics,” Briefings Bioinformat., vol. 14, no. 5, pp. 633–647, 2013
10. Geórgia Muccillo Dexheimer, Jayse Alves, Laura Reckziegel, Gabrielle Lazzaretti,
and Ana Lucia Abujamra, “DNA Methylation Events as Markers for Diagnosis and
Management of Acute Myeloid Leukemia and Myelodysplastic
Syndrome,” Disease Markers, vol. 2017, Article ID 5472893, 14 pages,
2017. https://doi.org/10.1155/2017/5472893.
11. Acharya, U. H., Halpern, A. B., Wu, Q. V., Voutsinas, J. M., Walter, R. B., Yun, S.,
Kanaan, M., Estey, E. H. (2018). Impact of region of diagnosis, ethnicity, age, and
gender on survival in acute myeloid leukemia (AML). Journal of drug
assessment, 7(1), 51–53. doi:10.1080/21556660.2018.1492925
20
12. Bruno Quesnel, Gaelle Guillerm, Rodolphe Vereecque, Eric Wattel, Claude Preudh
omme, FrancisBauters, Michael Vanrumbeke, Pierre Fenaux, Methylation of the
p15INK4b Gene in Myelodysplastic Syndromes Is Frequent and Acquired During
Disease Progression, Blood Apr 1998, 91 (8) 2985-2990
13. Lin S, Liu Y, Goldin LR, Lyu C, Kong X, Zhang Y, Caporaso NE, Xiang S, Gao Y , Sex-
related DNA methylation differences in B cell chronic lymphocytic leukemia, Biol
Sex Differ. 2019 Jan 7;10(1):2. doi: 10.1186/s13293-018-0213-7.
14. https://ncats.nih.gov/translation/spectrum
15. Frérot, M., Lefebvre, A., Aho, S., Callier, P., Astruc, K., & Aho Glélé, L. S. (2018).
What is epidemiology? Changing definitions of epidemiology 1978-2017. PloS
one, 13(12), e0208442. doi:10.1371/journal.pone.0208442
16. NIA Aging and Genetic Epidemiology Working Group, Genetic Epidemiologic
Studies on Age-specified Traits, American Journal of Epidemiology, Volume 152,
Issue 11, 1 December 2000, Pages 1003
1008, https://doi.org/10.1093/aje/152.11.1003
17. Jiang, H., Ou, Z., He, Y. et al. DNA methylation markers in the diagnosis and
prognosis of common leukemias. Sig Transduct Target Ther 5, 3 (2020).
https://doi.org/10.1038/s41392-019-0090-5
18. Gebhard, C., Glatz, D., Schwarzfischer, L. et al. Profiling of aberrant DNA
methylation in acute myeloid leukemia reveals subclasses of CG-rich
regions with epigenetic or genetic association. Leukemia 33, 26–36 (2019).
https://doi.org/10.1038/s41375-018-0165-2
19. Bzdok, D., Krzywinski, M. & Altman, N. Machine learning: supervised
methods. Nat Methods 15, 5–6 (2018). https://doi.org/10.1038/nmeth.4551
20. Eibe Frank, Mark A. Hall, and Ian H. Witten (2016). The WEKA Workbench. Online
Appendix for "Data Mining: Practical Machine Learning Tools and Techniques",
Morgan Kaufmann, Fourth Edition, 2016.
21
TABLE OF TABLES
TABLE 1: DATA FILE DESCRIPTION............................................................................................... 6 TABLE 2: SUBSET DATA DESCRIPTION ......................................................................................... 7 TABLE 3: RANDOM FOREST RANDOM DATA STATISTICS ............................................................ 8 TABLE 4: MULTILAYER PERCEPTRON RANDOM DATA STATISTICS .............................................. 8 TABLE 5: SEQUENTIAL MINIMAL OPTIMIZATION RANDOM DATA STATISTICS ........................... 9 TABLE 6: RANDOM FOREST CLASSIFIER STATISTICS .................................................................... 9 TABLE 7: RANDOM FOREST CONFUSION MATRIX .................................................................... 10 TABLE 8: MULTILAYER PERCEPTRON STATISTICS ...................................................................... 10 TABLE 9: MULTILAYER PERCEPTRON CONFUSION MATRIX ...................................................... 11 TABLE 10: SEQUENTIAL MINIMAL OPTIMIZATION STATISTICS ................................................. 11 TABLE 11: SEQUENTIAL MINIMAL OPTIMIZATION CONFUSION MATRIX ................................. 12 TABLE 12: RANDOM FOREST CLASSIFIER STATISTICS ................................................................ 13 TABLE 13: RANDOM FOREST CONFUSION MATRIX .................................................................. 13 TABLE 14: MULTILAYER PERCEPTRON STATISTICS .................................................................... 14 TABLE 15: MULTILAYER PERCEPTRON CONFUSION MATRIX .................................................... 14 TABLE 16: SEQUENTIAL MINIMAL OPTIMIZATION STATISTICS ................................................. 15 TABLE 17: SEQUENTIAL MINIMAL OPTIMIZATION CONFUSION MATRIX ................................. 15 TABLE 18: ACUTE MYELOID LEUKEMIA MORPHOLOGY ............................................................ 16
ACKNOWLEDGEMENTS
In the design, and the process of this project, I learned much more than
about using a prompt. Thank you to Dr Bichindaritz and SUNY Oswego for their
support and guidance in achieving this milestone.