Embed Size (px)
Citation preview
State Transport in India:MSRTC
(A Study in Operation Management)
by
Dr. P. M. Gawali M.Com., M.Phil., Ph.D.
Associate Professor and Head, Research Guide,Department of Commerce,
Shri Guru Buddhiswami Mahavidyalaya,Purna (Jn) District - Parbhani (M.S.) 431511
MUMBAI NEW DELHI NAGPUR BENGALURU HYDERABAD CHENNAI PUNE LUCKNOW AHMEDABAD ERNAKULAM BHUBANESWAR INDORE KOLKATA GUWAHATI
© AuthorNo part of this publication may be reproduced, stored in a retrieval system, ortransmitted in any form or by any means, electronic, mechanical, photocopying,recording and/or otherwise without the prior written permission of the publisher.
First Edition : First January, 2015
Published by : Mrs. Meena Pandey for Himalaya Publishing House Pvt. Ltd.,“Ramdoot”, Dr. Bhalerao Marg, Girgaon, Mumbai - 400 004.Phone: 022-23860170/23863863, Fax: 022-23877178E-mail: [email protected]; Website: www.himpub.com
Branch Offices :New Delhi : “Pooja Apartments”, 4-B, Murari Lal Street, Ansari Road, Darya Ganj,
New Delhi-110 002. Phone: 011-23270392, 23278631;Fax: 011-23256286
Nagpur : Kundanlal Chandak Industrial Estate, Ghat Road, Nagpur - 440 018.Phone: 0712-2738731, 3296733; Telefax: 0712-2721216
Bengaluru : No. 16/1 (Old 12/1), 1st Floor, Next to Hotel Highlands,Madhava Nagar, Race Course Road, Bengaluru - 560 001.Phone: 080-22286611, 22385461, 4113 8821, 22281541
Hyderabad : No. 3-4-184, Lingampally, Besides Raghavendra Swamy Matham,Kachiguda, Hyderabad - 500 027. Phone: 040-27560041, 27550139
Chennai : New-20, Old-59, Thirumalai Pillai Road, T. Nagar,Chennai-600 017. Mobile: 9380460419
Pune : First Floor, "Laksha" Apartment, No. 527, Mehunpura, Shaniwarpeth(Near Prabhat Theatre), Pune - 411 030.Phone: 020-24496323/24496333; Mobile: 09370579333
Lucknow : House No 731, Shekhupura Colony, Near B.D. Convent School,Aliganj, Lucknow - 226 022. Mobile: 09307501549
Ahmedabad : 114, “SHAIL”, 1st Floor, Opp. Madhu Sudan House, C.G. Road,Navrang Pura, Ahmedabad - 380 009.Phone: 079-26560126; Mobile: 09377088847
Ernakulam : 39/104 A, Lakshmi Apartment, Karikkamuri Cross Rd., Ernakulam,Cochin - 622011, Kerala. Phone: 0484-2378012, 2378016;Mobile: 09387122121
Bhubaneswar : 5 Station Square, Bhubaneswar - 751 001 (Odisha).Phone: 0674-2532129, Mobile: 09338746007
Indore : Kesardeep Avenue Extension, 73, Narayan Bagh, Flat No. 302,IIIrd Floor, Near Humpty Dumpty School, Indore - 452 007 (M.P.).Mobile: 09303399304
Kolkata : 108/4, Beliaghata Main Road, Near ID Hospital, Opp. SBI Bank,Kolkata - 700 010, Phone: 033-32449649, Mobile: 7439040301
Guwahati : House No. 15, Behind Pragjyotish College, Near Sharma PrintingPress, P.O. Bharalumukh, Guwahati - 781009, (Assam).Mobile: 09883055590, 08486355289, 7439040301
DTP by : OM Graphics, Bhandup (Amir)Printed at : M/S. Aditya Offset Process (I) Pvt. Ltd., Hyderabad. On behalf of HPH
PREFACE
The economic growth of a developing country like India dependson the development of adequate, speedy, efficient and economic transport.In the passenger transport system such as railways, airways, roadways,travel by the seas, bus transportation, have become the primary modeof transport for catering to the travel needs of the people throughoutthe country. The strength of the bus transport mode in the form ofconnectivity and accessibility is very wide in the country.
In 1950, the Government of India realising its obligations underwelfare state, has nationalised the passenger transport through theenactment of Road Transport Act, 1950. The Act has empowered theState Governments to establish, manage, run and control the State RoadTransport.
The state owned transport corporations, ever since, graduallyincreased their share of passenger transport, reaching to the maximumof 48 percent of the total bus passenger transport in 1981. The busservices of STUs in the country now declined to 20 percent by theend of the year 1998. Thus, public sector transport undertakings (STUs)are slowly losing their ground.
The MSRTC, one of such SRTCs established in the year 1961,like its counterparts in the country, has suffered great losses over theyears, is heading fast on the path of decline. If the functioning of theMSRTC is not revamped, there is an impending danger that the veryspirit of the welfare state will be defeated.
In such a sorry state of affairs prevailing in the management ofthe state transport undertakings, the present study acquires a greatsignificance.
It is hoped that, the study will contribute to the knowledge andwill be helpful to policy makers, planners and executors at Governmentlevel as well as STUs and MSRTC level.
Author
ABBREVI ATI ONS
Sr. Abbreviation ParticularsNo.1. AMTS Ahmedabad Municipal Transport Service2. APSRTC Andhra Pradesh State Road Transport Corporation3. ASRTU Association of State Road Transport Undertaking4. BMTCL Bangalore Metropolitan Transport Corporation Ltd.5. BSR Bus Staff Ratio6. CIRT Central Institute of Road Transport7. CPKM Cost Per Kilometre8. DTC Delhi Transport Corporation9. Dy Deputy10. EPKM Earning Per Kilometre11. GM General Manager12. GSRTC Gujrat State Road Transport Corporation13. HPRTC Himachal Pradesh Road Transport Corporation14. HSD High Speed Diesel15. IJTM Indian Journal of Transport Management16. J&K Jammu & Kashmir17. KMPL Kilometre Per Litre18. Kms Kilometres19. KMTU Kolhapur Municipal Transport Undertaking20. KnSRTC Karnataka State Road Transport Corporation21. M.E. Mechanical Engineer22. MOST Ministry of Surface Transport23. MPSRTC Madhya Pradesh State Road Transport Corporation24. MSRTC Maharashtra State Road Transport Corporation25. MTW Act Motor Transport Workers Act26. MV Act Motor Vehicles Act27. NTPC National Transport Policy Committee28. PCMT Pimpri-Chinchwad Municipal Transport29. P & IR Personnel and Industrial Relations30. RITES Rail India Technical and Economic Services31. A Rupees32. RSRTC Rajasthan State Road Transport Corporation33. RTC Act Road Transport Corporations Act34. S & P Stores and Purchase35. SRTC State Road Transport Corporation36. SRTU State Road Transport Undertaking37. STUs State Transport Undertakings38. UPSRTC Uttar Pradesh State Road Transport Corporation39. VCMD Vice Chairman and Managing Director
CONTENTS No. Particulars Page No.
Preface
Abbreviations
1. Introduction Transport, Importance, Modes, 1 - 20Public Sector Transport and ResearchMethodology
2. Review of Literature 21 - 47
3. Performance Overview of State Transport 48 - 79Undertakings (STUs) in India
4. A Profile of Maharashtra State Road 80 - 102Transport Corporation
5. Physical and Financial Performance of 103 - 158Maharashtra State Road Transport Corporation
6. Observations and Problems with Reference to 159 - 174MSRTC Bus Service Operations
7. Summary of Conclusions and Suggestions 175 - 192
* Appendices 193 - 200
* Bibliography 201 - 209
1
Mobility is one of the characteristics of human beings; movementis the feature of human nature which simply means mere movementof persons from one place to another for getting comfort journey, availingday-to-day necessities, and to earn bread and butter. Alfred Marshalalso pointed out in “Industry and Trade” (1927) and it was restatedby H.P. White M.L. Senior in “Transport Geography” (Longman, 1983)in the following words:
“The transport industries, which undertake nothing more than themere movement of persons and things from one place to another, haveconstructed one of the most important activities of man in every stateof advanced civilisation. It is not only a basic human activity but isalso a movement in space.” 1
Mobility intends and extends to transport of men and materials.It is found that mobility and movement of human beings resulted incourse of transport action. Moreover, it has been shaping and creatingthe means of transport for the fulfilment of the expanding needs ofhuman beings. Ultimately, it serves in creation and attainment of placeand time utilities.
1. ORIGIN AND EVOLUTION OF TRANSPORTThe word ‘transport’ is derived from the Latin word ‘transporter’,
‘Trans’ means across and ‘porter’ means to carry. ‘Transport’, therefore,refers to carrying goods or persons from one place to another. However,it may be noted that the term ‘Transport’ and ‘Transportation’ havebeen used to denote the same meaning except the fact that the latterbeing used more frequently by the American authors.2
It is admitted that the provision for continuous and without interruptionof mobility of persons and materials is a basic necessity of society.The continuous endeavour of the Western countries had resulted intodistinct stages of Transport evolution. The first stage begins with theearly period when immobility had been there and economic life of people
I NTRODUCTI ON
CH
AP
TE
R
(1)

2 State Transport in India: MSRTC
based on local transactions. Canals and turnpikes expanded in the secondstage. The third stage of transport evolution started when the steamengine was invented. And transport mechanism came into force withcommencement of railway transport, which helped to curtail the costand saved in-transit time and removed the burden on men and animals.The fourth era of transport evolution started with motor age and achievedtransport growth through introducing the mobility of road transportthe world over.
Later, transport sector attained comprehensive growth after theintroduction of Air or Aviation transport through Aircraft infrastructure.After all the journey of whole transport sector in the world has beenevolutionary to the U.S.A. and the other developed countries while ithas been revolutionary to the developing countries.3
1.1 Role and Importance of TransportIn the complex process of modern economic development,
transportation plays a vital role in achieving various goals of any countrysuch as to acquire land for production, to provide resources for industrialinfrastructure, to assist agriculture sector, to make proper utilisationof natural resources for the development of all sectors as well as executeplans and programmes for the interest of the public.4 In this regard,transport sector bears a close and complex relationship with all othersectors in the development of economy. Rapid growth of cities, increasein large scale manufacturing activities, the fast urbanisation around theindustrial centres all these factors contributed to the development ofvarious modes of transport all the world over.5 It is an explicit truththat the economic development of a country like India is largely conditionedupon the connectivity of villages and links up to rural, urban and hillyareas of the country. Besides, it integrates the economy by connectingall sectoral activities from every nook and corners of the countryside.From the discussion in foregoing paragraphs, it is apparent that theprogress in the field of transport brings different part of world in closecontact with one another and it reduces the time in covering the distance.In nutshell, it is justifiably true that growth of any country is beingaccomplished through the transport sector.
Transport Sector of IndiaIndian transport system comprises three major modes of transport:(i) Land transport which consists of rail and road transport,(ii) Water transport and(iii) Air transport
Introduction 3
(i) Land TransportIndia’s Land Transport System has been organised and managedby mixed ownership pattern of public and private sector. Theconstitutional responsibility for providing transport facilities restson the shoulders of both Central and State by which the CentralGovernment is accountable for development of the railways, nationalhighways, civil aviation, international shipping and major ports.
And the development of all minor ports, coastal shipping, inlandwater transport and urban transport rests within the domain ofthe States. The domestic air transport service has been deregulatedin early 1990 by allowing private operators. A few private air transportoperators have entered and recently they are competing with theGovernment undertaking.6
(a) Railway Transport: The Railway has more advantages ascompared to other modes of transport. Indian Railway is thesecond largest railway system in the world. It providesnecessary freight traffic to most of the Indian industries andreliable transportation to the common man. Considering therole of railway, Government of India has been providingconsiderable amount for transport sector during various planperiod. Of that railway share was about 50 percent to 66.87percent of the transport sector allocation during the first andthird Five Year Plan period and then gradually share declinedto 48.45 percent at the Eighth Plan.7 The Indian railway hasbeing performing attractive transport activity during the last50 years. It may be noted that freight traffic of Indian Railwayhas increased from 38 to 277.5 billion net ton kms. whichis 7.30 times of the base year. As well as passenger traffichas also increased from 66 billion passenger kms. to 357 billionpassenger kms, which is 5.40 fold of the year 1950-51, whileits route length increased from 54,000 to 62,725 kms, duringthe year 1950-51 and 1996-97, respectively.
During the period 1950-51 to 1997-98, the Indian Railwayhas a route length of 62,725 kms. out of which 13,500 kms.route length is electrified which accounts for 21 percent ofits total route kms and carries over 60 percent of the freightand 48 percent of the passenger traffic. Presently, IndianRailway is running 11,000 trains and carrying over 11 millionpassengers and 1.2 million tones of freight daily all over through
4 State Transport in India: MSRTC
62,725 route kms. and 7,000 Railway Stations spread acrossin the country.8 In fact, there was a steady decline in allocationof funds from Central Budget. The provision of budgetarysupport has declined from 75 percent in the 5th plan to 20percent in the 8th plan. It is clear that the industry is facingthe major problems of resource constraints which has badlyaffected the augmentation and expansion programme of IndianRailway.9
(b) Road Transport: The Road Transport is prominent infrastructurewhich occupies a predominant place in India with an areaof 3.29 million sq. kms. stretched over a distance of 3,000kms. and across 5,92,000 villages spread all over the country.
It is ever increasing and popular mode of transport onmass level because of its easy availability, flexibility in operation,adaptability to individuals, door-to-door service and reliabilityfor all kinds. Moreover, it serves as a feeder service to railand air traffic. It also carries long distance, in the district,inter-district, inter-state and remote areas traffic. Hence, roadsare imperative infrastructure for road transport. Rail IndiaTechnical and Economic Services Ltd. (RITES) observed that80 percent of the passenger and 60 percent of the freightmovement depended on the roads. Considering the importanceof road transport, out of total plan allocation to transport sector,Government allocated about 33.9 percent, 22 percent, 23.6percent, 39.3 percent, 39.8 percent, 36.6 percent, 28.8 percentand 30.4 percent during the last 8 consecutive plans,respectively. The progress of road length covered in Indiaover the period 1950-51 to 1996-97, increased from 0.4 millionkms. in 1950-51 to over 3.3 million kms. in 1996-97, whichwas eight times of the earlier progress. The national highwaysand state highways together constituted about 7 percent ofthe total road length but carried more than 75-80 percent ofthe road traffic which denoted the acute need of its developmentand maintenance of highways.10
Introduction 5
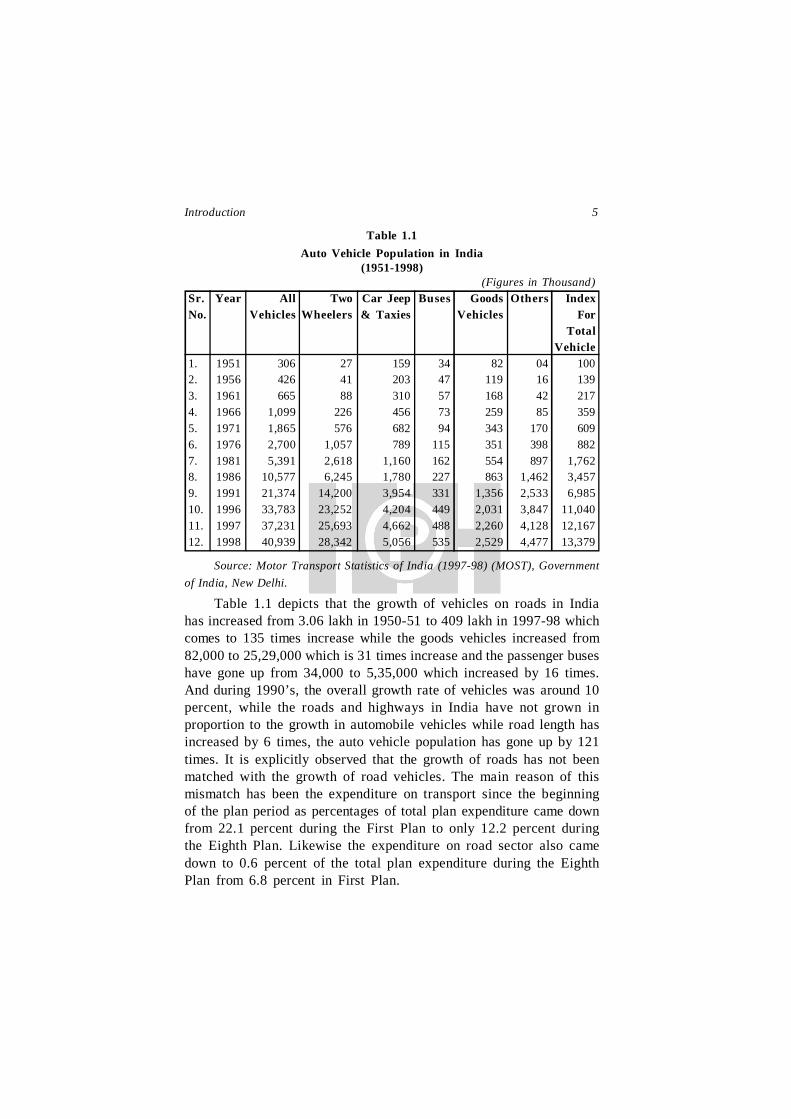
Table 1.1Auto Vehicle Population in India
(1951-1998)(Figures in Thousand)
Sr. Year All Two Car Jeep Buses Goods Others IndexNo. Vehicles Wheelers & Taxies Vehicles For
TotalVehicle
1. 1951 306 27 159 34 82 04 1002. 1956 426 41 203 47 119 16 1393. 1961 665 88 310 57 168 42 2174. 1966 1,099 226 456 73 259 85 3595. 1971 1,865 576 682 94 343 170 6096. 1976 2,700 1,057 789 115 351 398 8827. 1981 5,391 2,618 1,160 162 554 897 1,7628. 1986 10,577 6,245 1,780 227 863 1,462 3,4579. 1991 21,374 14,200 3,954 331 1,356 2,533 6,98510. 1996 33,783 23,252 4,204 449 2,031 3,847 11,04011. 1997 37,231 25,693 4,662 488 2,260 4,128 12,16712. 1998 40,939 28,342 5,056 535 2,529 4,477 13,379
Source: Motor Transport Statistics of India (1997-98) (MOST), Governmentof India, New Delhi.
Table 1.1 depicts that the growth of vehicles on roads in Indiahas increased from 3.06 lakh in 1950-51 to 409 lakh in 1997-98 whichcomes to 135 times increase while the goods vehicles increased from82,000 to 25,29,000 which is 31 times increase and the passenger buseshave gone up from 34,000 to 5,35,000 which increased by 16 times.And during 1990’s, the overall growth rate of vehicles was around 10percent, while the roads and highways in India have not grown inproportion to the growth in automobile vehicles while road length hasincreased by 6 times, the auto vehicle population has gone up by 121times. It is explicitly observed that the growth of roads has not beenmatched with the growth of road vehicles. The main reason of thismismatch has been the expenditure on transport since the beginningof the plan period as percentages of total plan expenditure came downfrom 22.1 percent during the First Plan to only 12.2 percent duringthe Eighth Plan. Likewise the expenditure on road sector also camedown to 0.6 percent of the total plan expenditure during the EighthPlan from 6.8 percent in First Plan.
6 State Transport in India: MSRTC
(c) Road Connectivity in India: Out of over 5,89,000 villagesin India just around 2,74,000 (only 47 percent) of the villageshave been connected in the last 50 years by permanent alltime weather roads. According to the Surface TransportMinistry sources, new road length of 12,60,000 kms. wouldhave to be constructed to meet the objective of ruralconnectivity.11
(ii) Inland Water TransportThe inland water transport is the cheapest mode of transport forcertain kinds of traffic. It covers both long and short distanceservices. It is an efficient mode of transport in respect of fuelconsumption. Although this mode requires very little investment,but it has very little scope in India because there are only a fewrivers in the country.12 In spite of this Government has allocated10.83 percent, 7.8 percent, 7.16 percent, 16.7 percent, 17.7 percent,9 percent, 8.2 percent and 13.5 percent of total plan allocationsto this transport sector during 1st, 2nd, 3rd, 4th, 5th, 6th, 7th and8th plan period, respectively (See Annexure-I).
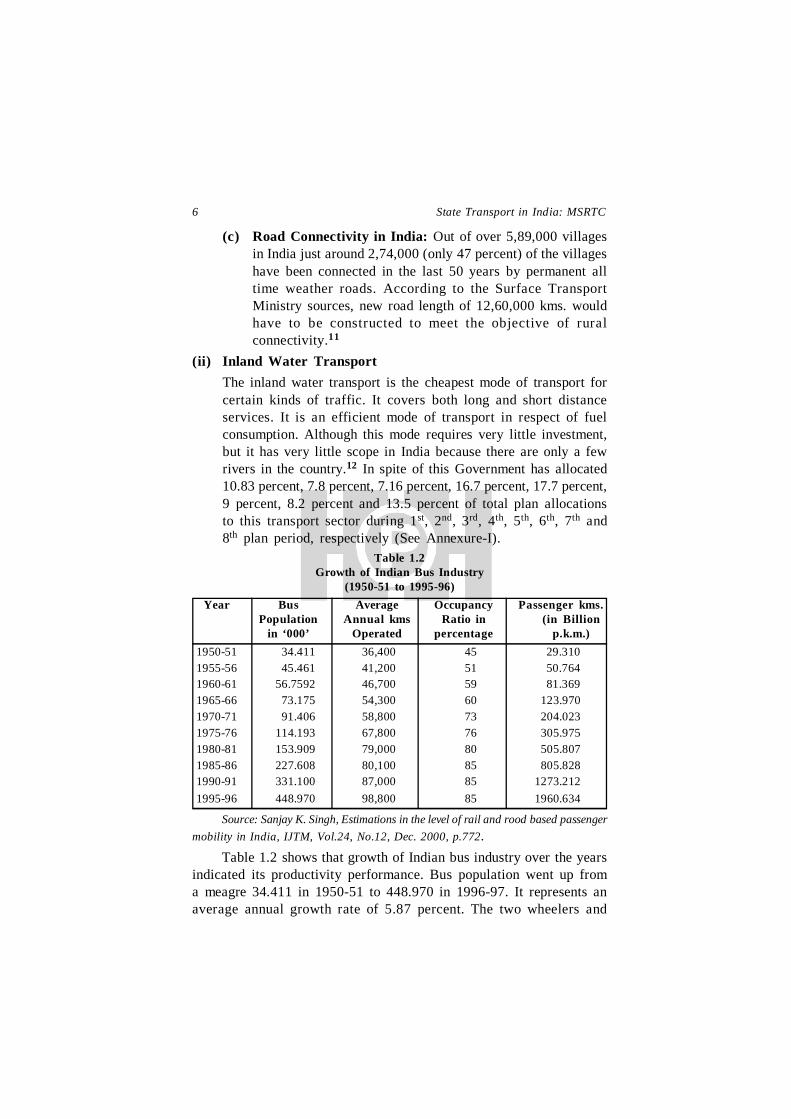
Table 1.2Growth of Indian Bus Industry
(1950-51 to 1995-96)Year Bus Average Occupancy Passenger kms.
Population Annual kms Ratio in (in Billionin ‘000’ Operated percentage p.k.m.)
1950-51 34.411 36,400 45 29.3101955-56 45.461 41,200 51 50.7641960-61 56.7592 46,700 59 81.3691965-66 73.175 54,300 60 123.9701970-71 91.406 58,800 73 204.0231975-76 114.193 67,800 76 305.9751980-81 153.909 79,000 80 505.8071985-86 227.608 80,100 85 805.8281990-91 331.100 87,000 85 1273.2121995-96 448.970 98,800 85 1960.634
Source: Sanjay K. Singh, Estimations in the level of rail and rood based passengermobility in India, IJTM, Vol.24, No.12, Dec. 2000, p.772.
Table 1.2 shows that growth of Indian bus industry over the yearsindicated its productivity performance. Bus population went up froma meagre 34.411 in 1950-51 to 448.970 in 1996-97. It represents anaverage annual growth rate of 5.87 percent. The two wheelers and
Introduction 7
three wheelers population grew at an average annual rate of 16.37 and15.32 percent, respectively. The growth in population of cars, jeepsand taxies was relatively modest, during the same period, car ownershipincreased at the rate of 7.54 percent per annum.(iii) Air Transport
At present there are over 300 civil airports in India spread overall the States. During the year 1996-97, 300 civil airports in thecountry all together operated 36.4 million passengers.13
SummaryWith the support of all these facts, it is, therefore, concluded that,
in all three major modes of transport in India are almost important forpassenger as well as for freight transport. Of these, water and air transporthave not developed up to the mark. It is not feasible to open new routesin countryside because of limited navigable rivers, coastal area and seasite. Similarly, air transport has also not developed as in anticipationto cheap in cost and easily accessible means of transport throughoutthe country.1.2 Need of Passenger Transport
The need of passenger transport services in India has been fulfilledby the routes of Railway, Roadways, Air Transport and Water Transport.Moreover, passenger mobility in India largely depends on rail and roadnetworks. It is observed that, the growth of road based passengermovement during the period 1950-51 to 1995-96 had been around 9.79percent per annum against the corresponding annual growth rate of3.69 percent by railways. The National Transport Policy Committee(NTPC) had targeted road share at only 48 percent by the end of 20th
century; but it is, by and large, far from the target at 85 percent bythe end of 20th century.14 Thus, the role of surface transport industryis becoming vital in present scenario. The Table 1.1 presents that thevehicle population in India which is growing faster in the category oftwo wheelers and three wheelers during 1950-51 to 1995-96, the roadbased passenger movement, bus travel currently represents around 80percent of the road based passenger travel.
8 State Transport in India: MSRTC
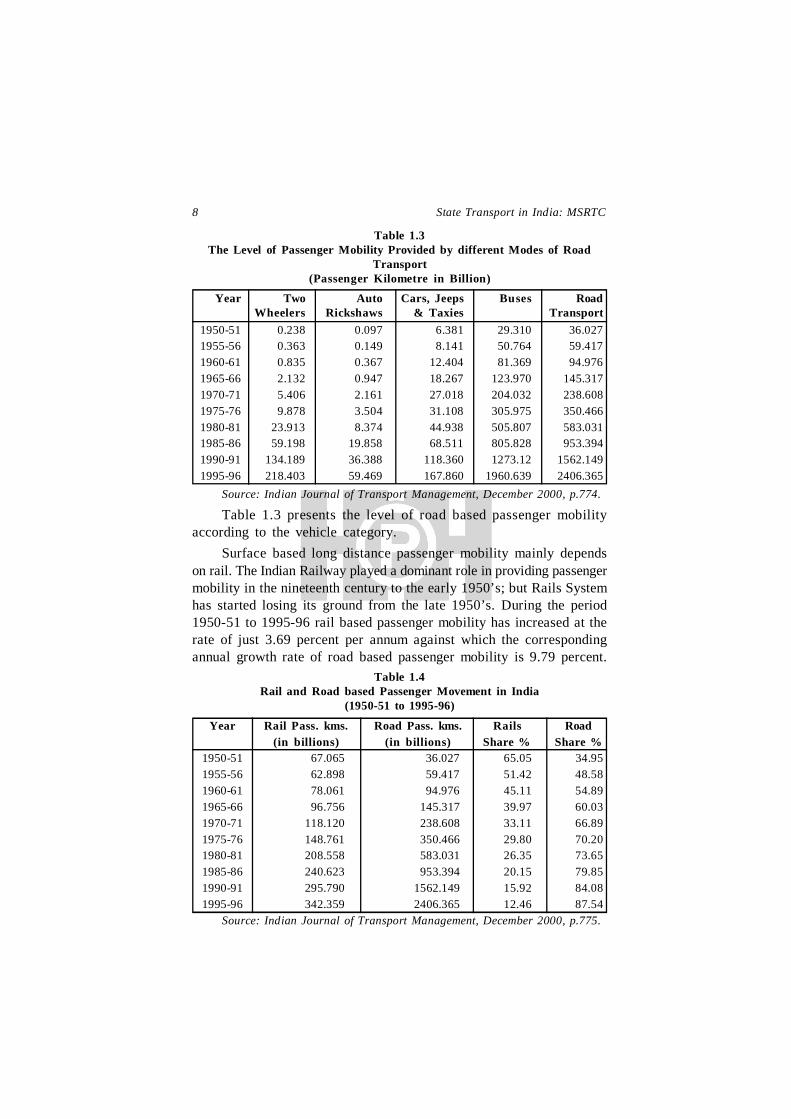
Table 1.3The Level of Passenger Mobility Provided by different Modes of Road
Transport(Passenger Kilometre in Billion)
Year Two Auto Cars, Jeeps Buses RoadWheelers Rickshaws & Taxies Transport
1950-51 0.238 0.097 6.381 29.310 36.0271955-56 0.363 0.149 8.141 50.764 59.4171960-61 0.835 0.367 12.404 81.369 94.9761965-66 2.132 0.947 18.267 123.970 145.3171970-71 5.406 2.161 27.018 204.032 238.6081975-76 9.878 3.504 31.108 305.975 350.4661980-81 23.913 8.374 44.938 505.807 583.0311985-86 59.198 19.858 68.511 805.828 953.3941990-91 134.189 36.388 118.360 1273.12 1562.1491995-96 218.403 59.469 167.860 1960.639 2406.365
Source: Indian Journal of Transport Management, December 2000, p.774.
Table 1.3 presents the level of road based passenger mobilityaccording to the vehicle category.
Surface based long distance passenger mobility mainly dependson rail. The Indian Railway played a dominant role in providing passengermobility in the nineteenth century to the early 1950’s; but Rails Systemhas started losing its ground from the late 1950’s. During the period1950-51 to 1995-96 rail based passenger mobility has increased at therate of just 3.69 percent per annum against which the correspondingannual growth rate of road based passenger mobility is 9.79 percent.
Table 1.4Rail and Road based Passenger Movement in India
(1950-51 to 1995-96)
Year Rail Pass. kms. Road Pass. kms. Rails Road(in billions) (in billions) Share % Share %
1950-51 67.065 36.027 65.05 34.951955-56 62.898 59.417 51.42 48.581960-61 78.061 94.976 45.11 54.891965-66 96.756 145.317 39.97 60.031970-71 118.120 238.608 33.11 66.891975-76 148.761 350.466 29.80 70.201980-81 208.558 583.031 26.35 73.651985-86 240.623 953.394 20.15 79.851990-91 295.790 1562.149 15.92 84.081995-96 342.359 2406.365 12.46 87.54
Source: Indian Journal of Transport Management, December 2000, p.775.

Introduction 9
Table 1.4 describes the level of rail based passenger mobility alongwith its share in total surface based passenger movement from 1950-51 to 1995-96. It is also clear from Table 1.5 that the road passengertransport industry overtook the railways despite its being large in capacity.Though road transport sector signifies almost in growth and capablein variety of demand from commuters and with having greater scopefor development as compared to railway transport, no serious effortsare being made to strengthen road transport as an infrastructure.
Table 1.5Road Network in India
(1951-1997)
Sr . Year N at io nal Sta te O t he r Panchayat Urban Project TotalNo . H ig h ways Highways P W D R aj Roads Roads
Roads Roads1. 1951 19811 - 173723 206408 - - 3999422. 1961 23798 - 257125 197194 46361 - 5244783. 1971 23838 56765 276833 354530 72120 138093 9221794. 1981 31671 94359 421895 628865 123120 185511 14854215. 1991 33650 127311 509435 931288 186799 209737 19982206. 1997 34849 137119 768257 1053539 232234 239879 2465877
Source: Five Years Plan Documents Published by Planning Commission, Govt.of India, New Delhi.
From the Table 1.5 it is seen that, the road development programmeachieved 6 times growth in construction of road under national highways,state highways, PWD Roads and urban and rural roads, whereas autovehicle population has grown 134 times. Out of 5.76 lakh villages inthe country, only 1.76 lakh villages are linked by all weather roads. Itis a challenge for future as resource requirement. And it is estimatedthat, it needs to be raised by about A 31,790 crores at the 2001 costlevel. These facts are ample to justify the need of road passenger transportin India.15
1.3 Origin of Public Sector Passenger Transport in IndiaPublic land passenger transport in India, which is mentioned earlier,
can be classified into two groups viz., the rail passenger transport andthe road passenger transport are the ones of which the second one isoperated partly by public and largely by private sector comprising about28.7 percent and 71.3 percent of the total buses, respectively. Bus transportin India was solely in the hands of private sector before 1950.
It is the Road Transport Corporation Act 1950 with which processof bus transport nationalisation started in the country. Moreover, the
10 State Transport in India: MSRTC
following Act and rule are being administered in road transport sectorwhich embody the policy relating to motor vehicles and State RoadTransport Corporation in the country.
1. Road Transport Corporation Act, 1950.2. Motor Vehicles Act, 1988.3. Central Motor Vehicle Rules, 1989.16
The various amendments made there in the Road TransportCorporation Act 1950, resulted into the formation of various State TransportUndertakings (STUs) in the country under four forms.
1. Departmental undertakings have been set up and operateddirectly by the various State Governments.
2. Municipal undertakings are owned and controlled by theMunicipal Corporations.
3. Companies or Corporations are formed under the IndianCompanies Act, 1956.
4. Road Transport Corporations are formed under the RoadTransport Corporation Act, 1950 (RTC Act)
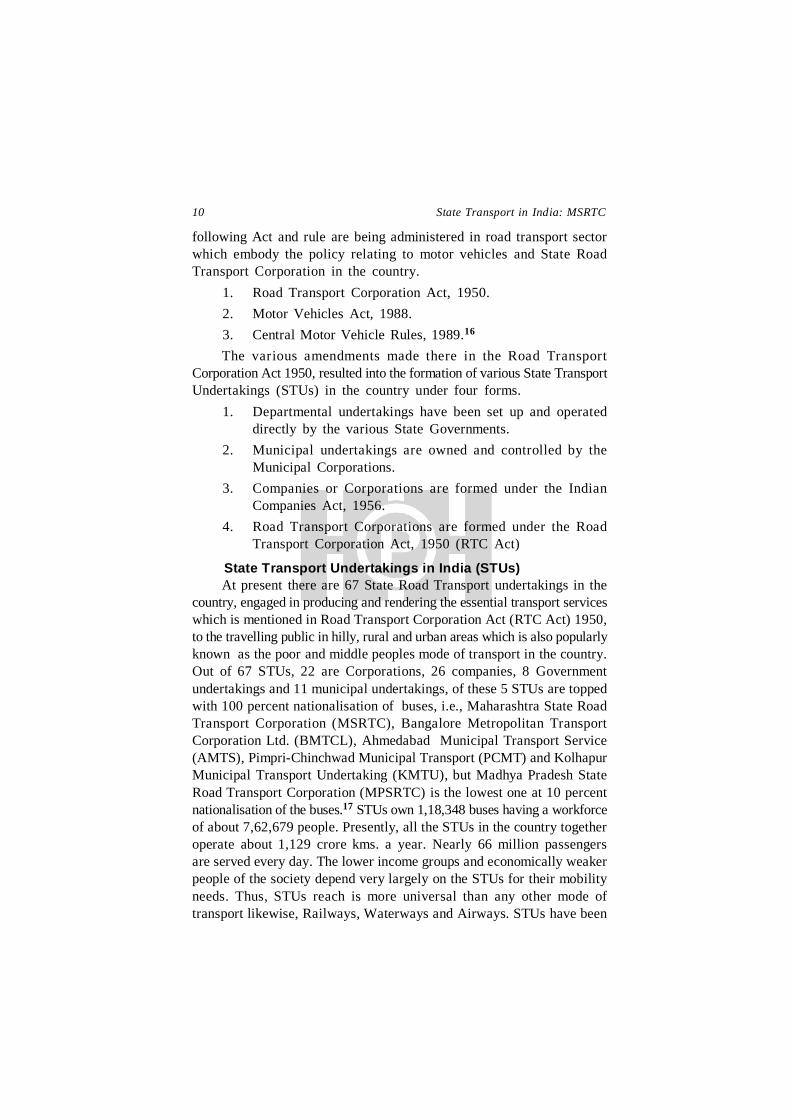
State Transport Undertakings in India (STUs)At present there are 67 State Road Transport undertakings in the
country, engaged in producing and rendering the essential transport serviceswhich is mentioned in Road Transport Corporation Act (RTC Act) 1950,to the travelling public in hilly, rural and urban areas which is also popularlyknown as the poor and middle peoples mode of transport in the country.Out of 67 STUs, 22 are Corporations, 26 companies, 8 Governmentundertakings and 11 municipal undertakings, of these 5 STUs are toppedwith 100 percent nationalisation of buses, i.e., Maharashtra State RoadTransport Corporation (MSRTC), Bangalore Metropolitan TransportCorporation Ltd. (BMTCL), Ahmedabad Municipal Transport Service(AMTS), Pimpri-Chinchwad Municipal Transport (PCMT) and KolhapurMunicipal Transport Undertaking (KMTU), but Madhya Pradesh StateRoad Transport Corporation (MPSRTC) is the lowest one at 10 percentnationalisation of the buses.17 STUs own 1,18,348 buses having a workforceof about 7,62,679 people. Presently, all the STUs in the country togetheroperate about 1,129 crore kms. a year. Nearly 66 million passengersare served every day. The lower income groups and economically weakerpeople of the society depend very largely on the STUs for their mobilityneeds. Thus, STUs reach is more universal than any other mode oftransport likewise, Railways, Waterways and Airways. STUs have been
Introduction 11
making every effort to fulfil the objectives for which they are setup.Many STUs have performed exceptionally well even in a monopolisticenvironment by achieving high levels of operational efficiency, adoptionof good managerial techniques and technical control to better performancein the areas of fleet utilisation, employees productivity, High Speed Diesel(HSD) in kilometre per litre (KMPL), lubricant oil in KMPL, averagetyre life, vehicle break down rate, Bus-staff ratio, accident rate andpercentage of trip cancellation etc. Despite that, STUs are criticisedinside and outside the Government regarding its performance. Thoughthere is an increase in their operational performance and in size ofinfrastructure activities, but their financial position has not beensatisfactory for last two or three decades. The fleet strength with theSTUs has shown a steady growth from 1977 but there has been aprogressive decline in the share of bus fleet as compared to total passengertransport buses in the country.18
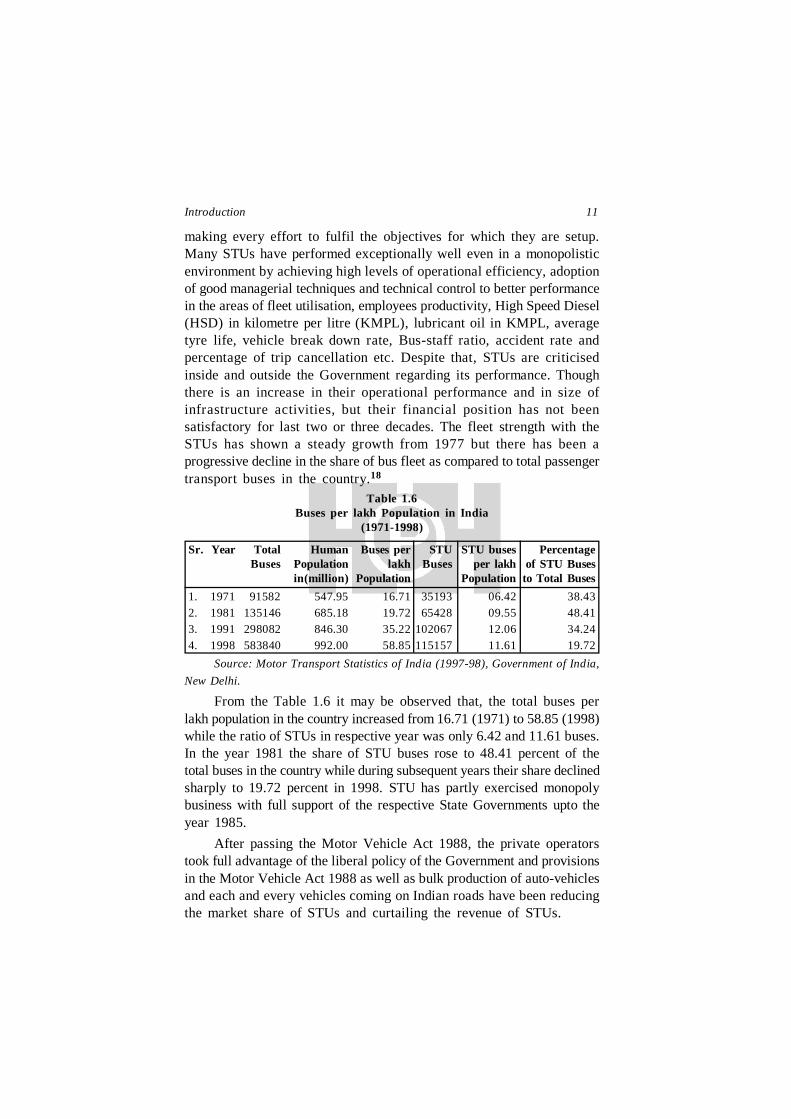
Table 1.6Buses per lakh Population in India
(1971-1998)
Sr. Year Total Human Buses per STU STU buses PercentageBuses Population lakh Buses per lakh of STU Buses
in(million) Population Population to Total Buses1. 1971 91582 547.95 16.71 35193 06.42 38.432. 1981 135146 685.18 19.72 65428 09.55 48.413. 1991 298082 846.30 35.22 102067 12.06 34.244. 1998 583840 992.00 58.85 115157 11.61 19.72
Source: Motor Transport Statistics of India (1997-98), Government of India,New Delhi.
From the Table 1.6 it may be observed that, the total buses perlakh population in the country increased from 16.71 (1971) to 58.85 (1998)while the ratio of STUs in respective year was only 6.42 and 11.61 buses.In the year 1981 the share of STU buses rose to 48.41 percent of thetotal buses in the country while during subsequent years their share declinedsharply to 19.72 percent in 1998. STU has partly exercised monopolybusiness with full support of the respective State Governments upto theyear 1985.
After passing the Motor Vehicle Act 1988, the private operatorstook full advantage of the liberal policy of the Government and provisionsin the Motor Vehicle Act 1988 as well as bulk production of auto-vehiclesand each and every vehicles coming on Indian roads have been reducingthe market share of STUs and curtailing the revenue of STUs.
12 State Transport in India: MSRTC
Thus, STUs are forced unwillingly to compete with private operatorson both fronts legal as well as illegal while most of the traffic on trunkroutes is attracted by private luxury and deluxe bus operators as stagecarriages, the rural traffic is taken over by jeeps and station wagonswith high frequency low capacity with result that STU has incurredheavy losses.
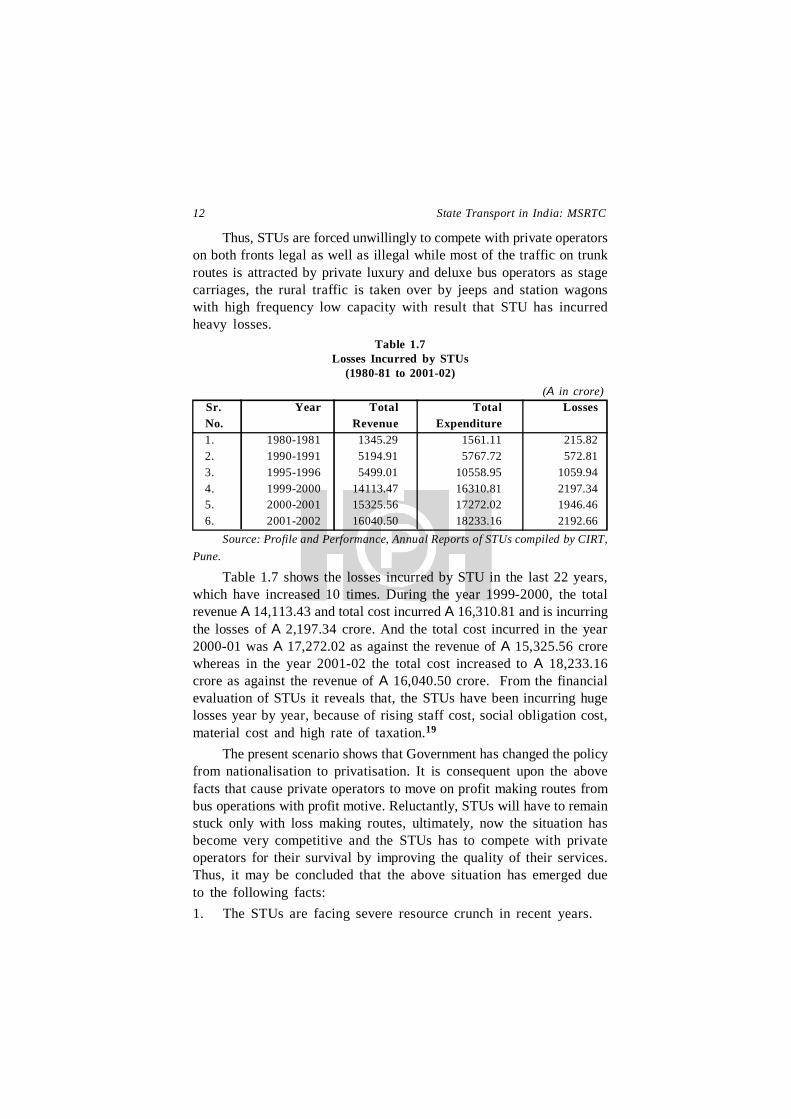
Table 1.7Losses Incurred by STUs
(1980-81 to 2001-02)(A in crore)
Sr. Year Total Total Losses No. Revenue Expenditure 1. 1980-1981 1345.29 1561.11 215.82 2. 1990-1991 5194.91 5767.72 572.81 3. 1995-1996 5499.01 10558.95 1059.94 4. 1999-2000 14113.47 16310.81 2197.34 5. 2000-2001 15325.56 17272.02 1946.46 6. 2001-2002 16040.50 18233.16 2192.66
Source: Profile and Performance, Annual Reports of STUs compiled by CIRT,Pune.
Table 1.7 shows the losses incurred by STU in the last 22 years,which have increased 10 times. During the year 1999-2000, the totalrevenue A 14,113.43 and total cost incurred A 16,310.81 and is incurringthe losses of A 2,197.34 crore. And the total cost incurred in the year2000-01 was A 17,272.02 as against the revenue of A 15,325.56 crorewhereas in the year 2001-02 the total cost increased to A 18,233.16crore as against the revenue of A 16,040.50 crore. From the financialevaluation of STUs it reveals that, the STUs have been incurring hugelosses year by year, because of rising staff cost, social obligation cost,material cost and high rate of taxation.19
The present scenario shows that Government has changed the policyfrom nationalisation to privatisation. It is consequent upon the abovefacts that cause private operators to move on profit making routes frombus operations with profit motive. Reluctantly, STUs will have to remainstuck only with loss making routes, ultimately, now the situation hasbecome very competitive and the STUs has to compete with privateoperators for their survival by improving the quality of their services.Thus, it may be concluded that the above situation has emerged dueto the following facts:1. The STUs are facing severe resource crunch in recent years.
2. The capital contribution provided by the Central and State Governmenthas almost stopped for the last ten years or so and it is expectedthat STUs should manage finances through their own resources.
3. They were forced to operate all the social obligatory routes,irrespective of the losses incurred through the operations and noreimbursement is made by the Government.
4. In case of those STUs which recommended for fare hikes werenever accepted in time by the respective Governments.
5. As a result, the gap between rising cost and revenue became evenmore pronounced.
6. The personnel cost which was 41 percent of the total revenue in1994-95, has gone up to 51 percent of the total revenue in1999-2000 and from 38 percent to 44 percent of the total costduring the same period.
7. The net loss steadily increased from 702.39 crores in 1994-95 to2197.34 crores in 1999-2000. The amount spent on material, taxes,interest and miscellaneous have remained more or less constantover the year under review.It could be found that the depreciation reserve fund is being used
to make up the cash losses actually incurred and there by badly affectingtimely replacement of the fleet in most of the undertakings.20 As a resultof above factors, the cost of operation has gone up steadily withoutadequate increase in productivity.
In the present liberalised scenario, the road passenger transportin public sector is mostly affected by illegal and legal private traffic.Hence, it is essential for STUs to rid itself of critical situation and therebycome out from financial crunch and survive for future. It is inculcatewith understanding and reviewing the STUs operational performanceand financial health, it may be possible to overcome deterioration ofSTUs through the elaboration of the various management control measuresto be adopted, by STUs in utilising the available resources and reducingthe cost of operation.1.4 Maharashtra State Road Transport Corporation (MSRTC)
The Maharashtra State Road Transport Corporation (MSRTC) wasestablished in 1961 under the State Road Transport Corporation (SRTC)Act 1950, with the main objective of providing an efficient, economicaland properly co-ordinated systems of road transport services in thestate of Maharashtra.
Introduction 13
At present, 8 STUs are operating as public sector transportundertakings in Maharashtra State comprising one State Road TransportCorporation (SRTC) and remaining 7 STUs are operating as Municipalundertakings in Municipal areas. MSRTC is today becoming one of thebiggest State Transport Undertakings in India holding a fleet strengthof 17,435 buses. MSRTC also happens to be the first road transportCorporation in the country. The MSRTC is the 100 percent nationalisedtransport undertakings in India holding over 17,435 vehicles operatingon more than 19,429 routes.
The MSRTC covers almost all villages in Maharashtra State andoperates buses in the State where there is road and reaches every whererendering services to rural people on mass level in the radius of 3 kms.,5 kms. and 8 kms. distance from the district head quarters.
In 1976, the Corporation adopted a four-tier system of organisation.Accordingly, four regional offices were created to act as a link betweenthe central office and divisions. This was further expanded to six regionsin July/August 1994.
Traffic StaffTraffic staff is one of the important factors for operating functions.
Traffic staff includes drivers, conductors, traffic controllers, line checkingstaff, traffic inspectors and other traffic staff. The drivers and conductorsare appointed with their services based on the sanctioned schedules,their work norms are set according to the provisions of Motor TransportWorkers Act 1961 (MTW Act) which prescribes a daily steering dutyof 8 hours and spread over duty of 12 hours.21
ServicesMSRTC operates rural and urban passenger transport services intra-
state and inter-state passenger transport services. Apart from this, witha view to considering and fulfiling the increased demand of passengerin the state, MSRTC has undertaken few need based operations.1. MSRTC introduced semi-luxury Asiad buses in 1982-83, which
is a feather in MSRTC’s cap.2. During 1993-94 the Corporation introduced deluxe buses specially
for Pune-Dadar (Mumbai) operations which are still very muchpopular and running with almost – 100 percent load factor.
3. MSRTC introduced 2 A/c coaches on Pune-Dadar route on a trialbasis in the year 1996-97. However, with the increased demandthe Corporation is running 6 numbers of A/c coaches.
14 State Transport in India: MSRTC
4. In the year 2000-01 MSRTC has started minibuses operations with21 seating capacity in its fleet. Besides the need based service,the passenger friendly Janta Bus services on the principle of ‘Boardon the Bus’ any where enroute has also enhanced and operatedcity buses to cater the needs of urban peoples; within city limitand beyond city limit within radius of 10/15/20/50 kilometres ofthose municipal councils or Corporations which cannot run cityoperations. One more policy decided by MSRTC is that to adoptthe liberalised policy of payment of accident compensation topassenger on humanitarian ground, in this regard it is the firstroad transport Corporation in India.22
Need of the StudyMSRTC was once a model STU, of the STUs of India. It has
developed its infrastructure, by utilising largely its profit realised fromoperations and partly by the Government contribution for developingbus stations, depots, divisional offices, divisional workshops, centralworkshops etc. and amenities to passengers with a view to provideimproved quality of services. MSRTC has been operating majority ofroutes in rural areas. However, for the last decade or so MSRTC islosing its ground, it has incurred huge losses continuously over theyears. It is a well known fact that there is some where odd in theoperation and financial set-up of the Corporation. In such a situation,it is critical to come back from financial crisis and build a sound positionof the organisation.23
From the foregoing paragraphs it is summed up that the presentscenario calls for a suitable strategy for improvement in operationaland financial performance at least for survival, if not for growth. Thisstudy is, therefore, intended to review the operational and financial aspectsof transport services of the Corporation and pursue some alternatives.1.5 Operations Management – Relevance with Transport Services
The term operations management refers to the planning, co-ordinationand control of all activities concerned with conversion of inputs intooutputs of product or service.24 The most obvious common groundof operations management is system’s purpose; the operation functionis responsible for providing the goods or services offered to customersby the organisation. To obtain the system’s purpose, the operationalfunction of the organisation must obtain the certain needful inputs andperform the necessary operation to provide the outputs. The operationalfunction transforms inputs into the outputs that will serve the customers
Introduction 15
need, the aim is to make the value of any service organisation to runby through operational function the value of outputs, considerably greaterthan the cost of inputs. 25
Road transport undertakings produce the services, which are totallyfound into intangible form and perishable one. In such a type oforganisation, there should be planning for better resources utilisation,proper co-ordination between the traffic operations and maintenancefunction and effective control all over the transport activities. Theseare the functions of operations management through the application ofthis function process, transport undertakings can improve their efficiencyand performance at large. Planning function covers the aspects ofestimation, by fixing, re-fixing targets in terms of route planning, schedulefixing, departure and arrival, usage targets etc. are involved. Co-ordinationfunction requires the traffic operation and maintenance function mustgo with hand in hand for achieving their work as quickly as possibleto maintain the reliability and punctuality of the overall transport managementby taking action to achieve the planned targets. It is an exercise ofplan implementation and to take corrective action. Evaluation of dataprovide enables to pinpoint the major ills of the MSRTC, it is analysedand deeply discussed in the succeeding chapter which also relates tothe operational performance of the MSRTC during last decade. Similarly,certain suggestions have also been made to improve the present stateof affairs of the MSRTC in particular and STUs in general.1.6 Scope of the Study
Scope of the present study is confined to operations managementof passenger transport services of MSRTC. In order to evaluate theoperational performance of MSRTC, data for the period from1990-91 to 2002-2003 is used. Further, study covers the evaluationof physical and financial performance of MSRTC of the said period.The study also covers all those aspects, which are related to, and affectedon, operational efficiency of MSRTC.1.7 Objectives
The overall objective of the study is to ascertain and evaluate theoperational performance of Maharashtra State Road Transport Corporation(MSRTC). The specific objectives of the study are as follows:1. To review the progress of the public sector passenger transport
system in India in general and MSRTC to the particular.2. To assess operational efficiency of MSRTC.
16 State Transport in India: MSRTC
3. To evaluate physical and financial performance of MSRTC.4. To take the account of the various operational problems/short falls
faced by MSRTC and to suggest measures to overcome them.5. To suggest policy measures for the overall development of MSRTC.1.8 Period of the Study
The period of present research work is widely spread over thirteenyears, i.e., 1990-91 to 2002-2003; for the purpose of operational efficiencyevaluation of MSRTC a state owned public sector undertaking in India.1.9 Hypothesis
Following are the principal assumptions of the study:1. Internal and external factors are the cause of downfall of the
Corporation which clench in dilemma.2. MSRTC has failed to maintain its operational efficiency at desired
level.1.10 Methodology
In order to attain these objectives of the study, the technique ofinvestigation, the tools used, the methods of statistical analysis etc.are determined as below:(i) Sources of data
The study being analytical in nature, as based on secondary datawhich is collected from the following sources:(a) Annual Administrative Reports prepared by MSRTC and
published by State Governments.(b) Audit Reports prepared by Office of the Accountant General
(A.G. Office, Mumbai) and published by Government ofMaharashtra.
(c) State Transport Undertakings (STUs) profile and performance,related to study period, compiled and published by CentralInstitute of Road Transport (CIRT) Pune.
(d) Various issues of Journal on Transport Management, publishedby CIRT, Pune.
(e) Basic Road Statistics of India published by Ministry of SurfaceTransport (MOST).
(f) Five-Year Plans documents, Government of India.(g) Motor Statistics of India published by MOST.
Introduction 17
(h) Economic Survey of Maharashtra – Government ofMaharashtra.
(i) Periodicals like journals, magazines and newspapers.(j) Websites available for data based information on transport
sector.Though the study is based on secondary data, opinions and viewson various issues, which are related to the study, are obtainedfrom the personnel of MSRTC, experts and researchers in thisfield.
(ii) Presentation of DataThe data based information is collected and presented in the formof appropriate tables and charts for ready comparison andinterpretation and conclusion. Data in the form of time series aredepicted in various tables, wherever necessary.
(iii) Statistical ToolsFor analysing the depicted data in different tables, the few statisticaltools such as averages, percentages, ratios, indices etc. are used.
1.11 Scheme of PresentationThe present study is divided into seven chapters including conclusions
and suggestions.(i) The First Chapter being introductory in nature covers meaning,
definition origin of transport, role of transport, role of STUs, needof the study and conceptual nature of operations management andscope, objectives and methodology of the study.
(ii) Literature review of the studies regarding nationalised public sectorroad transport undertakings in India which are related to the aspectsof the present study is included in Chapter-II.
(iii) The Third Chapter is devoted to the profile and performance ofSTUs in India.
(iv) The profile of MSRTC during the study period is presented inChapter-IV.
(v) The analysis of physical and financial performance of MSRTCduring the study period is presented in Chapter-V.
(vi) Sixth Chapter covers the observations as well as problems of MSRTCbus service operations. It includes an analysis of various problemsand inherent limitations of operations of MSRTC. It includes acritical review of various issues affecting the operations of MSRTC.
18 State Transport in India: MSRTC
It also covers a future look of MSRTC in present competitiveenvironment.
(vii) The Seventh Chapter contains the summary of conclusions of thestudy and suggestions to improve the operational performance ofMSRTC as well as the measures to overcome the various problemsfaced by the MSRTC; so that the quality and reliability of servicesof MSRTC could be improved.
1.12 Limitations of the StudyLike any other works, the present study also has its own limitations,
these are stated below:1. The study period is limited to 13 years.2. We could not incorporate the latest data due to its non-availability.3. The study is limited to the operational and financial performance
of MSRTC.4. Due to the non-availability of divisional and depot level data we
could not undertake their study.5. The study is based on the secondary data which may have its
own limitations.6. The data were made available from CIRT, Pune, Ministry of Surface
Transport, New Delhi and Annual Reports of the SRTC concernedfor the investigative study.
REFERENCES1. Edmund J. Gubbins, Managing Transport Operations, Kogan Page,
London, 1988, pp. 28-29.2. Made Gowada, Indian Journal of Transport Management (I.J.T.M.),
Pune, CIRT, March 1999, p. 157.3. Sudarshanam Padam, Bus Transport in India, Delhi, Ajantha
Publications, 1990, pp. 3-4.4. Ibid, pp. 2-3.5. Thomas M.K., Public Sector Bus Transport in India in the New
MillenniumA Historical Perspective, Pune, Ebenezer Publishers,2000, p.13.
6. Ibid.7. Ibid, p.18.8. Ibid, p.17.9. Ibid, pp. 20-21.
Introduction 19
10. Ibid, pp. 26-27.11. Ibid, p. 32.12. Ibid, pp. 52-55.13. Ibid, p. 49.14. Singh Sanjay K., Estimating the Level of Rail and Road Based
Passenger Mobility in India, Pune, I.J.T.M., Dec. 2000, Vol. 24,No. 12, pp. 771-781.
15. Kadam V.A., Road Passenger Transport in the 20th Century – IssuesRegarding STUs and Urban Transport, Pune, I.J.T.M., April-June2002, Vol. 26, No. 2, pp. 276-277.
16. Annual Report of Department of Ministry of Surface Transport,Delhi, 1999-2000, p. 74.
17. Thomas M.K. Op.cit., p. 65.18. G. Somayajulu, Employee Satisfaction – A Mantra for Profitability
in the Transport Sector, Pune, CIRT, I.J.T.M. Vol. 26, No. 3,July-Sept. 2002, p. 139.
19. Thomas M.K. Op.cit., p.72.20. Annual Reports, Profile and Performance of STUs, Years from
1990-91 to 2001-02, compiled by CIRT, Pune.21. Mishra Ashish, Operational Viability in STUs – Strategies for
Survival, Pune, C.I.R.T., I.J.T.M., July-Sept. 2002, Vol. 26,No. 3, pp. 383-400.
22. Nadaf A.N., Management Control in Road Transport Undertakings,Pune, CIRT, I.J.T.M., Vol. 26, No. 2, Apr-June 2002, pp. 240-241.
23. Annual Administrative Reports of MSRTC Year 2000-2001, p.1.24. Ibid.25. Gupta C.B., Operations Management and Control, Delhi, Sultan
Chand and Sons, 1997, pp. 13-15.26. Dilworth B., University Alabma, McGraw-Hill Inc., p. 6.
o o o
20 State Transport in India: MSRTC