Embed Size (px)
Citation preview

STATE TAX CODES AS POVERTY FIGHTING TOOLS 2015 Update on Four Key Policies in All 50 States
Institute on Taxation and Economic Policy September 2015
1616 P Street, NW Suite 200 • Washington, DC 20036
202.299.1066 • www.itep.org

CONTENTS 1 Introduction
3 State Tax Strategies for Reducing Poverty
3 Refundable Earned Income Tax Credits
6 Property Tax Circuit Breaker for Homeowners and Renters
7 Targeted Low-Income Tax Credits
9 Child-related Tax Credits
10 Implementation: A Vital Step
11 Summary of Recommendations
11 Conclusion
APPENDICES
12 Appendix A: State EITCs in 2015
13 Appendix B: State Property Tax Credit Programs in 2015
14 Appendix C: State Low-Income Tax Credits in 2015
15 Appendix D: State Dependent Care Credits and State Child Credits in 2015
16 Appendix E: State-by-State List of Anti-Poverty Tax Policies in 2015
TEXT BOXES
1 2015 Developments in State Anti-Poverty Tax Policy
3 State Lawmakers Lift Up EITC in 2015
5 Importance of Refundability
7 States with the Greatest Need for Improvement
8 Low-Tax States are Often High-Tax States for Families in Poverty
10 Which States Get it (Close to) Right?

The U.S. Census Bureau released data in September showing that the share
of Americans living in poverty remains high. In 2014, the national poverty rate was 14.8 percent – statistically unchanged from the previous year.1 However, the poverty rate remains 2.3 percentage points higher than it was in 2007, before the Great Recession, indicating that recent economic gains have not yet reached all households and that there is much room for improve-ment. The 2014 measure translates to more than 46.7 million – more than 1 in 7 – Americans living in poverty. Most state poverty rates also held steady between 2013 and 2014 though twelve states expe-rienced a decline.2
The Supplemental Poverty Measure (SPM) released alongside the official mea-sure, demonstrates that the tax code can be used as an effective poverty-fighting tool.3
The federal EITC and refundable portion of the Child Tax Credit alone, for example, decreased the supplemental poverty rate from 18.4 to 15.3 percent for everyone. And, thanks in large part to those credits, the supplemental poverty rate for children is actually lower than their official poverty rate (16.7 compare to 21.5 percent).
Astonishingly, tax policies in virtually every state make it harder for those living in pov-erty to make ends meet. When all the taxes imposed by state and local governments
. . . . . . . . . . . . . . .1 Carmen DeNavas-Walt et al.,“Income, Poverty and Health Insurance Coverage in the United States in 2014,” U.S. Census Bureau, September 16, 20152 U.S. Census Bureau, American Community Survery 2014.3 Short, Kathleen, “The Supplemental Poverty Measure: 2014,” U.S. Census Bureau, September 2015
1
Forward Steps Taken to Address Poverty
Backward Steps Taken
2015 Developments in State Anti-Poverty Tax Policy
Colorado's 10 percent refundable state EITC will be funded and families will likely be able to file for the credit on their 2015 state tax returns.
Maine converted the state's nonrefundable 5 percent credit to a fully refundable credit. Lawmakers also created a new targeted refundable sales tax credit to offset the impact of increased sales taxes on low- and middle-income residents.
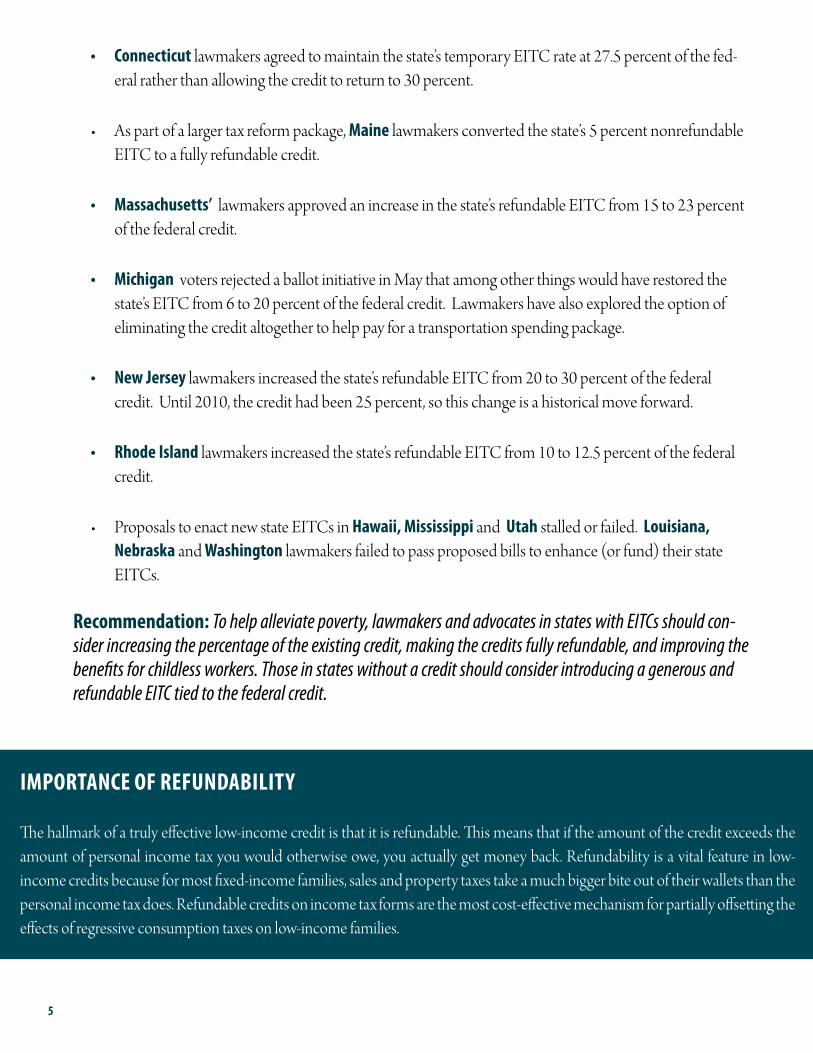
Connecticut lawmakers agreed to maintain the state’s temporary EITC rate at 27.5 percent of the federal rather than allowing the credit to return to 30 percent.
Massachusetts' state EITC was increased from 15 to 23 percent of the federal credit.
A proposal to eliminate Idaho's refundable grocery tax credit was defeated.
California enacted the state’s first refundable Earned Income Tax Credit. The new credit is targeted to working families and individuals with very low earnings and who are living in deep poverty.
New Jersey's state EITC was increased from 20 to 30 percent of the federal credit.
Rhode Island's state EITC was increased from 10 to 12.5 percent of the federal credit.
Hawaii's temporarily expanded the state’s food sales tax rebate. Most notably, the maximum credit increases from $85 to $110.
Louisiana, Nebraska, and Washington lawmakers failed to pass proposed bills to enhance (or fund) their state EITCs. Voters in Michigan rejected a ballot measure that would have, among other provisions, restored the state's EITC from 6 to 20 percent of the federal credit.
Missed Opportunities
Anti-Poverty Tax Policy Protected
Proposals to enact new state EITCs in Hawaii, Mississippi and Utah stalled or failed.
Mixed Results
New York enacted a permanent refundable income-based property tax credit for homeowners; the benefits of which will be phased-in over four years and are unavailable to homeowners living in NYC and non-property tax compliant jurisdictions.

are taken into account, every state imposes higher effective tax rates on poor families than on the richest taxpayers. Despite the unlevel playing field states create for their poorest residents through existing policies, many state policymakers have recently proposed (and in some cases enacted) tax increases on the poor un-der the guise of “tax reform,” often to finance tax cuts for their wealthiest residents and profitable corporations.
State and local tax systems typically make things harder for families living in poverty. A 2015 ITEP report, Who Pays? A Distributional Analysis of the Tax Systems in All 50 States, found that the poorest twenty percent of Americans paid on average 10.9 percent of their incomes in state and local taxes. Middle-income taxpayers didn’t fare much better, paying an average of 9.4 percent of their incomes toward those taxes. But when it comes to the wealthiest one percent, ITEP found they paid an average of just 5.4 percent of their incomes in state and local taxes.
The fact is that nearly every state and local tax system takes a much greater share of income from middle- and low-income families than from the wealthy. This “soak the poor” strategy pushes low-income families further into poverty and increases the likelihood that they will need to rely on safety net programs. From a state bud- geting perspective, this strategy also doesn’t yield much revenue compared to modest taxes on the rich.
There is a better approach. Just as state and local tax policies can push individuals and families further into poverty, there are tax policy tools available that can help them move out of poverty. In most states, a true rem-edy to improve state tax fairness would require comprehensive tax reform. Short of this, lawmakers should use their states’ tax systems as a means of providing affordable, effective and targeted assistance to people living in or close to poverty in their states.
This report presents a comprehensive overview of anti-poverty tax policies, surveys tax policy decisions made in the states in 2015, and offers recommendations that every state should consider to help families rise out of poverty. States can jump-start their anti-poverty efforts by enacting one or more of four proven and effective tax strategies to reduce the share of taxes paid by low- and moderate-income families: state Earned Income Tax Credits, property tax circuit breakers, targeted low-income credits, and child-related tax credits.
2

3
STATE TAX STRATEGIES FOR REDUCING POVERTY
Refundable Earned Income Tax Credits
The federal Earned Income Tax Credit (EITC) is widely recognized as an effective anti-poverty strategy. It was introduced in 1975 to provide targeted tax reductions to low-income workers and also to reward work and increase incomes.
The federal EITC is administered through the personal income tax. To encourage greater participation in the workforce, the EITC is based on earned income, such as salaries and wages. For example, for each dollarearned up to $13,870 in 2015, families with three children will receive a tax credit equal to 45 percent of those earnings, up to a maximum credit of $6,242. Because the credit is designed to provide tax relief to the working poor, there are income limits that restrict eligibility for the credit. Families continue to be eligible for the maximum credit until income reaches $18,110 (or $23,620 for married-couple families). Above this income level, the value of the credit is gradually reduced to zero and is unavailable when family income ex-ceeds the maximum eligibility level. The credit is entirely unavailable to families with three or more children earning more than $47,747 if the head of household is single and $53,267 if married. For taxpayers without children, the credit is less generous: the maximum credit is $503 and singles earning more than $14,820 (or $20,340 for married couples without children) are ineligible.
The Census Bureau estimated more than six million people, including 3.2 million children, were lifted out of poverty in 2013 thanks to the federal EITC.
In 2015, more than half of the states (twenty-seven states including the District of Columbia- see Appendix A) offer state Earned Income Tax Credits based on the federal EITC. Calculating a state EITC as a percent-
STATE LAWMAKERS LIFT UP EITCS AS POVERTY FIGHTING MEASURES IN 2015 Lawmakers from across the aisle came together in five states this year to champion Earned Income Tax Credits (EITCs) as vital tools to address poverty and provide targeted tax cuts to low-income working families. This legislative action was a huge victory for anti-poverty advocates who have largely been fighting proposals to weaken or eliminate the credit in recent years.
California became the 27th state (including DC) to enact a new refundable EITC. Massachusetts, New Jersey, and Rhode Island lawmakers boosted the value of their state credits and Maine lawmakers converted the state’s nonrefundable EITC to a fully refund-able credit.
State EITCs are invaluable in providing affordable, effective and targeted tax breaks to low-income working families who are hit hardest by state tax systems. While the fact remains that every state tax system is upside down, the advancements in state EITCs in 2015 will help improve tax fairness in the five states where lawmakers improved or enacted credits.

4
age of the federal credit makes the credit easier for state taxpayers to claim (since they have already calculated the amount of their federal credit) and easier for state tax administrators to monitor. However, states vary dramatically in the generosity of their credits. The credit provided by the District of Columbia amounts to 40 percent of the federal credit (100 percent for childless workers), while seven states will have credits worth less than 10 percent of the federal credit in 2015. In 2013, North Carolina became the first state to allow their EITC to expire. California enacted a new refundable EITC in 2015 targeted to families living in deep pov-erty.
Refundability is especially important in ensuring that deserving families get the full benefit of the state EITC. Refundable credits do not depend on the amount of income taxes paid: if the credit amount exceeds your in- come tax liability, the excess amount is given as a refund. Thus, refundable credits are useful in offsetting the regressive nature of sales and property taxes, and can provide a much needed income boost to help families pay for basic necessities. In 2015, all but three states (Delaware, Ohio and Virginia), with EITCs offer a fully refundable credit.
State EITCs generate bipartisan support because they are easily administered and relatively inexpensive. However, EITCs are most generous to families with children. Policymakers should be aware that the EITC does little to benefit seniors and low-income individuals without children because it was designed to specifi-cally help families with children. There are other tax provisions offered by states, like enhanced personal ex-emptions or standard deductions, that are available to elderly taxpayers. The EITC itself can also be modified to reach otherwise excluded groups. For example, policymakers in Washington, DC enhanced the district’s EITC for childless workers in 2014. President Obama has proposed a similar policy at the federal level, and there are now multiple bills pending in Congress and a handful of states to implement such a change. These recent developments reinforce the importance of linking state EITC eligibility rules to the federal program, so that any federal expansions are immediately passed on to the states.
2015 EITC Developments in the States
• California lawmakers enacted the state’s first refundable Earned Income Tax Credit. The new credit is targeted to working families and individuals with very low earnings and who are living in deep poverty. The credit is based on the federal credit, but has its own income eligibility parameters, phase out rules, and maximum credits. The new credit fully phases out for single, childless workers earning $6,580 or more and for married couples with two or more children earning $13,870 or more.
• Colorado lawmakers enacted a permanent 10 percent refundable state EITC in 2013 contingent on state revenues exceeding specified targets. Those targets were met in 2015, so Colorado working fami-lies will likely be able to file for the credit on their 2015 tax returns.
• Connecticut lawmakers agreed to maintain the state’s temporary EITC rate at 27.5 percent of the fed-eral rather than allowing the credit to return to 30 percent.
• As part of a larger tax reform package, Maine lawmakers converted the state’s 5 percent nonrefundable EITC to a fully refundable credit.
• Massachusetts’ lawmakers approved an increase in the state’s refundable EITC from 15 to 23 percent of the federal credit.
• Michigan voters rejected a ballot initiative in May that among other things would have restored the state’s EITC from 6 to 20 percent of the federal credit. Lawmakers have also explored the option of eliminating the credit altogether to help pay for a transportation spending package.
• New Jersey lawmakers increased the state’s refundable EITC from 20 to 30 percent of the federal credit. Until 2010, the credit had been 25 percent, so this change is a historical move forward.
• Rhode Island lawmakers increased the state’s refundable EITC from 10 to 12.5 percent of the federal credit.
• Proposals to enact new state EITCs in Hawaii, Mississippi and Utah stalled or failed. Louisiana, Nebraska and Washington lawmakers failed to pass proposed bills to enhance (or fund) their state EITCs.
Recommendation: To help alleviate poverty, lawmakers and advocates in states with EITCs should con-sider increasing the percentage of the existing credit, making the credits fully refundable, and improving the benefits for childless workers. Those in states without a credit should consider introducing a generous and refundable EITC tied to the federal credit.
5
IMPORTANCE OF REFUNDABILITY
The hallmark of a truly effective low-income credit is that it is refundable. This means that if the amount of the credit exceeds the amount of personal income tax you would otherwise owe, you actually get money back. Refundability is a vital feature in low-income credits because for most fixed-income families, sales and property taxes take a much bigger bite out of their wallets than the personal income tax does. Refundable credits on income tax forms are the most cost-effective mechanism for partially offsetting the effects of regressive consumption taxes on low-income families.

Property Tax Circuit Breaker for Homeowners & Renters
States employ a wide variety of mechanisms to reduce the amount of property taxes that low- and moderate- income families pay, though they vary significantly in effectiveness. A property tax circuit breaker is the only property tax reduction program explicitly designed to reduce the property tax burden on those low-income taxpayers hit hardest by the tax. Its name reflects its design: circuit breakers protect low-income residents from a property tax “overload”, just like electric circuit breakers prevent electricity surges in our homes. When a property tax bill exceeds a certain percentage of a taxpayer’s income, the circuit breaker offsets property taxes in excess of this “overload” level.
In 2015, 15 states and DC offer property tax circuit breaker programs that target tax reductions to low-income families who also owe significant property taxes relative to their incomes. Another 15 states provide property tax credits to some low-income families; however, the credits in those states are only based on income—these credits cut-off eligibility based on income, but do not include a provision requiring property taxes to exceed a set percentage of income to qualify for the credit (see Appendix B).
The most effective and targeted property tax credits are circuit breaker programs made available to all low- income taxpayers, regardless of age, and are also extended to renters. Because it is generally understood that renters pay property taxes indirectly in the form of higher rents, many states now extend their circuit breaker credit to renters as well. The calculation is typically the same as the one used for homeowners, with the ex- ception that renters must assume that their property tax bill is equal to some percentage of their rent. Renters in Maryland for instance, use 15 percent of their rent as their assumed property tax in calculating their circuit breaker credit. For a circuit breaker program to be successful, an effective outreach campaign is necessary.
2015 State Property Tax Circuit Breaker Developments
• New York lawmakers enacted a permanent refundable income-based property tax credit for home-owners; the benefits of which will be phased-in over four years. Homeowners with incomes of $275,000 and below will receive a rebate for a sliding-scale percentage of the tax savings due to their School Tax Relief (STAR) exemption. The credit is unavailable to New York City homeowners and others who live in property tax jurisdictions that do not comply with the state’s property tax cap.
Recommendation: State lawmakers and advocates interested in reducing the property taxes paid by low-income homeowners and renters should consider introducing a robust circuit-breaker program. States with circuit breaker programs only available to older adults or homeowners should consider expanding the program to low-income homeowners and renters of all ages.
6

Targeted Low-Income Tax Credits
Because the Earned Income Tax Credit is targeted to low-income working families with children, it typically offers little or no benefits to older adults and adults without children. Thus, refundable low-income credits are a good complementary policy to state EITCs (see Appendix C).
Eleven states offer targeted income tax credits to reduce (or zero out) low-income families’ personal income tax contributions. For example, Ohio offers a nonrefundable credit that ensures that families with incomes less than $10,000 aren’t subject to the income tax. Kentucky offers a nonrefundable credit based on family size to ensure that families at or below the poverty level aren’t subject to state income taxes. Making these targeted low-income credits refundable would increase their effectiveness for low-income families.
Seven states offer an income tax credit to help offset the sales and excise taxes that low-income families pay. Some of the credits are specifically intended to offset the impact of sales taxes on groceries. These credits are normally a flat dollar amount for each family member, and are available only to taxpayers with income below a certain threshold. They are usually administered on state income tax forms, and are refundable—meaning that the full credit is given even if it exceeds the amount of income tax a claimant owes.
Refundability is crucial because it allows low-income credits to be used by taxpayers who have little or no income tax liability but pay a substantial amount of their income in sales taxes. For example, Idaho offers a refundable credit for each Idahoan and their dependents to offset grocery taxes even if taxpayers aren’t
7
STATES WITH THE GREATEST NEED FOR IMPROVEMENT
Every state could stand to improve its tax policies toward low- and moder-ate- income families. However, some states have a stronger need to consider the reforms outlined in this report. The chart to the right shows the 10 states with the highest state and local taxes on the poor as a share of income ac-cording to ITEP’s 2015 Who Pays? report. Washington State, which does not have an income tax, is the highest-tax state in the country for poor people. In fact, when all state and local sales, excise and property taxes are tallied up, Washington’s poor families pay 16.8 percent of their total income in state and local taxes. Compare that to neighboring Idaho and Oregon, where the poor pay 8.5percent and 8.1 percent, respectively, of their incomes in state and local taxes—far less than in Washington. Hawaii, which relies heavily on consumption taxes, ranks second in its taxes on the poor, at 13.4 percent. Illinois—a state with a flat income tax rate —taxes its poor families at a rate of 13.2 percent, ranking third in this dubious distinction.
State% of Income Bottom 20% pay in State & Local Taxes
Washington 16.8%Hawaii 13.4%Illinois 13.2%Florida 12.9%Rhode Island 12.5%Arizona 12.5%Texas 12.5%Indiana 12.0%Pennsylvania 12.0%Arkansas 11.9%
Top 10 States with the Highest Taxes on the Poor

subject to the income tax. Kansas lawmakers eliminated their state’s refundable grocery tax credit in 2012 but enacted a new, less-effective nonrefundable credit in 2013.
2015 State Low-Income Tax Credit Developments
• Hawaii lawmakers temporarily expanded the state’s food sales tax rebate. Most notably, the maximum credit increases from $85 to $110.
• A bill that would have eliminated Idaho’s refundable grocery tax credit to pay for corporate and per-sonal income rate reductions failed. A similar bill that would have eliminated the state’s grocery tax credit to pay for exempting groceries from the sales tax base also failed.
• Maine lawmakers enacted a new refundable sales tax credit, the Sales Tax Fairness Credit, for low- and middle-income Maine residents. The credit amount is tied to family size and income and gradually phases out as income increases. For example, a married couple with 2 children with income below $40,000 would receive the maximum credit of $225 and the credit is unavailable to families with incomes of $52,000 and above.
Recommendation: State lawmakers and advocates committed to making sure taxes don’t push families further into poverty should create refundable, targeted low-income credits especially to help offset regres-sive sales and excise taxes. In states where these credits already exist, lawmakers should act to enhance them, such as by making them refundable.
8
STATES PRAISED AS “LOW-TAX” STATES ARE OFTEN HIGH TAX STATES FOR FAMILIES LIVING IN POVERTY
Annual state and local data from the Census Bureau is often used to rank states as “low” or “high” tax states based on taxes collect- ed as a share of state personal income. But focusing on a state’s overall tax revenues overlooks the fact that taxpayers experience tax systems very differently. In particular, the poorest 20 percent of taxpayers pay a greater share of their income in state and local taxes than any other income group in all but 15states . And, in every state, low- and moderate-income taxpayers pay significantly more as a share of income than the top 1 percent of taxpayers. The District of Columbia is the only tax system where the poorest residents pay the least as a share if income compared to other residents across the income spectrum
No income-tax states like Washington, Texas and Florida do, in fact, have average to low taxes overall. But, can they also be con-sidered “low-tax” states for poor families? Far from it. In fact, these states’ disproportionate reliance on sales and excise taxes make their taxes among the highest in the entire nation on low-income families. The bottom line is that many so-called “low-tax” states are high-tax states for the poor, and most do not offer a good deal to middle-income families either. Only the wealthy in such states pay relatively little.

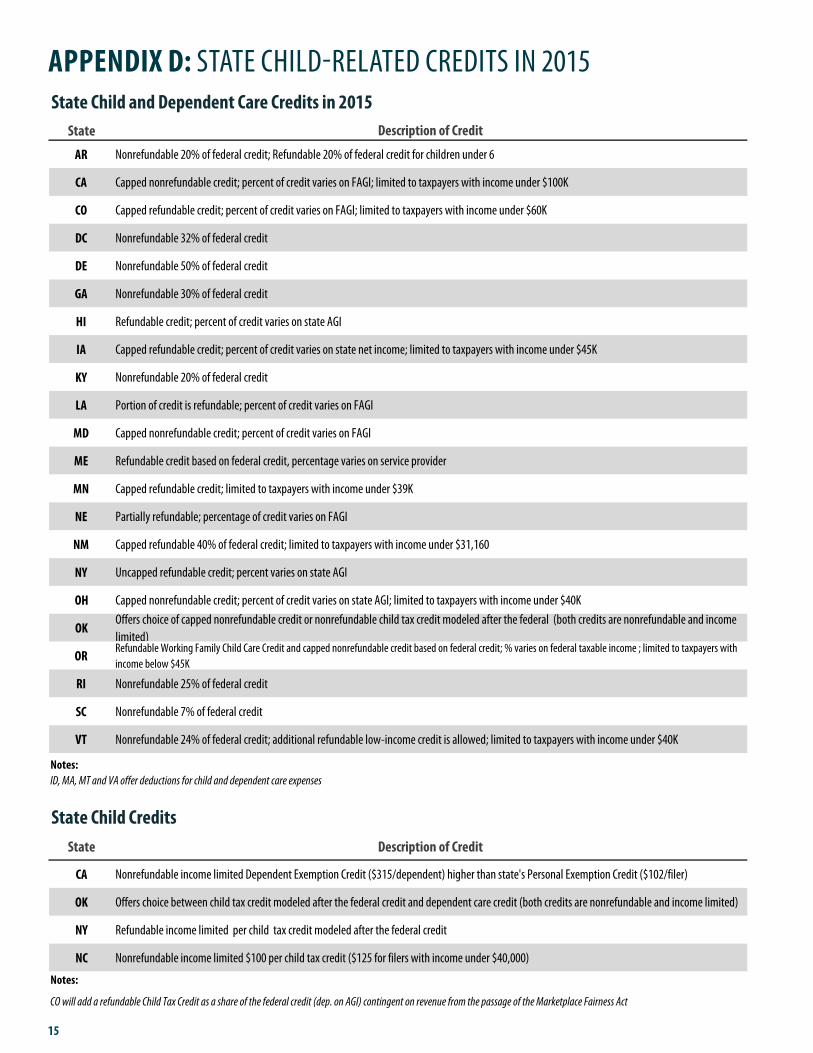
Child-Related Tax Credits
Child Tax Credits: Federal income tax law allows taxpayers to claim a $1,000 income tax credit for each de-pendent child under 17 years of age. The credit amount is gradually phased out for high income families. A portion of the child tax credit is refundable for low-income families.
Four states currently offer a much smaller version of the child tax credit for qualifying families (Colorado will join this list contingent on Congress passing a law to allow states to force out-of-state online retailers to collect and remit sales taxes-see Appendix D). These per-child credits are an important anti-poverty strategy, espe-cially if they are refundable and limited by income. The credits are offered beyond the extra dependent exemp-tions or exemption credits that most states offer families. For example, New York offers a $100 refundable child tax credit for qualifying families.
Child and Dependent Care Credits: Low and middle-income working parents increasingly spend a significant portion of their income on child care. The federal government allows a nonrefundable income tax credit to help offset child care expenses. In 2015, single working parents (and two-earner married couples) with children less than 12 years of age can claim a credit to partially offset up to $6,000 of child care expenses; low-income taxpayers can receive a credit of up to 35 percent of these expenses. The credit percentage gradually falls for higher-income taxpayers. This “sliding scale” approach helps to target tax relief somewhat more effec-tively to low-income taxpayers, but making the credit refundable would help those parents and children most in need.
The majority of the 22 states (including DC- See Appendix D) that offer a credit for child care expenses model their state credit on the federal credit. For example, Georgia allows taxpayers to take 30 percent of their federal child and dependent care credit as a nonrefundable child care credit. Nebraska takes a slightly different approach, offering both a refundable and a nonrefundable credit depending on a family’s income. The re-fundable child care credit is calculated as 100 percent of the federal credit for low income filers with incomes under $29,000. Higher earners can claim a nonrefundable credit equal to 25 percent of the federal credit. This approach targets the benefits of the Nebraska credit much more efficiently to low- and middle-income parents than does the federal credit.
2015 Child-Related Tax Credit Developments
• There were no significant changes made to state child-related tax credits in 2015.
Recommendation: State lawmakers and advocates who want to help low-income families with children should consider increasing the value of existing child credits, making them refundable, or introducing a new refundable per child credit. Lawmakers and advocates interested in targeting child and dependent care cred-its to help families most in need would do well to make their credits refundable and make the credit available only to families with limited incomes.
9

IMPLEMENTATION: A VITAL STEP
Offering the tax policies described in this report is a necessary step to helping lift families out of poverty, but simply offering these credits is not sufficient. In order to ensure that as many eligible families benefit from these anti-poverty policies as possible, lawmakers should consider how to make the credits more accessible. A simple design, such as linking a credit to an already established credit (as is the case with state EITCs) is a good place to start. Allowing taxpayers to claim credits on their personal income tax forms (as opposed to filling out a separate form or application at a different time of the year) also increases the likelihood that eligible taxpayers will take advantage of the credits.
Furthermore, policymakers, advocacy groups, and the media must work together to ensure that an effective outreach program is established and adequately funded so that taxpayers are informed about these credits. Outreach programs should be frequently evaluated to improve the effective reach of the tax credits offered.
WHICH STATES GET IT (CLOSE TO) RIGHT?
The most noticeable features of the least regressive tax states are a highly progressive income tax including targeted tax credits and a lesser reliance on sales and excise taxes. For example:
• Vermont’s tax system is among the least regressive in the nation because it has a highly progressive income tax and low sales and excise taxes. Vermont’s tax system is also made more fair by the size of the state’s refundable Earned Income Tax Credit (EITC) —32 percent of the federal credit—and a generous property tax circuit breaker credit.
• Delaware’s income tax is not very progressive, but its high reliance on income taxes and low dependence of consumption taxes results in a tax system that is only slightly regressive overall. Similarly, Oregon has a high reliance on income taxes and very low use of consumption taxes. Both states also offer a state EITC.
• New York and the District of Columbia each achieve a close-to-flat tax system overall through the use of generous refundable EITC’s and an income tax with relatively high top rates and limits on tax breaks for upper-income taxpayers. A recent tax reform bill in DC lowered the income tax rate for middle-income earners, increased the standard deduction and personal exemption allowed, and expanded the EITC for childless workers. New York also provides a refundable Child Tax Credit based on the federal program, and both states provide property tax circuit breaker credits.
It should be noted that even the least regressive states generally fail to meet what most would consider minimal standards of tax fairness. In each of these states, at least some low- or middle-income groups pay more of their income in state and local taxes than the wealthiest families must pay.
10

SUMMARY OF RECOMMENDATIONS
• State lawmakers and advocates in states with EITCs should consider increasing the percentage of the existing credit, making the credits fully refundable, and improving the benefit for childless workers. Those in states without a credit should consider introducing a generous and refundable EITC tied to the federal credit.
• State lawmakers and advocates interested in reducing the property taxes paid by low-income homeowners and renters should consider introducing a robust circuit-breaker program. States with circuit breaker pro-grams only available to older adults or homeowners should consider expanding the program to low-income homeowners and renters of all ages.
• State lawmakers and advocates committed to making sure taxes don’t push families further into poverty should create refundable, targeted low-income credits especially to help offset regressive sales and excise taxes. In states where these credits already exist, lawmakers should act to enhance them, such as by making them refundable.
• State lawmakers and advocates who want to help low-income families with children should consider in-creasing the value of existing child credits, making them refundable, or introducing a new refundable per child credit. Lawmakers and advocates interested in targeting child and dependent care credits to help families most in need would do well to make their credits refundable and make the credit available only to families with limited incomes.
CONCLUSION
American families living in poverty are in crisis, and many state tax systems across the country do too little to offer the assistance low-income families need. In fact, regressive state tax structures can push families deeper into poverty. State lawmakers have a responsibility to ensure that their state’s tax code does not exacerbate this crisis and should consider using the low-income tax credits outlined in this paper as a means of mitigating poverty in their states. Re-fundable tax credits are effective and time-tested anti-poverty solutions that would also provide additional income to help families pay for food, housing, transportation and other necessities. The reforms discussed in this paper are among the most cost-effective anti-poverty strategies available to state lawmakers.
11

APPENDIX A: STATE EITCS IN 2015
12
CA
CO
CT
DC** Starting in 2015, childless workers will receive a DC EITC worth 100% of the federal credit and income eligbity is expanded.
DE
IA
IL
IN Refundable
KS Non-Refundable
LA Currently unfunded
MA
MD 25.5/50%*
ME
MI
MN
NE
NJ
NM
NY
OH Additional limitations apply
OK
OR
RI*RI's EITC will increase to 12.5% in 2016
VA
VT
WA
WICredit amt. for 2 kids
Credit amt. for 1 kid
40%
20%
10%
*MD offers both a 50% non-refundable credit and a 25.5% refundable credit. Taxpayers claim the most helpful. The refundable portion will gradually increase to 28% by 2018.
Varies- Average is 33%
15%
17%
23%
10%
27.5% Temp. reduced from 30% thru 2016
3.5%
10%
9%
Provides a refundable credit to working families and individuals with very low earnings based on the federal credit. The credit phases out for single, childless workers earning $6,580 or more and for married couples with two or more children earning $13,870 or more. In 2015, the credit will equal 85% of the federal for those beneficiaries with earnings in the credit phase-in range. The credit percentage will be set annually through the budget process.
5%
6%
33%
8%
10%
10%
30%
30%
5%
10%
4%
20%
32%
10%
34% Credit amt. for 3 kids
11%

13
APPENDIX B: PROPERTY TAX CREDIT PROGRAMS IN 2015State Age Requirements Covers Renters? Approach
AZ 65+ YES Income based only
CA 62+ Renters only Income based only
CO 65+ YES Income based only
CT 65+ YES Income based only
DC All Ages; Sep. Elderly Program YES Circuit Breaker
HI All Ages; Doubled for Elderly Renters only Income based only
IA 65+ YES Income based only
ID 65+ NO Income based only
KS 55+, disabled/ dep. child under 18 NO Income based only
MA 65+ YES Circuit Breaker
MD All Ages YES Circuit Breaker
ME All Ages; Sep. Elderly Program YES Circuit Breaker
MI All Ages; Sep. Elderly Program YES Circuit Breaker
MN All Ages YES Circuit Breaker
MO 65+ YES Circuit Breaker
MT All Ages YES, Elderly only Circuit Breaker
ND 65+ YES Income based only
NH All Ages NO Income based only
NJ All Ages NO Circuit Breaker
NM 65+ YES Circuit Breaker
NY All Ages; Sep. Elderly Program NO Income based only
OK 65+ NO Circuit Breaker
OR 58+ Renters only Circuit Breaker
PA 65+ YES Income based only
RI 65+ YES Circuit Breaker
SD 65+ NO Income based only
UT 65+ YES Income based only
VT All Ages YES Circuit Breaker
WI All Ages YES Circuit Breaker
WV All Ages NO Circuit Breaker
WY All Ages; Sep Elderly Program NO Income based only

14
APPENDIX C: STATE TARGETED LOW-INCOME TAX CREDITS IN 2015
State Description of Credit
AZ Provides a refundable "Increased Excise Tax Credit" for low-income taxpayers of all ages
HIProvides a "Refundable Food/Excise Tax Credit" for taxpayers with FAGI below $50,000. In 2016, eligibility is changed for single taxpayers to $30,000 FAGI
IDProvides a refundable "Grocery Credit" to all families regardless of income. The credit is $100 per family member. Elderly taxpayers receive an extra $10 per filer
KSProvides a targeted, nonrefundable food sales tax credit to families with income below $30,615 with at least one dependent or who are over 55 years of age; the maximum credit is $125 per exemption
MEProvides a targeted, refundable Sales Tax Fairness Credit to low- and middle-income families dependent on family size and income; the maximum credit is $225
NM Provides a "Low Income Comprehensive Tax Rebate" for all low income taxpayers
OK Provides a refundable "Credit/Refund of Sales Tax" for low-income taxpayers of all ages
Credits Designed to Offset Sales Tax/Tax on Food
State Description of Credit
AZ Nonrefundable "Family Tax Credit" available to low-income taxpayers; eligibility varies with family size and structure
GA Nonrefundable "Low Income Credit" available if FAGI is less than $20,000
INRefundable "Unified Tax Credit for the Elderly" available if FAGI is less than $10,000 and one or more household members are age 65 or older
KY Nonrefundable "Family Size Credit" based on family size and "modified" gross income
MDNonrefundable “State Poverty Level Credit” equal to 5% of earned income is available to low-income taxpayers; eligibility varies with family size and structure
NY Nonrefundable "Household Credit" available if FAGI is less than $28,000 for single filers and $32,000 for others
OH Nonrefundable credit to ensure that families with Ohio AGI under $10,000 don't pay any income tax
PA Nonrefundable Tax Forgiveness credit that allows eligible taxpayers to reduce all or part of their state income tax liability
VANonrefundable "Tax Credit for Low-Income Individuals" that can be taken in lieu of the EITC; eligibility varies with family size and structure
WINonrefundable "working families tax credit" is available if Wisconsin income is less than $19,000 for married filers ($10,000 for other filers)
WV Nonrefundable "Family Tax Credit" available to low-income taxpayers; eligibility varies with family size and structure
Credits Designed to Reduce Personal Income Taxes
15
APPENDIX D: STATE CHILD-RELATED CREDITS IN 2015
State Description of Credit
AR Nonrefundable 20% of federal credit; Refundable 20% of federal credit for children under 6
CA Capped nonrefundable credit; percent of credit varies on FAGI; limited to taxpayers with income under $100K
CO Capped refundable credit; percent of credit varies on FAGI; limited to taxpayers with income under $60K
DC Nonrefundable 32% of federal credit
DE Nonrefundable 50% of federal credit
GA Nonrefundable 30% of federal credit
HI Refundable credit; percent of credit varies on state AGI
IA Capped refundable credit; percent of credit varies on state net income; limited to taxpayers with income under $45K
KY Nonrefundable 20% of federal credit
LA Portion of credit is refundable; percent of credit varies on FAGI
MD Capped nonrefundable credit; percent of credit varies on FAGI
ME Refundable credit based on federal credit, percentage varies on service provider
MN Capped refundable credit; limited to taxpayers with income under $39K
NE Partially refundable; percentage of credit varies on FAGI
NM Capped refundable 40% of federal credit; limited to taxpayers with income under $31,160
NY Uncapped refundable credit; percent varies on state AGI
OH Capped nonrefundable credit; percent of credit varies on state AGI; limited to taxpayers with income under $40K
OKOffers choice of capped nonrefundable credit or nonrefundable child tax credit modeled after the federal (both credits are nonrefundable and income limited)
ORRefundable Working Family Child Care Credit and capped nonrefundable credit based on federal credit; % varies on federal taxable income ; limited to taxpayers with income below $45K
RI Nonrefundable 25% of federal credit
SC Nonrefundable 7% of federal credit
VT Nonrefundable 24% of federal credit; additional refundable low-income credit is allowed; limited to taxpayers with income under $40K
Notes:ID, MA, MT and VA offer deductions for child and dependent care expenses
State Description of Credit
CA Nonrefundable income limited Dependent Exemption Credit ($315/dependent) higher than state's Personal Exemption Credit ($102/filer)
OK Offers choice between child tax credit modeled after the federal credit and dependent care credit (both credits are nonrefundable and income limited)
NY Refundable income limited per child tax credit modeled after the federal credit
NC Nonrefundable income limited $100 per child tax credit ($125 for filers with income under $40,000)
Notes:
CO will add a refundable Child Tax Credit as a share of the federal credit (dep. on AGI) contingent on revenue from the passage of the Marketplace Fairness Act
State Child and Dependent Care Credits in 2015
State Child Credits

16
APPENDIX E: 2015 STATE-BY-STATE ANTI-POVERTY TAX POLICIES
Alabama 19.3%
State and Local Taxes as % of Income in 2015*
Lowest 20% Middle 20% Top 1%Average Income in Group $11,000 $35,600 $1,050,400
Taxes as a Share of Income 10.0% 9.5% 3.8%
Anti-Poverty Tax Policies Offered Anti-Poverty Tax Policies to Consider
> Introduce a Refundable Earned Income Tax Credit
> Create a Low-Income Property Tax Circuit Breaker
> Create a Child-related Credit
> Create a Refundable Low-Income Credit
Alaska 11.2%
State and Local Taxes as % of Income in 2015*
Lowest 20% Middle 20% Top 1%Average Income in Group $15,000 $52,100 $1,289,700
Taxes as a Share of Income 7.0% 4.5% 2.5%
Anti-Poverty Tax Policies Offered Anti-Poverty Tax Policies to Consider
> Introduce a Refundable Earned Income Tax Credit
> Create a Low-Income Property Tax Circuit Breaker
> Create a Child-related Credit
> Create a Refundable Low-Income Credit
Arizona 18.2%
State and Local Taxes as % of Income in 2015*
Lowest 20% Middle 20% Top 1%Average Income in Group $13,100 $42,000 $1,239,400
Taxes as a Share of Income 12.5% 9.2% 4.6%
Anti-Poverty Tax Policies Offered: Anti-Poverty Tax Policies to Consider
> Targeted, nonrefundable and all ages, "Family Tax Credit" > Enhance Low-Income Credits
> Introduce a Refundable Earned Income Tax Credit
> Create a Child-related Credit
2014 Poverty Rate =
> Targeted, refundable and all ages, "Excise Tax Credit"
> NONE
*The baseline distribution of taxes is from ITEP's 2015 Who Pays? report. The figures represent total state and local taxes as a share of income, post-federal offset.
*The baseline distribution of taxes is from ITEP's 2015 Who Pays? report. The figures represent total state and local taxes as a share of income, post-federal offset.
2014 Poverty Rate =
*The baseline distribution of taxes is from ITEP's 2015 Who Pays? report. The figures represent total state and local taxes as a share of income, post-federal offset.
2014 Poverty Rate =
> Make true circuit breaker credit and expand to include Homeowners and Renters of All Ages; Raise Maximum Benefits
> NONE
> Low-Income property tax credit (For Homeowners and Renters, 65+ or Disabled)

17
Arkansas 18.9%
State and Local Taxes as % of Income in 2015*
Lowest 20% Middle 20% Top 1%Average Income in Group $9,600 $36,500 $909,100
Taxes as a Share of Income 11.9% 11.4% 5.6%
Anti-Poverty Tax Policies Offered: Anti-Poverty Tax Policies to Consider
> Offers low income alternative tax table > Create a Refundable Low-Income Credit
> Introduce a Refundable Earned Income Tax Credit
> Create a Low-Income Property Tax Circuit Breaker
California 16.4%
State and Local Taxes as % of Income in 2015*
Lowest 20% Middle 20% Top 1%Average Income in Group $13,900 $48,600 $1,966,700
Taxes as a Share of Income 10.5% 8.2% 8.7%
Anti-Poverty Tax Policies Offered: Anti-Poverty Tax Policies to Consider
> Create a Refundable Low-Income Credit
> Low-Income Renters credit available > Make Child and Dependent Care credit refundable
Colorado 12.0%
State and Local Taxes as % of Income in 2015*
Lowest 20% Middle 20% Top 1%Average Income in Group $12,300 $51,300 $1,779,900
Taxes as a Share of Income 8.4% 8.1% 4.6%
Anti-Poverty Tax Policies Offered: Anti-Poverty Tax Policies to Consider
> Refundable Earned Income Tax Credit at 10% > Fully Fund the Earned Income Credit
> Create a Refundable Low-Income Credit
> Fully Fund the Child tax credit
2014 Poverty Rate =
> Make Child and Dependent Care Credit Fully Refundable; Increase maximum benefits> Child and Dependent Care Credit offered modeled after the federal credit; Refundable for children under age 6
> Expand Circuit Breaker program to Include Homeowners and Renters of All Ages; Raise Maximum Benefits
> Refundable income-limited Child and Dependent Care Credit offered modeled after the federal credit
> Low-Income Quasi-Circuit Breaker (For Homeowners and Renters, 65+ or Disabled)
> Refundable Child Tax Credit (currently unfunded)
*The baseline distribution of taxes is from ITEP's 2015 Who Pays? report. The figures represent total state and local taxes as a share of income, post-federal offset.
> Low-Income quasi-Circuit Breaker (For Homeowners and Renters, 62+ or Disabled)
> Nonrefundable income limited Dependent Exemption Credit higher than state's Personal Exemption Credit
2014 Poverty Rate =
> Nonrefundable income limited Child and Dependent Care Credit offered modeled after the federal credit
*The baseline distribution of taxes is from ITEP's 2015 Who Pays? report. The figures represent total state and local taxes as a share of income, post-federal offset.
2014 Poverty Rate =
*The baseline distribution of taxes is from ITEP's 2015 Who Pays? report. The figures represent total state and local taxes as a share of income, post-federal offset.
> Refundable Earned Income Tax Credit targeted to working families and individuals with very low earnings
> Fully Fund Circuit Breaker Program; Expand Program to Include Homeowners and Renters of All Ages; Raise Maximum Benefits

18
Connecticut 10.8%
State and Local Taxes as % of Income in 2015*
Lowest 20% Middle 20% Top 1%Average Income in Group $13,000 $59,600 $3,822,000
Taxes as a Share of Income 10.5% 10.7% 5.3%
Anti-Poverty Tax Policies Offered: Anti-Poverty Tax Policies to Consider
> Create a Child-related Credit
> Create a Refundable Low-Income Credit
Delaware 12.5%
State and Local Taxes as % of Income in 2015*
Lowest 20% Middle 20% Top 1%Average Income in Group $10,300 $44,300 $1,225,500
Taxes as a Share of Income 5.5% 5.3% 4.8%
Anti-Poverty Tax Policies Offered: Anti-Poverty Tax Policies to Consider
> Nonrefundable Earned Income Tax Credit at 20%
> Create a Low-Income Property Tax Circuit Breaker
> Create a Refundable Low-Income Credit
District of Columbia 17.7%
State and Local Taxes as % of Income in 2015*
Lowest 20% Middle 20% Top 1%Average Income in Group $13,600 $52,100 $2,840,300
Taxes as a Share of Income 5.6% 10.3% 6.4%
Anti-Poverty Tax Policies Offered: Anti-Poverty Tax Policies to Consider
> Increase Earned Income Tax Credit
> Create a Refundable Low-Income Credit
> Nonrefundable Child and Dependent Care Credit offered modeled after the federal credit
> Nonrefundable Child and Dependent Care Credit offered modeled after the federal credit > Make Child and Dependent Care Credit Refundable and Increase maximum benefits
> Low-Income Multiple Threshold Circuit Breaker (For Homeowners and Renters, All Ages) > Enhance Circuit Breaker Program
*The baseline distribution of taxes is from ITEP's 2015 Who Pays? report. The figures represent total state and local taxes as a share of income, post-federal offset.
*The baseline distribution of taxes is from ITEP's 2015 Who Pays? report. The figures represent total state and local taxes as a share of income, post-federal offset.
> Refundable Earned Income Tax Credit at 30% (remains temporarily reduced at 27.5%)
> Low-Income Sliding Scale Circuit Breaker (For Homeowners and Renters, 65+ or Disabled)
> Restore and Increase state EITC
> Refundable Earned Income Tax Credit at 40%(100% expanded EITC for childless workers in 2015).
2014 Poverty Rate =
> Expand Circuit Breaker program to Include Homeowners and Renters of All Ages
> Make Earned Income Tax Credit Refundable and Increase Percentage
> Make Child and Dependent Care Credit Refundable and Increase Maximum Benefits
2014 Poverty Rate =
2014 Poverty Rate =
*The baseline distribution of taxes is from ITEP's 2015 Who Pays? report. The figures represent total state and local taxes as a share of income, post-federal offset.

19
Florida 16.5%
State and Local Taxes as % of Income in 2015*
Lowest 20% Middle 20% Top 1%Average Income in Group $10,700 $37,700 $2,075,100
Taxes as a Share of Income 12.9% 8.5% 1.9%
Anti-Poverty Tax Policies Offered: Anti-Poverty Tax Policies to Consider
> Introduce a Refundable Earned Income Tax Credit
> Create a Low-Income Property Tax Circuit Breaker
> Create a Child-related Credit
> Create a Refundable Low-Income Credit
Georgia 18.3%
State and Local Taxes as % of Income in 2015*
Lowest 20% Middle 20% Top 1%Average Income in Group $10,000 $38,700 $1,179,200
Taxes as a Share of Income 10.4% 9.4% 5.0%
Anti-Poverty Tax Policies Offered: Anti-Poverty Tax Policies to Consider
> Nonrefundable, all ages, Low-Income Credit offered > Make Low-Income Credit Refundable and increase amount of credit
> Introduce a Refundable Earned Income Tax Credit
> Create a Low-Income Property Tax Circuit Breaker
Hawaii 11.4%
State and Local Taxes as % of Income in 2015*
Lowest 20% Middle 20% Top 1%Average Income in Group $10,100 $42,100 $811,300
Taxes as a Share of Income 13.4% 11.4% 7.0%
Anti-Poverty Tax Policies Offered: Anti-Poverty Tax Policies to Consider
> Enhance existing Low-Income Credits
> Refundable Child and Dependent Care Credit offered
> Refundable income limited credit for renters > Create a Low-Income Property Tax Circuit Breaker for homeowners
> Introduce a Refundable Earned Income Tax Credit
2014 Poverty Rate =
> NONE
2014 Poverty Rate =
> Limit Child and Dependent Care Credit to Low-Income Families and increase benefits
*The baseline distribution of taxes is from ITEP's 2015 Who Pays? report. The figures represent total state and local taxes as a share of income, post-federal offset.
> Nonrefundable Child and Dependent Care Credit offered modeled after the federal credit > Make Child and Dependent Care Credit Refundable and Limit to Low-Income Families
2014 Poverty Rate =
> Refundable, all ages, Low-Income Credit offered to assist in offsetting food and excise taxes (temporarily expanded the state's food sales tax rebate)
*The baseline distribution of taxes is from ITEP's 2015 Who Pays? report. The figures represent total state and local taxes as a share of income, post-federal offset.
*The baseline distribution of taxes is from ITEP's 2015 Who Pays? report. The figures represent total state and local taxes as a share of income, post-federal offset.
20
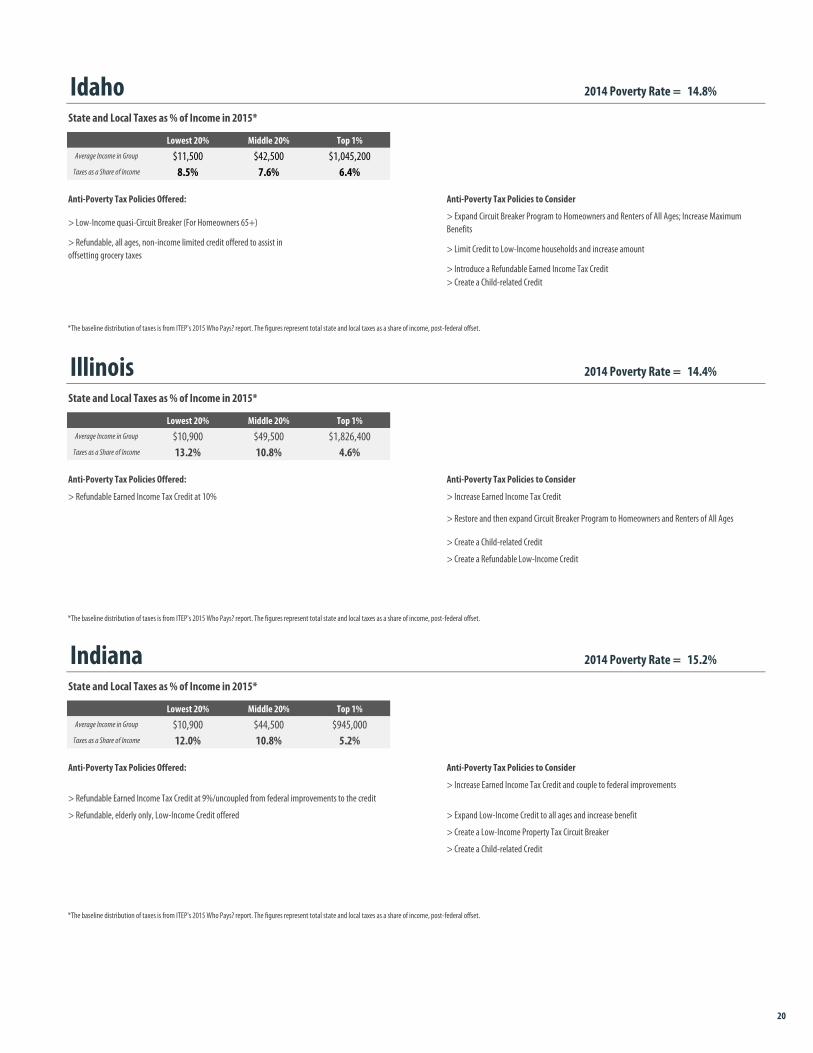
Idaho 14.8%
State and Local Taxes as % of Income in 2015*
Lowest 20% Middle 20% Top 1%Average Income in Group $11,500 $42,500 $1,045,200
Taxes as a Share of Income 8.5% 7.6% 6.4%
Anti-Poverty Tax Policies Offered: Anti-Poverty Tax Policies to Consider
> Limit Credit to Low-Income households and increase amount
> Introduce a Refundable Earned Income Tax Credit> Create a Child-related Credit
Illinois 14.4%
State and Local Taxes as % of Income in 2015*
Lowest 20% Middle 20% Top 1%Average Income in Group $10,900 $49,500 $1,826,400
Taxes as a Share of Income 13.2% 10.8% 4.6%
Anti-Poverty Tax Policies Offered: Anti-Poverty Tax Policies to Consider
> Refundable Earned Income Tax Credit at 10% > Increase Earned Income Tax Credit
> Create a Child-related Credit
> Create a Refundable Low-Income Credit
Indiana 15.2%
State and Local Taxes as % of Income in 2015*
Lowest 20% Middle 20% Top 1%Average Income in Group $10,900 $44,500 $945,000
Taxes as a Share of Income 12.0% 10.8% 5.2%
Anti-Poverty Tax Policies Offered: Anti-Poverty Tax Policies to Consider
> Refundable, elderly only, Low-Income Credit offered > Expand Low-Income Credit to all ages and increase benefit
> Create a Low-Income Property Tax Circuit Breaker
> Create a Child-related Credit
> Low-Income quasi-Circuit Breaker (For Homeowners 65+)> Expand Circuit Breaker Program to Homeowners and Renters of All Ages; Increase Maximum Benefits
> Refundable, all ages, non-income limited credit offered to assist in offsetting grocery taxes
> Refundable Earned Income Tax Credit at 9%/uncoupled from federal improvements to the credit> Increase Earned Income Tax Credit and couple to federal improvements
*The baseline distribution of taxes is from ITEP's 2015 Who Pays? report. The figures represent total state and local taxes as a share of income, post-federal offset.
2014 Poverty Rate =
*The baseline distribution of taxes is from ITEP's 2015 Who Pays? report. The figures represent total state and local taxes as a share of income, post-federal offset.
2014 Poverty Rate =
> Restore and then expand Circuit Breaker Program to Homeowners and Renters of All Ages
2014 Poverty Rate =
*The baseline distribution of taxes is from ITEP's 2015 Who Pays? report. The figures represent total state and local taxes as a share of income, post-federal offset.

21
Iowa 12.2%
State and Local Taxes as % of Income in 2015*
Lowest 20% Middle 20% Top 1%Average Income in Group $11,600 $50,500 $955,900
Taxes as a Share of Income 10.4% 9.7% 6.0%
Anti-Poverty Tax Policies Offered: Anti-Poverty Tax Policies to Consider
> Refundable Earned Income Tax Credit at 15% > Increase Earned Income Tax Credit
> Low-Income Sliding Scale Circuit Breaker (For Homeowners and Renters, 65+ or Disabled)
> Create a Refundable Low-Income Credit
Kansas 13.6%
State and Local Taxes as % of Income in 2015*
Lowest 20% Middle 20% Top 1%Average Income in Group $10,900 $47,700 $1,191,700
Taxes as a Share of Income 11.1% 9.5% 3.6%
Anti-Poverty Tax Policies Offered: Anti-Poverty Tax Policies to Consider
> Refundable Earned Income Tax Credit at 17% > Increase Earned Income Tax Credit
> Low-income nonrefundable food tax credit
Kentucky 19.1%
State and Local Taxes as % of Income in 2015*
Lowest 20% Middle 20% Top 1%Average Income in Group $9,100 $38,300 $839,500
Taxes as a Share of Income 9.0% 10.8% 6.0%
Anti-Poverty Tax Policies Offered: Anti-Poverty Tax Policies to Consider
> Nonrefundable, all ages, Low-Income Credit offered > Make Low-Income Credit Refundable and increase credit amount
> Introduce a Refundable Earned Income Tax Credit
> Create a Low-Income Property Tax Circuit Breaker
*The baseline distribution of taxes is from ITEP's 2015 Who Pays? report. The figures represent total state and local taxes as a share of income, post-federal offset.
> Nonrefundable Child and Dependent Care Credit offered modeled after the federal credit
> Make Child and Dependent Care Credit Refundable and Limit to Low-Income Families
> Expand Circuit Breaker Program to Homeowners and Renters of All Ages; Increase Maximum Benefits
> Refundable income limited Child and Dependent Care Credit offered modeled after the federal credit
2014 Poverty Rate =
> Low-Income Sliding Scale Circuit Breaker (For Homeowners, 55+, Disabled, Or With Dependent Under 18)
> Expand Circuit Breaker Program to Homeowners and Renters of All Ages; Increase Maximum Benefits
> Make food tax credit refundable
2014 Poverty Rate =
*The baseline distribution of taxes is from ITEP's 2015 Who Pays? report. The figures represent total state and local taxes as a share of income, post-federal offset.
*The baseline distribution of taxes is from ITEP's 2015 Who Pays? report. The figures represent total state and local taxes as a share of income, post-federal offset.
> Reinstate Child and Dependent Care Credit
2014 Poverty Rate =

22
Louisiana 19.8%
State and Local Taxes as % of Income in 2015*
Lowest 20% Middle 20% Top 1%Average Income in Group $10,900 $40,700 $1,225,800
Taxes as a Share of Income 10.0% 9.5% 4.2%
Anti-Poverty Tax Policies Offered: Anti-Poverty Tax Policies to Consider
> Refundable Earned Income Tax Credit at 3.5% > Increase Earned Income Tax Credit
> Create a Low-Income Property Tax Circuit Breaker
> Create a Refundable Low-Income Credit
Maine 14.1%
State and Local Taxes as % of Income in 2015*
Lowest 20% Middle 20% Top 1%Average Income in Group $12,200 $42,100 $813,600
Taxes as a Share of Income 9.4% 9.4% 7.5%
Anti-Poverty Tax Policies Offered: Anti-Poverty Tax Policies to Consider
> Refundable Earned Income Tax Credit at 5% > Increase the percentage of the Earned Income Tax Credit
> Enhance Circuit Breaker Program; Increase Maximum Credit
> Make Child and Dependent Care Credit Fully Refundable
> Create a Refundable Low-Income Credit
Maryland 10.1%
State and Local Taxes as % of Income in 2015*
Lowest 20% Middle 20% Top 1%Average Income in Group $13,100 $54,300 $1,590,700
Taxes as a Share of Income 9.7% 10.3% 6.7%
Anti-Poverty Tax Policies Offered: Anti-Poverty Tax Policies to Consider
> Increase Earned Income Tax Credit
> Nonrefundable "State Poverty Level Credit" offered > Create a Refundable Low-Income Credit
> Refundable Earned Income Tax Credit at 25% (increasing to 28% by 2018); Nonrefundable up to 50%> Low- and Middle- Income Multiple Threshold Circuit Breaker (For Homeowners All Ages and Renters 60+, Disabled, or With Dependent)
> Increase Circuit Breaker program benefits and make fully available to low-income renters.
> Nonrefundable income limited Child and Dependent Care Credit offered modeled after the federal credit
> Make Child and Dependent Care Credit Refundable and Increase maximum benefits
2014 Poverty Rate =
*The baseline distribution of taxes is from ITEP's 2015 Who Pays? report. The figures represent total state and local taxes as a share of income, post-federal offset.
> Refundable Child and Dependent Care Credit offered
> Expand Child and Dependent Care Credit to Include Children Over the Age of 5 and make the credit Refundable> Partially Refundable Child and Dependent Care Credit offered modeled after the federal credit
2014 Poverty Rate =
*The baseline distribution of taxes is from ITEP's 2015 Who Pays? report. The figures represent total state and local taxes as a share of income, post-federal offset.
*The baseline distribution of taxes is from ITEP's 2015 Who Pays? report. The figures represent total state and local taxes as a share of income, post-federal offset.
> Low- and Middle- Income Circuit Breaker (For Homeowners and Renters, All Ages)
2014 Poverty Rate =
> Targeted, refundable sales tax credit to offset the impact of increased sales taxes on low- and middle-income Maine residents

23
Massachusetts 11.6%
State and Local Taxes as % of Income in 2015*
Lowest 20% Middle 20% Top 1%Average Income in Group $12,400 $56,400 $2,560,300
Taxes as a Share of Income 10.4% 9.3% 4.9%
Anti-Poverty Tax Policies Offered: Anti-Poverty Tax Policies to Consider
> Refundable Earned Income Tax Credit at 23% of the federal credit
> Create a Child-related Credit
> Create a Refundable Low-Income Credit
Michigan 16.2%
State and Local Taxes as % of Income in 2015*
Lowest 20% Middle 20% Top 1%Average Income in Group $9,500 $44,000 $1,164,700
Taxes as a Share of Income 9.2% 9.2% 5.1%
Anti-Poverty Tax Policies Offered: Anti-Poverty Tax Policies to Consider
> Refundable Earned Income Tax Credit at 6%
> Increase Circuit Breaker Program Benefits/Restore to pre 2012 levels
> Create a Child-related Credit
> Create a Refundable Low-Income Credit
Minnesota 11.5%
State and Local Taxes as % of Income in 2015*
Lowest 20% Middle 20% Top 1%Average Income in Group $13,200 $55,400 $1,636,000
Taxes as a Share of Income 8.8% 9.6% 7.5%
Anti-Poverty Tax Policies Offered: Anti-Poverty Tax Policies to Consider
> Increase Earned Income Tax Credit
> Enhance Circuit Breaker Program
> Refundable Child and Dependent Care Credit offered > Create a Refundable Low-Income Credit
> Create a Child-related credit
> Refundable Earned Income Tax Credit, structured differently from the federal credit, average rate is 33%
> Low- and Middle- Income Circuit Breaker (For Homeowners and Renters, All Ages)
> Low-Income Circuit Breaker (For Homeowners and Renters, All Ages)
*The baseline distribution of taxes is from ITEP's 2015 Who Pays? report. The figures represent total state and local taxes as a share of income, post-federal offset.
> Restore the Earned Income Tax Credit to 20% (pre 2012 amount)
2014 Poverty Rate =
*The baseline distribution of taxes is from ITEP's 2015 Who Pays? report. The figures represent total state and local taxes as a share of income, post-federal offset.
> Low- and Middle- Income Circuit Breaker (For Homeowners and Renters, 65+)
2014 Poverty Rate =
*The baseline distribution of taxes is from ITEP's 2015 Who Pays? report. The figures represent total state and local taxes as a share of income, post-federal offset.
2014 Poverty Rate =
> Expand Circuit Breaker Program to Homeowners and Renters of All Ages; Increase Maximum Credit

24
Mississippi 21.5%
State and Local Taxes as % of Income in 2015*
Lowest 20% Middle 20% Top 1%Average Income in Group $9,700 $33,100 $736,800
Taxes as a Share of Income 10.4% 10.6% 5.3%
Anti-Poverty Tax Policies Offered Anti-Poverty Tax Policies to Consider
> Introduce a Refundable Earned Income Tax Credit
> Create a Low-Income Property Tax Circuit Breaker
> Create a Child-related Credit
> Create a Refundable Low-Income Credit
Missouri 15.5%
State and Local Taxes as % of Income in 2015*
Lowest 20% Middle 20% Top 1%Average Income in Group $10,800 $42,300 $1,088,200
Taxes as a Share of Income 9.5% 9.0% 5.5%
Anti-Poverty Tax Policies Offered Anti-Poverty Tax Policies to Consider
> Introduce a Refundable Earned Income Tax Credit
> Create a Child-related Credit
> Create a Refundable Low-Income Credit
Montana 15.4%
State and Local Taxes as % of Income in 2015*
Lowest 20% Middle 20% Top 1%Average Income in Group $10,500 $42,300 $1,047,500
Taxes as a Share of Income 6.1% 6.4% 4.7%
Anti-Poverty Tax Policies Offered Anti-Poverty Tax Policies to Consider
> Introduce a Refundable Earned Income Tax Credit
> Create a Child-related Credit
> Create a Refundable Low-Income Credit
> Expand Circuit Breaker Program to Renters and Homeowners of All Ages; Increase Maximum Benefits
*The baseline distribution of taxes is from ITEP's 2015 Who Pays? report. The figures represent total state and local taxes as a share of income, post-federal offset.
> Expand Circuit Breaker Program to Renters and Homeowners of All Ages; Increase Maximum Benefits
> NONE
*The baseline distribution of taxes is from ITEP's 2015 Who Pays? report. The figures represent total state and local taxes as a share of income, post-federal offset.
2014 Poverty Rate =
*The baseline distribution of taxes is from ITEP's 2015 Who Pays? report. The figures represent total state and local taxes as a share of income, post-federal offset.
> Low-Income Circuit Breaker (For Homeowners and Renters, 65+ or Disabled)
2014 Poverty Rate =
2014 Poverty Rate =
> Low-Income Circuit Breaker (For Homeowners All Ages and Renters, 62+)

25
Nebraska 12.4%
State and Local Taxes as % of Income in 2015*
Lowest 20% Middle 20% Top 1%Average Income in Group $11,900 $48,900 $1,332,500
Taxes as a Share of Income 10.9% 10.3% 6.3%
Anti-Poverty Tax Policies Offered Anti-Poverty Tax Policies to Consider
> Refundable Earned Income Tax Credit at 10% > Increase Earned Income Tax Credit
> Create a Refundable Low-Income Credit
Nevada 15.2%
State and Local Taxes as % of Income in 2015*
Lowest 20% Middle 20% Top 1%Average Income in Group $12,900 $40,000 $1,654,800
Taxes as a Share of Income 8.4% 6.6% 1.4%
Anti-Poverty Tax Policies Offered Anti-Poverty Tax Policies to Consider
> Introduce a Refundable Earned Income Tax Credit
> Create a Low-Income Property Tax Circuit Breaker
> Create a Child-related Credit
> Create a Refundable Low-Income Credit
New Hampshire 9.2%
State and Local Taxes as % of Income in 2015*
Lowest 20% Middle 20% Top 1%Average Income in Group $15,600 $55,900 $1,311,200
Taxes as a Share of Income 8.3% 6.6% 2.6%
Anti-Poverty Tax Policies Offered Anti-Poverty Tax Policies to Consider
> Low-Income Circuit Breaker (For Homeowners, All Ages) > Expand Circuit Breaker Program to Renters
> Introduce a Refundable Earned Income Tax Credit
> Create a Child-related Credit
> Create a Refundable Low-Income Credit
> Expand Circuit Breaker Program to Renters of All Ages; Increase maximum credit
> Make Child and Dependent Care Credit Refundable and Increase maximum benefits> Nonrefundable (refundable for qualifying families) income limited Child and Dependent Care Credit offered modeled after the federal credit
2014 Poverty Rate =
2014 Poverty Rate =
*The baseline distribution of taxes is from ITEP's 2015 Who Pays? report. The figures represent total state and local taxes as a share of income, post-federal offset.
> Low-Income Circuit Breaker (For Homeowners, 65+ or Disabled)
> NONE
*The baseline distribution of taxes is from ITEP's 2015 Who Pays? report. The figures represent total state and local taxes as a share of income, post-federal offset.
2014 Poverty Rate =
*The baseline distribution of taxes is from ITEP's 2015 Who Pays? report. The figures represent total state and local taxes as a share of income, post-federal offset.

26
New Jersey 11.1%
State and Local Taxes as % of Income in 2015*
Lowest 20% Middle 20% Top 1%Average Income in Group $13,200 $55,800 $2,063,700
Taxes as a Share of Income 10.7% 9.1% 7.1%
Anti-Poverty Tax Policies Offered Anti-Poverty Tax Policies to Consider
> Refundable Earned Income Tax Credit at 30% of the federal credit
> Create a Refundable Low-Income Credit
New Mexico 21.3%
State and Local Taxes as % of Income in 2015*
Lowest 20% Middle 20% Top 1%Average Income in Group $10,400 $37,600 $822,600
Taxes as a Share of Income 10.9% 9.9% 4.8%
Anti-Poverty Tax Policies Offered Anti-Poverty Tax Policies to Consider
> Refundable Earned Income Tax Credit at 10% > Increase Earned Income Tax Credit
> Increase Low-Income Credit
New York 15.9%
State and Local Taxes as % of Income in 2015*
Lowest 20% Middle 20% Top 1%Average Income in Group $10,500 $46,300 $2,720,900
Taxes as a Share of Income 10.4% 12.0% 8.1%
Anti-Poverty Tax Policies Offered Anti-Poverty Tax Policies to Consider
> Increase Earned Income Tax Credit
> Increase Circuit Breaker Income Ceiling and Maximum Benefits
> Increase Child and Dependent Care Credit
> Increase Child Tax Credit
> Create a Refundable Low-Income Credit
> Extend property tax credit to renters
*The baseline distribution of taxes is from ITEP's 2015 Who Pays? report. The figures represent total state and local taxes as a share of income, post-federal offset.
> Refundable income limited Child and Dependent Care Credit offered based on the federal credit
> Refundable, all ages, Low-Income Credit offered to assist in offsetting state and local taxes
> Low-Income Multiple Threshold Circuit Breaker (For Homeowners and Renters, 65+) > Expand Circuit Breaker Program to Homeowners & Renters of All Ages; Increase maximum credit
*The baseline distribution of taxes is from ITEP's 2015 Who Pays? report. The figures represent total state and local taxes as a share of income, post-federal offset.
> Nonrefundable, all ages, Low-Income Credit offered
*The baseline distribution of taxes is from ITEP's 2015 Who Pays? report. The figures represent total state and local taxes as a share of income, post-federal offset.
> Refundable Earned Income Tax Credit at 30% ( additional refundable 5% credit in NYC) and enhanced State EITC for Certain Non-Custodial Parents
2014 Poverty Rate =
2014 Poverty Rate =
> Create a Child-related Credit> Low- and Middle- Income Circuit Breaker (For Homeowners, All Ages)
> Very limited Low-Income quasi-Circuit Breaker (For Homeowners and Renters, All Ages); Refundable income-based property tax credit for homeowners (benefits of which will be phased-in over four years and are unavailable to homeowners living in NYC and non-property tax compliant jurisdictions)
> Refundable income limited Child and Dependent Care Credit offered modeled after the federal credit
> Refundable income limited $100 per child Child Tax Credit modeled after the federal credit
2014 Poverty Rate =
> Expand Circuit Breaker for all ages

27
North Carolina 17.2%
State and Local Taxes as % of Income in 2015*
Lowest 20% Middle 20% Top 1%Average Income in Group $10,700 $38,300 $969,100
Taxes as a Share of Income 9.2% 9.2% 5.3%
Anti-Poverty Tax Policies Offered Anti-Poverty Tax Policies to Consider
> Make Child Credit Refundable
> Reinstate and Increase Earned Income Tax Credit
> Create a Low-Income Property Tax Circuit Breaker
> Create a Refundable Low-Income Credit
North Dakota 11.5%
State and Local Taxes as % of Income in 2015*
Lowest 20% Middle 20% Top 1%Average Income in Group $17,900 $60,600 $1,523,700
Taxes as a Share of Income 9.3% 7.5% 3.0%
Anti-Poverty Tax Policies Offered Anti-Poverty Tax Policies to Consider
> Introduce a Refundable Earned Income Tax Credit
> Create a Child-related Credit
> Create a Refundable Low-Income Credit
Ohio 15.8%
State and Local Taxes as % of Income in 2015*
Lowest 20% Middle 20% Top 1%Average Income in Group $10,600 $42,400 $995,900
Taxes as a Share of Income 11.7% 10.3% 5.5%
Anti-Poverty Tax Policies Offered Anti-Poverty Tax Policies to Consider
> 10% nonrefundable, limited Earned Income Tax Credit > Expand EITC and make it refundable
•Nonrefundable, all ages Low-Income Credit offered > Make the Low-Income Tax Credit Refundable> Create a Child-related Credit> Create a Circuit Breaker Property Tax Credit
> Make the Child and Dependent Care Credit Refundable and increase benefits•Nonrefundable income limited Child and Dependent Care Credit offered modeled after the federal credit
> Low-Income Circuit Breaker (For Homeowners and Renters, 65+ or Disabled)
> Increase Size of Circuit Breaker Credit and Expand to All Renters and Homeowners
*The baseline distribution of taxes is from ITEP's 2015 Who Pays? report. The figures represent total state and local taxes as a share of income, post-federal offset.
2014 Poverty Rate =
*The baseline distribution of taxes is from ITEP's 2015 Who Pays? report. The figures represent total state and local taxes as a share of income, post-federal offset.
> Nonrefundable income limited $100 per Child Tax Credit modeled after the federal credit ($125/child for AGI under $40K)
2014 Poverty Rate =
*The baseline distribution of taxes is from ITEP's 2015 Who Pays? report. The figures represent total state and local taxes as a share of income, post-federal offset.
> Reinstate the Child and Dependent Care Credit
2014 Poverty Rate =

28
Oklahoma 16.6%
State and Local Taxes as % of Income in 2015*
Lowest 20% Middle 20% Top 1%Average Income in Group $10,300 $42,100 $1,456,600
Taxes as a Share of Income 10.5% 9.4% 4.3%
Anti-Poverty Tax Policies Offered Anti-Poverty Tax Policies to Consider
> Refundable Earned Income Tax Credit at 5% > Increase Earned Income Tax Credit
> Low-Income Circuit Breaker (For Homeowners, 65+ or Disabled)
Oregon 16.6%
State and Local Taxes as % of Income in 2015*
Lowest 20% Middle 20% Top 1%Average Income in Group $11,200 $43,500 $952,600
Taxes as a Share of Income 8.1% 7.6% 6.5%
Anti-Poverty Tax Policies Offered Anti-Poverty Tax Policies to Consider
> Refundable Earned Income Tax Credit at 8% > Increase Earned Income Tax Credit
> Low-Income Circuit Breaker (For Renters, 58+) > Expand Circuit Breaker Program to include all ages and Homeowners
> Create a Refundable Low-Income Credit for all households
Pennsylvania 13.6%
State and Local Taxes as % of Income in 2015*
Lowest 20% Middle 20% Top 1%Average Income in Group $11,600 $48,600 $1,241,600
Taxes as a Share of Income 12.0% 10.3% 4.2%
Anti-Poverty Tax Policies Offered Anti-Poverty Tax Policies to Consider
> Expand Circuit Breaker to all ages
•Nonrefundable Low-Income Credit > Enhance Low-Income Credit
> Introduce a Refundable Earned Income Tax Credit
> Create a Child-related Credit
> Refundable Low-Income/Child Tax Credit available to low-income working families with qualifying child care expenses
> Make Child and Dependent Care Credit Refundable and Increase maximum benefits•Nonrefundable income limited Child and Dependent Care Credit offered modeled after the federal credit
> Increase Low-Income Child Credit
> Low-Income Quasi-Circuit Breaker (For Homeowners and Renters, 65+, 50+ Widowers, or Disabled)
> Refundable, all ages, Low-Income Credit offered to assist in offsetting sales taxes (higher limit for elderly households)
2014 Poverty Rate =
2014 Poverty Rate =
*The baseline distribution of taxes is from ITEP's 2015 Who Pays? report. The figures represent total state and local taxes as a share of income, post-federal offset.
*The baseline distribution of taxes is from ITEP's 2015 Who Pays? report. The figures represent total state and local taxes as a share of income, post-federal offset.
> Increase Low-Income Credit
> Nonrefundable Child and Dependent Care Credit offered modeled after the federal credit
> Increase Circuit Breaker Credit and expand to renters and homeowners regardless of age
> Make the Child and Dependent Care Credit refundable and increase benefits
2014 Poverty Rate =
*The baseline distribution of taxes is from ITEP's 2015 Who Pays? report. The figures represent total state and local taxes as a share of income, post-federal offset.

29
Rhode Island 14.3%
State and Local Taxes as % of Income in 2015*
Lowest 20% Middle 20% Top 1%Average Income in Group $10,300 $47,500 $1,086,100
Taxes as a Share of Income 12.5% 10.5% 6.3%
Anti-Poverty Tax Policies Offered Anti-Poverty Tax Policies to Consider
> Restore Circuit Breaker Program for Homeowners and Renters under 65
> Create a Refundable Low-Income Credit for all households
South Carolina 18.0%
State and Local Taxes as % of Income in 2015*
Lowest 20% Middle 20% Top 1%Average Income in Group $10,000 $34,800 $937,400
Taxes as a Share of Income 7.5% 7.6% 4.5%
Anti-Poverty Tax Policies Offered Anti-Poverty Tax Policies to Consider
> Introduce a Refundable Earned Income Tax Credit
> Create a Low-Income Property Tax Circuit Breaker
> Create a Refundable Low-Income Credit
South Dakota 14.2%
State and Local Taxes as % of Income in 2015*
Lowest 20% Middle 20% Top 1%Average Income in Group $12,200 $49,900 $1,527,300
Taxes as a Share of Income 11.3% 7.7% 1.8%
Anti-Poverty Tax Policies Offered Anti-Poverty Tax Policies to Consider
> Introduce a Refundable Earned Income Tax Credit
> Create a Child-related credit
> Create a Refundable Low-Income Credit
> Low-Income Sliding Scale Circuit Breaker (For Homeowners, 65+ or Disabled)
*The baseline distribution of taxes is from ITEP's 2015 Who Pays? report. The figures represent total state and local taxes as a share of income, post-federal offset.
> Fully fund Circuit Breaker Program and expand to include all ages
> Low-Income Circuit Breaker for Homeowners and Renters (credit is eliminated for filers under 65 in 2015)
•Nonrefundable Child and Dependent Care Credit offered modeled after the federal credit
•Nonrefundable Child and Dependent Care Credit offered modeled after the federal credit> Make Child and Dependent Care Credit Refundable and Limit to Low-Income Families
*The baseline distribution of taxes is from ITEP's 2015 Who Pays? report. The figures represent total state and local taxes as a share of income, post-federal offset.
2014 Poverty Rate =
2014 Poverty Rate =
> 10% refundable EITC (increasing to 12.5% in 2016). > Increase EITC
> Make Child and Dependent Care Credit Refundable and Limit to Low-Income Families
*The baseline distribution of taxes is from ITEP's 2015 Who Pays? report. The figures represent total state and local taxes as a share of income, post-federal offset.
2014 Poverty Rate =
30
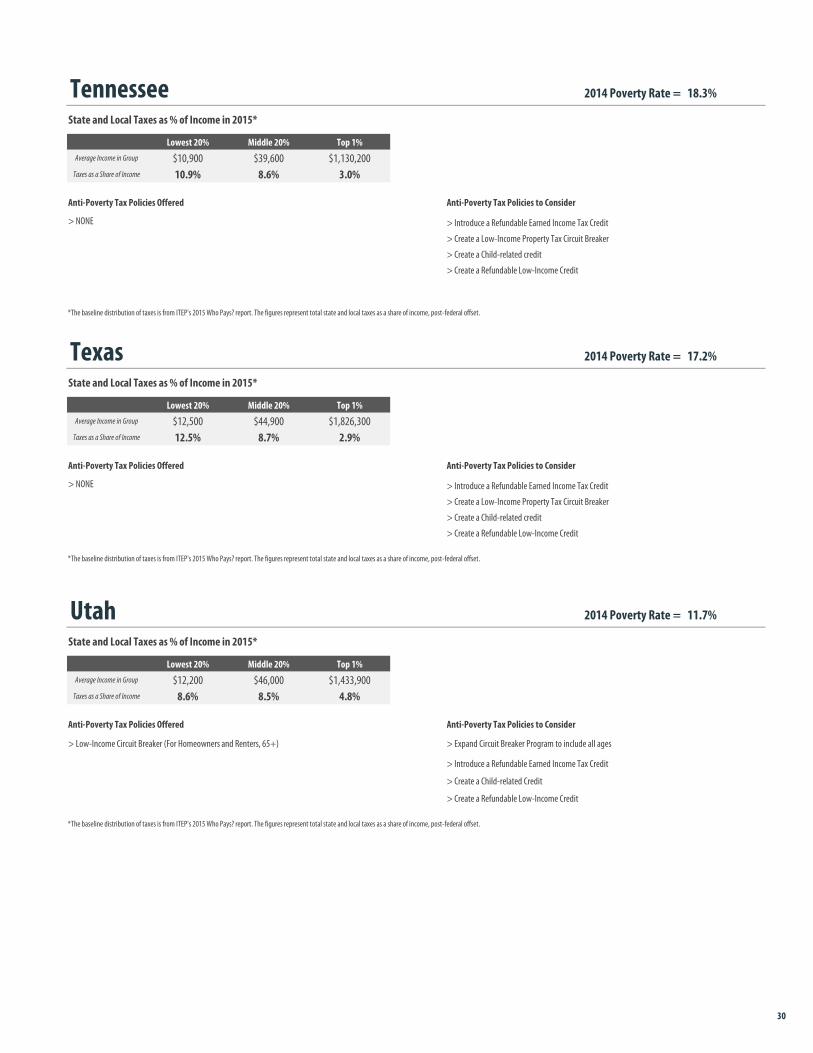
Tennessee 18.3%
State and Local Taxes as % of Income in 2015*
Lowest 20% Middle 20% Top 1%Average Income in Group $10,900 $39,600 $1,130,200
Taxes as a Share of Income 10.9% 8.6% 3.0%
Anti-Poverty Tax Policies Offered Anti-Poverty Tax Policies to Consider
> Introduce a Refundable Earned Income Tax Credit
> Create a Low-Income Property Tax Circuit Breaker
> Create a Child-related credit
> Create a Refundable Low-Income Credit
Texas 17.2%
State and Local Taxes as % of Income in 2015*
Lowest 20% Middle 20% Top 1%Average Income in Group $12,500 $44,900 $1,826,300
Taxes as a Share of Income 12.5% 8.7% 2.9%
Anti-Poverty Tax Policies Offered Anti-Poverty Tax Policies to Consider
> Introduce a Refundable Earned Income Tax Credit
> Create a Low-Income Property Tax Circuit Breaker
> Create a Child-related credit
> Create a Refundable Low-Income Credit
Utah 11.7%
State and Local Taxes as % of Income in 2015*
Lowest 20% Middle 20% Top 1%Average Income in Group $12,200 $46,000 $1,433,900
Taxes as a Share of Income 8.6% 8.5% 4.8%
Anti-Poverty Tax Policies Offered Anti-Poverty Tax Policies to Consider
> Introduce a Refundable Earned Income Tax Credit
> Create a Child-related Credit
> Create a Refundable Low-Income Credit
*The baseline distribution of taxes is from ITEP's 2015 Who Pays? report. The figures represent total state and local taxes as a share of income, post-federal offset.
> Low-Income Circuit Breaker (For Homeowners and Renters, 65+) > Expand Circuit Breaker Program to include all ages
2014 Poverty Rate =
> NONE
*The baseline distribution of taxes is from ITEP's 2015 Who Pays? report. The figures represent total state and local taxes as a share of income, post-federal offset.
2014 Poverty Rate =
> NONE
2014 Poverty Rate =
*The baseline distribution of taxes is from ITEP's 2015 Who Pays? report. The figures represent total state and local taxes as a share of income, post-federal offset.

31
Vermont 12.2%
State and Local Taxes as % of Income in 2015*
Lowest 20% Middle 20% Top 1%Average Income in Group $11,700 $45,600 $978,400
Taxes as a Share of Income 8.9% 10.5% 7.7%
Anti-Poverty Tax Policies Offered Anti-Poverty Tax Policies to Consider
> Refundable Earned Income Tax Credit at 32% > Increase Earned Income Tax Credit
> Create a Refundable Low-Income Credit
Virginia 11.8%
State and Local Taxes as % of Income in 2015*
Lowest 20% Middle 20% Top 1%Average Income in Group $11,900 $49,100 $1,470,300
Taxes as a Share of Income 8.9% 8.4% 5.1%
Anti-Poverty Tax Policies Offered Anti-Poverty Tax Policies to Consider
•Nonrefundable Earned Income Tax Credit at 20%
> Create a Low-Income Property Tax Circuit Breaker> Create a Child-related Credit
Washington 13.2%
State and Local Taxes as % of Income in 2015*
Lowest 20% Middle 20% Top 1%Average Income in Group $11,900 $52,800 $1,517,800
Taxes as a Share of Income 16.8% 10.1% 2.4%
Anti-Poverty Tax Policies Offered Anti-Poverty Tax Policies to Consider
> Refundable Earned Income Tax Credit at 10% (Unfunded) > Fully fund Earned Income Tax Credit and Increase the Size of Credit
> Create a Child-related Credit> Create a Refundable Low-Income Credit
2014 Poverty Rate =
> Low- and Middle- Income Circuit Breaker (For Homeowners and Renters, All Ages)
•Nonrefundable Child and Dependent Care Credit offered modeled after the federal credit
> Low-Income Sliding Scale Circuit Breaker (For Homeowners, 61+ or Disabled)
> Expand Circuit Breaker Program to include all ages
2014 Poverty Rate =
*The baseline distribution of taxes is from ITEP's 2015 Who Pays? report. The figures represent total state and local taxes as a share of income, post-federal offset.
> Increase Circuit Breaker Program Benefits
> Make Child and Dependent Care Credit Refundable and Limit to Low-Income Families
•Nonrefundable Low-Income Credit can be taken as an alternative to the EITC
> Make Low-Income Credit Refundable
2014 Poverty Rate =
> Make Earned Income Tax Credit Fully Refundable and Increase the Credit
*The baseline distribution of taxes is from ITEP's 2015 Who Pays? report. The figures represent total state and local taxes as a share of income, post-federal offset.
*The baseline distribution of taxes is from ITEP's 2015 Who Pays? report. The figures represent total state and local taxes as a share of income, post-federal offset.
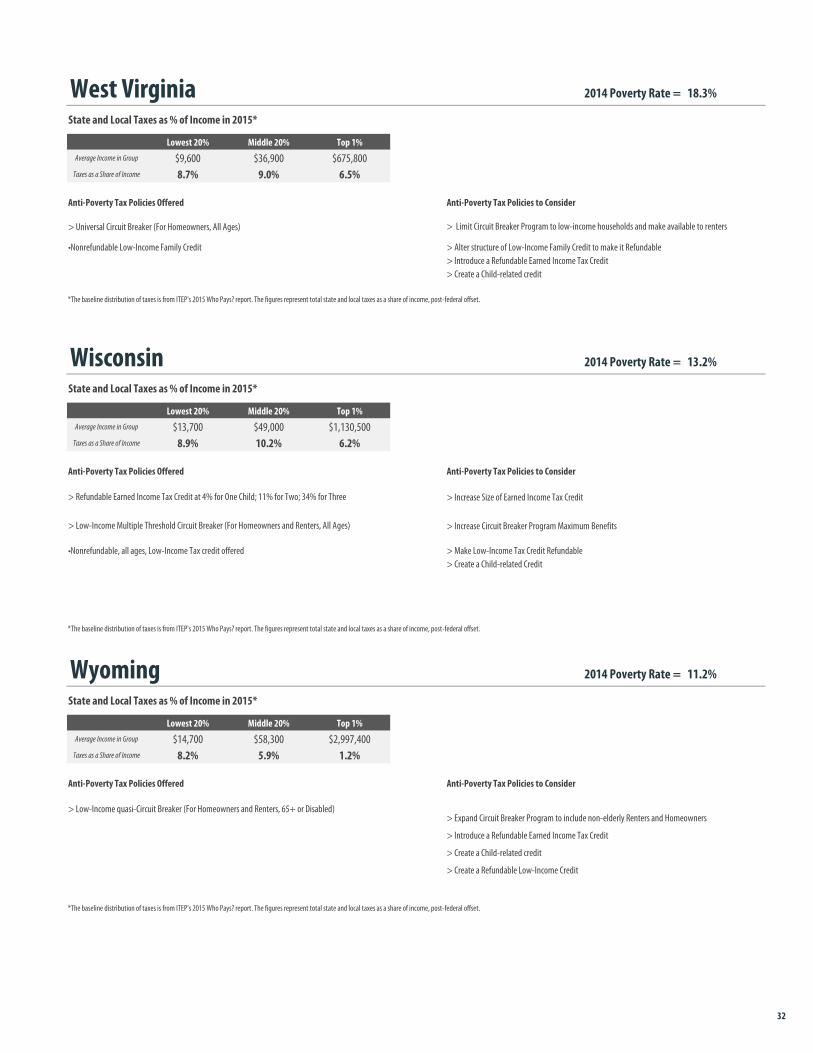
32
West Virginia 18.3%
State and Local Taxes as % of Income in 2015*
Lowest 20% Middle 20% Top 1%Average Income in Group $9,600 $36,900 $675,800
Taxes as a Share of Income 8.7% 9.0% 6.5%
Anti-Poverty Tax Policies Offered Anti-Poverty Tax Policies to Consider
> Universal Circuit Breaker (For Homeowners, All Ages)
•Nonrefundable Low-Income Family Credit > Alter structure of Low-Income Family Credit to make it Refundable> Introduce a Refundable Earned Income Tax Credit> Create a Child-related credit
Wisconsin 13.2%
State and Local Taxes as % of Income in 2015*
Lowest 20% Middle 20% Top 1%Average Income in Group $13,700 $49,000 $1,130,500
Taxes as a Share of Income 8.9% 10.2% 6.2%
Anti-Poverty Tax Policies Offered Anti-Poverty Tax Policies to Consider
> Increase Size of Earned Income Tax Credit
> Increase Circuit Breaker Program Maximum Benefits
•Nonrefundable, all ages, Low-Income Tax credit offered > Make Low-Income Tax Credit Refundable> Create a Child-related Credit
Wyoming 11.2%
State and Local Taxes as % of Income in 2015*
Lowest 20% Middle 20% Top 1%Average Income in Group $14,700 $58,300 $2,997,400
Taxes as a Share of Income 8.2% 5.9% 1.2%
Anti-Poverty Tax Policies Offered Anti-Poverty Tax Policies to Consider
> Introduce a Refundable Earned Income Tax Credit
> Create a Child-related credit
> Create a Refundable Low-Income Credit
2014 Poverty Rate =
*The baseline distribution of taxes is from ITEP's 2015 Who Pays? report. The figures represent total state and local taxes as a share of income, post-federal offset.
> Refundable Earned Income Tax Credit at 4% for One Child; 11% for Two; 34% for Three
> Low-Income Multiple Threshold Circuit Breaker (For Homeowners and Renters, All Ages)
> Expand Circuit Breaker Program to include non-elderly Renters and Homeowners
2014 Poverty Rate =
2014 Poverty Rate =
> Limit Circuit Breaker Program to low-income households and make available to renters
*The baseline distribution of taxes is from ITEP's 2015 Who Pays? report. The figures represent total state and local taxes as a share of income, post-federal offset.
*The baseline distribution of taxes is from ITEP's 2015 Who Pays? report. The figures represent total state and local taxes as a share of income, post-federal offset.
> Low-Income quasi-Circuit Breaker (For Homeowners and Renters, 65+ or Disabled)


![v v }vod }( vPo] ZW }. ] v Ç · About iTEP International, the creators of iTEP The iTEP test has set a new standard for effi-ciency, accuracy, and flexibility. iTEP can be ... •](https://img.pdfslide.us/doc/110x75/5eb9d36294954e7d657929a2/v-v-vod-vpo-zw-v-about-itep-international-the-creators-of-itep-the.jpg)