Embed Size (px)
Citation preview
1984314.7.1.NA.RTL
May 2018 Edition
State Street Global Advisors
SPDR® ETFs Chart Pack
For Public Use Please see Appendix C for more information on investment terms used in this Chart Pack.
Chart Pack Table of Contents
2
I. Market Environment
• Performance
• Investor Confidence
• Earnings Reaction
• Volatility
• State Street Current
Positioning
II. Global Flows & Fundamentals, US Factors
• Asset Class Flows
• Global Economy
• Global Valuations
• Global Earnings
• US Equity Risk
Premium
• US Factor Trends
III. Sectors
• Flows & Returns
• Valuations
• Sector Earnings
• Sector Growth
IV. Fixed Income
• Yield Curve
• Treasury Market
• Inflation
• Bond Markets
• Credit Trends
• EM Debt
1984314.7.1.NA.RTL

Market Environment
3 1984314.7.1.NA.RTL
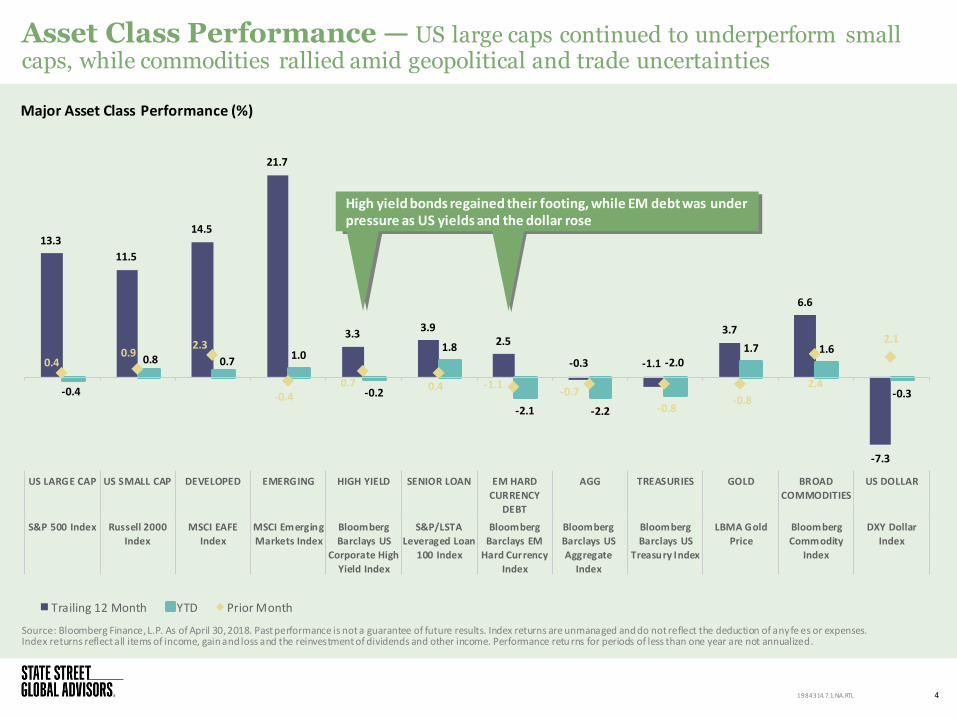
Asset Class Performance — US large caps continued to underperform small caps, while commodities rallied amid geopolitical and trade uncertainties
Source: Bloomberg Finance, L.P. As of April 30, 2018. Past performance is not a guarantee of future results. Index returns are unmanaged and do not reflect the deduction of any fe es or expenses. Index returns reflect all items of income, gain and loss and the reinvestment of dividends and other income. Performance retu rns for periods of less than one year are not annualized.
Major Asset Class Performance (%)
4
13.3
11.5
14.5
21.7
3.3 3.9
2.5
-0.3 -1.1
3.7
6.6
-7.3
-0.4
0.8 0.7 1.0
-0.2
1.8
-2.1 -2.2
-2.0 1.7 1.6
-0.3
0.4 0.9
2.3
-0.4 0.7 0.4 -1.1
-0.7
-0.8 -0.8
2.4
2.1
US LARGE CAP US SMALL CAP DEVELOPED EMERGING HIGH YIELD SENIOR LOAN EM HARD
CURRENCY
DEBT
AGG TREASURIES GOLD BROAD
COMMODITIES
US DOLLAR
S&P 500 Index Russell 2000
Index
MSCI EAFE
Index
MSCI Emerging
Markets Index
Bloomberg
Barclays US
Corporate High
Yield Index
S&P/LSTA
Leveraged Loan
100 Index
Bloomberg
Barclays EM
Hard Currency
Index
Bloomberg
Barclays US
Aggregate
Index
Bloomberg
Barclays US
Treasury Index
LBMA Gold
Price
Bloomberg
Commodity
Index
DXY Dollar
Index
Trailing 12 Month YTD Prior Month
1984314.7.1.NA.RTL
High yield bonds regained their footing, while EM debt was under pressure as US yields and the dollar rose
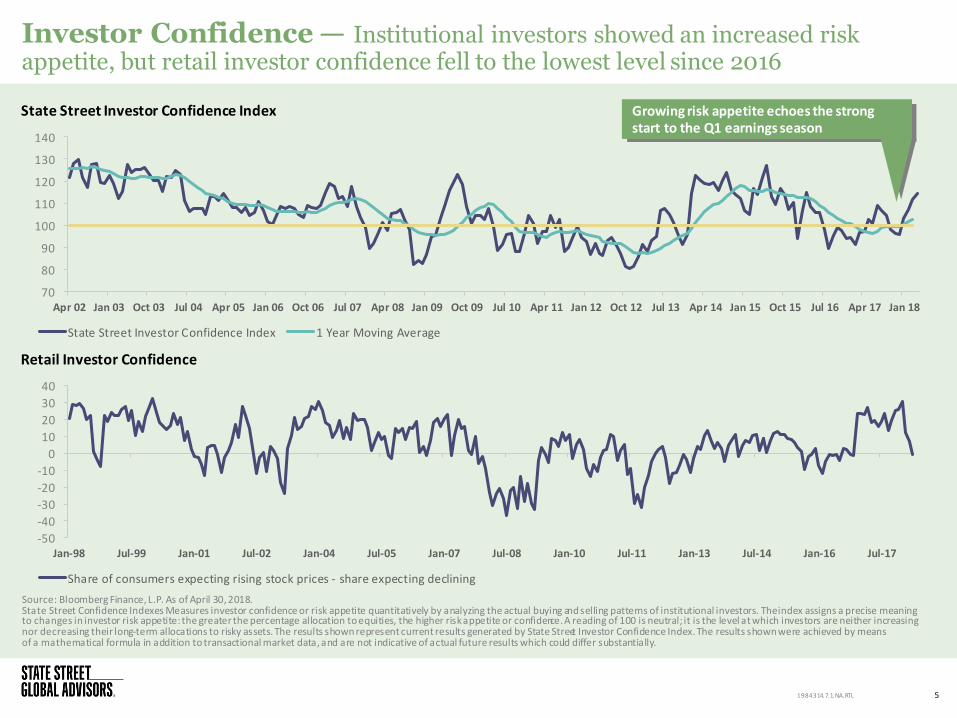
Investor Confidence — Institutional investors showed an increased risk appetite, but retail investor confidence fell to the lowest level since 2016
Source: Bloomberg Finance, L.P. As of April 30, 2018. State Street Confidence Indexes Measures investor confidence or risk appetite quantitatively by analyzing the actual buying and selling patterns of institutional investors. The index assigns a precise meaning to changes in investor risk appetite: the greater the percentage allocation to equities, the higher risk appetite or confidence. A reading of 100 is neutral; it is the level at which investors are neither increasing nor decreasing their long-term allocations to risky assets. The results shown represent current results generated by State Street Investor Confidence Index. The results shown were achieved by means of a mathematical formula in addition to transactional market data, and are not indicative of actual future results which could differ substantially.
State Street Investor Confidence Index
5 1984314.7.1.NA.RTL
70
80
90
100
110
120
130
140
Apr 02 Jan 03 Oct 03 Jul 04 Apr 05 Jan 06 Oct 06 Jul 07 Apr 08 Jan 09 Oct 09 Jul 10 Apr 11 Jan 12 Oct 12 Jul 13 Apr 14 Jan 15 Oct 15 Jul 16 Apr 17 Jan 18
State Street Investor Confidence Index 1 Year Moving Average
Growing risk appetite echoes the strong start to the Q1 earnings season
-50
-40
-30
-20
-10
0
10
20
30
40
Jan-98 Jul-99 Jan-01 Jul-02 Jan-04 Jul-05 Jan-07 Jul-08 Jan-10 Jul-11 Jan-13 Jul-14 Jan-16 Jul-17
Share of consumers expecting rising stock prices - share expecting declining
Retail Investor Confidence
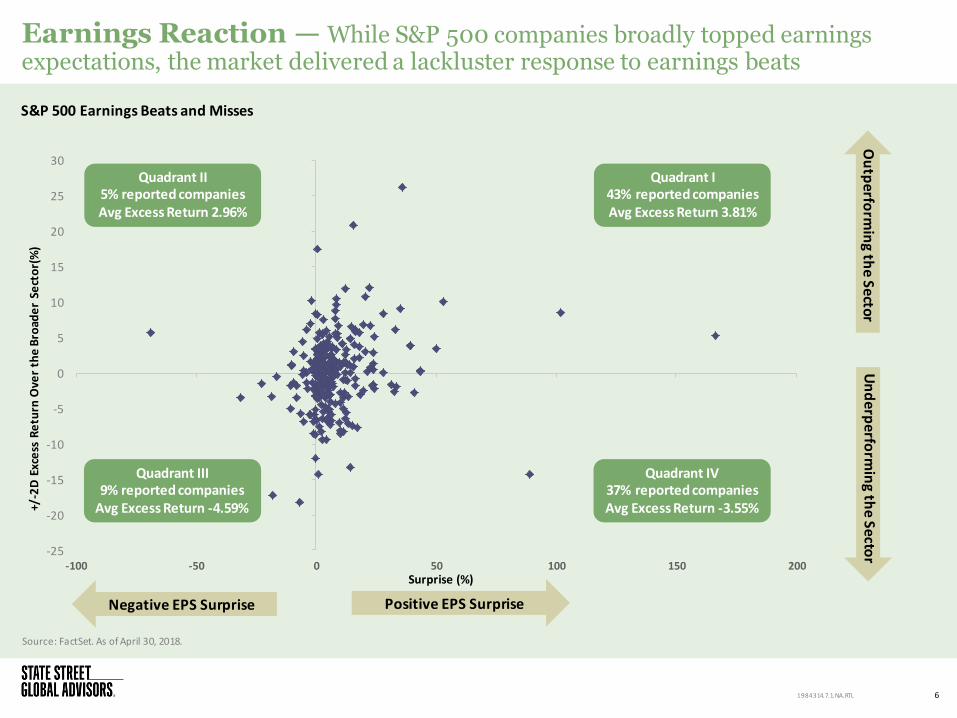
Earnings Reaction — While S&P 500 companies broadly topped earnings expectations, the market delivered a lackluster response to earnings beats
Source: FactSet. As of April 30, 2018.
S&P 500 Earnings Beats and Misses
6 1984314.7.1.NA.RTL
Positive EPS Surprise Negative EPS Surprise
-25
-20
-15
-10
-5
0
5
10
15
20
25
30
-100 -50 0 50 100 150 200
+/-2
D E
xce
ss R
etu
rn O
ver
the
Bro
ade
r Se
cto
r(%
)
Surprise (%)
Quadrant II 5% reported companies Avg Excess Return 2.96%
Quadrant III 9% reported companies
Avg Excess Return -4.59%
Quadrant IV 37% reported companies Avg Excess Return -3.55%
Quadrant I 43% reported companies Avg Excess Return 3.81%
Ou
tperfo
rmin
g the Sector
Un
derp
erform
ing th
e Sector
5
10
15
20
25
30
35
-10%
-8%
-6%
-4%
-2%
0%
2%
4%
6%
8%
10%
Jan-16 Apr-16 Jul-16 Oct-16 Jan-17 Apr-17 Jul-17 Oct-17 Jan-18 Apr-18
VIX
In
de
x Le
vel
Futu
re P
osi
tio
ns
to O
pe
n In
tere
st R
atio
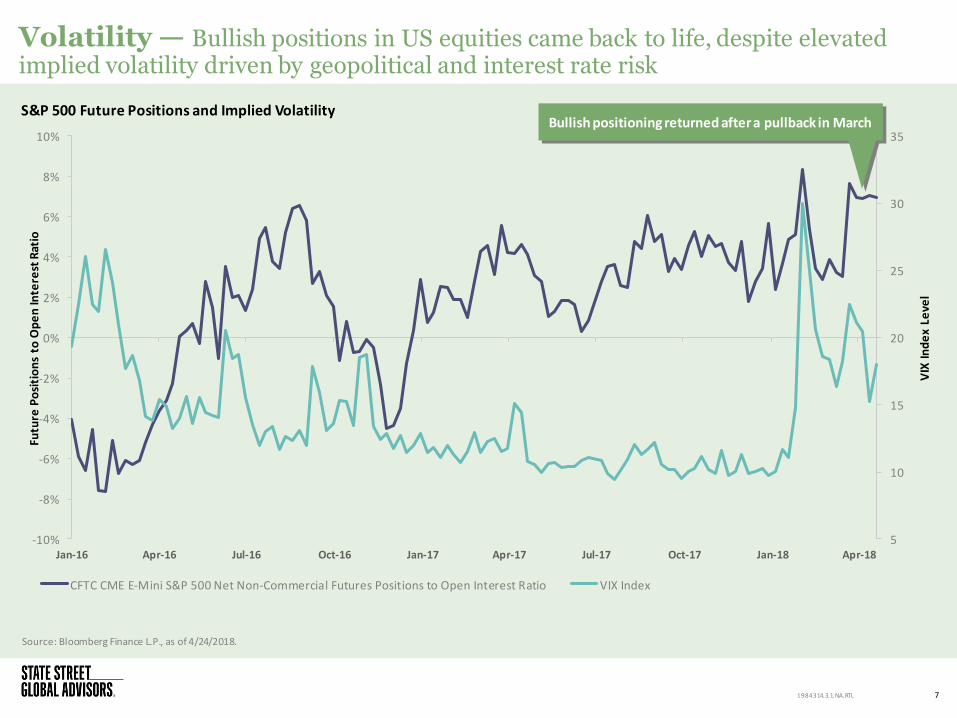
CFTC CME E-Mini S&P 500 Net Non-Commercial Futures Positions to Open Interest Ratio VIX Index
Source: Bloomberg Finance L.P., as of 4/24/2018.
7 1984314.3.1.NA.RTL
Volatility — Bullish positions in US equities came back to life, despite elevated implied volatility driven by geopolitical and interest rate risk
S&P 500 Future Positions and Implied Volatility Bullish positioning returned after a pullback in March
77 76
59
88
83
50
81
86
56
92 90
51
118
124 128
115
122
101
76 68
45
49 57
34
95 92
76
68
78
58
30
50
70
90
110
130
150
Currency Rates Oil S&P 500 Index Emerging Markets Equity U.S. High Yield Corproate
Bonds
Imp
lied
Vo
lati
lity
Ind
ex
Leve
l (B
ase
= 1
00
)
Current Last month Max Min Avg
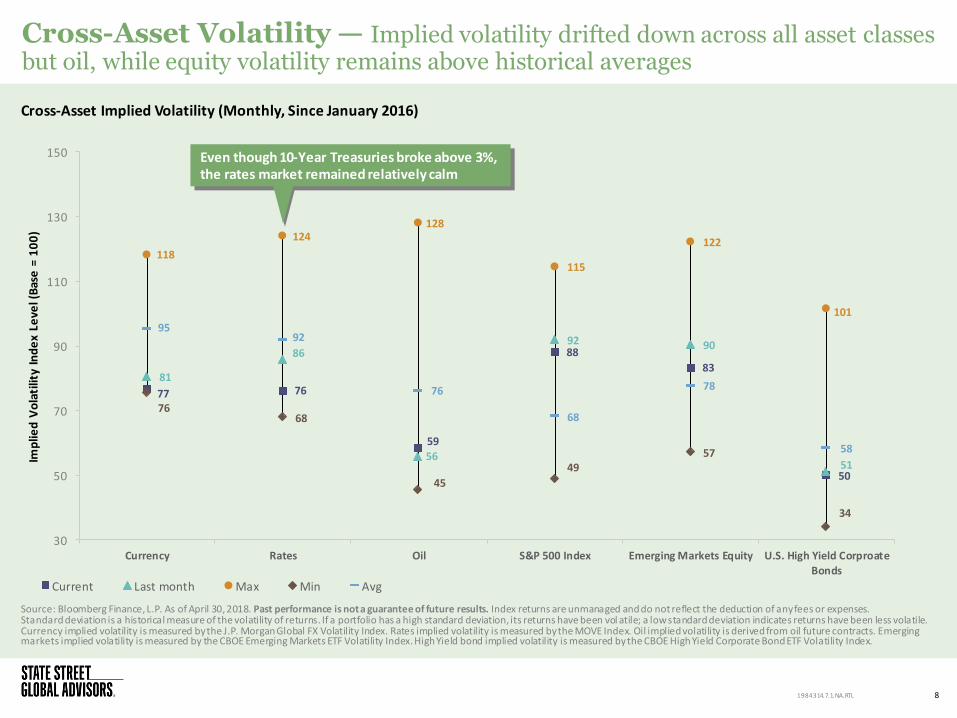
Cross-Asset Volatility — Implied volatility drifted down across all asset classes but oil, while equity volatility remains above historical averages
Source: Bloomberg Finance, L.P. As of April 30, 2018. Past performance is not a guarantee of future results. Index returns are unmanaged and do not reflect the deduction of any fees or expenses. Standard deviation is a historical measure of the volatility of returns. If a portfolio has a high standard deviation, its returns have been vol atile; a low standard deviation indicates returns have been less volatile. Currency implied volatility is measured by the J.P. Morgan Global FX Volatility Index. Rates implied volatility is measured by the MOVE Index. Oil implied volatility is derived from oil future contracts. Emerging markets implied volatility is measured by the CBOE Emerging Markets ETF Volatility Index. High Yield bond implied volatility is measured by the CBOE High Yield Corporate Bond ETF Volatility Index.
8 1984314.7.1.NA.RTL
Cross-Asset Implied Volatility (Monthly, Since January 2016)
Even though 10-Year Treasuries broke above 3%, the rates market remained relatively calm
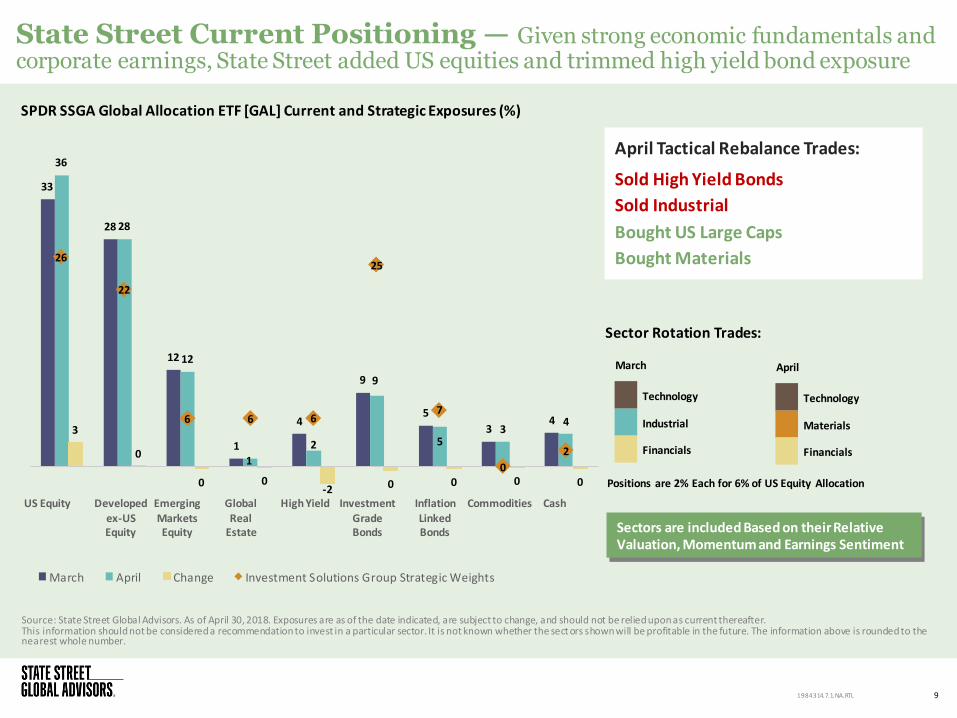
Source: State Street Global Advisors. As of April 30, 2018. Exposures are as of the date indicated, are subject to change, and should not be relied upon as current thereafter. This information should not be considered a recommendation to invest in a particular sector. It is not known whether the sect ors shown will be profitable in the future. The information above is rounded to the nearest whole number.
State Street Current Positioning — Given strong economic fundamentals and corporate earnings, State Street added US equities and trimmed high yield bond exposure
9
April
Sector Rotation Trades:
April Tactical Rebalance Trades:
Sold High Yield Bonds
Sold Industrial
Bought US Large Caps
Bought Materials
1984314.7.1.NA.RTL
Positions are 2% Each for 6% of US Equity Allocation
SPDR SSGA Global Allocation ETF [GAL] Current and Strategic Exposures (%)
Technology
Materials
Financials
US Equity Developed
ex-US Equity
Emerging
Markets Equity
Global
Real Estate
High Yield Investment
Grade Bonds
Inflation
Linked Bonds
Commodities Cash
Sectors are included Based on their Relative Valuation, Momentum and Earnings Sentiment
33
28
12
1
4
9
5
3 4
36
28
12
1
2
9
5 3
4 3
0
0 0 -2 0 0 0 0
26
22
6 6
25
7
0
2
March April Change Investment Solutions Group Strategic Weights
March
Technology
Industrial
Financials

Global Flows & Fundamentals, US Factors
10 1984314.7.1.NA.RTL
6
-0
3 3
-1
0
-1
-5.0%
-4.0%
-3.0%
-2.0%
-1.0%
0.0%
1.0%
2.0%
-10
0
10
U.S. Global Intl.Developed
Intl. EM Regional SingleCountry
CurrencyHedged
% A
UM
Gro
wth
fro
m F
low
s
Flo
ws
($M
)
April Month to Date (% of Start of Month AUM)
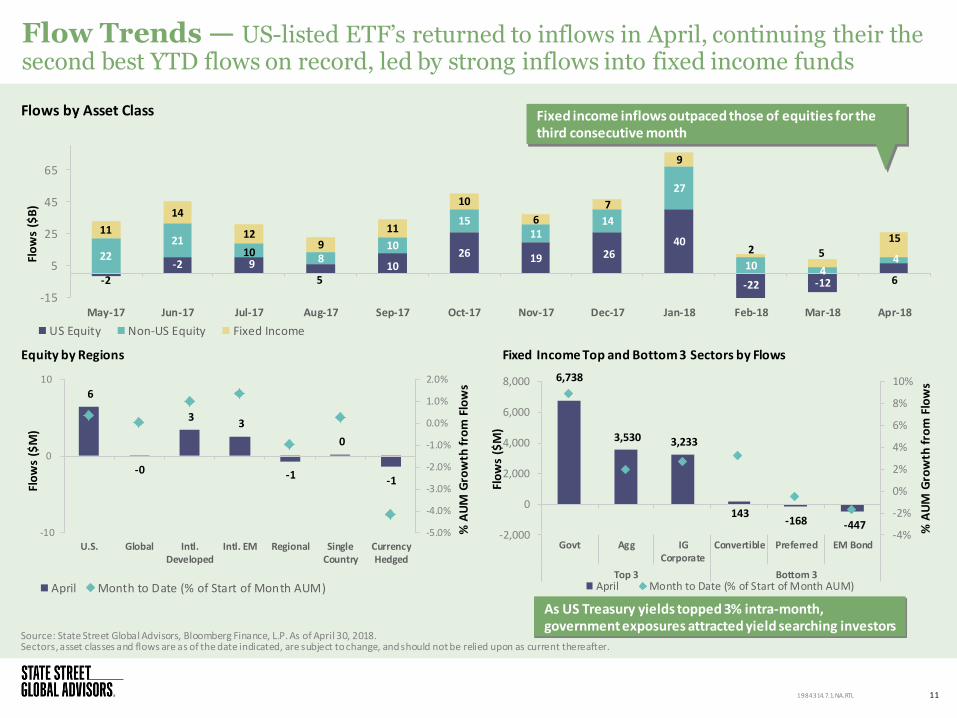
Flow Trends — US-listed ETF’s returned to inflows in April, continuing their the second best YTD flows on record, led by strong inflows into fixed income funds
Source: State Street Global Advisors, Bloomberg Finance, L.P. As of April 30, 2018. Sectors, asset classes and flows are as of the date indicated, are subject to change, and should not be relied upon as current thereafter.
11 1984314.7.1.NA.RTL
Flows by Asset Class
-2
-2 10
5 10
26 19 26 40
-22 -12 6
22
21
9 8 10
15 11
14
27
10 4 4
11
14
12 9
11
10
6
7
9
2 5 15
-15
5
25
45
65
May-17 Jun-17 Jul-17 Aug-17 Sep-17 Oct-17 Nov-17 Dec-17 Jan-18 Feb-18 Mar-18 Apr-18
Flo
ws
($B
)
US Equity Non-US Equity Fixed Income
Equity by Regions Fixed Income Top and Bottom 3 Sectors by Flows
Fixed income inflows outpaced those of equities for the third consecutive month
As US Treasury yields topped 3% intra-month, government exposures attracted yield searching investors
6,738
3,530 3,233
143 -168 -447
-4%
-2%
0%
2%
4%
6%
8%
10%
-2,000
0
2,000
4,000
6,000
8,000
Govt Agg IGCorporate
Convertible Preferred EM Bond
Top 3 Bottom 3
% A
UM
Gro
wth
fro
m F
low
s
Flo
ws
($M
)
April Month to Date (% of Start of Month AUM)
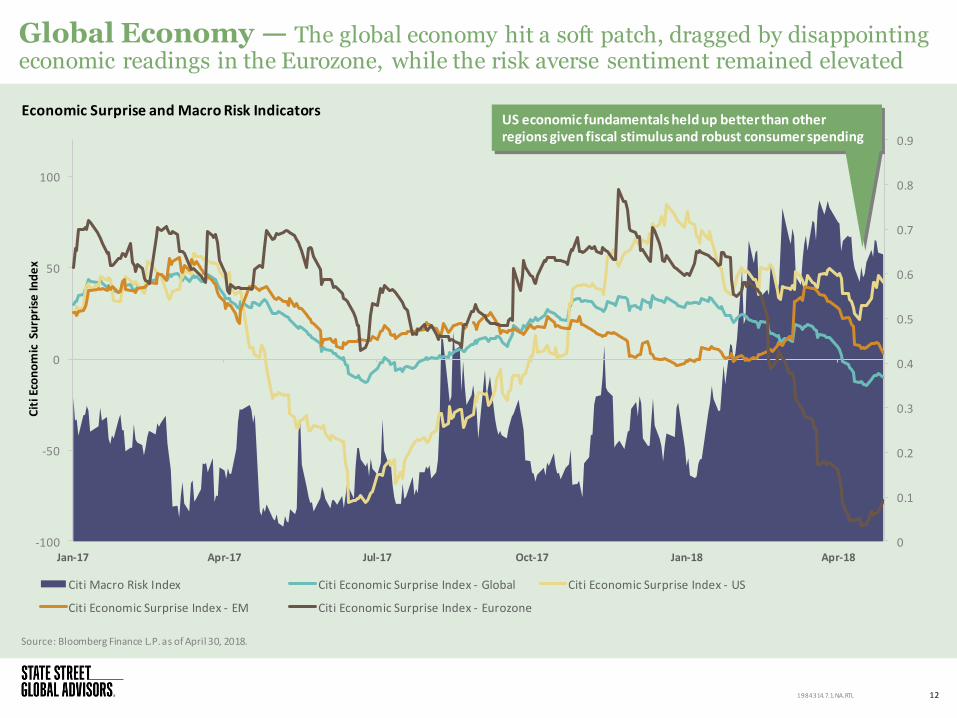
Global Economy — The global economy hit a soft patch, dragged by disappointing economic readings in the Eurozone, while the risk averse sentiment remained elevated
Source: Bloomberg Finance L.P. as of April 30, 2018.
12 1984314.7.1.NA.RTL
Economic Surprise and Macro Risk Indicators
0
0.1
0.2
0.3
0.4
0.5
0.6
0.7
0.8
0.9
-100
-50
0
50
100
Jan-17 Apr-17 Jul-17 Oct-17 Jan-18 Apr-18
Cit
i Eco
no
mic
Su
rpri
se In
de
x
Citi Macro Risk Index Citi Economic Surprise Index - Global Citi Economic Surprise Index - US
Citi Economic Surprise Index - EM Citi Economic Surprise Index - Eurozone
US economic fundamentals held up better than other regions given fiscal stimulus and robust consumer spending
3.19
2.35
1.67 1.73
1.38
1.60
2.59
2.08
1.73
1.77
1.41 1.59
3.45
2.59
2.42
2.96
2.14 2.20
1.64
1.16
1.05
1.16
0.90 0.96
3.27
2.36
1.69 1.73
1.40
1.58
0.3
0.8
1.3
1.8
2.3
2.8
3.3
3.8
S&P 500 Index Russell 2000 Index MSCI EAFE Index MSCI Emerging Markets
Index
MSCI Japan Index Euro Stoxx 50 Index
Pri
ce t
o B
oo
k
Current 15 Year Avg. 15 Year High 15 Year Low As of Jan-1-2018
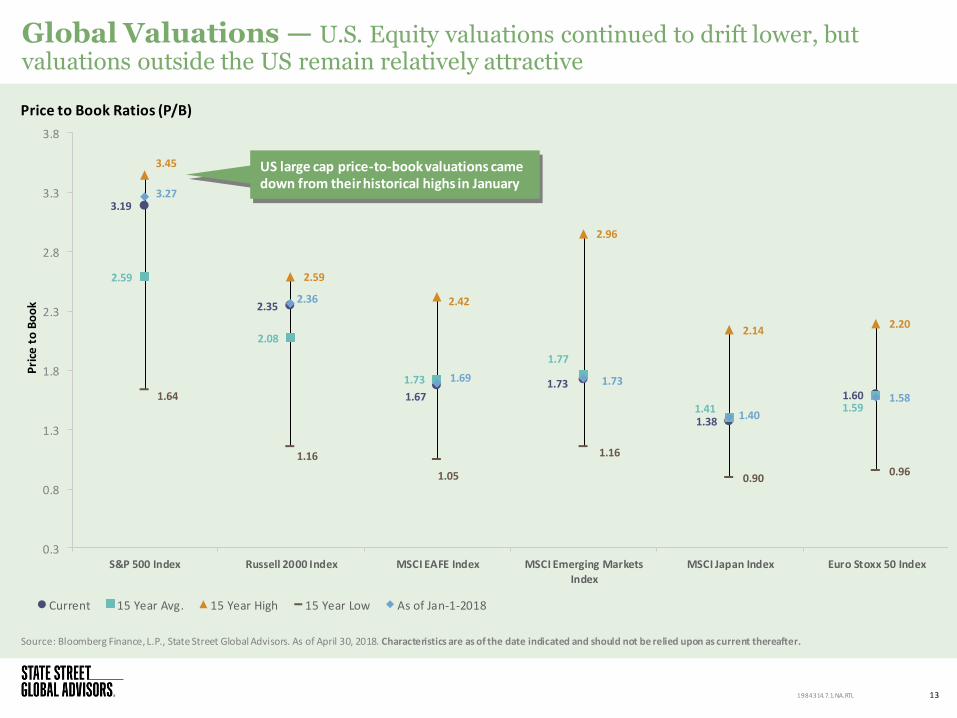
Global Valuations — U.S. Equity valuations continued to drift lower, but valuations outside the US remain relatively attractive
Source: Bloomberg Finance, L.P., State Street Global Advisors. As of April 30, 2018. Characteristics are as of the date indicated and should not be relied upon as current thereafter.
13
Price to Book Ratios (P/B)
1984314.7.1.NA.RTL
US large cap price-to-book valuations came down from their historical highs in January
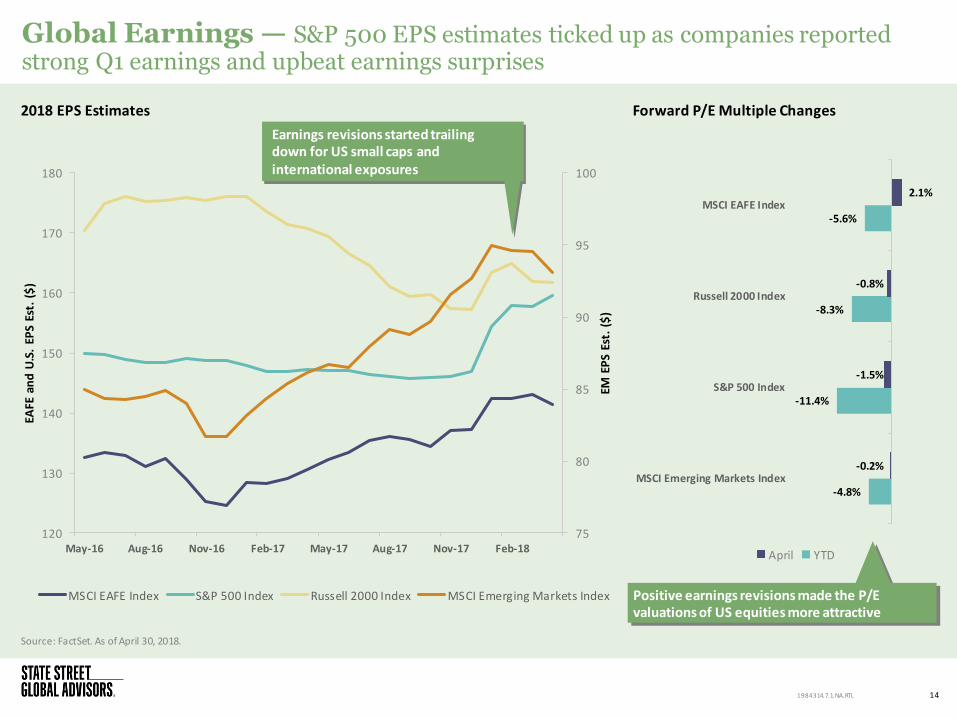
Global Earnings — S&P 500 EPS estimates ticked up as companies reported strong Q1 earnings and upbeat earnings surprises
Source: FactSet. As of April 30, 2018.
14 1984314.7.1.NA.RTL
75
80
85
90
95
100
120
130
140
150
160
170
180
May-16 Aug-16 Nov-16 Feb-17 May-17 Aug-17 Nov-17 Feb-18
EM E
PS
Est.
($
)
EAFE
an
d U
.S.
EPS
Est.
($
)
MSCI EAFE Index S&P 500 Index Russell 2000 Index MSCI Emerging Markets Index
2018 EPS Estimates Forward P/E Multiple Changes
-4.8%
-11.4%
-8.3%
-5.6%
-0.2%
-1.5%
-0.8%
2.1%
MSCI Emerging Markets Index
S&P 500 Index
Russell 2000 Index
MSCI EAFE Index
April YTD
Positive earnings revisions made the P/E valuations of US equities more attractive
Earnings revisions started trailing down for US small caps and international exposures
-6.00
-4.00
-2.00
0.00
2.00
4.00
6.00
8.00
10.00
Apr-98 Oct-99 Apr-01 Oct-02 Apr-04 Oct-05 Apr-07 Oct-08 Apr-10 Oct-11 Apr-13 Oct-14 Apr-16 Oct-17
%
Earnings Yield Less BBB Corporate Bond Yield Earnings Yield Less 10-Year Treasury Yield
Premium over BBB Corporate Bond: 20-Year Avg Premium over 10-Year Treasury Bond: 20-Year Avg
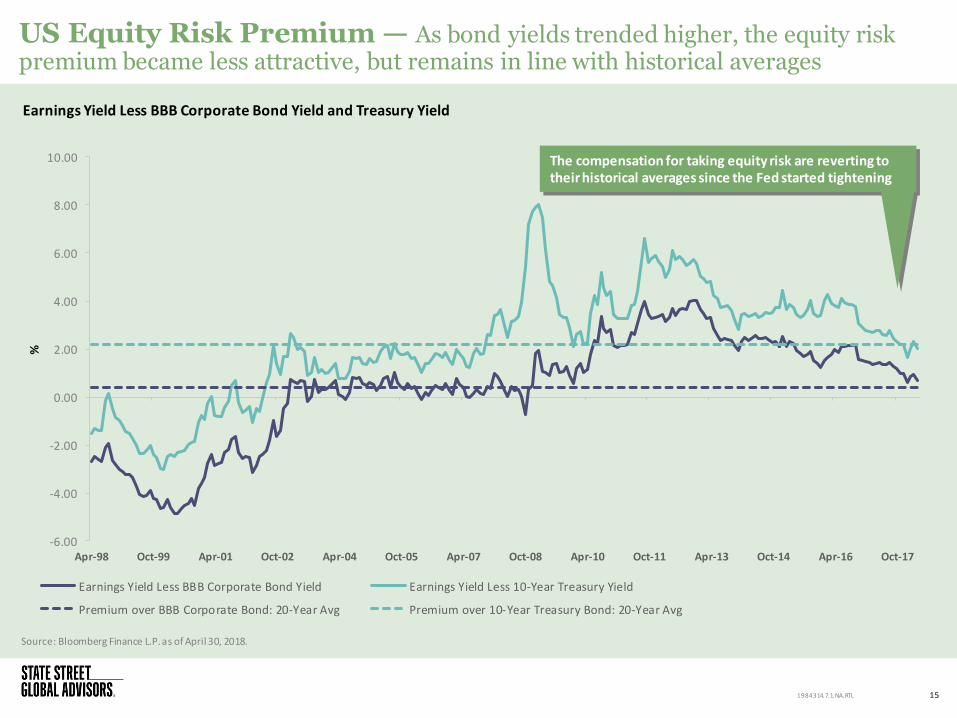
US Equity Risk Premium — As bond yields trended higher, the equity risk premium became less attractive, but remains in line with historical averages
Source: Bloomberg Finance L.P. as of April 30, 2018.
15 1984314.7.1.NA.RTL
Earnings Yield Less BBB Corporate Bond Yield and Treasury Yield
The compensation for taking equity risk are reverting to their historical averages since the Fed started tightening
85
90
95
100
105
110
115
120
125
May-15 Sep-15 Jan-16 May-16 Sep-16 Jan-17 May-17 Sep-17 Jan-18
No
rmal
ize
d I
nd
ex
Leve
l
Min. Vol Quality Size Yield Momentum Value
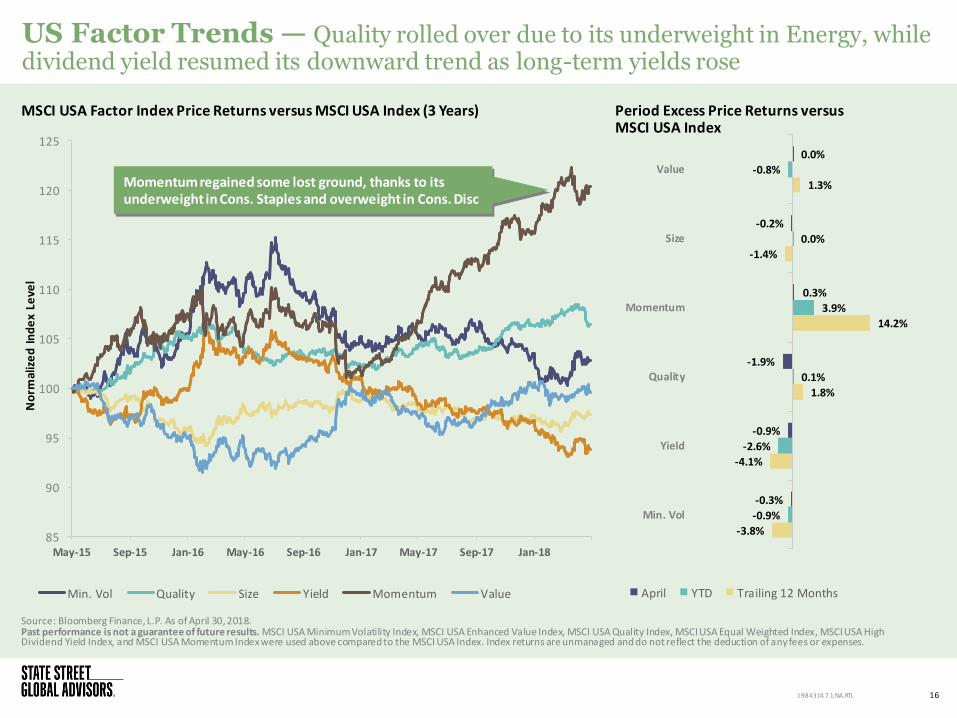
US Factor Trends — Quality rolled over due to its underweight in Energy, while dividend yield resumed its downward trend as long-term yields rose
16
Source: Bloomberg Finance, L.P. As of April 30, 2018. Past performance is not a guarantee of future results. MSCI USA Minimum Volatility Index, MSCI USA Enhanced Value Index, MSCI USA Quality Index, MSCI USA Equal Weighted Index, MSCI USA High Dividend Yield Index, and MSCI USA Momentum Index were used above compared to the MSCI USA Index. Index returns are unmanaged and do not reflect the deduction of any fees or expenses.
MSCI USA Factor Index Price Returns versus MSCI USA Index (3 Years) Period Excess Price Returns versus MSCI USA Index
1984314.7.1.NA.RTL
-3.8%
-4.1%
1.8%
14.2%
-1.4%
1.3%
-0.9%
-2.6%
0.1%
3.9%
0.0%
-0.8%
-0.3%
-0.9%
-1.9%
0.3%
-0.2%
0.0%
Min. Vol
Yield
Quality
Momentum
Size
Value
April YTD Trailing 12 Months
Momentum regained some lost ground, thanks to its underweight in Cons. Staples and overweight in Cons. Disc

Sectors
17 1984314.7.1.NA.RTL
Consumer Discretionary 11.7% 12.5% 2.4 -3.5
Consumer Staples 12.0% 14.8% -4.3 -12.5
Energy 10.5% 12.8% 9.4 -0.9
Financial 5.8% 5.3% -0.4 -7.3
Health Care 11.2% 11.9% 1.2 -6.3
Industrials 11.4% 10.1% -2.8 -9.1
Materials 7.0% 7.4% 0.2 -9.1
Real Estate 4.9% 6.5% -0.6 -3.8
Technology 8.8% 9.6% 0.1 -3.7
Telecommunications 4.7% 3.8% -1.0 -8.9
Utilities 19.6% 32.1% 2.1 1.9
18
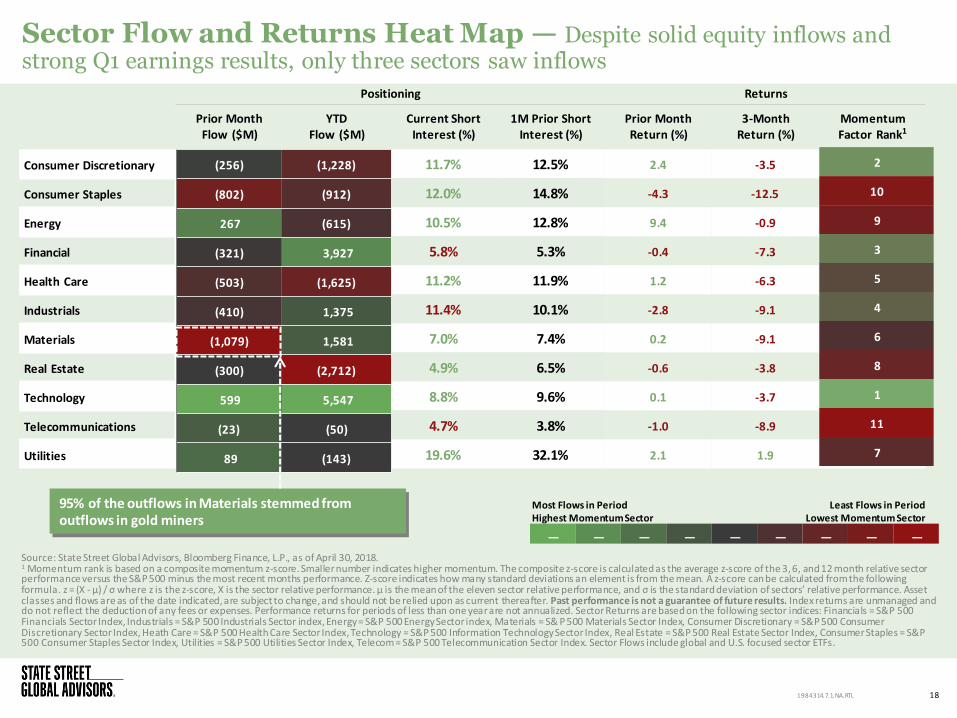
Sector Flow and Returns Heat Map — Despite solid equity inflows and strong Q1 earnings results, only three sectors saw inflows
1984314.7.1.NA.RTL
Positioning Returns
Prior Month Flow ($M)
YTD Flow ($M)
Current Short Interest (%)
1M Prior Short Interest (%)
Prior Month Return (%)
3-Month Return (%)
Momentum Factor Rank1
Source: State Street Global Advisors, Bloomberg Finance, L.P., as of April 30, 2018. 1 Momentum rank is based on a composite momentum z-score. Smaller number indicates higher momentum. The composite z-score is calculated as the average z-score of the 3, 6, and 12 month relative sector performance versus the S&P 500 minus the most recent months performance. Z-score indicates how many standard deviations an element is from the mean. A z-score can be calculated from the following formula. z = (X - μ) / σ where z is the z-score, X is the sector relative performance. μ is the mean of the eleven sector relative performance, and σ is the standard deviation of sectors’ relative performance. Asset classes and flows are as of the date indicated, are subject to change, and should not be relied upon as current thereafter. Past performance is not a guarantee of future results. Index returns are unmanaged and do not reflect the deduction of any fees or expenses. Performance returns for periods of less than one year are not annualized. Sector Returns are based on the following sector indices: Financials = S&P 500 Financials Sector Index, Industrials = S&P 500 Industrials Sector index, Energy = S&P 500 Energy Sector index, Materials = S& P 500 Materials Sector Index, Consumer Discretionary = S&P 500 Consumer Discretionary Sector Index, Heath Care = S&P 500 Health Care Sector Index, Technology = S&P 500 Information Technology Sector Index, Real Estate = S&P 500 Real Estate Sector Index, Consumer Staples = S&P 500 Consumer Staples Sector Index, Utilities = S&P 500 Utilities Sector Index, Telecom = S&P 500 Telecommunication Sector Index. Sector Flows include global and U.S. focused sector ETFs.
95% of the outflows in Materials stemmed from outflows in gold miners
Least Flows in Period Lowest Momentum Sector
Most Flows in Period Highest Momentum Sector
— — — — — — — — —
2
10
9
3
5
4
6
8
1
11
7
(256) (1,228)
(802) (912)
267 (615)
(321) 3,927
(503) (1,625)
(410) 1,375
(1,079) 1,581
(300) (2,712)
599 5,547
(23) (50)
89 (143)
Cons. Disc
Cons. Staples
Energy
Financials Health Care
Industrials
Tech
Materials
Telecom
Real Estate
Utilities
-1.5
-1.0
-0.5
0.0
0.5
1.0
1.5
-1.5 -1.0 -0.5 0.0 0.5 1.0 1.5 2.0 2.5
Val
uat
ion
re
lati
ve t
o t
he
S&
P 5
00
Valuations Based on to Sector Historical Valuation
19
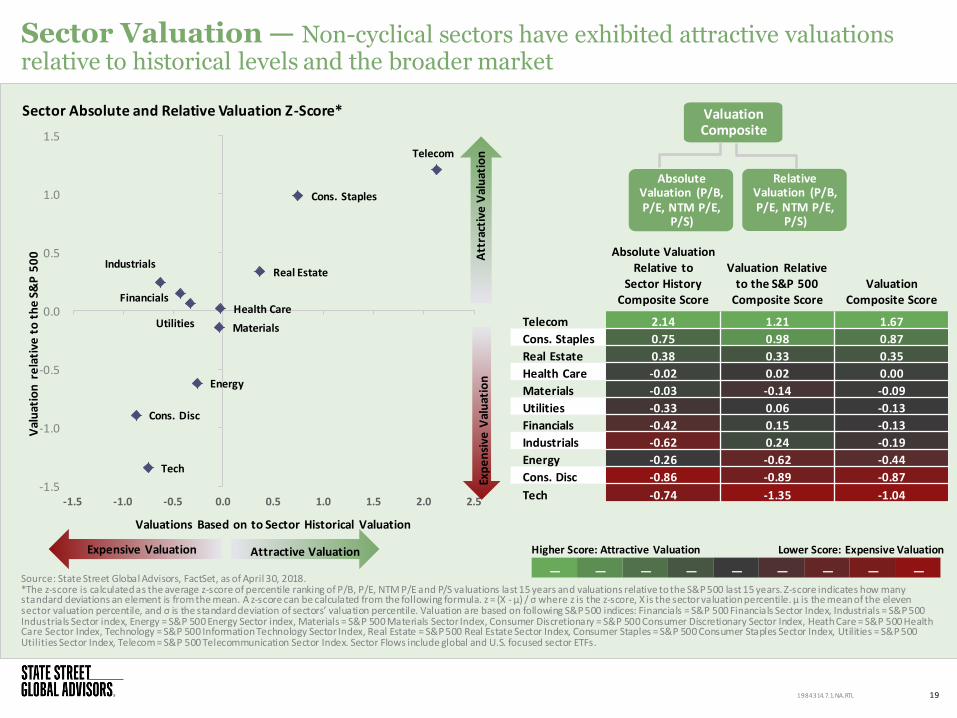
Sector Valuation — Non-cyclical sectors have exhibited attractive valuations relative to historical levels and the broader market
1984314.7.1.NA.RTL
Sector Absolute and Relative Valuation Z-Score* Valuation Composite
Relative Valuation (P/B, P/E, NTM P/E,
P/S)
Absolute Valuation (P/B, P/E, NTM P/E,
P/S)
Higher Score: Attractive Valuation Lower Score: Expensive Valuation
— — — — — — — — —
Absolute Valuation Relative to
Sector History Composite Score
Valuation Relative to the S&P 500
Composite Score Valuation
Composite Score
Telecom 2.14 1.21 1.67
Cons. Staples 0.75 0.98 0.87
Real Estate 0.38 0.33 0.35
Health Care -0.02 0.02 0.00
Materials -0.03 -0.14 -0.09
Utilities -0.33 0.06 -0.13
Financials -0.42 0.15 -0.13
Industrials -0.62 0.24 -0.19
Energy -0.26 -0.62 -0.44
Cons. Disc -0.86 -0.89 -0.87
Tech -0.74 -1.35 -1.04
Source: State Street Global Advisors, FactSet, as of April 30, 2018. *The z-score is calculated as the average z-score of percentile ranking of P/B, P/E, NTM P/E and P/S valuations last 15 years and valuations relative to the S&P 500 last 15 years. Z-score indicates how many standard deviations an element is from the mean. A z-score can be calculated from the following formula. z = (X - μ) / σ where z is the z-score, X is the sector valuation percentile. μ is the mean of the eleven sector valuation percentile, and σ is the standard deviation of sectors’ valuation percentile. Valuation are based on following S&P 500 indices: Financials = S&P 500 Financials Sector Index, Industrials = S&P 500 Industrials Sector index, Energy = S&P 500 Energy Sector index, Materials = S&P 500 Materials Sector Index, Consumer Discretionary = S&P 500 Consumer Discretionary Sector Index, Heath Care = S&P 500 Health Care Sector Index, Technology = S&P 500 Information Technology Sector Index, Real Estate = S&P 500 Real Estate Sector Index, Consumer Staples = S&P 500 Consumer Staples Sector Index, Utilities = S&P 500 Utilities Sector Index, Telecom = S&P 500 Telecommunication Sector Index. Sector Flows include global and U.S. focused sector ETFs.
Att
ract
ive
Val
uat
ion
Ex
pe
nsi
ve V
alu
atio
n
Attractive Valuation Expensive Valuation
20
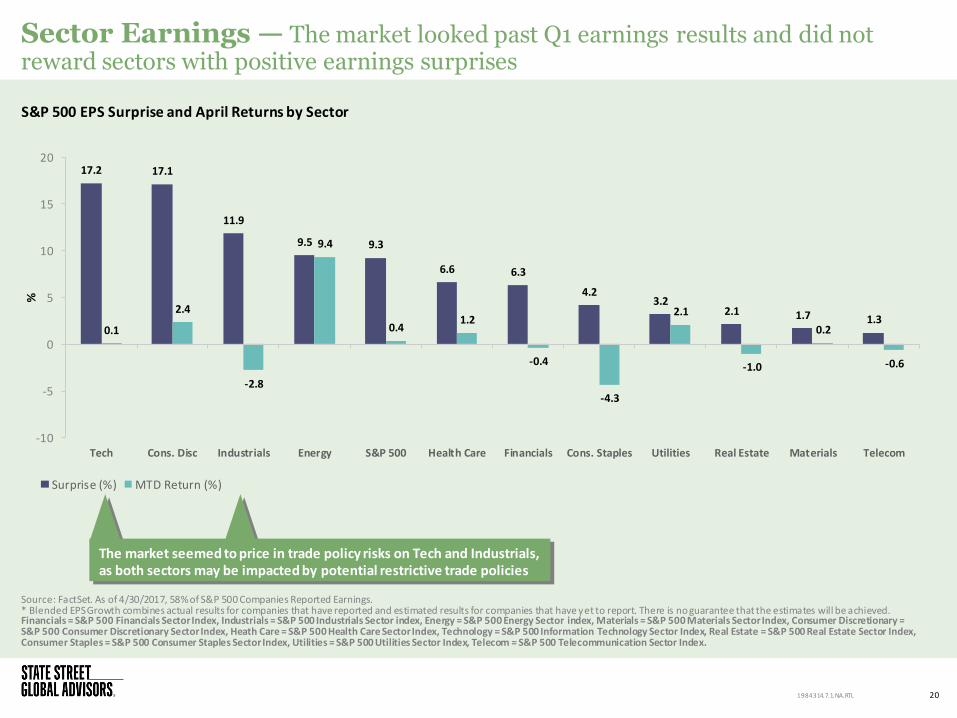
Sector Earnings — The market looked past Q1 earnings results and did not reward sectors with positive earnings surprises
1984314.7.1.NA.RTL
S&P 500 EPS Surprise and April Returns by Sector
Source: FactSet. As of 4/30/2017, 58% of S&P 500 Companies Reported Earnings. * Blended EPS Growth combines actual results for companies that have reported and estimated results for companies that have yet to report. There is no guarantee that the estimates will be achieved. Financials = S&P 500 Financials Sector Index, Industrials = S&P 500 Industrials Sector index, Energy = S&P 500 Energy Sector index, Materials = S&P 500 Materials Sector Index, Consumer Discretionary = S&P 500 Consumer Discretionary Sector Index, Heath Care = S&P 500 Health Care Sector Index, Technology = S&P 500 Information Technology Sector Index, Real Estate = S&P 500 Real Estate Sector Index, Consumer Staples = S&P 500 Consumer Staples Sector Index, Utilities = S&P 500 Utilities Sector Index, Telecom = S&P 500 Telecommunication Sector Index.
17.2 17.1
11.9
9.5 9.3
6.6 6.3
4.2 3.2
2.1 1.7 1.3 0.1
2.4
-2.8
9.4
0.4 1.2
-0.4
-4.3
2.1
-1.0
0.2
-0.6
-10
-5
0
5
10
15
20
Tech Cons. Disc Industrials Energy S&P 500 Health Care Financials Cons. Staples Utilities Real Estate Materials Telecom
%
Surprise (%) MTD Return (%)
The market seemed to price in trade policy risks on Tech and Industrials, as both sectors may be impacted by potential restrictive trade policies
0.06
-0.11
-1.18
-0.58
0.13
-2.65
1.03 1.09
-0.26
-1.04
0.29
-0.72 -0.64
-0.29
-1.01
-0.25
-0.78
-1.35
0.08
-0.54 -0.37
0.32
-3.0
-2.5
-2.0
-1.5
-1.0
-0.5
0.0
0.5
1.0
1.5
S&P 500 Cons. Disc Cons. Staples Financials Health Care Industrials Tech Materials Real Estate Telecom Utilities
Ch
ange
s to
EP
S G
row
th E
st.
Changes to Q2 2018 EPS Growth Rate Changes to 2019 EPS Growth Rate
21
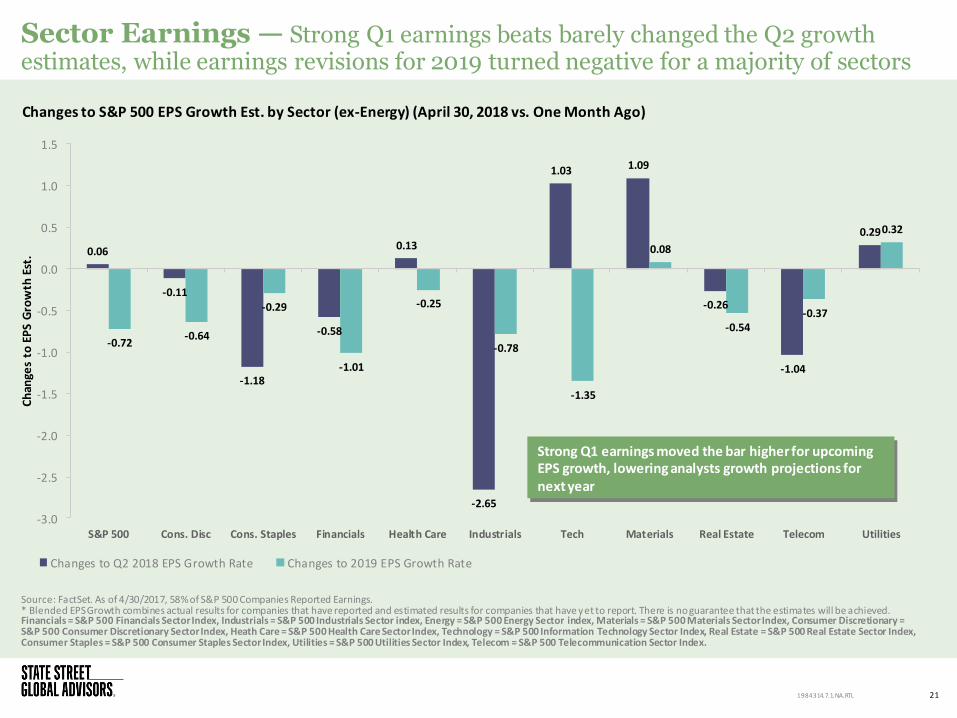
Sector Earnings — Strong Q1 earnings beats barely changed the Q2 growth estimates, while earnings revisions for 2019 turned negative for a majority of sectors
1984314.7.1.NA.RTL
Changes to S&P 500 EPS Growth Est. by Sector (ex-Energy) (April 30, 2018 vs. One Month Ago)
Source: FactSet. As of 4/30/2017, 58% of S&P 500 Companies Reported Earnings. * Blended EPS Growth combines actual results for companies that have reported and estimated results for companies that have yet to report. There is no guarantee that the estimates will be achieved. Financials = S&P 500 Financials Sector Index, Industrials = S&P 500 Industrials Sector index, Energy = S&P 500 Energy Sector index, Materials = S&P 500 Materials Sector Index, Consumer Discretionary = S&P 500 Consumer Discretionary Sector Index, Heath Care = S&P 500 Health Care Sector Index, Technology = S&P 500 Information Technology Sector Index, Real Estate = S&P 500 Real Estate Sector Index, Consumer Staples = S&P 500 Consumer Staples Sector Index, Utilities = S&P 500 Utilities Sector Index, Telecom = S&P 500 Telecommunication Sector Index.
Strong Q1 earnings moved the bar higher for upcoming EPS growth, lowering analysts growth projections for next year

Fixed Income
22 1984314.7.1.NA.RTL
96 101 104
117 123 118
98
82
67
17
39 42 47 50
60 66
59 58 55
38
1 10 9
15 22 24 24 23 21
15
0
20
40
60
80
100
120
140
Ch
ange
in
Bp
s
1 Year YTD April
0.7 0.8
1.0 1.1 1.3
1.4
1.8 2.1
2.3
3.0
1.6 1.7 1.9
2.1 2.3
2.4 2.6
2.7 2.7
3.0
1.6 1.8
2.0 2.2
2.5 2.6
2.8 2.9 3.0
3.1
0.0
0.5
1.0
1.5
2.0
2.5
3.0
3.5
1M 3M 6M 1Y 2Y 3Y 5Y 7Y 10Y 30Y
Yie
ld (
%)
US Treasury Active Curve 3/31/2017 US Treasury Active Curve 3/31/2018 US Treasury Active Curve 4/30/2018
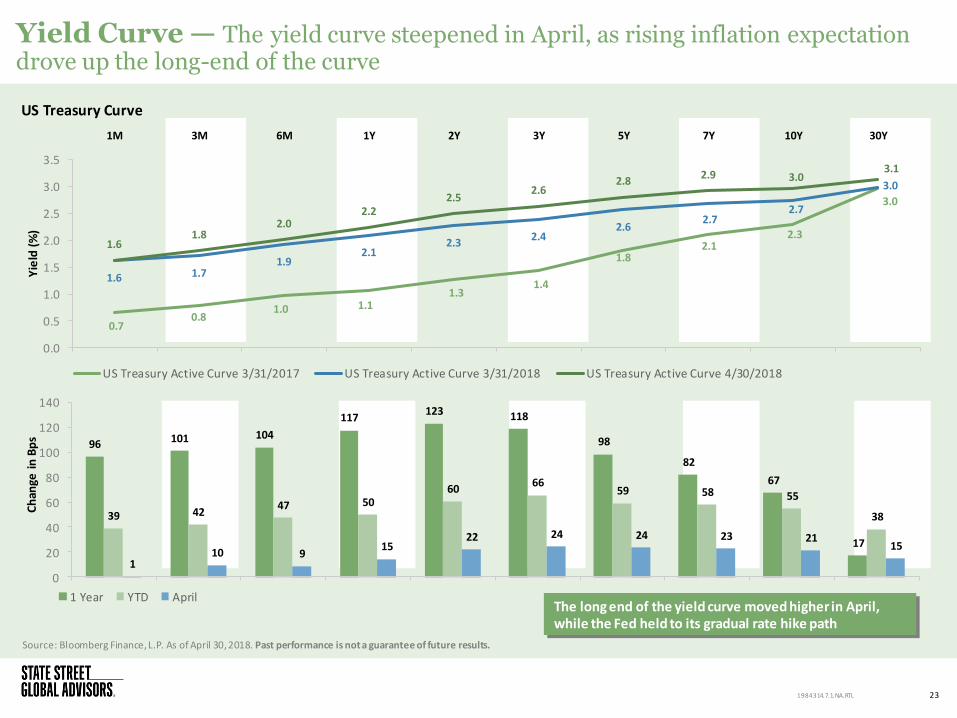
Yield Curve — The yield curve steepened in April, as rising inflation expectation drove up the long-end of the curve
Source: Bloomberg Finance, L.P. As of April 30, 2018. Past performance is not a guarantee of future results.
23
US Treasury Curve
1984314.7.1.NA.RTL
The long end of the yield curve moved higher in April, while the Fed held to its gradual rate hike path
0
0.5
1
1.5
2
2.5
3
0
0.5
1
1.5
2
2.5
3
3.5
Yie
ld S
pre
ad (
%)
Yie
ld (
%)
US 10-2 Year Yield Spread US 10 Year Yield US 2 Year Yield
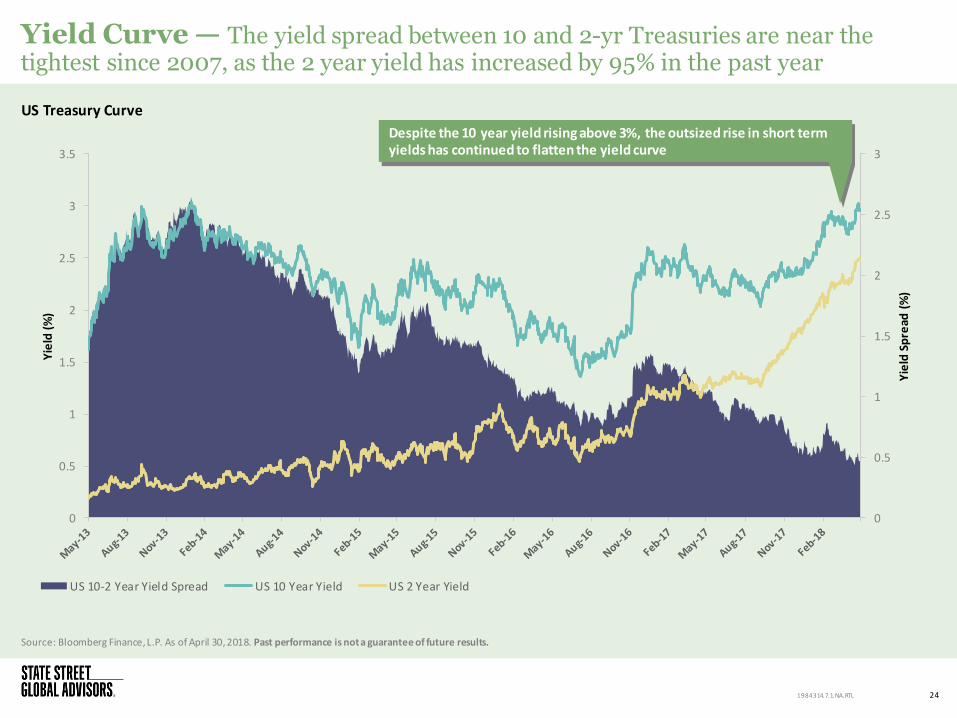
Yield Curve — The yield spread between 10 and 2-yr Treasuries are near the tightest since 2007, as the 2 year yield has increased by 95% in the past year
Source: Bloomberg Finance, L.P. As of April 30, 2018. Past performance is not a guarantee of future results.
24
US Treasury Curve
1984314.7.1.NA.RTL
Despite the 10 year yield rising above 3%, the outsized rise in short term yields has continued to flatten the yield curve
-25%
-20%
-15%
-10%
-5%
0%
5%
10%
15%
10-Year Treasury Non-Commercial Future Postions
2-Year Treasury Non-Commercial Future Postions
5-Year Treasury Non-Commercial Future Postions
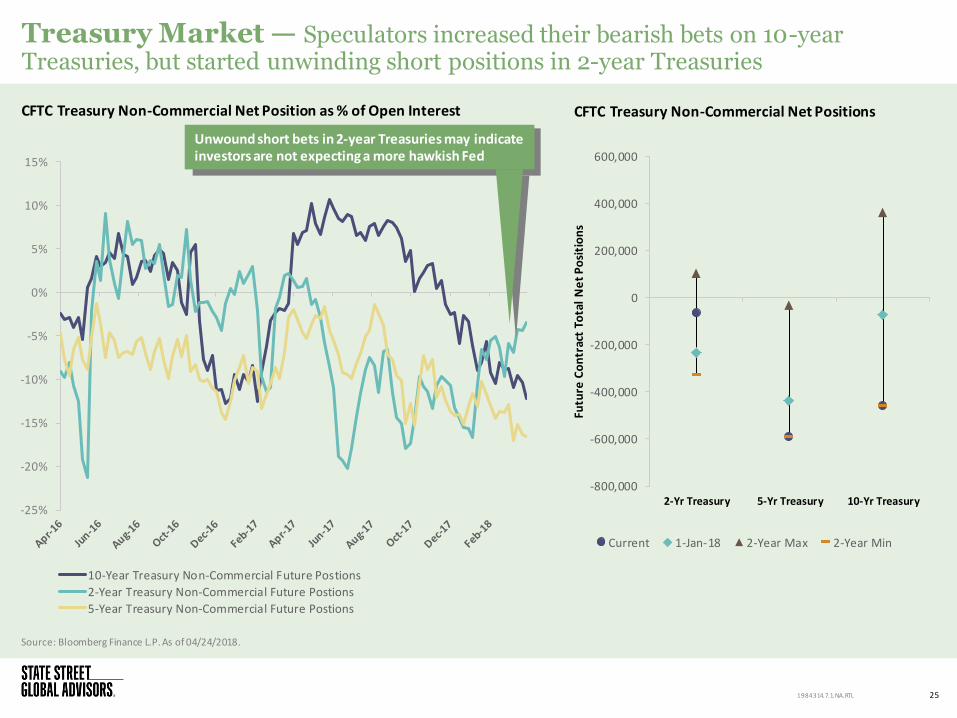
Treasury Market — Speculators increased their bearish bets on 10-year Treasuries, but started unwinding short positions in 2-year Treasuries
Source: Bloomberg Finance L.P. As of 04/24/2018.
25
CFTC Treasury Non-Commercial Net Position as % of Open Interest
1984314.7.1.NA.RTL
Unwound short bets in 2-year Treasuries may indicate investors are not expecting a more hawkish Fed
-800,000
-600,000
-400,000
-200,000
0
200,000
400,000
600,000
2-Yr Treasury 5-Yr Treasury 10-Yr Treasury
Futu
re C
on
trac
t To
tal
Ne
t P
osi
tio
ns
Current 1-Jan-18 2-Year Max 2-Year Min
CFTC Treasury Non-Commercial Net Positions
1.4
1.6
1.8
2
2.2
2.4
2.6
2.8
3
20
30
40
50
60
70
80
90
100
110
120
Bre
ake
ven
Rat
e (
%)
Oil
Pri
ces
($/B
arre
l)
WTI Oil Prices ($/barrel) U.S. 5yr 5yr Forward Breakeven Rate
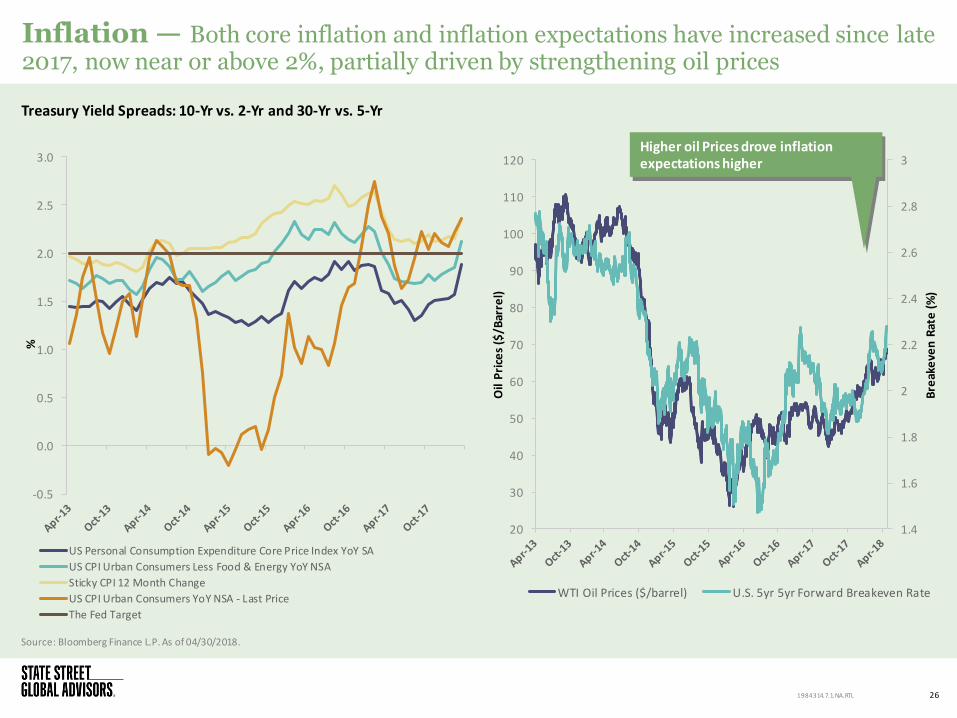
Inflation — Both core inflation and inflation expectations have increased since late 2017, now near or above 2%, partially driven by strengthening oil prices
Source: Bloomberg Finance L.P. As of 04/30/2018.
26
Treasury Yield Spreads: 10-Yr vs. 2-Yr and 30-Yr vs. 5-Yr
1984314.7.1.NA.RTL
-0.5
0.0
0.5
1.0
1.5
2.0
2.5
3.0
%
US Personal Consumption Expenditure Core Price Index YoY SA
US CPI Urban Consumers Less Food & Energy YoY NSA
Sticky CPI 12 Month Change
US CPI Urban Consumers YoY NSA - Last Price
The Fed Target
Higher oil Prices drove inflation expectations higher
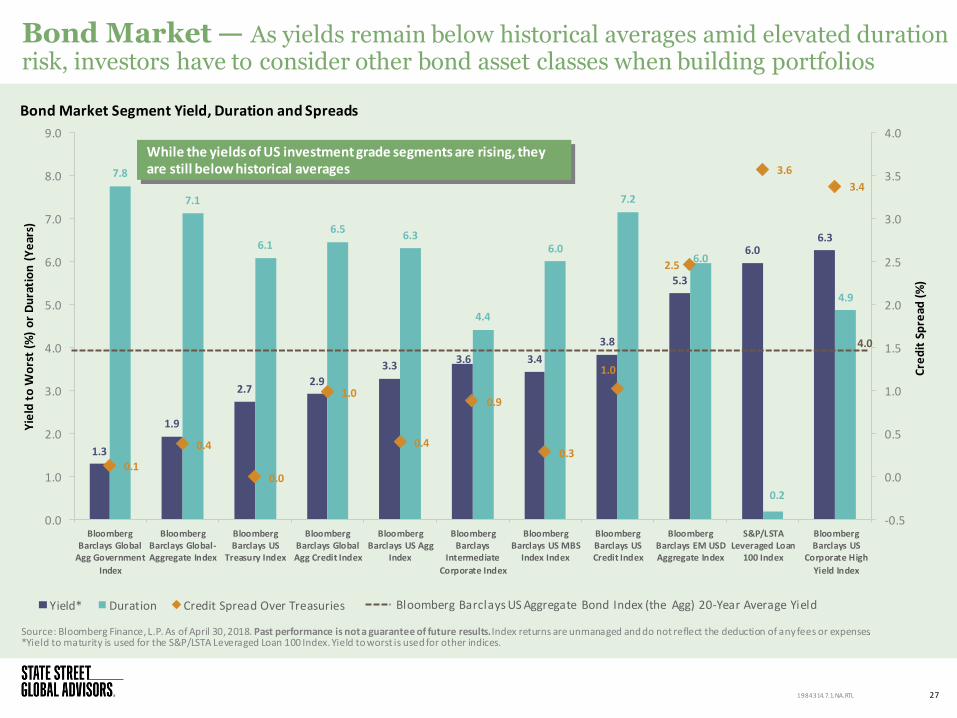
Bond Market — As yields remain below historical averages amid elevated duration risk, investors have to consider other bond asset classes when building portfolios
Source: Bloomberg Finance, L.P. As of April 30, 2018. Past performance is not a guarantee of future results. Index returns are unmanaged and do not reflect the deduction of any fees or expenses. *Yield to maturity is used for the S&P/LSTA Leveraged Loan 100 Index. Yield to worst is used for other indices.
27 1984314.7.1.NA.RTL
Bond Market Segment Yield, Duration and Spreads
1.3
1.9
2.7 2.9
3.3 3.6 3.4
3.8
5.3
6.0 6.3
7.8
7.1
6.1
6.5 6.3
4.4
6.0
7.2
6.0
0.2
4.9
0.1
0.4
0.0
1.0
0.4
0.9
0.3
1.0
2.5
3.6
3.4
-0.5
0.0
0.5
1.0
1.5
2.0
2.5
3.0
3.5
4.0
0.0
1.0
2.0
3.0
4.0
5.0
6.0
7.0
8.0
9.0
BloombergBarclays Global
Agg Government
Index
BloombergBarclays Global-Aggregate Index
BloombergBarclays US
Treasury Index
BloombergBarclays GlobalAgg Credit Index
BloombergBarclays US Agg
Index
BloombergBarclays
Intermediate
Corporate Index
BloombergBarclays US MBS
Index Index
BloombergBarclays USCredit Index
BloombergBarclays EM USDAggregate Index
S&P/LSTALeveraged Loan
100 Index
BloombergBarclays US
Corporate High
Yield Index
Cre
dit
Sp
read
(%
)
Yie
ld t
o W
ors
t (%
) o
r D
ura
tio
n (
Ye
ars)
Yield* Duration Credit Spread Over Treasuries
4.0
Bloomberg Barclays US Aggregate Bond Index (the Agg) 20-Year Average Yield
While the yields of US investment grade segments are rising, they are still below historical averages
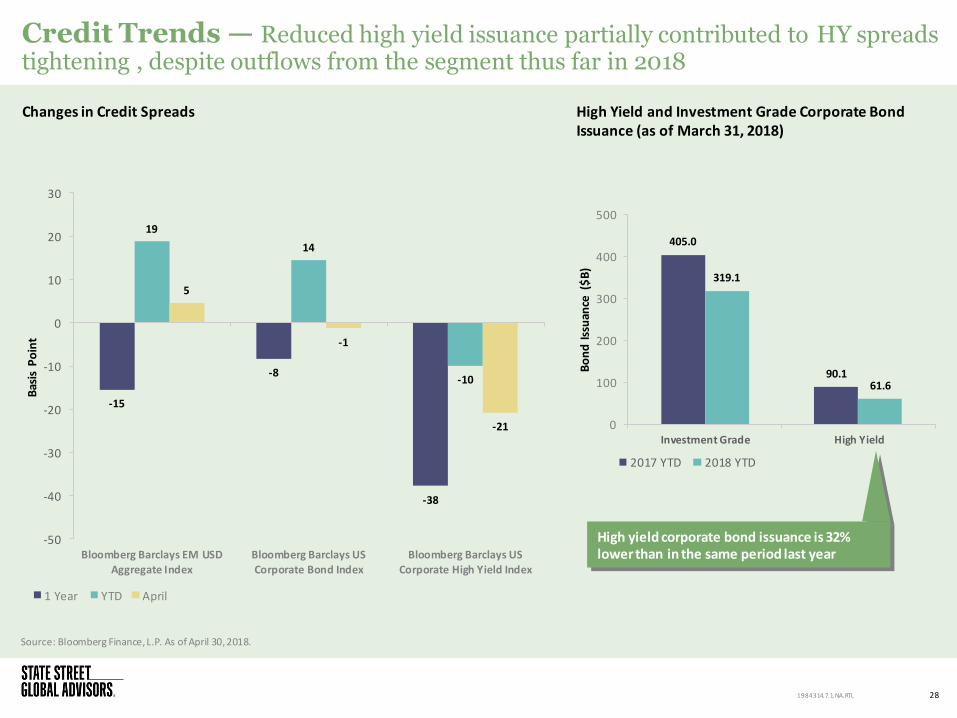
Credit Trends — Reduced high yield issuance partially contributed to HY spreads tightening , despite outflows from the segment thus far in 2018
Source: Bloomberg Finance, L.P. As of April 30, 2018.
28
Changes in Credit Spreads
1984314.7.1.NA.RTL
-15
-8
-38
19
14
-10
5
-1
-21
-50
-40
-30
-20
-10
0
10
20
30
Bloomberg Barclays EM USDAggregate Index
Bloomberg Barclays USCorporate Bond Index
Bloomberg Barclays USCorporate High Yield Index
Bas
is P
oin
t
1 Year YTD April
High Yield and Investment Grade Corporate Bond Issuance (as of March 31, 2018)
405.0
90.1
319.1
61.6
0
100
200
300
400
500
Investment Grade High Yield
Bo
nd
Iss
uan
ce (
$B
)
2017 YTD 2018 YTD
High yield corporate bond issuance is 32% lower than in the same period last year
64
65
66
67
68
69
70
71
72
73
74
90
95
100
105
110
115
May-16 Aug-16 Nov-16 Feb-17 May-17 Aug-17 Nov-17 Feb-18
JP M
org
an E
M C
urr
en
cy I
nd
ex
Blo
om
be
r B
arcl
ay I
nd
ice
s
Bloomberg Barclays EM Local Currency Government Bond Index Bloomberg Barclays EM Hard Currency Agg Government-Related Index
JP Morgan EM Currency Index
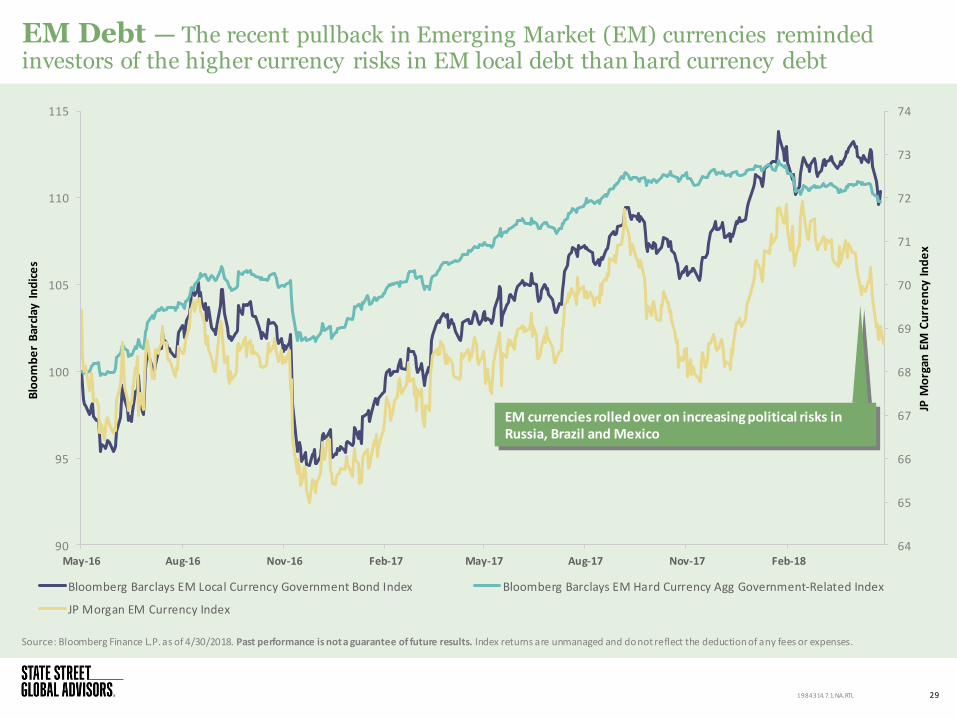
EM Debt — The recent pullback in Emerging Market (EM) currencies reminded investors of the higher currency risks in EM local debt than hard currency debt
29 1984314.7.1.NA.RTL
Source: Bloomberg Finance L.P. as of 4/30/2018. Past performance is not a guarantee of future results. Index returns are unmanaged and do not reflect the deduction of any fees or expenses.
EM currencies rolled over on increasing political risks in Russia, Brazil and Mexico
Appendix A: Flow Summary
30 1984314.7.1.NA.RTL
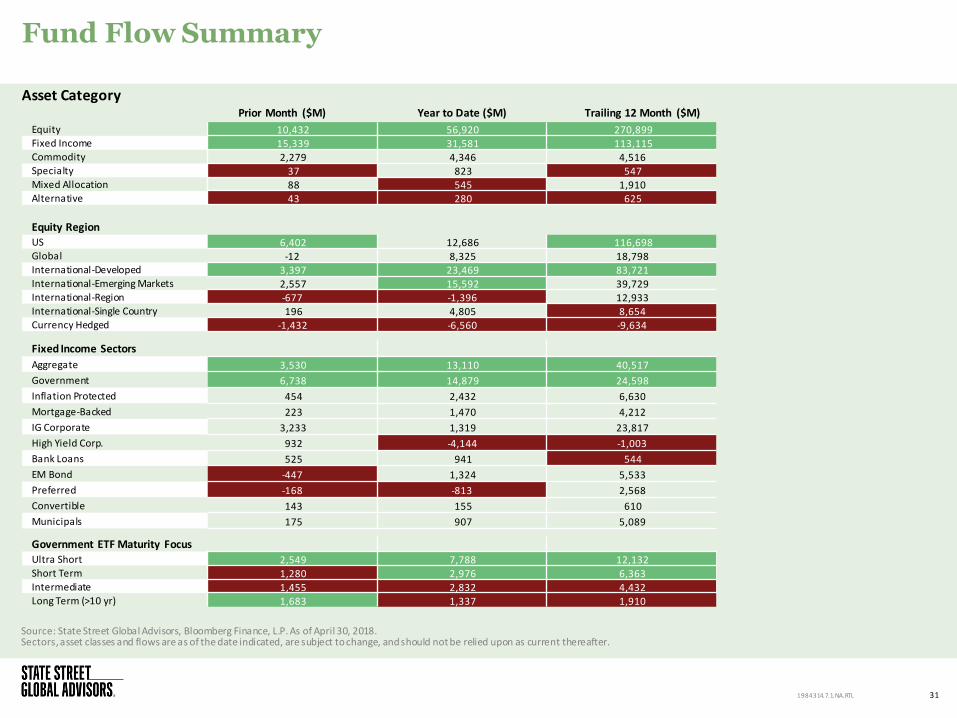
Fund Flow Summary
31 1984314.7.1.NA.RTL
Source: State Street Global Advisors, Bloomberg Finance, L.P. As of April 30, 2018. Sectors, asset classes and flows are as of the date indicated, are subject to change, and should not be relied upon as current thereafter.
Asset Category Prior Month ($M) Year to Date ($M) Trailing 12 Month ($M)
Equity 10,432 56,920 270,899 Fixed Income 15,339 31,581 113,115 Commodity 2,279 4,346 4,516 Specialty 37 823 547 Mixed Allocation 88 545 1,910 Alternative 43 280 625
Equity Region US 6,402 12,686 116,698 Global -12 8,325 18,798 International-Developed 3,397 23,469 83,721 International-Emerging Markets 2,557 15,592 39,729 International-Region -677 -1,396 12,933 International-Single Country 196 4,805 8,654 Currency Hedged -1,432 -6,560 -9,634
Fixed Income Sectors
Aggregate 3,530 13,110 40,517
Government 6,738 14,879 24,598
Inflation Protected 454 2,432 6,630
Mortgage-Backed 223 1,470 4,212
IG Corporate 3,233 1,319 23,817
High Yield Corp. 932 -4,144 -1,003
Bank Loans 525 941 544
EM Bond -447 1,324 5,533
Preferred -168 -813 2,568
Convertible 143 155 610
Municipals 175 907 5,089
Government ETF Maturity Focus Ultra Short 2,549 7,788 12,132 Short Term 1,280 2,976 6,363 Intermediate 1,455 2,832 4,432 Long Term (>10 yr) 1,683 1,337 1,910

Appendix B: Asset Class Forecast
32 1984314.7.1.NA.RTL
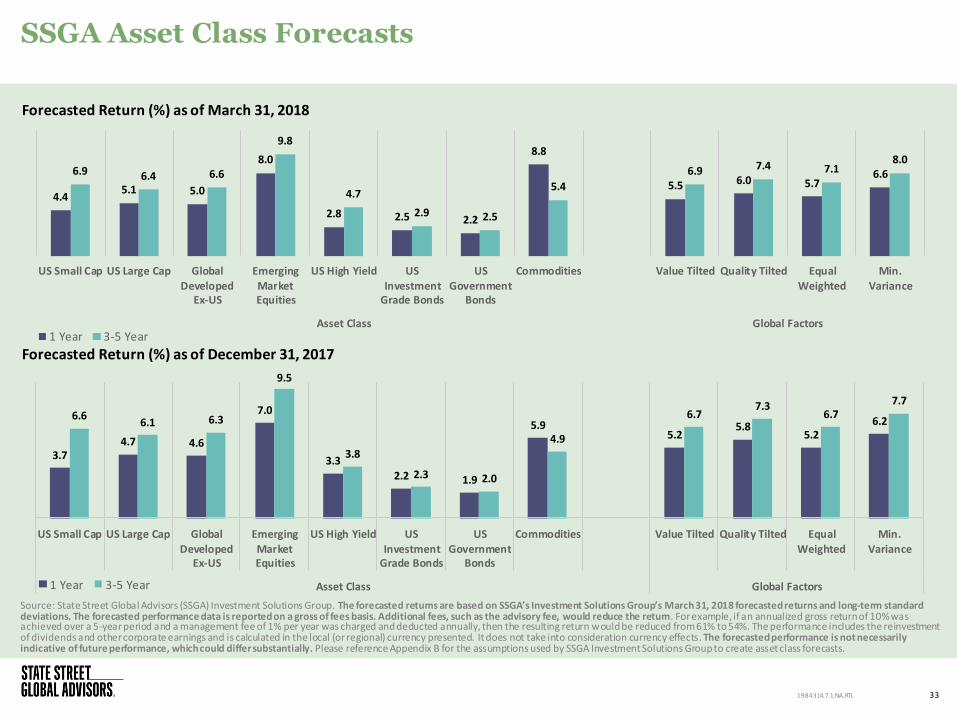
SSGA Asset Class Forecasts
Source: State Street Global Advisors (SSGA) Investment Solutions Group. The forecasted returns are based on SSGA’s Investment Solutions Group’s March 31, 2018 forecasted returns and long-term standard deviations. The forecasted performance data is reported on a gross of fees basis. Additional fees, such as the advisory fee, would reduce the return. For example, if an annualized gross return of 10% was achieved over a 5-year period and a management fee of 1% per year was charged and deducted annually, then the resulting return would be reduced from 61% to 54%. The performance includes the reinvestment of dividends and other corporate earnings and is calculated in the local (or regional) currency presented. It does not take into consideration currency effects. The forecasted performance is not necessarily indicative of future performance, which could differ substantially. Please reference Appendix B for the assumptions used by SSGA Investment Solutions Group to create asset class forecasts.
33
Forecasted Return (%) as of March 31, 2018
4.4 5.1 5.0
8.0
2.8 2.5 2.2
8.8
5.5 6.0 5.7 6.6 6.9 6.4 6.6
9.8
4.7
2.9 2.5
5.4
6.9 7.4 7.1 8.0
US Small Cap US Large Cap Global
DevelopedEx-US
Emerging
MarketEquities
US High Yield US
InvestmentGrade Bonds
US
GovernmentBonds
Commodities Value Tilted Quality Tilted Equal
Weighted
Min.
Variance
Asset Class Global Factors1 Year 3-5 Year
3.7 4.7 4.6
7.0
3.3
2.2 1.9
5.9 5.2
5.8 5.2
6.2 6.6 6.1 6.3
9.5
3.8
2.3 2.0
4.9
6.7 7.3
6.7 7.7
US Small Cap US Large Cap GlobalDeveloped
Ex-US
EmergingMarketEquities
US High Yield USInvestment
Grade Bonds
USGovernment
Bonds
Commodities Value Tilted Quality Tilted EqualWeighted
Min.Variance
Asset Class Global Factors1 Year 3-5 Year
Forecasted Return (%) as of December 31, 2017
1984314.7.1.NA.RTL
Asset Class Forecast Assumptions
34 1984314.7.1.NA.RTL
Forecast Assumptions
For Fixed Income: Our return forecasts for fixed income derive from current yield conditions together with expectations as to how real and nominal yield curves could evolve relative to historical averages. For corporate bonds, we also analyze credit spreads and their term structures, with separate assessments of investment-grade and high-yield bonds.
For Equities: Our long-term equity forecasts begin with expectations for developed market large capitalization stocks. The foundation for these fo recasts are estimates of real return potential, derived from current dividend yields, forecast real earnings growth rates, and potential for expansion or contract ion of valuation multiples. Our forecasting method incorporates long run estimates of potential economic growth based on forecast labor and capital inputs to estimate real earning growth.
For Factor Returns: Over a one to three-year forecast horizon, we look to see how cheap each factor is relative to its own history. Specifically, we focu s on book/price spreads for each factor and relate that to their subsequent returns. We find that valuation ratios are useful for forecasting market returns .
For Commodities: Our long-term commodity forecast is based on the level of world GDP, as a proxy for consumption demand, as well as on our inflation outlook. Additional factors affecting the returns to a commodities investor include how commodities are held (e.g., physically, synthetically, or via futures) and the various construction methodologies of different commodity benchmarks.

Appendix C: Definitions
35 1984314.7.1.NA.RTL
Definitions
S&P500 Index: A popular benchmark for US large-cap equities that includes 500 companies from leading industries and captures approximately 80% coverage of available market capitalization.
CBOE VIX Index: The Chicago Board Options Exchange (CBOE) Volatility Index shows the market’s expectation of 30 -day volatility. It is constructed using the implied volatilities of a wide range of S&P 500 index options.
CBOE 3-Month Volatility Index: The Index is designed to be a constant measure of 3-month implied volatility of the S&P 500® (SPX) Index options.
Implied Volatility: A way of estimating volatility of a security’s price based on a number of predictive variables. Implied volatility rises when the market is falling when investors believe that the asset’s price will decline over time, and it falls when the market is rising when investors believe that the security’s price will rise over time. This is due to the common belief that bearish markets are riskier than bullish markets.
MSCI Emerging Market Index: The MSCI Emerging Markets Index captures large and mid-cap representation across 23 emerging markets countries. With 834 consti tuents, the index covers approximately 85% of the free float-adjusted market capitalization in each country.
Russell 2000 Index: A benchmark that measures the performance of the small-cap segment of the US equity universe.
MSCI EAFE Index: An equities benchmark that captures large- and mid-cap representation across developed market countries around the world, excluding the US and Canada.
Bloomberg US High Yield Index: The Bloomberg USD High Yield Corporate Bond Index is a rules-based, market-value weighted index engineered to measure publicly issued non-investment grade USD fixed-rate, taxable, corporate bonds. To be included in the index a security must have a minimum par amount of 250MM.
Bloomberg Barclays US Aggregate Index: A benchmark that provides a measure of the performance of the US dollar denominated investment grade bond market, which includes investment grade government bonds, investment grade corporate bonds, mortgage pass through securities, commercial mortgage backed securities and asset backed securities that are publicly for sale in the US.
Bloomberg US Treasury Index: The Bloomberg US Treasury Bond Index is a rules-based, market-value weighted index engineered to measure the performance and characteristics of fixed rate coupon US Treasuries which have a maturity greater than 12 months. To be included in the index a security must have a minimum par amoun t of 1,000MM.
Bloomberg Commodity Index: Bloomberg Commodity Index (BCOM) is calculated on an excess return basis and reflects commodity futures price movements. The index rebalances annually weighted 2/3 by trading volume and 1/3 by world production and weight-caps are applied at the commodity, sector and group level for diversification.
MSCI Europe Index: The MSCI Europe Index is a free-float weighted equity index designed to measure the equity market performance of the developed markets in Europe.
Euro STOXX 50 Index: Europe’s leading blue-chip index for the Eurozone, provides a blue-chip representation of super-sector leaders in the Eurozone. The index covers 50 stocks from 12 Eurozone countries.
MSCI Japan Index: The MSCI Europe Index is a free-float weighted equity index designed to measure the equity market performance of the developed markets in Japan.
Bloomberg Dollar Spot Index: The Bloomberg Dollar Spot Index tracks the performance of a basket of ten leading global currencies versus the US Dollar. Each currency in the basket and their weight is determined annually based on their share of international trade and FX liquidity.
Bloomberg Barclays Global Aggregate Bond Index: A benchmark that provides a broad-based measure of the global investment-grade fixed income markets. The three major components of this index are the U.S. Aggregate, the Pan-European Aggregate, and the Asian-Pacific Aggregate Indices. The index also includes Eurodollar and Euro-Yen corporate bonds, Canadian government, agency and corporate securities, and USD investment-grade 144A securities.
State Street Confidence Indexes: Measures investor confidence or risk appetite quantitatively by analyzing the actual buying and selling patterns of institutional investors. The index assigns a precise meaning to changes in investor risk appetite: the greater the percentage allocation to equities, the higher risk appetite or confidence. A reading of 100 is neutral; it is the level at which investors are neither increasing nor decreasing their long-term allocations to risky assets. The results shown represent current results generated by State Street Investor Confidence Index. The results shown were achieved by means of a mathematical formula in addition to transactional market data, and are not indicative of actual future results which could differ substantially.
BofA Merrill Lynch US High Yield Master II Index: The BofA Merrill Lynch US High Yield Index tracks the performance of US dollar denominated below investment grade corporate debt publi cly issued in the US domestic market. Qualifying securities must have a below investment grade rating (based on an average of Moody’s, S&P and Fitch).
Yield to worst: Yield to worst is an estimate of the lowest yield that you can expect to earn from a bond when holding to maturity, absent a default. It is a measure that is used in place of yield to maturity with callable bonds.
Overnight Index Swap (OIS) rate: The overnight Index Swap rate is calculated from contracts in which investors swap fixed-and floating-rate cash flows. It’s commonly used as proxies for where market see U.S. central bank policy headed at various points in the future.
36 1984314.7.1.NA.RTL
Definitions
MSCI USA Index: The MSCI World Index, which is part of The Modern Index Strategy, is a broad global equity benchmark that represents large an d mid-cap equity performance across 23 developed markets countries. It covers approximately 85% of the free float-adjusted market capitalization in each country and MSCI World benchmark does not offer exposure to emerging markets.
MSCI USA Minimum Volatility Index: The MSCI USA Minimum Volatility (USD) Index aims to reflect the performance characteristics of a minimum variance strategy applied to the MSCI large and mid cap equity universe. The index is calculated by optimizing the MSCI USA Index, its parent index, for the lowest absolute risk (within a given set of constraints). Historically, the index has shown lower beta and volatility characteristics relative to the MSCI World Index.
MSCI USA Enhanced Value Weighted Index: The MSCI USA Enhanced Value Weighted Index captures large and mid-cap representation across the US equity markets exhibiting overall value style characteristics. The index is designed to represent the performance of securities that exhibit higher value characteristics relative to their peers within the corresponding GICS® sector.
MSCI USA Quality Index: The MSCI USA Quality Index is based on MSCI USA, its parent index. The index aims to capture the performance of quality growth stocks by identifying stocks with high quality scores based on three main fundamental variables: high return on equity (ROE), stable year-over-year earnings growth and low financial leverage.
MSCI USA Equal Weighted Index: The MSCI USA Equal Weighted Index represents an alternative weighting scheme to its market cap weighted parent index, the MSCI USA Index. At each quarterly rebalance date, all index constituents are weighted equally, effectively removing the influence of each constituent’s current price (high or low).
MSCI USA High Dividend Yield Index: The MSCI World High Dividend Yield Index is based on the MSCI USA Index, its parent index, and includes large and mid cap stocks. The index is designed to reflect the performance of equities in the parent index (excluding REITs) with higher dividend income and quality characteristics than average dividend yields that are both sustainable and persistent. The index also applies quality screens and reviews 12-month past performance to omit stocks with potentially deteriorating fundamentals that could force them to cut or reduce dividends.
Price-to-book ratio (P/B Ratio): The price-to-book ratio (P/B Ratio) is a ratio used to compare a stock’s market value to its book value. It is calculated by dividing the current closing price of the stock by the latest quarter’s book value per share. Also known as the "price-equity ratio.
Price-earnings ratio (P/E Ratio): The price-earnings ratio (P/E Ratio) is the ratio for valuing a company that measures its current share price relative to its per-share earnings. The price-earnings ratio can be calculated as: Market Value per Share/Earnings per Share.
S&P 500 Pure Growth Index: The S&P 500® Pure Growth index is a style-concentrated index designed to track the performance of stocks that exhibit the strongest growth characteristics by using a style-attractiveness-weighting scheme.
S&P 500 Pure Value Index: The S&P 500® Pure Value index is a style-concentrated index designed to track the performance of stocks that exhibit the strongest value characteristics by using a style-attractiveness-weighting scheme.
S&P 500 High Beta Index: The S&P 500® High Beta Index measures the performance of 100 constituents in the S&P 500 that are most sensitive to changes i n market returns. The index is designed for investors initiating a bullish strategy or making a directional bet on current markets.
S&P Low Beta United States Index: The S&P Low Beta United States Index is a rules-based, float-adjusted market cap weighted index that contains the 70% of the S&P United States BMI (by market capitalization) with the lowest beta.
Z-score: It indicates how many standard deviations an element is from the mean. A z-score can be calculated from the following formula. z = (X - μ) / σ where z is the z-score, X is the sector relative performance. μ is the mean of the eleven sector relative performance, and σ is the standard deviation of sectors’ relative performance.
Implied Volatility: The estimated volatility of a security’s price. In general, implied volatility increases when the market is bearish and decreases when the market is bullish. This is due to the common belief that bearish markets are more risky than bullish markets.
Minimum Volatility Factor: A category of stocks that are characterized by relatively less movement in share price than many other equities.
Quality Factor: One of the six widely recognized, research-based smart beta factors that refers to “quality” equities. Companies whose stocks qualify exhibit consistent profitability, stability of earnings, low financial leverage and other characteristics consistent with long-term reliability such as ethical corporate governance.
Size Factor: A smart beta factor based on the tendency of small-cap stocks to outperform their large-cap peers over long time periods.
Yield Factor: A factor which screens for companies with a higher than average dividend yield relative to the broad market, and which have d emonstrated dividend sustainability and persistence.
Momentum Factor: The tendency for a security to maintain a certain direction of price trajectory. This tendency is well documented in academic research, which has made “momentum” one of the six smart beta factors that are systematically being isolated in new-generation strategic indexes.
Value Factor: One of the basic elements of “style”-focused investing that focuses on companies that may be priced below intrinsic value. The most commonly used methodology to assess value is by examining price-to-book (P/B) ratios, which compare a company’s total market value with its assessed book value.
37 1984314.7.1.NA.RTL
Definitions
Standard Deviation: Measures the historical dispersion of a security, fund or index around an average. Investors use standard deviation to measure expected risk or volatility, and a higher standard deviation means the security has tended to show higher volatility or price swings in the past.
Excess Returns: A security’s return minus the return from another security in the same time period.
Current Short Interest (%): The percentage of tradable outstanding shares which have been shorted. Used as a measure of investor sentiment.
Yield: The income produced by an investment, typically calculated as the interest received annually divided by the investment’s price.
Basis Point: One hundredth of one percent, or 0.01%.
Yield Curve: A graph or line that plots the interest rates or yields of bonds with similar credit quality but different durations, typically from shortest to longest duration. When the yield curve is said to be flat, it means the difference in yields between bonds with shorter and longer durations is relatively narrow. When the yield curve is said to be steepened, it means the difference in yields between short term and long term bonds increases.
Spread Changes: Changes in the spread between Treasury securities and non-Treasury securities that are identical in all respects except for quality rating.
Bloomberg Barclays Global Aggregate Bond Index: The Bloomberg Barclays Global Aggregate Index is a flagship measure of global investment grade debt from twenty-four local currency markets. This multi-currency benchmark includes treasury, government-related, corporate and securitized fixed-rate bonds from both developed and emerging markets issuers.
Bloomberg Barclays US Corporate High Yield Index: The index consists of fixed rate, high yield, USD-denominated, taxable securities issued by US corporate issuers.
Bloomberg Barclays USD Liquid Investment Grade Corporate Index: The Bloomberg Barclays USD Liquid Investment Grade Corporate Index consists of fixed rate, investment grade, taxable, USD -denominated securities issued by US corporate issuers, with time since issuance of less than two years, that meet certain liquidity requi rements.
Bloomberg Barclays EM Hard Currency Aggregate Index: The index is a hard currency emerging markets debt benchmark that includes US dollar-denominated debt from sovereign, quasi-sovereign, and corporate issuers in the developing markets.
BofA Merrill Lynch US High Yield CCC or Below Index: The BofA Merrill Lynch US High Yield CCC or Below Index tracks the performance of US dollar denominated, CCC or below rating corporate debt publicly issued in the US domestic market. Qualifying securities must have a CCC or Below rating (based on an average of Moody’s, S&P and Fitch).
Bloomberg Barclays US Corporate Bond Index: The Bloomberg Barclays US Corporate Bond Index measures the investment grade, US dollar-denominated, fixed-rate, taxable corporate and government related bond markets. It is composed of the US Corporate Index and a non-corporate component that includes foreign agencies, sovereigns, supranationals and local authorities.
The Global Industry Classification Standard (GICS): An industry taxonomy developed in 1999 by MSCI and Standard & Poor’s (S&P) for use by the global financial community. The GIC S structure consists of 10 sectors, 24 industry groups, 67 industries and 156 sub-industries [1]into which S&P has categorized all major public companies.
Credit Spread: A credit spread is the difference in yield between a US Treasury bond and a debt security with the same maturity but of lesser quality.
S&P 500 Health Care Sector Index: The Index comprises of those companies included in the S&P 500 that are classified as members of the GICS® health care sector .
S&P 500 Consumer Discretionary Index: The Index comprises of those companies included in the S&P 500 that are classified as members of the GICS® consumer discretio nary sector.
S&P 500 Consumer Staples Index: The Index comprises of those companies included in the S&P 500 that are classified as members of the GICS® consumer staples sector.
S&P 500 Financial Sector Index: The Index comprises of those companies included in the S&P 500 that are classified as members of the GICS® financial sector.
S&P 500 Utilities Index: The Index comprises of those companies included in the S&P 500 that are classified as members of the GICS® utilities sector.
S&P500 Information Technology Sector Index: The Index comprises of those companies included in the S&P 500 that are classified as members of the GICS® information techno logy sector.
S&P 500 Industrial Sector Index: The Index comprises of those companies included in the S&P 500 that are classified as members of the GICS® industrial sector.
S&P 500 Materials Sector Index: The Index comprises of those companies included in the S&P 500 that are classified as members of the GICS® materials sector.
S&P 500 Real Estate Sector Index: The Index comprises of those companies included in the S&P 500 that are classified as members of the GICS® real estate sector.
S&P 500 Telecommunication Sector Index: The Index comprises of those companies included in the S&P 500 that are classified as members of the GICS® telecommunication services sector.
Breakeven Inflation Rate: It is a market based measure of expected inflation. It is the difference between the yield of a nominal bond and an inflation linked bond of the same maturity.
38 1984314.7.1.NA.RTL

Appendix D: Important Disclosures
39 1984314.7.1.NA.RTL

Important Disclosures
The views expressed in this material are the views of SPDR Americas Research Team and are subject to change based on market and other conditions. This document contains certain s tatements that may be deemed forward-looking statements. Please note that any such statements are not guarantees of any future performance and actual results or developments may di ffer materially from those projected.
The information provided does not constitute investment advice and it should not be relied on as such. It should not be considered a solicitation to buy or an offer to sell a security. It does not take into account any investor’s particular investment objectives, strategies, tax s tatus or investment horizon. You should consult your tax and financial advisor.
Al l material has been obtained from sources believed to be reliable. There i s no representation or warranty as to the accuracy of the information and State Street shall have
no l iability for decisions based on such information.
Al l the index performance results referred to are provided exclusively for comparison purposes only. It should not be assumed that they represent the performance of any particular investment.
Bonds generally present less short-term ri sk and volatility than stocks, but contain interest rate risk (as interest rates rise, bond prices usually fa ll); issuer default risk; issuer credit ri sk; l iquidity ri sk; and inflation ri sk. These effects are usually pronounced for longer-term securities. Any fixed income security sold or redeemed prior to maturity may be subject to a
substantial gain or loss.
The va lues of debt securities may decrease as a result of many factors, including, by way of example, general market fluctuations; increases in interest rates; actual or perceived inability or unwi llingness of issuers, guarantors or liquidity providers to make scheduled principal or interest payments; illiquidity in debt securities markets; and prepayments of principal,
which often must be reinvested in obligations paying interest at lower rates.
Equity securities may fluctuate in value in response to the activities of individual companies and general market and economic conditions.
Investments in small-sized companies may involve greater risks than in those of larger, better known companies.
Investments in mid-sized companies may involve greater ri sks than in those of larger, better known companies, but may be less volatile than investments in smaller companies.
Companies with large market capitalizations go in and out of favor based on market and economic conditions. Larger companies tend to be less volatile than companies with smaller market capitalizations. In exchange for this potentially lower ri sk, the va lue of the security may not rise as much as companies with smaller market capitalizations.
Value stocks can perform differently from the market as a whole. They can remain undervalued by the market for long periods of time.
Foreign investments involve greater risks than US investments, including political and economic risks and the risk of currency fluctuations, a ll of which may be magnified in emerging markets.
Because of their narrow focus, sector funds tend to be more volatile.
Commodities investing entail significant risk as commodity prices can be extremely volatile due to wide range of factors Bond funds contain interest rate risk (as interest rates rise bond prices usually fa ll); the ri sk of issuer default; issuer credit risk; liquidity ri sk; and inflation risk.
Asset Allocation i s a method of diversification which positions assets among major investment categories. Asset Allocation may be used in an effort to manage risk and enhance returns. It does not, however, guarantee a profit or protect against loss.
40 1984314.7.1.NA.RTL
Important Disclosures (continued)
The trademarks and service marks referenced herein are the property of their respective owners. Third party data providers make n o warranties or representations of any kind relating to the accuracy, completeness or timeliness of the data and have no liability for damages of any kind relating to th e use of such data.
Standard & Poor’s, S&P and SPDR are registered trademarks of Standard & Poor/s Financial Services LLC (S&P); Dow Jones is a registered trademark of Dow Jones Trademark Holdings LLC (Dow Jones); and these trademarks have been l icensed for use by S&P Dow Jones Indices LLC (SPDJI) and sublicensed for certain purposes by State Street Corporation. State Street Corporation’s financial products are not sponsored, endorsed, sold or promoted by SPDJI, Dow Jones, S&P, their respective affiliates and th ird party l icensors and none of such parties make any representation regarding the advisability of investing in such product(s) nor do they have any l iability in relation thereto, including for any errors,
omissions, or interruptions of any index.
Distributor: State Street Global Advisors Funds Distributors LLC, member FINRA, SIPC, an indirect wholly owned subsidiary of State Street Corporation. References to State Street may include State Street Corporation and its affiliates. Certain State Street affiliates provide services and receive fees from the SPDR ETFs.
Before investing, consider the funds’ investment objectives, risks, charges and expenses. To obtain a prospectus or summary prospectus which contains this and other information, call 1-866-787-2257 or visit www.spdrs.com. Read it carefully.
State Street Global Advisors, One Iron Street, Boston, MA 02210.
© 2018 State Street Corporation — Al l Rights Reserved.
Tracking Code: 1984314.7.1.NA.RTL
Expiration Date: August 31, 2018
Not FDIC Insured — No Bank Guarantee — May Lose Value.
41 1984314.7.1.NA.RTL