Embed Size (px)
Citation preview
Continuing Education examination available at http://www.cdc.gov/mmwr/cme/conted_info.html#weekly.
U.S. Department of Health and Human ServicesCenters for Disease Control and Prevention
Morbidity and Mortality Weekly ReportWeekly / Vol. 62 / No. 28 July 19, 2013
Healthy life expectancy (HLE) is a population health mea-sure that combines mortality data with morbidity or health status data to estimate expected years of life in good health for persons at a given age. HLE accounts for quantity and quality of life and can be used to describe and monitor the health status of populations. HLE estimates for countries have been used for predicting future health service needs, evaluating health programs, and identifying trends and inequalities (1), but to date, few studies have reported HLE at the state level for the United States (2). To determine state-level estimates, CDC used data from the National Vital Statistics Systems (NVSS), U.S. Census Bureau, and Behavioral Risk Factor Surveillance System (BRFSS) to calculate HLEs for persons aged 65 years, by sex and race, for each of the 50 states and the District of Columbia (DC). Those calculations indicate that, during 2007–2009, females had a greater HLE than males at age 65 years in every state and DC. HLE was greater for whites than for blacks in all states from which sufficient data were available and DC, except in Nevada and New Mexico. These results can be used as a baseline for states to monitor changes in the HLE of persons aged 65 years as they age and identify health disparities among subpopulations.
State-specific HLE estimates were calculated from three data sources: 1) 2007–2009 state-specific, individual-level multiple cause mortality data from NVSS; 2) 2007–2009 bridged-race, mid-year population estimates from the U.S. Census Bureau; and 3) 2007–2009 self-reported health status data from BRFSS, a state-based, telephone survey of noninstitutionalized U.S. civilian adults aged ≥18 years administered in all states and selected territories.* The BRFSS question used to assess health status was “Would you say that in general your health is excellent, very good, good, fair, or poor?” For this study, participant responses of “fair or poor” were categorized as “unhealthy” and “excellent, very good, or good” as “healthy.”
During 2007–2009, the BRFSS median response rate† for states ranged from 50.6% to 53.3% (3).
Life expectancy (LE) (i.e., expected years of life at a given age) is the average remaining years of life a person can expect to live on the basis of the current mortality rates for the population. HLE estimates the equivalent healthy years that a person can expect to live on the basis of the current mortality rates and prevalence distribution of health status in the population. An abridged life table method was used to estimate LE using data by 5-year age intervals (4). State-specific HLE estimates were calculated from the LE estimates and the self-reported health status data from the BRFSS.
To estimate LE, age-specific death rates were calculated using the mid-year U.S. Census population and the number of deaths in the NVSS. Age-specific death rates were used to estimate the number of survivors, the total number of person-years lived within each age interval, and the average expected years of life remaining per person at the beginning of each
State-Specific Healthy Life Expectancy at Age 65 Years — United States, 2007–2009
* Additional information about BRFSS is available at http://www.cdc.gov/brfss.
† The response rate reflects telephone sampling efficiency and the degree of participation among eligible respondents contacted. The cooperation rate reflects the proportion of persons who completed an interview among eligible persons contacted.
INSIDE567 Salmonella Enteritidis Infections Associated with
Foods Purchased from Mobile Lunch Trucks — Alberta, Canada, October 2010–February 2011
570 Dengue Outbreak — Federated States of Micronesia, 2012–2013
574 Updated Recommendations for Use of VariZIG — United States, 2013
577 Announcement578 QuickStats
Morbidity and Mortality Weekly Report
562 MMWR / July 19, 2013 / Vol. 62 / No. 28
The MMWR series of publications is published by the Office of Surveillance, Epidemiology, and Laboratory Services, Centers for Disease Control and Prevention (CDC), U.S. Department of Health and Human Services, Atlanta, GA 30333.Suggested citation: Centers for Disease Control and Prevention. [Article title]. MMWR 2013;62:[inclusive page numbers].
Centers for Disease Control and PreventionThomas R. Frieden, MD, MPH, Director
Harold W. Jaffe, MD, MA, Associate Director for ScienceJames W. Stephens, PhD, Director, Office of Science Quality
Denise M. Cardo, MD, Acting Deputy Director for Surveillance, Epidemiology, and Laboratory ServicesStephanie Zaza, MD, MPH, Director, Epidemiology and Analysis Program Office
MMWR Editorial and Production StaffRonald L. Moolenaar, MD, MPH, Editor, MMWR Series
John S. Moran, MD, MPH, Deputy Editor, MMWR SeriesTeresa F. Rutledge, Managing Editor, MMWR Series
Douglas W. Weatherwax, Lead Technical Writer-EditorDonald G. Meadows, MA, Jude C. Rutledge, Writer-Editors
Martha F. Boyd, Lead Visual Information Specialist
Maureen A. Leahy, Julia C. Martinroe, Stephen R. Spriggs, Terraye M. Starr
Visual Information SpecialistsQuang M. Doan, MBA, Phyllis H. King
Information Technology Specialists
MMWR Editorial BoardWilliam L. Roper, MD, MPH, Chapel Hill, NC, Chairman
Matthew L. Boulton, MD, MPH, Ann Arbor, MIVirginia A. Caine, MD, Indianapolis, INBarbara A. Ellis, PhD, MS, Atlanta, GA
Jonathan E. Fielding, MD, MPH, MBA, Los Angeles, CADavid W. Fleming, MD, Seattle, WA
William E. Halperin, MD, DrPH, MPH, Newark, NJKing K. Holmes, MD, PhD, Seattle, WA
Timothy F. Jones, MD, Nashville, TNRima F. Khabbaz, MD, Atlanta, GADennis G. Maki, MD, Madison, WI
Patricia Quinlisk, MD, MPH, Des Moines, IAPatrick L. Remington, MD, MPH, Madison, WI
John V. Rullan, MD, MPH, San Juan, PRWilliam Schaffner, MD, Nashville, TN
age interval. To estimate HLE at a given age, the prevalence of being healthy at the beginning of the age interval and the total number of person-years lived by a cohort in that age interval were calculated. The products for each age interval and for all subsequent age intervals were summed to obtain the total number of years lived in healthy state at a given age. This sum was then divided by the number of persons alive at each age interval.§
HLE estimates were calculated for persons aged 65 years, by sex (male and female) and race (white and black) for each of the 50 states and DC. States with small numbers of deaths (<700 total deaths in the period studied) in specific demo-graphic categories were excluded from the analysis (5). HLE estimates for Hispanics, Asians, and American Indians/Alaska Natives were not presented because sufficient reliable data were not available at the state level. State estimates for HLE as a percent of LE for each age and race subpopulation were calculated. Statistical software was used to account for the complex BRFSS sampling. To assess disparities, differences in HLE were measured between subpopulations. The statistical significance of the differences was assessed using the two-tailed z-statistic and p<0.05.
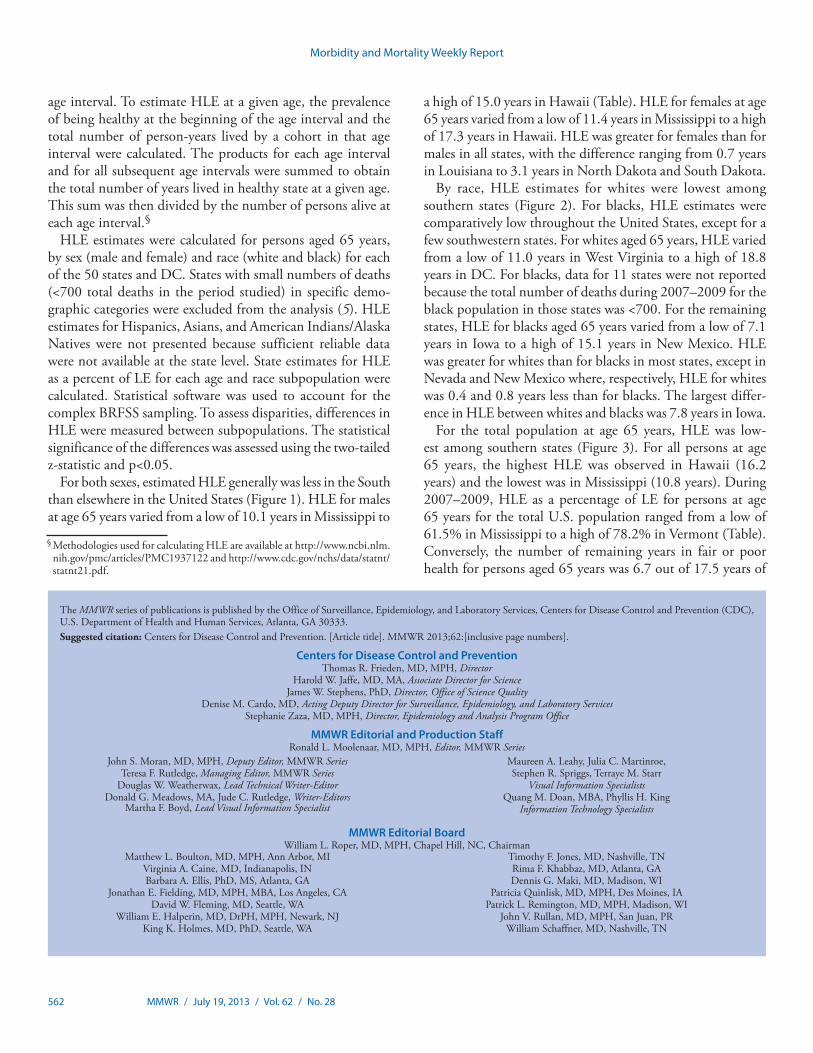
For both sexes, estimated HLE generally was less in the South than elsewhere in the United States (Figure 1). HLE for males at age 65 years varied from a low of 10.1 years in Mississippi to
a high of 15.0 years in Hawaii (Table). HLE for females at age 65 years varied from a low of 11.4 years in Mississippi to a high of 17.3 years in Hawaii. HLE was greater for females than for males in all states, with the difference ranging from 0.7 years in Louisiana to 3.1 years in North Dakota and South Dakota.
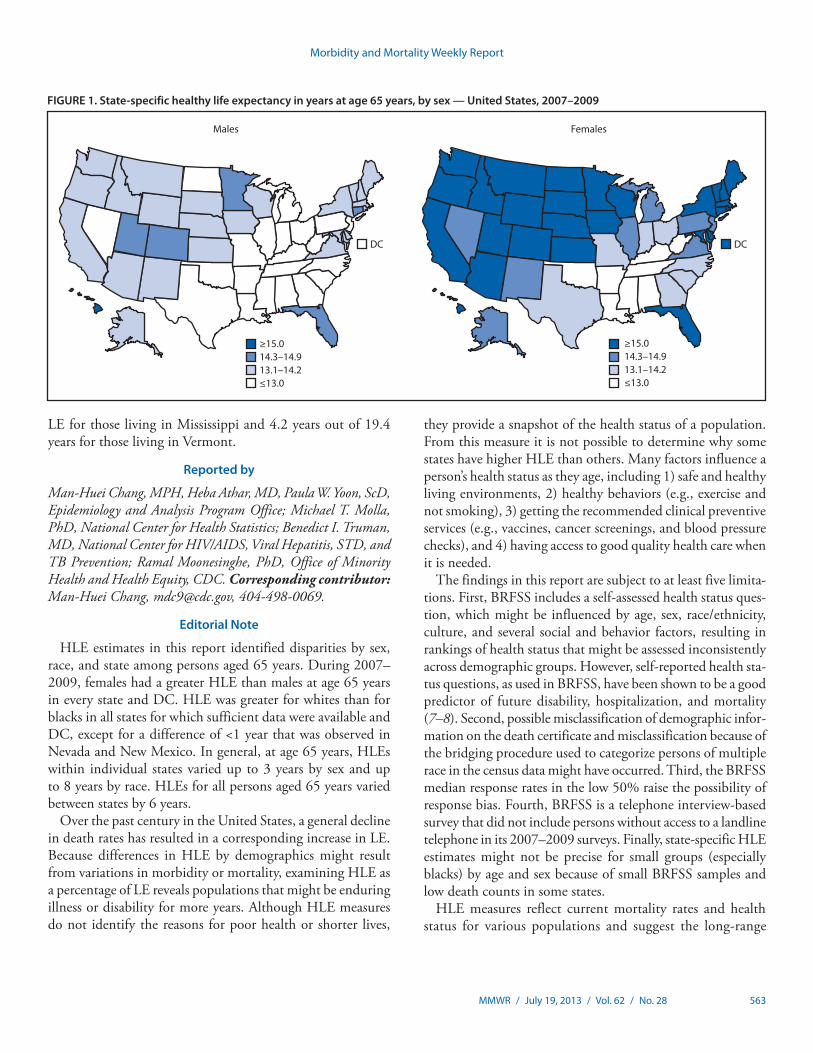
By race, HLE estimates for whites were lowest among southern states (Figure 2). For blacks, HLE estimates were comparatively low throughout the United States, except for a few southwestern states. For whites aged 65 years, HLE varied from a low of 11.0 years in West Virginia to a high of 18.8 years in DC. For blacks, data for 11 states were not reported because the total number of deaths during 2007–2009 for the black population in those states was <700. For the remaining states, HLE for blacks aged 65 years varied from a low of 7.1 years in Iowa to a high of 15.1 years in New Mexico. HLE was greater for whites than for blacks in most states, except in Nevada and New Mexico where, respectively, HLE for whites was 0.4 and 0.8 years less than for blacks. The largest differ-ence in HLE between whites and blacks was 7.8 years in Iowa.
For the total population at age 65 years, HLE was low-est among southern states (Figure 3). For all persons at age 65 years, the highest HLE was observed in Hawaii (16.2 years) and the lowest was in Mississippi (10.8 years). During 2007–2009, HLE as a percentage of LE for persons at age 65 years for the total U.S. population ranged from a low of 61.5% in Mississippi to a high of 78.2% in Vermont (Table). Conversely, the number of remaining years in fair or poor health for persons aged 65 years was 6.7 out of 17.5 years of
§ Methodologies used for calculating HLE are available at http://www.ncbi.nlm.nih.gov/pmc/articles/PMC1937122 and http://www.cdc.gov/nchs/data/statnt/statnt21.pdf.
Morbidity and Mortality Weekly Report
MMWR / July 19, 2013 / Vol. 62 / No. 28 563
LE for those living in Mississippi and 4.2 years out of 19.4 years for those living in Vermont.
Reported by
Man-Huei Chang, MPH, Heba Athar, MD, Paula W. Yoon, ScD, Epidemiology and Analysis Program Office; Michael T. Molla, PhD, National Center for Health Statistics; Benedict I. Truman, MD, National Center for HIV/AIDS, Viral Hepatitis, STD, and TB Prevention; Ramal Moonesinghe, PhD, Office of Minority Health and Health Equity, CDC. Corresponding contributor: Man-Huei Chang, [email protected], 404-498-0069.
Editorial Note
HLE estimates in this report identified disparities by sex, race, and state among persons aged 65 years. During 2007–2009, females had a greater HLE than males at age 65 years in every state and DC. HLE was greater for whites than for blacks in all states for which sufficient data were available and DC, except for a difference of <1 year that was observed in Nevada and New Mexico. In general, at age 65 years, HLEs within individual states varied up to 3 years by sex and up to 8 years by race. HLEs for all persons aged 65 years varied between states by 6 years.
Over the past century in the United States, a general decline in death rates has resulted in a corresponding increase in LE. Because differences in HLE by demographics might result from variations in morbidity or mortality, examining HLE as a percentage of LE reveals populations that might be enduring illness or disability for more years. Although HLE measures do not identify the reasons for poor health or shorter lives,
they provide a snapshot of the health status of a population. From this measure it is not possible to determine why some states have higher HLE than others. Many factors influence a person’s health status as they age, including 1) safe and healthy living environments, 2) healthy behaviors (e.g., exercise and not smoking), 3) getting the recommended clinical preventive services (e.g., vaccines, cancer screenings, and blood pressure checks), and 4) having access to good quality health care when it is needed.
The findings in this report are subject to at least five limita-tions. First, BRFSS includes a self-assessed health status ques-tion, which might be influenced by age, sex, race/ethnicity, culture, and several social and behavior factors, resulting in rankings of health status that might be assessed inconsistently across demographic groups. However, self-reported health sta-tus questions, as used in BRFSS, have been shown to be a good predictor of future disability, hospitalization, and mortality (7–8). Second, possible misclassification of demographic infor-mation on the death certificate and misclassification because of the bridging procedure used to categorize persons of multiple race in the census data might have occurred. Third, the BRFSS median response rates in the low 50% raise the possibility of response bias. Fourth, BRFSS is a telephone interview-based survey that did not include persons without access to a landline telephone in its 2007–2009 surveys. Finally, state-specific HLE estimates might not be precise for small groups (especially blacks) by age and sex because of small BRFSS samples and low death counts in some states.
HLE measures reflect current mortality rates and health status for various populations and suggest the long-range
FIGURE 1. State-specific healthy life expectancy in years at age 65 years, by sex — United States, 2007–2009
Males Females
≥15.014.3–14.913.1–14.2≤13.0
≥15.014.3–14.913.1–14.2≤13.0
DCDC
Morbidity and Mortality Weekly Report
564 MMWR / July 19, 2013 / Vol. 62 / No. 28
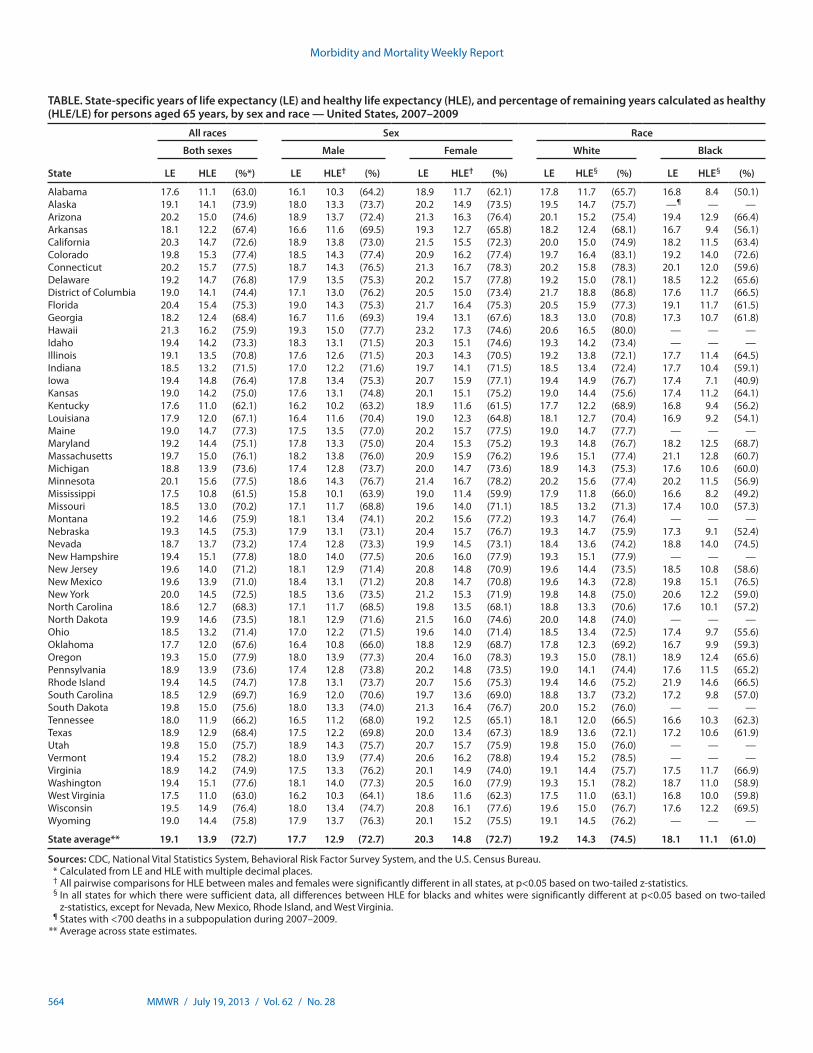
TABLE. State-specific years of life expectancy (LE) and healthy life expectancy (HLE), and percentage of remaining years calculated as healthy (HLE/LE) for persons aged 65 years, by sex and race — United States, 2007–2009
State
All races Sex Race
Both sexes Male Female White Black
LE HLE (%*) LE HLE† (%) LE HLE† (%) LE HLE§ (%) LE HLE§ (%)
Alabama 17.6 11.1 (63.0) 16.1 10.3 (64.2) 18.9 11.7 (62.1) 17.8 11.7 (65.7) 16.8 8.4 (50.1)Alaska 19.1 14.1 (73.9) 18.0 13.3 (73.7) 20.2 14.9 (73.5) 19.5 14.7 (75.7) —¶ — —Arizona 20.2 15.0 (74.6) 18.9 13.7 (72.4) 21.3 16.3 (76.4) 20.1 15.2 (75.4) 19.4 12.9 (66.4)Arkansas 18.1 12.2 (67.4) 16.6 11.6 (69.5) 19.3 12.7 (65.8) 18.2 12.4 (68.1) 16.7 9.4 (56.1)California 20.3 14.7 (72.6) 18.9 13.8 (73.0) 21.5 15.5 (72.3) 20.0 15.0 (74.9) 18.2 11.5 (63.4)Colorado 19.8 15.3 (77.4) 18.5 14.3 (77.4) 20.9 16.2 (77.4) 19.7 16.4 (83.1) 19.2 14.0 (72.6)Connecticut 20.2 15.7 (77.5) 18.7 14.3 (76.5) 21.3 16.7 (78.3) 20.2 15.8 (78.3) 20.1 12.0 (59.6)Delaware 19.2 14.7 (76.8) 17.9 13.5 (75.3) 20.2 15.7 (77.8) 19.2 15.0 (78.1) 18.5 12.2 (65.6)District of Columbia 19.0 14.1 (74.4) 17.1 13.0 (76.2) 20.5 15.0 (73.4) 21.7 18.8 (86.8) 17.6 11.7 (66.5)Florida 20.4 15.4 (75.3) 19.0 14.3 (75.3) 21.7 16.4 (75.3) 20.5 15.9 (77.3) 19.1 11.7 (61.5)Georgia 18.2 12.4 (68.4) 16.7 11.6 (69.3) 19.4 13.1 (67.6) 18.3 13.0 (70.8) 17.3 10.7 (61.8)Hawaii 21.3 16.2 (75.9) 19.3 15.0 (77.7) 23.2 17.3 (74.6) 20.6 16.5 (80.0) — — —Idaho 19.4 14.2 (73.3) 18.3 13.1 (71.5) 20.3 15.1 (74.6) 19.3 14.2 (73.4) — — —Illinois 19.1 13.5 (70.8) 17.6 12.6 (71.5) 20.3 14.3 (70.5) 19.2 13.8 (72.1) 17.7 11.4 (64.5)Indiana 18.5 13.2 (71.5) 17.0 12.2 (71.6) 19.7 14.1 (71.5) 18.5 13.4 (72.4) 17.7 10.4 (59.1)Iowa 19.4 14.8 (76.4) 17.8 13.4 (75.3) 20.7 15.9 (77.1) 19.4 14.9 (76.7) 17.4 7.1 (40.9)Kansas 19.0 14.2 (75.0) 17.6 13.1 (74.8) 20.1 15.1 (75.2) 19.0 14.4 (75.6) 17.4 11.2 (64.1)Kentucky 17.6 11.0 (62.1) 16.2 10.2 (63.2) 18.9 11.6 (61.5) 17.7 12.2 (68.9) 16.8 9.4 (56.2)Louisiana 17.9 12.0 (67.1) 16.4 11.6 (70.4) 19.0 12.3 (64.8) 18.1 12.7 (70.4) 16.9 9.2 (54.1)Maine 19.0 14.7 (77.3) 17.5 13.5 (77.0) 20.2 15.7 (77.5) 19.0 14.7 (77.7) — — —Maryland 19.2 14.4 (75.1) 17.8 13.3 (75.0) 20.4 15.3 (75.2) 19.3 14.8 (76.7) 18.2 12.5 (68.7)Massachusetts 19.7 15.0 (76.1) 18.2 13.8 (76.0) 20.9 15.9 (76.2) 19.6 15.1 (77.4) 21.1 12.8 (60.7)Michigan 18.8 13.9 (73.6) 17.4 12.8 (73.7) 20.0 14.7 (73.6) 18.9 14.3 (75.3) 17.6 10.6 (60.0)Minnesota 20.1 15.6 (77.5) 18.6 14.3 (76.7) 21.4 16.7 (78.2) 20.2 15.6 (77.4) 20.2 11.5 (56.9)Mississippi 17.5 10.8 (61.5) 15.8 10.1 (63.9) 19.0 11.4 (59.9) 17.9 11.8 (66.0) 16.6 8.2 (49.2)Missouri 18.5 13.0 (70.2) 17.1 11.7 (68.8) 19.6 14.0 (71.1) 18.5 13.2 (71.3) 17.4 10.0 (57.3)Montana 19.2 14.6 (75.9) 18.1 13.4 (74.1) 20.2 15.6 (77.2) 19.3 14.7 (76.4) — — —Nebraska 19.3 14.5 (75.3) 17.9 13.1 (73.1) 20.4 15.7 (76.7) 19.3 14.7 (75.9) 17.3 9.1 (52.4)Nevada 18.7 13.7 (73.2) 17.4 12.8 (73.3) 19.9 14.5 (73.1) 18.4 13.6 (74.2) 18.8 14.0 (74.5)New Hampshire 19.4 15.1 (77.8) 18.0 14.0 (77.5) 20.6 16.0 (77.9) 19.3 15.1 (77.9) — — —New Jersey 19.6 14.0 (71.2) 18.1 12.9 (71.4) 20.8 14.8 (70.9) 19.6 14.4 (73.5) 18.5 10.8 (58.6)New Mexico 19.6 13.9 (71.0) 18.4 13.1 (71.2) 20.8 14.7 (70.8) 19.6 14.3 (72.8) 19.8 15.1 (76.5)New York 20.0 14.5 (72.5) 18.5 13.6 (73.5) 21.2 15.3 (71.9) 19.8 14.8 (75.0) 20.6 12.2 (59.0)North Carolina 18.6 12.7 (68.3) 17.1 11.7 (68.5) 19.8 13.5 (68.1) 18.8 13.3 (70.6) 17.6 10.1 (57.2)North Dakota 19.9 14.6 (73.5) 18.1 12.9 (71.6) 21.5 16.0 (74.6) 20.0 14.8 (74.0) — — —Ohio 18.5 13.2 (71.4) 17.0 12.2 (71.5) 19.6 14.0 (71.4) 18.5 13.4 (72.5) 17.4 9.7 (55.6)Oklahoma 17.7 12.0 (67.6) 16.4 10.8 (66.0) 18.8 12.9 (68.7) 17.8 12.3 (69.2) 16.7 9.9 (59.3)Oregon 19.3 15.0 (77.9) 18.0 13.9 (77.3) 20.4 16.0 (78.3) 19.3 15.0 (78.1) 18.9 12.4 (65.6)Pennsylvania 18.9 13.9 (73.6) 17.4 12.8 (73.8) 20.2 14.8 (73.5) 19.0 14.1 (74.4) 17.6 11.5 (65.2)Rhode Island 19.4 14.5 (74.7) 17.8 13.1 (73.7) 20.7 15.6 (75.3) 19.4 14.6 (75.2) 21.9 14.6 (66.5)South Carolina 18.5 12.9 (69.7) 16.9 12.0 (70.6) 19.7 13.6 (69.0) 18.8 13.7 (73.2) 17.2 9.8 (57.0)South Dakota 19.8 15.0 (75.6) 18.0 13.3 (74.0) 21.3 16.4 (76.7) 20.0 15.2 (76.0) — — —Tennessee 18.0 11.9 (66.2) 16.5 11.2 (68.0) 19.2 12.5 (65.1) 18.1 12.0 (66.5) 16.6 10.3 (62.3)Texas 18.9 12.9 (68.4) 17.5 12.2 (69.8) 20.0 13.4 (67.3) 18.9 13.6 (72.1) 17.2 10.6 (61.9)Utah 19.8 15.0 (75.7) 18.9 14.3 (75.7) 20.7 15.7 (75.9) 19.8 15.0 (76.0) — — —Vermont 19.4 15.2 (78.2) 18.0 13.9 (77.4) 20.6 16.2 (78.8) 19.4 15.2 (78.5) — — —Virginia 18.9 14.2 (74.9) 17.5 13.3 (76.2) 20.1 14.9 (74.0) 19.1 14.4 (75.7) 17.5 11.7 (66.9)Washington 19.4 15.1 (77.6) 18.1 14.0 (77.3) 20.5 16.0 (77.9) 19.3 15.1 (78.2) 18.7 11.0 (58.9)West Virginia 17.5 11.0 (63.0) 16.2 10.3 (64.1) 18.6 11.6 (62.3) 17.5 11.0 (63.1) 16.8 10.0 (59.8)Wisconsin 19.5 14.9 (76.4) 18.0 13.4 (74.7) 20.8 16.1 (77.6) 19.6 15.0 (76.7) 17.6 12.2 (69.5)Wyoming 19.0 14.4 (75.8) 17.9 13.7 (76.3) 20.1 15.2 (75.5) 19.1 14.5 (76.2) — — —
State average** 19.1 13.9 (72.7) 17.7 12.9 (72.7) 20.3 14.8 (72.7) 19.2 14.3 (74.5) 18.1 11.1 (61.0)
Sources: CDC, National Vital Statistics System, Behavioral Risk Factor Survey System, and the U.S. Census Bureau. * Calculated from LE and HLE with multiple decimal places. † All pairwise comparisons for HLE between males and females were significantly different in all states, at p<0.05 based on two-tailed z-statistics. § In all states for which there were sufficient data, all differences between HLE for blacks and whites were significantly different at p<0.05 based on two-tailed
z-statistics, except for Nevada, New Mexico, Rhode Island, and West Virginia. ¶ States with <700 deaths in a subpopulation during 2007–2009. ** Average across state estimates.
Morbidity and Mortality Weekly Report
MMWR / July 19, 2013 / Vol. 62 / No. 28 565
implications of the prevailing age-specific death and illness rates. HLE is a relatively simple measure that can be readily used by public health officials, health-care providers, and policy makers to understand the health status of a population. The results presented in this study can be used as a baseline for states to monitor the HLE of persons aged 65 years as they age, identify health disparities among subpopulations, and target resources to improve population health.
* Data for 11 states were not reported because the total number of deaths from 2007 to 2009 for the black population in those states was <700: Alaska, Hawaii, Idaho, Maine, Montana, New Hampshire, North Dakota, South Dakota, Utah, Vermont, and Wyoming.
FIGURE 2. State-specific healthy life expectancy in years at age 65 years, by race — United States, 2007–2009*
DCDC
Whites Blacks
≥15.014.3–14.913.1–14.2≤13.0Insu�cient data
≥15.014.3–14.913.1–14.2≤13.0
What is already known on this topic?
Healthy life expectancy (HLE) is a population health measure that combines age-specific mortality with morbidity or health status to estimate expected years of life in good health for persons at a given age. HLE reflects both quality and quantity of life and might be useful in describing and monitoring the health status of a population. Although national HLE estimates for the U.S. population have been reported previously, limited data have been available on estimates at the state level and by demographic characteristics.
What is added by this report?
In this report, differences in HLE were reported at the state level for adults aged 65 years based on self-reported health in the 2007–2009 Behavioral Risk Factor Surveillance System survey, National Vital Statistics Systems mortality data, and correspond-ing U.S. Census population estimates. The HLE estimates identify disparities in health status by sex, race, and state. Overall, at age 65 years, females had a greater HLE than males and whites had a greater HLE than blacks in all states with sufficient data and the District of Columbia, except in Nevada and New Mexico.
What are the implications for public health practice?
HLE is a relatively simple measure that can be readily used by public health officials, health-care providers, and policy makers to monitor trends in the health of populations and identify health inequalities. The results presented in this study can be used as a baseline for states to monitor changes in the HLE of persons aged 65 years as they age and to identify health disparities among subpopulations by state.
FIGURE 3. State-specific healthy life expectancy in years at age 65 years —United States, 2007–2009
≥15.014.3–14.913.1–14.2≤13.0
DC
Morbidity and Mortality Weekly Report
566 MMWR / July 19, 2013 / Vol. 62 / No. 28
Acknowledgments
Sukhjeet Ahuja, MD, National Association for Public Health Statistics and Information Systems. Stephanie Zaza, MD, Rachel B. Kaufmann, PhD, Carl Kinkade, MCRP, Eric Knudsen, Jose Aponte, Epidemiology and Analysis Program Office; Brenda Le, MSPH, National Center for Environmental Health; Robert N. Anderson, PhD, Joyce A. Arbertha, National Center for Health Statistics; Sigrid A. Economou, Public Health Surveillance and Informatics Program Office, CDC.
References 1 Masseria C, Allin S, Sorenson C, Papanicolas I, Mossialos E. What are
the methodological issues related to measuring health and drawing comparison across countries? Brussels, Belgium: European Commission; 2007. Available at http://ec.europa.eu/social/BlobServlet?docId=3951&langId=en.
2. Bol K. Living longer? Living better? Estimates of life expectancy and healthy life expectancy in Colorado. Denver, CO: Colorado Department of Public Health Environment; 2012. http://www.chd.dphe.state.co.us/resources/briefs/lifeexpectancy.pdf.
3. CDC. Behavioral Risk Factor Surveillance System annual survey data. Atlanta, GA: US Department of Health and Human Services, CDC; 2012. Available at http://www.cdc.gov/brfss/annual_data/annual_data.htm.
4. Sirken MG. Comparison of two methods of constructing abridged life tables by reference to a “standard” table. Vital Health Stat 1966;2(4).
5. Wei R, Anderson RN, Curtin LR. U.S. decennial life tables for 1999–2001: state life tables. Natl Vital Stat Rep 2012;60(9).
6. Washington State Department of Health. Self-reported health status. In: Health of Washington State. Olympia, WA: Washington State Department of Health; 2012. Available at http://www.doh.wa.gov/portals/1/documents/5500/ghs-srhs2012.pdf.
7. Jamoom EW, Horner-Johnson W, Suzuki R, Andresen EM, Campbell VA; RRTC Expert Panel on Health Status Measurement. Age at disability onset and self-reported health status. BMC Public Health 2008;8:1–7.
8. Idler EL. Self-assessed health and mortality: a review of the studies. In: Maes S, Leventhal S, Johnston M, eds. International review of health psychology. New York, NY: John Wiley & Sons Ltd; 1992:33–54.
Morbidity and Mortality Weekly Report
MMWR / July 19, 2013 / Vol. 62 / No. 28 567
During October 2010–February 2011, an outbreak of 91 Salmonella Enteritidis (SE) infections in Alberta, Canada, was investigated by a local public health department (Alberta Health Services, Calgary Zone). Index cases initially were linked through a common history of consumption of food purchased from mobile food-vending vehicles (lunch trucks) operating at worksites in Alberta. Further investigation impli-cated one catering company that supplied items for the lunch trucks and other vendors. In 85 cases, patients reported con-sumption of food prepared by the catering company in the 7 days before illness. Six patients were employees of the catering company, and two food samples collected from the catering company were positive for SE. Foods likely were contaminated directly or indirectly through the use of illegally sourced, SE-contaminated eggs at the implicated catering facility and by catering employees who were infected with SE. Public health interventions put into place to control the outbreak included screening employees for Salmonella, excluding those infected from food-handling duties, and training employees in safe food-handling procedures. No further outbreak cases were identified after full implementation of the interventions. This investigation highlights the potential for lunch trucks to be a source of foodborne illness and the need for robust regulatory compliance monitoring of lunch trucks and their food suppliers.
Epidemiologic InvestigationThe case definition for this outbreak was a laboratory culture-
confirmed SE infection identified in Alberta during October 2010–February 2011 that was epidemiologically linked to the implicated catering firm. The 91 outbreak cases were in customers of lunch trucks (78), gas stations (three), or vend-ing machines (two) that received product from the implicated caterer. Six were employees of the implicated caterer, and two were lunch truck drivers. Patients resided in Calgary (86), metro Edmonton, (three), and southern Alberta (two); all resided in different households. Lunch truck customer cases were among employees of several different workplaces. Median age at onset of symptoms was 32 years, with a range of 19 to 68 years; 76% of cases were among males. Reported signs and symptoms included diarrhea (96%), abdominal cramps (85%), fever (52%), bloody diarrhea (33%), and vomiting (25%); two patients, both employees of the implicated cater-ing company, were reportedly asymptomatic and detected by screening. Six patients (7%) were hospitalized. Illness onset
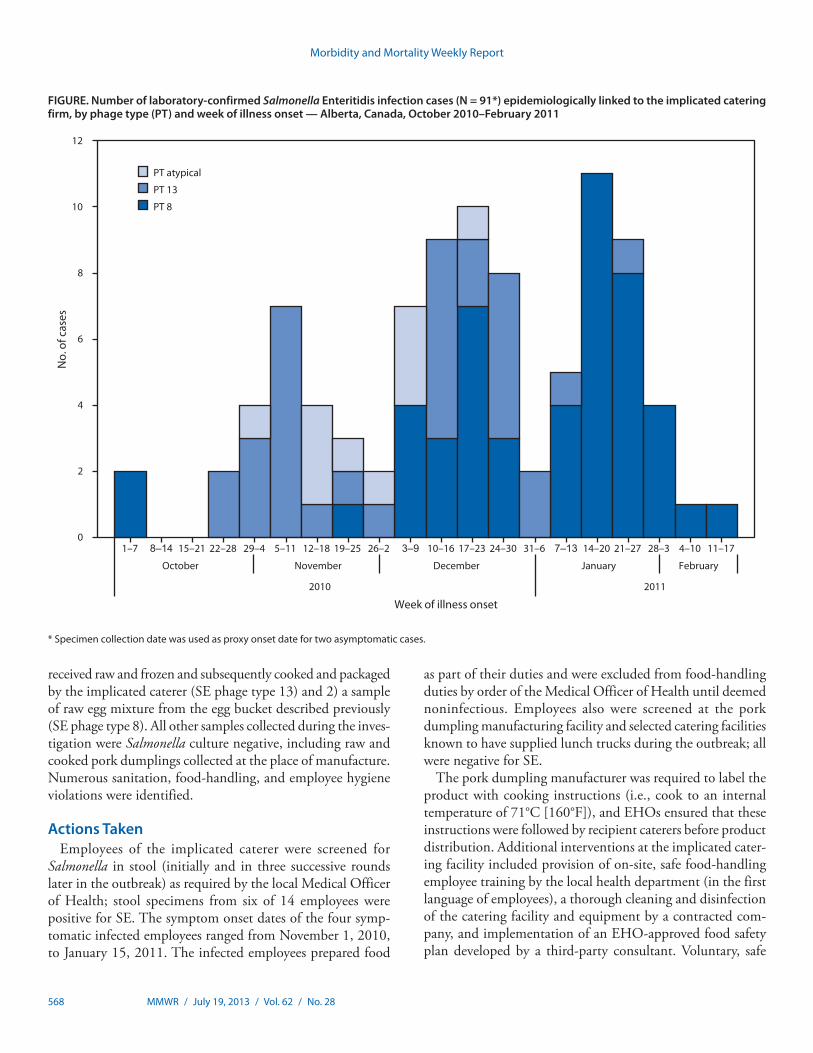
dates ranged from October 1, 2010, to February 14, 2011 (Figure). Human SE outbreak isolates were phage type 8 (49 [54%]), 13 (32 [35%]), or atypical (10 [11%]). Of the 1,311 human SE isolates reported in Alberta during 2006–2010, the proportion that were phage type 8, 13, and atypical was 30%, 11%, and 3%, respectively (Alberta Health Services, unpublished data, 2011).
Most lunch truck customer patients (57%) could not recall the specific vehicle from which they purchased food, result-ing in positive identification of only 14 lunch trucks. Patient food histories included more than 40 different lunch truck food items; those most frequently reported were breakfast egg sandwiches (38%) and pork dumplings (24%). Patients often reported consuming multiple meals from lunch trucks during the incubation period.
Environmental InvestigationLocal public health department environmental health offi-
cers (EHOs) located 54 lunch trucks in operation for targeted inspections. All food received by trucks was prepackaged; perishable food was refrigerated and/or reheated in the vehicle. Several violations were observed, including selling foods from unlicensed food facilities and inadequate reheating of previ-ously cooked food.
Seven Calgary-based caterers were identified as lunch truck suppliers; all had been routinely inspected by the public health department. Eggs at several catering facilities were found to be from unapproved sources and were ungraded, cracked, visibly dirty, and/or improperly packaged, resulting in a parallel inves-tigation of the egg suppliers. Ongoing traceback of food items consumed by persons infected in the outbreak implicated one caterer as the source of illnesses. A bucket used for mixing pooled eggs by the implicated caterer during preparation of breakfast sandwiches had not been cleaned for several weeks and was stored in a cooler between uses. Pork dumplings sold by lunch trucks were produced by a Calgary-based manufacturer, and approximately 1,000 were distributed uncooked and frozen to several caterers each day. Caterers cooked, packaged, and refrig-erated the dumplings before distribution to lunch trucks. Eggs were reportedly not an ingredient of the dumplings. The pork dumpling cooking procedure used by the implicated caterer was deemed adequate by EHOs.
A total of 32 food samples were collected from lunch truck suppliers. Two food samples collected at the implicated cater-ing facility were culture positive for SE: 1) pork dumplings
Salmonella Enteritidis Infections Associated with Foods Purchased from Mobile Lunch Trucks — Alberta, Canada, October 2010–February 2011
Morbidity and Mortality Weekly Report
568 MMWR / July 19, 2013 / Vol. 62 / No. 28
received raw and frozen and subsequently cooked and packaged by the implicated caterer (SE phage type 13) and 2) a sample of raw egg mixture from the egg bucket described previously (SE phage type 8). All other samples collected during the inves-tigation were Salmonella culture negative, including raw and cooked pork dumplings collected at the place of manufacture. Numerous sanitation, food-handling, and employee hygiene violations were identified.
Actions TakenEmployees of the implicated caterer were screened for
Salmonella in stool (initially and in three successive rounds later in the outbreak) as required by the local Medical Officer of Health; stool specimens from six of 14 employees were positive for SE. The symptom onset dates of the four symp-tomatic infected employees ranged from November 1, 2010, to January 15, 2011. The infected employees prepared food
as part of their duties and were excluded from food-handling duties by order of the Medical Officer of Health until deemed noninfectious. Employees also were screened at the pork dumpling manufacturing facility and selected catering facilities known to have supplied lunch trucks during the outbreak; all were negative for SE.
The pork dumpling manufacturer was required to label the product with cooking instructions (i.e., cook to an internal temperature of 71°C [160°F]), and EHOs ensured that these instructions were followed by recipient caterers before product distribution. Additional interventions at the implicated cater-ing facility included provision of on-site, safe food-handling employee training by the local health department (in the first language of employees), a thorough cleaning and disinfection of the catering facility and equipment by a contracted com-pany, and implementation of an EHO-approved food safety plan developed by a third-party consultant. Voluntary, safe
FIGURE. Number of laboratory-confirmed Salmonella Enteritidis infection cases (N = 91*) epidemiologically linked to the implicated catering firm, by phage type (PT) and week of illness onset — Alberta, Canada, October 2010–February 2011
0
2
4
6
8
10
12
1–7 8–14 15–21 22–28 29–4 5–11 12–18 19–25 26–2 3–9 10–16 17–23 24–30 31–6 7–13 14–20 21–27 28–3 4–10 11–17
October November December January February
2010 2011
No.
of c
ases
Week of illness onset
PT atypical
PT 13
PT 8
* Specimen collection date was used as proxy onset date for two asymptomatic cases.
Morbidity and Mortality Weekly Report
MMWR / July 19, 2013 / Vol. 62 / No. 28 569
food-handling training courses were provided to lunch truck operators by EHOs. No further outbreak cases were identified after full implementation of the interventions.
Despite intensive monitoring of the implicated caterer and apparent confirmation that all eggs used were from legal sources, illegally sourced eggs were discovered at the facility after the outbreak, resulting in prosecution of the caterer for breaching Alberta public health legislation. An illegal egg sup-plier identified through this investigation also was charged. Several thousand eggs were seized from the supplier, and subsequent enforcement actions resulted in seizure of an egg delivery vehicle, issuance of a $2,500 fine, and incarceration of the supplier for 14 days.
Reported by
Lance Honish, MSc, Dawn Greenwald, Kristin McIntyre, Wendy Lau, Sarah Nunn, Dale Nelson, Judy MacDonald, MD, Alberta Health Services. Victoria Keegan, MSc, Krista Wilkinson, MSc, Canadian Field Epidemiology Program, Public Health Agency of Canada. Corresponding contributor: Lance Honish, [email protected].
Editorial Note
In Canada, approximately 6,000 laboratory-confirmed cases of Salmonella are reported annually, with Enteritidis the most frequently reported serotype (32.1% of isolates in 2009) (1). Incidence rates in the Calgary area typically are comparable to those observed nationally (Alberta Health Services, unpublished data, 2011). The source of this outbreak likely was a catering firm that supplied items for lunch trucks throughout Calgary. Foods likely were contaminated through the use of SE-contaminated eggs obtained from unapproved sources,
subsequent cross-contamination through improper food-handling practices, and handling of food by SE-infected employees.
Eggs have been established as an important vehicle for human SE infections. The use of ungraded, illegally distributed eggs was a possible factor in a recent large SE cluster in British Columbia (2), and pooling of eggs and cross-contamination of food contact surfaces was a factor in other SE outbreaks (3). Consistent with other outbreaks associated with foodborne Salmonella (4), Salmonella probably entered the facility via contaminated eggs, with infected food handlers and environ-mental contamination resulting in transmission to customers. Outbreak SE isolate phage typing data provided an epide-miologic link between food contaminated by the implicated caterer and outbreak cases but do not help to confirm patterns of contamination and transmission. The implicated catering facility was routinely inspected before the outbreak, but new cases ceased only after more intensive review and improvement of food handling practices at the facility, as well as screening of facility employees and exclusion of SE-infected workers.
Prolonged shedding of SE by symptomatic and asymptom-atic food workers might have contributed to the duration of the outbreak; median duration of shedding in excess of 30 days has been observed previously in SE-infected food work-ers (5). The probable ongoing use of illegally sourced eggs and improper handling of eggs by the implicated caterer also might have been a factor in outbreak duration. Proper reheat-ing of pork dumplings by lunch truck operators likely would have prevented some of the outbreak cases. This investigation highlights the need for robust health department inspections of these food facilities and their suppliers.
Acknowledgments
Population and Public Health, Alberta Health Services; ProvLab Alberta; Alberta Agriculture and Rural Development; Alberta Health; Canadian Food Inspection Agency; Public Health Agency of Canada.
References1. National Microbiology Laboratory and Centre for Food-borne
Environmental and Zoonotic Infectious Diseases, Public Health Agency of Canada. 2009 annual summary of laboratory surveillance data. Ottawa, Ontario: Public Health Agency of Canada; 2011. Available at http://www.nml-lnm.gc.ca/nesp-pnsme/surveillance-2009-eng.html#topten.
2. Taylor M, Leslie M, Ritson M, et al. Investigation of the concurrent emergence of Salmonella Enteritidis in humans and poultry in British Columbia, Canada, 2008–2010. Zoonoses Public Health 2012; 59:584–92.
3. Braden CR. Salmonella enterica serotype Enteritidis and eggs: a national epidemic in the United States. Clin Infect Dis 2006;43:512–7.
4. Medus C, Smith KE, Bender JB, Besser JM, Hedberg CW. Salmonella outbreaks in restaurants in Minnesota, 1995 through 2003: evaluation of the role of infected foodworkers. J Food Prot 2006;69:1870–8.
5. Medus C, Smith KE, Bender JB, Leano F, Hedberg CW. Salmonella infections in food workers identified through routine public health surveillance in Minnesota: impact on outbreak recognition. J Food Prot 2010;73:2053–8.
What is already known on this topic?
Eggs are an important vehicle for the transmission of Salmonella Enteritidis to humans.
What is added by this report?
An outbreak of 91 Salmonella Enteritidis infections was linked to a catering company that supplied food items for lunch trucks and other vendors. Foods likely were contaminated directly or indirectly through the use of illegally sourced eggs or by infected catering employees. No further outbreak cases were identified after full implementation of public health interven-tions, which included training in and enforcement of approved food-handling procedures.
What are the implications for public health practice?
This investigation highlights the potential for lunch trucks to be a source of foodborne illness and the need for robust health department inspections of lunch trucks and their suppliers.
Morbidity and Mortality Weekly Report
570 MMWR / July 19, 2013 / Vol. 62 / No. 28
On September 26, 2012, a woman aged 35 years from Kosrae in the Federated States of Micronesia (FSM) was hospitalized with fever, headache, muscle pain, vomiting, leukopenia, and thrombocytopenia. A rapid diagnostic test (RDT) (Dengue Duo, Standard Diagnostics Inc.) was positive for dengue virus (DENV) nonstructural protein-1 (NS1). During the next week, seven more persons with suspected dengue were tested with the RDT, of whom three were RDT-positive for NS1 or anti-DENV immunoglobulin M (IgM). During October, the Kosrae State Department of Health Services, with sup-port from the FSM Department of Health and Social Affairs and the World Health Organization (WHO), responded to the outbreak with enhanced surveillance, training in clini-cal management, analysis of hospital surge capacity, a rapid mosquito survey to identify species and distributions, and control measures. By March 14, 2013, approximately 3.7% of Kosrae State residents had been hospitalized with suspected dengue. The outbreak consumed scarce medical and public health services, including outpatient, inpatient, and labora-tory services, resulting in redirection of human and material resources from other important medical and public health activities. Because the health consequences of dengue can be substantial in resource-limited settings, Pacific Island nations might wish to consider preparedness measures for dengue out-breaks such as developing and testing outbreak response plans and ensuring adequate capacity for epidemiologic surveillance and laboratory testing.
Investigation and ResultsKosrae, with a population of 6,600, is a small (42 square
miles [109 square kilometers]) volcanic island that forms most of the land mass of Kosrae State, one of the four states of FSM. Kosrae has four municipalities, of which Lelu is the administrative center and home of 33% of the state’s residents and the 40-bed Kosrae State Hospital. The only previously documented DENV transmission on Kosrae was an outbreak of dengue virus serotype 2 (DENV-2) in 1998 (1).
During October 2012, the number of dengue cases contin-ued to increase, and in late October an epidemiologist from WHO was deployed to provide technical assistance to the Kosrae State Department of Health Services outbreak response team. Six serum specimens were submitted for reference labora-tory testing by reverse transcription–polymerase chain reaction (RT-PCR) and anti-DENV IgM enzyme-linked immunosor-bent assay (ELISA) to the Queensland Health Forensic and Scientific Services, Australia. Five of the six specimens were tested with RT-PCR using a novel dried-sera-on-filter-paper
surveillance technique at the Institut Louis Malardé, French Polynesia (2). DENV-4 was detected by RT-PCR in one speci-men at both laboratories, and four specimens had detectable anti-DENV IgM antibody, of which two were specific for DENV-4 (3). Thus, DENV infection was confirmed in five (83%) of six suspected dengue cases.
A modified WHO 2009 dengue case definition (4) was used to identify suspected dengue cases with fever plus at least two of the following: anorexia and nausea, rash, aches and pains (headache, eye pain, muscle pain, or joint pain), leukopenia (white blood cells <4,000/mL), or a warning sign (abdominal pain or tenderness, persistent vomiting, mucosal bleed or wide-spread petechiae, lethargy, restlessness, clinical fluid accumula-tion, or liver enlargement >2 cm). The case definition for an RDT-positive case was any suspected dengue case that tested NS1-positive or IgM-positive by RDT.
From September 26, 2012, to March 14, 2013, a total of 729 suspected dengue cases were identified at Kosrae State Hospital, with 242 (33.2%) patients admitted. One or more dengue warning signs were reported for 159 (21.8%) patients. Although detailed data on severe dengue cases are not avail-able, poor peripheral perfusion or hemodynamic instability, as defined by the treating physician, was reported for 25 (3.4%) patients. No deaths were reported.
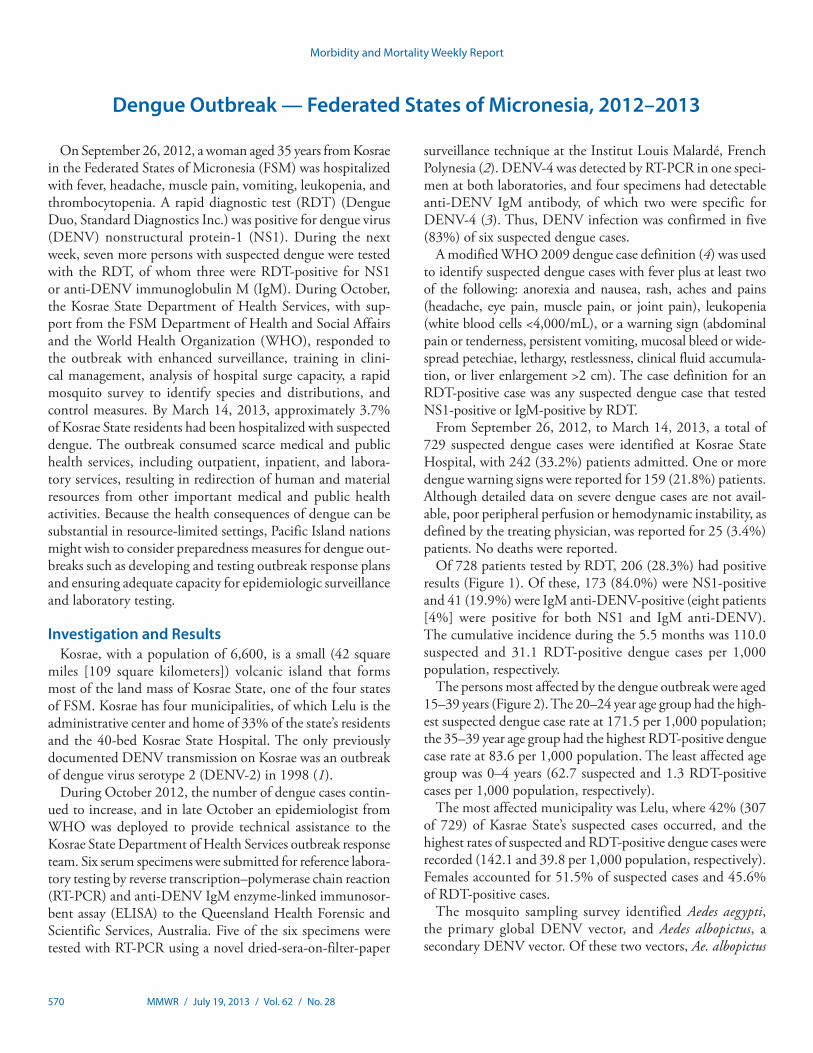
Of 728 patients tested by RDT, 206 (28.3%) had positive results (Figure 1). Of these, 173 (84.0%) were NS1-positive and 41 (19.9%) were IgM anti-DENV-positive (eight patients [4%] were positive for both NS1 and IgM anti-DENV). The cumulative incidence during the 5.5 months was 110.0 suspected and 31.1 RDT-positive dengue cases per 1,000 population, respectively.
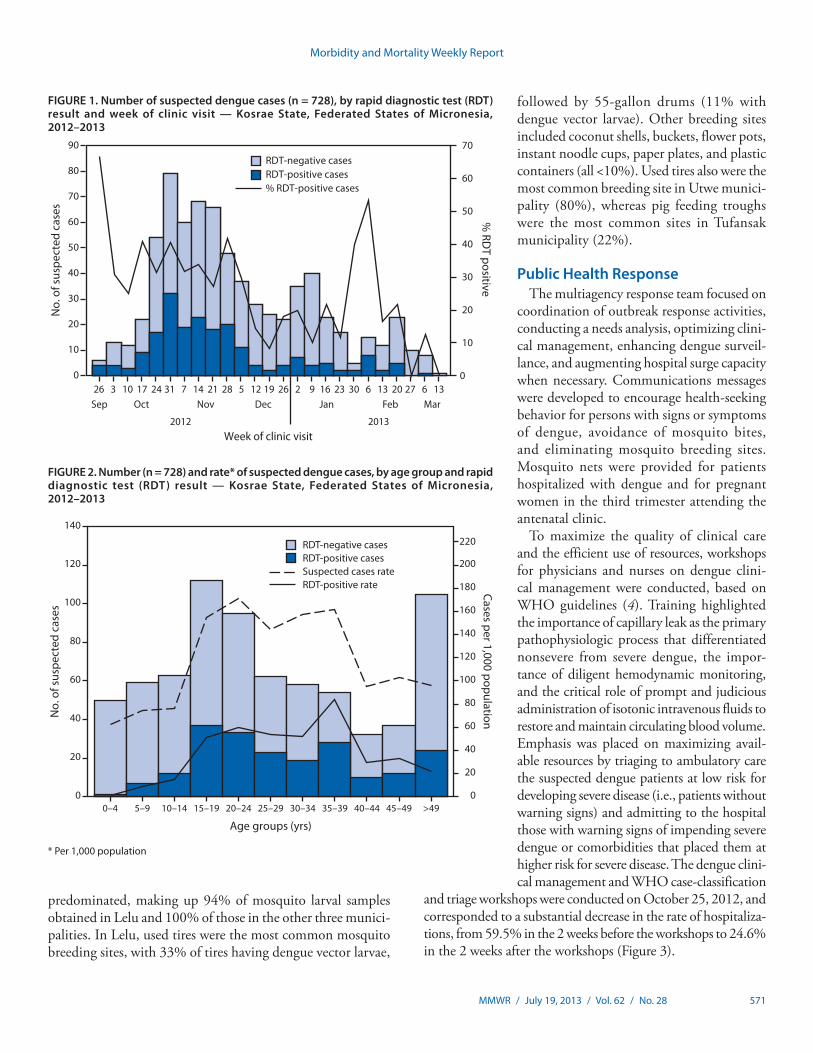
The persons most affected by the dengue outbreak were aged 15–39 years (Figure 2). The 20–24 year age group had the high-est suspected dengue case rate at 171.5 per 1,000 population; the 35–39 year age group had the highest RDT-positive dengue case rate at 83.6 per 1,000 population. The least affected age group was 0–4 years (62.7 suspected and 1.3 RDT-positive cases per 1,000 population, respectively).
The most affected municipality was Lelu, where 42% (307 of 729) of Kasrae State’s suspected cases occurred, and the highest rates of suspected and RDT-positive dengue cases were recorded (142.1 and 39.8 per 1,000 population, respectively). Females accounted for 51.5% of suspected cases and 45.6% of RDT-positive cases.
The mosquito sampling survey identified Aedes aegypti, the primary global DENV vector, and Aedes albopictus, a secondary DENV vector. Of these two vectors, Ae. albopictus
Dengue Outbreak — Federated States of Micronesia, 2012–2013
Morbidity and Mortality Weekly Report
MMWR / July 19, 2013 / Vol. 62 / No. 28 571
predominated, making up 94% of mosquito larval samples obtained in Lelu and 100% of those in the other three munici-palities. In Lelu, used tires were the most common mosquito breeding sites, with 33% of tires having dengue vector larvae,
followed by 55-gallon drums (11% with dengue vector larvae). Other breeding sites included coconut shells, buckets, flower pots, instant noodle cups, paper plates, and plastic containers (all <10%). Used tires also were the most common breeding site in Utwe munici-pality (80%), whereas pig feeding troughs were the most common sites in Tufansak municipality (22%).
Public Health ResponseThe multiagency response team focused on
coordination of outbreak response activities, conducting a needs analysis, optimizing clini-cal management, enhancing dengue surveil-lance, and augmenting hospital surge capacity when necessary. Communications messages were developed to encourage health-seeking behavior for persons with signs or symptoms of dengue, avoidance of mosquito bites, and eliminating mosquito breeding sites. Mosquito nets were provided for patients hospitalized with dengue and for pregnant women in the third trimester attending the antenatal clinic.
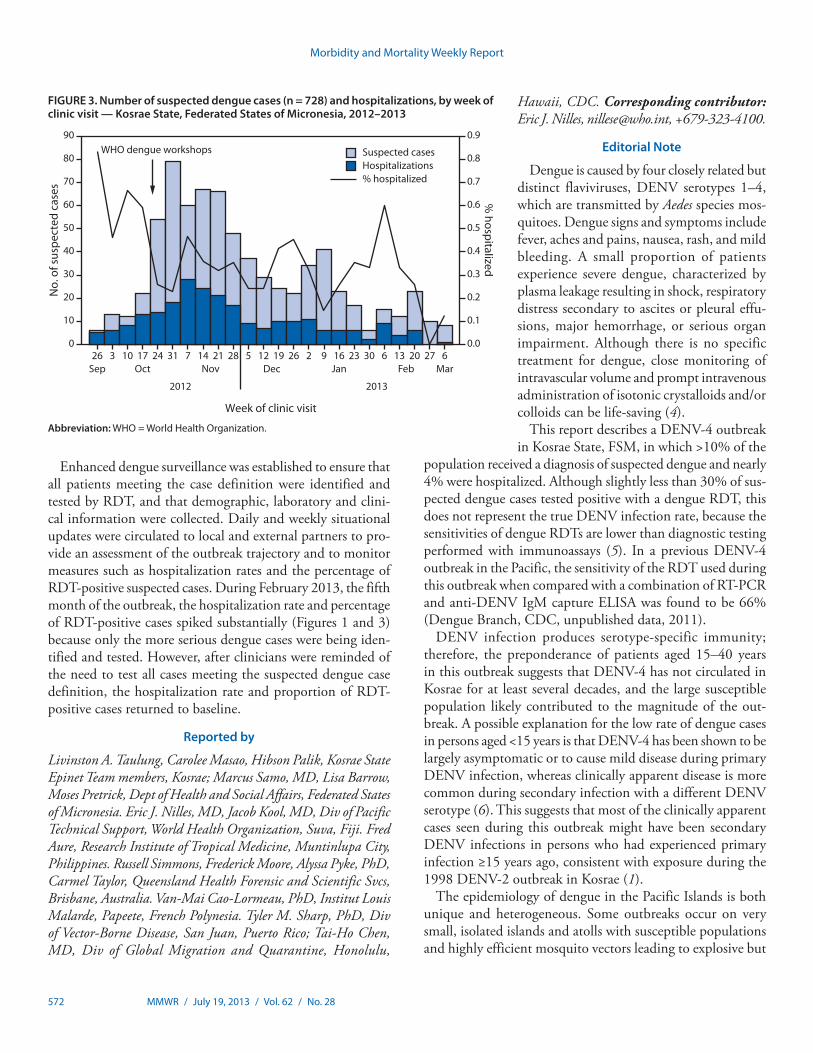
To maximize the quality of clinical care and the efficient use of resources, workshops for physicians and nurses on dengue clini-cal management were conducted, based on WHO guidelines (4). Training highlighted the importance of capillary leak as the primary pathophysiologic process that differentiated nonsevere from severe dengue, the impor-tance of diligent hemodynamic monitoring, and the critical role of prompt and judicious administration of isotonic intravenous fluids to restore and maintain circulating blood volume. Emphasis was placed on maximizing avail-able resources by triaging to ambulatory care the suspected dengue patients at low risk for developing severe disease (i.e., patients without warning signs) and admitting to the hospital those with warning signs of impending severe dengue or comorbidities that placed them at higher risk for severe disease. The dengue clini-cal management and WHO case-classification
and triage workshops were conducted on October 25, 2012, and corresponded to a substantial decrease in the rate of hospitaliza-tions, from 59.5% in the 2 weeks before the workshops to 24.6% in the 2 weeks after the workshops (Figure 3).
FIGURE 1. Number of suspected dengue cases (n = 728), by rapid diagnostic test (RDT) result and week of clinic visit — Kosrae State, Federated States of Micronesia, 2012–2013
0
10
20
30
40
50
60
70
0
10
20
30
40
50
60
70
80
90
% RD
T positive
No.
of s
uspe
cted
cas
es
Week of clinic visit
26 10 243 17 31 7 14 28 1221 5 19 26 2 16 309 23 6 13 2720 6 13Sep Oct Nov Dec Jan Feb Mar
2012 2013
RDT-negative casesRDT-positive cases% RDT-positive cases
FIGURE 2. Number (n = 728) and rate* of suspected dengue cases, by age group and rapid diagnostic test (RDT) result — Kosrae State, Federated States of Micronesia, 2012–2013
0
20
40
60
80
100
120
140
160
180
200
220
0
20
40
60
80
100
120
140
0–4 5–9 10–14 15–19 20–24 25–29 30–34 35–39 40–44 45–49 >49
Cases per 1,000 populationNo.
of s
uspe
cted
cas
es
Age groups (yrs)
RDT-negative casesRDT-positive casesSuspected cases rateRDT-positive rate
* Per 1,000 population
Morbidity and Mortality Weekly Report
572 MMWR / July 19, 2013 / Vol. 62 / No. 28
Enhanced dengue surveillance was established to ensure that all patients meeting the case definition were identified and tested by RDT, and that demographic, laboratory and clini-cal information were collected. Daily and weekly situational updates were circulated to local and external partners to pro-vide an assessment of the outbreak trajectory and to monitor measures such as hospitalization rates and the percentage of RDT-positive suspected cases. During February 2013, the fifth month of the outbreak, the hospitalization rate and percentage of RDT-positive cases spiked substantially (Figures 1 and 3) because only the more serious dengue cases were being iden-tified and tested. However, after clinicians were reminded of the need to test all cases meeting the suspected dengue case definition, the hospitalization rate and proportion of RDT-positive cases returned to baseline.
Reported by
Livinston A. Taulung, Carolee Masao, Hibson Palik, Kosrae State Epinet Team members, Kosrae; Marcus Samo, MD, Lisa Barrow, Moses Pretrick, Dept of Health and Social Affairs, Federated States of Micronesia. Eric J. Nilles, MD, Jacob Kool, MD, Div of Pacific Technical Support, World Health Organization, Suva, Fiji. Fred Aure, Research Institute of Tropical Medicine, Muntinlupa City, Philippines. Russell Simmons, Frederick Moore, Alyssa Pyke, PhD, Carmel Taylor, Queensland Health Forensic and Scientific Svcs, Brisbane, Australia. Van-Mai Cao-Lormeau, PhD, Institut Louis Malarde, Papeete, French Polynesia. Tyler M. Sharp, PhD, Div of Vector-Borne Disease, San Juan, Puerto Rico; Tai-Ho Chen, MD, Div of Global Migration and Quarantine, Honolulu,
Hawaii, CDC. Corresponding contributor: Eric J. Nilles, [email protected], +679-323-4100.
Editorial Note
Dengue is caused by four closely related but distinct flaviviruses, DENV serotypes 1–4, which are transmitted by Aedes species mos-quitoes. Dengue signs and symptoms include fever, aches and pains, nausea, rash, and mild bleeding. A small proportion of patients experience severe dengue, characterized by plasma leakage resulting in shock, respiratory distress secondary to ascites or pleural effu-sions, major hemorrhage, or serious organ impairment. Although there is no specific treatment for dengue, close monitoring of intravascular volume and prompt intravenous administration of isotonic crystalloids and/or colloids can be life-saving (4).
This report describes a DENV-4 outbreak in Kosrae State, FSM, in which >10% of the
population received a diagnosis of suspected dengue and nearly 4% were hospitalized. Although slightly less than 30% of sus-pected dengue cases tested positive with a dengue RDT, this does not represent the true DENV infection rate, because the sensitivities of dengue RDTs are lower than diagnostic testing performed with immunoassays (5). In a previous DENV-4 outbreak in the Pacific, the sensitivity of the RDT used during this outbreak when compared with a combination of RT-PCR and anti-DENV IgM capture ELISA was found to be 66% (Dengue Branch, CDC, unpublished data, 2011).
DENV infection produces serotype-specific immunity; therefore, the preponderance of patients aged 15–40 years in this outbreak suggests that DENV-4 has not circulated in Kosrae for at least several decades, and the large susceptible population likely contributed to the magnitude of the out-break. A possible explanation for the low rate of dengue cases in persons aged <15 years is that DENV-4 has been shown to be largely asymptomatic or to cause mild disease during primary DENV infection, whereas clinically apparent disease is more common during secondary infection with a different DENV serotype (6). This suggests that most of the clinically apparent cases seen during this outbreak might have been secondary DENV infections in persons who had experienced primary infection ≥15 years ago, consistent with exposure during the 1998 DENV-2 outbreak in Kosrae (1).
The epidemiology of dengue in the Pacific Islands is both unique and heterogeneous. Some outbreaks occur on very small, isolated islands and atolls with susceptible populations and highly efficient mosquito vectors leading to explosive but
FIGURE 3. Number of suspected dengue cases (n = 728) and hospitalizations, by week of clinic visit — Kosrae State, Federated States of Micronesia, 2012–2013
0.0
0.1
0.2
0.3
0.4
0.5
0.6
0.7
0.8
0.9
0
10
20
30
40
50
60
70
80
90
% hospitalized
No.
of s
uspe
cted
cas
es
Week of clinic visit
2012 2013
WHO dengue workshops
Suspected casesHospitalizations% hospitalized
Sep26 3
Oct10 17 24 31 7
Nov14 21 28 5
Dec12 19 26 2
Jan9 16 23 30 6 13
Feb20 6
Mar27
Abbreviation: WHO = World Health Organization.
Morbidity and Mortality Weekly Report
MMWR / July 19, 2013 / Vol. 62 / No. 28 573
short-lived outbreaks, often burning out within weeks to several months. The outbreak in Kosrae is an example of this type of outbreak. Conversely, outbreaks on the geographically larger Pacific islands with larger and more widely distributed popula-tions often result in prolonged circulation of a single serotype, but rarely for more than 4–5 years (7). Unlike most dengue-endemic regions, cocirculation of multiple DENV serotypes is unusual in the small Pacific islands (8). The present dengue outbreak likely was caused by a single serotype, but because of the small number of serotype-specific laboratory-confirmed cases, this cannot be confirmed.
Multiple dengue outbreaks have occurred in the Pacific over the past decade, affecting nearly all countries and territories. Periodic dengue outbreaks are expected to continue to occur in the Pacific. Surveillance for acute febrile illnesses could be strengthened in areas at risk for dengue to promptly identify outbreaks. As demonstrated during this outbreak, the public health impact of dengue in these resource-limited settings can be substantial, both in terms of morbidity and redirect-ing human and material resources away from other health priorities. Public health preparedness planners might consider including dengue among their priority diseases to ensure adequate capacity and resources to recognize and respond to the disease. Hospitalization of stable patients at low risk for devel-oping severe dengue overloads inpatient services and expends valuable resources, but is common during outbreaks unless clinicians are trained in dengue case classification and manage-ment. As this outbreak demonstrated, timely and appropriate WHO dengue case classification and triage workshops can
What is already known on this topic?
Dengue outbreaks occur sporadically in many of the Pacific Island countries and territories. Over the past 4 decades, short-lived and often explosive dengue outbreaks have been reported. Dengue has not been reported in Kosrae State, Federated States of Micronesia, since 1998.
What is added by this report?
A dengue outbreak occurred in Kosrae State during September 2012–March 2013, in which 11% and 4% of the population met the case definition for suspected dengue and were hospitalized, respectively. Notable consequences of the outbreak included a substantial drain on a range of medical and public health services, including outpatient, inpatient and laboratory services, which resulted in redirection of limited human and material resources from other important medical and public health activities.
What are the implications for public health practice?
Because the health consequences can be substantial in these resource-limited settings, Pacific Island nations might consider planning for future dengue outbreaks by enhancing surveil-lance activities, ensuring laboratory testing capacity, and developing and testing outbreak response contingency plans.
substantially reduce unnecessary hospitalization rates, although ongoing attention to key metrics (e.g., hospitalization or percentage of RDT-positive cases) is important to monitor application of triage criteria and case-identification protocols.
This outbreak highlights the multidisciplinary nature of the public health response required to manage a dengue outbreak. One area of particular importance is assuring high quality clinical management. This is often overlooked, despite reliable evidence that proper management can substantially reduce mortality from severe dengue (9). Public health messages during a dengue outbreak should recommend that residents and visitors 1) seek care for dengue-like illness; 2) eliminate mosquito breeding sites by covering, emptying, or disposing of water containers (e.g., water cisterns, discarded tires and refuse, and flower pots); and 3) protect themselves from being bitten by the predominantly day-biting Aedes species mosquitoes by using insect repellent, wearing insecticide-impregnated cloth-ing, and assuring that intact mosquito screens are in place on doors and windows. Additional information on dengue is available from WHO at http://www.who.int/topics/dengue/en and from CDC at http://www.cdc.gov/dengue.
Acknowledgments
Clinical, laboratory, and administrative staff members at Kosrae State Hospital; Harold S. Margolis, MD, Div of Vector-Borne Disease, San Juan, Puerto Rico, CDC.
References1. Taulung L, Asher A. Dengue fever outbreak in Kosrae. InformAction
1998;2:16–8.2. Aubry M, Roche C, Dupont-Rouzeyrol M, et al. Use of serum and blood
samples on filter paper to improve the surveillance of dengue in Pacific Island countries. J Clin Virol 2012;55:23–9.
3. Taylor C, Simmons R, Smith I. Development of immunoglobulin M capture enzyme-linked immunosorbent assay to differentiate human flavivirus infections occurring in Australia. Clin Diagn Lab Immunol 2005;12:371–4.
4. World Health Organization. Dengue: guidelines for diagnosis, treatment, prevention and control. New edition. Geneva, Switzerland: World Health Organization; 2009. Available at http://whqlibdoc.who.int/publications/ 2009/9789241547871_eng.pdf.
5. Blacksell SD, Jarman RG, Bailey MS, et al. Evaluation of six commercial point-of-care tests for the diagnosis of acute dengue infections: the need for combining NS1antigen and IgM/IgG antibody detection to achieve acceptable levels of accuracy. Clin Vaccine Immunol 2011;18:2095–101.
6. Sharp TM, Hunsperger E, Santiago GA, et al. Virus-specific differences in rates of disease during the 2010 dengue epidemic in Puerto Rico. PLoS Negl Trop Dis 2013;7:e2159.
7. Li DS, Liu W, Guigon A, Mostyn C, Grant R, Aaskov J. Rapid displacement of dengue virus type 1 by type 4, Pacific Region, 2007–2009. Emerg Infect Dis 2012;16:123–5.
8. Singh N, Kiedrzynski T, Lepers C, Benyon EK. Dengue in the Pacific—an update of the current situation. Pac Health Dialog 2005;12:111–9.
9. Kalayanarooj S. Standardized clinical management: evidence of reduction of dengue hemorrhagic fever case fatality rate in Thailand. Dengue Bull 1999;23:10–7.
Morbidity and Mortality Weekly Report
574 MMWR / July 19, 2013 / Vol. 62 / No. 28
Updated Recommendations for Use of VariZIG — United States, 2013
In December 2012, the Food and Drug Administration (FDA) approved VariZIG, a varicella zoster immune globulin preparation (Cangene Corporation, Winnipeg, Canada) for use in the United States for postexposure prophylaxis of varicella for persons at high risk for severe disease who lack evidence of immunity to varicella* and for whom varicella vaccine is contraindicated (1). Previously available under an investiga-tional new drug (IND) expanded access protocol, VariZIG, a purified immune globulin preparation made from human plasma containing high levels of anti–varicella-zoster virus antibodies (immunoglobulin G), is the only varicella zoster immune globulin preparation currently available in the United States. VariZIG is now approved for administration as soon as possible following varicella-zoster virus exposure, ideally within 96 hours (4 days) for greatest effectiveness (2). CDC recommends administration of VariZIG as soon as possible after exposure to the varicella-zoster virus and within 10 days. CDC also has revised the patient groups recommended by the Advisory Committee on Immunization Practices (ACIP) to receive VariZIG by extending the period of eligibility for previously recommended premature infants from exposures to varicella-zoster virus during the neonatal period to exposures that occur during the entire period for which they require hos-pital care for their prematurity. The CDC recommendations for VariZIG use are now harmonized with the American Academy of Pediatrics (AAP) recommendations (3). This report sum-marizes data on the timing of administration of varicella zoster immune globulin in relation to exposure to varicella-zoster virus and provides the CDC updated recommendations for use of VariZIG that replace the 2007 ACIP recommendations.
BackgroundStudies conducted in the late 1960s indicated that clinical
varicella was prevented in susceptible, healthy children by administration of zoster immune globulin (ZIG) (prepared from patients recovering from herpes zoster) within 72 hours of household exposure (4). ZIG also lowered attack rates and modified disease severity among susceptible immunocompro-mised children when administered within 72 hours after house-hold exposure (5,6). The definitions for susceptible children varied across studies and included children with negative or
unknown history of varicella or those who were seronegative for varicella-zoster antibodies. The first commercial varicella zoster immune globulin preparation available in the United States, VZIG, was prepared from plasma obtained from healthy, volunteer blood donors identified by routine screening to have high antibody titers to varicella-zoster virus, and became available in 1978. Both serologic and clinical evaluations demonstrated that VZIG was equivalent to ZIG in preventing or modifying clinical illness in susceptible, immunocompro-mised children if administered within 96 hours of exposure to varicella (7,8). In a study of immunocompromised children who were administered VZIG within 96 hours of exposure, approximately one in five exposed children developed clinical varicella, and one in 20 developed subclinical disease com-pared with 65%–85% attack rates among historical controls (8). Among those in the study who became ill, the severity of clinical varicella (evaluated by percentage of patients with >100 lesions or with complications) was lower than expected on the basis of historic controls. The effectiveness of VZIG when administered >96 hours after initial exposure was not evalu-ated. Based on these findings and the licensure indications of the VZIG available in the United States, ACIP recommended VZIG for use within 96 hours of exposure (9). In February 2006, the VZIG supply was discontinued and a new product, VariZIG, became available under an IND protocol for admin-istration within 96 hours of exposure (9,10).
MethodsThese recommendations reflect the ACIP work group discus-
sions and review of scientific evidence related to use of varicella zoster immune globulin conducted during the development of the ACIP statements on prevention of varicella as well as a review of published literature to include reports with immune globulins with high anti–varicella-zoster virus antibodies used outside the United States >4 days after exposure to varicella-zoster virus. When data were not available, expert opinion was considered.
Summary of Rationale for VariZIG Recommendations
Timing of VariZIG administration. In May 2011, the FDA approved amendment of the IND protocol to extend the period for administration of VariZIG after exposure to varicella-zoster virus from 4 days (96 hours) to 10 days. Subsequently, in 2012, CDC published notification of FDA agreement with administration of investigational VariZIG as soon as possible after exposure and within 10 days (11). Limited experience
* Evidence of immunity to varicella includes 1) documentation of age-appropriate vaccination with varicella vaccine, 2) laboratory evidence of immunity or laboratory confirmation of disease, 3) birth in the United States before 1980 (except for health-care personnel, pregnant women, and immunocompromised persons), or 4) health-care provider diagnosis or verification of a history of varicella or herpes zoster. For immunocompromised children aged 12 months to 6 years, 2 doses of varicella vaccine are considered age-appropriate vaccination.
Morbidity and Mortality Weekly Report
MMWR / July 19, 2013 / Vol. 62 / No. 28 575
from outside the United States with use of other immune globulin products with high levels of anti–varicella-zoster virus antibodies suggested that, compared with administration of the immune globulins within 4 days of exposure, admin-istration >4 days (up to 10 days) after exposure resulted in comparable incidence of varicella and attenuation of disease (12–15). One study indicated an increase in varicella incidence with increasing time between exposure and administration of ZIG, but disease was attenuated in all cases (16). Considering these data, CDC recommends that VariZIG be administered as soon as possible after exposure and within 10 days. AAP also recommends administration of VariZIG within 10 days of exposure (3).
Patient groups for whom VariZIG is recommended. In anticipation of availability of a licensed product for which the supply is projected to be adequate and to harmonize with recommendations from AAP, CDC revised the patient groups previously recommended by ACIP for use of VariZIG. The change refers to extending the period of eligibility for VariZIG administration for previously recommended premature infants from exposures to varicella-zoster virus during the neonatal period to exposures that occurred during the entire period for which they require hospital care for their prematurity. The risk for complications of postnatally acquired varicella in premature infants is unknown. Because the immune systems of premature infants (some of whom might be extremely low birthweight and spend months in neonatal intensive care units) might be compromised, they are considered, on the basis of expert opinion, at high risk for severe varicella; this increased risk is likely continued for as long as these infants remain hospitalized. Patients receiving monthly high-dose (≥400 mg/kg) immune globulin intravenous (IGIV) are likely to be protected and probably do not require VariZIG if the most recent dose of IGIV was administered ≤3 weeks before exposure (9).
CDC Recommendations for Use of VariZIGThe decision to administer VariZIG depends on three fac-
tors: 1) whether the patient lacks evidence of immunity to varicella, 2) whether the exposure is likely to result in infection, and 3) whether the patient is at greater risk for varicella com-plications than the general population. For high-risk patients who have additional exposures to varicella-zoster virus ≥3 weeks after initial VariZIG administration, another dose of VariZIG should be considered.
Timing of VariZIG administration. CDC recommends administration of VariZIG as soon as possible after exposure to varicella-zoster virus and within 10 days.
Patient groups for whom VariZIG is recommended. Patients without evidence of immunity to varicella who are at high risk for severe varicella and complications, who have been
exposed to varicella or herpes zoster, and for whom varicella vaccine is contraindicated, should receive VariZIG. Patient groups recommended by CDC to receive VariZIG include the following:• Immunocompromised patients without evidence of
immunity.•Newborn infants whose mothers have signs and symptoms
of varicella around the time of delivery (i.e., 5 days before to 2 days after).
•Hospitalized premature infants born at ≥28 weeks of gestation whose mothers do not have evidence of immunity to varicella.
•Hospitalized premature infants born at <28 weeks of gestation or who weigh ≤1,000 g at birth, regardless of their mothers’ evidence of immunity to varicella.
• Pregnant women without evidence of immunity.
VariZIG AdministrationVariZIG is supplied in 125-IU vials and should be admin-
istered intramuscularly as directed by the manufacturer. The recommended dose is 125 IU/10 kg of body weight, up to a maximum of 625 IU (five vials). The minimum dose is 62.5 IU (0.5 vial) for patients weighing ≤2.0 kg and 125 IU (one vial) for patients weighing 2.1–10.0 kg (2).
Unchanged from previous recommendations (9), for patients who become eligible for vaccination, varicella vaccine should be administered ≥5 months after VariZIG administration. Because varicella zoster immune globulin might prolong the incubation period by ≥1 week, any patient who receives VariZIG should be observed closely for signs and symptoms of varicella for 28 days after exposure. Antiviral therapy should be instituted immediately if signs or symptoms of varicella occur. Most common adverse reactions following VariZIG adminis-tration were pain at injection site (2%) and headache (2%) (2). Contraindications for VariZIG administration include a history of anaphylactic or severe systemic reactions to human immune globulins and IgA-deficient patients with antibodies against IgA and a history of hypersensitivity (2).
How to Obtain VariZIGVariZIG can be ordered from the exclusive U.S. dis-
tributor, FFF Enterprises (Temecula, California) (telephone, 800-843-7477; online at http://www.fffenterprises.com).
CommentThe demand for VariZIG has declined significantly, commen-
surate with declining incidence of varicella (9). Nevertheless, exposures from varicella and from herpes zoster might still occur. Extending the time window for administration of
Morbidity and Mortality Weekly Report
576 MMWR / July 19, 2013 / Vol. 62 / No. 28
VariZIG should increase availability of postexposure prophy-laxis with VariZIG for persons at high risk for severe varicella. However, physicians are reminded that VariZIG should be administered as soon as possible following exposure. CDC recommendations for use of this product are now harmonized with those of AAP (3).
Reported by
Mona Marin, MD, Stephanie R. Bialek, MD, Jane F. Seward, MBBS, Div of Viral Diseases, National Center for Immunization and Respiratory Diseases, CDC. Corresponding contributor: Mona Marin, [email protected], 404–639–8791.
References 1. Food and Drug Administration. FDA approves VariZIG for reducing
chickenpox symptoms. Silver Spring, MD: Food and Drug Administration; 2012. Available at http://www.fda.gov/newsevents/newsroom/pressannouncements/ucm333233.htm.
2. Cangene Corporation. VariZIG: varicella zoster immune globulin (human). [package insert]. Winnipeg, Canada: Cangene Corporation; 2013.
3. American Academy of Pediatrics. Varicella-zoster infections. In: Pickering LK, Baker CJ, Kimberlin DW, Long SS, eds. Red book: 2012 report of the Committee on Infectious Diseases. 29th ed. Elk Grove Village, IL: American Academy of Pediatrics; 2012:774–89.
4. Brunell PA, Ross A, Miller LH, Kuo B. Prevention of varicella by zoster immune globulin. N Engl J Med 1969;280:1191–4.
5. Brunell PA, Gershon AA, Hughes WT, Riley HD Jr, Smith J. Prevention of varicella in high risk children: a collaborative study. Pediatrics 1972;50:718–22.
6. Gershon AA, Steinberg S, Brunell PA. Zoster immune globulin. A further assessment. N Engl J Med 1974;290:243–5.
7. Zaia J, Levin MJ, Preblud SK, et al. Evaluation of varicella-zoster immune globulin: protection of immunosuppressed children after household exposure to varicella. J Infect Dis 1983;147:737–43.
8. Levin MJ, Nelson WL, Preblud SR, Zaia JA. Clinical trials with varicella-zoster imunoglobulins. In Movell A, Nydegger U, eds. Clinical use of intravenous imunoglobulins. London, UK: Academic Press Inc.; 1986:255–67.
9. CDC. Prevention of varicella: recommendations of the Advisory Committee on Immunization Practices (ACIP). MMWR 2007;56(No. RR-4).
10. CDC. A new product (VariZIG) for postexposure prophylaxis of varicella available under an investigational new drug application expanded access protocol. MMWR 2006;55:209–10.
11. CDC. FDA approval of an extended period for administering VariZIG for postexposure prophylaxis of varicella. MMWR 2012;61:212.
12. Evans EB, Pollock TM, Cradock-Watson JE, Ridehalgh MK. Human anti-chickenpox immunoglobulin in the prevention of chickenpox. Lancet 1980;1:354–6.
13. Miller E, Marshall R, Vurdien J. Epidemiology, outcome and control of varicella-zoster infection. Reviews in Medical Microbiology 1993; 4:222–30.
14. Enders G, Miller E. Varicella and herpes zoster in pregnancy and the newborn. In: Arvin A, Gershon A, eds. Varicella-zoster virus: virology and clinical management. Cambridge, UK: Cambridge University Press; 2000.
15. Koren G, Money D, Boucher M, et al. Serum concentrations, efficacy, and safety of a new, intravenously administered varicella zoster immune globulin in pregnant women. J Clin Pharmacol 2002;42:267–74.
16. Winsnes R. Efficacy of zoster immunoglobulin in prophylaxis of varicella in high-risk patients. Acta Paediatr Scanda 1978;67:77–82.
Morbidity and Mortality Weekly Report
MMWR / July 19, 2013 / Vol. 62 / No. 28 577
New National Health Interview Survey Occupational Health Supplement Topic Page
CDC’s National Institute for Occupational Safety and Health (NIOSH) has released a new topic page at http://www.cdc.gov/niosh/topics/nhis. The page describes the 2010 National Health Interview Survey (NHIS) Occupational Health Supplement (OHS), and results are organized into National Occupational Research Agenda (NORA) sector pro-files. These profiles each contain charts and tables describing the prevalence rates of certain work-related health conditions, work organization factors, and occupational psychosocial and physical/chemical exposures. Results are categorized by indus-try and/or occupation subgroups within each sector profile.
An additional profile compares sector-level results and includes some additional outcomes that cannot be shown for subsectors because of small subsamples.
Using the information available on this page, employers can benchmark the health of their workers against industry aver-ages. Additionally, industry and employer stakeholders can use the information to prioritize interventions at the industry and organizational levels. This helps ensure that the most pressing industry health concerns receive appropriate attention.
In addition, NIOSH is looking for input on what questions to include in the 2015 NHIS-OHS. Additional information is avail-able at http://blogs.cdc.gov/niosh-science-blog/2013/06/24/nhis.
Announcement
Morbidity and Mortality Weekly Report
578 MMWR / July 19, 2013 / Vol. 62 / No. 28
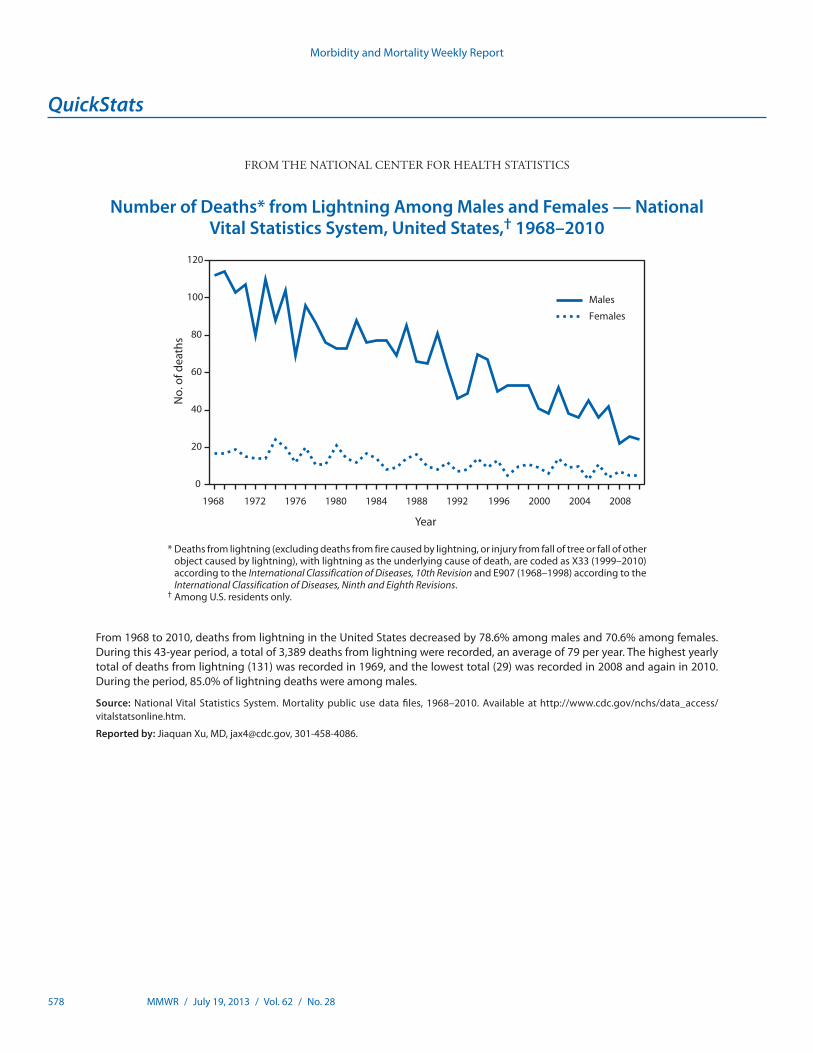
* Deaths from lightning (excluding deaths from fire caused by lightning, or injury from fall of tree or fall of other object caused by lightning), with lightning as the underlying cause of death, are coded as X33 (1999–2010) according to the International Classification of Diseases, 10th Revision and E907 (1968–1998) according to the International Classification of Diseases, Ninth and Eighth Revisions.
† Among U.S. residents only.
From 1968 to 2010, deaths from lightning in the United States decreased by 78.6% among males and 70.6% among females. During this 43-year period, a total of 3,389 deaths from lightning were recorded, an average of 79 per year. The highest yearly total of deaths from lightning (131) was recorded in 1969, and the lowest total (29) was recorded in 2008 and again in 2010. During the period, 85.0% of lightning deaths were among males.
Source: National Vital Statistics System. Mortality public use data files, 1968–2010. Available at http://www.cdc.gov/nchs/data_access/ vitalstatsonline.htm.
Reported by: Jiaquan Xu, MD, [email protected], 301-458-4086.
0
20
40
60
80
100
120
1968 1972 1976 1980 1984 1988 1992 1996 2000 2004 2008
No.
of d
eath
s
Year
Males
Females
QuickStats
FROM THE NATIONAL CENTER FOR HEALTH STATISTICS
Number of Deaths* from Lightning Among Males and Females — National Vital Statistics System, United States,† 1968–2010

U.S. Government Printing Office: 2013-623-030/01015 Region IV ISSN: 0149-2195
The Morbidity and Mortality Weekly Report (MMWR) Series is prepared by the Centers for Disease Control and Prevention (CDC) and is available free of charge in electronic format. To receive an electronic copy each week, visit MMWR’s free subscription page at http://www.cdc.gov/mmwr/mmwrsubscribe.html. Paper copy subscriptions are available through the Superintendent of Documents, U.S. Government Printing Office, Washington, DC 20402; telephone 202-512-1800.
Data presented by the Notifiable Disease Data Team and 122 Cities Mortality Data Team in the weekly MMWR are provisional, based on weekly reports to CDC by state health departments. Address all inquiries about the MMWR Series, including material to be considered for publication, to Editor, MMWR Series, Mailstop E-90, CDC, 1600 Clifton Rd., N.E., Atlanta, GA 30333 or to [email protected].
All material in the MMWR Series is in the public domain and may be used and reprinted without permission; citation as to source, however, is appreciated.
Use of trade names and commercial sources is for identification only and does not imply endorsement by the U.S. Department of Health and Human Services.
References to non-CDC sites on the Internet are provided as a service to MMWR readers and do not constitute or imply endorsement of these organizations or their programs by CDC or the U.S. Department of Health and Human Services. CDC is not responsible for the content of these sites. URL addresses listed in MMWR were current as of the date of publication.
Morbidity and Mortality Weekly Report


![Proposals to Extend Healthy Life Expectancy in Shizuoka ...€¦ · [Gap between life expectancy and healthy life expectancy in Shizuoka Prefecture] Healthy life expectancy *Source:](https://img.pdfslide.us/doc/110x75/5f427921a09c2479a15262fb/proposals-to-extend-healthy-life-expectancy-in-shizuoka-gap-between-life-expectancy.jpg)