Embed Size (px)
Citation preview

Corridor SystemManagement Plan
August 2010
9State Route 91


S T A T E R O U T E 9 1 c o r r i d o r s y s t e m m a n a g e m e n t p l a n i
C S M P E x e c u t i v e S u m m a r y
Corridor System Management Plan State Route 91 (Orange County )
Executive Summary
Caltrans District 12
ii. STATE ROUTE 91 corridor system management plan

S T A T E R O U T E 9 1 c o r r i d o r s y s t e m m a n a g e m e n t p l a n iii
C S M P E x e c u t i v e S u m m a r y
TABLE OF CONTENTS
List of Exhibits ......................................................................................................iv INTRODUCTION.................................................................................................. 1 BACKGROUND.................................................................................................... 2 STAKEHOLDER INVOLVEMENT ........................................................................ 3 CORRIDOR PERFORMANCE ASSESSMENT.................................................... 4 Corridor Description....................................................................... 4 Corridor Performance Assessment................................................ 6 Mobility ...................................................................................... 6 Reliability ................................................................................. 11 Safety ...................................................................................... 14 Productivity .............................................................................. 16 BOTTLENECK IDENTIFICATION AND CAUSALITY ANALYSIS ...................... 19 SCENARIO DEVELOPMENT AND ANALYSIS.................................................. 21 Traffic Model Development.......................................................... 21 Scenario Development Framework ............................................. 23 Scenario Evaluation Results........................................................ 25 Benefit-Cost Analysis .................................................................. 31 CONCLUSIONS AND RECOMMENDATIONS .................................................. 32

S T A T E R O U T E 9 1 c o r r i d o r s y s t e m m a n a g e m e n t p l a n iv
C S M P E x e c u t i v e S u m m a r y
LIST OF EXHIBITS
Exhibit ES-1: System Management Pyramid ........................................................ 2 Exhibit ES-2: Orange County SR-99CSMP Corridor Map .................................... 5 Exhibit ES-3: Mainline and HOV Weekday Delay by Month (2002-2009)............. 7 Exhibit ES-4: Mainline and HOV Weekday Delay by Month (2005-2009)............. 9 Exhibit ES-5: Mainline Lane Delay by Day of Week (2002 to 2009) ..................... 9 Exhibit ES-6: Eastbound Mainline Lanes Hourly Delay (2005-2009) .................. 10 Exhibit ES-7: Westbound Mainline Lanes Hourly Delay (2005-2009) ................. 10 Exhibit ES-8: Eastbound Mainline Lanes Travel Time by Hour (2005-2009) ................................................................................. 12 Exhibit ES-9: Westbound Mainline Lanes Travel Time by Hour (2005-2009) ................................................................................. 12 Exhibit ES-10: Eastbound Mainline Travel Time Variation (2007) ...................... 13 Exhibit ES-11: Westbound Mainline Travel Time Variation (2007) ..................... 13 Exhibit ES-12: Eastbound Monthly Accidents (2006-2008) ................................ 15 Exhibit ES-13: Westbound Monthly Accidents (2006-2008) ............................... 15 Exhibit ES-14: Lost Productivity Illustrated ......................................................... 16 Exhibit ES-15: Mainline Lost Lane-Miles by Direction and Period (2005-2009).. 18 Exhibit ES-16: HOV Lost Lane-Miles by Direction and Period (2005-2009) ....... 18 Exhibit ES-17: SR-91 Bottleneck Locations and Causality ................................. 19 Exhibit ES-18: Map of Major SR-91 AM Existing Bottlenecks............................. 20 Exhibit ES-19: Map of Major SR-91 PM Existing Bottlenecks............................. 20 Exhibit ES-20: SR-91 Micro-Simulation Model Network ..................................... 22 Exhibit ES-21: Micro-Simulation Modeling Approach.......................................... 24 Exhibit ES-22: AM Peak Micro-Simulation Delay Results by Scenario (2007).... 29 Exhibit ES-23: PM Peak Micro-Simulation Delay Results by Scenario (2007).... 29 Exhibit ES-24: AM Peak Micro-Simulation Delay by Scenario (2020)................. 30
Exhibit ES-25: PM Peak Micro-Simulation Delay by Scenario (2020)................. 30 Exhibit ES-26: Scenario Benefit/Cost (B/C) Results ........................................... 31 Exhibit ES-27: District 12 CSMP Team Organization Chart................................ 33

1 S T A T E R O U T E 9 1 c o r r i d o r s y s t e m m a n a g e m e n t p l a n
C S M P E x e c u t i v e S u m m a r y
This document contains the Executive Summary for
the Orange County State Route 91 (SR-91) Corridor
System Management Plan (CSMP) Final Report de-
veloped on behalf of the California Department of
Transportation (Caltrans) by System Metrics Group,
Inc. (SMG). A more detailed technical CSMP is
available upon request.
This CSMP is the direct result of the November 2006
voter-approved Proposition 1B (The Highway Safety,
Traffic Reduction, Air Quality, and Port Security
Bond Act of 2006). This ballot measure included a
funding program deposited into a Corridor Mobility
Improvement Account (CMIA). There are two CMIA
funded projects on the SR-91 corridor:
Add an eastbound auxiliary lane from SR-241 to SR-71 in Orange and Riverside Counties. This project is expected to be delivered in December 2010 at a total cost of $94 million, of which $82 million are CMIA funds.
Add a one general purpose lane on eastbound SR-91 from the SR-55/SR-91 connector to east of the Weir Canyon Road interchange and on westbound SR-91 from just east of the Weir Canyon Road interchange to the Imperial High-way (SR-90) interchange. This project is antici-pated to be delivered in February 2012 at a total cost of $96 million, of which $22 million are CMIA funds.
To receive CMIA funds, the California Transportation
Commission (CTC) guidelines require that project
nominations describe in a CSMP how mobility gains
from funded corridor improvements would be main-
tained over time. A CSMP, therefore, aims to define
how corridors will be managed, focusing on opera-
tional strategies in addition to the already funded
expansion projects. The goal is to get the most out
of the existing system and maintain or improve corri-
dor performance.
This Executive Summary and the full technical
CSMP represent the results of the study, which in-
cluded several key steps:
Stakeholder Involvement
Corridor Performance Assessment
Bottleneck Identification and Causality Analysis
Scenario Development and Analysis
Conclusions and Recommendations
1. Introduction

2 S T A T E R O U T E 9 1 c o r r i d o r s y s t e m m a n a g e m e n t p l a n
C S M P E x e c u t i v e S u m m a r y
Orange County’s transportation system faces numer-
ous challenges – the demand for transportation keeps
rising, congestion is increasing, and infrastructure is
aging. At the same time, traditional transportation
finance mechanisms are not able to provide adequate
funding to continue expanding the infrastructure and
keep up with demand. Caltrans recognized that infra-
structure expansion cannot keep pace with demand,
and adopted a system management philosophy to
address current and future transportation needs in a
comprehensive manner.
Exhibit ES-1 illustrates the concept of system man-
agement as a pyramid. The exhibit shows that trans-
portation decision makers and practitioners at all juris-
dictions must expand their “tool box” to include many
complementary strategies, including smart land use,
demand management, and an increased focus on
operational investments (shown in the middle part of
the pyramid) to complement the traditional system
expansion investments. All of these strategies build
on a strong foundation of system monitoring and
evaluation.
This CSMP aims to define how Caltrans and its stake-
holders will manage the SR-91 corridor over time,
focusing on operational strategies in addition to al-
ready funded expansion projects. The CSMP fully
respects previous decisions (including land use, pric-
ing, and demand management) and complements
them with additional promising investment sugges-
tions, where appropriate. The CSMP development
effort relies on complex analytical tools, including mi-
cro-simulation models, to isolate deficiencies and
quantify improvements for even relatively small opera-
tional investments.
The CSMP study team developed a calibrated 2007
Base Year model for the SR-91 corridor. This model
was calibrated using California and Federal Highway
Administration (FHWA) guidelines. Following ap-
proval of a 2007 Base Year model, the study team
developed a 2020 Horizon Year model to test the im-
pacts of short-term programmed projects as well as
future operational improvements. Caltrans and the
study team agreed to 2020 as the Horizon Year since
micro-simulation modeling captures operational
strategies, but is typically suited for the short- to me-
dium-term forecasting. Note that latent demand over
and beyond the OCTA forecast demand was not ac-
counted for in the analysis.
Caltrans develops integrated multimodal projects in
balance with community goals, plans, and values.
Caltrans seeks to address the safety and mobility
needs of bicyclists, pedestrians, and transit users in
all projects, regardless of funding. Bicycle, pedes-
trian, and transit travel is facilitated by creating
"complete streets" beginning early in system planning
and continuing through project delivery, maintenance,
and operations. Developing a network of complete
streets requires collaboration among all Caltrans func-
tional units and stakeholders. As the first-generation
CSMP, this report focuses more on reducing conges-
tion and increasing mobility through capital and op-
erational strategies. Future CSMP work will further
address pedestrian, bicycle and transit components
and seek to manage and improve the whole network
as an interactive system.
Exhibit ES-1: System Management Pyramid
2. Background

S T A T E R O U T E 9 1 c o r r i d o r s y s t e m m a n a g e m e n t p l a n 3
C S M P E x e c u t i v e S u m m a r y
The SR-91 CSMP involved corridor stakeholders
including representatives from cities bordering SR-
91, the Orange County Transportation Authority
(OCTA), and the Southern California Association of
Governments (SCAG). Caltrans briefed these stake-
holders at critical milestones. Feedback from the
stakeholders helped solidify the findings of the per-
formance assessment, bottleneck identification, and
causality analysis given their intimate knowledge of
local conditions. Moreover, corridor stakeholders
have provided support and insight, and shared valu-
able field and project data without which this study
would not have been possible. The stakeholders
included representatives from the following organiza-
tions:
Orange County Transportation Authority (OCTA)
Southern California Association of Governments (SCAG)
City of Anaheim
City of Buena Park
City of Fullerton
City of La Palma
City of Placentia
City of Yorba Linda
Caltrans would like to thank all of its partners for
contributing to this CSMP development process. In
addition, the CSMP development provided a venue
for tighter coordination between Caltrans planning
and operations professionals, which is critical to the
success of the system management approach.
3. Stakeholder Involvement

S T A T E R O U T E 9 1 c o r r i d o r s y s t e m m a n a g e m e n t p l a n 4
C S M P E x e c u t i v e S u m m a r y
4. Corridor Performance Assessment SR-91 runs through Los Angeles, Orange, and Riv-
erside Counties. This section describes the subset
of SR-91 covered in the Orange County SR-91
CSMP Corridor and summarizes results from the
comprehensive corridor performance assessment.
CORRIDOR DESCRIPTION
Named the Riverside Freeway, SR-91 links the
“Inland Empire” communities in Riverside and San
Bernardino Counties to Orange and Los Angeles
Counties. In Orange County, SR-91 runs from the
Los Angeles County line to the Riverside County
line. As shown in Exhibit ES-2, the Orange County
SR-91 CSMP Corridor covers a smaller area. The
CSMP corridor extends approximately 19 miles as
an east-west route from I-5 in Buena Park at post-
mile R3.6 to the Orange/Riverside County Line at
postmile R18.9.
As shown in Exhibit ES-2, the SR-91 CSMP Corridor
passes through Anaheim, Fullerton, Placentia, and
Yorba Linda and includes four major freeway-to-
freeway interchanges: I-5, SR-57, SR-55, and the
SR-241 Eastern Transportation Corridor Toll Road.
SR-91 is a six to eight-lane freeway with a concrete
barrier median for most of the study corridor with
auxiliary lanes along some sections. High Occu-
pancy Vehicle (HOV) lanes are available in the west-
ern portion of the corridor between I-5 and SR-55, a
distance of just under nine miles. The HOV lanes
operate as a 2+ vehicle-occupancy facility, 24-hours
every day.
A key feature of SR-91 is the 91 Express Lanes – a
ten-mile toll facility in the inner two lanes between
SR-55 and the Riverside County Line. Opened in
1995, the four-lane facility is the first privately fi-
nanced toll road in the United States in more than 50
years, the world's first fully-automated toll facility,
and the first application of value pricing in the United
States. Tolls are paid using a transponder from pre-
paid accounts. Reduced tolls are available to vehi-
cles with three or more occupants as an incentive.
According to Caltrans traffic volumes reported for
2008, the Orange County SR-91 CSMP Corridor car-
ries between 217,000 and 318,000 annual average
daily traffic (AADT). The highest volumes on the
corridor occur between Imperial Highway (SR-90)
and SR-55. The lowest volumes occur between SR-
57 and SR-55.
SR-91 is also a Surface Transportation Assistance
Act (STAA) route that allows large trucks to operate
on the mainline lanes. According to 2008 truck vol-
umes from Caltrans, trucks comprise 4.5 to 8.7 per-
cent of total daily traffic along the corridor. The
heaviest truck volumes occur around SR-57 and
State College Boulevard. Truck weigh stations are
located in both the eastbound and westbound direc-
tions near Weir Canyon and are the only weigh sta-
tions in Orange County.
Three major transit operators provide service on or
near SR-91: OCTA, Riverside Transit Agency (RTA),
and the Southern California Regional Rail Authority
(SCRRA) – commonly known as Metrolink.
As the primary bus transit provider in Orange
County, OCTA provides fixed-route bus and para-
transit services throughout Orange County. In addi-
tion to several local and express routes that operate
near SR-91, the following routes operate on or di-
rectly adjacent to SR-91: Routes 794, 721,
213/213A, 30, and 38.
RTA provides 38 fixed routes and paratransit ser-
vices in western Riverside County. Along the SR-91
corridor, it offers both weekday and weekend service
on Route 149 between the Cities of Riverside and
Anaheim.

5 S T A T E R O U T E 9 1 c o r r i d o r s y s t e m m a n a g e m e n t p l a n
C S M P E x e c u t i v e S u m m a r y
Exhibit ES-2: Orange County SR-91 CSMP Corridor Map

6 S T A T E R O U T E 9 1 c o r r i d o r s y s t e m m a n a g e m e n t p l a n
C S M P E x e c u t i v e S u m m a r y
SCRRA is a joint powers authority that operates the
Metrolink regional rail service throughout Southern
California. Metrolink commuter rail service stops at
11 stations in Orange County and provides 44 week-
day round trips on three lines. Along the SR-91 cor-
ridor, Metrolink provides service to the Anaheim
Canyon Metrolink Station and the Fullerton Trans-
portation Center.
Several major special event facilities generate trips
along the SR-91 corridor including the Disneyland
Resort and Theme Park; “Angels Stadium of Ana-
heim,” home of the Los Angeles Angels’ professional
baseball team; and the “Honda Center” arena, home
to the Anaheim Ducks professional hockey team.
The SR-91 Corridor is also the main transportation
corridor for beach access from the Inland Empire.
There are major universities and colleges near the
SR-91 corridor and other post-secondary and trade
schools nearby. There also exist several nearby
medical facilities. Kaiser Permanente and the Ana-
heim Memorial Medical Center are located within
one-mile of SR-91. Kaiser Permanente is moving
from Lakeview to Tustin Avenue. In addition, there
are several major shopping centers along freeways
connecting to the SR-91 corridor, but no major shop-
ping malls are located directly adjacent to the corri-
dor.
CORRIDOR PERFORMANCE ASSESSMENT
The SR-91 CSMP focuses on four categories of per-
formance measures:
Mobility describes how quickly people and freight move along the corridor.
Reliability captures the relative predictability of travel time along the corridor.
Safety provides an overview of collisions along the corridor.
Productivity quantifies the degree to which traffic inefficiencies at bottlenecks or hot spots reduce flow rates along the corridor.
Mobility
Two primary measures quantify mobility in this re-
port: delay and travel time. Each is estimated from
field automatic detection data and forecasted using
macro or micro-simulation models. The Perform-
ance Measurement System (PeMS)1 provides ac-
cess to the historical freeway detection data needed
to estimate the two mobility measures. PeMS col-
lects detector volume and vehicle occupancy data on
the freeway, which are used to estimate speed, de-
lay and travel time. The vehicle occupancy data are
not the same as person occupancy.
Delay
Delay is defined as the observed travel time less the
travel time during free-flow conditions (assumed 60
miles per hour). It is reported as vehicle-hours of
delay.
Exhibit ES-3 shows the average weekday daily vehi-
cle-hours of delay for each month between 2005 and
2009 for both mainline and high occupancy vehicle
(HOV) lanes. These trends exclude weekends and
holidays. It is important to note that the mainline and
HOV facilities are not the same distance in length.
The mainline facility extends 19 miles, whereas the
HOV facility extends about 9 miles from I-5 to SR-55.
Exhibit ES-3 reveals the following delay trends on
the mainline and HOV facilities:
As expected, the mainline, or general purpose lanes, experience significantly more congestion than the HOV facility, and the eastbound mainline lanes can experience more than twice the delay of the westbound lanes.
Between 2005 and 2007, mainline delay (with the exception of typical summer season lows) grew from about 6,800 vehicle-hours of delay for both directions to nearly 17,000 vehicle-hours with the eastbound mainline lanes reaching nearly 11,000 vehicle-hours in October 2007.
Since 2007, delay has declined to around 2006 levels.
1Developed and maintained by Caltrans and accessible at http://pems.dot.ca.gov.

7 S T A T E R O U T E 9 1 c o r r i d o r s y s t e m m a n a g e m e n t p l a n
C S M P E x e c u t i v e S u m m a r y
Exhibit ES-3: Mainline and HOV Weekday Delay by Month (2005-2009)
-
1,000
2,000
3,000
4,000
5,000
6,000
7,000
8,000
9,000
10,000
11,000
12,000Ja
n Fe
Ma
Ap
rM
aJu Ju
lA
uS
eO
ct No
De
Jan Fe
Ma
Ap
rM
aJu Ju
lA
uS
eO
ct No
De
Jan Fe
Ma
Ap
rM
aJu Ju
lA
uS
eO
ct No
De
Jan Fe
Ma
Ap
rM
aJu Ju
lA
uS
eO
ct No
De
Jan Fe
Ma
Ap
rM
aJu Ju
lA
uS
eO
ct No
De
2005 2006 2007 2008 2009
Month
Av
era
ge
Da
ily
Ve
hic
le-H
ou
rs o
f D
ela
y (
<6
0 m
ph
)
Mainline (ML) Eastbound
ML Westbound
HOV Eastbound
HOV Westbound
S o u r c e : C a l t r a n s a u t o m a t i c d e t e c t o r d a t a

S T A T E R O U T E 9 1 c o r r i d o r s y s t e m m a n a g e m e n t p l a n 8
C S M P E x e c u t i v e S u m m a r y
The CSMP separates delay into two components:
severe delay and other delay. Severe delay occurs
when speeds are below 35 mph and other delay oc-
curs when speeds are between 35 and 60 mph. Se-
vere delay represents breakdown conditions.
“Other” delay represents conditions approaching or
leaving breakdown congestion, or areas that experi-
ence temporary slowdowns. However, it can also be
a leading indicator of future, severe delay.
Exhibits ES-4 (mainline lanes) and ES-5 (HOV
lanes) show average severe and other daily vehicle-
hours of delay by day of the week. A few notes re-
lated to Exhibits ES-4 and ES-5:
On the mainline lanes, severe delay accounts for just under 80 percent of all weekday delay on the corridor in the eastbound direction, while making up less than 60 percent in the west-bound direction (Exhibit ES-4). HOV delays tend to average just over 40 percent of total delay in either direction.
In the eastbound direction, Fridays experience the highest delays, probably due to weekend travel. The second highest delays generally oc-curred on Thursdays.
In the westbound direction, the day-of-week trends are more typical for urban commute corri-dors. The midweek days experience the highest delays. Mondays and Fridays show slightly less congestion, while the weekends show much lower delays than the weekdays.
Exhibits ES-6 and ES-7 summarize average annual
weekday delay by hour of the day over the five-year
period on the mainline eastbound and westbound,
respectively. These exhibits allow planners and de-
cision makers to understand the trend in peak period
delay spiking (greater variance/differences) and
peak period spreading (longer duration) by compar-
ing the intensity and duration of the peak congestion.
Note that the HOV lanes are not shown in this sum-
mary report since they follow similar peaking trends
as the mainline lanes. The main technical report
contains the HOV delay by hour results.
A few notes on these two exhibits:
Delay in the westbound direction peaks during the AM period, while delay peaks in the east-bound direction during the PM period.
The peak period of delay lasts from 6:00 AM to 9:00 AM and from 3:00 PM to 6:00 PM. The AM peak hour is 7:00 AM, while the PM peak period has two peak hours depending on the year: 4:00 PM or 5:00 PM.
Delay increased through December 2008, but decreased in 2009. In both directions, peak pe-riod congestion nearly doubled between 2005 and 2008, but declined in 2009. Delay is less in the westbound direction
The eastbound PM peak period started one hour earlier in 2008 than in 2005. In 2009, the east-bound congested period shrank by about one-half hour.
Although delays are less in the westbound direc-tion, the AM peak grew more pronounced in 2008 and 2009. The AM peak period also ex-panded.

9 S T A T E R O U T E 9 1 c o r r i d o r s y s t e m m a n a g e m e n t p l a n
C S M P E x e c u t i v e S u m m a r y
Exhibit ES-4: Mainline Lane Delay by Day of Week (2005-2009 )
Exhibit ES-5: HOV Lane Delay by Day of Week (2005-2009)
S o u r c e : C a l t r a n s a u t o m a t i c d e t e c t o r d a t a
S o u r c e : C a l t r a n s a u t o m a t i c d e t e c t o r d a t a
-
1,000
2,000
3,000
4,000
5,000
6,000
7,000
8,000
9,000
10,000
11,000
12,000M
on
Tue
Wed
Thu
Fri
Sat
Sun/ H
ol
Mon
Tue
Wed
Thu
Fri
Sat
Sun/ H
ol
Mon
Tue
Wed
Thu
Fri
Sat
Sun/ H
ol
Mon
Tue
Wed
Thu
Fri
Sat
Sun/ H
ol
Mon
Tue
Wed
Thu
Fri
Sat
Sun/ H
ol
Mon
Tue
Wed
Thu
Fri
Sat
Sun/ H
ol
Mon
Tue
Wed
Thu
Fri
Sat
Sun/ H
ol
Mon
Tue
Wed
Thu
Fri
Sat
Sun/ H
ol
Mon
Tue
Wed
Thu
Fri
Sat
Sun/ H
ol
Mon
Tue
Wed
Thu
Fri
Sat
Sun/ H
ol
2005 2006 2007 2008 2009 2005 2006 2007 2008 2009
EASTBOUND WESTBOUND
Ave
rage
Dai
ly V
ehic
le-H
ours
of D
elay
(<60
mph)
Other Delay
Severe Delay
-
50.0
100.0
150.0
200.0
250.0
300.0
350.0
400.0
450.0
500.0
Mon
Tue
Wed
Thu
Fri
Sat
Sun/ H
ol
Mon
Tue
Wed
Thu
Fri
Sat
Sun/ H
ol
Mon
Tue
Wed
Thu
Fri
Sat
Sun/ H
ol
Mon
Tue
Wed
Thu
Fri
Sat
Sun/ H
ol
Mon
Tue
Wed
Thu
Fri
Sat
Sun/ H
ol
Mon
Tue
Wed
Thu
Fri
Sat
Sun/ H
ol
Mon
Tue
Wed
Thu
Fri
Sat
Sun/ H
ol
Mon
Tue
Wed
Thu
Fri
Sat
Sun/ H
ol
Mon
Tue
Wed
Thu
Fri
Sat
Sun/ H
ol
Mon
Tue
Wed
Thu
Fri
Sat
Sun/ H
ol
2005 2006 2007 2008 2009 2005 2006 2007 2008 2009
EASTBOUND WESTBOUND
Ave
rage
Dai
ly V
ehic
le-H
ours
of D
elay
(<60
mph)
Other Delay
Severe Delay

10 S T A T E R O U T E 9 1 c o r r i d o r s y s t e m m a n a g e m e n t p l a n
C S M P E x e c u t i v e S u m m a r y
Exhibit ES-6: Eastbound Mainline Lanes Hourly Delay (2005-2009)
Exhibit ES-7: Westbound Mainline Lanes Hourly Delay (2005-2009)
S o u r c e : C a l t r a n s a u t o m a t i c d e t e c t i o n d a t a
S o u r c e : C a l t r a n s a u t o m a t i c d e t e c t i o n d a t a
0
200
400
600
800
1,000
1,200
1,400
1,600
0:0
0
1:0
0
2:0
0
3:0
0
4:0
0
5:0
0
6:0
0
7:0
0
8:0
0
9:0
0
10
:00
11
:00
12
:00
13
:00
14
:00
15
:00
16
:00
17
:00
18
:00
19
:00
20
:00
21
:00
22
:00
23
:00
Hour of the Day
Ave
rag
e D
aily
Ve
hic
le H
ou
rs o
f D
ela
y (<
60
mp
h) 2009 Weekday
2008 Weekday2007 Weekday2006 Weekday2005 Weekday
0
200
400
600
800
1,000
1,200
1,400
1,600
0:0
0
1:0
0
2:0
0
3:0
0
4:0
0
5:0
0
6:0
0
7:0
0
8:0
0
9:0
0
10
:00
11
:00
12
:00
13
:00
14
:00
15
:00
16
:00
17
:00
18
:00
19
:00
20
:00
21
:00
22
:00
23
:00
Hour of the Day
Av
era
ge
Da
ily
Veh
icle
Ho
urs
of
Del
ay
(<
60
mp
h) 2009 Weekday
2008 Weekday2007 Weekday2006 Weekday2005 Weekday

11 S T A T E R O U T E 9 1 c o r r i d o r s y s t e m m a n a g e m e n t p l a n
C S M P E x e c u t i v e S u m m a r y
Travel Time
The travel time measure represents the average time
for a vehicle to travel between I-5 and the Riverside
County Line (a distance of approximately 19 miles on
the mainline). The distance measured for HOV lanes
is shorter, because HOV lanes extend only nine miles
along the corridor. Caltrans detection data were used
to compute and analyze travel times.
Exhibits ES-8 and ES-9 present the travel time results
for the mainline facility of the SR-91 corridor for 2005
through 2009. The eastbound direction had travel
times of approximately 32 to 40 minutes during its PM
peak hour. The westbound direction had travel times
of approximately 20 to 25 minutes during its AM peak
hour.
In the eastbound direction, travel times remained un-
changed in the AM peak hour, while they increased in
the PM peak hour (from approximately 32 minutes to
40 minutes between 2005 and 2008). In 2009, PM
travel times decreased to 36 minutes.
In the westbound direction, travel times increased in
the AM peak hour from approximately 20 minutes to
25 minutes between 2005 and 2008. In contrast, the
westbound travel times decreased during the PM
peak hour. The travel time in 2008 nearly equaled
2005 and 2006 levels (about 22 minutes).
Travel times on the HOV facility remained steady in
both directions during the four years analyzed at ap-
proximately 8.5 minutes along the nine-mile HOV fa-
cility (charts can be found in the detailed Final Re-
port). During the 5:00 PM peak hour in both direc-
tions of travel, delay increased from about eight min-
utes in 2005 to 11 minutes in 2007.
Reliability
Reliability captures the degree of predictability in travel
time. Reliability focuses on how travel time varies from
day to day and reflects the impacts of accidents, inci-
dents, weather, and special events. Improving reliabil-
ity is an important goal for transportation agencies.
Efforts to improve reliability include incident manage-
ment, traveler information, and special event planning.
To measure reliability, the CSMP uses the “buffer in-
dex”, which reflects the additional time required (over
and beyond the average) to ensure an on-time arrival
95 percent of the time. In other words, if a person
must be on time 95 days out of 100 (or 19 out of 20
workdays per month), then that person must add addi-
tional time to their average expected travel time to
ensure an on-time arrival. That additional time is the
buffer time. Severe events, such as collisions, could
cause longer travel times, but the 95th percentile
represents a balance between days with extreme
events (e.g., major accidents) and other, more
“typical” travel days.
Exhibits ES-10 and ES-11 illustrate the variability of
travel time along the mainline lanes for non-holiday
weekdays in 2007. The detailed final report shows
the buffer index for the years from 2005 to 2009 for
both mainline and HOV lanes. This Executive Sum-
mary reports only mainline data for 2007 since that
year was the base for modeling.
The following observations on the mainline facility are
worth noting:
In 2007 in the eastbound direction, 4:00 PM had the highest estimated average travel time at ap-proximately 40 minutes and the highest estimated buffer time of 21 minutes (a buffer index of 52 percent). In other words, to arrive on time 95 per-cent of the time, a commuter would need to leave for work 61 minutes before the start time to travel the entire length of the SR-91 study corridor.
The westbound direction had both AM and PM peaks (7:00 AM and 5:00 PM) for variability. The AM peak had an estimated average travel time of 23 minutes in 2007 with a buffer time of 7 minutes (buffer index of 30 percent), while the PM peak also had a buffer index of just under 30 percent with a 24-minute average time and a 7-minute buffer time.
It is important to keep track of the reliability statistic, in
part to evaluate incident management improvement
strategies, and in part to gauge the effectiveness of
safety projects delivered.

12 S T A T E R O U T E 9 1 c o r r i d o r s y s t e m m a n a g e m e n t p l a n
C S M P E x e c u t i v e S u m m a r y
Exhibit ES-8: Eastbound Mainline Lanes Travel Time by Hour (2005-2009)
0
5
10
15
20
25
30
35
40
45
50
0 1 2 3 4 5 6 7 8 9 10 11 12 13 14 15 16 17 18 19 20 21 22 23
Hour of the Day
Tra
vel T
ime
(min
ute
s)
2009 Average Travel Time
2008 Average Travel Time
2007 Average Travel Time
2006 Average Travel Time
2005 Average Travel Time
Travel Time @ 35mph
Travel Time @ 60mph
Exhibit ES-9: Westbound Mainline Lanes Travel Time by Hour (2005-2009)
0
5
10
15
20
25
30
35
40
45
50
0 1 2 3 4 5 6 7 8 9 10 11 12 13 14 15 16 17 18 19 20 21 22 23
Hour of the Day
Tra
vel T
ime
(min
ute
s)
2009 Average Travel Time
2008 Average Travel Time
2007 Average Travel Time
2006 Average Travel Time
2005 Average Travel Time
Travel Time @ 35mph
Travel Time @ 60mph
S o u r c e : C a l t r a n s a u t o m a t i c d e t e c t i o n d a t a
S o u r c e : C a l t r a n s a u t o m a t i c d e t e c t i o n d a t a

13 S T A T E R O U T E 9 1 c o r r i d o r s y s t e m m a n a g e m e n t p l a n
C S M P E x e c u t i v e S u m m a r y
Exhibit ES-10: Eastbound Mainline Lanes Travel Time Variability (2007)
Exhibit ES-11: Westbound Mainline Lanes Travel Time Variability (2007)
0
5
10
15
20
25
30
35
40
45
50
55
60
65
70
75
0:00
1:00
2:00
3:00
4:00
5:00
6:00
7:00
8:00
9:00
10:0
0
11:0
0
12:0
0
13:0
0
14:0
0
15:0
0
16:0
0
17:0
0
18:0
0
19:0
0
20:0
0
21:0
0
22:0
0
23:0
0
TR
AV
EL
TIM
E (
MIN
)
TIME OF DAY
Average Travel Time
Travel Time Variability (95th Percentile)
Travel Time at 60mph
Travel Time at 35mph
0
5
10
15
20
25
30
35
40
45
50
55
60
65
70
75
0:00
1:00
2:00
3:00
4:00
5:00
6:00
7:00
8:00
9:00
10:0
0
11:0
0
12:0
0
13:0
0
14:0
0
15:0
0
16:0
0
17:0
0
18:0
0
19:0
0
20:0
0
21:0
0
22:0
0
23:0
0
TR
AV
EL
TIM
E (
MIN
)
TIME OF DAY
Average Travel Time
Travel Time Variability (95th Percentile)
Travel Time at 60mph
Travel Time at 35mph
S o u r c e : C a l t r a n s a u t o m a t i c d e t e c t i o n d a t a
S o u r c e : C a l t r a n s a u t o m a t i c d e t e c t i o n d a t a

14 S T A T E R O U T E 9 1 c o r r i d o r s y s t e m m a n a g e m e n t p l a n
C S M P E x e c u t i v e S u m m a r y
Safety
The adopted performance measures to assess
safety involve the number of accidents and the acci-
dent rates computed from the Caltrans Traffic Acci-
dent Surveillance and Analysis System (TASAS).
TASAS is a traffic records system containing an ac-
cident database linked to a highway database. The
highway database contains descriptive elements of
highway segments, intersections and ramps, access
control, traffic volumes and other data. TASAS con-
tains specific data for accidents on State Highways.
Accidents on non-State Highways are not included
(e.g., local streets and roads).
The safety assessment in this report intends to char-
acterize the overall accident history and trends in the
corridor. It also highlights notable accident concen-
tration locations or readily apparent patterns. This
report is not intended to replace more detailed safety
investigations routinely performed by Caltrans staff.
Exhibits ES-12 and ES-13 show the total number of
accidents by month on eastbound and westbound
SR-91, respectively. The accidents reported for the
study corridor are not separated by mainline and
HOV facility. The exhibits summarize the latest
available three-year data from January 1, 2006
through December 31, 2008.
From 2006 to 2008, westbound SR-91 experienced
as many as 118 collisions per month (approximately
four per day), while the eastbound direction had up
to 110 monthly collisions (daily per day). There was
a significant increase in total collisions in 2006,
which indicates that there may have been more traf-
fic in 2006 than in previous years. This could vali-
date the 2006 detector-based mobility analysis re-
sults. With reduction of congestion and elimination
of bottlenecks, these collisions may decrease. Many
of the reported accidents were rear-end collisions,
which are often indicative of congestion-related inci-
dents. Both directions have shown a decrease in
collisions through the end of 2008.
The SR-91 Corridor does not have many parallel
routes that offer opportunities for motorists to bypass
traffic incidents. To improve travel time reliability,
increased incident response could focus on these
areas.

15 S T A T E R O U T E 9 1 c o r r i d o r s y s t e m m a n a g e m e n t p l a n
C S M P E x e c u t i v e S u m m a r y
Exhibit ES-12: Eastbound Monthly Accidents (2006-2008)
Exhibit ES-13: Westbound Monthly Accidents (2006-2008)
S o u r c e : C a l t r a n s T A S A S
S o u r c e : C a l t r a n s T A S A S
0
20
40
60
80
100
120
140
Jan-
06
Mar
-06
May
-06
Jul-0
6
Sep-0
6
Nov-0
6
Jan-
07
Mar
-07
May
-07
Jul-0
7
Sep-0
7
Nov-0
7
Jan-
08
Mar
-08
May
-08
Jul-0
8
Sep-0
8
Nov-0
8
Month
Nu
mb
er
of
Mo
nth
ly I
nc
ide
nts
EB Weekend/Holiday
EB Weekday
Num
ber
of M
onth
ly A
ccid
ents
0
20
40
60
80
100
120
140
Jan-
06
Mar
-06
May
-06
Jul-0
6
Sep-0
6
Nov-0
6
Jan-
07
Mar
-07
May
-07
Jul-0
7
Sep-0
7
Nov-0
7
Jan-
08
Mar
-08
May
-08
Jul-0
8
Sep-0
8
Nov-0
8
Month
Nu
mb
er
of
Mo
nth
ly I
nc
ide
nts
EB Weekend/Holiday
EB Weekday
Num
ber
of M
onth
ly A
ccid
ents
0
20
40
60
80
100
120
140
Nu
mb
er o
f M
on
thly
Acc
iden
ts
Month
WB Weekend/Holiday
WB Weekday

16 S T A T E R O U T E 9 1 c o r r i d o r s y s t e m m a n a g e m e n t p l a n
C S M P E x e c u t i v e S u m m a r y
Productivity
Productivity is a system efficiency measure used to
analyze the throughput of the corridor during con-
gested conditions. Restoring lost productivity is a
focus of CSMPs.
Exhibit ES-14 illustrates how congestion leads to lost
productivity. The exhibit uses observed data from
sensors for a typical spring PM peak period
(Tuesday, May 4, 2010) on SR-91. It shows speeds
(in red) and flow rates (in blue) on eastbound SR-91
at Gypsum Canyon Road, one of the most con-
gested locations on the corridor.
Flow rates (measured as vehicles per hour per lane
or “vphpl”) at Gypsum Canyon Road between 1:30
PM and 2:30 PM averaged around 1,500 vphpl. This
is slightly less than a typical peak period maximum
flow rate. Generally, freeway flow rates over 2,000
vphpl cannot be sustained over a long period.
Once volumes approach this maximum rate, traffic
becomes unstable. With any additional merging or
weaving, traffic breaks down and speeds can rapidly
plummet to below 35 mph. In essence, every incre-
mental merge takes up two spots on the freeway for
a short time. However, since the volume is close to
capacity, these merges lead to queues. Rather than
accommodating the same number of vehicles, flow
rates also drop and vehicles back up, creating bottle-
necks and associated congestion.
At the location shown in Exhibit ES-14, throughput
drops by nearly 25 percent on average during the
peak period (from over 1,500 to around 1,100 vphpl).
This five-lane segment therefore operates as if it
were a four-lane road just when demand is at its
highest. Stated differently, just when the corridor
needed the most capacity, it performed in the least
productive manner and effectively lost lanes. This
loss in throughput can be aggregated and presented
as “Equivalent Lost-Lane-Miles.”
Exhibit ES-14: Lost Productivity Illustrated
0
5
10
15
20
25
30
35
40
45
50
55
60
65
70
75
80
12:00 13:00 14:00 15:00 16:00 17:00 18:00 19:00 20:00
Time of Day
SP
EE
D (
mp
h)
0
125
250
375
500
625
750
875
1000
1125
1250
1375
1500
1625
1750
1875
2000
FL
OW
RA
TE
(V
eh.
per
Hr.
per
Lan
e)Lost Productivity
Speed (<35mph)
SR-91 EastboundPostmile R016.600Gypsum Canyon RoadPM Peak PeriodMay 4, 2010
Restoring Lost Productivity is the focus of CSMPs and System Management

17 S T A T E R O U T E 9 1 c o r r i d o r s y s t e m m a n a g e m e n t p l a n
C S M P E x e c u t i v e S u m m a r y
Average weekday (non-holiday) lost lane-miles by
time period and year for SR-91 are shown in Exhibits
ES-15 (mainline) and ES-16 (HOV). A few notes on
these two exhibits:
The largest productivity losses occurred in the eastbound direction during the PM peak hours, which are the direction and time period that ex-perienced the most congestion.
On the mainline facility, the westbound direction during the AM peak period experienced produc-tivity losses nearly as high as the eastbound di-rection during the PM peak period.
On the HOV lanes, a greater productivity loss is more evident in the eastbound peak period.
Express lanes are priced to maximize through-put. Express lanes are managed up to a maxi-mum of 1,600 vphpl and pricing is adjusted to ensure these lanes operate at different flow rates than the mainline.
Operational strategies are critical to recovering such
productivity losses. These strategies include build-
ing new or extending auxiliary lanes, developing
more aggressive ramp metering strategies without
negatively influencing the arterial network, and im-
proving incident management.

18 S T A T E R O U T E 9 1 c o r r i d o r s y s t e m m a n a g e m e n t p l a n
C S M P E x e c u t i v e S u m m a r y
S o u r c e : S M G a n a l y s i s o f C a l t r a n s T A S A S d a t a
Exhibit ES-15: Mainline Daily Equivalent Lost Lane-Miles by Direction and Period (2005-2009)
Exhibit ES-16: HOV Daily Equivalent Lost Lane-Miles by Direction and Period (2005-2009)
-
1.0
2.0
3.0
4.0
5.0
6.0
7.0
8.0
9.0
10.0
11.0
12.0
2005 2006 2007 2008 2009 2005 2006 2007 2008 2009 2005 2006 2007 2008 2009 2005 2006 2007 2008 2009
AM Midday PM Night
Time Period by Year
Eq
uiv
ale
nt
Lo
st L
ane
-Mil
es
Eastbound
Westbound
-
0.1
0.2
0.3
0.4
0.5
0.6
0.7
0.8
0.9
1.0
2005 2006 2007 2008 2009 2005 2006 2007 2008 2009 2005 2006 2007 2008 2009 2005 2006 2007 2008 2009
AM Midday PM NightTime Period by Year
Eq
uiv
ale
nt
Lo
st
Lan
e-M
iles
Eastbound
Westbound

19 S T A T E R O U T E 9 1 c o r r i d o r s y s t e m m a n a g e m e n t p l a n
C S M P E x e c u t i v e S u m m a r y
5. Bottleneck Identification and Causality Analysis
Exhibit ES-17: SR-91 Bottleneck Locations and Causality
Major bottlenecks are the primary cause of conges-
tion and lost productivity. By definition, a bottleneck
is a location where traffic demand exceeds the effec-
tive carrying capacity of the roadway. In most cases,
the cause of a bottleneck relates to a sudden reduc-
tion in capacity, such as a lane drop, merging and
weaving, driver distractions, a surge in demand, or a
combination of factors.
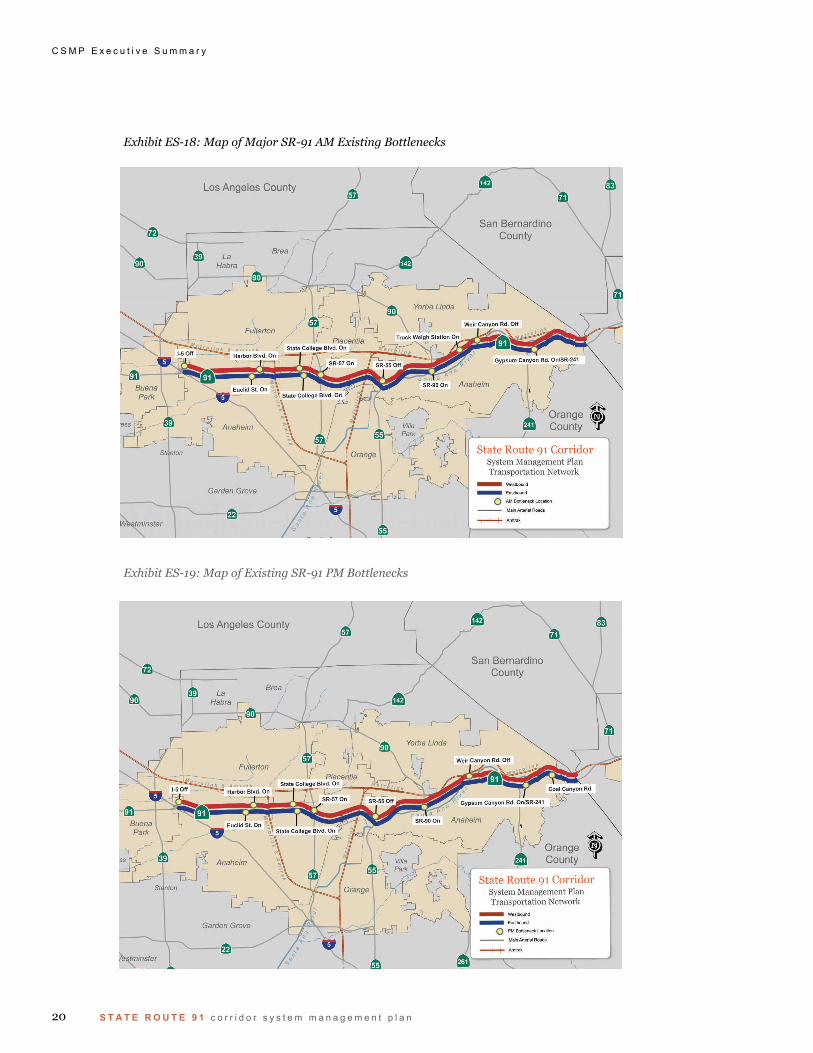
Exhibit ES-17 summarizes eastbound and west-
bound bottleneck locations on SR-91, the period
these bottlenecks are active, and the causes of the
bottlenecks. The exhibit also shows three bottle-
necks indicated by Caltrans, which did not appear
until 2009. Caltrans staff indicated that additional
bottlenecks likely exist in the westbound direction at
Tustin Avenue and the SR-55 On Ramp. Exhibits
ES-18 and ES-19 are maps showing verified bottle-
neck locations for the AM and PM peak periods, re-
spectively.
The specific location and causality of each major SR
-91 bottleneck were verified in multiple field observa-
tions on separate weekdays. Many bottleneck loca-
tions were videotaped to validate specific locations
and causes and to assist in micro-simulation model
calibration. The detailed final report fully explains
the process and results of the bottleneck identifica-
tion and causality analysis.
AM PM
Euclid St Not directly observable during 2008 field visits due to lower traffic volumes 2.4
State College Blvd Not directly observable during 2008 field visits due to lower traffic volumes 5.3
SR‐57 On
SR‐55 Off
SR‐90 On Merging from consecutive on‐ramps R11.7
Gypsum Canyon Rd On/SR‐241 Merging from consecutive on‐ramps; heavy demand from SR‐241 R16.4
Coal Canyon Rd Lane drop R17.8
Weir Canyon Rd OffHeavy demand from northbound SR‐241 on‐ramp; loss of aux lane to Weir
Canyon R14.5
Truck Weigh Station Heavy demand from Weir Canyon on‐ramps R13.3
SR‐55 Off Queuing on SR‐55 off‐ramp; weaving R8.9
SR‐57 Off
SR‐57 On Merging from consecutive on‐ramps 6.1
State College Blvd Continuation of SR‐57 On bottleneck. Crest of uphill grade. 5.1
Harbor Blvd Horizontal and vertical grade 3.1
I‐5 Off Horizontal and vertical grade; weaving R3.6
Location
Postmile
Active Period
Wes
tbo
un
dE
astb
ou
nd
Dir CausalityBottleneck Location
Indicated by Caltrans and did not appear until 2009
Indicated by Caltrans and did not appear until 2009
Indicated by Caltrans and did not appear until 2009
20 S T A T E R O U T E 9 1 c o r r i d o r s y s t e m m a n a g e m e n t p l a n
C S M P E x e c u t i v e S u m m a r y
Exhibit ES-18: Map of Major SR-91 AM Existing Bottlenecks
Exhibit ES-19: Map of Existing SR-91 PM Bottlenecks

21 S T A T E R O U T E 9 1 c o r r i d o r s y s t e m m a n a g e m e n t p l a n
C S M P E x e c u t i v e S u m m a r y
Fully understanding how a corridor performs and
why it performs that certain way sets the foundation
for evaluating potential solutions. Several steps
were required to develop and evaluate improve-
ments, including:
Developing traffic models for 2007 base-year and 2020 long-term demand
Combining projects in a logical manner for mod-eling and testing
Evaluating model outputs and summarizing results
Conducting benefit-cost assessments of scenarios.
TRAFFIC MODEL DEVELOPMENT
The study team developed a traffic model using the
Caliper TransModeler micro-simulation software. It
is important to note that micro-simulation models are
complex to develop and calibrate for a large urban
corridor such as the SR-91 corridor. However, it is
one of few tools capable of providing reasonable
approximations of bottleneck formation and queue
development. Therefore, such tools help quantify
the impacts of operational strategies, which tradi-
tional travel demand models cannot.
6. Scenario Development and Analysis

22 S T A T E R O U T E 9 1 c o r r i d o r s y s t e m m a n a g e m e n t p l a n
C S M P E x e c u t i v e S u m m a r y
Exhibit ES-20: SR-91 Micro-Simulation Model Network
Orangethorpe Ave
La Palma Ave
Lincoln Ave
Euc
lid A
ve
Sta
te C
olle
ge B
lvd
Tus
tin A
ve
Orangethorpe Ave
La Palma Ave
Lincoln Ave
Euc
lid A
ve
Sta
te C
olle
ge B
lvd
Tus
tin A
ve
Exhibit ES-20 shows the corridor roadway network
included in the model. All freeway interchanges
were included as well as on and off-ramps along the
SR-91 corridor. The study team calibrated the base
year model against the actual 2007 conditions pre-
sented earlier. This effort required several submittal
and review cycles until the model reasonably
matched bottleneck locations and relative severity.
After acceptance of the base year model, the team
developed a model with 2020 demands extrapolated
from the 2030 OCTA travel demand model. Caltrans
selected 2020 as the horizon year to test operational
improvements and other system management strate-
gies.
These models were then used to evaluate different
scenarios (combinations of projects) to quantify the
associated congestion-relief benefits and to compare
the project costs against their benefits.

23 S T A T E R O U T E 9 1 c o r r i d o r s y s t e m m a n a g e m e n t p l a n
C S M P E x e c u t i v e S u m m a r y
SCENARIO DEVELOPMENT FRAMEWORK
The study team developed a framework for combin-
ing projects into scenarios for evaluation. It would
be desirable to evaluate every possible combination
of projects, but this would have entailed thousands
of model runs. Instead, the team combined projects
based on a number of factors, including:
Projects fully programmed and funded were combined separately from projects that were not.
Whenever possible, expansion projects were not combined with operational strategies in order to delineate differences between types of improve-ments.
Short-term projects (delivered by 2015) were used to develop scenarios tested with both the 2007 and 2020 models.
Long-term projects (delivered after 2015, but before or by 2020) were used to develop scenar-ios tested with the 2020 model only.
The study team assumed that projects developed
before 2015 could reasonably be evaluated using
the 2007 base year model. The 2020 forecast year
for the SR-91 corridor was consistent with the origin-
destination matrices in the OCTA regional travel de-
mand model.
When OCTA updates its travel demand model and
SCAG updates its Regional Transportation Plan
(RTP), they may wish to update the micro-simulation
model with revised demand projections.
Project lists used to develop scenarios were from the
Regional Transportation Improvement Program
(RTIP), the RTP, Measure M2, SR-91 Implementa-
tion Plan, Transportation Corridor Agencies (TCA)
improvements, and Riverside County Transportation
Commission (RCTC) improvements, and other
sources (such as special studies). The study team
eliminated projects that do not directly affect mobility.
For instance, sound wall, landscaping, or minor arte-
rial improvement projects were eliminated because
micro-simulation models cannot evaluate them.
Scenario testing performed for the SR-91 CSMP dif-
fers from traditional alternatives evaluations or Envi-
ronmental Impact Reports (EIRs). Traditional alter-
natives evaluations or EIRs focus on identifying al-
ternative solutions to address current or projected
corridor problems, so each alternative is evaluated
separately and results among competing alternatives
are compared resulting in a locally preferred alterna-
tive. In contrast, for the SR-91 CSMP, scenarios
build on each other. A scenario contains the pro-
jects from the previous scenario plus one or more
projects as long as the incremental scenario results
show an acceptable level of performance improve-
ment. This incremental scenario evaluation ap-
proach is important because CSMPs are new and
often compared with alternatives studies.
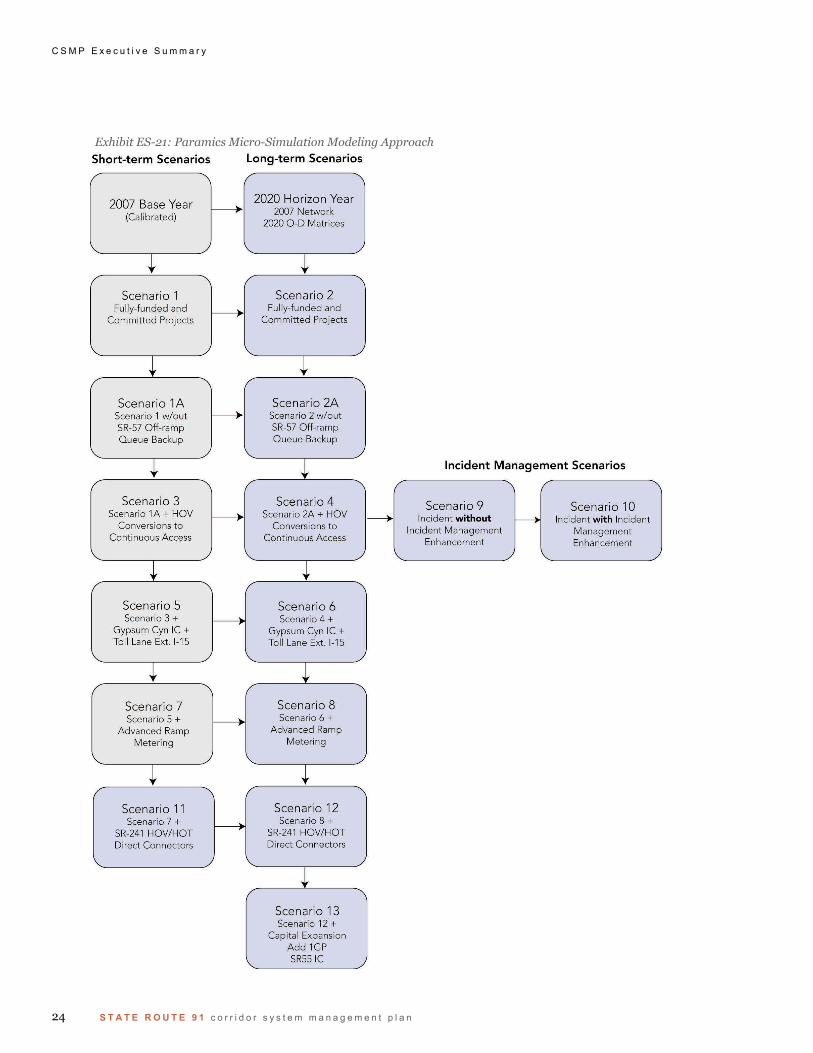
Exhibit ES-21 summarizes the approach used and
scenarios tested. It also provides a general descrip-
tion of the projects included in the 2007 and 2020
micro-simulation runs.
24 S T A T E R O U T E 9 1 c o r r i d o r s y s t e m m a n a g e m e n t p l a n
C S M P E x e c u t i v e S u m m a r y
Exhibit ES-21: Paramics Micro-Simulation Modeling Approach

25 S T A T E R O U T E 9 1 c o r r i d o r s y s t e m m a n a g e m e n t p l a n
C S M P E x e c u t i v e S u m m a r y
SCENARIO EVALUATION RESULTS
Exhibits ES-22 and ES-23 show the delay results for
all the 2007 scenarios evaluated for the AM and PM
peak periods, respectively. Exhibits ES-24 and ES-
25 show similar results for scenarios evaluated using
the 2020 horizon year model. The percentages
shown in the exhibits indicate the difference in delay
between the current scenario and the previous sce-
nario (e.g., “Percent Change = (Current Scenario -
Previous Scenario) / Previous Scenario”). Impacts
of strategies differ based on a number of factors
such as traffic flow conditions, ramp storage, bottle-
neck locations, and levels of congestion.
For each scenario, the modeling team added the
proposed improvements, conducted multiple model
runs, and produced composite results by facility type
(i.e., mainline, HOV, arterials, and ramps) and vehi-
cle type (SOV, HOV, and trucks) as well as speed
contour diagrams. The study team reviewed incre-
mental steps in detail for each modeling analysis to
ensure they were consistent with general traffic engi-
neering principles.
The following describes the findings for each sce-
nario tested and reviewed by the study team:
2007 Base Year and 2020 “Do Minimum” Hori-zon Year
Absent any physical improvements, the modeling
team estimates that by 2020, total delay (mainline,
HOV, ramps, and arterials) will increase by more
than 400 percent compared to 2007 (from a total of
around 17,000 vehicle-hours daily to nearly 69,000
vehicle-hours). Demand may continue to increase
beyond 2020 and may require further study. As de-
scribed below, the programmed projects lead to sig-
nificant decreases in congestion.
Scenarios 1 and 2 (Fully Funded and Committed Projects)
The first two scenarios include fully funded and pro-
grammed projects that are both expansion and op-
erations-related. These projects are slated for com-
pletion by 2015 and include:
Connecting the existing auxiliary lane through interchanges on westbound SR-91 between SR-57 and I-5 with its elements
Extending a lane and reconstructing the auxiliary lane on westbound SR-91 from SR-55 through the Tustin interchange
Adding an eastbound lane between SR-241 and SR-71, and improving the northbound SR-71 con-nector from SR-91 to a standard one lane and shoulder width (CMIA project)
Adding one lane in each direction – SR-55 connec-tor to SR-241 in Anaheim, from east of SR-55 con-nector to east of Weir Canyon Road (CMIA project)
Re-striping southbound Lakeview Avenue to provide 1.5 right-turn lanes to westbound SR-91 on-ramp
Widening and improving Tustin Avenue between SR-91 and La Palma Avenue (city development mitigation project)
Widening northbound SR-241 to both directions of SR-91 from three to four lanes (two in each direction)
The 2007 model estimates that the programmed pro-
jects will reduce delay on the corridor by approxi-
mately 44 percent in the AM peak period and by 78
percent in the PM peak period. In total, this scenario
estimates a reduction of nearly 12,000 vehicle-hours
of daily (AM and PM peak period) delay. In the west-
bound direction, the majority of the delay reduction oc-
curs during the AM peak period from SR-55 to State
College Boulevard. In the eastbound direction, the larg-
est mobility improvements occur during the PM peak
period from Gypsum Canyon Road to Coal Canyon
Road.
The 2020 model estimates that the same projects
will reduce delay on the corridor by approximately
60 percent in the AM peak period and 54 percent in
the PM peak period, for a total daily reduction of
over 38,000 vehicle-hours delay.

26 S T A T E R O U T E 9 1 c o r r i d o r s y s t e m m a n a g e m e n t p l a n
C S M P E x e c u t i v e S u m m a r y
These scenarios include CMIA projects that will pro-
duce significant corridor operational and mobility bene-
fits. Reductions in daily delay are well over 50 percent
in both directions and on every type of corridor facility
(mainline, HOV lanes, ramps, and arterials).
Scenarios 1A and 2A (Programmed Projects w/o SR-57 Off-Ramp Queue Backup)
During the early stages of testing, the study team real-
ized that improvements on SR-57 led to mobility
benefits on SR-91 and vice versa. The team needed
to isolate such benefits and assign them to the appro-
priate corridor. For instance, improvements on SR-91
will reduce backups on the connector from
southbound SR-57 to westbound SR-91. These delay
benefits do not relate to improvements on SR-57.
Conversely, improvements on SR-57 also lead to de-
lay reductions on SR-91.
In order to assign benefits correctly, the team evalu-
ated two sets of scenarios related to the programmed
projects listed above. The first set (Scenarios 1 and
2) maintained the queue backups from westbound SR
-91 to northbound SR-57 connector. The second set
relieved these backups with the improvements on the
SR-57 corridor. The difference between the benefits
of these two sets of scenarios belongs to the SR-57
corridor. The team used the same approach with the
SR-57 model (developed for the SR-57 CSMP) to
delineate the benefits associated with SR-91 improve-
ments that affect SR-57.
The results of the scenarios run in the SR-91 model
were applied to the SR-57 CSMP. In addition, the
study team assumed that the SR-57 improvements that
relieve the queue backup onto SR-91 would occur prior
to all subsequent SR-91 improvement scenarios.
Scenarios 3 and 4 (HOV lane Conversion to Con-tinuous Access)
Scenarios 3 and 4 build on Scenarios 1A and 2A by
adding a project to convert the existing buffer-
separated HOV and limited access HOV to a full-time
continuous access HOV facility. The study team
tested Scenarios 3 and 4 with the 2007 and 2020
models, respectively. Caltrans may revisit the model-
ing once the full details of the continuous access de-
sign are finalized.
The 2007 model estimates that this project would pro-
duce a delay reduction of approximately seven percent
in the AM peak period and seven percent in the PM
peak period. The 2020 model, however, estimates that
Scenario 4 would result in an increase in delay by as
much as eight percent in the PM peak period. The
model shows that this is due to the HOV conversion
exacerbating an eastbound bottleneck downstream at
Gypsum Canyon. The project improves operations
upstream in the eastbound direction and allows traffic
to move downstream faster. This higher demand com-
pounds the bottleneck at Gypsum Canyon and results
in a higher overall delay. It is only when this bottleneck
is relieved (in Scenarios 5 and 6) that the continuous
HOV access project will produce an overall net positive
result.
Scenarios 5 and 6 (Planned Short-Range Imple-mentation Projects)
Scenarios 5 and 6 build on Scenarios 3 and 4 by add-
ing planned short-range implementation projects.
These projects include:
Widening Gypsum Canyon Road from two to four lanes; adding Class II on-road bike lanes; adding a multi-use trail and sidewalk on west side of roadway; modifying an existing entrance ramp; and reconstructing and signalizing the eastbound SR-91 exit ramp intersection
Extending the toll lane to east of I-15 (a component of Project No. 7 of the 2009 Implementation Plan and Project No. 4 of the 2010 Implementation Plan)
With the widening and toll extension of the SR-91 Ex-
press Lanes to I-15, traffic flows would increase in the
westbound direction from east of I-15. This increased
traffic would result in an increase in overall delay in
both the AM and PM peak period by about four per-
cent.

S T A T E R O U T E 9 1 c o r r i d o r s y s t e m m a n a g e m e n t p l a n 27
C S M P E x e c u t i v e S u m m a r y
However, while the 2020 model estimates that the
AM peak period also results in overall increase in de-
lay by about four percent, this delay is more than
made up by a significant reduction in delay (reduction
of over 75 percent or over 12,000 vehicle-hours delay)
peak period. This reduction occurs almost entirely in
the east-bound direction from Imperial Highway to
the Riverside County line. This result should be ex-
pected with the toll lane extension eastbound to I-15.
Scenarios 7 and 8 (Advanced Ramp Metering System with Connector Metering)
Scenarios 7 and 8 build on Scenarios 5 and 6 by
adding an advanced ramp metering system, such as
dynamic or adaptive ramp metering with connector
metering and queue control. Queue control ensures
that traffic flow does not exceed the capacity of the
connector at the following locations:
SB-57 to WB-91 (widen connector to 3 lanes of storage)
NB-57 to EB-91 (widen connector to 2 lanes of storage)
NB-55 to WB-91 (no widening)
NB-241 to WB-91 (no widening)
NB-241 to EB-91 (no widening at maximum allow-able rate to flow)
SB-5 to EB-91 (no widening)
NB-5 to WB-91 (no widening)
Meter all HOV bypass ramps.
The 2007 model estimates that this project would
produce a delay reduction of approximately five per-
cent in the AM peak period and minimal impact in
the PM peak period. The 2020 model estimates that
advanced ramp metering would reduce delay by as
much as 18 percent in the AM peak period (with the
largest mobility improvements from Truck Scales to
SR-55) and 3 percent in the PM peak period. Ramp
metering has less impact on the PM peak period be-
cause there is very little freeway congestion.
Note that there are various types of advanced ramp
metering systems deployed around the world, includ-
ing the System-wide Adaptive Ramp Metering Sys-
tem (SWARM) tested on Los Angeles I-210 freeway
corridor. For the SR-91 modeling purposes, the As-
servissement Lineaire d’Entrée Autoroutiere
(ALINEA) system was tested as a proxy for any ad-
vanced ramp metering system, as its algorithm for
the model was readily available. It is, however, not
necessarily recommended that ALINEA be deployed
but rather some type of advanced ramp metering
system that would produce similar, if not better re-
sults.
Scenarios 9 and 10 (Enhanced Incident Man-agement System)
The study team tested two incident scenarios built
upon the Scenario 4 network to evaluate non-
recurrent delay reductions resulting from enhanced
incident management strategies. In the first scenario
(Scenario 9), a collision incident with one outside
lane closure was simulated in the westbound direc-
tion in the AM peak period model and in the east-
bound direction in the PM peak period model. The
incident simulation location and duration were se-
lected based on a review of the actual 2010 incident
data, at one of the high-frequency incident locations.
The following are the scenario details:
Westbound AM Peak Period starting at 7:00 AM, close outermost mainline lane for 35 minutes at postmile R10.2 (west of Lakeview Avenue)
Eastbound PM Peak Period starting at 4:00 PM, close outermost mainline lane for 35 minutes at postmile R18.8 (at Green River)
This scenario represents a typical, moderate incident
at one location during each peak direction period.
Data suggest that incidents vary significantly in
terms of impact and duration. Some incidents last
hundreds of minutes, some close multiple lanes, and
some occur at multiple locations simultaneously.
There are also numerous minor incidents lasting only
a few minutes without lane closures, yet still resulting
in congestion. In addition, there are many incidents
occurring during off-peak hours.

28 S T A T E R O U T E 9 1 c o r r i d o r s y s t e m m a n a g e m e n t p l a n
C S M P E x e c u t i v e S u m m a r y
Based on actual Caltrans incident management
data, it is estimated that an enhanced incident man-
agement system could reduce a 35-minute incident
by about 10 minutes. An enhanced incident man-
agement system would entail upgrading or enhanc-
ing the current Caltrans incident management sys-
tem that includes deployment of intelligent transpor-
tation system (ITS) field devices, central control/
communications software, communications medium
(i.e. fiber optic lines), advanced traveler information
system, and/or freeway service patrol (FSP) program
to reduce incident detection, verification, response,
and clearance times.
In the second scenario (Scenario 10), the study team
simulated the same collisions with a 10-minute re-
duction in duration to determine the benefits of an
enhanced incident management system.
The model results indicate that deployment of such a
system could eliminate approximately 1,500 vehicle-
hours delay in the eastbound direction and nearly
3,500 vehicle-hours of delay in the westbound direc-
tion using 2020 demand. These results reflect bene-
fits realized during the peak direction period. Addi-
tional benefits would be realized during off-peak
hours and in the off-peak direction.
Scenarios 11 and 12 (Direct HOV/HOT Connec-tors)
Scenarios 11 and 12 build on Scenarios 7 and 8 and
include a planned project to add direct HOV/HOT
connectors at:
Northbound SR-241 to eastbound SR-91
Westbound SR-91 to southbound SR-241.
The 2007 model estimates that this project would
reduce delay by about two percent in the AM peak
period and four percent in the PM peak period. The
2020 model estimates that Scenario 12 would result
in reduction in delay by as much as 19 percent in the
PM peak period with minimal impact in the AM peak
period.
Scenario 13 (Planned Long-Range Capital Ex-pansion)
Scenario 13 builds on Scenarios 12 by adding the
following planned, long-range capital expansion pro-
jects:
Adding one general purpose lane in each direc-tion from SR-57 to SR-55
Reconstructing the SR-55 interchange, restriping existing lanes, modifying SR-55 connectors to SR-91, and adding a flyover connector from WB SR-91 to SB SR-55.
The 2020 model estimates that this project would
produce a delay reduction of approximately 15 per-
cent in the AM peak period and 15 percent in the PM
peak period. This is a total reduction in delay of
about 3,000 vehicle-hours.
Post Scenario 13 Conditions
By 2020, with the inclusion of projects from Scenario
1 to Scenario 13, the model reveals some residual
congestion that remains to address with future im-
provements. According to the model results, the
total remaining delay on the corridor is less than
10,000 daily vehicle-hours with no bottleneck area
segment exceeding 1,000 vehicle-hours in either
direction during either peak period.

29 S T A T E R O U T E 9 1 c o r r i d o r s y s t e m m a n a g e m e n t p l a n
C S M P E x e c u t i v e S u m m a r y
Exhibit ES-23: PM Peak Micro-Simulation Delay Results by Scenario (2007)
Exhibit ES-22: AM Peak Micro-Simulation Delay Results by Scenario (2007)
-
500
1,000
1,500
2,000
2,500
3,000
3,500
4,000
4,500
5,000
Base Year S1 S1A S3 S5 S7 S11
Del
ay (
Pea
k P
erio
d V
ehic
le-H
ou
rs)
Toll WB
HOV WB
SR-91 WB
Toll EB
HOV EB
SR-91 EB
Ramps
Arterials
‐44%
0% ‐7%4%
‐5% ‐2%
S1 - Fully Funded/Committed ProjectsS1A - S1 w/o SR-57 Off-Ramp Queue BackupS3 - S1A+HOV Continuous AccessS5 - S3+Gypsum Cyn IC+Toll Lane ext. I-15S7 - S5+Advanced Ramp MeteringS11 - S7+SR-241 HOV/HOT Direct
-
2,000
4,000
6,000
8,000
10,000
12,000
14,000
Base Year S1 S1A S3 S5 S7 S11
Del
ay (
Pea
k P
erio
d V
ehic
le-H
ou
rs)
Toll WB
HOV WB
SR-91 WB
Toll EB
HOV EB
SR-91 EB
Ramps
Arterials
‐78%
‐10% ‐7% 4%
0%‐4%
S1 - Fully Funded/Committed ProjectsS1A - S1 w/o SR-57 Off-Ramp Queue BackupS3 - S1A+HOV Continuous AccessS5 - S3+Gypsum Cyn IC+Toll Lane ext. I-15S7 - S5+Advanced Ramp MeteringS11 - S7+SR-241 HOV/HOT Direct Connectors

30 S T A T E R O U T E 9 1 c o r r i d o r s y s t e m m a n a g e m e n t p l a n
C S M P E x e c u t i v e S u m m a r y
Exhibit ES-24: AM Peak Micro-Simulation Delay by Scenario (2020)
-
2,000
4,000
6,000
8,000
10,000
12,000
14,000
16,000
HorizonYear
S2 S2a S4 S6 S8 S12 S13
Del
ay (
Pea
k P
erio
d V
ehic
le-H
ou
rs)
Toll WB
HOV WB
SR-91 WB
Toll EB
HOV EB
SR-91 EB
Ramps
Arterials
‐60%
0% 0%
4%
‐18%
0% ‐15%
S2 - Fully Funded/Committed ProjectsS2A - S2 w/o SR-57 Off-Ramp Queue BackupS4 - S2A+HOV Continuous AccessS6 - S4+Gypsum Cyn IC+Toll Lane ext. I-15S8 - S6+Advanced Ramp MeteringS12 - S8+SR-241 HOV/HOT Direct ConnectorsS13 - S12+Capital Expansion
Exhibit ES-25: PM Peak Micro-Simulation Delay by Scenario (2020)
-
10,000
20,000
30,000
40,000
50,000
60,000
Horizon Year S2 S2a S4 S6 S8 S12 S13
Del
ay (
Pea
k P
erio
d V
ehic
le-H
ou
rs)
Toll WBHOV WBSR-91 WBToll EBHOV EBSR-91 EBRampsArterials
‐54%
‐19% 8%
‐75%
‐3% ‐19%‐15%
S2 - Fully Funded/Committed ProjectsS2A - S2 w/o SR-57 Off-Ramp Queue BackupS4 - S2A+HOV Continuous AccessS6 - S4+Gypsum Cyn IC+Toll Lane ext. I-15S8 - S6+Advanced Ramp MeteringS12 - S8+SR-241 HOV/HOT Direct ConnectorsS13 - S12+Capital Expansion

S T A T E R O U T E 9 1 c o r r i d o r s y s t e m m a n a g e m e n t p l a n 31
C S M P E x e c u t i v e S u m m a r y
BENEFIT-COST ANALYSIS
Following an in-depth review of the model results,
the study team developed a benefit-cost analysis for
each scenario. The benefit-cost results represent
the incremental benefits over the incremental costs
of a given scenario.
The study team used the California Benefit-Cost
Model (Cal-B/C) developed by Caltrans to estimate
benefits in three key areas: travel time savings, ve-
hicle operating cost savings, and emission reduction
savings. The results are conservative since this
analysis does not capture benefits after the 20-year
lifecycle or other benefits, such as the reduction in
congestion beyond the peak periods and improve-
ment in transit travel times.
Project costs were obtained from various sources,
including the RTIP, OCTA’s Long Range Plan (LRP),
and Caltrans project planning. Costs for the ad-
vanced ramp and connector ramp metering include
widening to accommodate the connector meters
within the State’s right-of-way, but not the acquisition
of new right-of-way. A benefit-cost ratio (B/C)
greater than 1 means that a scenario's projects re-
turn benefits greater than they cost to construct or
implement. It is important to consider the total bene-
fits that a project brings. The B/C results are shown
in Exhibit ES-26.
The benefit-cost findings for each scenario are as follows:
Scenarios 1 and 2 (completed or fully funded pro-grammed projects) produce a high B/C ratio of over 10:1.
Scenarios 3 and 4 (HOV lane conversion to con-tinuous access) produce a benefit-cost ratio of less than 1, but the full benefits appear in later scenarios after the Gypsum Canyon bottleneck is relieved.
Scenarios 5 and 6 (planned short-range imple-mentation projects) produce a benefit-cost ratio of over 4:1. The B/C ratio is lowered by the high cost of the toll lane extension.
Scenarios 7 and 8 (advanced ramp metering with connector metering) produce a benefit-cost ratio of nearly 5:1.
Scenarios 11 and 12 (direct HOV/HOT connec-tors) produces a low ratio of below 1, due mainly to the high cost and benefits limited to a point loca-tion in the corridor. Consistent with standard bene-fit-cost methodology, toll revenue is not included in the benefit-cost calculation.
Scenario 13 (capital expansion project) produces a B/C of less than 1, mainly due to the high cost and limited benefits from nominal remaining con-gestion to reduce.
The benefit-cost ratio of all the scenarios com-bined is about 3:1. If all the projects are delivered at current cost estimates, the public will get three dollars of benefits for each dollar expended. In current dollars, costs add to around $1.8 billion whereas the benefits are estimated to be almost $5.0 billion.
The projects also alleviate greenhouse gas (GHG) emissions by over 3.3 million tons over 20 years, averaging nearly 165,000 tons reduced per year.. The emissions reductions are estimated in Cal-B/C using data from the California Air Resources Board (CARB) Emissions Factors (EMFAC) model.
Exhibit ES-26: Scenario Benefit/Cost (B/C) Results
Low Medium Medium‐High High Very High
<1 ≥1 and <2 ≥2 and <5 ≥5 and <10 >10
1/2
Fully‐funded and committed projects w/o SR‐57
off‐ramp queue backup
3/4 HOV conversion to continuous access
5/6 Gypsum Cyn IC + Toll Lane ext. I‐15
7/8 Advanced ramp metering
11/12 HOV/HOT direct connectors
13
Capital Expansion (Add 1 GP from SR57 to
SR55+SR55 IC)
Scenario Scenario Description
Benefit/Cost Ranges

32 S T A T E R O U T E 9 1 c o r r i d o r s y s t e m m a n a g e m e n t p l a n
C S M P E x e c u t i v e S u m m a r y
7. Conclusions and Recommendations This section summarizes the conclusions and rec-
ommendations based on the analysis presented.
Many of these conclusions are based on the micro-
simulation model results. The model was developed
based on the best data available at the time. After a
thorough and careful review of each incremental
step and analysis, the study team believes that both
the calibration and the scenario results are reason-
able and allow for more informed decision-making.
However, caution should always be used when mak-
ing decisions based on modeling alone. There are
engineering and professional judgment and experi-
ence, among other technical factors to take into con-
sideration in making the most effective project deci-
sions that affect millions, if not billions, of dollars in
investment. Project decisions are based on a combi-
nation of regional and inter-regional plans and
needs, regional and local acceptance for the project,
availability of funding, planning and engineering re-
quirements.
Based on these results, the study team offers the
following conclusions and recommendations:
Although the costs of completed or programmed and committed projects (including CMIA) in Sce-narios 1 and 2 are high at over $350 million com-bined, the model results indicate that benefits could outweigh costs by over 10:1 with benefits exceeding $3.5 billion over a 20-year lifecycle. These projects produce significant returns on investment.
The benefit-cost ratios for other scenarios range from low to moderate. Low-cost improvements, such as advanced ramp metering with connector metering, seem to show relatively reasonable investment results. Other improvements may need to consider other factors.
Enhanced incident management shows promise. Over the course of a year, the delay savings could be substantial when both peak and off-peak benefits are considered.
There is very little noticeable congestion by year 2020 after all of the scenarios are implemented. A small amount of congestion at Gypsum Can-yon on-ramp remains in the eastbound direction in the PM peak period. Westbound, three AM period congested locations remain at Gypsum Canyon Road, State College Boulevard, and Brookhurst Street. Since the CSMP horizon year model is for 2020, further study or other methodology may be needed to assess the benefits of addressing demand beyond 2020.
This is the first-generation CSMP for the SR-91 corri-
dor. It is important to emphasize that CSMPs should
be updated, on a regular basis, if possible. This is
particularly important since traffic conditions and pat-
terns can differ from current projections. After pro-
jects are delivered, it is also useful to compare actual
results with estimated ones in this document so that
models can be further improved as appropriate.
CSMPs, or some variation, should become the nor-
mal course of business that includes detailed per-
formance assessments, an in-depth understanding
of the reasons for performance deterioration, and an
analytical framework that allows for evaluating com-
plementary operational strategies that maximize sys-
tem productivity.

S T A T E R O U T E 9 1 c o r r i d o r s y s t e m m a n a g e m e n t p l a n 33
C S M P E x e c u t i v e S u m m a r y
Exhibit ES-27: District 12 CSMP Team Organization Chart