Embed Size (px)
Citation preview
December
CPLAN
STATEPerformance
Part Bonnecticut
2005
RevisedFebruary
2010
Connecticut State Department of EducationDivision of Family and Student Support Services
Bureau of Special Education

Table of Contents Overview of State Performance Plan Development
Broad Input from Stakeholders i Public Dissemination i-ii Revisions Made ii
Monitoring Priority: FAPE in the LRE
Indicator 1: Graduation 1-5 Indicator 2: Dropouts 6-10 Indicator 3: Participation and Performance on Statewide Assessments 11-17 Indicator 4: Suspension and Expulsion 18-24 Indicator 5: Removal from Regular Class 25-32 Indicator 6: Preschool Settings 33-42 Indicator 7: Preschool Social, Knowledge and Behavior Skills 43-62 Indicator 8: Parent Involvement 63-69
Monitoring Priority: Disproportionality
Indicator 9: Districts with Disproportionate Representation in Special Education and Related Services 70-77
Indicator 10: Districts with Disproportionate Representation in Specific Disability Categories 78-86
Monitoring Priority: Effective General Supervision Part B
Indicator 11: Evaluation Timeline 87-92 Indicator 12: IEPs Implemented at Age 3 93-96 Indicator 13: IEP Goals and Transition Services 97-101 Indicator 14: Post-Graduation Data 102-108 Indicator 15: General Supervision 109-118 Indicator 16: Complaints 119-121 Indicator 17: Due Process Hearing Requests 122-125 Indicator 18: Resolution Session Agreements 126-128 Indicator 19: Mediation Agreements 129-131 Indicator 20: Timely and Accurate Reporting 132-134
Appendix CT Special Education Parent Survey 135-138 Sampling Plan 139-143 CT Special Education Exiter Survey 144-145

i
Overview of the State Performance Plan Development Updated February 2010 Broad Input from Stakeholders: With the first submission of the State Performance Plan (SPP) in December 2005, the Connecticut State Department of Education (CSDE) divided the 20 indicators into six categories for its SPP. In its updated revision of the SPP, the CSDE reorganized its workgroups to reflect seven groups. Each category was designated as a work group with at least one CSDE consultant facilitating each. The work groups are:
• General Supervision – indicators 11, 15, 16, 17, 18, 19, 20 • Early Childhood – indicators 6, 7, 12 • Parent Involvement – indicator 8 • Free Appropriate Public Education (FAPE) in the Least Restrictive Environment (LRE) –
indicator 5 • Academic Accomplishment – indicators 3, 9, 10 • School Engagement and Completion – indicators 1, 2, 4 • Secondary Transition – indicators 13, 14
Personnel from the CSDE continued to invite the members of the former Connecticut Continuous Improvement Planning Team (CIPT) via the stakeholder groups to participate in making recommendations for revisions to the SPP and analyzing data for reporting in the Annual Performance Report (APR). These stakeholder groups were culturally and geographically diverse and contained a wide range of expertise and views. Each work group also included an employee of the State Education Resource Center (SERC), our training and technical assistance center. Additionally, general education personnel from the CSDE who have expertise and perspective with a particular indicator were invited to join each work group. CSDE personnel then reviewed each work group composition to ensure that parents of students with disabilities, district representatives, other state agencies, higher education, State Advisory Council and Connecticut’s Comprehensive System of Personnel Development (CSPD) were represented on the work groups. The consultant assigned as work group manager oversaw the annual work plan, progress toward completing activities and the evaluation of outcomes. Relevant stakeholders participated by reviewing previous action plans and making strategic recommendations for sustaining best practices, closing existing gaps, and securing resources to ensure successful completion. Public Dissemination: The updated SPP and APR will be posted on the CSDE’s Web site. Written communication bringing attention to the revised SPP and APR will be provided to each local education agency (LEA) and to parent organizations including, but not limited to, the state’s Parent Training and Information (PTI) Center, African and Caribbean American Parents of Children with Disabilities (AFCAMP), ARC of Connecticut and Padres Abriendo Puertas (PAP), as well as institutes of higher education throughout the state that have educator preparation programs, the State Advisory Council (SAC), the Department of Mental Health and Addiction Services (DMHAS), the Connecticut Birth to Three System, the Department of Children and Families (DCF), the

ii
Department of Developmental Services (formerly Department of Mental Retardation) and the Commission on Children. The CSDE will report annually to the public on the performance of each local education agency located in the state on the targets in the SPP through the District Annual Performance Reports, which will be posted on the CSDE’s Web site and announced in the Bureau of Special Education’s Bureau Bulletin. The updated SPP and subsequent APRs will be shared with the Connecticut State Board of Education for discussion. Revisions Made: Due to the reorganization the CSDE underwent in June 2009, the Bureau of School and District Improvement and the Bureau of Accountability, Compliance and Monitoring have been combined and are now the Bureau of Accountability and Improvement. Similarly, the Bureau of Curriculum and Instruction and the Bureau of Early Childhood are now the Bureau of Teaching and Learning. Any changes or revisions made within SPP indicators are specified, with an explanation and justification for those changes or revisions in the Annual Performance Report submitted February 2010.

SPP Template – Part B (3) Connecticut State
Part B State Performance Plan: 2005-2010 Monitoring Priority: FAPE in the LRE – Page 1 (OMB NO: 1820-0624 / Expiration Date: 2/29/2012) Indicator 1 – Graduation
Part B State Performance Plan (SPP) for 2005-2010
Overview of the State Performance Plan Development:
See Overview page i
(The following items are to be completed for each monitoring priority/indicator.)
Monitoring Priority: FAPE in the LRE
Indicator 1: Percent of youth with IEPs graduating from high school with a regular diploma.
(20 U.S.C. 1416 (a)(3)(A))
Measurement: States must report using the graduation rate calculation and timeline established by the Department under the ESEA.
Overview of Issue/Description of System or Process:
In 2005-2006 and subsequent years, the Connecticut State Department of Education (CSDE) implemented a statewide register/unregister process for use with the Public School Information System (PSIS). This process allows the CSDE to utilize a single mechanism for collecting all students’ exit data for general and special education students. Use of a single process for all public school systems will provide for increased accuracy, consistency and timeliness for reports relating to graduation and dropout information.
A state issued and approved diploma defines graduation with a regular high school diploma. Graduation with a General Educational Development (GED) or a Certificate of Completion does not constitute graduation with a regular high school diploma. A minimum of twenty credits is required for graduation with a regular high school diploma, including no fewer than four of which shall be in English, not fewer than three in mathematics, not fewer than three in social studies, including at least a one-half credit course on civics and American government, not fewer than two in science, not fewer than one in the arts or vocational education and not fewer than one in physical education. In 2001, Connecticut General Statutes were revised to require that by September 1, 2002, each district had to specify basic skill levels necessary for graduation for classes graduating 2006 and later, and the district had to specify a process for assessing competency. This process needed to include, but could not be limited to, assessment on the statewide Grade 10 Connecticut Academic Performance Test (CAPT). Districts were also required to create a course of study for students unsuccessful in meeting these competency requirements so they could reach a satisfactory level of competency before graduation. The same rules are applicable for youth with IEPs.
The formula for calculating graduation rates is: the number of students with disabilities who graduate with a regular high school diploma in a given year divided by the sum of the number of students with disabilities who graduated with a regular high school diploma plus the number of students with disabilities reported as having dropped out of school in the previous four reporting
SPP Template – Part B (3) Connecticut State
Part B State Performance Plan: 2005-2010 Monitoring Priority: FAPE in the LRE – Page 2 (OMB NO: 1820-0624 / Expiration Date: 2/29/2012) Indicator 1 – Graduation
cycles (4CB
A+
). This formula is used to calculate Connecticut graduation rates for both special
education students and all students (general education and special education totals combined). In 2010, this graduation formula is expected to change for all students and special education students as the CSDE starts reporting a “graduation in the standard number of years” rate.
Baseline Data for FFY 2004 (2004-2005):
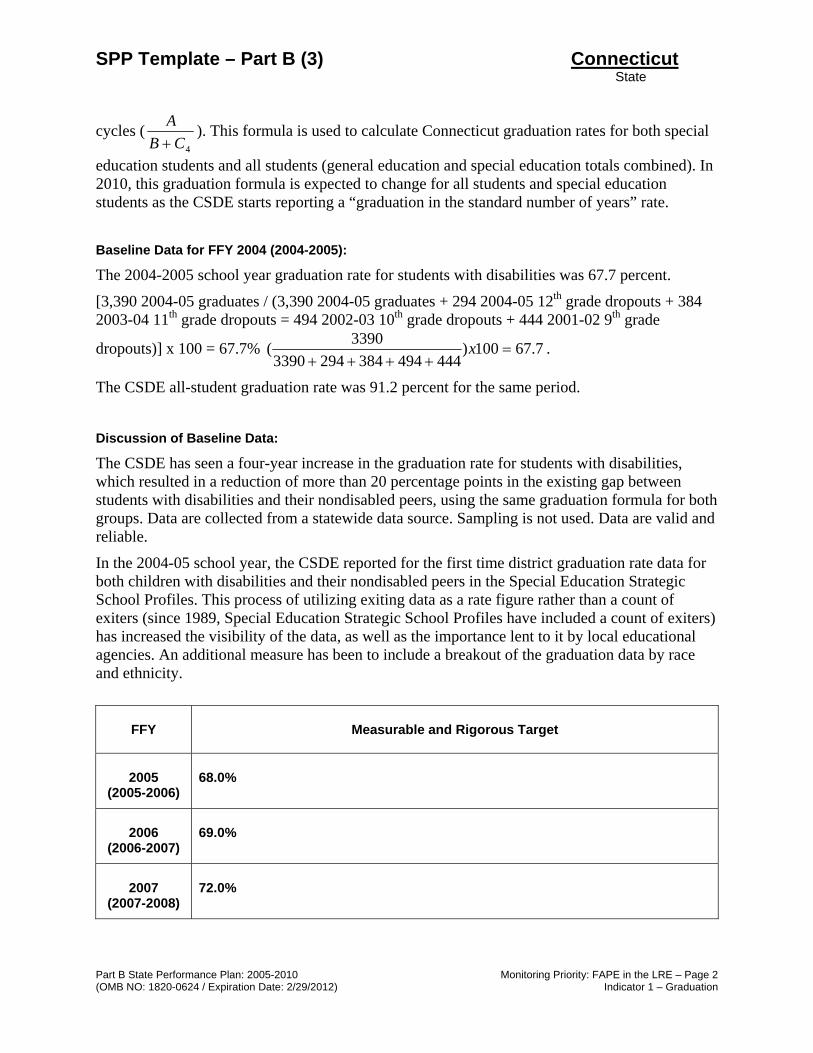
The 2004-2005 school year graduation rate for students with disabilities was 67.7 percent.
[3,390 2004-05 graduates / (3,390 2004-05 graduates + 294 2004-05 12th grade dropouts + 384 2003-04 11th grade dropouts = 494 2002-03 10th grade dropouts + 444 2001-02 9th grade
dropouts)] x 100 = 67.7% 7.67100)4444943842943390
3390( =++++
x .
The CSDE all-student graduation rate was 91.2 percent for the same period.
Discussion of Baseline Data:
The CSDE has seen a four-year increase in the graduation rate for students with disabilities, which resulted in a reduction of more than 20 percentage points in the existing gap between students with disabilities and their nondisabled peers, using the same graduation formula for both groups. Data are collected from a statewide data source. Sampling is not used. Data are valid and reliable.
In the 2004-05 school year, the CSDE reported for the first time district graduation rate data for both children with disabilities and their nondisabled peers in the Special Education Strategic School Profiles. This process of utilizing exiting data as a rate figure rather than a count of exiters (since 1989, Special Education Strategic School Profiles have included a count of exiters) has increased the visibility of the data, as well as the importance lent to it by local educational agencies. An additional measure has been to include a breakout of the graduation data by race and ethnicity.
FFY Measurable and Rigorous Target
2005 (2005-2006)
68.0%
2006 (2006-2007)
69.0%
2007 (2007-2008)
72.0%

SPP Template – Part B (3) Connecticut State
Part B State Performance Plan: 2005-2010 Monitoring Priority: FAPE in the LRE – Page 3 (OMB NO: 1820-0624 / Expiration Date: 2/29/2012) Indicator 1 – Graduation
2008 (2008-2009)
75.0%
2009 (2009-2010)
78.0%
2010 (2010-2011)
80%
Improvement Activities/Timelines/Resources:
Improvement Activities Timelines Resources
1.5 Meet with State Education Resource Center (SERC) staff to discuss statewide and district-specific activities and training to address graduation and dropout.
2005-06 school year through 2011
• Allocate a portion of IDEA funds awarded to SERC to provide professional development.
• CSDE personnel • SERC personnel • CSPD Council • Plan statewide summit to target
districts with low rates of student graduation
• CALI • SRBI • PBIS
1.6 Use the resources and technical assistance of the National Dropout Prevention Center.
2005-06 school year through 2011
• The National Dropout Prevention Center
1.7 (Revised) Assign a consultant from the Bureau of Special Education for dropout prevention and graduation for students with disabilities. This person will work with the CSDE and other state agencies to strengthen and promote interagency collaboration.
July 2006 through Fall 2008
• CSDE personnel • Connecticut Department of
Children and Families personnel • Connecticut Department of
Mental Health and Addiction Services personnel
• Connecticut Department of Justice, Court Support Services Division
1.8 Disseminate data to all school districts via District Annual Performance Reports and the Strategic School Profiles. Data are available on the CSDE website.
2006-07 school year through 2011
• Department personnel
SPP Template – Part B (3) Connecticut State
Part B State Performance Plan: 2005-2010 Monitoring Priority: FAPE in the LRE – Page 4 (OMB NO: 1820-0624 / Expiration Date: 2/29/2012) Indicator 1 – Graduation
Improvement Activities Timelines Resources
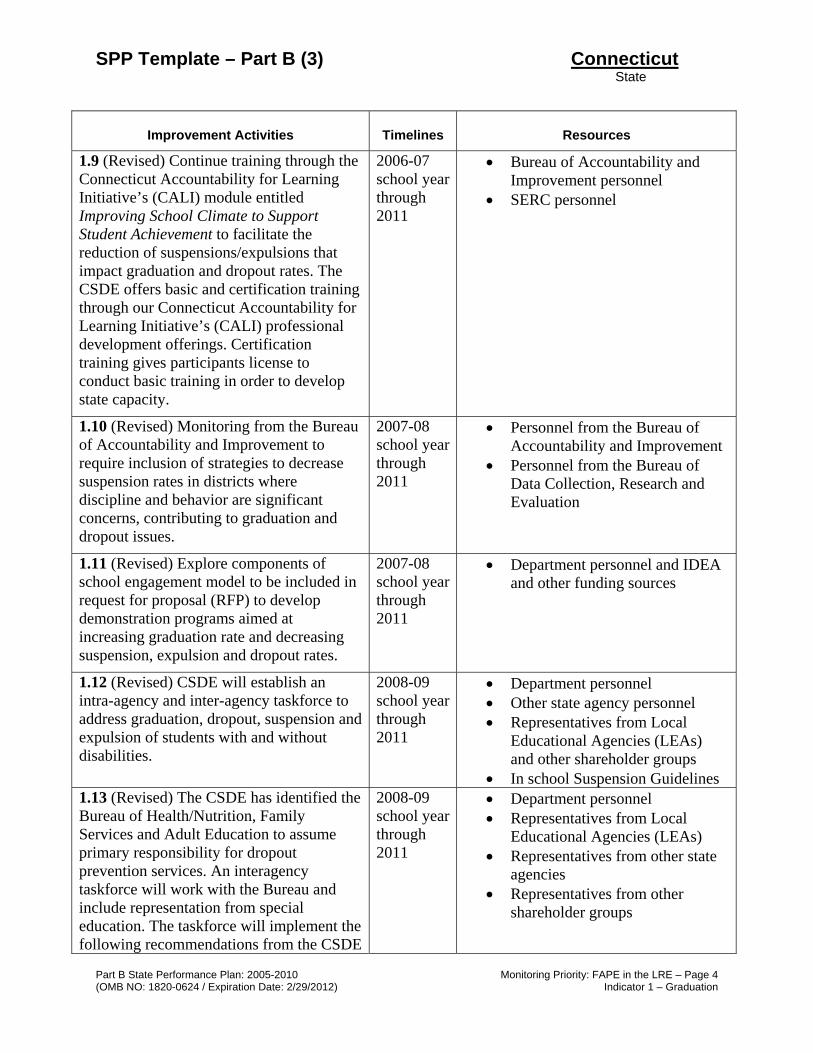
1.9 (Revised) Continue training through the Connecticut Accountability for Learning Initiative’s (CALI) module entitled Improving School Climate to Support Student Achievement to facilitate the reduction of suspensions/expulsions that impact graduation and dropout rates. The CSDE offers basic and certification training through our Connecticut Accountability for Learning Initiative’s (CALI) professional development offerings. Certification training gives participants license to conduct basic training in order to develop state capacity.
2006-07 school year through 2011
• Bureau of Accountability and Improvement personnel
• SERC personnel
1.10 (Revised) Monitoring from the Bureau of Accountability and Improvement to require inclusion of strategies to decrease suspension rates in districts where discipline and behavior are significant concerns, contributing to graduation and dropout issues.
2007-08 school year through 2011
• Personnel from the Bureau of Accountability and Improvement
• Personnel from the Bureau of Data Collection, Research and Evaluation
1.11 (Revised) Explore components of school engagement model to be included in request for proposal (RFP) to develop demonstration programs aimed at increasing graduation rate and decreasing suspension, expulsion and dropout rates.
2007-08 school year through 2011
• Department personnel and IDEA and other funding sources
1.12 (Revised) CSDE will establish an intra-agency and inter-agency taskforce to address graduation, dropout, suspension and expulsion of students with and without disabilities.
2008-09 school year through 2011
• Department personnel • Other state agency personnel • Representatives from Local
Educational Agencies (LEAs) and other shareholder groups
• In school Suspension Guidelines 1.13 (Revised) The CSDE has identified the Bureau of Health/Nutrition, Family Services and Adult Education to assume primary responsibility for dropout prevention services. An interagency taskforce will work with the Bureau and include representation from special education. The taskforce will implement the following recommendations from the CSDE
2008-09 school year through 2011
• Department personnel • Representatives from Local
Educational Agencies (LEAs) • Representatives from other state
agencies • Representatives from other
shareholder groups

SPP Template – Part B (3) Connecticut State
Part B State Performance Plan: 2005-2010 Monitoring Priority: FAPE in the LRE – Page 5 (OMB NO: 1820-0624 / Expiration Date: 2/29/2012) Indicator 1 – Graduation
Improvement Activities Timelines Resources
report to the State Board of Education titled A Review of Programs for Reducing the Dropout and Suspension Rates of Those Children At Risk of Dropping Out or Being Suspended from School:
1. Conduct in depth analysis of dropout and suspension data among Connecticut’s School children;
2. Identify individuals in the state with expertise in dropout prevention and reach out to national consultant;
3. Complete and analysis of local programs in Connecticut to identify exemplary models; and
4. Promote the use of Scientific Research-based Intervention (SRBI) to identify youth at risk of dropping out of school.
1.14 The Connecticut proposals for secondary school reform will impact the graduation requirements. In addition to the IEP, the “Student Success Plan,” which includes features of the IEP and advisor-advisee programs, will be implemented to ensure that students with disabilities have appropriate post-secondary outcomes.
2008-09 school year through 2011
• Department personnel • Proposed state legislation
1.15 (Revised) In collaboration with the Governor’s P-20 Council, conduct a Dropout Prevention Summit.
Fall 2009 • Department personnel • Representatives from Local
Educational Agencies (LEAs) • Representatives from other state
agencies • Representatives from other
shareholder groups • Grant Funds from America’s
Promise Alliance • Grant funds from State Farm
Insurance • Re-allocated funds within CSDE

SPP Template – Part B (3) Connecticut State
Part B State Performance Plan: 2005-2010 Monitoring Priority: FAPE in the LRE – Page 6 (OMB NO: 1820-0624 / Expiration Date: 2/29/2012) Indicator 2 – Dropout
Part B State Performance Plan (SPP) for 2005-2010
Overview of the State Performance Plan Development:
See Overview page i (The following items are to be completed for each monitoring priority/indicator.)
Monitoring Priority: FAPE in the LRE
Indicator 2: Percent of youth with IEPs dropping out of high school.
(20 U.S.C. 1416 (a)(3)(A))
Measurement: States must report using the dropout data used in the ESEA graduation rate calculation and follow the timeline established by the Department under the ESEA.
Overview of Issue/Description of System or Process:
A required statewide register/unregister process associated with the State’s existing Public School Information System (PSIS) database was be piloted in the 2005-06 school year and is mandatory for all districts in the 2006-07 school year. This new process will allow the Department to collect all students’ exit data, for both general and special education students, through one mechanism. This new system is anticipated to allow for the tracking of student movement within the State and will greatly affect the consistency and accuracy of state graduation and dropout information.
The dropout rate calculation for students with disabilities is consistent with the formula used for all Connecticut students. The formula is calculated by dividing the number of students with disabilities, in Grades 9-12, who dropped out in a given reporting year, by the total number of active students with disabilities, Grades 9-12 in the previous reporting year. Specifically, students who drop out are defined as: (1) 16-and 17-year-old students who notify the school of their intention to withdraw, with parental permission; (2) 18-year-old students who notify the school of their intention to withdraw; (3) students who enroll in a GED program; and (4) students who withdraw from the school, without notifying the district, and for whom no transfer information or transcript is requested by another school.
Baseline Data for FFY 2004 (2004-2005):
In the 2004-05 school year, the dropout rate for students with disabilities was 5.6 percent.
(1,284 2004-05 dropouts / 22,763 students with disabilities in Grades 9-12 in 2004-05) x 100 = 5.6%
The Department all-student dropout rate was 1.7 percent for the same period.

SPP Template – Part B (3) Connecticut State
Part B State Performance Plan: 2005-2010 Monitoring Priority: FAPE in the LRE – Page 7 (OMB NO: 1820-0624 / Expiration Date: 2/29/2012) Indicator 2 – Dropout
Discussion of Baseline Data:
The Department has seen a six-year decline in the dropout rate for students with disabilities, significantly reducing the existing gap between students with disabilities and their nondisabled peers, using the same dropout formula for both groups. Data are collected from a statewide data source. Sampling is not used. Data are valid and reliable.
In the 2004-05 school year, the Department reported for the first time district dropout rate data for both students with disabilities and their nondisabled peers in the Special Education Strategic School Profiles. This process of illuminating exiting data as a rate figure rather than a count of exiters (since 1989 Special Education Strategic School Profiles have included a count of exiters) has increased the visibility of the data as well as the attention paid to it by local agencies. Additionally, a breakout of the dropout data by race and ethnicity was included.
FFY Measurable and Rigorous Target
2005 (2005-2006)
5.5%
2006 (2006-2007)
5.3%
2007 (2007-2008)
5.0%
2008 (2008-2009)
4.0%
2009 (2009-2010)
3.%
2010 (2010-2011)
2.0%
Improvement Activities/Timelines/Resources:
Improvement Activities Timelines Resources 2.5 Meet with State Education Resource Center (SERC) staff to discuss statewide and district-specific activities and training to address graduation and dropout.
2005-06 school year through 2011
• Allocate a portion of IDEA funds awarded to SERC to provide professional development activities
• Department personnel
SPP Template – Part B (3) Connecticut State
Part B State Performance Plan: 2005-2010 Monitoring Priority: FAPE in the LRE – Page 8 (OMB NO: 1820-0624 / Expiration Date: 2/29/2012) Indicator 2 – Dropout
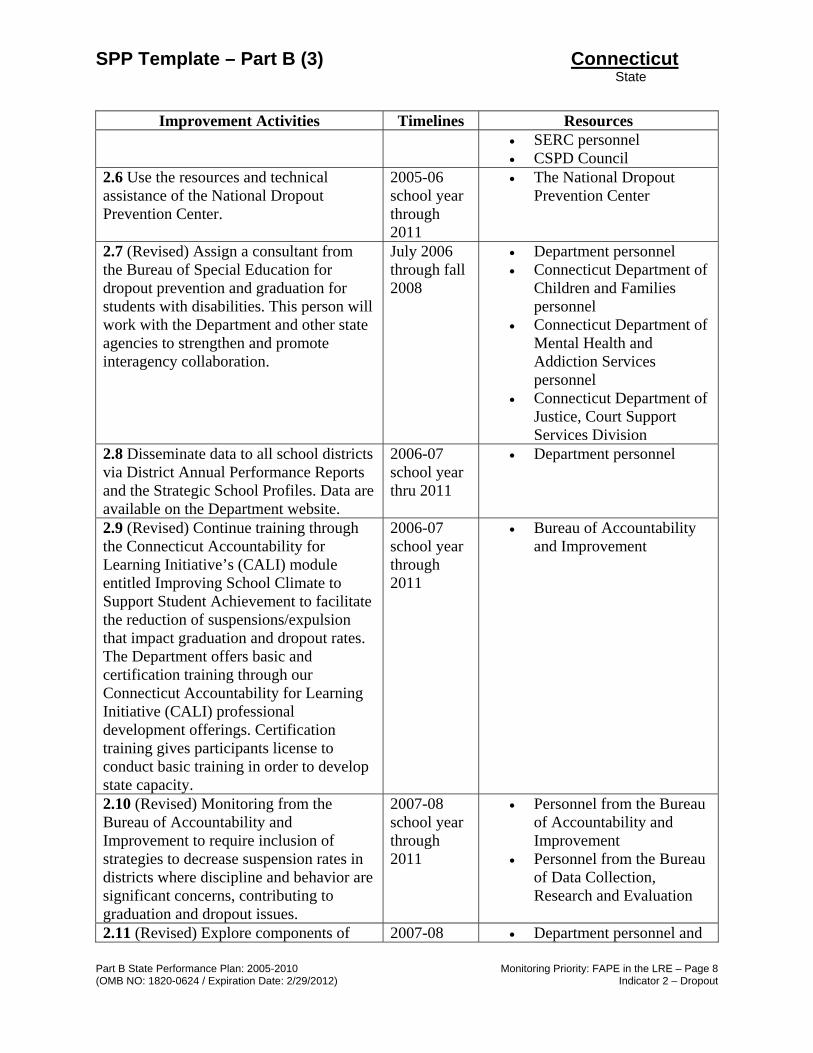
Improvement Activities Timelines Resources • SERC personnel • CSPD Council
2.6 Use the resources and technical assistance of the National Dropout Prevention Center.
2005-06 school year through 2011
• The National Dropout Prevention Center
2.7 (Revised) Assign a consultant from the Bureau of Special Education for dropout prevention and graduation for students with disabilities. This person will work with the Department and other state agencies to strengthen and promote interagency collaboration.
July 2006 through fall 2008
• Department personnel • Connecticut Department of
Children and Families personnel
• Connecticut Department of Mental Health and Addiction Services personnel
• Connecticut Department of Justice, Court Support Services Division
2.8 Disseminate data to all school districts via District Annual Performance Reports and the Strategic School Profiles. Data are available on the Department website.
2006-07 school year thru 2011
• Department personnel
2.9 (Revised) Continue training through the Connecticut Accountability for Learning Initiative’s (CALI) module entitled Improving School Climate to Support Student Achievement to facilitate the reduction of suspensions/expulsion that impact graduation and dropout rates. The Department offers basic and certification training through our Connecticut Accountability for Learning Initiative (CALI) professional development offerings. Certification training gives participants license to conduct basic training in order to develop state capacity.
2006-07 school year through 2011
• Bureau of Accountability and Improvement
2.10 (Revised) Monitoring from the Bureau of Accountability and Improvement to require inclusion of strategies to decrease suspension rates in districts where discipline and behavior are significant concerns, contributing to graduation and dropout issues.
2007-08 school year through 2011
• Personnel from the Bureau of Accountability and Improvement
• Personnel from the Bureau of Data Collection, Research and Evaluation
2.11 (Revised) Explore components of 2007-08 • Department personnel and

SPP Template – Part B (3) Connecticut State
Part B State Performance Plan: 2005-2010 Monitoring Priority: FAPE in the LRE – Page 9 (OMB NO: 1820-0624 / Expiration Date: 2/29/2012) Indicator 2 – Dropout
Improvement Activities Timelines Resources school engagement model to be included in request for proposal (RFP) to develop demonstration programs aimed at increasing graduation rate and decreasing suspension, expulsion and dropout rates.
school year through 2011
IDEA and other funding sources
2.12 (Revised) Department will establish an intra-agency and inter-agency taskforce to address graduation, dropout and suspension and expulsion of students with and without disabilities.
2008-09 school year through 2011
• Department personnel • Other state agency
personnel • Representatives from Local
Educational Agencies (LEAs) and other stakeholder groups
• In-school suspension guidelines
2.13 (Revised) The Department has identified the Bureau of Health/Nutrition, Family Services and Adult Education to assume primary responsibility for dropout prevention services. This intra-agency taskforce will work with the Bureaus of Special Education; Teaching and Learning; and Accountability and Improvement. The taskforce will implement the following recommendations:
1. Conduct in-depth analyses of dropout and suspension data among Connecticut’s school children.
2. Identify individuals in the state with expertise in dropout prevention and reach out to national consultant.
3. Complete an analysis of local programs in Connecticut to identify exemplary models.
4. Promote the use of Scientific Research-based Intervention (SRBI) to identify youths at risk of dropping out of school.
2008-09 school year through 2011
• Department personnel • Representatives from
LEAs • Representatives from other
state agencies • Representatives from
community groups
2.14 The Connecticut proposal for secondary school reform will impact the graduation requirements. In addition to the IEP, the “Student Success Plan,”
2008-09 school year through 2011
• Department personnel • Proposed State legislation

SPP Template – Part B (3) Connecticut State
Part B State Performance Plan: 2005-2010 Monitoring Priority: FAPE in the LRE – Page 10 (OMB NO: 1820-0624 / Expiration Date: 2/29/2012) Indicator 2 – Dropout
Improvement Activities Timelines Resources which includes features of the IEP and advisor–advisee programs, will be implemented to ensure that students with disabilities have appropriate post-school outcomes. 2.15 (Revised) In collaboration with the Governor’s P-20 Council, conduct a Dropout Prevention Summit.
Fall 2009 • Department personnel • Representatives from
LEAs • Representatives from other
state agencies • Representatives from other
shareholder groups • Grant Funds from
America’s Promise Alliance
• Grant funds from State Farm Insurance
• Re-allocated funds within Department
SPP Template – Part B (3) CONNECTICUT State
Part B State Performance Plan: 2005-2010 Monitoring Priority: FAPE in the LRE – Page 11 (OMB NO: 1820-0624 / Expiration Date: 2/29/2012) Indicator 3 – Assessment
Part B State Performance Plan (SPP) for 2005-2010
Overview of the State Performance Plan Development:
See Overview, Page i (The following items are to be completed for each monitoring priority/indicator.)
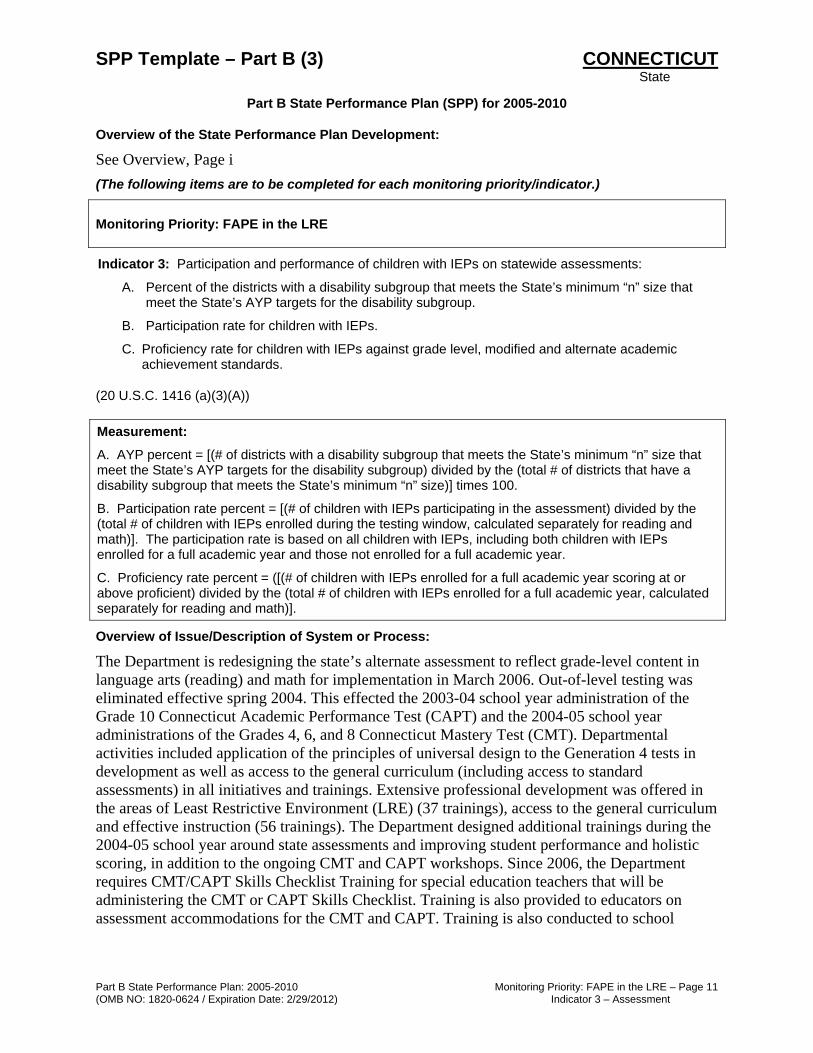
Monitoring Priority: FAPE in the LRE
Indicator 3: Participation and performance of children with IEPs on statewide assessments:
A. Percent of the districts with a disability subgroup that meets the State’s minimum “n” size that meet the State’s AYP targets for the disability subgroup.
B. Participation rate for children with IEPs.
C. Proficiency rate for children with IEPs against grade level, modified and alternate academic achievement standards.
(20 U.S.C. 1416 (a)(3)(A))
Measurement:
A. AYP percent = [(# of districts with a disability subgroup that meets the State’s minimum “n” size that meet the State’s AYP targets for the disability subgroup) divided by the (total # of districts that have a disability subgroup that meets the State’s minimum “n” size)] times 100.
B. Participation rate percent = [(# of children with IEPs participating in the assessment) divided by the (total # of children with IEPs enrolled during the testing window, calculated separately for reading and math)]. The participation rate is based on all children with IEPs, including both children with IEPs enrolled for a full academic year and those not enrolled for a full academic year.
C. Proficiency rate percent = ([(# of children with IEPs enrolled for a full academic year scoring at or above proficient) divided by the (total # of children with IEPs enrolled for a full academic year, calculated separately for reading and math)].
Overview of Issue/Description of System or Process:
The Department is redesigning the state’s alternate assessment to reflect grade-level content in language arts (reading) and math for implementation in March 2006. Out-of-level testing was eliminated effective spring 2004. This effected the 2003-04 school year administration of the Grade 10 Connecticut Academic Performance Test (CAPT) and the 2004-05 school year administrations of the Grades 4, 6, and 8 Connecticut Mastery Test (CMT). Departmental activities included application of the principles of universal design to the Generation 4 tests in development as well as access to the general curriculum (including access to standard assessments) in all initiatives and trainings. Extensive professional development was offered in the areas of Least Restrictive Environment (LRE) (37 trainings), access to the general curriculum and effective instruction (56 trainings). The Department designed additional trainings during the 2004-05 school year around state assessments and improving student performance and holistic scoring, in addition to the ongoing CMT and CAPT workshops. Since 2006, the Department requires CMT/CAPT Skills Checklist Training for special education teachers that will be administering the CMT or CAPT Skills Checklist. Training is also provided to educators on assessment accommodations for the CMT and CAPT. Training is also conducted to school

SPP Template – Part B (3) CONNECTICUT State
Part B State Performance Plan: 2005-2010 Monitoring Priority: FAPE in the LRE – Page 12 (OMB NO: 1820-0624 / Expiration Date: 2/29/2012) Indicator 3 – Assessment
personnel on making adequate yearly progress (AYP) for students with disabilities. This training is focused on those schools that have not made AYP for students with disabilities. The Connecticut Accountability for Learning Initiative (CALI) contains the Department’s professional development which is aligned to state standards and assessments. This is a state priority as it is aligned with Connecticut accountability legislation. Schools and districts that have not made AYP have access to these offerings. It is also required that districts in year 3 of not making AYP develop a data team structure, which includes district, school, grade and content level teams, as their accountability mechanism. Beginning in 2007-08, the Department monitors the data team structures within these districts.
Baseline Data for FFY 2004 (2004-2005): In the school year 2004 – 05: 3A: In Connecticut, 39.4 percent of districts met the state’s AYP objectives for special education students for the CMT (Grades 4, 6, and 8) and 45.0 percent of districts met the state’s AYP objectives for special education students for the CAPT (Grade 10). 3B: Average Participation Rate for students with disabilities = 97.1 percent 3C: Average Proficiency for students with disabilities = 35.0 percent Discussion of Baseline Data: 3A: Forty-one of 104 districts in Connecticut (with at least 40 students with disabilities), or
39.4 percent of districts met the state’s AYP objectives for special education students for the CMT (Grades 4, 6, & 8). Sixty-three districts did not meet the state’s AYP objectives for special education students for the CMT (Grades 4, 6, and 8).
Eighteen of 40 districts in Connecticut (with at least 40 students with disabilities), or 45.0 percent of districts met the state’s AYP objectives for special education students for the CAPT (Grade 10). Twenty-two districts did not meet the state’s AYP objectives for special education students for the CAPT (Grade 10).
3B: a. = 21,541 students with IEPs b. = 19,638 students took the standard math assessment b. = 19,654 students took the standard reading assessment c. = 0
d. = 0 e. = 1,291 students took the alternate assessment Unaccounted for students = 612 in math and 596 in reading. These students were absent or exempt due to English Language Learner (ELL) status. Math Participation: (19,638 + 1291) / 21,541 x 100 = 97.2% Reading Participation: (19,654 + 1291) / 21,541 x 100 = 97.2%
3C: a. = 21,541 students with IEPs b. = 7,397 students took the standard math assessment

SPP Template – Part B (3) CONNECTICUT State
Part B State Performance Plan: 2005-2010 Monitoring Priority: FAPE in the LRE – Page 13 (OMB NO: 1820-0624 / Expiration Date: 2/29/2012) Indicator 3 – Assessment
b. = 6,159 students took the standard reading assessment c. = 0
d. = 0 e. = 659 students were proficient on the math alternate assessment e. = 861 students were proficient on the reading alternate assessment
Math Proficiency: (7397 + 659) / 21,541 x 100 = 37.4% Reading Proficiency: (6159 + 861) / 21,541 x 100 = 32.6% Average Proficiency for students with disabilities = 35.0%
FFY Measurable and Rigorous Target
2005 (2005-2006)
3A: 35.0% 3B: 95.0% 3C: CMT reading = 68.0% CMT math = 74.0% CAPT reading = 72.0% CAPT math = 69.0%
2006 (2006-2007)
3A: 37.5% 3B: 96.0% 3C: CMT reading = 68.0% CMT math = 74.0% CAPT reading = 72.0% CAPT math = 69.0%
2007 (2007-2008)
3A: 40.0% 3B: 97.0% 3C: CMT reading = 79.0% CMT math = 82.0% CAPT reading = 81.0% CAPT math = 80.0%
2008 (2008-2009)
3A: 50.0% 3B: 95.0% 3C: CMT reading = 79.0% CMT math = 82.0% CAPT reading = 81.0% CAPT math = 80.0%
2009 (2009-2010)
3A: 60.0% 3B: 95.0% 3C: CMT reading = 79.0% CMT math = 82.0% CAPT reading = 81.0% CAPT math = 80.0%
2010 (2010-2011)
3A: 70.0% 3B: 95.0% 3C: CMT reading = 89.0% CMT math = 91.0% CAPT reading = 91.0% CAPT math = 90.0%
Improvement Activities/Timelines/Resources:
Improvement Activities Timelines Resources 3.1 Provide Step by Step for Inclusive Schools © training to targeted districts and available statewide.
2005-06 school year
• SERC
SPP Template – Part B (3) CONNECTICUT State
Part B State Performance Plan: 2005-2010 Monitoring Priority: FAPE in the LRE – Page 14 (OMB NO: 1820-0624 / Expiration Date: 2/29/2012) Indicator 3 – Assessment
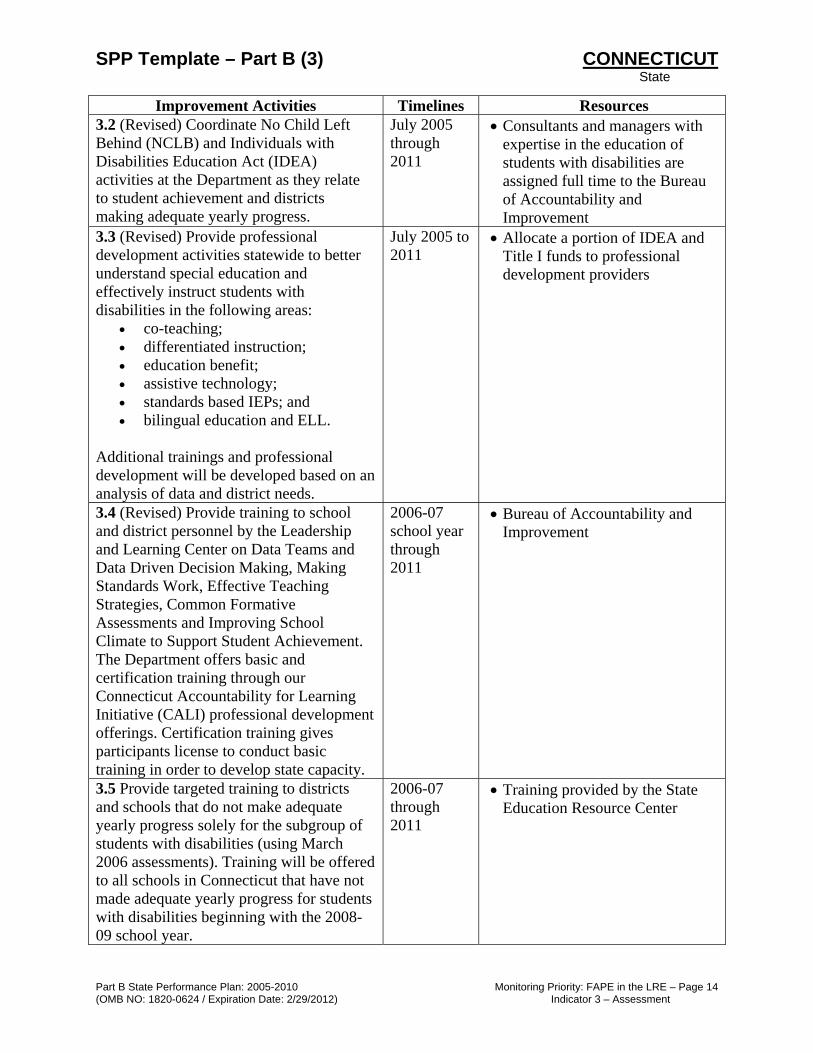
Improvement Activities Timelines Resources 3.2 (Revised) Coordinate No Child Left Behind (NCLB) and Individuals with Disabilities Education Act (IDEA) activities at the Department as they relate to student achievement and districts making adequate yearly progress.
July 2005 through 2011
• Consultants and managers with expertise in the education of students with disabilities are assigned full time to the Bureau of Accountability and Improvement
3.3 (Revised) Provide professional development activities statewide to better understand special education and effectively instruct students with disabilities in the following areas:
• co-teaching; • differentiated instruction; • education benefit; • assistive technology; • standards based IEPs; and • bilingual education and ELL.
Additional trainings and professional development will be developed based on an analysis of data and district needs.
July 2005 to 2011
• Allocate a portion of IDEA and Title I funds to professional development providers
3.4 (Revised) Provide training to school and district personnel by the Leadership and Learning Center on Data Teams and Data Driven Decision Making, Making Standards Work, Effective Teaching Strategies, Common Formative Assessments and Improving School Climate to Support Student Achievement. The Department offers basic and certification training through our Connecticut Accountability for Learning Initiative (CALI) professional development offerings. Certification training gives participants license to conduct basic training in order to develop state capacity.
2006-07 school year through 2011
• Bureau of Accountability and Improvement
3.5 Provide targeted training to districts and schools that do not make adequate yearly progress solely for the subgroup of students with disabilities (using March 2006 assessments). Training will be offered to all schools in Connecticut that have not made adequate yearly progress for students with disabilities beginning with the 2008-09 school year.
2006-07 through 2011
• Training provided by the State Education Resource Center
SPP Template – Part B (3) CONNECTICUT State
Part B State Performance Plan: 2005-2010 Monitoring Priority: FAPE in the LRE – Page 15 (OMB NO: 1820-0624 / Expiration Date: 2/29/2012) Indicator 3 – Assessment
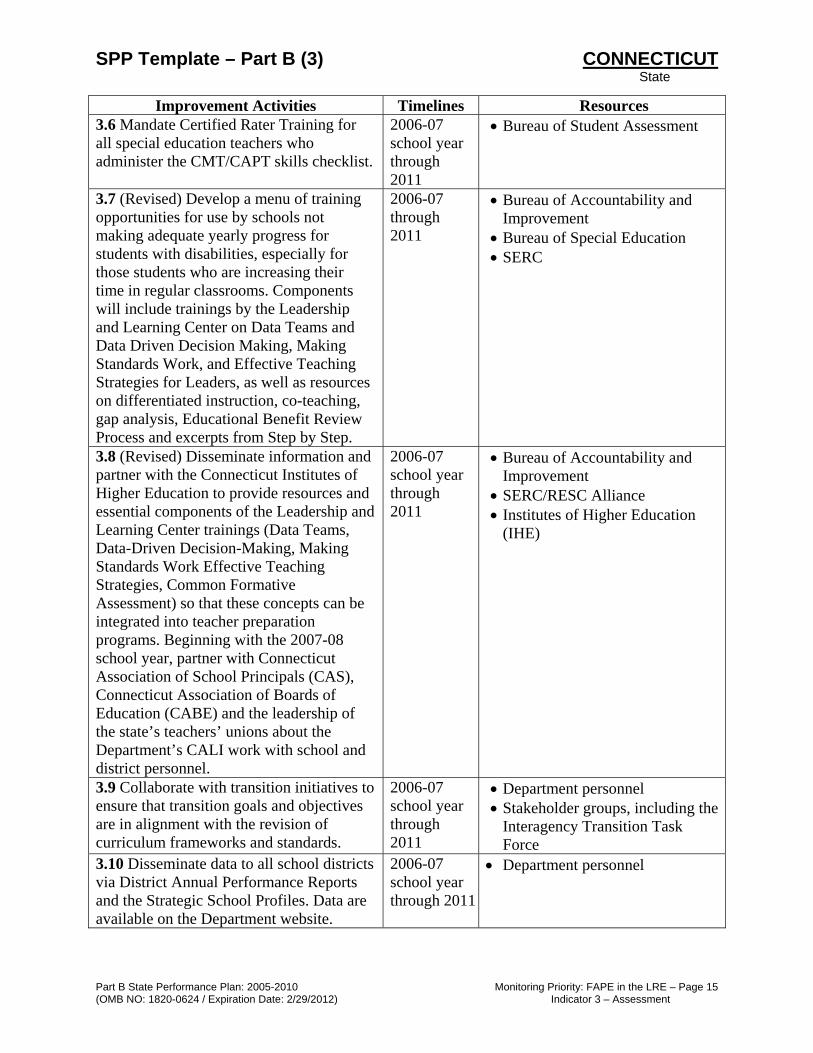
Improvement Activities Timelines Resources 3.6 Mandate Certified Rater Training for all special education teachers who administer the CMT/CAPT skills checklist.
2006-07 school year through 2011
• Bureau of Student Assessment
3.7 (Revised) Develop a menu of training opportunities for use by schools not making adequate yearly progress for students with disabilities, especially for those students who are increasing their time in regular classrooms. Components will include trainings by the Leadership and Learning Center on Data Teams and Data Driven Decision Making, Making Standards Work, and Effective Teaching Strategies for Leaders, as well as resources on differentiated instruction, co-teaching, gap analysis, Educational Benefit Review Process and excerpts from Step by Step.
2006-07 through 2011
• Bureau of Accountability and Improvement
• Bureau of Special Education • SERC
3.8 (Revised) Disseminate information and partner with the Connecticut Institutes of Higher Education to provide resources and essential components of the Leadership and Learning Center trainings (Data Teams, Data-Driven Decision-Making, Making Standards Work Effective Teaching Strategies, Common Formative Assessment) so that these concepts can be integrated into teacher preparation programs. Beginning with the 2007-08 school year, partner with Connecticut Association of School Principals (CAS), Connecticut Association of Boards of Education (CABE) and the leadership of the state’s teachers’ unions about the Department’s CALI work with school and district personnel.
2006-07 school year through 2011
• Bureau of Accountability and Improvement
• SERC/RESC Alliance • Institutes of Higher Education
(IHE)
3.9 Collaborate with transition initiatives to ensure that transition goals and objectives are in alignment with the revision of curriculum frameworks and standards.
2006-07 school year through 2011
• Department personnel • Stakeholder groups, including the
Interagency Transition Task Force
3.10 Disseminate data to all school districts via District Annual Performance Reports and the Strategic School Profiles. Data are available on the Department website.
2006-07 school year through 2011
• Department personnel

SPP Template – Part B (3) CONNECTICUT State
Part B State Performance Plan: 2005-2010 Monitoring Priority: FAPE in the LRE – Page 16 (OMB NO: 1820-0624 / Expiration Date: 2/29/2012) Indicator 3 – Assessment
Improvement Activities Timelines Resources 3.11 (Revised) Evaluate prior training activities to determine future technical assistance to school districts not making adequate yearly progress.
2006-07 school year through 2011
• Bureau of Accountability and Improvement
• SERC • RESC • IHE
3.12 (Revised) Develop publication and conduct statewide training on Scientific Research-Based Interventions (SRBI): Connecticut’s Response to Intervention Framework.
2007-08 school year through 2011
• Bureau of Accountability and Improvement
3.13 (Revised) Continue to implement legislation enacted in 2007 that focuses on school and district improvement relative to increased outcomes for all students. This law gives authority to the Department to conduct school and district assessments and monitor district improvement plans for those schools and districts that are in year 3 of not making adequate yearly progress under NCLB.
2007-08 school year through 2011
• Bureau of Accountability and Improvement
3.14 (Revised) Through the work of the Bureau of Teaching and Learning, develop tools for school personnel to improve core instruction such as grade level expectations aligned with Curriculum Frameworks, Walkthrough Protocol, and a Model for Curriculum Development and Implementation Guide.
2007-08 school year through 2011
• Bureau of Teaching and Learning
3.15 Provide training on assessment accommodations for the CMT/CAPT to ensure fidelity of implementing accommodations.
2007-08 school year through 2011
• Bureau of Student Assessment

SPP Template – Part B (3) CONNECTICUT State
Part B State Performance Plan: 2005-2010 Monitoring Priority: FAPE in the LRE – Page 17 (OMB NO: 1820-0624 / Expiration Date: 2/29/2012) Indicator 3 – Assessment
Improvement Activities Timelines Resources 3.16 (Revised) Develop math and reading benchmark assessments that would be available in the fall, winter and spring of grades 3 through 8 for educators to use with students. The assessments cover, at minimum, the math grade level expectations (GLEs) and the reading substrands of the CMT. The Connecticut benchmark assessments are computer-based, using the Measurement Incorporated Secure Test. Volunteer districts provide feedback about the system with the anticipated statewide launch date of fall 2009.
2007-08 school year through 2011
• Bureau of Teaching and Learning• Bureau of Student Assessment
3.17 Revise Connecticut curriculum frameworks and standards to make them more user-friendly to teachers.
2007-08 school year through 2011
• Department personnel
3.18 In the 2008-09 school year, the Bureau will be conducting focused monitoring visits in the area of participation and performance of students with disabilities on statewide assessments. The Focused Monitoring Steering Committee determined this to be the key performance indicator after looking at data from both compliance and performance indicators in the SPP. Focused monitoring visits in this area allows for alignment with the Bureau of Accountability, Compliance and Monitoring who conduct visits for districts for all students that are in need of improvement for four years under NCLB. Additionally, this allows districts to focus on improved outcomes for students with disabilities, in conjunction with compliance components that will occur within the visits.
2008-09 school year
• Bureau of Special Education • Focused Monitoring Steering
Committee
3.19 (New) Develop training and materials for families to assist with understanding school or district improvement planning, understanding CMT/CAPT reports, the SRBI Framework, and IEP goals and objectives aligned with the general education curriculum.
2009-10 school year, annually as needed
• Department Personnel • Connecticut Parent Advocacy
Center (CPAC)

SPP Template – Part B (3) CONNECTICUT State
Part B State Performance Plan: 2005-2010 Monitoring Priority: FAPE in the LRE – Page 18 (OMB NO: 1820-0624 / Expiration Date: 2/29/2012) Indicator 4 – Suspension and Expulsion
Part B State Performance Plan (SPP) for 2005-2010
Overview of the State Performance Plan Development:
See Overview page i (The following items are to be completed for each monitoring priority/indicator.)
Monitoring Priority: FAPE in the LRE
Indicator 4: Rates of suspension and expulsion:
A. Percent of districts identified by the State as having a significant discrepancy in the rates of suspensions and expulsions of children with disabilities for greater than 10 days in a school year; and
B. Percent of districts identified by the State as having a significant discrepancy in the rates of suspensions and expulsions of greater than 10 days in a school year of children with disabilities by race and ethnicity.
(20 U.S.C. 1416(a)(3)(A); 1412(a)22))
Measurement:
A. Percent = [(# of districts identified by the State as having significant discrepancies in the rates of suspensions and expulsions of children with disabilities for greater than 10 days in a school year) divided by the (# of districts in the state)] times 100.
B. Percent = [(# of districts identified by the State as having significant discrepancies in the rates of suspensions and expulsions for greater than 10 days in a school year of children with disabilities by race ethnicity) divided by the (# of districts in the state)] times 100.
Include State’s definition of “significant discrepancy.”
Overview of Issue/Description of System or Process:
Department consultants from the Bureau of Data Collection, Research and Evaluation and the Bureau of Special Education met to review suspension and expulsion data. The areas of suspension and expulsion reviewed included: special education out-of-school suspensions, special education overall (in- and out-of-school) suspension rates, and a calculated difference score between the overall suspension rates of students with disabilities and that of their nondisabled peers. Districts were ranked on these three indicators. A cut score for data of concern was established. Finally, districts were identified as belonging to one of three groups: districts with data below the state average, districts with data between the state average and the established cut score, and districts with data above the established cut score for suspension and expulsion rates of concern. Districts with atypical suspension and expulsion data (two or more indicators with data above the state established cut score) were notified in early spring 2005 and required to review their data and explain the patterns in the data.
The 2004-05 analysis discussed here using the 2003-04 school year suspension and expulsion data represents the establishment of a baseline for future comparison. The Department has

SPP Template – Part B (3) CONNECTICUT State
Part B State Performance Plan: 2005-2010 Monitoring Priority: FAPE in the LRE – Page 19 (OMB NO: 1820-0624 / Expiration Date: 2/29/2012) Indicator 4 – Suspension and Expulsion
been working diligently to clarify and consolidate the collection of suspension and expulsion data. During the 2004-05 school year the Department conducted a number of activities to address inappropriate use of suspension and expulsion. Technical assistance was provided to districts based upon the recommendation of the Continuous Improvement Partnership Team (CIPT).
During the 2003-04 school year, the Department published in the Special Education Strategic School Profiles suspension and expulsion information (2002-03 data) for each district. District counts and rates were illuminated for in-school suspensions, out-of-school suspensions and expulsion data for both general and special education students. Statewide data were included for comparison. This new public display of data drew attention to the disproportionate suspension of students with disabilities within a district as well as across districts.
In response to the FFY 2003 Annual Performance Report letter dated October 18, 2005, the Department will communicate with superintendents of LEAs about disproportionately suspending students with disabilities and for having a high rate of suspending students with disabilities. District personnel will be asked to review and revise policies, procedures and practices related to development of IEPs, use of behavioral interventions and procedural safeguards. District personnel will report to the Department on a review of policies, procedures and practices, and the development of a plan to reduce the rate of suspensions. Targeted assistance and training will then be provided by the Department. The Department will report on these interventions in the 2007 APR.
Baseline Data for FFY 2004 (2004-2005): Sampling is not used. Data are valid and reliable.
4A. Thirty-six districts or 21.3 percent of the districts in Connecticut demonstrate a significant discrepancy for the suspension and expulsion of students with disabilities based on 2004-05 school year data.
(36/169 x 100 = 21.3%)
4B. Per OSEP instructions, not reporting at this time.
Discussion of Baseline Data: 4A. In order to address Indicator 4A, the Department calculated the greater than 10-day suspension and expulsion rates for each district for special education. The Department set a cut score of greater than 2 percent and determined which districts had a greater than 10-day suspension rate for students with disabilities. Thirty-six districts or 21.3 percent of the districts in Connecticut reported a suspension and expulsion rate of students with disabilities greater than 2 percent based on 2004-05 school year data.
Due to the data collection practices within the Department associated with the collection of suspension and expulsion data, it is not anticipated that these data will be reported within federal timelines (November 1 – Table 5; February 1 APR/SPP) for the foreseeable future. Currently, it is Department policy to open the discipline data collection in mid-July and allow reporting through late October. This timeline allows the Department to conduct multiple validation checks and align the discipline file with the state’s Public School Information

SPP Template – Part B (3) CONNECTICUT State
Part B State Performance Plan: 2005-2010 Monitoring Priority: FAPE in the LRE – Page 20 (OMB NO: 1820-0624 / Expiration Date: 2/29/2012) Indicator 4 – Suspension and Expulsion
System (PSIS) and assessment data collection files. The Department will be meeting in spring 2007 to discuss how and when it will be possible to convert the discipline data collection to an online system linked directly to PSIS and enable collection in a manner that facilitates timely reporting of suspension and expulsion data. Due to our data collection timelines, the 2004-05 school year suspension and expulsion data will be used as a data point to select districts for focused monitoring for the 2006-07 school year. Four data probes will be used: unique out-of-school suspension and expulsion rates for general education students; unique out-of-school suspension and expulsion rates for students with disabilities; difference between unique out-of-school suspension and expulsion rates for general and special education students; and greater than 10-days out-of-school suspension and expulsion rate for students with disabilities. 4B. The Department is designing a data analysis that mirrors our current disproportionality initiative to address disproportionate suspension of students with disabilities. The Department’s planning group has reviewed guidance from OSEP, NCCRESt, and other states through the NASDE survey to assist with determining our definition of significant disproportionality in these categories. The Department continues to struggle with concerns regarding small n size when assessing racial disproportionality in subgroups of subgroups of the students with disabilities subgroup in our state (i.e., students with disabilities suspended greater than 10 days). In the meantime, the Department is conducting focused monitoring visits on suspension of students with disabilities, which include an analysis of disproportionality and policies, practices and procedures as part of the site visits. Additionally, discussions center on the determination of directing funds for disproportionate suspension. To date, the Department has directed funds for disproportionate identification by disability only.
FFY Measurable and Rigorous Target
2005 (2005-2006)
4A: 30.0%
2006 (2006-2007)
4A: 30.0%
2007 (2007-2008)
4A: 25.0%
2008 (2008-2009)
4A: 20.0%

SPP Template – Part B (3) CONNECTICUT State
Part B State Performance Plan: 2005-2010 Monitoring Priority: FAPE in the LRE – Page 21 (OMB NO: 1820-0624 / Expiration Date: 2/29/2012) Indicator 4 – Suspension and Expulsion
FFY Measurable and Rigorous Target
2009 (2009-2010)
4A: 15.0%
2010 (2010-2011)
4A: 10%
Improvement Activities/Timelines/Resources:
Improvement Activities Timelines Resources 4.1 Provide professional development
activities statewide on: • Positive Behavior Supports: A
Systems Approach to Effective School-wide Management; and
• Challenging Behaviors: A Series of Three Workshops
2005-06 school year
• Statewide training provided by SERC
4.2 Disseminate state color-coded maps representing suspension/expulsion rates for students with disabilities.
2005-06 school year
• Department personnel to design and disseminate the maps
• Department website 4.3 Include in bureau information to school district personnel current research on alternatives to suspension and expulsion.
September 2006
• Department personnel to review research and develop update to district personnel
4.4 Use suspension and expulsion data as a data point to select districts for focused monitoring.
2005-06 and 2007-08 school year
• Department personnel and focused monitoring procedures
4.5 Conduct statewide summit on dropout prevention, graduation and alternatives to suspension; incorporate into three day consortium.
2006-07 and 2007-08 school year
• Department personnel • SERC personnel • Allocate a portion of IDEA funds
awarded to SERC for summit activities
4.6 Meet with State Education Resource Center (SERC) staff to discuss statewide and district-specific activities and training to address rates of suspension and expulsion.
2005-06 school year through 2011
• Allocate a portion of IDEA funds awarded to SERC to provide professional development activities
• Department personnel • SERC personnel • CSPD Council
4.7 Provide targeted training to individual districts on positive behavior supports.
2005-06 school year through 2011
• District and school-wide training provided by SERC

SPP Template – Part B (3) CONNECTICUT State
Part B State Performance Plan: 2005-2010 Monitoring Priority: FAPE in the LRE – Page 22 (OMB NO: 1820-0624 / Expiration Date: 2/29/2012) Indicator 4 – Suspension and Expulsion
Improvement Activities Timelines Resources 4.8 (Revised) Assign a consultant from the Bureau of Health/Nutrition, family Services and Adult Education for suspension and expulsion for students with disabilities. This person will work with the Department and other state agencies to strengthen and promote interagency collaboration.
July 2005 through fall 2011
• Department personnel
4.9 (Revised) Disseminate data to all school districts via District Annual Performance Reports and the Strategic School Profiles. Data are available on the Department website.
2006-07 school year through 2011
• Department personnel
4.10 Use the resources and technical assistance of The Center on Positive Behavioral Interventions and Supports.
2005-06 school year through 2011
• The Center on Positive Behavioral Interventions and Supports
4.11 Identify and disseminate information regarding model programs in the area of reducing suspension and expulsion.
April 2006 through 2011
• Department personnel and funding from the State Personnel Development Grant (SPDG)
4.12 (Revised) Explore components of school engagement model to be included in request for proposal (RFP) to develop demonstration programs aimed at increasing graduation rate and decreasing suspension, expulsion and dropout rates.
2007-08 school year through 2011
• Department personnel and IDEA and other funding sources
4.13 (Revised) Monitoring from the Bureau of Accountability and Improvement to require inclusion of strategies to decrease suspension rates in districts where discipline and behavior are significant concerns, contributing to graduation and dropout issues.
2007-08 school year through 2011
• Personnel from the Bureau of Accountability and Improvement
• Personnel from the Bureau of Data Collection, Research and Evaluation

SPP Template – Part B (3) CONNECTICUT State
Part B State Performance Plan: 2005-2010 Monitoring Priority: FAPE in the LRE – Page 23 (OMB NO: 1820-0624 / Expiration Date: 2/29/2012) Indicator 4 – Suspension and Expulsion
Improvement Activities Timelines Resources 4.14 (Revised) The Department has identified the Bureau of Health/Nutrition, Family Services and Adult Education to assume primary responsibility for dropout prevention services. An interagency taskforce will work with the Bureau and include representation from special education. The taskforce will implement the following recommendations from the Department report to the State Board of Education titled A Review of Programs for Reducing the Dropout and Suspension Rates of Those Children At Risk of Dropping Out or Being Suspended from School:
1. Conduct in depth analysis of dropout and suspension data among Connecticut’s School children;
2. Identify individuals in the state with expertise in dropout prevention and reach out to national consultant;
3. Complete an analysis of local programs in Connecticut to identify exemplary models; and
4. Promote the use of Scientific Research-based Intervention (SRBI) to identify youth at risk of dropping out of school.
2008-09 school year through 2011
• Department personnel • Representatives from LEAs • Representatives from other
state agencies • Representatives from
community groups
4.15 (Revised) Continue training through the Connecticut Accountability for Learning Initiative’s (CALI) module entitled Improving School Climate to Support Student Achievement to facilitate the reduction of suspensions/expulsion that impact graduation and dropout rates. The Department offers basic and certification training through our Connecticut Accountability for Learning Initiative (CALI) professional development offerings. Certification training gives participants license to conduct basic training in order to develop state capacity.
2006-07 school year through 2011
• Bureau of Accountability and Improvement
• SERC personnel

SPP Template – Part B (3) CONNECTICUT State
Part B State Performance Plan: 2005-2010 Monitoring Priority: FAPE in the LRE – Page 24 (OMB NO: 1820-0624 / Expiration Date: 2/29/2012) Indicator 4 – Suspension and Expulsion
Improvement Activities Timelines Resources 4.16 The Department to release official guidance to districts regarding in-school and out-of-school suspensions as passed via state legislation to be effective July 1, 2009. The Department to host a statewide conference and regional training for all districts on implementation of in-school suspension guidelines.
2008-09 school year through 2010
• Department personnel
4.17 (New) Department will establish an intra-agency and inter-agency taskforce to address graduation, dropout, suspension and expulsion of students with and without disabilities.
2008-09 school year through 2011
• Department personnel • Other state agency personnel • Representatives from Local
Educational Agencies (LEAs) and other stakeholder groups
• In-school suspension guidelines
4.18 (New) Design and implementation of new Web-based Suspension and Expulsion Data Collection System (ED 166).
2009-2010 • Department personnel
4.19 (New) Department personnel will provide integrated data systems training to LEA data managers.
2009-10 through 2011
• Department personnel • SEDAC • Public School Information
System (PSIS) • ED 166

SPP Template – Part B (3) CONNECTICUT State
Part B State Performance Plan: 2005-2010 Monitoring Priority: FAPE in the LRE – Page 25 (OMB NO: 1820-0624 / Expiration Date: 2/29/2012) Indicator 5 – LRE Placement
Part B State Performance Plan (SPP) for 2005-2010
Overview of the State Performance Plan Development:
See Overview page i (The following items are to be completed for each monitoring priority/indicator.)
Monitoring Priority: FAPE in the LRE
Indicator 5: Percent of children with IEPs aged 6 through 21 served:
A. Inside the regular class 80% or more of the day;
B. Inside the regular class less than 40% of the day; and
C. In separate schools, residential facilities, or homebound/hospital placements.
(20 U.S.C. 1416(a)(3)(A))
Measurement:
A. Percent = [(# of children with IEPs served inside the regular class 80% or more of the day) divided by the (total # of students aged 6 through 21 with IEPs)] times 100.
B. Percent = [(# of children with IEPs served inside the regular class less than 40% of the day) divided by the (total # of students aged 6 through 21 with IEPs)] times 100.
C. Percent = [(# of children with IEPs served in separate schools, residential facilities, or homebound/hospital placements) divided by the (total # of students aged 6 through 21 with IEPs)] times 100.
Overview of Issue/Description of System or Process: In the 2004-05 school year, 169 school districts in Connecticut provided special education and related services to 65,050 children with disabilities ages 6 - 21. This represents 11.4 percent of the total school population of children ages 6-21. The overwhelming majority of children, 93.9 percent, are educated in public schools, in either the LEA in which they live or another LEA. Given the very small and rural nature of many of Connecticut’s school districts, a Regional Educational Service Center (RESC) network, along with private special education schools, are available to the 169 public schools to provide services and educational programs to students. The Department of Corrections, the Department of Children and Families and the Connecticut Technical High School System each operate a public school district for students in their jurisdiction as defined by Connecticut state law. These students are not reported by any other school district identified in this report.

SPP Template – Part B (3) CONNECTICUT State
Part B State Performance Plan: 2005-2010 Monitoring Priority: FAPE in the LRE – Page 26 (OMB NO: 1820-0624 / Expiration Date: 2/29/2012) Indicator 5 – LRE Placement
Baseline Data for FFY 2004 (2004-2005): For the school year 2004 – 05:
5A. The percentage of students with disabilities aged 6 - 21 removed from regular class less than 21 percent of the day was 60.7 percent (39,480 / 65,052) x 100 = 60.7%
5B. The percentage of students with disabilities aged 6 through 21 removed from regular class greater than 60 percent of the day was 10.3 percent (6,687 / 65,052) x 100 = 10.3%
5C. The percentage of students with disabilities aged 6 - 21 served in public or private separate schools, residential placements, or homebound or hospital placements was 6.1 percent (3,999 / 65,052) x 100 = 6.1 %
Discussion of Baseline Data: Data indicate a continuous increase for Indicator 5A and a continuous decrease for Indicator 5B for the past three years. Indicator 5C has decreased from the 2002-03 school year. Due to data trends moving in the appropriate direction, many of the interventions previously used that have contributed to achieving these data outcomes will continue (see improvement activities section that follows). Annually, LEAs in Connecticut report to the Department the number of hours that students receiving special education and related services spend in school in any given week, along with the number of nondisabled peer hours per week. Nondisabled peer hours are determined by counting the number of hours a student spends with his or her nondisabled peers, including both special education and non-special education hours. This information is recorded on the IEP and submitted on December 1 of the school year. The Department calculates what proportion of time each student spends with nondisabled peers per week by dividing the number of nondisabled peer hours by the total school hours and multiplying by 100. Using this calculation, every student with an IEP is assigned a code to represent one of the three federal categories for educational environment of children with disabilities: removed from the regular class less than 21percent of the day; removed from the regular class at least 21 percent of the day but no more than 60 percent of the day; and removed from the regular class greater than 60 percent of the day. The Department collects this information for every student with an IEP or service plan in the state. For the purposes of Part B Section 618 data reporting, students served in public or private separate schools, residential placements or homebound or hospital placements are not included in the educational environments categories. These students are considered in Least Restrictive Environment (LRE) data monitoring and auditing activities that examine LEAs’ time with nondisabled peer data. Disaggregation of Indicators 5A, 5B and 5C by age, disability type and location of service may be useful for further development of interventions. Additionally, stakeholders suggest that accuracy of this data may be influencing the rate of improvement as state terms being translated to federal terms may influence the way in which subindicator data is reported. Also, previous data audits of Indicator 5A for students with an intellectual disability have suggested an error rate that needs improvement and may be effecting data accuracy of other disabilities’ data for Indicators 5A and 5B.

SPP Template – Part B (3) CONNECTICUT State
Part B State Performance Plan: 2005-2010 Monitoring Priority: FAPE in the LRE – Page 27 (OMB NO: 1820-0624 / Expiration Date: 2/29/2012) Indicator 5 – LRE Placement
FFY Measurable and Rigorous Target
2005 (2005-2006)
5A: 62.5% 5B: 10.0% 5C: 6.0%
2006 (2006-2007)
5A: 65.0% 5B: 9.0% 5C: 5.8%
2007 (2007-2008)
5A: 67.5% 5B: 8.0% 5C: 5.6%
2008 (2008-2009)
5A: 70.0% 5B: 7.0% 5C: 5.4%
2009 (2009-2010)
5A: 72.5% 5B: 6.0% 5C: 5.2%
2010 (2010-2011)
5A: 75.0% 5B: 5.0% 5C: 5.0%
Improvement Activities/Timelines/Resources:
Improvement Activities Timelines Resources 5.1 Begin implementation of the newly developed CMT/CAPT Skills Checklist, which is aligned with the state grade- level Connecticut Curriculum Frameworks to be used for assessment and instructional planning.
Spring 2006 • Two consultants from the Bureau of Research, Evaluation and Assessment to work on training and development of CMT/CAPT standard and checklist assessment
5.2 Examine mentoring teacher qualifications and training, and availability for student teaching placements in LRE settings.
Spring 2006 • Bureau of Special Education facilitator and Bureau of Research, Evaluation and Assessment data analyst available for discussions with appropriate stakeholders (higher education personnel and district personnel)
5.3 Examine data definitions used for reporting to determine how to best report data to accurately reflect state and district activities that address LRE indicators.
Spring 2006 • Bureau of Special Education facilitator and Bureau of Data Collection, Research and Evaluation data analyst to examine data definitions and reporting practices
SPP Template – Part B (3) CONNECTICUT State
Part B State Performance Plan: 2005-2010 Monitoring Priority: FAPE in the LRE – Page 28 (OMB NO: 1820-0624 / Expiration Date: 2/29/2012) Indicator 5 – LRE Placement
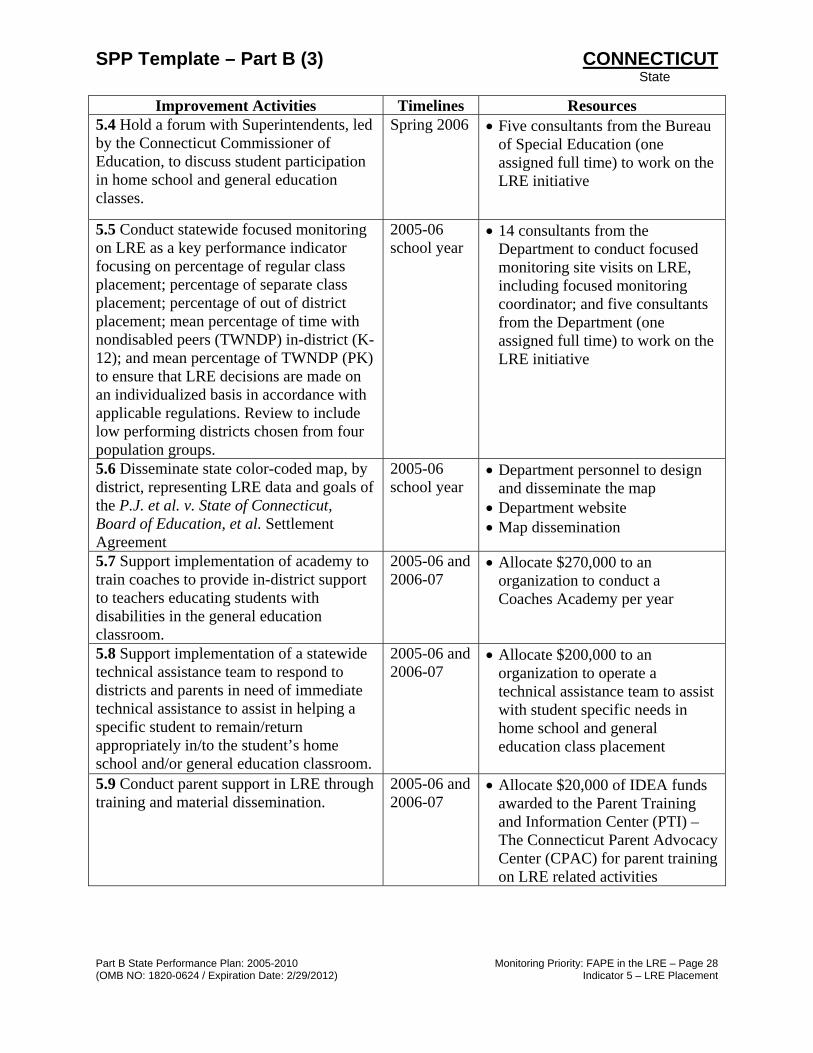
Improvement Activities Timelines Resources 5.4 Hold a forum with Superintendents, led by the Connecticut Commissioner of Education, to discuss student participation in home school and general education classes.
Spring 2006 • Five consultants from the Bureau of Special Education (one assigned full time) to work on the LRE initiative
5.5 Conduct statewide focused monitoring on LRE as a key performance indicator focusing on percentage of regular class placement; percentage of separate class placement; percentage of out of district placement; mean percentage of time with nondisabled peers (TWNDP) in-district (K-12); and mean percentage of TWNDP (PK) to ensure that LRE decisions are made on an individualized basis in accordance with applicable regulations. Review to include low performing districts chosen from four population groups.
2005-06 school year
• 14 consultants from the Department to conduct focused monitoring site visits on LRE, including focused monitoring coordinator; and five consultants from the Department (one assigned full time) to work on the LRE initiative
5.6 Disseminate state color-coded map, by district, representing LRE data and goals of the P.J. et al. v. State of Connecticut, Board of Education, et al. Settlement Agreement
2005-06 school year
• Department personnel to design and disseminate the map
• Department website • Map dissemination
5.7 Support implementation of academy to train coaches to provide in-district support to teachers educating students with disabilities in the general education classroom.
2005-06 and 2006-07
• Allocate $270,000 to an organization to conduct a Coaches Academy per year
5.8 Support implementation of a statewide technical assistance team to respond to districts and parents in need of immediate technical assistance to assist in helping a specific student to remain/return appropriately in/to the student’s home school and/or general education classroom.
2005-06 and 2006-07
• Allocate $200,000 to an organization to operate a technical assistance team to assist with student specific needs in home school and general education class placement
5.9 Conduct parent support in LRE through training and material dissemination.
2005-06 and 2006-07
• Allocate $20,000 of IDEA funds awarded to the Parent Training and Information Center (PTI) – The Connecticut Parent Advocacy Center (CPAC) for parent training on LRE related activities

SPP Template – Part B (3) CONNECTICUT State
Part B State Performance Plan: 2005-2010 Monitoring Priority: FAPE in the LRE – Page 29 (OMB NO: 1820-0624 / Expiration Date: 2/29/2012) Indicator 5 – LRE Placement
Improvement Activities Timelines Resources 5.10 Provide “Families as Partners” training to parents and districts participating in STARS and Coaches Academy.
2006-07 school year
• Provide $10,000 to joint university project through the University Center on Excellence in Developmental Disabilities (UCEDD) to conduct training
5.11 Meet three times a year with the Expert Advisory Panel (EAP) of the P.J. et al. v. State of Connecticut, Board of Education, et al. Settlement Agreement to advise the state in increasing home school and regular class placement and examining out-of-district placements for students with intellectual disabilities.
2005-06 school year through December 2007
• Allocate $85,000 for Expert Advisory Panel expenses per year
5.12 Discussions with the Department of Children and Families (DCF) about placement boundaries and impact on out- of-state and out-of-district placements, and determine next steps.
2007-08 school year
• Department personnel to meet with DCF staff
5.13 (Revised) Disseminate P.J. et al. v. State of Connecticut, Board of Education, et al. settlement agreement data to all school districts via individual district determination letters. Data are available on State Web site.
2005-06 school year through 2010
• Department personnel
5.14 Continue to conduct general supervision and monitoring of targeted districts in the area of LRE/ID (intellectual disabilities). This is to include requiring targeted districts to submit action plans and multiple data reports per year on LRE/ID.
2006-07 school year through 2010
• Five consultants from the Department (one assigned full time) to work on the LRE initiative
5.15 Use nationally available resources and research to guide the development of implementation strategies, such as the work of the Consortium on Inclusive School Practices to examine state and local policies on inclusion.
2005-06 through 2011
• Five consultants from the Department (one assigned full time) to work on the LRE initiative
• SERC
5.16 Provide training and technical assistance to all P.J. et al. v. State of Connecticut, Board of Education, et al. Settlement Agreement targeted districts through the State Education Resource Center (SERC) in the areas of LRE/Inclusion.
2005-06 school year through 2011
• Allocate a portion of IDEA funds awarded to the State Education Resource Center (SERC) to provide district specific training
SPP Template – Part B (3) CONNECTICUT State
Part B State Performance Plan: 2005-2010 Monitoring Priority: FAPE in the LRE – Page 30 (OMB NO: 1820-0624 / Expiration Date: 2/29/2012) Indicator 5 – LRE Placement
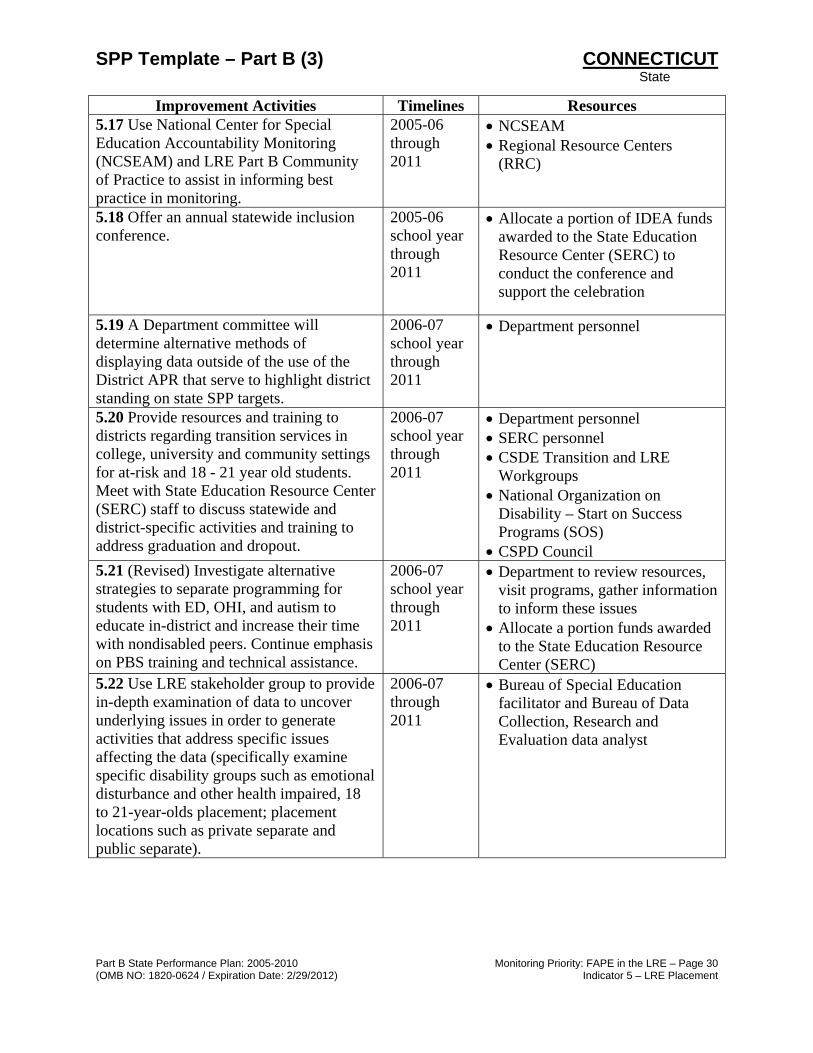
Improvement Activities Timelines Resources 5.17 Use National Center for Special Education Accountability Monitoring (NCSEAM) and LRE Part B Community of Practice to assist in informing best practice in monitoring.
2005-06 through 2011
• NCSEAM • Regional Resource Centers
(RRC)
5.18 Offer an annual statewide inclusion conference.
2005-06 school year through 2011
• Allocate a portion of IDEA funds awarded to the State Education Resource Center (SERC) to conduct the conference and support the celebration
5.19 A Department committee will determine alternative methods of displaying data outside of the use of the District APR that serve to highlight district standing on state SPP targets.
2006-07 school year through 2011
• Department personnel
5.20 Provide resources and training to districts regarding transition services in college, university and community settings for at-risk and 18 - 21 year old students. Meet with State Education Resource Center (SERC) staff to discuss statewide and district-specific activities and training to address graduation and dropout.
2006-07 school year through 2011
• Department personnel • SERC personnel • CSDE Transition and LRE
Workgroups • National Organization on
Disability – Start on Success Programs (SOS)
• CSPD Council 5.21 (Revised) Investigate alternative strategies to separate programming for students with ED, OHI, and autism to educate in-district and increase their time with nondisabled peers. Continue emphasis on PBS training and technical assistance.
2006-07 school year through 2011
• Department to review resources, visit programs, gather information to inform these issues
• Allocate a portion funds awarded to the State Education Resource Center (SERC)
5.22 Use LRE stakeholder group to provide in-depth examination of data to uncover underlying issues in order to generate activities that address specific issues affecting the data (specifically examine specific disability groups such as emotional disturbance and other health impaired, 18 to 21-year-olds placement; placement locations such as private separate and public separate).
2006-07 through 2011
• Bureau of Special Education facilitator and Bureau of Data Collection, Research and Evaluation data analyst

SPP Template – Part B (3) CONNECTICUT State
Part B State Performance Plan: 2005-2010 Monitoring Priority: FAPE in the LRE – Page 31 (OMB NO: 1820-0624 / Expiration Date: 2/29/2012) Indicator 5 – LRE Placement
Improvement Activities Timelines Resources 5.23 Examine state agency placements, private placements and RESC options and current practices with each of these to illuminate future intervention strategies.
Spring 2006 through 2011
• Bureau of Special Education facilitator and Bureau of Data Collection, Research and Evaluation data analyst
5.24 Increase focus on professional development and monitoring to assist districts in supporting students to remain in district that are being considered or are at risk for out-of-district placement, as well as to transition students back into district.
Spring 2007 through 2011
• Allocate a portion of IDEA funds awarded to the State Education Resource Center (SERC) to offer statewide professional development training on LRE/Inclusion
5.25 Support training and information sharing sessions conducted by other public or private agencies on LRE for families and school/agency personnel.
2005-06 school year through 2011
• Allocate up to $200,000 per year from IDEA funds for supporting LRE activities or other public and private organizations with advisement from CSDE Parent Workgroup
5.26 (Revised) Provide professional development activities statewide on:
• co-teaching; • differentiated instruction and
assessment; • administrator training; • curriculum topics; • learning strategies; • collaborative teaching; • speech pathologists as co-teachers;
and positive behavior supports.
Spring 2007 through 2011
• Allocate a portion of IDEA funds awarded to the State Education Resource Center (SERC) to offer statewide professional development training on LRE/Inclusion
5.27 (Revised) Develop a menu of training opportunities for use by schools not making adequate yearly progress for students with disabilities, especially for those students who are increasing their time in regular classrooms. Components will include trainings by the Leadership and Learning Center on Data Teams and Data Driven Decision Making, Making Standards Work, and Effective Teaching Strategies for Leaders, as well as resources on differentiated instruction, co-teaching, gap analysis, Educational Benefit Review Process and excerpts from Step by Step.
Spring 2007 through 2011
• SERC personnel • Bureau of Accountability and
Improvement • Bureau of Special Education

SPP Template – Part B (3) CONNECTICUT State
Part B State Performance Plan: 2005-2010 Monitoring Priority: FAPE in the LRE – Page 32 (OMB NO: 1820-0624 / Expiration Date: 2/29/2012) Indicator 5 – LRE Placement
Improvement Activities Timelines Resources 5.28 Continue to examine data on expansion of out-of-district placement and causal factors, and the quality of programming at separate and out-of-district placements to determine next steps. Explore additional statistical techniques to more accurately represent this data.
2007-08 school year through 2011
• Bureau of Special Education and Bureau of Data Collection, Research and Evaluation staff to collaborate to examine data and to review findings of private facilities/RESC monitoring
5.29 Investigate reading and behavioral supports and methods of delivery that can be implemented at younger ages to reduce later out-of-district placements of students for reading difficulties and behavioral concerns.
2007-08 school year through 2011
• Department to review resources, visit programs, gather information to inform these issues

SPP Template – Part B (3) CONNECTICUT State
Part B State Performance Plan: 2005-2010 Monitoring Priority: FAPE in the LRE – Page 33 (OMB NO: 1820-0624 / Expiration Date: 2/29/2012) Indicator 6 – Early Childhood LRE
Part B State Performance Plan (SPP) for 2005-2010
Overview of the State Performance Plan Development:
See Overview page i (The following items are to be completed for each monitoring priority/indicator.)
Monitoring Priority: FAPE in the LRE
Indicator 6: Percent of preschool children with Individualized Education Programs (IEPs) who received special education and related services in settings with typically developing peers (e.g., early childhood settings, home, and part-time early childhood/part-time early childhood special education settings).
(20 U.S.C. 1416(a)(3)(A))
Measurement: Percent = # of preschool children with IEPs who received special education services in settings with typically developing peers divided by the total # of preschool children with IEPs times 100.
Overview of Issue/Description of System or Process: There are 159 school districts in Connecticut that provide special education and related services to eligible 3-, 4- and 5-year-old children with disabilities. Since the initial submission of the SPP in December 2005, Connecticut served the following numbers of children ages 3 through 5 with an IEP:
School Year Number of 3-, 4-, and 5-year-olds
2004-05 7,978
2005-06 7,881
2006-07 6,833* * CT changed from a Dec. 1 to an Oct. 1 child count collection date
In Connecticut, kindergarten is provided to all children who turn age 5 on or before January 1st of a school year while preschool education for all children 3 and 4 years old is not a component of compulsory public elementary school education. Besides the availability of private community-based early childhood programs for the preschool-age population, the state has two publicly funded early childhood programs: a federally funded program, Head Start which also receives state funds, and a state funded early childhood program called School Readiness. Each of the two publicly funded programs has their own specific eligibility criteria. A number of children with disabilities who meet the eligibility requirements of either Head Start or School Readiness have access to and are included in these two publicly funded programs either as a part of or in addition to the special education and related services children received through an IEP. Children with disabilities also have
SPP Template – Part B (3) CONNECTICUT State
Part B State Performance Plan: 2005-2010 Monitoring Priority: FAPE in the LRE – Page 34 (OMB NO: 1820-0624 / Expiration Date: 2/29/2012) Indicator 6 – Early Childhood LRE
access to and participate in private community-based early childhood programs which may or may not be a component of a child’s IEP. All school districts provide special education and related services to eligible 3-, 4- and 5-year-old children with disabilities and use a variety of service delivery options including an integrated program service model (e.g., ‘reverse mainstream program’) and itinerant services which may be provided at a community-based early childhood program and/or at a public school facility. Some school districts provide a preschool program specifically designed for typically developing 3- and 4-year-old children and use that particular program setting to provide services to preschool-age children with an IEP. The state is working toward the goal of ultimately having preschool universally available for all children 3 and 4 years old in the next 10 years. There is a Governor’s Early Childhood Cabinet. Personnel from the State Department of Education are members of the Governor’s Early Childhood Cabinet and members of related work groups established by the Cabinet. The Governor’s Early Childhood Cabinet and the related work groups are building an inter-agency statewide collaborative network that will design and build an infrastructure for access to universal preschool for all children in the state. State Data Collection System: On an annual basis, the Department collects data from all school districts on the educational environments of 3-, 4- and 5-year-old children with disabilities receiving special education and related services. Data are provided to the Department through an electronic data submission. This data collection falls under the Section 618 data collection requirements in the IDEA. The data are collected annually in accordance with the established timelines for federal reporting. Data are not obtained from sampling. Assurance of Data Accuracy The Department has unique student identification numbers for students ages 3 through 21. Each school district has a mechanism to annually input required data on an individual student basis. Data is submitted electronically from each school district to the state’s data system. The data submitted to the Department are verified by the Superintendent of Schools as accurate. In addition, the Department data system has data verifications and checks that are a part of the data system to ensure the accuracy and validity of the data that are submitted by each school district. Another activity to ensure the accuracy and validity of the data is the annual and on-going training and technical assistance provided to all school districts by the Department. Specific training and technical assistance is provided to the data managers in each school district to ensure their understandings of the data required and ultimately ensure accuracy in the information provided to the state. Upon collection of the data at the state level, Department personnel follow-up with individual school districts when unusual or outlier data have been provided to the state. Targeted technical assistance and guidance are available by the Department to assist school districts in their data reporting.

SPP Template – Part B (3) CONNECTICUT State
Part B State Performance Plan: 2005-2010 Monitoring Priority: FAPE in the LRE – Page 35 (OMB NO: 1820-0624 / Expiration Date: 2/29/2012) Indicator 6 – Early Childhood LRE
Implementation of a New Statewide Data Collection System 2006-07 A new state data system was implemented in the 2006-07 school year. The state’s data system is known as SEDAC, the Special Education Data Application and Collection. The new data system was launched in 2006-07. Analysis of special education data for this indicator demonstrated a need for improved (1) understanding at the district level of new data elements and definitions; (2) data entry and accuracy at the district level and (3) ability to provide the needed comprehensive, individualized and targeted training and technical assistance to school districts. The data system’s data verifications and checks assisted the Department in identifying needed improvements in the operation of the data system and the training needs of school districts. LRE Data Collection 2004-05 The data collected on the IDEA 619 educational environments in 2004 included eight categories, two of which were optional reporting categories. The eight educational environment categories were those identified and defined by the U.S. Department of Education. The Department’s data collection and analysis for 2004 reflected all eight federally identified and defined educational environment categories for children ages 3 through 5 with an IEP and included: early childhood setting; early childhood special education setting; part-time early childhood and part-time early childhood special education setting; separate school; residential facility; home; reverse mainstream setting, and itinerant services. The Department used the federal data definitions for each of the eight educational environments for data collection and analysis. Department training, technical assistance and data verification activities for these eight environment categories reflected strict adherence to the federal definition for each educational setting. The Department collected this data statewide on educational environments for each individual 3-, 4- and 5-year-old child with an IEP. This information was used to submit the federally required 618 data to the U.S. Department of Education, Office of Special Education Programs for 2004-05 and for reporting in the SPP submitted December 2005. LRE Data Collection 2005-06 In 2005, the Department began revising its data collection to reflect the new educational environment categories approved by the U.S. Department’s Office of Management and Budget (OMB). For 2005, the Department began implementation of the new federal educational environment categories using the new federal definitions to collect data from each school district. This information would ultimately be used to report on the educational environments of children ages 3 through 5 with an IEP. The new educational environments include: early childhood program, separate class (e.g., early childhood special education), separate school, residential facility, home and service provider location. In 2005, the Department created a crosswalk between the old and new categories to assist in the collection and analysis of data. For one of the new reporting categories, the “early childhood program” environment, those children will be identified as: (a) spending 80 -100 percent of the time in regular education; (b) 40-79 percent of the time in regular education; or (c) 0-39 percent of the time in regular education. Statewide training and technical assistance was available in 2005-06 to ensure that special education personnel, including district data managers, were introduced to and

SPP Template – Part B (3) CONNECTICUT State
Part B State Performance Plan: 2005-2010 Monitoring Priority: FAPE in the LRE – Page 36 (OMB NO: 1820-0624 / Expiration Date: 2/29/2012) Indicator 6 – Early Childhood LRE
understood the changes in the data collection to assist ensuring accuracy in data reporting. Related state forms, state data bases and other infrastructure elements were adjusted accordingly. LRE Data Collection 2006-07 Beginning in the 2006-07 school year and annually thereafter, the state will collect and analyze information based upon new federal categories and the federal definitions on the educational environments of children ages 3 through 5 with an IEP. The new educational environments include: early childhood program, separate class (e.g., early childhood special education), separate school, residential facility, home and service provider location. The new statewide data system, SEDAC, will be used to collect information from each school district in the state on each 3-, 4-, and 5-year-old child with an IEP. While the data collection in 2005-06 was crosswalked between the old and new educational environment categories, this is no longer required. The crosswalk was helpful in transitioning data managers to the new educational environment categories, but is not longer necessary in the second year of collection. General training and technical assistance was provided statewide to assist school districts in their understanding of the new system as well as the new data elements implemented and required for reporting in SEDAC. LRE Data Reported 2004-05 Data collected by the Department from all school districts in the 2004-05 school year indicate that 61.0 percent of children 3, 4 and 5 years old with an IEP are receiving their special education and related services with typically developing peers in either an early childhood setting, a reverse mainstream setting or by receiving itinerant services (see italicized chart below).
Early Childhood Environments 2004-05
Early Childhood Setting 22.1
Reverse Mainstream Setting 21.7
Itinerant Services 17.2
Part-Time EC/Part-Time ECSE 18.8
Home 0.1
Early Childhood Special Education 19.3
Residential Facility 0.0
Separate School 0.7
A total of 1,767 children or 22.1 percent of children 3, 4 and 5 years old with an IEP received services in an early childhood setting. A total of 1,247 children 5 years of age (40.2 percent) received their services in a regular education kindergarten while the preschool population was served in a variety of early childhood settings that included private community-based

SPP Template – Part B (3) CONNECTICUT State
Part B State Performance Plan: 2005-2010 Monitoring Priority: FAPE in the LRE – Page 37 (OMB NO: 1820-0624 / Expiration Date: 2/29/2012) Indicator 6 – Early Childhood LRE
programs, publicly funded preschool programs or preschool programs offered by the public schools. Specifically 8.1 percent of 3-year-olds and 12.6 percent of 4-year-olds were served in these three types of setting that offered time with typically developing peers. A total of 21.7 percent or 1730 children ages 3 through 5 were served in a reverse mainstream setting. A reverse mainstream setting was utilized primarily for the preschool age population with 34.9 percent of 3-year-olds and 30.0 percent of 4-year-olds respectively served in a reverse mainstream setting while only 5.3 percent or 163, 5 year old children received their special educated services in a reverse mainstream setting. In Connecticut, itinerant services were utilized for the preschool population with 27.9 percent of 3 year old children and 24.2 percent of 4 year old children receiving itinerant services. Only 3.6 percent of 5year old population of kindergarten-aged children received itinerant services. Regular education kindergarten appeared to be the least LRE for 5 year old children while the utilization of reverse mainstream settings and the delivery of itinerant services appeared to be the LRE for 3 and 4 year old children. More restrictive settings such as residential facilities, separate schools and home are rarely used in the state to deliver special education and related services to the eligible population of young children with an IEP. LRE Data Reported 2005-06 The data obtained through a data crosswalk using the old and new data elements in the 2005-06 school year, indicate that 70.0 percent (n = 5520) of all children ages 3 through 5 with an IEP spend 80-100 percent of their time in a regular early childhood program. In drilling down into the data by age, of those children spending 80-100 percent of time in a regular early childhood environment, the data indicate that 60.9 percent of 3-year-olds, 69.3 percent of 4-year-olds and 76.7 percent of 5-year-olds spend 80-100 percent of their time in an early childhood environment, including kindergarten. The percentages of children spending 80-100 percent of their time with typically developing peers increase by age with the greatest percentage being reported for 5-year-olds. This increase by age may be due to the availability of more preschool opportunities for 4-year-olds and a public elementary education opportunity for 5-year-old children in kindergarten.
Within the federal definition of an early childhood program there are two other categories that are defined by the amount of time children with an IEP spend with typically developing peers. There were 731 children, or 9.3 percent of children ages 3 through 5 with an IEP spending 40-79 percent of time with typically developing peers. There were 164 children, or 2.1 percent of children ages 3 through 5 with an IEP spending 0-39 percent of time with typically developing peers. If the Department were to include these two groups of children in the SPP/APR reporting, the total percent of children ages 3 through 5 with an IEP in an early childhood environment would represent 81.4 percent of all children ages 3 through 5with an IEP.
The Department examined the reporting of children ages 3 through 5 using the old federal educational environment categories and the new federal educational environment categories. This first year analysis indicated no significant difference in the educational environment categories that included separate school, residential facility, or home.

SPP Template – Part B (3) CONNECTICUT State
Part B State Performance Plan: 2005-2010 Monitoring Priority: FAPE in the LRE – Page 38 (OMB NO: 1820-0624 / Expiration Date: 2/29/2012) Indicator 6 – Early Childhood LRE
Children previously reported in the old category of reverse mainstream were now all in the new category “early childhood”. The children previously in a part-time early childhood, early childhood special education program were now in the new category “early childhood”. The children receiving itinerant services in 2004-05 school year either stayed in the itinerant category as “service provider location only” or moved to the category “early childhood” depending on whether they were attending any program or service with typically developing peers. Essentially, the first year crosswalk showed no significant difference as the state began to move from one data collection of educational environments to the new categories approved by the U.S. Department of Education. LRE Data Reported 2006-07 The data obtained through the new statewide data system, SEDAC, in the 2006-07 school year, indicate that 62.3 percent (n = 4259) of all children ages 3 through 5 with an IEP spend 80-100 percent of their time in the educational environment category of a regular early childhood program. The educational environment category of “early childhood” also indicates that there were 501 children, or 7.3 percent of children ages 3 through 5 with an IEP spending 40-79 percent of time with typically developing peers. There were 237 children, or 3.5 percent of children ages 3 through 5 with an IEP spending 0-39 percent of their time with typically developing peers. The total percent of children ages 3 through 5 with an IEP in an early childhood environment would represent 73.1 percent of all children ages 3 through 5 with an IEP.
This data analysis in the 2006-07 school year indicates that there continue to be no significant difference in the educational environment categories that included separate school, residential facility, or home. The data indicate that 1.0 percent of children were served in a separate school, 0.2 percent served in a residential facility and 0.2 percent were served at home. A total of 443 children or 6.5 percent received services through a service provider location and 1300 children or 19.0 percent were served in an early childhood special education program that had less than a 50-50 ratio of typically developing children to children with an IEP. Assurance of Valid, reliable Data in 2006-07 and Thereafter Note that due to changes in the 618 State-reported data collection, this indicator for the educational environment categories for children ages 3 through 5 with an IEP changed for the 2006 APR, due February 1, 2008. The Department emphasis in the 2006-07 school year and annually thereafter will be focused on the collection of valid and reliable data in order to provide baseline and targets in the 2007 APR, due February 1, 2009. Activities for the collection of accurate, timely, reliable and valid data will include:
• Reviewing and amending any directions and definitions in the SEDAC user manual utilized by school districts to ensure that data directions and guidance guarantee data accuracy, validity and reliability.
• Reviewing and revising the statewide training and technical assistance system for school district data managers and other personnel to ensure that the training informs the knowledge base of personnel providing and entering the data.

SPP Template – Part B (3) CONNECTICUT State
Part B State Performance Plan: 2005-2010 Monitoring Priority: FAPE in the LRE – Page 39 (OMB NO: 1820-0624 / Expiration Date: 2/29/2012) Indicator 6 – Early Childhood LRE
• Reviewing and amending any state documents such as the statewide IEP Form and Manual to ensure that the data elements that must be collected are aligned to the IEP Form and Manual. The information will be made publicly available through the Department’s web site.
• Providing individual and group targeted technical assistance for school district personnel and parents through the Department and the state Parent Information and Training Center, the Connecticut Parent Advocacy Center (CPAC).
• Contacting and working with private companies and purchased service vendors that provide school districts computerized IEPs to ensure that the purchased programs and IEP forms address all required data elements conform to and align with the collection requirements for the 618 data on the educational environments for children ages 3 through 5with an IEP.
• Reviewing the 2006-07 and 2007-08 data collection to identify needs and ensure that data reporting by school districts is valid and reliable.
Measurable and Rigorous Targets To be established after the reporting of baseline in accordance with the timelines established by the SPP/APR and the U.S. Department of Education, Office of Special Education Programs.
FFY
Measurable and Rigorous Targets
2005
(2005-2006) * Not required per OSEP instructions for FFY 2006.
2006 (2006-2007)
* Not required per OSEP instructions for FFY 2006.
2007 (2007-2008)
* Not required per OSEP instructions for FFY 2006.
2008 (2008-2009)
* Not required per OSEP instructions for FFY 2006.
2009 (2009-2010)
* Not required per OSEP instructions for FFY 2006.
2010 (2010-2011)
* Not required per OSEP instructions for FFY 2006.
* Note: The Department recognizes that while it is not inconsistent with the IDEA Part B to include numerical targets to increase the number of preschool and kindergarten-age children with IEPs to receive their special education and related services with typically developing peers, the Department will monitor school districts to ensure that placement decisions are made on an individual basis in conformity with 34 CFR sections 300.550 through 300.556 and that decisions regarding educational placements are not based upon any numerical target established by the Department.

SPP Template – Part B (3) CONNECTICUT State
Part B State Performance Plan: 2005-2010 Monitoring Priority: FAPE in the LRE – Page 40 (OMB NO: 1820-0624 / Expiration Date: 2/29/2012) Indicator 6 – Early Childhood LRE
Improvement Activities/Timelines/Resources:
Improvement Activities Timelines Resources • Provide targeted training and
technical assistance to ensure the accuracy, validity and reliability of data reported.
2005-06 through 2011
• Department personnel
• Develop and disseminate policy guidance documents specific to ensuring that children ages 3 through 5 with an IEP are provided a FAPE in the LRE.
2006-07 school year through 2011
• Department personnel
• Develop and disseminate policy guidance and other documents to ensure that the child’s IEP team understands the new data definitions for the educational environment of children ages 3 through 5 with an IEP.
2006-07 through 2011
• Department personnel
• Provide professional development opportunities for the broad early childhood and early childhood special education community including specific training and technical assistance on LRE and related issues for 3- and 4-year-old children.
2005-06 through 2011
• Department and State Education Resource Center (SERC) personnel
• Comprehensive System of Personnel Development (CSPD)
• Use the resources and training opportunities of the National Early Childhood Technical Assistance Center (NECTAC), the National Professional Development Center on Inclusion and other national centers, resources and training opportunities.
2005-06 through 2011
• NECTAC, NPDCI resource and training opportunities
• Include a specific LRE focus in the Department’s general supervision efforts and activities related to FAPE in the LRE for 3-, 4- and 5-year-old children with disabilities.
2005-06 through 2011
• Department personnel

SPP Template – Part B (3) CONNECTICUT State
Part B State Performance Plan: 2005-2010 Monitoring Priority: FAPE in the LRE – Page 41 (OMB NO: 1820-0624 / Expiration Date: 2/29/2012) Indicator 6 – Early Childhood LRE
Improvement Activities Timelines Resources • Conduct Department monitoring to
ensure that decisions regarding educational placements for 3-, 4- and 5-year-old children with an IEP are made on an individual basis in accordance with all applicable federal and state laws. Monitoring tools used will include: reviews of student records; interviews with administrators, teachers (general and special education), related service professionals; soliciting input from parents through forums and other venues; and conducting observations of the implementation of a children’s IEPs.
2005-06 through 2011; activities will be continued until such time when no longer appropriate as indicated by data or other sources.
• Department personnel
• Provide financial resources to support early childhood accreditation through the National Association for the Education of Young Children (NAEYC) for programs serving 3-, 4-and 5-year-old children with an IEP as an incentive for providing an LRE and provide related training and technical assistance to support programs in the NAEYC accreditation process.
2005-06 through 2008
• Funds up to $40,000 annually • Department personnel • SERC personnel
• Provide a statewide coaching model to support early childhood community-based programs and personnel in meeting the needs of children with social-emotional, challenging behavioral and/or mental health needs
2005-06 through 2010
• Funds up to $100,000 annually • Department personnel • Partnership with state agency
for children’s mental health

SPP Template – Part B (3) CONNECTICUT State
Part B State Performance Plan: 2005-2010 Monitoring Priority: FAPE in the LRE – Page 42 (OMB NO: 1820-0624 / Expiration Date: 2/29/2012) Indicator 6 – Early Childhood LRE
Improvement Activities Timelines Resources • Provide a statewide coaching
model and training and technical assistance to support early childhood community-based programs and personnel in implementing a Response to Intervention (RtI) model for preschool-age children called Recognition and Response.
2005-06 through 2009
• Funds up to $40,000 annually • Department personnel
• Provide parent training opportunities to ensure that parents are informed and knowledgeable about LRE settings for children 3, 4, and 5 years of age with disabilities, particularly those families transitioning from the Connecticut Birth to Three System.
2005-06 through 2011
• Part C personnel • Department personnel • Parent Training and
Information Center (PTI) – The Connecticut Parent Advocacy Center (CPAC)
• Work with Higher Education institutions preparing early childhood personnel, particularly two- and four-year institutions, to ensure that individuals working with young children in community-based settings are prepared to serve all children of varying abilities, including children with disabilities.
2005-06 through 2010
• Department personnel
• Ensure that children with disabilities are included in the design and infrastructure development as the state works toward universal preschool for all children.
2005-06 through 2015
• Department personnel

SPP Template – Part B (3) CONNECTICUT State
Part B State Performance Plan: 2005-2010 Monitoring Priority: FAPE in the LRE – Page 43 (OMB NO: 1820-0624 / Expiration Date: 2/29/2012) Indicator 7 – Early Childhood Outcomes
Part B State Performance Plan (SPP) for 2005-2010
Overview of the State Performance Plan Development:
See Overview page i
Monitoring Priority: FAPE in the LRE
Indicator 7: Percent of preschool children aged 3 through 5 with IEPs who demonstrate improved:
A. Positive social-emotional skills (including social relationships);
B. Acquisition and use of knowledge and skills (including early language/ communication and early literacy); and
C. Use of appropriate behaviors to meet their needs.
(20 U.S.C. 1416 (a)(3)(A))
Measurement:
Outcomes:
A. Positive social-emotional skills (including social relationships);
B. Acquisition and use of knowledge and skills (including early language/communication and early literacy); and
C. Use of appropriate behaviors to meet their needs.
Progress categories for A, B and C:
a. Percent of preschool children who did not improve functioning = [(# of preschool children who did not improve functioning) divided by (# of preschool children with IEPs assessed)] times 100.
b. Percent of preschool children who improved functioning but not sufficient to move nearer to functioning comparable to same-aged peers = [(# of preschool children who improved functioning but not sufficient to move nearer to functioning comparable to same-aged peers) divided by (# of preschool children with IEPs assessed)] times 100.
c. Percent of preschool children who improved functioning to a level nearer to same-aged peers but did not reach it = [(# of preschool children who improved functioning to a level nearer to same-aged peers but did not reach it) divided by (# of preschool children with IEPs assessed)] times 100.
d. Percent of preschool children who improved functioning to reach a level comparable to same-aged peers = [(# of preschool children who improved functioning to reach a level comparable to same-aged peers) divided by (# of preschool children with IEPs assessed)] times 100.
e. Percent of preschool children who maintained functioning at a level comparable to same-aged peers = [(# of preschool children who maintained functioning at a level comparable to same-aged peers) divided by (# of preschool children with IEPs assessed)] times 100.
Summary Statements for Each of the Three Outcomes (use for FFY 2008-2009 reporting):
Summary Statement 1: Of those preschool children who entered the preschool program below age expectations in each Outcome, the percent who substantially increased their rate of growth by the time they turned 6 years of age or exited the program.
Measurement for Summary Statement 1:
Percent = # of preschool children reported in progress category (c) plus # of preschool children reported in category (d) divided by [# of preschool children reported in progress category (a) plus # of preschool children reported in progress category (b) plus # of preschool children reported in progress category (c)

SPP Template – Part B (3) CONNECTICUT State
Part B State Performance Plan: 2005-2010 Monitoring Priority: FAPE in the LRE – Page 44 (OMB NO: 1820-0624 / Expiration Date: 2/29/2012) Indicator 7 – Early Childhood Outcomes
plus # of preschool children reported in progress category (d)] times 100.
Summary Statement 2: The percent of preschool children who were functioning within age expectations in each Outcome by the time they turned 6 years of age or exited the program.
Measurement for Summary Statement 2: Percent = # of preschool children reported in progress category (d) plus [# of preschool children reported in progress category (e) divided by the total # of preschool children reported in progress categories (a) + (b) + (c) + (d) + (e)] times 100.
The content in The “Overview of Issue/Description of System or Process” in Indicator #7 is unchanged from the prior years’ submissions.
Overview of Issue/Description of System or Process The Connecticut State Department of Education (CSDE) established a statewide system to collect data on the developmental and functional progress of 3-, 4- and 5-year-old children with IEPs in the preschool grade. Information obtained through a statewide data collection system are used to report on the three early childhood outcome measurement areas: positive social-emotional skills, including social relationships; acquisition and use of knowledge and skills, including early language/communication and early literacy; and use of appropriate behaviors to meet needs. Connecticut’s statewide early childhood outcome measurement system for 3-, 4- and 5-year-old children receiving special education and related services consists of three major activities: (1) the development, implementation, evaluation and continued refinement of policies, procedures and practices for measuring child outcomes; (2) the development, implementation, evaluation and continued refinement of training and technical assistance; and (3) the development, implementation, evaluation and continued refinement of a statewide data collection system. The first major activity, the development and implementation of statewide policies, procedures and practices, is specific to the early childhood outcome reporting requirement. The CSDE has developed policies and procedures that establish state guidance on how the early childhood outcome assessment is to be conducted, by whom, when and within what prescribed timeline. The established policies and procedures were used to develop and disseminate an Early Childhood Outcome (ECO) Question and Answer document which has been updated annually. The document outlines the requirements for all school districts and personnel in the state working with the population of children ages 3 through 5 with an IEP. This ECO Question and Answer document is used as the framework for informing school district personnel of their obligations to collect and report information for this indicator. The CSDE utilized feedback from school district personnel to evaluate the CSDE’s policies and procedures and amended them as appropriate over the course of the implementation of the early childhood outcome requirement starting in 2005-06 and then again in each subsequent year. The CSDE will continue to re-evaluate state policies and procedures for this indicator. Policies and procedures will be updated annually by evaluating implementation at the state and local level and by obtaining continuous feedback from school personnel, families and other stakeholders. The second major activity, the provision of training and technical assistance to school district administrators and personnel, was a major focus in the 2005-06 school year and again in each

SPP Template – Part B (3) CONNECTICUT State
Part B State Performance Plan: 2005-2010 Monitoring Priority: FAPE in the LRE – Page 45 (OMB NO: 1820-0624 / Expiration Date: 2/29/2012) Indicator 7 – Early Childhood Outcomes
subsequent school year. The major goal of the training and technical assistance was to ensure that all school district personnel were knowledgeable about the early childhood outcome requirement and that personnel had the skills and competencies in the use of the assessment instrument in order to ensure consistency, reliability and validity in conducting the assessment and ultimately in ensuring accuracy in the measurement reporting. Focused training and technical assistance has taken place annually since the 2005-06 school year. Targeted training and technical assistance has been available on the administration of the assessment tool, on state policies and procedures for meeting this requirement and on the requirements and mechanisms for data collection and reporting. Within the context of developing and implementing training and technical assistance, CSDE activities embedded evidence-based practices in child assessment in meeting the early childhood outcome requirement. Beginning in 2006-07 and annually thereafter, the CSDE enlisted the state’s Regional Educational Service Centers (RESCs) to provide more regionally-based and individualized training and technical assistance to their member school districts. Training and technical assistance materials were developed over the course of the implementation of this requirement and were made available during the trainings and in targeted technical assistance to school districts. All trainings were evaluated by a feedback form completed by participants. The evaluation information from participants was used to review and revise policies and procedures as well as inform future training and technical assistance activities. This type of training and technical assistance and the cycle of evaluation and refinement will continue on an annual basis. It is anticipated that in future years, statewide and regional training and technical assistance will be directed to topics and areas that are identified as a result of the analysis of the early childhood outcome data on child progress. An example of a training need that could potentially be identified through an analysis of the data might be related to the collection and reporting of accurate and valid data. Another possible example of targeted training and technical assistance could occur if the state data indicates that children do not appear to be making progress in the area of early literacy. Consequently, the CSDE could then focus its training and technical assistance resources on early reading and literacy development. In relation to general pre-service and in-service training, the CSDE does have an active Comprehensive System of Personnel Development (CSPD) Council that can advise and assist in the identification of training and technical assistance as well as make pre-service and in-service recommendations in areas identified in the implementation of the early childhood outcome data collection. The CSPD Council may also be instrumental in helping to advise higher education institutions of the state’s needs relating to personnel competencies and knowledge. Higher education’s attention to the identified needs of the state can lead to better prepared personnel entering the field of early childhood special education, particularly as it relates to child assessment and to creating teaching and learning environments that maximize children’s developmental and functional skills. The third activity is the development, implementation and evaluation of a statewide data system for data input, data verification and data analysis. A data collection system for the 2005-06 school year was developed and implemented. The data collection in 2005-06 consisted of a data disc to collect Point 1 information on all children with an IEP entering special education for reporting in the SPP submitted in February 2007. In the 2006-07 school year, the CSDE developed and implemented a Web-based data collection system. The Web-based data collection
SPP Template – Part B (3) CONNECTICUT State
Part B State Performance Plan: 2005-2010 Monitoring Priority: FAPE in the LRE – Page 46 (OMB NO: 1820-0624 / Expiration Date: 2/29/2012) Indicator 7 – Early Childhood Outcomes
system that was developed and implemented is ‘live’ meaning that access by school districts for reporting child information is available throughout the calendar year except for a small portion of time in which the CSDE closes the system to capture and analyze data for reporting in the SPP/APR. The data collection system captures the child’s name, birth date, unique student identification number, the dates the test administration was completed and the specific data collected about the child’s developmental and functional progress. The Web-based data collection system collects Point 1 and Point 2 data on individual children and provides the aggregate child progress information that is analyzed and subsequently reported in the SPP and APR. The CSDE also collects and maintains an e-mail distribution list of all individuals within a school district who have responsibilities related to the early childhood outcome requirement, including the data managers at the school district level who are responsible for the early childhood outcome data. This mechanism for e-mail communication with the districts allows the CSDE to ensure that school districts have up-to-date information and allows for a system of communication for data verification and correction of missing or inaccurate student data. The parameters for the statewide early childhood outcome measurement system consist of the following: Who will be included in the State’s early childhood outcome system? For progress reporting on this indicator, all 3-, 4- and 5-year-old children who have been determined eligible for special education and who have an IEP in place for at least six months before entering kindergarten will be included in the early childhood outcome assessment system. All eligible children with an IEP will be administered a single state identified assessment tool to collect child specific data in each of the three early childhood outcome areas. There are no child exceptions for the exclusion of any child for any particular disability category, for the developmental and functional abilities of any child or for the level of service a given child receives. The CSDE’s requirement is that every child, ages 3-, 4- and 5-years-old, found eligible for special education and related services and who receives at least six months of special education before kindergarten entry will be included in the progress reporting for this indicator. The state does not employ a sampling methodology to address this indicator. Who will conduct the assessment and when? The child’s primary early childhood special education service provider, either the child’s early childhood special education teacher and/or the child’s speech and language pathologist, will conduct the assessment to collect Point 1 and Point 2 data. The child’s early childhood special education service provider must conduct the assessment to collect Point 1 data within the first four weeks that the child begins receiving their special education and related services. It will be the early childhood special education service provider’s responsibility to collect Point 2 data for those children exiting preschool special education for any reason and/or prior to entering kindergarten. The guidance for the collection of Point 2 data identifies that the collection of assessment information should take place in the spring of the school year and at most within eight to ten weeks prior to a child’s exit from the preschool grade.

SPP Template – Part B (3) CONNECTICUT State
Part B State Performance Plan: 2005-2010 Monitoring Priority: FAPE in the LRE – Page 47 (OMB NO: 1820-0624 / Expiration Date: 2/29/2012) Indicator 7 – Early Childhood Outcomes
What assessment instrument was selected by the state and why? The CSDE selected a single statewide assessment instrument, the Brigance Diagnostic Inventory of Early Development II© (Brigance), a criterion-referenced assessment instrument, for the collection and reporting of early childhood outcome data. One reason for the selection of the Brigance was that many of the sub-domains of the Brigance correspond to the early childhood outcome areas that states are required to measure. Another reason for the selection of the Brigance is that many of the Brigance’s sub-domain areas could be cross-walked to the Connecticut Preschool Curriculum Framework (2006) and the Connecticut Preschool Assessment Framework (2005). The CSDE requires school districts to administer the Brigance as a criterion-reference instrument, not as a standardized instrument, which is one of the options of the Brigance Diagnostic Inventory of Early Development II©. By using the Brigance as a criterion-referenced instrument, school district personnel can obtain information from direct testing when required, through observation in a natural setting, through parent report or through the reporting of a child’s skills and behaviors by individuals close to the child (e.g., the child’s early childhood teacher). The Brigance also allows for the test administration of items to be modified or adapted based upon the needs of individual children. It can be administered across settings and situations with a focus on a child’s functioning and performance. The purpose of administering the Brigance over the course of weeks by the professionals with the primary responsibility for the education of the child, is to obtain child specific information based upon an authentic assessment of a child. Observing the child within the context of their learning environment and using information from a child’s parents and others close to the child allows for richer and more authentic information regarding a child’s developmental and functional skills to be obtained both at entry to and at exit from preschool special education. It should be noted that Connecticut is not utilizing the same assessment instrument as the state’s Part C program. In Connecticut, the Part C program chose the Hawaii Early Learning Profile (HELP) and the Carolina Curriculum for Infants and Toddlers with Special Needs as the assessment instruments that would be administered in the Part C program in order to collect child specific information. The HELP and the Carolina Curriculum are the two curriculum-based assessment options that Part C providers are required to use to collect early childhood outcome information. When Part C collects information on how each child is functioning, that information is then converted to the seven-point scale for those children receiving early intervention services in the state. The CSDE’s IDEA 619 program did not select either curriculum-based assessment tool opting instead to support the use of the state’s progress monitoring tool, the Connecticut Preschool Assessment Framework (2005), for all children, including children receiving special education and related services. The CSDE did purchase a Brigance testing manual for each school district. Each school district also received a small number of Brigance Developmental Record Booklets to be used to collect child specific Point 1 and Point 2 information. The state purchase was intended to off-set some of the initial costs that a school district would incur in order to move forward in the collection of child progress information, most specifically the collection of Point 1 information in 2005-06 and progress data for 2006-07 and annually thereafter. As needed, school districts are expected to purchase additional testing manuals and record booklets.

SPP Template – Part B (3) CONNECTICUT State
Part B State Performance Plan: 2005-2010 Monitoring Priority: FAPE in the LRE – Page 48 (OMB NO: 1820-0624 / Expiration Date: 2/29/2012) Indicator 7 – Early Childhood Outcomes
What is the Department’s purpose in selecting the Brigance? The CSDE selected the Brigance Diagnostic Inventory of Early Development II© primarily for the purpose of utilizing the assessment instrument for federal reporting purposes and for evaluating, monitoring and publicly reporting on the status of individual school districts in the state with regard to this indicator. The Brigance was not selected, and school districts are not required, to utilize this instrument to determine a child’s eligibility for special education. The process of a child’s eligibility determination, including the selection of assessment instruments, personnel, methods and procedures should be individually designed by the child’s IEP Team with the parent’s participation and based upon the presenting concerns that prompted a child’s referral to special education. The Brigance was also not selected for the purpose of curriculum planning for a child or for a group of children. The Connecticut State Board of Education endorses and supports the Connecticut Preschool Curriculum Framework (2006) which defines the state’s early learning standards. The Connecticut State Board of Education also endorses and supports the Connecticut Preschool Assessment Framework (2005) which is the progress state’s progress monitoring tool. Both documents are used statewide for all programs serving the preschool-age population, including preschool-age children with disabilities. The CSDE supports the utilization of curricula for typically developing children in a teaching and learning environment which provides a focus on high expectations for all learners. Separate disability specific curricula could supplement, but should not replace nor serve as the sole basis for planning programs and delivering instruction to young children with an IEP. What Brigance sub-tests will be administered? The state selected a subset of Brigance sub-tests which correlate to the early childhood outcome questions for federal reporting. The CSDE sent the list of selected sub-tests to the Brigance IED-II test developer and publisher for review and approval. Feedback from both the developer and publisher of the Brigance IED-II was that the sub-tests selected were sufficiently varied and representative of the instrument, hence not compromising either the intent or the integrity of the instrument and were felt to sufficiently answer the federal questions regarding child progress. The Brigance sub-tests selected by the CSDE are required to be administered to all children 3, 4 and 5-years of age with an IEP entering the preschool grade and receiving special education and related services. The assessment, specifically the state’s required sub-tests of the assessment instrument, will be used to collect data at a child’s entry to and exit from special education from the preschool grade. In selecting specific sub-tests of the Brigance for administration, the CSDE selected sub-tests of the Brigance that (a) sufficiently answered the three federally required early childhood outcome questions regarding a child’s developmental and functional skills and (b) were as inclusive as possible of the skills and behaviors children might potentially demonstrate between the ages of birth through age 7. The CSDE’s goal was to ensure that the sub-tests and the sub-test items were as varied and yet as inclusive as possible in order to capture information on children who might be demonstrating skills and behaviors either significantly below or significantly above age expectations. The CSDE recognizes that children’s early learning and development are multidimensional and the developmental and functional skills of children are inter-related. Children are capable and competent learners and they can exhibit, at any point in time, individual differences in their developmental and functional growth with a range of skills and competencies that can be quite varied. The CSDE organized the Brigance selected sub-tests by outcome

SPP Template – Part B (3) CONNECTICUT State
Part B State Performance Plan: 2005-2010 Monitoring Priority: FAPE in the LRE – Page 49 (OMB NO: 1820-0624 / Expiration Date: 2/29/2012) Indicator 7 – Early Childhood Outcomes
measurement area to assist service providers in seeing how the developmental domains and curricula areas of the assessment correspond to a child’s skills and competencies in functional areas for outcome reporting. The selected sub-tests were organized by outcome area to also allow for the analysis of data in relation to developmental domains, functional skills and pre-academic areas. Information obtained from analysis of data would ultimately provide a vehicle for identifying focused and targeted training and technical assistance in a teaching and learning area. The state selected the following Brigance sub-tests to answer the three early childhood outcome questions:
Positive Social Relationships (including social relationships)
• Sub-Test G-1 General Social-Emotional Development • Sub-Test G-3 Initiative, Engagement, Behaviors
Acquisition & Use Knowledge and Skills (including early language/communication and early literacy)
Language • Sub-Test E-4 General Speech & Language Development • Sub-Test E-7 Verbal Directions • Sub-Test F-6 Directional
Cognition • Sub-Test E-8 Picture Vocabulary • Sub-Test F-5 Quantitative • Sub-Test F-7 Classifying
Literacy • Sub-Test C-3 Handwriting • Sub-Test F-1 Response to Experience with Books
Action To Meet Needs
Motor – Gross Motor • Sub-Test B-1 Standing • Sub-Test B-2 Walking • Sub-Test B-4 Running • Sub-Test B-10 Rolling and Throwing
Motor – Fine Motor • Sub-Test C-1 General Eye, Hand, Finger Skills
Self-Help • Sub-Test D-1 Feeding and Eating • Sub-Test D-3 Dressing • Sub-Test D-6 Toileting
The CSDE reviewed the cross-walk made available by the Early Childhood Outcome (ECO) Center which cross-walked various sub-test of the Brigance to the early childhood outcome questions. The CSDE also created a cross-walk of some of the selected sub-tests of the Brigance with the Connecticut Preschool Curriculum Framework (2006) and the Connecticut Preschool
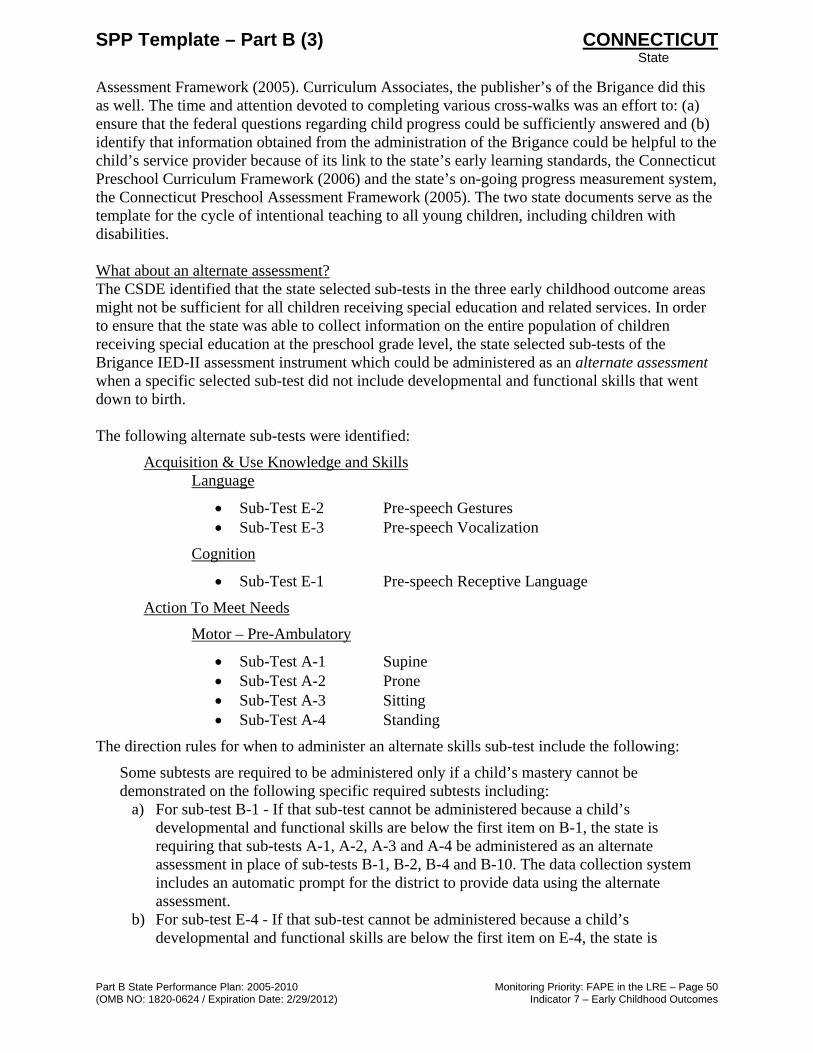
SPP Template – Part B (3) CONNECTICUT State
Part B State Performance Plan: 2005-2010 Monitoring Priority: FAPE in the LRE – Page 50 (OMB NO: 1820-0624 / Expiration Date: 2/29/2012) Indicator 7 – Early Childhood Outcomes
Assessment Framework (2005). Curriculum Associates, the publisher’s of the Brigance did this as well. The time and attention devoted to completing various cross-walks was an effort to: (a) ensure that the federal questions regarding child progress could be sufficiently answered and (b) identify that information obtained from the administration of the Brigance could be helpful to the child’s service provider because of its link to the state’s early learning standards, the Connecticut Preschool Curriculum Framework (2006) and the state’s on-going progress measurement system, the Connecticut Preschool Assessment Framework (2005). The two state documents serve as the template for the cycle of intentional teaching to all young children, including children with disabilities. What about an alternate assessment? The CSDE identified that the state selected sub-tests in the three early childhood outcome areas might not be sufficient for all children receiving special education and related services. In order to ensure that the state was able to collect information on the entire population of children receiving special education at the preschool grade level, the state selected sub-tests of the Brigance IED-II assessment instrument which could be administered as an alternate assessment when a specific selected sub-test did not include developmental and functional skills that went down to birth. The following alternate sub-tests were identified:
Acquisition & Use Knowledge and Skills Language
• Sub-Test E-2 Pre-speech Gestures • Sub-Test E-3 Pre-speech Vocalization
Cognition
• Sub-Test E-1 Pre-speech Receptive Language
Action To Meet Needs
Motor – Pre-Ambulatory
• Sub-Test A-1 Supine • Sub-Test A-2 Prone • Sub-Test A-3 Sitting • Sub-Test A-4 Standing
The direction rules for when to administer an alternate skills sub-test include the following:
Some subtests are required to be administered only if a child’s mastery cannot be demonstrated on the following specific required subtests including:
a) For sub-test B-1 - If that sub-test cannot be administered because a child’s developmental and functional skills are below the first item on B-1, the state is requiring that sub-tests A-1, A-2, A-3 and A-4 be administered as an alternate assessment in place of sub-tests B-1, B-2, B-4 and B-10. The data collection system includes an automatic prompt for the district to provide data using the alternate assessment.
b) For sub-test E-4 - If that sub-test cannot be administered because a child’s developmental and functional skills are below the first item on E-4, the state is
SPP Template – Part B (3) CONNECTICUT State
Part B State Performance Plan: 2005-2010 Monitoring Priority: FAPE in the LRE – Page 51 (OMB NO: 1820-0624 / Expiration Date: 2/29/2012) Indicator 7 – Early Childhood Outcomes
requiring that sub-tests E-2 and E-3 be administered as an alternate assessment in place of sub-tests E-4, E-7 and F-6. The data collection system includes an automatic prompt for the district to provide data using the alternate assessment.
c) For sub-test E-8 (1) and (2) - If either or both sub-tests cannot be administered because a child’s developmental and functional skills are below the first item on E-8 the state is requiring that sub-tests E-1 be administered as an alternate assessment. The data collection system includes an automatic prompt for the district to provide data using the alternate assessment.
The CSDE anticipates that most children will not require assessment with the alternate assessment sub-tests (optional sub-tests) unless the child presents with physical, language and/or cognitive delays so significant that the child’s skills cannot be appropriately measured by the required sub-tests selected by the CSDE. Who will report the data to whom, in what form and how often? The CSDE is not using the Early Childhood Outcome Summary Form (COSF) to collect and/or report child progress data for this indicator. The CSDE relied on a data disc in the 2005-06 school year to collect information from across the state on all children who entered special education in the preschool grade. The data disc was sent to all school districts. Districts entered the required information and returned the disc with completed information to the CSDE. Information from the discs was aggregated by the CSDE and was used to present Point 1 information in the SPP submitted in February 2007. In 2006-07, the CSDE developed and implemented a Web-based system for the collection of early childhood outcome data. Information obtained from the data disc submitted the previous year was pre-populated into the Web-based data application. The Web-based data collection system is the vehicle for collecting data and information in the 2006-07 school year and in subsequent years. The data disc in 2005-06 and the Web-based data collection system for 2006-07 includes elements for reporting on each required Brigance IED-II sub-test and each alternate sub-test, as appropriate. The data fields for entering the child’s assessment results for each of the required sub-tests of the Brigance IED-II are organized by the instrument’s sub-domain headings. Two types of information are collected on each sub-test and include: (1) the highest skill item number that the child successfully demonstrated (mastery item) in a specific sub-test and (2) the number of missed items between the first item of the sub-test and the last item that the child demonstrated mastery. The same information is collected at Point 1 and Point 2. The collective information on Point 1 data representing each child that entered special education from May 1, 2006 to June 30, 2006 was aggregated and used for federal reporting in the SPP submitted February 2007. Beginning in 2006-07, Point 1 and Point 2 data were analyzed and used for reporting progress information in the SPP and APR. The state analysis will be able to answer the following questions:
(A) Did the child not improve functioning?
(B) Did the child improve but not at a level comparable to same-age peers?
(C) Did the child improve functioning close to same-age peers?
(D) Did the child reach functioning at a level comparable to same-age peers?

SPP Template – Part B (3) CONNECTICUT State
Part B State Performance Plan: 2005-2010 Monitoring Priority: FAPE in the LRE – Page 52 (OMB NO: 1820-0624 / Expiration Date: 2/29/2012) Indicator 7 – Early Childhood Outcomes
(E) Did the child maintain functioning at a level comparable to same-age peers?
How will ‘comparable to same age peers’ be determined? The CSDE’s decisions regarding data analysis and reporting is based upon the validity of the Brigance items which provide reference points for skills and behaviors expected of children within certain age bands. The Brigance test items are a result of extensive research and multiple validation studies. The items within each sub-test of the Brigance IED-II are hierarchically ordered to reflect the typical developmental trend of the increasing acquisition of children’s skills over time. In order to assist test administrators with the interpretation of results when the test is administered as a criterion-referenced assessment, certain items within each sub-test were determined by the developers of the Brigance IED-II to serve as age-specific benchmarks of skill acquisition. In conjunction with information gathered from validation and standardization studies, the Brigance IED–II developers determined the developmental age notations ascribed to specific items by compiling information from a comprehensive research base in the area of infant and early childhood development (a detailed bibliography is provided on pages 292-294 of the Brigance IED-II assessment). The ages (in months) ascribed to specific items increase from benchmark item to benchmark item. This corresponds to and reflects the hierarchical order of the items within each sub-test. Due to the inclusion of age-related benchmark items, the Brigance IED-II permits conclusions to be drawn about a child’s performance on a sub-test relative to their chronological age and provides for comparison of skills and behaviors expected of a child’s chronological age. The CSDE uses the instrument’s age-related benchmarks to determine comparable to same-age peers in the data analysis. What is the state’s ability to collect and analyze data? The CSDE has an electronic statewide data collection system for every student attending public school and an electronic statewide data collection system for every child receiving special education and related services. The statewide electronic data collection system for every student attending public schools is the Public School Information System (PSIS). The statewide electronic data collection system for students with an IEP is the Special Education Data Application and Collection (SEDAC). Both data systems are based upon a unique student identification number. The unique student identification number is called the State Assigned Student Identification Number (SASID). That number stays with the child throughout their school career and is used across data systems to capture individual student information. In 2006-07 and annually thereafter, the CSDE assigns each child receiving early intervention in the state’s Part C program a SASID. That same number stays with the child into their entry to the Part B system and/or entry to public school education. The utilization of the SASID number will assist the CSDE in using information from multiple database systems in any future analysis. Possible available future information from an analysis of the data could reflect and relate to the children who received or did not receive Part C services, the length of time children received special education, the disability category of children who received special education, the settings in which children received their services, etc., all of which could provide additional information and insight in relation to looking at the data on child progress. The data collected and aggregated at the state level can also potentially reflect children’s progress within various areas of development and functioning beyond the broad outcome areas used for reporting on this indicator. For example, the data system would be able to identify how children in the state are functioning in language, literacy or in their independence and self-help

SPP Template – Part B (3) CONNECTICUT State
Part B State Performance Plan: 2005-2010 Monitoring Priority: FAPE in the LRE – Page 53 (OMB NO: 1820-0624 / Expiration Date: 2/29/2012) Indicator 7 – Early Childhood Outcomes
skills. Available data will allow the CSDE to not only identify child progress in each of the three early childhood outcome areas as defined by this indicator but will also be able to provide information on children in each sub-test identified for each outcome area. This type of analysis may assist the CSDE in identifying content and curriculum areas for targeted training and technical assistance. On a school district level, this data may provide additional information as a program evaluation tool to assist individual school districts with improving their services and programs for children ages 3 through 5 with an IEP. How will the state ensure valid and reliable data? The CSDE chose a single assessment to be used to collect this information, the Brigance Diagnostic Inventory of Early Development II©. The instrument chosen has undergone rigorous reliability and validity studies. The state’s training and technical assistance, which includes the administration of the assessment instrument and the reporting of data, is designed to help ensure consistency in the test protocols and data reporting. There is also data verification that occurs by a series of validation checks built into the data collection system which helps ensure the reporting of valid and reliable data. To ensure that the data collected are valid and reliable, consultants in the RESCs were trained to provide support to school districts on test administration and scoring. Training on item scoring is directly related to data collection and data entry thereby helping to ensure the validity and reliability of data. The CSDE also has personnel that provide targeted training and technical assistance to school districts regarding the child specific assessment information that must be entered into the Web-based data collection system. CSDE personnel that provide technical assistance with regard to the data collection include: IDEA Part B personnel; the IDEA Part B data manager; data personnel, including PSIS and SEDAC staff; and the Part B 619 coordinator. The Web-based data application also provides data checks against the entry of inaccurate data and requires users to enter complete student records prior to having the ability to save a child’s test item scores. For each test item, the data menu only allows the selections (i.e., mastery item, number of items missed) appropriate to individual sub-tests. The data application allows for a review and edits checks of the data in relation to individual children. Periodic review and analysis of the data by CSDE personnel occur to ensure valid and reliable data. What are the data checks for ensuring valid and reliable data? Connecticut’s Web-based data collection system for collecting outcome data is a secure, Web-based application that is accessible by all school districts in the state. Data users at the school district level must receive an individual user pass code from the CSDE. The policies and procedures developed around the Web-based data collection ensure that student data is confidential and protected. The Web-based application for data entry has been available to districts since the spring of 2007. The data collection system uses Edit Checks/Business Rules specific to the Brigance IED-II assessment to ensure the validity of the data collected on individual children. Since all of the CSDE’s data systems rely on a SASID number, data on individual children can be validated against SEDAC, PSIS, and CSDE’s Student Registration Records. The Student Registration Records are constantly updated so that the student record system can be used for tracking student movement between schools and school districts. The PSIS data system collects student information in October, January and June which assists the CSDE by providing a snapshot of a district’s student roster which allows for validating a student’s enrollment as well as for the tracking of students.

SPP Template – Part B (3) CONNECTICUT State
Part B State Performance Plan: 2005-2010 Monitoring Priority: FAPE in the LRE – Page 54 (OMB NO: 1820-0624 / Expiration Date: 2/29/2012) Indicator 7 – Early Childhood Outcomes
In the 2007-08 school year, the data collection was refined and changed from a passive data collection to an active collection. Districts are only allowed to add data for students, who at the time of data entry, were actively registered with their school district. In addition, the PSIS data collections can be used to generate various reports for use by school districts. A data report lists all students in the preschool grade that are reported by a school district as a student who is receiving special education in the October, January or June data collections and who did not yet have Point 1 data entered in the Web-based data collection. There are additional data reports that can be used by school districts including a report which lists all of the students that had Point 1 data on ECO and for whom Point 2 data should have been provided or will need to be provided at a future date. The data system also allows for school districts to explain to the CSDE why Point 2 data might not be available. The CSDE allows for school districts to report that: (a) a child received less than 6 months of service or (b) the child suddenly moved and became unavailable. Both reasons can be verified by the CSDE through the PSIS and SEDAC systems and the Student Registration information collected throughout the year. How will the data be analyzed? From data collected in 2005-06 and reported in the SPP in February 2007, the CSDE reported on the percent of children in each outcome area whose Point 1 data indicated that they were performing at a level comparable to same-age peers. This was determined by the proportion of children for whom the skills and behaviors on each sub-test within an outcome area demonstrated mastery at or above an age appropriate level (e.g., the child fell within an age band commensurate with the child’s chronological age). Similarly, the percent of children whose Point 1 data indicate that they were not performing at a level comparable to same-age peers was determined by the proportion of children for whom the skills and behaviors in one or more of the sub-tests within an outcome area demonstrated that a child was not demonstrating skills comparable to same-age peers (e.g., the child fell outside of an age band commensurate with the child’s chronological age). From data collected in 2006-07 and reported in the SPP in February 2008 and annually thereafter, the CSDE is able to report on the developmental and functional progress for any child for whom both Point 1 and Point 2 data are available. The Point 1 child specific data will be compared to Point 2 child specific data in order to identify where a child’s progress falls across the five outcome measurement categories. That information will be aggregated for federal reporting. The current general decision points for answering each of the five child progress measures for each of the three early childhood outcome questions include the following:
Progress Question Decision Point
A. Did the child not improve functioning?
The child’s Point 2 data indicate that the child did not demonstrate skills at a level comparable to same age peers (“post-test score age” determined by the average of highest post-test score items mastered was less than actual post-test age) and at Point 2 the child did not demonstrate any new skill on any of the sub-tests administered for a particular outcome question (on all subtests, post-test highest item mastered is less than or equal to pre-test highest item mastered).

SPP Template – Part B (3) CONNECTICUT State
Part B State Performance Plan: 2005-2010 Monitoring Priority: FAPE in the LRE – Page 55 (OMB NO: 1820-0624 / Expiration Date: 2/29/2012) Indicator 7 – Early Childhood Outcomes
Progress Question Decision Point
B. Did the child improve but not at a level comparable to same-age peers?
The child’s Point 2 data indicate that the child did not demonstrate skills at a level comparable to same age peers (“post-test score age” determined by the average of highest post-test score items mastered was less than actual post-test age) and between Point 1 and Point 2 the child was able to demonstrate the acquisition of one or more new skills, although the growth in score age was less than the growth in actual age (amount of learning is less than the amount of passed time in special education).
C. Did the child improve functioning close to same-age peers?
The child’s Point 2 data indicate that the child did not demonstrate skills at a level comparable to same age peers (“post-test score age” determined by the average of highest post-test score items mastered was less than actual post-test age) and between Point 1 and Point 2 the child was able to demonstrate the acquisition of one or more new skills AND the growth in score age was equal to or greater than the growth in actual age (the amount of learning is greater than or equal to the amount of passed time in special education).
D. Did the child reach functioning at a level comparable to same-age peers?
The child’s Point 1 data indicate that the child did not demonstrate skills at a level comparable to same age peers and at Point 2 the child was able to demonstrate skills at a level comparable to same age peers.
E. Did the child maintain
functioning at a level comparable to same-age peers?
The child’s Point 1 data indicate the child was demonstrating skills at a level comparable to same age peers and at Point 2 the child continued to demonstrate skills at a level comparable to same age peers.
The data collected and analyzed are consistent with the measurement expectations outlined in the early childhood outcome indicator. All data analyzed by the CSDE uses the above decision rules and method in the analysis. Child Progress Measurement Data for 2008-09 The following chart provides child progress information with the actual numbers used in the calculation and represents the state’s early childhood outcome data collected from July 1, 2008, to June 30, 2009.

SPP Template – Part B (3) CONNECTICUT State
Part B State Performance Plan: 2005-2010 Monitoring Priority: FAPE in the LRE – Page 56 (OMB NO: 1820-0624 / Expiration Date: 2/29/2012) Indicator 7 – Early Childhood Outcomes
Child Progress in Measurement Categories for Children Exiting 2008-2009
Positive social-emotional skills (including social relationships):
Number of Children
Percent of Children
a) Percent of children who did not improve functioning 89 3.4%
b) Percent of children who improved functioning but not sufficient to move nearer to functioning comparable to same-aged peers
632 24.4%
c) Percent of children who improved functioning to a level nearer to same-aged peers but did not reach
465 18.0%
d) Percent of children who improved functioning to reach a level comparable to same-aged peers
544 21.0%
e) Percent of children who maintained functioning at a level comparable to same-aged peers
857 33.1%
Total N =2587 100%
Acquisition and use of knowledge and skills (including early language/communication and early literacy):
Number of Children
Percent of Children
a) Percent of children who did not improve functioning 25 1.0%
b) Percent of children who improved functioning but not sufficient to move nearer to functioning comparable to same-aged peers
775 30.0%
c) Percent of children who improved functioning to a level nearer to same-aged peers but did not reach
932 36.0%
d) Percent of children who improved functioning to reach a level comparable to same-aged peers
356 13.8%
e) Percent of children who maintained functioning at a level comparable to same-aged peers
499 19.3%
Total N = 2587 100%
Use of appropriate behaviors to meet their needs: Number of Children
Percent of Children
a) Percent of children who did not improve functioning 42 1.6%
b) Percent of children who improved functioning but not sufficient to move nearer to functioning comparable to same-aged peers
1065 41.2%
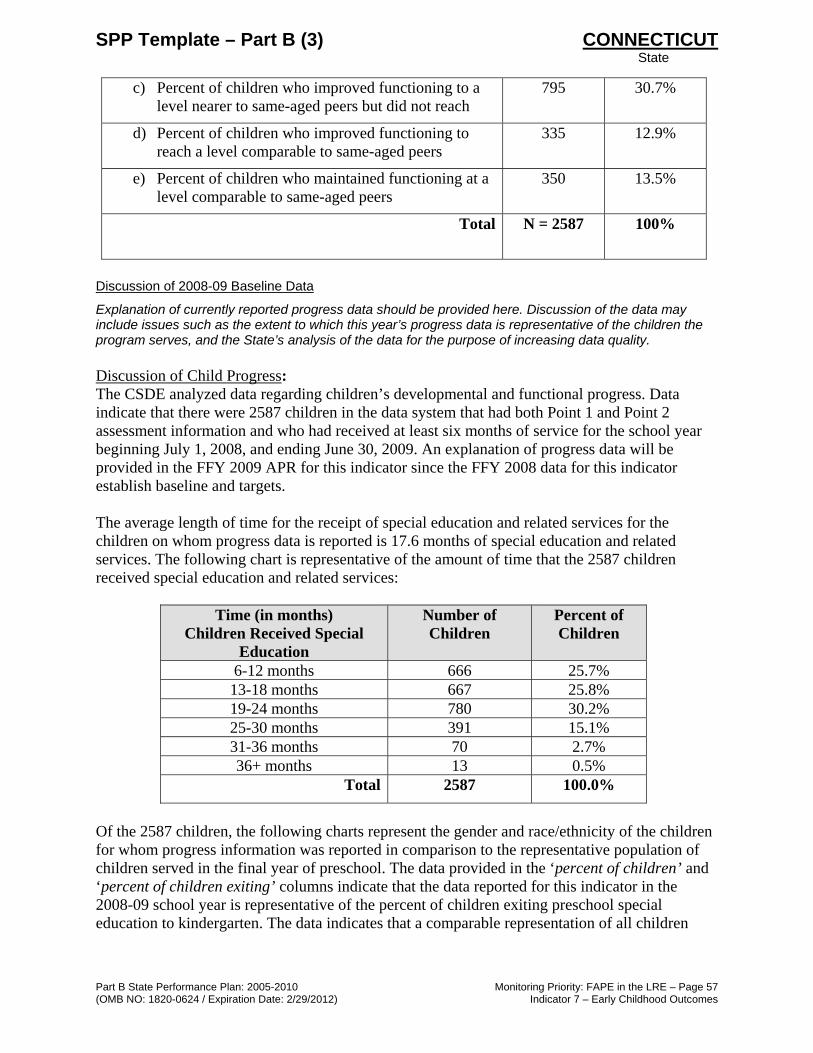
SPP Template – Part B (3) CONNECTICUT State
Part B State Performance Plan: 2005-2010 Monitoring Priority: FAPE in the LRE – Page 57 (OMB NO: 1820-0624 / Expiration Date: 2/29/2012) Indicator 7 – Early Childhood Outcomes
c) Percent of children who improved functioning to a level nearer to same-aged peers but did not reach
795 30.7%
d) Percent of children who improved functioning to reach a level comparable to same-aged peers
335 12.9%
e) Percent of children who maintained functioning at a level comparable to same-aged peers
350 13.5%
Total N = 2587 100%
Discussion of 2008-09 Baseline Data
Explanation of currently reported progress data should be provided here. Discussion of the data may include issues such as the extent to which this year’s progress data is representative of the children the program serves, and the State’s analysis of the data for the purpose of increasing data quality. Discussion of Child Progress: The CSDE analyzed data regarding children’s developmental and functional progress. Data indicate that there were 2587 children in the data system that had both Point 1 and Point 2 assessment information and who had received at least six months of service for the school year beginning July 1, 2008, and ending June 30, 2009. An explanation of progress data will be provided in the FFY 2009 APR for this indicator since the FFY 2008 data for this indicator establish baseline and targets. The average length of time for the receipt of special education and related services for the children on whom progress data is reported is 17.6 months of special education and related services. The following chart is representative of the amount of time that the 2587 children received special education and related services:
Time (in months) Children Received Special
Education
Number of Children
Percent of Children
6-12 months 666 25.7% 13-18 months 667 25.8% 19-24 months 780 30.2% 25-30 months 391 15.1% 31-36 months 70 2.7% 36+ months 13 0.5%
Total 2587 100.0%
Of the 2587 children, the following charts represent the gender and race/ethnicity of the children for whom progress information was reported in comparison to the representative population of children served in the final year of preschool. The data provided in the ‘percent of children’ and ‘percent of children exiting’ columns indicate that the data reported for this indicator in the 2008-09 school year is representative of the percent of children exiting preschool special education to kindergarten. The data indicates that a comparable representation of all children

SPP Template – Part B (3) CONNECTICUT State
Part B State Performance Plan: 2005-2010 Monitoring Priority: FAPE in the LRE – Page 58 (OMB NO: 1820-0624 / Expiration Date: 2/29/2012) Indicator 7 – Early Childhood Outcomes
receiving special education at the preschool level is evident in the FFY 2008 outcome data in relation to gender and race/ethnicity.
Gender Number of Children in ECO Data
Children in ECO Data
Children Served in Pre-K in 2008-09
Female 715 27.6% 26.8% Male 1872 72.4% 73.2%
Total 2587 100% 100%
Race/Ethnicity Number of Children in ECO Data
Children in ECO Data
Children Served in Pre-K in 2008-09
Am. Indian/Native Alaskan 12 0.5%
0.4%
Asian 76 2.9% 3.0% Black 329 12.7% 11.9% White 1679 64.9% 64.3% Hispanic 491 19.0% 20.3%
Total 2587 100.0% 100% The CSDE continues to address the issue of data quality in the collection, analysis and reporting of data for this indicator. Data integration across multiple CSDE data systems has enhanced the assurance of data accuracy and reporting. The CSDE uses the state’s all student data collection system, PSIS, to assist in tracking children who have moved from one school district to another. PSIS has also assisted in identifying the start date of special education to ensure that all newly identified children are included and that Point 1 data is obtained for all children in the data collection. PSIS also assists in identifying when children have exited preschool to kindergarten to ensure the collection and reporting of Point 2 data for all children who exit. The data collection system for this indicator also has a number of edit checks which help ensure that the data is accurate. Follow-up technical assistance and support on ensuring timely and accurate data is provided by the CSDE. These and other continuing activities allow for enhanced data quality and reliability.
Baseline Data for Preschool Children Exiting 2008-2009
Summary Statements
Outcome A: Positive social-emotional skills (including social relationships)
% of children
1. Of those children who entered the program below age expectations in Outcome A, the percent who substantially increased their rate of growth by the time they turned 6 years of age or exited the program.
58.3%

SPP Template – Part B (3) CONNECTICUT State
Part B State Performance Plan: 2005-2010 Monitoring Priority: FAPE in the LRE – Page 59 (OMB NO: 1820-0624 / Expiration Date: 2/29/2012) Indicator 7 – Early Childhood Outcomes
Summary Statements
2. The percent of children who were functioning within age expectations in Outcome A by the time they turned 6 years of age or exited the program.
54.2%
Outcome B: Acquisition and use of knowledge and skills (including early language/communication and early literacy)
% of children
1. Of those children who entered the program below age expectations in Outcome B, the percent who substantially increased their rate of growth by the time they turned 6 years of age or exited the program.
61.7%
2. The percent of children who were functioning within age expectations in Outcome B by the time they turned 6 years of age or exited the program.
33.0%
Outcome C: Use of appropriate behaviors to meet their needs
% of children
1. Of those children who entered the program below age expectations in Outcome C, the percent who substantially increased their rate of growth by the time they turned 6 years of age or exited the program.
50.5%
2. The percent of children who were functioning within age expectations in Outcome C by the time they turned 6 years of age or exited the program
26.5%
Measurable and Rigorous Targets [as stated in the Part B Indicator Measurement Table] Targets for Preschool Children Exiting in FFY 2009 (2009-10) and FFY 2010 (2010-2011) and Subsequently Reported in February 2011 and February 2012.
Established Targets for ECO Summary Statements
Outcome A: Positive social-emotional skills (including social relationships)
Target FFY 2009
% of Children
Target FFY 2010
% of Children
1. Of those children who entered the program below age expectations in Outcome A, the percent who substantially increased their rate of growth by the time they turned 6 years of age or exited the program.
56.0% 58.4%
2. The percent of children who were functioning within age expectations in Outcome A by the time they turned 6 years of age or exited the program.
52.0% 54.3%

SPP Template – Part B (3) CONNECTICUT State
Part B State Performance Plan: 2005-2010 Monitoring Priority: FAPE in the LRE – Page 60 (OMB NO: 1820-0624 / Expiration Date: 2/29/2012) Indicator 7 – Early Childhood Outcomes
Established Targets for ECO Summary Statements
Outcome B: Acquisition and use of knowledge and skills (including early language/communication and early literacy)
Target FFY 2009
% of Children
Target FFY 2010
% of Children
1. Of those children who entered the program below age expectations in Outcome A, the percent who substantially increased their rate of growth by the time they turned 6 years of age or exited the program.
59.0% 61.8%
2. The percent of children who were functioning within age expectations in Outcome A by the time they turned 6 years of age or exited the program.
31.0% 33.1%
Outcome C: Use of appropriate behaviors to meet their needs
Target FFY 2009
% of Children
Target FFY 2010
% of Children
1. Of those children who entered the program below age expectations in Outcome A, the percent who substantially increased their rate of growth by the time they turned 6 years of age or exited the program.
48.0% 50.6%
2. The percent of children who were functioning within age expectations in Outcome A by the time they turned 6 years of age or exited the program.
24.0% 26.6%
Rationale for Established Targets Provide a rationale for your targets based on your analyses of data quality and strategies for program improvement.
The CSDE identified the early childhood outcome targets in consultation with a number of stakeholder groups. There were a variety of stakeholder groups convened to discuss indicator #7, including the establishment of targets. Stakeholders included: directors of special education; administrators of early childhood special education; the Connecticut Parent Advocacy Center, the state’s Parent Training and Information Center; and various professional development planning groups. The targets established for FFY 2009 and FFY 2010 are conservative. The rationale for establishing conservative targets is that the FFY 2008 outcome data represent the first year of data which include the population of children for whom the state is obligated to report upon. The CSDE, in establishing the targets, is adjusting for a flux in the population of children for whom progress data will be available in the future. The CSDE generally uses three years of data to assess trends in order to establish targets that are less vulnerable. Under other assessment programs in the state, Connecticut, in consultation with stakeholders, chooses to maintain identical or similar targets for two to three years. This should permit sufficient time for program improvements to impact children’s progress and ultimately would be demonstrated in the data.

SPP Template – Part B (3) CONNECTICUT State
Part B State Performance Plan: 2005-2010 Monitoring Priority: FAPE in the LRE – Page 61 (OMB NO: 1820-0624 / Expiration Date: 2/29/2012) Indicator 7 – Early Childhood Outcomes
Improvement activities, particularly those that relate to this indicator: data refinement; training and technical assistance; policy development; and district monitoring will continue to ensure reliable and valid data. Trend data will be used to inform future improvement activities.
Improvement Activities/Timelines/Resources
The following improvement activities, timelines and resources highlight the state activities relative to this indicator. Stakeholders reviewed the improvement activities, timelines and resources and supported the continuation of each. Each activity will be reviewed and re-assessed annually in relation to the data collected and reported.
Improvement Activities Timelines Resources
7.1 Use information and feedback obtained from school district administrators, school personnel, families and from other stakeholders to update the state’s policies and procedures on the implementation of the early childhood outcome requirement.
2008-09 school year through 2010-2011
• 619 Coordinator • Department personnel • SPP Workgroup • RESC training and technical
assistance providers
7.2 Develop and update materials to be used in training and technical assistance, in outreach and public awareness and in other professional development and informational venues.
2008-09 school year through 2010-2011
• 619 Coordinator • Department personnel • SPP Workgroup • RESC training and technical
assistance providers 7.3 Provide and evaluate training and
technical assistance and revise and refine the training and technical assistance and other professional development opportunities based on evaluation feedback.
2008-09 school year through 2010-2011
• 619 Coordinator • Department personnel • SPP Workgroup • RESC training and technical
assistance providers
7.4 Ensure that materials and other information developed and disseminated is coordinated with the state’s Part C program and Department personnel working on this and other Part B SPP/APR indicators.
2008-09 school year through 2010-2011
• 619 Coordinator • Part C Coordinator • Department personnel • SPP Workgroup
7.5 Use the annual data collection and analysis to inform and refine the data collection, the decision rules and the analysis in future reporting.
2008-09 school year through 2010-2011
• 619 Coordinator • Department personnel
7.6 Utilize national resources to inform the state system, including accessing professional development opportunities and training and technical assistance through the National Early Childhood
2008-09 school year through 2010-2011
• 619 Coordinator • Department personnel

SPP Template – Part B (3) CONNECTICUT State
Part B State Performance Plan: 2005-2010 Monitoring Priority: FAPE in the LRE – Page 62 (OMB NO: 1820-0624 / Expiration Date: 2/29/2012) Indicator 7 – Early Childhood Outcomes
Improvement Activities Timelines Resources
Technical Assistance Center (NECTAC), US DOE/OSEP, and the Early Childhood Outcomes Center (ECO Center).
7.7 Utilize information and resources from national professional organizations to embed evidence-based assessment practices into the state outcome system (e.g., National Association for the Education of Young Children, the Division of Early Childhood, etc).
2008-09 school year through 2010-2011
• 619 Coordinator • Department personnel

SPP Template – Part B (3) CONNECTICUT State
Part B State Performance Plan: 2005-2010 Monitoring Priority: FAPE in the LRE – Page 63 (OMB NO: 1820-0624 / Expiration Date: 2/29/2012) Indicator 8 – Parental Involvement
Part B State Performance Plan (SPP) for 2005-2010
Overview of the State Performance Plan Development:
See Overview page i (The following items are to be completed for each monitoring priority/indicator.)
Monitoring Priority: FAPE in the LRE
Indicator 8: Percent of parents with a child receiving special education services who report that schools facilitated parent involvement as a means of improving services and results for children with disabilities.
(20 U.S.C. 1416(a)(3)(A))
Measurement: Percent = [(# of respondent parents who report schools facilitated parent involvement as a means of improving services and results for children with disabilities) divided by the (total # of respondent parents of children with disabilities)] times 100.
Overview of Issue/Description of System or Process: In the 2004-05 school year, the Department developed and disseminated a Special Education Parent Survey. The survey was developed with guidance from the CSDE Parent Workgroup. The questionnaire asked parents of children ages 3 - 21 with disabilities to respond to a series of statements related to 1) satisfaction with their child’s special education program; 2) participation in developing and implementing their child’s program; 3) their child’s participation in the IEP process; 4) transition planning for preschool children and secondary students; 5) parent training and support; and 6) the child’s skills. In 2005-06 the Parent Survey was revised to collect data that directly addresses Indicator 8. Parents were asked to respond to survey statements according to their experiences over the past 12 months using a 6-point scale ranging from strongly agree to strongly disagree, with the option of responding don’t know or not applicable. Parents were also asked to provide demographic data on their child, including age, gender, race and ethnicity, grade level and primary eligibility for services. Responses from the 2005-06 school year survey were analyzed using factor analysis to determine which subset of other items from the survey could provide further evidence of a school’s facilitation of parent involvement as a means of improving services and results for children with disabilities. Factor analysis is a statistical technique which uses the correlations between observed variables to estimate common factors or the structural relationships linking the observed variables together. These data generated relationships or constructs are examined for their ability to explain the variation among the items in the survey. Understanding how items are interpreted and linked together by survey respondents and the variation in responses among the items allows for the derived factor or set of related survey items to be used as supporting evidence for the conclusions drawn from the specific question asked in response to Indicator 8. Survey item 12 was included in a factor with 10 other items, all with factor loadings from 0.609 to 0.882. The conclusion that can be drawn from the factor analysis is that yes, the survey items

SPP Template – Part B (3) CONNECTICUT State
Part B State Performance Plan: 2005-2010 Monitoring Priority: FAPE in the LRE – Page 64 (OMB NO: 1820-0624 / Expiration Date: 2/29/2012) Indicator 8 – Parental Involvement
appear to be valid; they are measuring what the survey was intended to measure about parental involvement in improving services and outcomes for their child.
Alpha reliability was conducted for this factor and indicated a very high overall internal-consistency reliability (α = 0.932; α > 0.70 are generally considered high or acceptable in survey research). The issue that a reliability analysis helps to address is measurement error. When a survey uses a single survey item to measure an intended outcome, conclusions can be drawn that are completely invalid because the measurement error cannot be determined accurately. The construct validity analysis, above, identified other survey items that appear to measure the same intended outcome. The reliability analysis of this group of survey items helps to ascertain the consistency or reliability that can be assumed of the conclusions drawn from the survey responses to the items. The conclusion from this reliability analysis is that yes, the parent survey is measuring the intended outcome regarding parental involvement in improving services and outcomes for their child both consistently and reliably. In each year, 2005-06 through 2011, the Department will survey a statewide representative sample of parents of students with disabilities (see attached revised sampling plan). In the 2005-06 school year, LEAs were assigned to one of six data collection years based on demographic characteristics. Particular attention was paid to the representativeness of the sample with respect to disability, gender, race and ethnicity and age. Data will be reported out on specific LEAs in the LEA-Level Annual Performance Report each winter, as long as the number of responses for a given LEA meets the Department’s minimum standard for the reporting of LEA-level data (n = 20). This rule safeguards against possible breaches in confidentiality. By 2010-11, data will have been collected from every LEA in Connecticut.
Baseline Data for FFY 2004 (2004-2005): Of parents surveyed from 21 LEAs in Connecticut during the 2005-06 school year, 86.9 percent agreed that their school(s) facilitated parent involvement as a means of improving services and results for their children with disabilities. Data are valid and reliable.
(1,141 agreements with item 12 / 1,313 survey respondents x 100 = 86.9%)
Discussion of Baseline Data: The survey sample included 21 districts and had an overall response rate of 21.7 percent. Thirteen districts had an overall response rate between 20 percent and 30 percent; four districts had an overall response rate greater than 30 percent.
Parent responses to survey item 12, “In my child’s school, administrators and teachers encourage parent involvement in order to improve services and results for children with disabilities,” were analyzed to determine state performance on Indicator 8. Parent responses in the categories of strongly agree, moderately agree, and slightly agree constitute the 86.9 percent reported above.
The responses collected from 21 districts in this year’s survey sample were analyzed for representativeness by age, gender, race and ethnicity, grade and disability as compared to the total statewide population of students with disabilities. The analysis for response representativeness was conducted using both a statistical significance test (chi-square) and a

SPP Template – Part B (3) CONNECTICUT State
Part B State Performance Plan: 2005-2010 Monitoring Priority: FAPE in the LRE – Page 65 (OMB NO: 1820-0624 / Expiration Date: 2/29/2012) Indicator 8 – Parental Involvement
practical or meaningful significance test (effect size). Below are the actual proportions for each area assessed.
Variable Grouping 2005-06 statewide data 2005-06 survey data Age 3 – 5 10.9% 14.3% 6 – 12 45.5% 46.2% 13 – 14 15.7% 14.6% 15 – 17 22.5% 19.9% 18 - 21 5.2% 5.1% Gender Male 69.3% 70.3% Female 30.7% 29.7%
Race/Ethnicity American Indian/ Alaskan Native
0.4% 1.7%
Asian 1.5% 2.2% Black 16.0% 12.5% White 64.7% 68.2% Hispanic 17.4% 15.4% Grade PK 7.2% 12.4% Elementary 37.3% 39.6% Middle 23.8% 25.4% High 26.3% 19.9% Transition 5.2% 2.6% Disability LD 34.1% 28.9% ID/MR 4.2% 4.6% ED 9.1% 4.6% Speech/LI 21.5% 17.9% OHI 15.4% 19.0% Autism 4.5% 11.3% Other 11.1% 13.7%
Of the five areas assessed, only gender demonstrated no statistical difference between the sample and statewide population proportions (see below). While there was statistical support for differences between the sample and the statewide population of students with disabilities across age, race and ethnicity, grade and disability, only disability had an effect size or practical significance level that warranted consideration. All effect sizes for age, race and ethnicity and grade were small (below 0.30) and do not indicate a practical or meaningful difference between the sample and the actual population. It is important to assess the effect size of any statistical significance test outcome as statistical significance tests are highly influenced by sample size. Effect sizes are not influenced by sample size and thus allow for the interpretation of statistical differences for their meaningful and practical application when drawing conclusions from the data. Below are the chi-square and effect size results for each of the areas assessed.
Variable Chi-Sq Test (χ2) Cohen’s Effect Size Interpretation Age χ2 = 19.2 0.12 Small Gender χ2 = 0.6 (not sign.) n/a Race/Ethnicity χ2 = 34.4 0.16 Small

SPP Template – Part B (3) CONNECTICUT State
Part B State Performance Plan: 2005-2010 Monitoring Priority: FAPE in the LRE – Page 66 (OMB NO: 1820-0624 / Expiration Date: 2/29/2012) Indicator 8 – Parental Involvement
Variable Chi-Sq Test (χ2) Cohen’s Effect Size Interpretation Grade χ2 = 91.8 0.26 Small Disability χ2 = 201.1 0.39 Moderate
One issue to be considered when interpreting the disability representativeness of the sample is that parents tend to identify more than one disability when asked to select only their child’s primary disability. Therefore, interpretation of the disability data from the survey is suspect regarding accuracy. The Department and Parent Workgroup will continue to stress the importance of accurate reporting of disability on the parent survey and investigate methods for ensuring the validity of the disability data collected in order to improve the representativeness of parent survey data collected and reported for this indicator. Considering the effect sizes of the other indicators, the Department is satisfied with the overall representativeness of the survey sampled in 2006 and feel the conclusions drawn from this sample are both valid and reliable.
FFY Measurable and Rigorous Target
2005 (2005-2006)
Not applicable/baseline data year
2006 (2006-2007)
87.0%
2007 (2007-2008)
87.1%
2008 (2008-2009)
87.5%
2009 (2009-2010)
88.0%
2010 (2010-2011)
90.0%
Improvement Activities/Timelines/Resources:
Improvement Activities Timelines Resources 8.1 Provide parent training opportunities to ensure that parents are informed and knowledgeable about LRE settings for children 3, 4, and 5 years of age with disabilities, particularly those families transitioning from the CT Birth to Three
2005-06 school year through 2011
• Department personnel • Parent Training and Information
Center (PTI) – The Connecticut Parent Advocacy Center (CPAC)

SPP Template – Part B (3) CONNECTICUT State
Part B State Performance Plan: 2005-2010 Monitoring Priority: FAPE in the LRE – Page 67 (OMB NO: 1820-0624 / Expiration Date: 2/29/2012) Indicator 8 – Parental Involvement
Improvement Activities Timelines Resources System. 8.2 Participate in statewide summit on dropout prevention, graduation and alternatives to suspension.
2006–07 school year
• Department personnel • SERC personnel • CSDE Parent Workgroup • CSDE Transition Task Force
members • Allocate a portion of the IDEA
funds to SERC 8.3 Update the Department’s Special Education Policy and Procedures Manual for district adoption.
2006-07 school year
• Department personnel
8.4 Update the Department’s “A Parent’s Guide to Special Education in Connecticut” in English and Spanish and disseminate to parents, districts and public.
2006-07 school year
• Department personnel • SERC personnel • CSDE Parent Workgroup • translation service • outside evaluator
8.5 Prepare Department brochure on dispute resolution options entitled “Opportunities for Solutions” and disseminate to parents, districts and public.
2006-07 school year
• Department personnel • CSDE Parent Workgroup
8.6 (Revised) Offer statewide workshops to parents and districts on effective transitions for children with special needs in early childhood education, diversity in education, integrated student support services, and resolving disputes in special education.
2006-07 school year through 2011
• SERC personnel • CSDE personnel • Parent Training and Information
Center (PTI) – The Connecticut Parent Advocacy Center (CPAC)
8.7 Assign a consultant from the Department to act as the liaison with the Parent Information Resource Center at SERC (PIRC@SERC).
2006-07 school year
• Department personnel • SERC personnel
8.8 Provide a 3-part parent training “Promoting School Success” in four communities in collaboration with the Connecticut Department of Mental Retardation and CPAC.
2006-07 school year
• Department personnel • SERC personnel • Parent Training and Information
Center (PTI) – The Connecticut Parent Advocacy Center (CPAC)
• Connecticut Coalition for Inclusive Education (CCIE)
• Connecticut Department of Mental Retardation

SPP Template – Part B (3) CONNECTICUT State
Part B State Performance Plan: 2005-2010 Monitoring Priority: FAPE in the LRE – Page 68 (OMB NO: 1820-0624 / Expiration Date: 2/29/2012) Indicator 8 – Parental Involvement
Improvement Activities Timelines Resources 8.9 Present at statewide inclusion conference to parents and district staff on making the most of PPT meetings.
2006-07 school year
• Department personnel • SERC personnel • Parent Training and Information
Center (PTI) – The Connecticut Parent Advocacy Center (CPAC)
8.10 Provide one, day long training to parent trainers on the education benefit review process.
2006-07 school year
• CSDE Parent Workgroup • SERC personnel
8.11 Pilot use of pre-PPT meeting checklist in two districts.
2006-07 school year
• Department personnel • CSDE Parent Workgroup • CPAC with funding from the
State Personnel Development Grant (SPDG)
8.12 Pilot use of post-PPT meeting comment postcard in two districts.
2006-07 school year
• Department personnel • CSDE Parent Workgroup • CPAC with funding from the
State Personnel Development Grant (SPDG)
8.13 Administer the Department’s Parent Survey in English and Spanish.
2006-07 school year through 2011
• Department personnel • SERC personnel • CSDE Parent Workgroup • translation service • outside evaluator
8.14 Analyze and disseminate the results of the Department’s Parent Survey to the public in English and Spanish.
2006-07 school year through 2011
• Department personnel • SERC personnel • CSDE Parent Workgroup • translation service • outside evaluator
8.15 Include a parent representative on the Department’s focused monitoring teams.
2006-07 school year through 2011
• Department personnel
8.16 Include parent forums as part of the Department’s focused monitoring system.
2006-07 school year through 2011
• Department personnel
8.17 Provide “Families as Partners” training to parents and districts.
2006-07 school year through 2011
• Provide $10,000 to joint university project through the University Center on Excellence in Developmental Disabilities (UCEDD) to conduct training
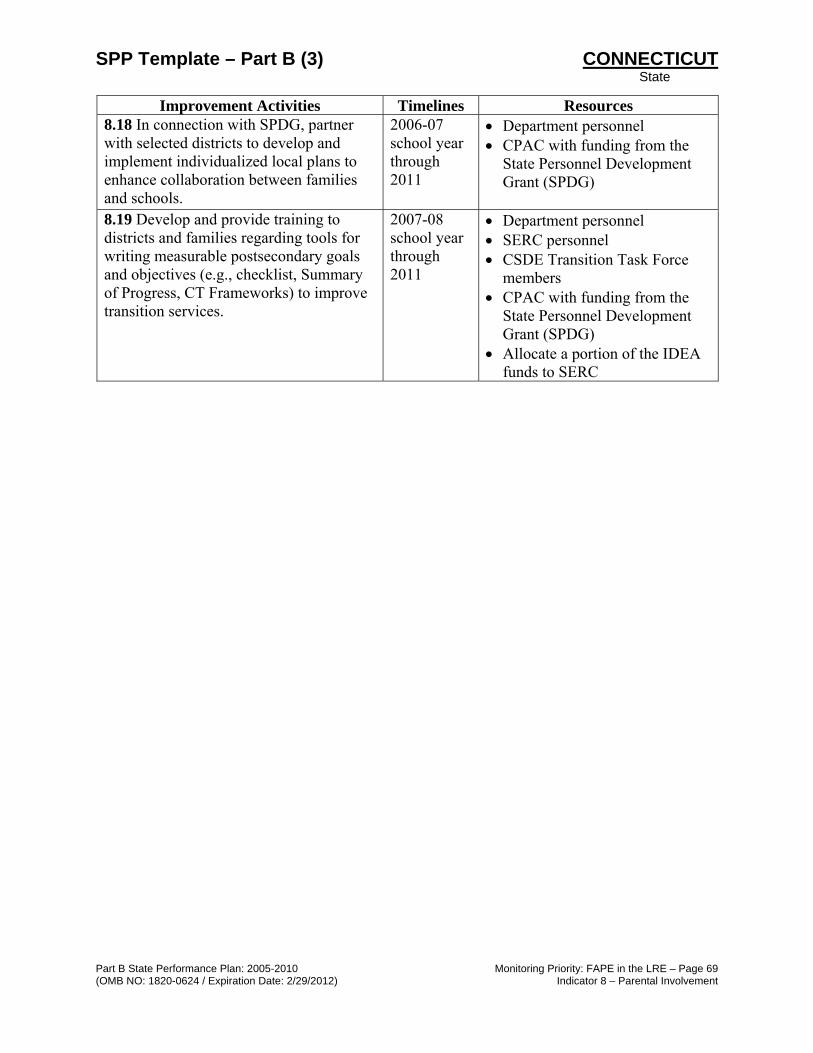
SPP Template – Part B (3) CONNECTICUT State
Part B State Performance Plan: 2005-2010 Monitoring Priority: FAPE in the LRE – Page 69 (OMB NO: 1820-0624 / Expiration Date: 2/29/2012) Indicator 8 – Parental Involvement
Improvement Activities Timelines Resources 8.18 In connection with SPDG, partner with selected districts to develop and implement individualized local plans to enhance collaboration between families and schools.
2006-07 school year through 2011
• Department personnel • CPAC with funding from the
State Personnel Development Grant (SPDG)
8.19 Develop and provide training to districts and families regarding tools for writing measurable postsecondary goals and objectives (e.g., checklist, Summary of Progress, CT Frameworks) to improve transition services.
2007-08 school year through 2011
• Department personnel • SERC personnel • CSDE Transition Task Force
members • CPAC with funding from the
State Personnel Development Grant (SPDG)
• Allocate a portion of the IDEA funds to SERC

SPP Template – Part B (3) Connecticut State
Part B State Performance Plan: 2005-2010 Monitoring Priority: Disproportionality – Page 70 (OMB NO: 1820-0624 / Expiration Date: 2/29/2012) Indicator 9 – Disproportionate Special Education
Part B State Performance Plan (SPP) for 2005-2010
Overview of the State Performance Plan Development:
See Overview page i
Monitoring Priority: Disproportionality
Indicator 9: Percent of districts with disproportionate representation of racial and ethnic groups in special education and related services that is the result of inappropriate identification.
(20 U.S.C. 1416(a)(3)(C))
Measurement:
Percent = [(# of districts with disproportionate representation of racial and ethnic groups in special education and related services that is the result of inappropriate identification) divided by the (# of districts in the State)] times 100.
Include State’s definition of “disproportionate representation.”
Based on its review of the 618 data for FFY 2008, describe how the State made its annual determination that the disproportionate representation it identified (consider both over and underrepresentation) of racial and ethnic groups in special education and related services was the result of inappropriate identification as required by §§300.600(d)(3) and 300.602(a), e.g., using monitoring data; reviewing policies, practices and procedures, etc. In determining disproportionate representation, analyze data, for each district, for all racial and ethnic groups in the district, or all racial and ethnic groups in the district that meet a minimum 'n' size set by the State. Report on the percent of districts in which disproportionate representation of racial and ethnic groups in special education and related services is the result of inappropriate identification, even if the determination of inappropriate identification was made after the end of the FFY 2008 reporting period, i.e., after June 30, 2009. If inappropriate identification is identified, report on corrective actions taken.
Overview of Issue/Description of System or Process:
In response to the FFY 2003 Annual Performance Report letter dated October 18, 2005, the following information is provided. Race and ethnic disproportionate representation will be assessed by comparing the proportion of students with disabilities by race and ethnicity (from the State 618 data) to the expected race and ethnicity proportion found in the LEA or state all student data. This analysis will be conducted using the formula +/- 1.96 {sqrt [(P x Q) / n]} for the standard error of the sample proportion. For areas of identified statistically significant overrepresentation, relative risk index will be calculated to aid in the interpretation of the overrepresentation.
To determine “disproportionate representation” statistical overrepresentation is identified. LEAs, where statistical overrepresentation is identified, will receive correspondence from the Department requiring them to conduct a self-assessment and, if noncompliance is evident, develop an action plan with improvement strategies to address the following areas:
• verification that data are accurate;
• review of how disproportionate identification is being addressed through district and school improvement plans;

SPP Template – Part B (3) Connecticut State
Part B State Performance Plan: 2005-2010 Monitoring Priority: Disproportionality – Page 71 (OMB NO: 1820-0624 / Expiration Date: 2/29/2012) Indicator 9 – Disproportionate Special Education
• examination of special education eligibility policies, procedures and practices to ensure that they are race neutral; and
• examination of professional development activities, curriculum and instructional practices and early intervening services, including academic and behavioral interventions.
Additional monitoring activities and corrective actions will be applied as appropriate.
Baseline Data for FFY 2004 (2004-2005):
In the 2005-06 school year, zero districts in Connecticut had disproportionate representation of racial and ethnic groups in special education and related services that was the result of inappropriate identification. 0/169 x 100 = 0%
Discussion of Baseline Data:
Beginning in the 2002-03 school year, a Department initiative called “Closing the Achievement Gaps: Connecticut Summit on Overidentification and Disproportion in Special Education” began with the creation of a statewide stakeholder group. There began a focus on district and statewide data in the area of identification and placement by race and ethnicity. Suspension, graduation and dropout analyses by race were also included in this initiative’s annual activities including data, a statewide summit, and technical assistance.
Connecticut was one of nine states that received a grant from the National Center for Culturally Responsive Educational Systems (NCCRESt) in the 2004-05 school year, which included technical assistance from the center. The Department and the State Education Resource Center (SERC) presented at the national conference hosted by NCCRESt in February 2006 regarding the Department’s efforts to eliminate disproportionate representation of students with disabilities by race and ethnicity. Currently, the center is conducting two case studies of Connecticut school districts that have made significant progress in the area of overrepresentation. Data is obtained from a statewide data source. Sampling is not used. Data are valid and reliable.
Analysis of disproportionate representation of students with disabilities by race and ethnicity began in the 2002-03 school year using 2001-02 data and continues to date using the same data reported to OSEP under section 618 (Table 1). In the 2004-05 school year, using 2003-04 data, the Department identified, for the first time, overrepresentation as a result of inappropriate identification. In that year, multiple districts demonstrated data of concern in this area; through Connecticut’s System of General Supervision and Focused Monitoring it was determined that one of these districts demonstrated overrepresentation as a result of inappropriate identification. In 2005-06, using 2004-05 data, two additional districts were identified for overrepresentation as a result of inappropriate identification. Using 2005-06 data, zero districts demonstrated overrepresentation as a result of inappropriate identification.
Through Connecticut’s System of General Supervision and Focused Monitoring an analysis of data is conducted to determine districts with data of concern. From that information,
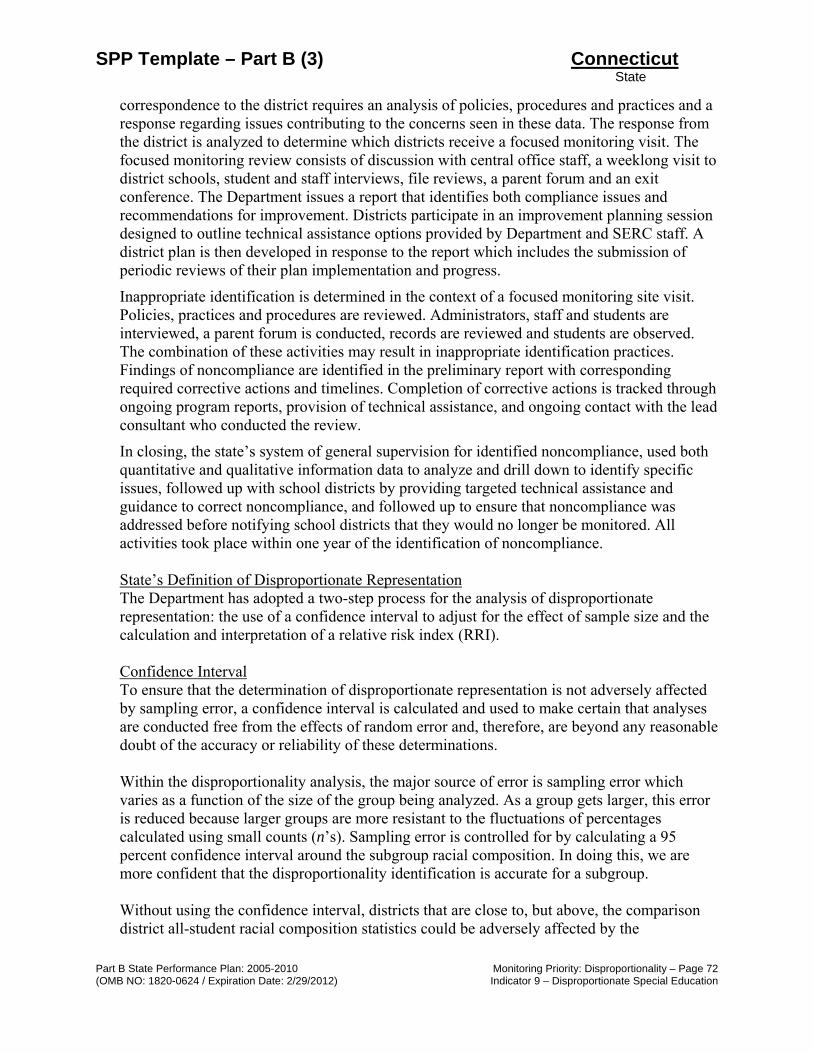
SPP Template – Part B (3) Connecticut State
Part B State Performance Plan: 2005-2010 Monitoring Priority: Disproportionality – Page 72 (OMB NO: 1820-0624 / Expiration Date: 2/29/2012) Indicator 9 – Disproportionate Special Education
correspondence to the district requires an analysis of policies, procedures and practices and a response regarding issues contributing to the concerns seen in these data. The response from the district is analyzed to determine which districts receive a focused monitoring visit. The focused monitoring review consists of discussion with central office staff, a weeklong visit to district schools, student and staff interviews, file reviews, a parent forum and an exit conference. The Department issues a report that identifies both compliance issues and recommendations for improvement. Districts participate in an improvement planning session designed to outline technical assistance options provided by Department and SERC staff. A district plan is then developed in response to the report which includes the submission of periodic reviews of their plan implementation and progress.
Inappropriate identification is determined in the context of a focused monitoring site visit. Policies, practices and procedures are reviewed. Administrators, staff and students are interviewed, a parent forum is conducted, records are reviewed and students are observed. The combination of these activities may result in inappropriate identification practices. Findings of noncompliance are identified in the preliminary report with corresponding required corrective actions and timelines. Completion of corrective actions is tracked through ongoing program reports, provision of technical assistance, and ongoing contact with the lead consultant who conducted the review.
In closing, the state’s system of general supervision for identified noncompliance, used both quantitative and qualitative information data to analyze and drill down to identify specific issues, followed up with school districts by providing targeted technical assistance and guidance to correct noncompliance, and followed up to ensure that noncompliance was addressed before notifying school districts that they would no longer be monitored. All activities took place within one year of the identification of noncompliance.
State’s Definition of Disproportionate Representation The Department has adopted a two-step process for the analysis of disproportionate representation: the use of a confidence interval to adjust for the effect of sample size and the calculation and interpretation of a relative risk index (RRI).
Confidence Interval To ensure that the determination of disproportionate representation is not adversely affected by sampling error, a confidence interval is calculated and used to make certain that analyses are conducted free from the effects of random error and, therefore, are beyond any reasonable doubt of the accuracy or reliability of these determinations.
Within the disproportionality analysis, the major source of error is sampling error which varies as a function of the size of the group being analyzed. As a group gets larger, this error is reduced because larger groups are more resistant to the fluctuations of percentages calculated using small counts (n’s). Sampling error is controlled for by calculating a 95 percent confidence interval around the subgroup racial composition. In doing this, we are more confident that the disproportionality identification is accurate for a subgroup.
Without using the confidence interval, districts that are close to, but above, the comparison district all-student racial composition statistics could be adversely affected by the

SPP Template – Part B (3) Connecticut State
Part B State Performance Plan: 2005-2010 Monitoring Priority: Disproportionality – Page 73 (OMB NO: 1820-0624 / Expiration Date: 2/29/2012) Indicator 9 – Disproportionate Special Education
identification of a single student. Because of this, the final disproportionality identification is made after giving a district every reasonable benefit of doubt. It is especially important, however, to note that the confidence interval will be an aid only to districts with small group or subgroup n’s and racial compositions that are close to the district all student composition for that year.
The formula +/- 1.96 {sqrt [(P x Q) / n]}for the standard error of the sample proportion is used to calculate the 95 percent confidence interval. (Where P = composition of the subgroup being assessed, Q = 100 – P, and n = the number of students in the subgroup being assessed for overrepresentation.)
Confidence Interval Example: Learning Disability = 1,000 students 0: Native American 0: Asian 200: Black 700: White 100: Hispanic
0% 0% 20% 70% 10% District Enrollment = 10,000 students 0: Native American 0: Asian 2,500: Black 7,200: White 300: Hispanic
0% 0% 25% 72% 3% A) If 100 Hispanic LD students are 10 percent of the district’s total LD population (1,000): take 0.10 times 0.90 which is equal to 0.09. Divide that by 100 (number of Hispanic LD students) and take the square root which is 0.03. Multiply this by 1.96 which equals 0.059. Add and subtract this to the original 0.10 composition statistic and you have a confidence interval of 4.1 percent to 15.9 percent. B) If these same students were 10 percent of a district with only 500 LD students, the confidence interval would be 1.6 percent to 18.3 percent. (The smaller the population, the larger the confidence interval will be.) Finally compare the district all-student Hispanic population percentage to the established confidence interval. In this scenario, the district has 3 percent of its students identified as Hispanic. In example A (10 percent of 1,000 LD) the Hispanic LD students would be potentially overidentified and a Relative Risk Index (RRI) should be calculated. In example B (10 percent of 500 LD) the data would not indicate concern regarding overidentification. Relative Risk Index For areas indicating possible overrepresentation using the 95 percent confidence interval test, a RRI should be calculated to aid in the interpretation of the identified overrepresentation. Learning Disability = 1,000 students 0: Native American 0: Asian 200: Black 700: White 100: Hispanic District Enrollment = 10,000 students 0: Native American 0: Asian 2,500: Black 7,200: White 300: Hispanic

SPP Template – Part B (3) Connecticut State
Part B State Performance Plan: 2005-2010 Monitoring Priority: Disproportionality – Page 74 (OMB NO: 1820-0624 / Expiration Date: 2/29/2012) Indicator 9 – Disproportionate Special Education
First, the Hispanic LD Risk should be calculated by dividing the number of Hispanic LD students by the number of all district Hispanic students (100 / 300 = 0.333). Second, calculate the Risk for all other races to be identified as LD by dividing the number of all other LD students by the number of all district students from all racial categories except Hispanic (900 / 9,700 = 0.093). Finally, calculate the Relative Risk by dividing the Risk for Hispanic LD by the LD Risk for all other races (0.333 / .093 = 3.6). In this scenario, Hispanic students are 3.6 times as likely as their non-Hispanic peers to be identified as students with learning disabilities.
Interpretation Criteria for Disproportionality No guidance is provided in the IDEA statutes or regulations regarding the criteria for a RRI to be considered “significant.” Absent guidelines from the Office of Special Education Programs (OSEP), each SEA must establish guidelines regarding disproportionate representation that are flexible enough to avoid violating the Grutter and Gratz prohibitions of numerical quotas (Grutter v. Bollinger et al., No. 02-241 U.S. Supreme Court, opinion June 23, 2003 and Gratz v. Bollinger et al., No. 02-516 U.S. Supreme Court, opinion June 23, 2003). The following criteria have been adopted by the Department as flexible guidelines regarding the identification of disproportionate representation based on race and ethnicity with respect to the identification of children as students with disabilities [20 U.S.C. 1418(d); 34 C.F.R. Section 300.646]. 0.25 < RRI < 2.0 RRI is not significant; disproportionate representation not indicated –
district receives data 0.25 > RRI > 2.0 RRI of concern; district receives correspondence from the Department;
district submits self assessment of data, policies, procedures and practices regarding identification of students for special education to the Department; if individual student or systemic noncompliance is found, the Department issues, monitors and verifies corrective actions.
FFY Measurable and Rigorous Target
2005 (2005-2006)
0
2006 (2006-2007)
0
2007 (2007-2008)
0
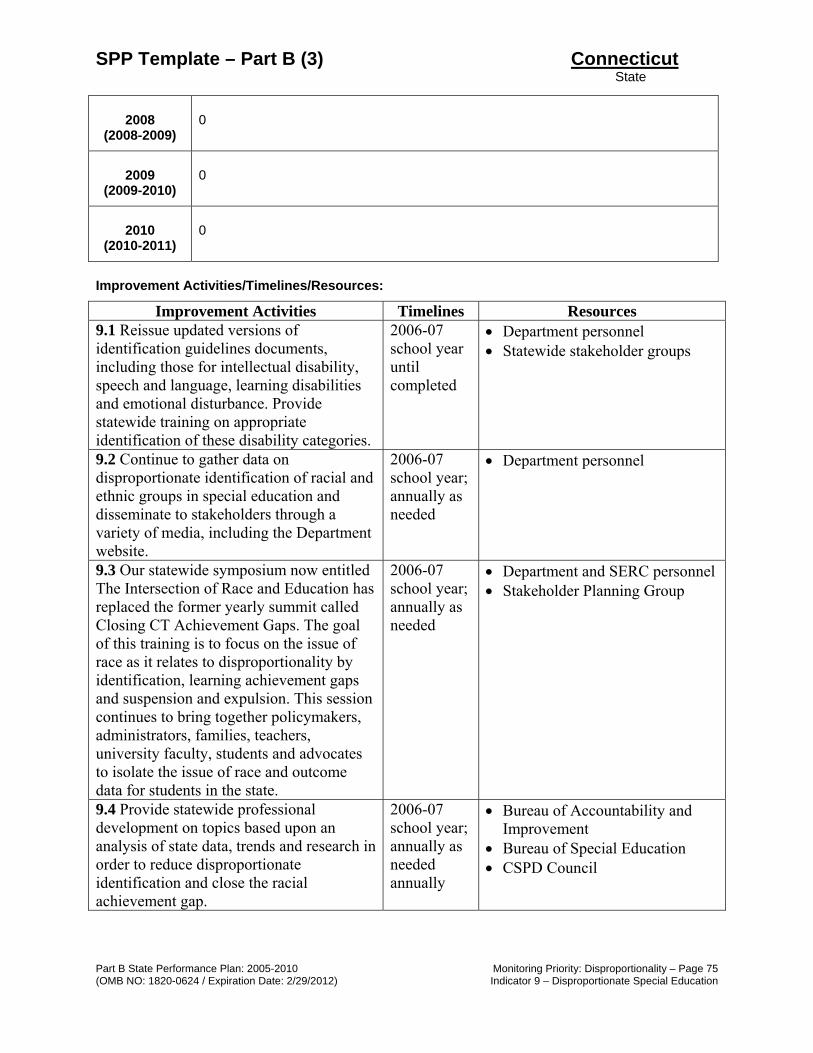
SPP Template – Part B (3) Connecticut State
Part B State Performance Plan: 2005-2010 Monitoring Priority: Disproportionality – Page 75 (OMB NO: 1820-0624 / Expiration Date: 2/29/2012) Indicator 9 – Disproportionate Special Education
2008 (2008-2009)
0
2009 (2009-2010)
0
2010 (2010-2011)
0
Improvement Activities/Timelines/Resources:
Improvement Activities Timelines Resources 9.1 Reissue updated versions of identification guidelines documents, including those for intellectual disability, speech and language, learning disabilities and emotional disturbance. Provide statewide training on appropriate identification of these disability categories.
2006-07 school year until completed
• Department personnel • Statewide stakeholder groups
9.2 Continue to gather data on disproportionate identification of racial and ethnic groups in special education and disseminate to stakeholders through a variety of media, including the Department website.
2006-07 school year; annually as needed
• Department personnel
9.3 Our statewide symposium now entitled The Intersection of Race and Education has replaced the former yearly summit called Closing CT Achievement Gaps. The goal of this training is to focus on the issue of race as it relates to disproportionality by identification, learning achievement gaps and suspension and expulsion. This session continues to bring together policymakers, administrators, families, teachers, university faculty, students and advocates to isolate the issue of race and outcome data for students in the state.
2006-07 school year; annually as needed
• Department and SERC personnel • Stakeholder Planning Group
9.4 Provide statewide professional development on topics based upon an analysis of state data, trends and research in order to reduce disproportionate identification and close the racial achievement gap.
2006-07 school year; annually as needed annually
• Bureau of Accountability and Improvement
• Bureau of Special Education • CSPD Council

SPP Template – Part B (3) Connecticut State
Part B State Performance Plan: 2005-2010 Monitoring Priority: Disproportionality – Page 76 (OMB NO: 1820-0624 / Expiration Date: 2/29/2012) Indicator 9 – Disproportionate Special Education
Improvement Activities Timelines Resources 9.5 Provide training to school and district personnel by the Leadership and Leaning Center on Data Teams and Data Driven Decision Making, Making Standards Work, Effective Teaching Strategies, Common Formative Assessments and Improving School Climate to Support Student Achievement. The Department offers basic and certification training through our Connecticut Accountability for Learning Initiative (CALI) professional development offerings. Certification training gives participants license to conduct basic training in order to develop state capacity.
2006-07 school year through 2011
• Bureau of Accountability and Improvement
9.6 Coordinate activities with early intervention initiatives, including Connecticut’s Response to Intervention (RtI) framework called Scientific Research Based Interventions (SRBI) to ensure appropriate identification of students with disabilities.
2006-07 school year through 2011
• Department and SERC personnel • SRBI State Leadership Team
9.7 (Deleted) Districts who fail to meet the target for this indicator continue to be closely monitored through their action plans (see indicator 15). All districts are given data through electronic correspondence and districts with a 0.25 > RRI ≥ 2.0 are considered districts of concern and receive correspondence from the Department. These districts examine their policies and practices through a self-assessment adapted from NCCRESt. The districts then develop action steps based on the self assessment that are aligned with their District Improvement Plan. Department personnel examine the self-assessment and action plan to determine if plan is accepted, rejected or needs revisions. adapted from NCCRESt. The districts then develop action steps based on the self assessment that are aligned with their District Improvement Plan. Department personnel examine the self-assessment and action plan to determine if plan is accepted,
2007-08 school year; annually as needed
• Bureau of Accountability and Improvement
• Bureau of Special Education

SPP Template – Part B (3) Connecticut State
Part B State Performance Plan: 2005-2010 Monitoring Priority: Disproportionality – Page 77 (OMB NO: 1820-0624 / Expiration Date: 2/29/2012) Indicator 9 – Disproportionate Special Education
Improvement Activities Timelines Resources rejected or needs revisions. 9.8 Coordinate Department activities concerning the development of students’ social, emotional, behavioral, physical and mental health. Create a blueprint to assist school personnel in the provision of a comprehensive continuum of supports for students. Provide training and technical assistance in implementing the blueprint.
2006-07 through 2011
• Department and SERC personnel
9.9 As a result of our persistent achievement gaps, Department personnel created a Racial Equity Team. The Racial Equity Team consists of representatives from across the Department whose purpose is to evaluate and provide recommendations to the State Board of Education regarding Department policies and practices as they pertain to racial equity and Department employee interactions internally and externally. A secondary purpose of this team is to increase the number of Department personnel who effectively communicate about issues of race in all areas of the Department’s work.
2007-08, 2008-09
• Department personnel
9.10 (New) Develop a brief publication outlining the key points around what families should know about good evaluations for special education. Ensure alignment with SRBI framework.
2009-10 school year
• Bureau of Special Education • CPAC
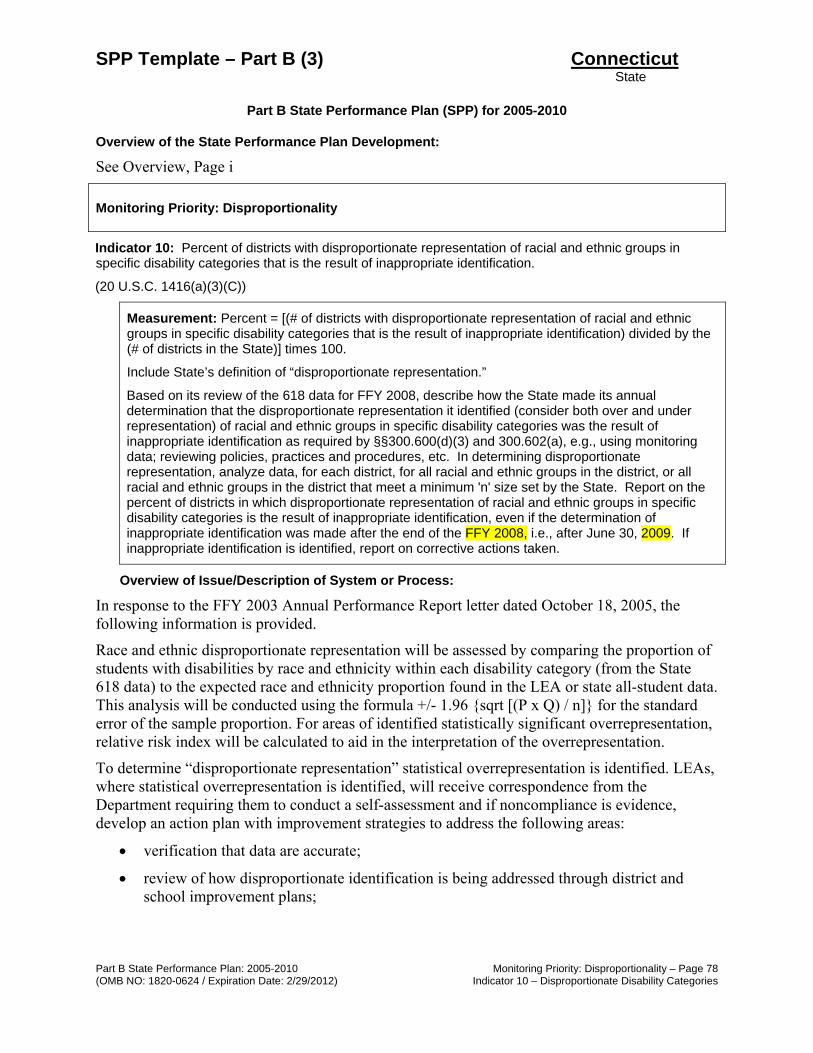
SPP Template – Part B (3) Connecticut State
Part B State Performance Plan: 2005-2010 Monitoring Priority: Disproportionality – Page 78 (OMB NO: 1820-0624 / Expiration Date: 2/29/2012) Indicator 10 – Disproportionate Disability Categories
Part B State Performance Plan (SPP) for 2005-2010
Overview of the State Performance Plan Development:
See Overview, Page i
Monitoring Priority: Disproportionality
Indicator 10: Percent of districts with disproportionate representation of racial and ethnic groups in specific disability categories that is the result of inappropriate identification.
(20 U.S.C. 1416(a)(3)(C))
Measurement: Percent = [(# of districts with disproportionate representation of racial and ethnic groups in specific disability categories that is the result of inappropriate identification) divided by the (# of districts in the State)] times 100.
Include State’s definition of “disproportionate representation.”
Based on its review of the 618 data for FFY 2008, describe how the State made its annual determination that the disproportionate representation it identified (consider both over and under representation) of racial and ethnic groups in specific disability categories was the result of inappropriate identification as required by §§300.600(d)(3) and 300.602(a), e.g., using monitoring data; reviewing policies, practices and procedures, etc. In determining disproportionate representation, analyze data, for each district, for all racial and ethnic groups in the district, or all racial and ethnic groups in the district that meet a minimum 'n' size set by the State. Report on the percent of districts in which disproportionate representation of racial and ethnic groups in specific disability categories is the result of inappropriate identification, even if the determination of inappropriate identification was made after the end of the FFY 2008, i.e., after June 30, 2009. If inappropriate identification is identified, report on corrective actions taken.
Overview of Issue/Description of System or Process:
In response to the FFY 2003 Annual Performance Report letter dated October 18, 2005, the following information is provided.
Race and ethnic disproportionate representation will be assessed by comparing the proportion of students with disabilities by race and ethnicity within each disability category (from the State 618 data) to the expected race and ethnicity proportion found in the LEA or state all-student data. This analysis will be conducted using the formula +/- 1.96 {sqrt [(P x Q) / n]} for the standard error of the sample proportion. For areas of identified statistically significant overrepresentation, relative risk index will be calculated to aid in the interpretation of the overrepresentation.
To determine “disproportionate representation” statistical overrepresentation is identified. LEAs, where statistical overrepresentation is identified, will receive correspondence from the Department requiring them to conduct a self-assessment and if noncompliance is evidence, develop an action plan with improvement strategies to address the following areas:
• verification that data are accurate;
• review of how disproportionate identification is being addressed through district and school improvement plans;

SPP Template – Part B (3) Connecticut State
Part B State Performance Plan: 2005-2010 Monitoring Priority: Disproportionality – Page 79 (OMB NO: 1820-0624 / Expiration Date: 2/29/2012) Indicator 10 – Disproportionate Disability Categories
• examination of special education eligibility policies, procedures and practices to ensure that they are race neutral; and
• examination of professional development activities, curriculum and instructional practices and early intervening services, including academic and behavioral interventions.
Additional monitoring activities and corrective actions will be applied as appropriate. Baseline Data for FFY 2004 (2004-2005):
In the 2005-06 school year, four districts (2.4 percent) in Connecticut had disproportionate representation of racial and ethnic groups in specific disability categories that was the result of inappropriate identification. 4/169 x 100 = 2.4%
Discussion of Baseline Data:
Beginning in the 2002-03 school year, a Department initiative called “Closing the Achievement Gap: Connecticut Summit on Overidentification and Disproportion in Special Education” began with the creation of a statewide stakeholder group. There began a focus on district and statewide data in the area of identification and placement by race and ethnicity. Suspension, graduation and dropout analyses by race were also included in this initiative’s annual activities including data, a statewide summit, and technical assistance.
Connecticut was one of nine states that received a grant from the National Center for Culturally Responsive Educational Systems (NCCRESt) in the 2004-05 school year, which included technical assistance from the Center. The Department and the State Education Resource Center (SERC) presented at the national conference hosted by NCCRESt in February 2006 regarding the Department’s efforts to eliminate disproportionate representation of students with disabilities by race and ethnicity. Currently, the Center is conducting two case studies of Connecticut school districts that have made significant progress in the area of overrepresentation.
Analysis of disproportionate representation of students with disabilities in specific disability categories by race and ethnicity began in the 2002-03 school year using 2001-02 data and continues to date using the same data reported to OSEP under section 618 (Table 1). In the 2004-05 school year, using 2003-04 data, the Department identified, for the first time, overrepresentation as a result of inappropriate identification. In that year, multiple districts demonstrated data of concern in this area; through Connecticut’s System of General Supervision and Focused Monitoring it was determined that three of these districts demonstrated overrepresentation as a result of inappropriate identification. In 2005-06, using 2004-05 data, two additional districts were identified for overrepresentation as a result of inappropriate identification. Using 2005-06 data, a total of four districts demonstrated overrepresentation in specific disability categories as a result of inappropriate identification. Two of these districts were included in previous year identification and two were new identifications.

SPP Template – Part B (3) Connecticut State
Part B State Performance Plan: 2005-2010 Monitoring Priority: Disproportionality – Page 80 (OMB NO: 1820-0624 / Expiration Date: 2/29/2012) Indicator 10 – Disproportionate Disability Categories
Overrepresentation by disability, 2005-06 school year data:
District Overrepresentation Category
11 black LD
103 black ED
135 black ED
155 black ED
Through Connecticut’s System of General Supervision and Focused Monitoring an analysis of data is conducted to determine districts with data of concern. From that information, correspondence to the district requires an analysis of policies, procedures and practices and a response regarding issues contributing to the concerns seen in these data. The response from the districts is analyzed to determine which districts receive a focused monitoring visit. The focused monitoring review consists of discussion with central office staff, a week long visit to district schools, student and staff interviews, file reviews, a parent forum and an exit conference. The Department issues a report that identifies both compliance issues and recommendations for improvement. Districts participate in an improvement planning session designed to outline technical assistance options provided by Department and SERC staff. A district plan is then developed in response to the report which includes the submission of periodic reviews of their plan implementation and progress.
Inappropriate identification is determined in the context of a focused monitoring site visit. Policies, practices and procedures are reviewed. Administrators, staff and students are interviewed, a parent forum is conducted, records are reviewed and students are observed. The combination of these activities may result in inappropriate identification practices. Findings of noncompliance are identified in the preliminary report with corresponding required corrective actions and timelines. Completion of corrective actions is tracked through ongoing program reports, provision of technical assistance, and ongoing contact with the lead consultant who conducted the review.
In closing, the state’s system of general supervision for identified noncompliance, used both quantitative and qualitative information data to analyze and drill down to identify specific issues, followed up with school districts by providing targeted technical assistance and guidance to correct noncompliance, and followed up to ensure that noncompliance was addressed before notifying school districts that they would no longer be monitored. All activities took place within one year of the identification of noncompliance. State’s Definition of Disproportionate Representation The Department has adopted a two-step process for the analysis of disproportionate representation: the use of a confidence interval to adjust for the effect of sample size and the calculation and interpretation of a relative risk index (RRI).

SPP Template – Part B (3) Connecticut State
Part B State Performance Plan: 2005-2010 Monitoring Priority: Disproportionality – Page 81 (OMB NO: 1820-0624 / Expiration Date: 2/29/2012) Indicator 10 – Disproportionate Disability Categories
Confidence Interval To ensure that the determination of disproportionate representation is not adversely affected by sampling error, a confidence interval is calculated and used to make certain that analyses are conducted free from the effects of random error and, therefore, are beyond any reasonable doubt of the accuracy or reliability of these determinations.
Within the disproportionality analysis, the major source of error is sampling error which varies as a function of the size of the group being analyzed. As a group gets larger, this error is reduced because larger groups are more resistant to the fluctuations of percentages calculated using small counts (n’s). Sampling error is controlled for by calculating a 95 percent confidence interval around the subgroup racial composition. In doing this, we are more confident that the disproportionality identification is accurate for a subgroup.
Without using the confidence interval, districts that are close to, but above, the comparison district all-student racial composition statistics could be adversely affected by the identification of a single student. Because of this, the final disproportionality identification is made after giving a district every reasonable benefit of doubt. It is especially important, however, to note that the confidence interval will be an aid only to districts with small group or subgroup n’s and racial compositions that are close to the district all student composition for that year.
The formula +/- 1.96 {sqrt [(P x Q) / n]}for the standard error of the sample proportion is used to calculate the 95 percent confidence interval. (Where P = composition of the subgroup being assessed, Q = 100 – P, and n = the number of students in the subgroup being assessed for overrepresentation).
Confidence Interval Example: Learning Disability = 1,000 students 0: Native American 0: Asian 200: Black 700: White 100: Hispanic
0% 0% 20% 70% 10% District Enrollment = 10,000 students 0: Native American 0: Asian 2,500: Black 7,200: White 300: Hispanic
0% 0% 25% 72% 3% A) If 100 Hispanic LD students are 10 percent of the districts total LD population (1,000): take 0.10 times 0.90 which is equal to 0.09. Divide that by 100 (number of Hispanic LD students) and take the square root which is 0.03. Multiply this by 1.96 which equals 0.059. Add and subtract this to the original 0.10 composition statistic and you have a confidence interval of 4.1 percent to 15.9 percent. B) If these same students were 10 percent of a district with only 500 LD students, the confidence interval would be 1.6 percent to 18.3 percent. (The smaller the population, the larger the confidence interval will be.)
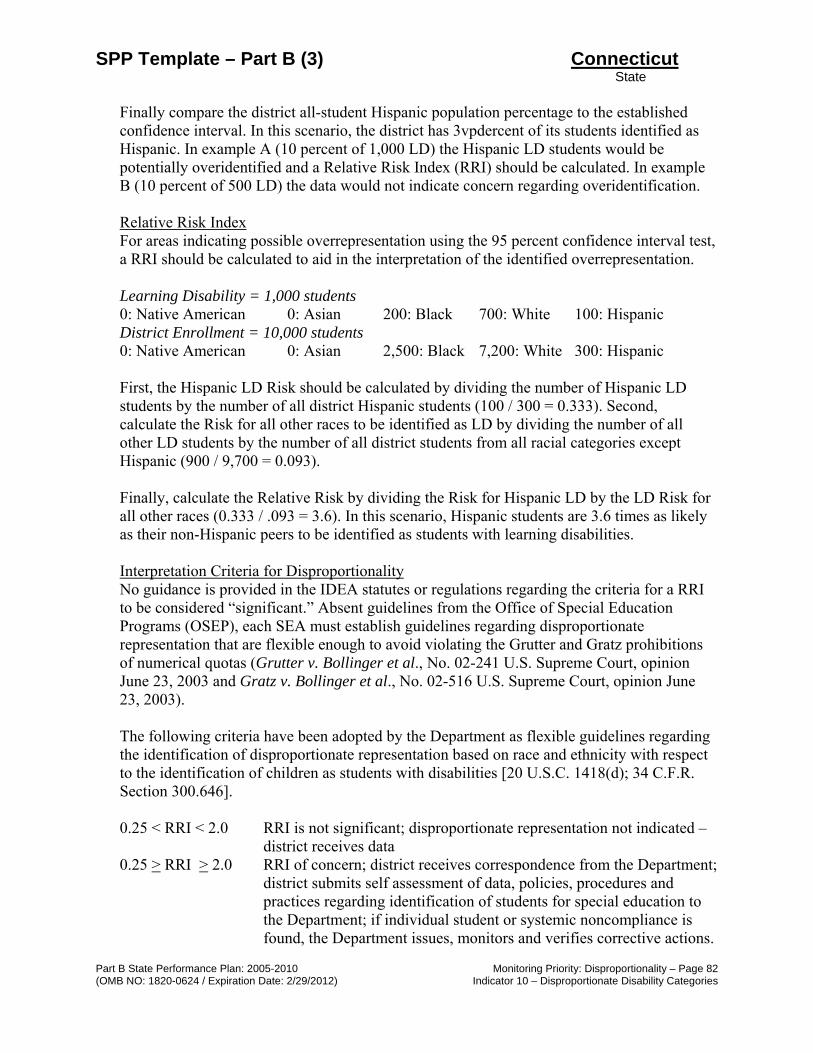
SPP Template – Part B (3) Connecticut State
Part B State Performance Plan: 2005-2010 Monitoring Priority: Disproportionality – Page 82 (OMB NO: 1820-0624 / Expiration Date: 2/29/2012) Indicator 10 – Disproportionate Disability Categories
Finally compare the district all-student Hispanic population percentage to the established confidence interval. In this scenario, the district has 3vpdercent of its students identified as Hispanic. In example A (10 percent of 1,000 LD) the Hispanic LD students would be potentially overidentified and a Relative Risk Index (RRI) should be calculated. In example B (10 percent of 500 LD) the data would not indicate concern regarding overidentification.
Relative Risk Index For areas indicating possible overrepresentation using the 95 percent confidence interval test, a RRI should be calculated to aid in the interpretation of the identified overrepresentation. Learning Disability = 1,000 students 0: Native American 0: Asian 200: Black 700: White 100: Hispanic District Enrollment = 10,000 students 0: Native American 0: Asian 2,500: Black 7,200: White 300: Hispanic First, the Hispanic LD Risk should be calculated by dividing the number of Hispanic LD students by the number of all district Hispanic students (100 / 300 = 0.333). Second, calculate the Risk for all other races to be identified as LD by dividing the number of all other LD students by the number of all district students from all racial categories except Hispanic (900 / 9,700 = 0.093). Finally, calculate the Relative Risk by dividing the Risk for Hispanic LD by the LD Risk for all other races (0.333 / .093 = 3.6). In this scenario, Hispanic students are 3.6 times as likely as their non-Hispanic peers to be identified as students with learning disabilities.
Interpretation Criteria for Disproportionality No guidance is provided in the IDEA statutes or regulations regarding the criteria for a RRI to be considered “significant.” Absent guidelines from the Office of Special Education Programs (OSEP), each SEA must establish guidelines regarding disproportionate representation that are flexible enough to avoid violating the Grutter and Gratz prohibitions of numerical quotas (Grutter v. Bollinger et al., No. 02-241 U.S. Supreme Court, opinion June 23, 2003 and Gratz v. Bollinger et al., No. 02-516 U.S. Supreme Court, opinion June 23, 2003). The following criteria have been adopted by the Department as flexible guidelines regarding the identification of disproportionate representation based on race and ethnicity with respect to the identification of children as students with disabilities [20 U.S.C. 1418(d); 34 C.F.R. Section 300.646]. 0.25 < RRI < 2.0 RRI is not significant; disproportionate representation not indicated –
district receives data 0.25 > RRI > 2.0 RRI of concern; district receives correspondence from the Department;
district submits self assessment of data, policies, procedures and practices regarding identification of students for special education to the Department; if individual student or systemic noncompliance is found, the Department issues, monitors and verifies corrective actions.

SPP Template – Part B (3) Connecticut State
Part B State Performance Plan: 2005-2010 Monitoring Priority: Disproportionality – Page 83 (OMB NO: 1820-0624 / Expiration Date: 2/29/2012) Indicator 10 – Disproportionate Disability Categories
FFY Measurable and Rigorous Target
2005 (2005-2006)
0
2006 (2006-2007)
0
2007 (2007-2008)
0
2008 (2008-2009)
0
2009 (2009-2010)
0
2010 (2010-2011)
0
Improvement Activities/Timelines/Resources:
Improvement Activities Timelines Resources 10.1 Reissue updated versions of identification guidelines documents, including those for intellectual disability, speech and language, learning disabilities and emotional disturbance. Provide statewide training on appropriate identification of these disability categories.
2006-07 school year until completed
• Department personnel • Statewide stakeholder groups
10.2 Continue to gather data on disproportionate identification of racial and ethnic groups in special education and disseminate to stakeholders through a variety of media, including the Department website.
2006-07 school year; annually as needed
• Department personnel

SPP Template – Part B (3) Connecticut State
Part B State Performance Plan: 2005-2010 Monitoring Priority: Disproportionality – Page 84 (OMB NO: 1820-0624 / Expiration Date: 2/29/2012) Indicator 10 – Disproportionate Disability Categories
10.3 Our statewide symposium now titled “The Intersection of Race and Education” has replaced the former yearly summit called Closing CT Achievement Gaps. The goal of this training is to focus on the issue of race as it relates to disproportionality by identification, learning achievement gaps and suspension and expulsion. This session continues to bring together policymakers, administrators, families, teachers, university faculty, students and advocates to isolate the issue of race and outcome data for students in the state.
2006-07 school year; annually as needed
• Department and SERC personnel
• Stakeholder Planning Group
10.4 Provide statewide professional development on topics based upon an analysis of state data, trends and research in order to reduce disproportionate identification and close the racial achievement gap.
2006-07 school year; annually as needed
• Bureau of Accountability and Improvement
• Bureau of Special Education • CSPD Council
10.5 Provide training to school and district personnel by the Leadership and Leaning Center on Data Teams and Data Driven Decision Making, Making Standards Work, Effective Teaching Strategies, Common Formative Assessments and Improving School Climate to Support Student Achievement. The Department offers basic and certification training through our Connecticut Accountability for Learning Initiative (CALI) professional development offerings. Certification training gives participants license to conduct basic training in order to develop state capacity.
2006-07 school year through 2011
• Bureau of Accountability and Improvement
10.6 Coordinate activities with early intervention initiatives, including Connecticut’s Response to Intervention (RtI) framework called Scientific Research Based Interventions (SRBI) to ensure appropriate identification of students with disabilities.
2006-07 school year through 2011
• Department and SERC personnel
• SRBI State Leadership Team

SPP Template – Part B (3) Connecticut State
Part B State Performance Plan: 2005-2010 Monitoring Priority: Disproportionality – Page 85 (OMB NO: 1820-0624 / Expiration Date: 2/29/2012) Indicator 10 – Disproportionate Disability Categories
10.7 (Deleted) Districts who fail to meet the target for this indicator continue to be closely monitored through their action plans (see indicator 15). All districts are given data through electronic correspondence and districts with a 0.25 > RRI ≥ 2.0 are considered districts of concern and receive correspondence from the Department. These districts examine their policies and practices through a self-assessment adapted from NCCRESt. The districts then develop action steps based on the self assessment that are aligned with their District Improvement Plan. Department personnel examine the self-assessment and action plan to determine if plan is accepted, rejected or needs revisions.
2007-08 school year; annually as needed
• Bureau of Accountability and Improvement
• Bureau of Special Education
10.8 Coordinate Department activities with social, emotional, behavioral, physical and mental health to create a system’s approach to effective school-wide management that provides a comprehensive continuum of supports.
2007-08 through 2011
• Department and SERC personnel
10.9 As a result of our persistent achievement gaps, Department personnel created a Racial Equity Team. The Racial Equity Team consists of representatives from across the Department whose purpose is to evaluate and provide recommendations to the State Board of Education regarding Department policies and practices as they pertain to racial equity and Department employee interactions internally and externally. A secondary purpose of this team is to increase the number of Department personnel who effectively communicate about issues of race in all areas of the Department’s work.
2007-08, 2008-09
• Department personnel
10.10 (New) Develop a brief publication outlining the key points around what families should know about good evaluations for special education. Ensure alignment with SRBI framework.
2009-10 school year
• Bureau of Special Education • CPAC

SPP Template – Part B (3) Connecticut State
Part B State Performance Plan: 2005-2010 Monitoring Priority: Disproportionality – Page 86 (OMB NO: 1820-0624 / Expiration Date: 2/29/2012) Indicator 10 – Disproportionate Disability Categories
10.11 (New) Investigate the identification policies, procedures and practices around Autism in all racial categories. Develop and coordinate professional development and training opportunities for districts and families to ensure appropriate identification of students with Autism.
2009-10 school year, annually as needed
• Bureau of Special Education • Professional development
providers • CPAC

SPP Template – Part B (3) CONNECTICUT State
Part B State Performance Plan: 2005-2010 Monitoring Priority: Effective General Supervision– Page 87 (OMB NO: 1820-0624 / Expiration Date: 2/29/2012) Indicator 11 – Evaluation Timelines
Part B State Performance Plan (SPP) for 2005-2010
Overview of the State Performance Plan Development:
See Overview page i (The following items are to be completed for each monitoring priority/indicator.)
Monitoring Priority: Effective General Supervision Part B / Child Find
Indicator 11: Percent of children with parental consent to evaluate, who were evaluated within 60 days (or State established timeline).
(20 U.S.C. 1416(a)(3)(B))
Measurement: a. # of children for whom parental consent to evaluate was received. b. # of children whose evaluations were completed within 60 days (or State-established
timeline).
Account for children included in a but not included in b. Indicate the range of days beyond the timeline when the evaluation was completed and any reasons for the delays.
Percent = [(b) divided by (a)] times 100.
Overview of Issue/Description of System or Process: Regulations of Connecticut State Agencies (RCSA) Section 10-76d-13 provides that “special education and related services shall be provided as soon as possible after the planning and placement team meeting held to review, revise or develop the child’s individualized education program (IEP), but in any event not later than the following timelines:
(a) School year. In the case of a referral made during the academic year, the timelines shall be as follows.
i. The IEP shall be implemented within 45 days of referral or notice, exclusive of the time required to obtain parental consent.
ii. In the case of a child whose IEP calls for out-of-district or private placement, the IEP shall be implemented within 60 days of referral or notice, exclusive of the time required to obtain parental consent.
(b) Between school years. In case of a referral made in between school years, the effective date of the referral may be deemed to be the first school day of the next school year.”
The Department developed and implemented a new online data collection system for this indicator for the purpose of meeting the reporting requirements of the SPP. The Department required electronic data submission of referral and evaluation data by each LEA for the previous fiscal year. Data was collected beginning July 1, 2006 – August 15, 2006, and will be collected annually thereafter.
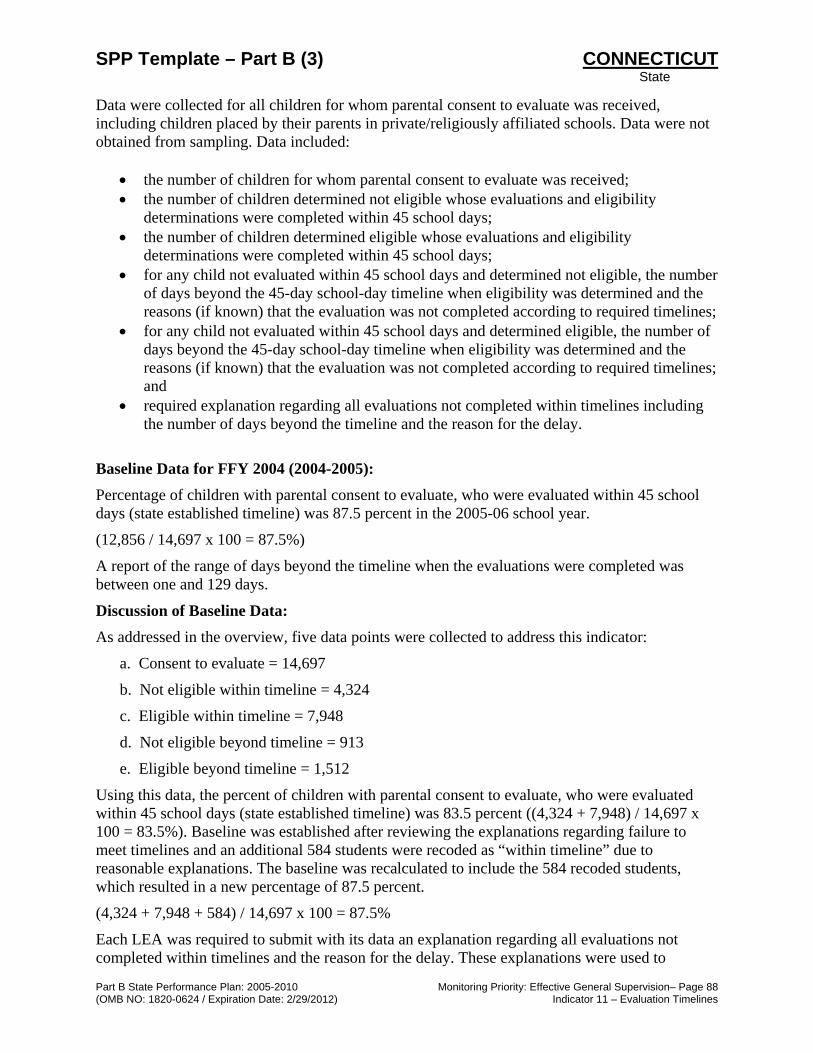
SPP Template – Part B (3) CONNECTICUT State
Part B State Performance Plan: 2005-2010 Monitoring Priority: Effective General Supervision– Page 88 (OMB NO: 1820-0624 / Expiration Date: 2/29/2012) Indicator 11 – Evaluation Timelines
Data were collected for all children for whom parental consent to evaluate was received, including children placed by their parents in private/religiously affiliated schools. Data were not obtained from sampling. Data included:
• the number of children for whom parental consent to evaluate was received; • the number of children determined not eligible whose evaluations and eligibility
determinations were completed within 45 school days; • the number of children determined eligible whose evaluations and eligibility
determinations were completed within 45 school days; • for any child not evaluated within 45 school days and determined not eligible, the number
of days beyond the 45-day school-day timeline when eligibility was determined and the reasons (if known) that the evaluation was not completed according to required timelines;
• for any child not evaluated within 45 school days and determined eligible, the number of days beyond the 45-day school-day timeline when eligibility was determined and the reasons (if known) that the evaluation was not completed according to required timelines; and
• required explanation regarding all evaluations not completed within timelines including the number of days beyond the timeline and the reason for the delay.
Baseline Data for FFY 2004 (2004-2005): Percentage of children with parental consent to evaluate, who were evaluated within 45 school days (state established timeline) was 87.5 percent in the 2005-06 school year.
(12,856 / 14,697 x 100 = 87.5%)
A report of the range of days beyond the timeline when the evaluations were completed was between one and 129 days.
Discussion of Baseline Data: As addressed in the overview, five data points were collected to address this indicator:
a. Consent to evaluate = 14,697
b. Not eligible within timeline = 4,324
c. Eligible within timeline = 7,948
d. Not eligible beyond timeline = 913
e. Eligible beyond timeline = 1,512
Using this data, the percent of children with parental consent to evaluate, who were evaluated within 45 school days (state established timeline) was 83.5 percent ((4,324 + 7,948) / 14,697 x 100 = 83.5%). Baseline was established after reviewing the explanations regarding failure to meet timelines and an additional 584 students were recoded as “within timeline” due to reasonable explanations. The baseline was recalculated to include the 584 recoded students, which resulted in a new percentage of 87.5 percent.
(4,324 + 7,948 + 584) / 14,697 x 100 = 87.5%
Each LEA was required to submit with its data an explanation regarding all evaluations not completed within timelines and the reason for the delay. These explanations were used to

SPP Template – Part B (3) CONNECTICUT State
Part B State Performance Plan: 2005-2010 Monitoring Priority: Effective General Supervision– Page 89 (OMB NO: 1820-0624 / Expiration Date: 2/29/2012) Indicator 11 – Evaluation Timelines
conduct the above recoding. Criteria were established to determine acceptable and unacceptable reasons. The Department individually analyzed each of these cases to determine if the reason was acceptable or unacceptable. If the reason was determined to be acceptable and the evaluation was completed, the case was included in the recalculation of the “within timeline” percentage. The following is a list of the criteria used for the analysis.
Acceptable explanations regarding failure to meet the evaluation timelines criteria: 1. Excessive student absences and/or hospitalization with medical documentation 2. School closures (holiday/weather/emergency) 3. Evaluation completed/IEP team meeting scheduling conflict 4. Requests for additional outside evaluation in order to determine eligibility 5. Parent request for delay 6. Trial placement for diagnostic purposes to determine eligibility 7. Student moved/withdrew from school 8. FAPE at age three; child transitioning from Connecticut Birth to Three System, referral
made at 90 day transition conference, evaluation completed by third birthday Unacceptable explanations regarding failure to meet the evaluation timelines criteria:
1. Parent did not return phone calls 2. Parent did not have transportation 3. CMT/CAPT testing (statewide assessments) 4. Staff illness 5. Extensive observation needed 6. Need time to determine student’s dominant language 7. Not enough staff/staff schedules/increases in staff caseloads 8. Student not available due to school activities 9. Eye issues (student needs testing and/or reading glasses) 10. Parent schedule inflexible 11. Student refusal
The data utilized to report on this indicator are statewide data that are inclusive of every school district in the state that provides special education and related services. The data are collected annually in accordance with the established timelines for federal reporting. Data are not obtained from sampling. Inclusive of the recode, data reported here are valid and reliable.
The data indicate that we are below the required 100 percent target. The data analysis and subsequent recoding revealed a need for clarification to LEAs regarding acceptable reasons for delay. The Department has responded with policy clarification to the field in preparation for data collection this year. In addition, this is the first year many LEAs collected and analyzed their local data to this extent. It is expected that the statewide policy clarification and local analysis will lead to significant improvements in the 2006-07 school year.
In addition, some of the delays reported for evaluations conducted for students in nonpublic settings were due to the changes in IDEA regulations regarding which LEA is responsible to conduct these evaluations.
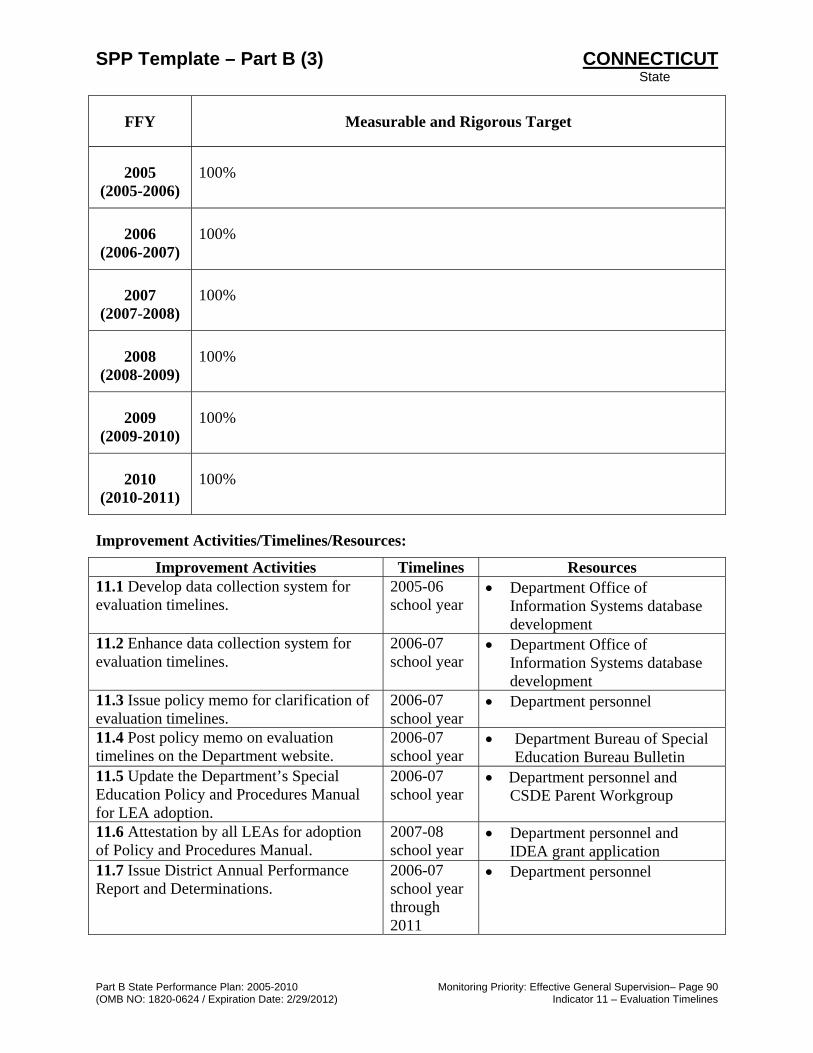
SPP Template – Part B (3) CONNECTICUT State
Part B State Performance Plan: 2005-2010 Monitoring Priority: Effective General Supervision– Page 90 (OMB NO: 1820-0624 / Expiration Date: 2/29/2012) Indicator 11 – Evaluation Timelines
FFY Measurable and Rigorous Target
2005 (2005-2006)
100%
2006 (2006-2007)
100%
2007 (2007-2008)
100%
2008 (2008-2009)
100%
2009 (2009-2010)
100%
2010 (2010-2011)
100%
Improvement Activities/Timelines/Resources:
Improvement Activities Timelines Resources 11.1 Develop data collection system for evaluation timelines.
2005-06 school year
• Department Office of Information Systems database development
11.2 Enhance data collection system for evaluation timelines.
2006-07 school year
• Department Office of Information Systems database development
11.3 Issue policy memo for clarification of evaluation timelines.
2006-07 school year
• Department personnel
11.4 Post policy memo on evaluation timelines on the Department website.
2006-07 school year
• Department Bureau of Special Education Bureau Bulletin
11.5 Update the Department’s Special Education Policy and Procedures Manual for LEA adoption.
2006-07 school year
• Department personnel and CSDE Parent Workgroup
11.6 Attestation by all LEAs for adoption of Policy and Procedures Manual.
2007-08 school year
• Department personnel and IDEA grant application
11.7 Issue District Annual Performance Report and Determinations.
2006-07 school year through 2011
• Department personnel

SPP Template – Part B (3) CONNECTICUT State
Part B State Performance Plan: 2005-2010 Monitoring Priority: Effective General Supervision– Page 91 (OMB NO: 1820-0624 / Expiration Date: 2/29/2012) Indicator 11 – Evaluation Timelines
Improvement Activities Timelines Resources 11.8 Establish and implement enforcement system. Action Step: Establish criteria for corrective action Action Step: Notify districts of indicator status Action Step: Implement a series of sanctions and targeted technical assistance for programs that fail to meet 45-day timeline and/or have not corrected noncompliance within one year of identification. Action Step: Districts with less than 95 percent compliance on this indicator will be required to re-submit data two times a year for this indicator to the State to demonstrate correction of noncompliance.
2008-09 school year through 2011
• Department personnel • SERC personnel • Regional Education Service
Center personnel • Stakeholders representing
districts, independent consultancies, due process, private schools, parent advocate, bilingual evaluation specialist, and recruitment shortage areas.
• Bureau of Data Collection, Research and Evaluation
11.9 Review data on complaints, mediations and due process hearings on an annual basis for trends related to evaluation timelines.
2006-07 school year through 2011
• Department personnel
11.10 Establish a Department leadership team and statewide stakeholder group to develop and provide guidance on RtI and for referral and evaluation for determining special education eligibility.
2006-07 school year through 2011
• Associate Commissioner of Division of Family and Student Support Services
• Associate Commissioner of Division of Teaching, Learning and Instructional Leadership
• Department personnel • SERC personnel • Parent Training and Information
Center (PTI) –Connecticut Parent Advocacy Center (CPAC)

SPP Template – Part B (3) CONNECTICUT State
Part B State Performance Plan: 2005-2010 Monitoring Priority: Effective General Supervision– Page 92 (OMB NO: 1820-0624 / Expiration Date: 2/29/2012) Indicator 11 – Evaluation Timelines
Improvement Activities Timelines Resources 11.11 Increase awareness and availability of technical assistance aligned with noncompliance areas: Action Step: Analyze reasons for any noncompliance barriers to timely compliance. Action Step: Identify supports for districts based on a current review of the literature given needs of the districts. Action Step: Design or locate multi-media technical assistance support and disseminate using Bureau newsletter, SERC website, and electronic mailings to representative stakeholder groups.
2007-08 school year through 2011
• Department personnel • Indicator 11 Work group • SERC personnel
11.12 Increase the quality of data received and verified by districts for this data collection. Action Step: Develop and implement training module for Evaluation Timelines Data Collection (online with a training segment for SEDAC). Action Step: Definition of terms handout. Action Step: Ensure compatibility of databases with data collection expectations.
2008-09 school year through 2011
• Department personnel • SERC personnel • Bureau of Data Collection,
Research and Evaluation
11.13 (Revised) Assess appropriateness of data collection timing. Action Step: Review data collection timing and federal requirements. Action Step: Survey districts and programs for timing considerations.
2008-09 school year
• Department personnel • Bureau of Data Collection,
Research and Evaluation
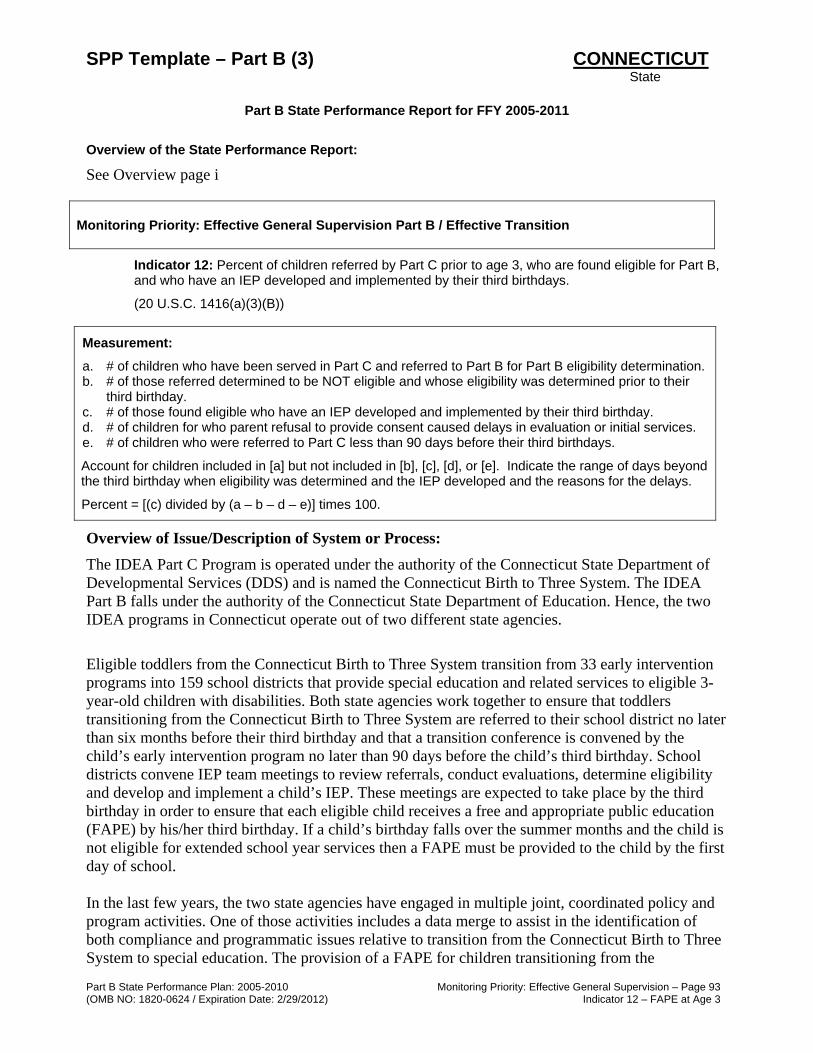
SPP Template – Part B (3) CONNECTICUT State
Part B State Performance Plan: 2005-2010 Monitoring Priority: Effective General Supervision – Page 93 (OMB NO: 1820-0624 / Expiration Date: 2/29/2012) Indicator 12 – FAPE at Age 3
Part B State Performance Report for FFY 2005-2011
Overview of the State Performance Report:
See Overview page i
Indicator 12: Percent of children referred by Part C prior to age 3, who are found eligible for Part B, and who have an IEP developed and implemented by their third birthdays.
(20 U.S.C. 1416(a)(3)(B))
Measurement:
a. # of children who have been served in Part C and referred to Part B for Part B eligibility determination. b. # of those referred determined to be NOT eligible and whose eligibility was determined prior to their
third birthday. c. # of those found eligible who have an IEP developed and implemented by their third birthday. d. # of children for who parent refusal to provide consent caused delays in evaluation or initial services. e. # of children who were referred to Part C less than 90 days before their third birthdays.
Account for children included in [a] but not included in [b], [c], [d], or [e]. Indicate the range of days beyond the third birthday when eligibility was determined and the IEP developed and the reasons for the delays.
Percent = [(c) divided by (a – b – d – e)] times 100.
Overview of Issue/Description of System or Process: The IDEA Part C Program is operated under the authority of the Connecticut State Department of Developmental Services (DDS) and is named the Connecticut Birth to Three System. The IDEA Part B falls under the authority of the Connecticut State Department of Education. Hence, the two IDEA programs in Connecticut operate out of two different state agencies.
Eligible toddlers from the Connecticut Birth to Three System transition from 33 early intervention programs into 159 school districts that provide special education and related services to eligible 3-year-old children with disabilities. Both state agencies work together to ensure that toddlers transitioning from the Connecticut Birth to Three System are referred to their school district no later than six months before their third birthday and that a transition conference is convened by the child’s early intervention program no later than 90 days before the child’s third birthday. School districts convene IEP team meetings to review referrals, conduct evaluations, determine eligibility and develop and implement a child’s IEP. These meetings are expected to take place by the third birthday in order to ensure that each eligible child receives a free and appropriate public education (FAPE) by his/her third birthday. If a child’s birthday falls over the summer months and the child is not eligible for extended school year services then a FAPE must be provided to the child by the first day of school. In the last few years, the two state agencies have engaged in multiple joint, coordinated policy and program activities. One of those activities includes a data merge to assist in the identification of both compliance and programmatic issues relative to transition from the Connecticut Birth to Three System to special education. The provision of a FAPE for children transitioning from the
Monitoring Priority: Effective General Supervision Part B / Effective Transition

SPP Template – Part B (3) CONNECTICUT State
Part B State Performance Plan: 2005-2010 Monitoring Priority: Effective General Supervision – Page 94 (OMB NO: 1820-0624 / Expiration Date: 2/29/2012) Indicator 12 – FAPE at Age 3
Connecticut Birth to Three System is a compliance issue that both state agencies work together to ensure a smooth and effective transition for children and their families. Reporting transition data is based upon a data merge activity conducted by the two state agencies. Data merge activities between the two state agencies reflect adherence to IDEA confidentiality requirements and the regulations under the Family Educational Rights and Privacy Act (FERPA). The Department’s data definition for this indicator reflects a stringent definition of the FAPE provisions of IDEA as reflected in statutory language in Section 612 (9) which states that “By the third birthday of such a child, an individualized education program or, if consistent with sections 614(d)(2)(B) and 636(d), an individualized family service plan, has been developed and is being implemented for the child.” This statutory language has been defined for state data collection purposes. The data is collected by identifying the “start date” of services indicating that an IEP is “being implemented” for a child. The “start date” is compared to the child’s birth date to match the date of a child’s IEP implementation with the child’s third birthday. Statewide data collection and analysis do not allow for variability in the data relative to situations such as differing start and end days of school (which vary across the state), weekends, holidays, etc., hence the data reported may under-represent the actual numbers of children who received a FAPE by their third birthday. Compliance monitoring and follow up on this indicator in previous years indicates that there are other variables which the data does not capture. Those variables include parental choice to refuse and/or delay the provision of a FAPE, mobility of children and their families, nexus and no-nexus issues for children in foster care, etc., all of which may be factors that under-represent the actual number and percent of children who have an IEP in effect by their third birthday. Annually, the two state agencies engage in collaborative and coordinated activities to ensure accurate data and reporting of children. These activities address compliance as well as program challenges and barriers for those children who transition from one service system to another. Activities include: refining of data and data verification, training and technical assistance on transition issues, on-going refinement of policies and procedures across the two service systems, and joint development of information, materials and products. Baseline Data for FFY 2004 (2004-2005):
For the 2004-05 school year, a data merge of Part C and Part B found that 85.4 percent of children that were referred and found eligible for special education and related services had an IEP developed and implemented by their third birthday. Discussion of Baseline Data:
The data merge of Part C and Part B data and analysis indicates that a total of 1,543 children were referred by the Connecticut Birth to Three System to school districts. Of the 1,543 children referred, 459 or 29.7 percent were determined not eligible for special education. Of the 1,084 children found eligible, 926 children or 85.4 percent received a FAPE by their third birthday. There were 158 children who did not receive a FAPE by their third birthday. The data indicates that the range of days beyond a child’s receipt of a FAPE was between eight to 365 calendar days. The majority received a FAPE within 60 days.
Children who did not receive a FAPE by their third birthday in 2004-05 school year came from 68 school districts. The data indicated that there were 32 school districts that had one child and 15

SPP Template – Part B (3) CONNECTICUT State
Part B State Performance Plan: 2005-2010 Monitoring Priority: Effective General Supervision – Page 95 (OMB NO: 1820-0624 / Expiration Date: 2/29/2012) Indicator 12 – FAPE at Age 3
school districts that had two children who did not receive a FAPE by their third birthday. Of the remaining school districts: eleven school districts had three children, four school districts had four children, two school districts had six children, two school districts had seven children, one school district had eight children and one school district had 13 children who did not have a FAPE by their third birthday. Since the provision of a FAPE by the third birthday is a compliance issue for children transitioning from the IDEA Part C Program, the state will follow-up with all school districts in the 2005-06 school year by contacting each school district and engaging in dialogue to ascertain the accuracy of data. If noncompliance in this area is identified, follow up activities will include one or more of the following: dialogue with school districts, data verification activities, record review, interviews with parents and/or school personnel, recommended and/or required training and technical assistance, and the development of a corrective action plan if necessary. Follow up information on monitored school districts will be available in the February 2007 Annual Performance Report (APR). The two state agencies will work together to resolve any challenges or barriers that may be identified that cross the two service delivery systems.
FFY Measurable and Rigorous Target
2005 (2005-2006)
100%
2006 (2006-2007)
100%
2007 (2007-2008)
100%
2008 (2008-2009)
100%
2009 (2009-2010)
100%
2010 (2010-2011)
100%
Improvement Activities/Timelines/Resources:
Improvement Activities Timelines Resources 12.1 Conduct data merge activities between IDEA’s Part C and Part B to inform and guide future collaborative activities, including reporting activities, while ensuring compliance with IDEA and FERPA.
2005-06 school year through 2011
• Department personnel • Part C personnel
12.2 Work with Part C to provide unique student identification numbers that could follow a child from Part C to Part B to enhance the current data merge activities.
2007-08 school year
• Department personnel • Part C personnel
12.3 Refine Department systematic follow- 2005-06 • Department personnel

SPP Template – Part B (3) CONNECTICUT State
Part B State Performance Plan: 2005-2010 Monitoring Priority: Effective General Supervision – Page 96 (OMB NO: 1820-0624 / Expiration Date: 2/29/2012) Indicator 12 – FAPE at Age 3
Improvement Activities Timelines Resources up and corrective action activities with school districts to ensure that the free and appropriate public education (FAPE) by age 3 demonstrates 100 percent compliance.
school year through 2011
12.4 Provide parent training opportunities across both service delivery systems to ensure that parents are familiar with transition activities and that parents understand the similarities and differences between the Part C and Part B.
2005-06 school year through 2011
• Department personnel • Part C personnel • Parent Training and Information
Center (PTI) – Connecticut Parent Advocacy Center (CPAC)
12.5 Work with Part C to encourage early intervention programs to provide small and large group opportunities for children transitioning in order to introduce the child to activities outside of the home in groups with other children.
2005-06 school year through 2008
• Department personnel • Birth-3 providers
12.6 Redefine current policies and procedures across both service delivery systems to reflect the reauthorized IDEA and the new regulations.
2008-09 school year
• Department personnel • Part C personnel

SPP Template – Part B (3) CONNECTICUT State
Part B State Performance Plan: 2005-2010 Monitoring Priority: Effective General Supervision – Page 97 (OMB NO: 1820-0624 / Expiration Date: 2/29/2012) Indicator 13 – Secondary Transition Goals & Services
Part B State Performance Plan (SPP) for 2005-2010
Overview of the State Performance Plan Development:
See Overview page i (The following items are to be completed for each monitoring priority/indicator.)
Monitoring Priority: Effective General Supervision Part B / Effective Transition
Indicator 13: Percent of youth with IEPs aged 16 and above with an IEP that includes appropriate measurable postsecondary goals that are annually updated and based upon an age appropriate transition assessment, transition services, including courses of study, that will reasonably enable the student to meet those postsecondary goals, and annual IEP goals related to the student’s transition services needs. There also must be evidence that the student was invited to the IEP Team meeting where transition services are to be discussed and evidence that, if appropriate, a representative of any participating agency was invited to the IEP Team meeting with the prior consent of the parent or student who has reached the age of majority.
(20 U.S.C. 1416(a)(3)(B))
Measurement:
Percent = [(# of youth with IEPs aged 16 and above with an IEP that includes appropriate measurable postsecondary goals that are annually updated and based upon an age appropriate transition assessment, transition services, including courses of study, that will reasonably enable the student to meet those postsecondary goals, and annual IEP goals related to the student’s transition services needs. There also must be evidence that the student was invited to the IEP Team meeting where transition services are to be discussed and evidence that, if appropriate, a representative of any participating agency was invited to the IEP Team meeting with the prior consent of the parent or student who has reached the age of majority) divided by the (# of youth with an IEP age 16 and above)] times 100.
Due to changes in the Part B Indicator Measurement Table (Revised 11/10/09), the following information does not match the above indicator language and measurement.
Refer to the February 2009 revision of Connecticut’s Part B State Performance Plan for the indicator language and measurement that was in place when this indicator was developed. Per OSEP’s instructions, the State will establish a new baseline and review/revise the improvement activities in the FFY 2009 submission (February 1, 2011).
Overview of Issue/Description of System or Process: The Department has added a new data element to the 2005-06 state data system to collect whether or not students’ Individualized Education Programs (IEPs) include coordinated, measurable, annual IEP goals and transition services. This element will be collected annually for all youth with disabilities aged 16 and above with an IEP. The state will ensure the accuracy of this data through the general supervision system such as data system accuracy checks, monitoring and complaints. The Department has created a Transition IEP Goals, Objectives and Services Checklist for use by LEAs and the state to assess whether or not the IEP goals and transition services are coordinated, measurable, and will reasonably enable the student to meet their postsecondary goals. The checklist covers four major outcome areas that must be
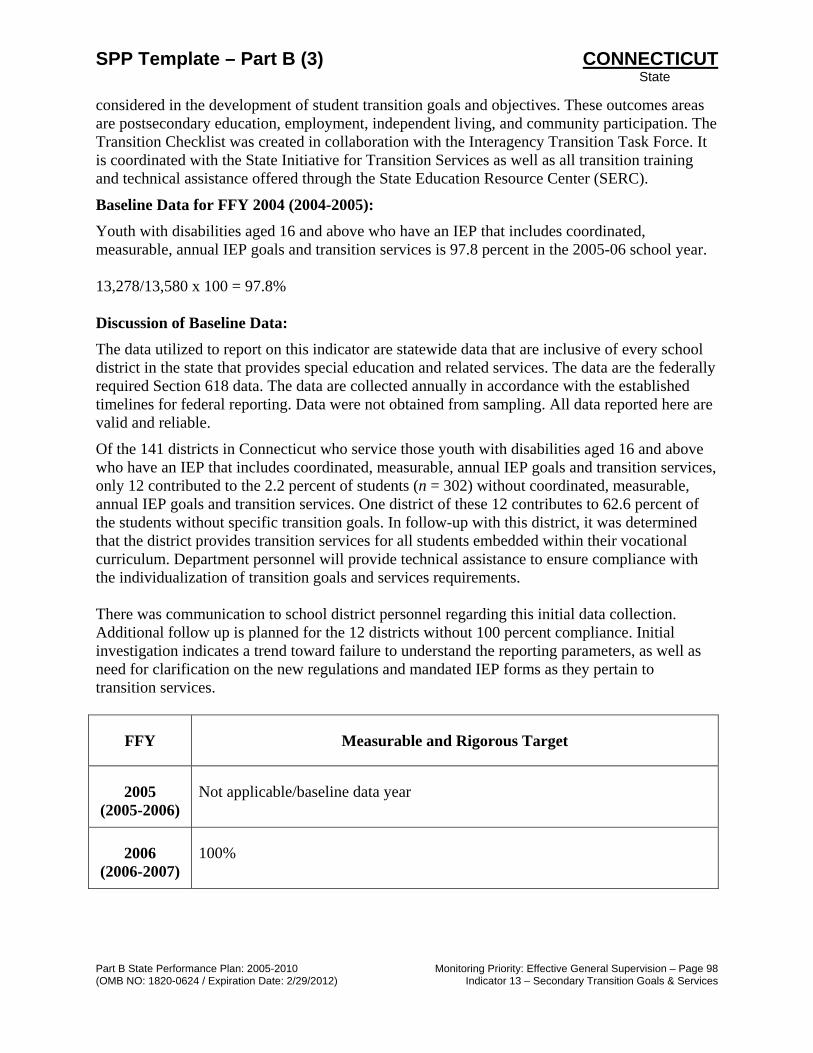
SPP Template – Part B (3) CONNECTICUT State
Part B State Performance Plan: 2005-2010 Monitoring Priority: Effective General Supervision – Page 98 (OMB NO: 1820-0624 / Expiration Date: 2/29/2012) Indicator 13 – Secondary Transition Goals & Services
considered in the development of student transition goals and objectives. These outcomes areas are postsecondary education, employment, independent living, and community participation. The Transition Checklist was created in collaboration with the Interagency Transition Task Force. It is coordinated with the State Initiative for Transition Services as well as all transition training and technical assistance offered through the State Education Resource Center (SERC).
Baseline Data for FFY 2004 (2004-2005): Youth with disabilities aged 16 and above who have an IEP that includes coordinated, measurable, annual IEP goals and transition services is 97.8 percent in the 2005-06 school year. 13,278/13,580 x 100 = 97.8% Discussion of Baseline Data: The data utilized to report on this indicator are statewide data that are inclusive of every school district in the state that provides special education and related services. The data are the federally required Section 618 data. The data are collected annually in accordance with the established timelines for federal reporting. Data were not obtained from sampling. All data reported here are valid and reliable.
Of the 141 districts in Connecticut who service those youth with disabilities aged 16 and above who have an IEP that includes coordinated, measurable, annual IEP goals and transition services, only 12 contributed to the 2.2 percent of students (n = 302) without coordinated, measurable, annual IEP goals and transition services. One district of these 12 contributes to 62.6 percent of the students without specific transition goals. In follow-up with this district, it was determined that the district provides transition services for all students embedded within their vocational curriculum. Department personnel will provide technical assistance to ensure compliance with the individualization of transition goals and services requirements.
There was communication to school district personnel regarding this initial data collection. Additional follow up is planned for the 12 districts without 100 percent compliance. Initial investigation indicates a trend toward failure to understand the reporting parameters, as well as need for clarification on the new regulations and mandated IEP forms as they pertain to transition services.
FFY Measurable and Rigorous Target
2005 (2005-2006)
Not applicable/baseline data year
2006 (2006-2007)
100%

SPP Template – Part B (3) CONNECTICUT State
Part B State Performance Plan: 2005-2010 Monitoring Priority: Effective General Supervision – Page 99 (OMB NO: 1820-0624 / Expiration Date: 2/29/2012) Indicator 13 – Secondary Transition Goals & Services
FFY Measurable and Rigorous Target
2007 (2007-2008)
100%
2008 (2008-2009)
100%
2009 (2009-2010)
100%
2010 (2010-2011)
100%
Improvement Activities/Timelines/Resources:
Improvement Activities Timelines Resources 13.1 Revise Individualized Education Program (IEP) and Summary of Performance (SOP) to reflect IDEA regulations related to transition and provide training on revised forms.
2006-07 school year
• Department personnel • SERC personnel • Transition Task Force (TTF)
13.2 Develop a comprehensive manual of age-appropriate transition assessment tools and processes to support districts in their transition planning efforts.
2006-07 school year
• SERC personnel • TTF members
13.3 Provide the Transition IEP Goals, Objectives and Services Checklist and topic brief on Writing Transition Goals and Objectives to special education directors and transition contact persons via email and post document on the Department, CPAC and SERC websites.
2006-07 school year
• Department personnel • SERC personnel • Parent Training and
Information Center (PTI)-CT Parent Advocacy Center (CPAC)
13.4 Follow up with districts reporting “No” responses to transition data point to identify possible scenarios.
2006-07 school year
• Department personnel
13.5 Participate in statewide summit on dropout prevention, graduation and alternatives to suspension.
2006–07 school year
• Department personnel • SERC personnel • CSDE Parent and Transition
Workgroups

SPP Template – Part B (3) CONNECTICUT State
Part B State Performance Plan: 2005-2010 Monitoring Priority: Effective General Supervision – Page 100 (OMB NO: 1820-0624 / Expiration Date: 2/29/2012) Indicator 13 – Secondary Transition Goals & Services
Improvement Activities Timelines Resources 13.6 Develop a comprehensive manual of age-appropriate transition assessment tools and processes to support districts in their transition planning efforts.
2006-07 school year through 2007-08
• SERC personnel • TTF members
13.7 Clarify and provide training regarding transition data collection parameters for special education directors, teachers, and data entry personnel.
2006-07 school year through 2011
• Department personnel
13.8 Develop and conduct a Train-the-Trainer series using the revised Transition Resource Manual to prepare individuals to offer transition training to districts, families and agency personnel.
2006-07 school year through 2011
• Department personnel • SERC personnel • CSDE Transition and Parent
Workgroups • CPAC • Connecticut Council for
Administrators of Special Education (ConnCASE)
13.9 Provide training to assist districts to implement a review process to assess the quality of observable measurable postsecondary goals and objectives over a period of years to determine if there has been educational benefit.
2006-07 school year through 2011
• SERC personnel • TTF members • CPAC
13.10 Provide training to districts, families, state agency personnel, and other relevant stakeholder groups regarding transition and post-school services available via state agencies.
2006-07 school year through 2011
• Department personnel • SERC personnel • CSDE Transition and Parent
Workgroups • Parent Training and
Information Center (PTI) – CT Parent Advocacy Center (CPAC)
• Department of Social Services, Bureau of Rehabilitation Services (BRS)
• Department of Developmental Disabilities (DDS)
• DDS, Division of Autism Spectrum Services (DASS)
• Bureau of Education and Services for the Blind (BESB)
• Department of Mental Health and Addiction Services (DMHAS)

SPP Template – Part B (3) CONNECTICUT State
Part B State Performance Plan: 2005-2010 Monitoring Priority: Effective General Supervision – Page 101 (OMB NO: 1820-0624 / Expiration Date: 2/29/2012) Indicator 13 – Secondary Transition Goals & Services
Improvement Activities Timelines Resources 13.11 Provide training to Department personnel and relevant stakeholder groups to support best practices in secondary transition that will contribute to successful post-school outcomes.
2006-07 school year; annually as needed
• Department personnel • SERC personnel • TTF members • CPAC • ConnCASE
13.12 Provide resources and training to districts regarding transition services in college, university and community settings for at-risk and 18 – 21 year old students. Meet with State Education Resource Center (SERC) staff to discuss statewide and district-specific activities and training to address graduation and dropout.
2006-07 school year through 2011
• Department personnel • SERC personnel • CSDE Transition and LRE
Workgroups • National Organization on
Disability – Start on Success Programs (SOS)
• CSPD Council
13.13 Develop and implement a process to conduct annual secondary transition on-site training visits to selected districts to ensure that the IEPs of youth aged 16 and above include coordinated, measurable annual IEP goals and transition services that are reasonably designed to enable the student to meet the postsecondary goals.
2007-08 school year
• Department personnel • SERC personnel • TTF members
13.14 Develop and provide training to districts and families regarding tools for differentiating instruction, and writing measurable post-school outcome goal statements, functional performance statements, and annual IEP goals and objectives within the general curriculum (e.g., checklist, Summary of Performance guidance and instructions, CT Frameworks and Content Standards) to improve transition services.
2007-08 school year
• Department personnel • SERC personnel • TTF members • CPAC

SPP Template – Part B (3) CONNECTICUT State
Part B State Performance Plan: 2005-2010 Monitoring Priority: Effective General Supervision – Page 102 (OMB NO: 1820-0624 / Expiration Date: 2/29/2012) Indicator 14 – Postsecondary Outcomes
Part B State Performance Plan (SPP) for 2005-2010
Overview of the State Performance Plan Development:
See Overview page i (The following items are to be completed for each monitoring priority/indicator.)
Monitoring Priority: Effective General Supervision Part B / Effective Transition
Indicator 14: Percent of youth who are no longer in secondary school, had IEPs in effect at the time they left school, and were:
A. Enrolled in higher education within one year of leaving high school. B. Enrolled in higher education or competitively employed within one year of leaving high school. C. Enrolled in higher education or in some other postsecondary education or training program; or
competitively employed or in some other employment within one year of leaving high school.
(20 U.S.C. 1416(a)(3)(B)) Measurement:
A. Percent enrolled in higher education = [(# of youth who are no longer in secondary school, had IEPs in effect at the time they left school and were enrolled in higher education within one year of leaving high school) divided by the (# of respondent youth who are no longer in secondary school and had IEPs in effect at the time they left school)] times 100.
B. Percent enrolled in higher education or competitively employed within one year of leaving high school = [(# of youth who are no longer in secondary school, had IEPs in effect at the time they left school and were enrolled in higher education or competitively employed within one year of leaving high school) divided by the (# of respondent youth who are no longer in secondary school and had IEPs in effect at the time they left school)] times 100.
C. Percent enrolled in higher education, or in some other postsecondary education or training program; or competitively employed or in some other employment = [(# of youth who are no longer in secondary school, had IEPs in effect at the time they left school and were enrolled in higher education, or in some other postsecondary education or training program; or competitively employed or in some other employment) divided by the (# of respondent youth who are no longer in secondary school and had IEPs in effect at the time they left school)] times 100.
Due to changes in the Part B Indicator Measurement Table (Revised 11/10/09), the following information does not match the above indicator language and measurement.
Refer to the February 2009 revision of Connecticut’s Part B State Performance Plan for the indicator language and measurement that was in place when this indicator was developed. Per OSEP’s instructions, the State will establish a new baseline and review/revise the improvement activities in the FFY 2009 submission (February 1, 2011).

SPP Template – Part B (3) CONNECTICUT State
Part B State Performance Plan: 2005-2010 Monitoring Priority: Effective General Supervision – Page 103 (OMB NO: 1820-0624 / Expiration Date: 2/29/2012) Indicator 14 – Postsecondary Outcomes
Overview of Issue/Description of System or Process: The Department has been collecting outcome data on all (approximately 4,500) exiters from special education who are no longer in secondary school (graduates with regular diplomas and certificates of completion, exiters reaching maximum age and dropouts) for the years 2000, 2002 and 2004 using census methodology. The Department has a broad stakeholder group represented on the Transition Task Force (TTF) whose input led to the decision to align the data collection on all exiters to the SPP requirements of every year, one year after they exit special education and are no longer in secondary school. This alignment will be effective with the 2006–07 school year exiters, to be reported in the February 2009 APR. While the Department has already shifted to a yearly survey, we will continue, as approved by OSEP, to survey one year after exiting for the February 2009 APR. The instrument to be used was developed in 2000 by the Department with input from the TTF. A panel of content experts with expertise in special education, transition and/or survey methodology reviewed the original instrument. The 2002 survey was subsequently revised based upon this feedback. The 2004 instrument was shortened from 24 items to eight items and was also reviewed by a panel of young adults with disabilities. Information was elicited related to the clarity and readability of each item and the instructions. With input from National Post-School Outcomes Center (NPSO) resources and the Transition Workgroup, the current instrument underwent additional minor modifications. The Department has a Memorandum of Agreement with the University of Connecticut to conduct data collection activities for indicator 14. See attached 2005 survey. The instrument consisted of items across three main categories: 1) Employment Status; 2) Postsecondary Education and Training Status; and 3) Access to State Agency Support Systems. Most items are formatted with a stem and list of options from which respondents select either the single most appropriate response or all responses that apply. The final item on the survey is open-ended and offers respondents an opportunity to provide additional information about life after high school. For the purposes of the post-school outcomes survey, the Department uses the Rehabilitation Act definition of competitive employment: “Competitive employment means work, in the competitive labor market that is performed on a full-time or part-time basis in an integrated setting, and for which an individual is compensated at or above the minimum wage, but not less than the customary wage and level of benefits paid by the employer for the same or similar work performed by individuals who are not disabled” (Authority: Sections 7(11) and 12(c) of the Act; 29U.S.C. 705(11) and 709(c)). Therefore, exiters who responded YES to either full-time or part-time work in Question 1 of the survey and received minimum or above minimum wage on Question 2 would be classified as competitively employed. The Department is using the general definitions of institutions of higher education found in the 1998 Amendments to the Higher Education Act of 1965 (P.L. 105-244) when referring to postsecondary education and training in the post-school outcomes survey. Postsecondary school means an educational institution that admits students having a certificate of graduation from a school providing secondary education, or the recognized equivalent of such a certificate; is legally authorized to provide a program of education beyond secondary education; provides an

SPP Template – Part B (3) CONNECTICUT State
Part B State Performance Plan: 2005-2010 Monitoring Priority: Effective General Supervision – Page 104 (OMB NO: 1820-0624 / Expiration Date: 2/29/2012) Indicator 14 – Postsecondary Outcomes
educational program for which the institution awards a bachelor's degree or provides not less than a two-year program that is acceptable for full credit toward such a degree; is a public or other nonprofit institution; and is accredited by a nationally recognized accrediting agency or association. Postsecondary school also includes any school that provides not less than a one-year program of training to prepare students for gainful employment in a recognized occupation; and a public or nonprofit private educational institution that admits, as regular students, persons who are beyond the age of compulsory school attendance in Connecticut. Therefore, exiters who respond YES to being a full-time (12 or more credits per semester) or part-time (less than 12 credits per semester) student in Question 3 and are enrolled in any of the following postsecondary schools listed in Question 4 (community or two-year college, four-year college or university, technical/trade school, military training school or program, or a college-prep or postgraduate program) would be counted as participating in postsecondary education. Responses under Other will be recoded as appropriate (e.g., Army would be recoded as military training school or program, Certified Nurses Assistant – CNA would be recoded as technical/trade school).
A letter explaining the purpose of the survey and inviting participation was created. The letter explained that the completed survey would be sent to the project principal investigator at the University of Connecticut for data entry. A consent form that outlines the respondent’s rights and protections as a participant in this research was created. Both the cover letter and the consent form indicate that completion and return of the survey are an expression of consent to participate. The completed instrument, letter of participation, and consent form were submitted to the University of Connecticut Institutional Review Board and were approved. The initial mailing was conducted by the Department in collaboration with the University of Connecticut. The survey was mailed during the first week of April 2006. There was a follow-up mailing in an effort to increase response rate. The Department provided the data analysis. The data obtained from the spring 2006 survey informed our decisions about activities, interventions, technical assistance, professional development and monitoring activities for the 2006-07 school year. As noted, the Transition Task Force recommended collecting post-school outcome data via a census method using an annual collection cycle on students one year after they exit special education and are no longer in secondary school. Particular attention was paid to the representativeness of the survey responses received with respect to disability, gender, race and ethnicity and age of the total surveyed population. Because the Department changed to a new exit data collection system statewide, effective during the 2006–07 school year, students who exited special education and secondary school in 2004–05 and were reported to the Department in December 2005 were surveyed in spring 2007. Data will be reported out on specific LEAs in the District Annual Performance Report each winter, as long as the number of responses for a given LEA meets the Department’s minimum standard for the reporting of LEA-level data (n = 20). This rule safeguards against possible breaches in confidentiality. Beginning with the 2007-08 school year students will be surveyed one year after exiting special education and secondary school. Therefore, students who exited special education and secondary school in 2006–07 and were reported to the Department in October 2007 will be surveyed in spring 2008 and reported in the February 2009 APR.

SPP Template – Part B (3) CONNECTICUT State
Part B State Performance Plan: 2005-2010 Monitoring Priority: Effective General Supervision – Page 105 (OMB NO: 1820-0624 / Expiration Date: 2/29/2012) Indicator 14 – Postsecondary Outcomes
Baseline Data for FFY 2004 (2004-2005): The Department’s 2007 survey of students who exited special education in 2004-05 and were no longer in secondary education found that 81.1 percent of survey respondents were competitively employed and/or enrolled in post-secondary education within two years after their exit.
715/882 x 100 = 81.1% 2007 survey administration sample total: surveys sent = 4,864 exiters surveys returned completed = 882 response rate = 18.1% surveys returned non-deliverable = 1, 077 non-deliverable rate = 22.1%
While an 18.1 percent response rate with a 22.1 percent non-deliverable rate is not what the Department hoped for, we are well aware that the current practice (for which we have an approved waiver from OSEP) of surveying two years out is a major influence. Our existing practice was a recommendation of our stakeholder group. Connecticut will be changing to the OSEP standard of surveying exiters one year out effective the 2006-07 exiters, to be surveyed in the spring of 2008 and reported in the February 2009 APR. The Department would expect an increase in response rate at the time this change in method is implemented.
Discussion of Baseline Data: The Department’s spring 2007 survey of students who exited special education in 2004-05 and were no longer in secondary education found that 81.1 percent were competitively employed and/or enrolled in post-secondary education within two years after their exit. Of these, 28.1 percent were only competitively employed, 15.7 percent were only enrolled in post-secondary education and 56.2 percent were both competitively employed and enrolled in post-secondary education. While the Department sought survey participation from all 2004-05 exiters (4,864), many could not be located and ultimately 882 students or 18.1 percent of all exiters participated in the survey. Data related to the exceptionality type, gender, minority status and dropout rate of both the survey responders (n = 882) and the total population of exiters of special education and secondary school in 2005 (n = 4,864) were examined for representativeness using the National Post-School Outcomes Center’s Response Calculator (www.psocenter.org). Results indicate that minority exiters were underrepresented in the final respondent sample, as were exiters who dropped out of school. Differences by exceptionality category and gender were not significant.

SPP Template – Part B (3) CONNECTICUT State
Part B State Performance Plan: 2005-2010 Monitoring Priority: Effective General Supervision – Page 106 (OMB NO: 1820-0624 / Expiration Date: 2/29/2012) Indicator 14 – Postsecondary Outcomes
FFY Measurable and Rigorous Target
2005 (2005-2006)
81.1% baseline data
2006 (2006-2007)
81.2%
2007 (2007-2008)
81.5%
2008 (2008-2009)
82%
2009 (2009-2010)
84%
2010 (2010-2011)
85%
Improvement Activities/Timelines/Resources:
Improvement Activities Timelines Resources 14.1 Develop pilot program process for using district personnel to follow up on post-school outcome non-responders.
2007 -08 school year
• Department personnel • SERC personnel • TTF Members • University of Connecticut
(UCONN) 14.2 Develop post-school outcomes survey informational materials for distribution to students, families, and district personnel at student Summary of Performance (SOP) interviews or final IEP Meetings. Develop and provide training to districts and families regarding post-school outcomes survey and its impact on transition services and the SOP. Incorporate into existing training.
2007 -08 school year
• Department personnel • SERC personnel • TTF Members • Parent Training and Information
Center (PTI) – CT Parent Advocacy Center (CPAC)
14.3 Develop Executive Summary with graphics of 2005 Exiter Survey results for dissemination to districts and posting on Department website. Use data from
2007-08 school year
• Department personnel • SERC personnel • TTF Members • UCONN personnel

SPP Template – Part B (3) CONNECTICUT State
Part B State Performance Plan: 2005-2010 Monitoring Priority: Effective General Supervision – Page 107 (OMB NO: 1820-0624 / Expiration Date: 2/29/2012) Indicator 14 – Postsecondary Outcomes
Improvement Activities Timelines Resources Executive Summary of 2005 Exiter Survey results with graphics and suggestions for improving secondary transition services for dissemination to districts; use this data to evaluate current measurable and rigorous targets. 14.4 Provide training regarding post-school outcomes survey data collection for special education directors and transition personnel.
2007-08 school year through 2011
• Department personnel • SERC personnel • Connecticut Council for
Administrators of Special Education (ConnCASE)
14.5 Provide training to districts, families, state agency personnel, and other relevant stakeholder groups regarding transition and post-school services available via state agencies.
2007-08 school year through 2011
• Department personnel • SERC personnel • CSDE Transition and Parent
Workgroups • CPAC • Department of Social Services,
Bureau of Rehabilitation Services (BRS)
• Department of Developmental Disabilities (DDS)
• DDS, Division of Autism Spectrum Services (DASS)
• Bureau of Education and Services for the Blind (BESB)
• Department of Mental Health and Addiction Services (DMHAS)
14.6 Provide training to Department personnel and relevant stakeholder groups to support best practices in secondary transition that will contribute to successful post-school outcomes.
2007-08 school year through 2011
• Department personnel • SERC personnel • Transition Task Force (TTF) • CPAC • ConnCASE
14.7 Display Post-School Outcomes Survey results on Department website.
2007-08 school year through 2011
• Department personnel • UCONN personnel
14.8 Rewrite post-school outcomes survey letter of instructions to better assist students and their assistors in completing the survey.
2008-09 school year
• Department personnel • SERC personnel • CSDE Transition Workgroup • UCONN personnel
14.9 Develop protocol report format and dissemination process for districts that received 20 or more completed survey
2008-09 school year
• Department personnel • SERC personnel • CSDE Transition Workgroup

SPP Template – Part B (3) CONNECTICUT State
Part B State Performance Plan: 2005-2010 Monitoring Priority: Effective General Supervision – Page 108 (OMB NO: 1820-0624 / Expiration Date: 2/29/2012) Indicator 14 – Postsecondary Outcomes
Improvement Activities Timelines Resources responses to allow them to incorporate specific data elements into transition planning efforts.
• UCONN personnel
14.10 Translate post-school outcomes survey and letter of instructions into Spanish.
2009-10 school year
• Department personnel • SERC personnel • CSDE Transition Workgroup
14.11 Explore options for using web-based/on-line post-school outcomes survey.
2009-10 school year
• Department personnel • SERC personnel • CSDE Transition Workgroup • UCONN personnel
14.12 Research and develop additional methods to improve survey response by following up on dropouts and non-responders.
2009-10 school year
• Department personnel • SERC personnel • CSDE Transition and School
Engagement and Completion Workgroup
• UCONN personnel 14.13 Identify and collaborate with districts who already collect post-school outcome data on either general and/or special education exiters to prevent duplication of efforts and develop comparison to general education outcomes.
2009-10 school year
• Department personnel • SERC personnel • CSDE Transition Workgroup • UCONN personnel • ConnCASE

SPP Template – Part B (3) Connecticut State
Part B State Performance Plan: 2005-2010 Monitoring Priority: Effective General Supervision – Page 109 (OMB NO: 1820-0624 / Expiration Date: 2/29/2012) Indicator 15 – General Supervision
Part B State Performance Plan (SPP) for 2005-2010
Overview of the State Performance Plan Development: The Department has a Focused Monitoring Steering Committee comprised of parents, advocates, Department consultants, training and technical assistance providers from the State Education Resource Center (SERC) and district directors of special education. This group was originally convened in 2003-04 to assist the Department in designing the current system of General Supervision and Focused Monitoring. The group continues to meet on a regular basis to review the results of general supervision and monitoring activities, advise the Department on improvement activities, analyze statewide data, develop strategies for public dissemination of data, determine the key performance indicators for the upcoming year and advise on implementation of the SPP. Due to the treatment of the 2003-04 school year as a planning year, there were a limited number of findings of noncompliance in that year. The baseline data is significantly impacted by the on-going issues of noncompliance with one district currently in level four of sanctions. (The following items are to be completed for each monitoring priority/indicator.)
Monitoring Priority: Effective General Supervision Part B / General Supervision
Indicator 15: General supervision system (including monitoring, complaints, hearings, etc.) identifies and corrects noncompliance as soon as possible but in no case later than one year from identification.
(20 U.S.C. 1416 (a)(3)(B))
Measurement: Percent of noncompliance corrected within one year of identification:
a. # of findings of noncompliance. b. # of corrections completed as soon as possible but in no case later than one year from
identification.
Percent = [(b) divided by (a)] times 100.
For any noncompliance not corrected within one year of identification, describe what actions, including technical assistance and enforcement actions that the State has taken.
Overview of Issue/Description of System or Process: The Department has multiple methods of oversight to ensure compliance with IDEA. These methods together make up the system of general supervision. A description of the system is available on the Department website at www.sde.ct.gov in a manual titled: Connecticut’s System of General Supervision and Focused Monitoring for Continuous Improvement for Students with

SPP Template – Part B (3) Connecticut State
Part B State Performance Plan: 2005-2010 Monitoring Priority: Effective General Supervision – Page 110 (OMB NO: 1820-0624 / Expiration Date: 2/29/2012) Indicator 15 – General Supervision
Disabilities. A copy of the manual is also included with this SPP packet. The range of supervision and monitoring activities includes:
• ongoing meetings of the Focused Monitoring Steering Committee; • the annual review and dissemination of data for LEAs through the Special Education
Strategic School Profiles; • the annual training of data submission and verification of data through preliminary
profiles and focused monitoring data reports; • ongoing analysis of trends in complaints, mediations and due process hearings; • self-assessments conducted by LEAs on identified areas of concern; • a desk audit of LEA IDEA applications for funding; • an attestation by each district of their adoption and use of the Department issued Policy
and Procedure Manual and IEP form; • training and technical assistance on guidelines and publications created by the
Department and supported through training and technical assistance from SERC; • monitoring of corrective actions issued through complaints or due process hearings, and
focused monitoring; and • focused monitoring of key performance indicators.
The Department spent the 2003-04 school year as a transition from our program review process of monitoring LEAs on a cyclical basis to the current system of focused monitoring. The new system of focused monitoring incorporates the information gleaned from all existing data sources including complaints, mediations and due process hearings, as well as the other methods of general supervision described above. The data from the above resources is used by the steering committee to determine key performance indicators (KPIs) for focused monitoring on an annual basis. Three data probes are identified for each key performance indicator. Criteria is established for each data point and district data are displayed on data maps in one of three categories: 1) an area of significant concern requiring data verification, data analysis and potential need for monitoring and improvement planning; 2) an area of concern requiring data verification and analysis; and 3) an area of strength indicating strong performance in the area identified. A copy of the data maps for 2005-06 is included in this SPP packet and available on the Department website at www.sde.ct.gov. The data maps are disseminated to superintendents, special education directors and parent organizations. The data maps are used to determine which districts will receive specific communications regarding their performance and requests for a self-assessment to analyze data and indicate improvement activities. This information is reviewed and used to determine which districts will subsequently receive a focused monitoring site visit. Site visits were conducted for 10 districts in the 2004-05 school year and will be conducted for 10 districts in the 2005-06 school year. Site visits include a review of district policies, practices and procedures, a record review, observation of students, interviews with staff and administration and a public forum for parents. The site visit team includes representatives from the Department’s Bureau of Special Education and Bureau of School and District Improvement,
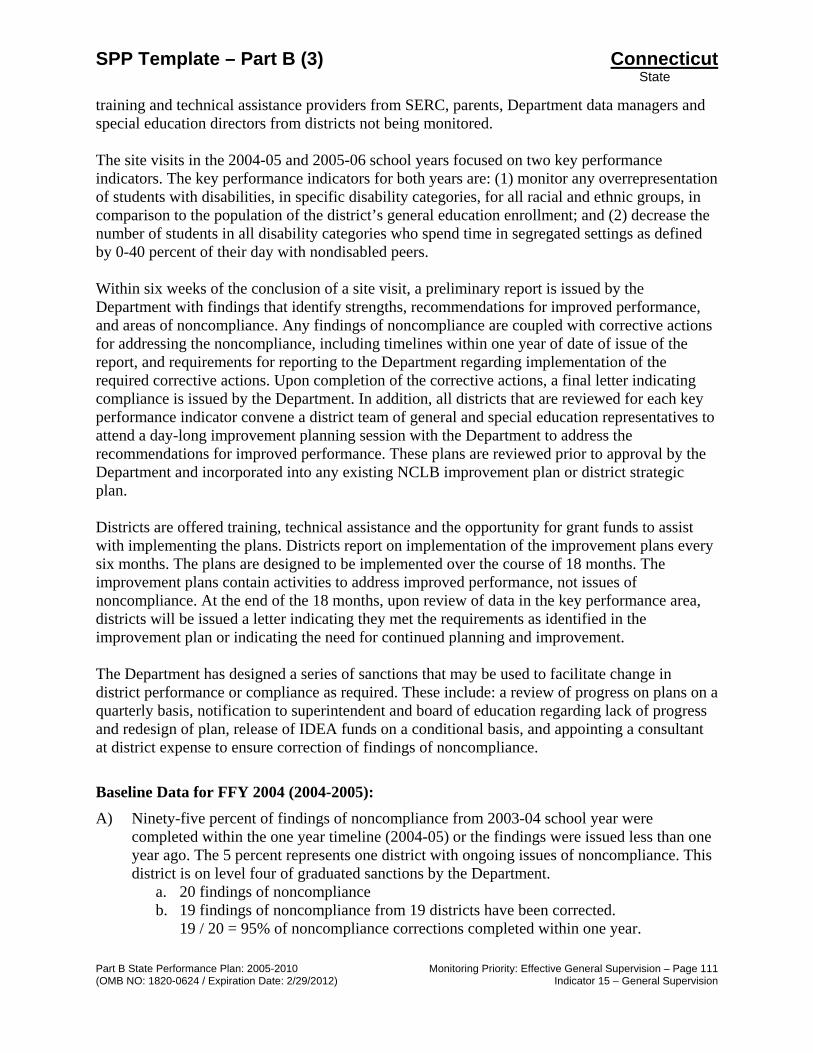
SPP Template – Part B (3) Connecticut State
Part B State Performance Plan: 2005-2010 Monitoring Priority: Effective General Supervision – Page 111 (OMB NO: 1820-0624 / Expiration Date: 2/29/2012) Indicator 15 – General Supervision
training and technical assistance providers from SERC, parents, Department data managers and special education directors from districts not being monitored.
The site visits in the 2004-05 and 2005-06 school years focused on two key performance indicators. The key performance indicators for both years are: (1) monitor any overrepresentation of students with disabilities, in specific disability categories, for all racial and ethnic groups, in comparison to the population of the district’s general education enrollment; and (2) decrease the number of students in all disability categories who spend time in segregated settings as defined by 0-40 percent of their day with nondisabled peers.
Within six weeks of the conclusion of a site visit, a preliminary report is issued by the Department with findings that identify strengths, recommendations for improved performance, and areas of noncompliance. Any findings of noncompliance are coupled with corrective actions for addressing the noncompliance, including timelines within one year of date of issue of the report, and requirements for reporting to the Department regarding implementation of the required corrective actions. Upon completion of the corrective actions, a final letter indicating compliance is issued by the Department. In addition, all districts that are reviewed for each key performance indicator convene a district team of general and special education representatives to attend a day-long improvement planning session with the Department to address the recommendations for improved performance. These plans are reviewed prior to approval by the Department and incorporated into any existing NCLB improvement plan or district strategic plan.
Districts are offered training, technical assistance and the opportunity for grant funds to assist with implementing the plans. Districts report on implementation of the improvement plans every six months. The plans are designed to be implemented over the course of 18 months. The improvement plans contain activities to address improved performance, not issues of noncompliance. At the end of the 18 months, upon review of data in the key performance area, districts will be issued a letter indicating they met the requirements as identified in the improvement plan or indicating the need for continued planning and improvement.
The Department has designed a series of sanctions that may be used to facilitate change in district performance or compliance as required. These include: a review of progress on plans on a quarterly basis, notification to superintendent and board of education regarding lack of progress and redesign of plan, release of IDEA funds on a conditional basis, and appointing a consultant at district expense to ensure correction of findings of noncompliance.
Baseline Data for FFY 2004 (2004-2005): A) Ninety-five percent of findings of noncompliance from 2003-04 school year were
completed within the one year timeline (2004-05) or the findings were issued less than one year ago. The 5 percent represents one district with ongoing issues of noncompliance. This district is on level four of graduated sanctions by the Department.
a. 20 findings of noncompliance b. 19 findings of noncompliance from 19 districts have been corrected.
19 / 20 = 95% of noncompliance corrections completed within one year.

SPP Template – Part B (3) Connecticut State
Part B State Performance Plan: 2005-2010 Monitoring Priority: Effective General Supervision – Page 112 (OMB NO: 1820-0624 / Expiration Date: 2/29/2012) Indicator 15 – General Supervision
B) Zero percent of findings of noncompliance from 2003-04 school year were completed
within the one year time line. This percentage represents three findings of noncompliance for the same district indicated in A. There were no findings of noncompliance for other districts.
a. 3 findings of noncompliance b. 0 findings of noncompliance have been corrected.
3 / 0 = 0% of noncompliance corrections completed within one year.
C) One hundred percent of findings of noncompliance from 2003-04 school year were completed within the one year time line.
a. 39 agencies with findings of noncompliance b. 99 findings of noncompliance c. 99 findings of noncompliance have been corrected
99 / 99 = 100% of noncompliance corrections completed within one year.
Discussion of Baseline Data: A) As reported in the 2005 APR, one urban school district remains with ongoing issues of
noncompliance identified in the 1999-2003 cycle of review, in spite of the continued efforts of the Department to facilitate resolution of these issues. These issues include: ensuring that IEPs are implemented and that each student’s IEP is available at the school that he/she is attending, placement decisions for children with disabilities are made on an individual basis, all students have access to the general education curriculum with corresponding materials and all services identified on IEPs are delivered.
A staff member from the Bureau of Special Education was assigned to work with a staff member from the Equity Unit of the Department to ensure that students are receiving a free and appropriate public education in the least restrictive environment. Since the last report in the 2005 APR, the Department has maintained an ongoing presence in the district through the following activities:
• May 2005: Department audit of students’ IEPs to monitor delivery of services – six schools were chosen for the review, four were visited. Ten of 16 files continued to demonstrate noncompliance;
• June and October 2005: Meeting of superintendent, assistant superintendent, chief of staff and director of special education with the Department associate commissioner and Department district monitors to discuss issues of noncompliance;
• Fall 2005: Meeting of Department district monitors with the administration of the teacher’s union and district administration to discuss issues relating to noncompliance;
• Fall 2005: Provision of technical assistance to district through Department funded intervention teams in 15 schools ($30,000);
• Fall 2005: Planning for district Coaches Academy in Spring 2006; • Fall 2005: Implementation of Level Four of Sanctions; and • December 2005: Focused Monitoring site visit scheduled.

SPP Template – Part B (3) Connecticut State
Part B State Performance Plan: 2005-2010 Monitoring Priority: Effective General Supervision – Page 113 (OMB NO: 1820-0624 / Expiration Date: 2/29/2012) Indicator 15 – General Supervision
The Department has a menu of four levels of graduated sanctions that may be employed in response to district noncompliance. As indicated through the 2005 APR and the list of Department interventions, three of these sanctions had been employed. On November 1, 2005, Department communicated to the district movement to level four of sanctions which includes appointing a special education consultant at district expense to assist with implementation of corrective actions. The Department required the district to redirect part of their 2006 IDEA appropriations to ensure that students were receiving their mandated IEP services. The mandated consultant will be required to conduct school and classroom visits, prepare and write monthly reports on district progress in implementing its special education policies and procedures and in demonstrating compliance with state and federal mandates. The reports will be submitted to the superintendent, Chair of the board of education, and the Department associate commissioner of the Division of Family and Student Support Services.
As described above, the Department had minimal findings of noncompliance in 2003-04 outside of those identified through dispute resolution. This data are presented in the attached data template and used to establish the required baselines. In an effort to more accurately communicate the current system of general supervision and monitoring, findings for the 2004-05 year are included in this report. The Department conducted 10 focused monitoring site visits in the 2004-05 year. No findings of noncompliance have exceeded the one year time line. The following chart summarizes findings of noncompliance and timelines for completion of corrective actions:
District Issue(s) One year timeline Status 064 Provision of IEP services
General education teacher access to IEP Access to general education curriculum Placement decisions made on individual basis
February 2002 Open Level Four of sanctions
163 Evaluation practices Provision of IEP services
December 17, 2005 Open
077 Evaluation practices Provision of IEP services
December 7, 2005 Closed
103 Evaluation practices Length of instructional day
December 22, 2005 Closed
164 IEP goals and services individualized for student need
January 21, 2006 Closed
147 Notice of planning and placement team meeting Out-of-district IEP implementation and notice of placement
March 28, 2006 Closed
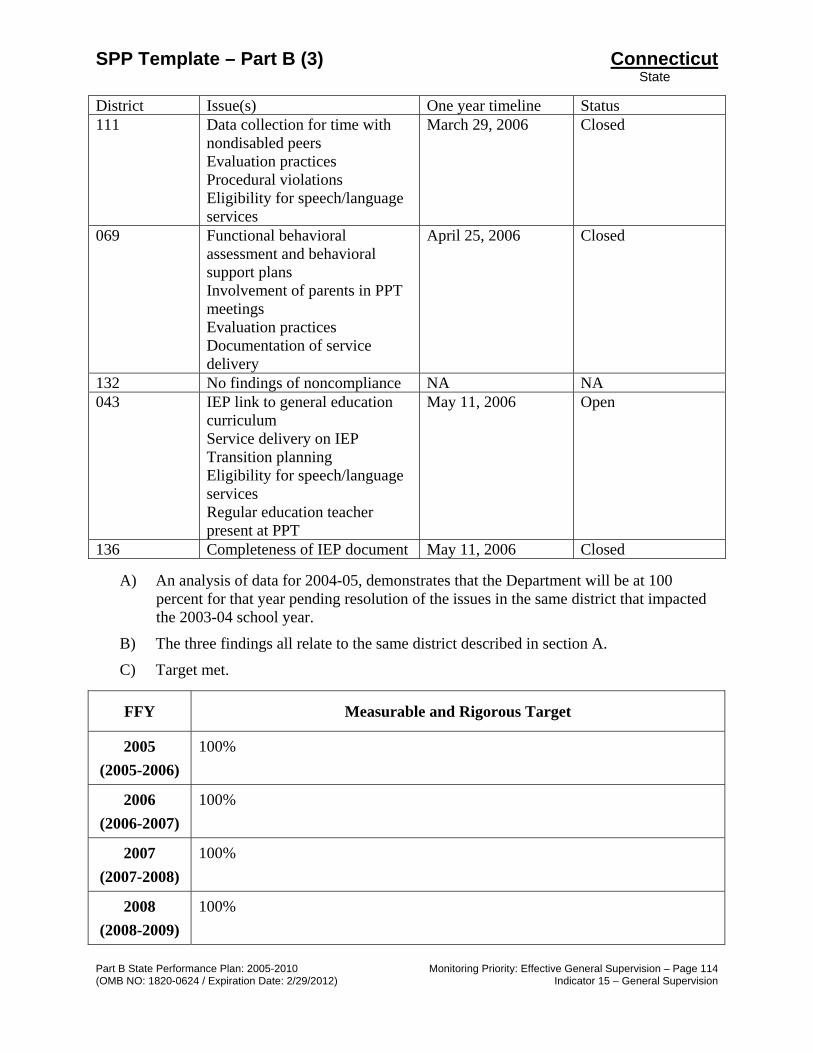
SPP Template – Part B (3) Connecticut State
Part B State Performance Plan: 2005-2010 Monitoring Priority: Effective General Supervision – Page 114 (OMB NO: 1820-0624 / Expiration Date: 2/29/2012) Indicator 15 – General Supervision
District Issue(s) One year timeline Status 111 Data collection for time with
nondisabled peers Evaluation practices Procedural violations Eligibility for speech/language services
March 29, 2006 Closed
069 Functional behavioral assessment and behavioral support plans Involvement of parents in PPT meetings Evaluation practices Documentation of service delivery
April 25, 2006 Closed
132 No findings of noncompliance NA NA 043 IEP link to general education
curriculum Service delivery on IEP Transition planning Eligibility for speech/language services Regular education teacher present at PPT
May 11, 2006 Open
136 Completeness of IEP document May 11, 2006 Closed
A) An analysis of data for 2004-05, demonstrates that the Department will be at 100 percent for that year pending resolution of the issues in the same district that impacted the 2003-04 school year.
B) The three findings all relate to the same district described in section A.
C) Target met.
FFY Measurable and Rigorous Target
2005 (2005-2006)
100%
2006 (2006-2007)
100%
2007 (2007-2008)
100%
2008 (2008-2009)
100%

SPP Template – Part B (3) Connecticut State
Part B State Performance Plan: 2005-2010 Monitoring Priority: Effective General Supervision – Page 115 (OMB NO: 1820-0624 / Expiration Date: 2/29/2012) Indicator 15 – General Supervision
FFY Measurable and Rigorous Target
2009 (2009-2010)
100%
2010 (2010-2011)
100%
Improvement Activities/Timelines/Resources:
Improvement Activities Timelines Resources 15.1 Implementation of NCSEAM State Partner Work Plan.
2005-06 school year
• National Center for Special Education Accountability Monitoring (NCSEAM)
15.2 Addition of student interview into FM process.
2005-06 school year
• Students attending CT Youth Leadership Forum
15.3 Disseminate state color-coded maps representing key performance indicators.
2005-06 school year
• Department personnel to design and disseminate the maps
• Department website 15.4 Arrange for Focused Monitoring Steering Committee to meet three times on an annual basis to review data, determine key performance indicators and advise on implementation of SPP.
2005-06 school year through 2011
• Stipends for parents • NCSEAM
15.5 (Deleted) Revision of data maps and District APRs on an annual basis.
2005-06 school year through 2011
• Upgraded software • Special Education Data
Application and Collection (SEDAC)
15.6 Complete annual revision of focused monitoring self assessments and site visit protocols.
2005-06 school year through 2011
• Focused Monitoring Coordinator
• Lead consultants for FM 15.7 Conduct focused monitoring to ensure compliance with IDEA. The monitoring tools will be utilized to review student records; interview with administrators, teachers (general and special education), related service professionals; solicit input from parent through forums; and conduct observations of implementation of student IEPs.
2005-06 school year through 2011
• Fourteen consultants from the Department to conduct focused monitoring site visits, including focused monitoring coordinator
15.8 Distribute district grant funds to implement improvement plans.
2005-06 school year through 2011
• $10,000 per district – IDEA discretionary funds

SPP Template – Part B (3) Connecticut State
Part B State Performance Plan: 2005-2010 Monitoring Priority: Effective General Supervision – Page 116 (OMB NO: 1820-0624 / Expiration Date: 2/29/2012) Indicator 15 – General Supervision
Improvement Activities Timelines Resources 15.9 Conduct external evaluation of focused monitoring system.
2006-07 school year
• External evaluator • NCSEAM technical assistance
15.10 Revise state IEP form and manual – training in new form.
2006-07 school year
• Department personnel • Printing costs
15.11 Update Department’s Policy and Procedure Manual for districts.
2006-07 school year
• Department personnel
15.12 Provide oversight by Department consultants to districts with ongoing noncompliance and district consultant to provide monitoring and technical assistance in district and report to the Department on correction of noncompliance.
2006-07 school year
• District IDEA funds
15.13 Review of system of sanctions for districts with ongoing noncompliance.
2006-07 school year
• Department personnel
15.14 Provide training and technical assistance tied to district improvement plans.
2006-07 school year
• SERC personnel
15.15 Implement new Department data collection system to assist with tracking noncompliance identified through complaints, mediations and due process hearings.
2006-07 school year
• Office of Information Systems database development
15.16 Meet with SERC to discuss statewide and district specific activities and training to address general supervision and monitoring.
2005-06 school year through 2011
• Department personnel • SERC personnel • CSPD Council
15.17 Develop and implement GSS Strategic Planning and Internal Evaluation Protocol
2007-08 school year until complete
• Department personnel • SERC personnel
15.18 Conduct alignment and coordinate activities such as notification methods, data collection and methods, database infrastructure among all components of general supervision and state accountability measures to ensure an integrated system.
2007-08 school year through 2011
• Department personnel • SERC personnel • Other state agency personnel as
needed
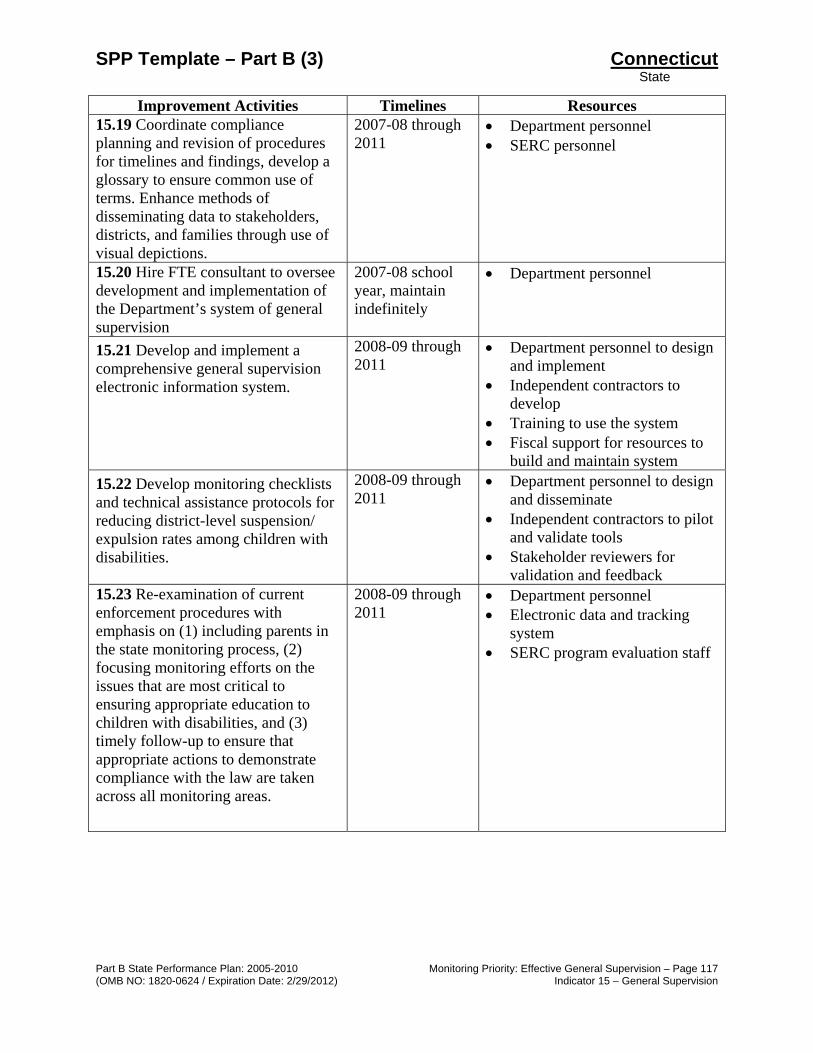
SPP Template – Part B (3) Connecticut State
Part B State Performance Plan: 2005-2010 Monitoring Priority: Effective General Supervision – Page 117 (OMB NO: 1820-0624 / Expiration Date: 2/29/2012) Indicator 15 – General Supervision
Improvement Activities Timelines Resources 15.19 Coordinate compliance planning and revision of procedures for timelines and findings, develop a glossary to ensure common use of terms. Enhance methods of disseminating data to stakeholders, districts, and families through use of visual depictions.
2007-08 through 2011
• Department personnel • SERC personnel
15.20 Hire FTE consultant to oversee development and implementation of the Department’s system of general supervision
2007-08 school year, maintain indefinitely
• Department personnel
15.21 Develop and implement a comprehensive general supervision electronic information system.
2008-09 through 2011
• Department personnel to design and implement
• Independent contractors to develop
• Training to use the system • Fiscal support for resources to
build and maintain system 15.22 Develop monitoring checklists and technical assistance protocols for reducing district-level suspension/ expulsion rates among children with disabilities.
2008-09 through 2011
• Department personnel to design and disseminate
• Independent contractors to pilot and validate tools
• Stakeholder reviewers for validation and feedback
15.23 Re-examination of current enforcement procedures with emphasis on (1) including parents in the state monitoring process, (2) focusing monitoring efforts on the issues that are most critical to ensuring appropriate education to children with disabilities, and (3) timely follow-up to ensure that appropriate actions to demonstrate compliance with the law are taken across all monitoring areas.
2008-09 through 2011
• Department personnel • Electronic data and tracking
system • SERC program evaluation staff

SPP Template – Part B (3) Connecticut State
Part B State Performance Plan: 2005-2010 Monitoring Priority: Effective General Supervision – Page 118 (OMB NO: 1820-0624 / Expiration Date: 2/29/2012) Indicator 15 – General Supervision
Improvement Activities Timelines Resources 15.24 Fully incorporate other monitoring activities into a comprehensive system of general supervision with common protocol and practices regarding oversight:
• P.J. et al .v. State of Connecticut, State Board of Education et al.;
• grant application submissions; • approved private special
education program reviews; • CEIS; • parentally placed private
school students; and • fiscal verification.
2008-09 through 2011
• Department personnel • Electronic data and tracking
system • Staff development • Revised General Supervision
manual, guidelines, and protocol.

SPP Template – Part B (3) CONNECTICUT State
Part B State Performance Plan: 2005-2010 Monitoring Priority: Effective General Supervision – Page 119 (OMB NO: 1820-0624 / Expiration Date: 2/29/2012) Indicator 16 - Complaints
Part B State Performance Plan (SPP) for 2005-2010
Overview of the State Performance Plan Development:
See Overview page i (The following items are to be completed for each monitoring priority/indicator.)
Monitoring Priority: Effective General Supervision Part B / General Supervision
Indicator 16: Percent of signed written complaints with reports issued that were resolved within 60-day timeline or a timeline extended for exceptional circumstances with respect to a particular complaint, or because the parent (or individual or organization) and the public agency agree to extend the time to engage in mediation or other alternative means of dispute resolution, if available in the State.
(20 U.S.C. 1416(a)(3)(B))
Measurement: Percent = [(1.1(b) + 1.1(c)) divided by 1.1] times 100.
Overview of Issue/Description of System or Process: The Department assigns a Bureau of Special Education consultant to coordinate the signed written complaint system. Signed written complaints are logged in and assigned to a Department consultant. The staff member completes the review of the complaint and issues a written final decision within 60 days of receipt of the complaint. The 60 day time limit for the review and resolution of a complaint may be extended if the parties agree to engage in mediation or alternative means of dispute resolution, or if exceptional circumstances exist with respect to the particular complaint in which case all parties will be informed in writing of the specific length of the extension and the circumstances required the extension.
Baseline Data for FFY 2004 (2004-2005): (63 + 13) / 76 x 100 = 100%
Discussion of Baseline Data: Target met. This data and analysis demonstrate full compliance in this indicator as required in the FFY 2003 Annual Performance Report letter dated October 18, 2005.
FFY Measurable and Rigorous Target
2005 (2005-2006)
100%
2006 (2006-2007)
100%

SPP Template – Part B (3) CONNECTICUT State
Part B State Performance Plan: 2005-2010 Monitoring Priority: Effective General Supervision – Page 120 (OMB NO: 1820-0624 / Expiration Date: 2/29/2012) Indicator 16 - Complaints
FFY Measurable and Rigorous Target
2007 (2007-2008)
100%
2008 (2008-2009)
100%
2009 (2009-2010)
100%
2010 (2010-2011)
100%
Improvement Activities/Timelines/Resources:
Improvement Activities Timelines Resources 16.1 Develop brochure for LEAs and families on alternatives to dispute resolution.
2005-06 school year
• State Education Resource Center (SERC)
16.2 Continue development of new data system to track complaints by district, issue, findings and timelines. Data system to have “tickler” system for corrective action timelines. Implement data system and identify training needs of bureau staff.
2006-07 until completed
• Office of Information Systems database development
• Due Process Unit of Bureau of Special Education
16.3 Simplify the process for filing a complaint through explanation and sample request form in updated Parent’s Guide to Special Education in Connecticut.
2006-2007 • CSDE Parent Workgroup
16.4 Complete an assessment of the Dispute Resolution System and alignment to general supervision of compliance indicators. Action Step: Review practices and tools used for assigning and verifying corrective actions. Action Step: Revise procedures to include appropriate guidelines for applying sanctions for noncompliance. Action Step: Pursue development of a management table to track the various aspects of compliance and performance through the general supervision system. Action Step: Develop criteria to determine
2008-09 through 2011
• Department personnel • Due Process Unit of Bureau of
Special Education • CADRE assessment tools • Storage system to maintain
results of Dispute Resolution System assessment

SPP Template – Part B (3) CONNECTICUT State
Part B State Performance Plan: 2005-2010 Monitoring Priority: Effective General Supervision – Page 121 (OMB NO: 1820-0624 / Expiration Date: 2/29/2012) Indicator 16 - Complaints
Improvement Activities Timelines Resources if district is in need of assistance, needs intervention, or needs substantial intervention consistent with Section 616 of IDEA 2004. 16.5 Provide training for new consultants who work on complaints.
2005-06 school year through 2011
• Complaint Resolution Manual • Guidelines for granting
extensions
16.6 Monitor timelines for completion of complaints or documentation of extensions for each consultant.
2005-06 school year through 2011
• Data System
16.7 Maintain increased staffing in Due Process Unit.
2005-06 school year through 2011
• 0.7 FTE staff added 2004-05 school year
16.8 Review data on annual basis to determine if there are trends in not meeting timelines with specific districts, consultants, across indicators, and specificities related to General Supervision expectations.
2005-06 school year through 2011
• Data System • Due Process Unit of Bureau of
Special Education • Bureau of Special Education
personnel
16.9 Provide complaint data reports to consultants for districts undergoing focused monitoring visits.
2005-06 school year through 2011
• Office of Information Systems database development
16.10 Staff will participate in relevant professional development activities concerning complaint resolution. Action Step: Staff will continue to participate in professional development in effective complaint resolution with additional emphasis on timelines. Action Step: Train monitoring staff on what needs to be evident for one year closeouts.
2008-09 through 2011
• Department personnel • Due Process Unit of Bureau of
Special Education • CADRE assessment tools

SPP Template – Part B (3) CONNECTICUT State
Part B State Performance Plan: 2005-2010 Monitoring Priority: Effective General Supervision – Page 122 (OMB NO: 1820-0624 / Expiration Date: 2/29/2012) Indicator 17 - Due Process Hearing Requests
Part B State Performance Plan (SPP) for 2005-2010
Overview of the State Performance Plan Development:
See Overview page i (The following items are to be completed for each monitoring priority/indicator.)
Monitoring Priority: Effective General Supervision Part B / General Supervision
Indicator 17: Percent of adjudicated due process hearing requests that were adjudicated within the 45-day timeline or a timeline that is properly extended by the hearing officer at the request of either party or in the case of an expedited hearing, within the required timelines.
(20 U.S.C. 1416(a)(3)(B))
Measurement: Percent = [(3.2(a) + 3.2(b)) divided by 3.2] times 100.
Overview of Issue/Description of System or Process: The due process hearing system is overseen by the Department’s Bureau of Special Education, which appoints contracted hearing officers. All 12 hearing officers are attorneys in good standing with their respective state bar associations and have experience in education.
Within 45 calendar days after receipt of a request for a hearing a final decision is rendered. Hearing officers may grant a specific extension of time beyond the 45 calendar day time line for certain reasons at the request of either party.
Prior to a due process hearing, mediation and advisory opinion are available through the state. Department consultants are assigned for mediations and hearing officers are assigned for advisory opinions.
Baseline Data for FFY 2004 (2004-2005): 3 + 24 (27) / 29 x 100 = 93%
Discussion of Baseline Data:
For the 2004-05 school year, 291 hearing requests were received by the Department. Of this total number of requests, 29 resulted in fully adjudicated hearing decisions. Twenty-seven of these were completed within required timelines. This represents a timely completion rate of 93 percent. This is an increase over the rate reported in 2005 APR (89.5 percent). The 7 percent of due process hearings not completed in a timely manner represent two hearing decisions. The Department continues to work diligently with hearing officers regarding adherence to timelines.

SPP Template – Part B (3) CONNECTICUT State
Part B State Performance Plan: 2005-2010 Monitoring Priority: Effective General Supervision – Page 123 (OMB NO: 1820-0624 / Expiration Date: 2/29/2012) Indicator 17 - Due Process Hearing Requests
FFY Measurable and Rigorous Target
2005 (2005-2006)
100%
2006 (2006-2007)
100%
2007 (2007-2008)
100%
2008 (2008-2009)
100%
2009 (2009-2010)
100%
2010 (2010-2011)
100%
Improvement Activities/Timelines/Resources:
Improvement Activities Timelines Resources 17.1 Development of data collection system that tracks timelines and provides “tickler” system to distribute reminders to hearing officers.
2006-07 school year
• Office of Information Systems database development
17.2 Development of data collection system that integrates management of mediations, complaints and due process hearings.
2006-07 school year
• Office of Information Systems database development
17.3 Training to hearing officers in new timelines required by IDEA 2004 and system for tracking timelines.
2006-07 school year
• Due Process Unit
17.4 Provide training and technical assistance to mediators, LEAs and families on alternatives to dispute resolution including IEP facilitation.
2006-07 school year through 2008
• State Education Resource Center (SERC)
• Consortium for Appropriate Dispute Resolution in Special Education (CADRE)
• Parent Training and Information Center (PTI)- The Connecticut Parent Advocacy Center (CPAC)

SPP Template – Part B (3) CONNECTICUT State
Part B State Performance Plan: 2005-2010 Monitoring Priority: Effective General Supervision – Page 124 (OMB NO: 1820-0624 / Expiration Date: 2/29/2012) Indicator 17 - Due Process Hearing Requests
Improvement Activities Timelines Resources 17.5 Develop a brochure on use of LEA and state alternatives to dispute resolution.
2006-07 school year
• SERC personnel • CADRE
17.6 Implement a supplemental tracking activity to ensure timely rendering of decisions.
2007-08 school year
• Hearing officer training • Department personnel
17.7 Complete an assessment of the Dispute Resolution System specific to hearing processes and procedures. Action Step: Review practices and revise procedures for documenting and justifying extensions of hearing timelines. Action Step: Collect data regarding satisfaction with due process hearings and individual practitioners, as well as the needs of district-level administrators. Action Step: Interpret evaluation data obtained by SERC on hearing officer ratings of state sponsored workshops and conferences. Action Step: Identify procedures for decreasing resources used for data entry and handling information requests.
2008-09 through 2011
• Due Process Unit of Bureau of Special Education
• CADRE assessment tools • Storage system to maintain
results of Dispute Resolution System assessment
17.8 Sustain and improve existing professional development practices. Action Step: Review number and nature of professional development activities occurring. Action Step: Professional development for due process hearing officers, eight days per year. Action Step: Individualized professional development for due process hearing officers.
2008-09 through 2011
• Due Process Unit of Bureau of Special Education
• CADRE assessment tools • SERC • $400 per year per hearing
officer
17.9 Individualized professional development for due process hearing officers.
2006-07 school year through 2011
• $400 per hearing officer per year
17.10 Provide a summary of due process hearing data and timely completions data to hearing officers on an annual basis.
2006-07 school year through 2011
• Due Process Unit
17.11 Annual review of data on due process hearing timelines to determine if trends exist with specific hearing officers.
2006-07 school year through 2011
• Due Process Unit

SPP Template – Part B (3) CONNECTICUT State
Part B State Performance Plan: 2005-2010 Monitoring Priority: Effective General Supervision – Page 125 (OMB NO: 1820-0624 / Expiration Date: 2/29/2012) Indicator 17 - Due Process Hearing Requests
Improvement Activities Timelines Resources 17.12 Include timely hearing completions as a performance measure for annual hearing officer appraisal.
2006-07 school year through 2011
• Due Process Unit
17.13 Provide frequent and regular reminders to hearing officer of required timelines
2006-07 school year through 2011
• Due Process Database

SPP Template – Part B (3) CONNECTICUT State
Part B State Performance Plan: 2005-2010 Monitoring Priority: Effective General Supervision – Page 126 (OMB NO: 1820-0624 / Expiration Date: 2/29/2012) Indicator 18 – Resolution Session Agreements
Part B State Performance Plan (SPP) for 2005-2010
Overview of the State Performance Plan Development:
See Overview page i (The following items are to be completed for each monitoring priority/indicator.)
Monitoring Priority: Effective General Supervision Part B / General Supervision
Indicator 18: Percent of hearing requests that went to resolution sessions that were resolved through resolution session settlement agreements.
(20 U.S.C. 1416(a)(3(B))
Measurement: Percent = (3.1(a) divided by 3.1) times 100.
Overview of Issue/Description of System or Process: The Department required data submission by each LEA for the 2005-06 school year. Data was collected beginning July 1, 2006 – August 15, 2006. The data collection included:
• the number of hearing requests submitted to the Department by parent(s) in the district; • the number of hearing requests by parent(s) that went through a resolution session and
were resolved as a result; • the number of hearing requests by parent(s) that went through a resolution session and
were not resolved; and • the number of hearing requests by parent(s) in which the resolution session was waived.
For the 2006-07 school year, data will be collected from every district each time a hearing is requested. The data will include: whether a resolution session was convened; waived; and the outcome of the session, if convened.
Baseline Data for FFY 2004 (2004-2005): For the baseline year of 2005-06, the percent of resolution sessions successfully resolving disputes was 67.2 percent. (41/61 x 100 = 67.2%)
Discussion of Baseline Data: This was the first year districts were required to offer resolution sessions. A total of 41 resolution sessions were successful in resolving disputes. Data are valid and reliable. Although other methods of alternate dispute resolution have been available in the past, it appears that the addition of the resolution sessions has afforded parents an additional successful option in resolving disputes.
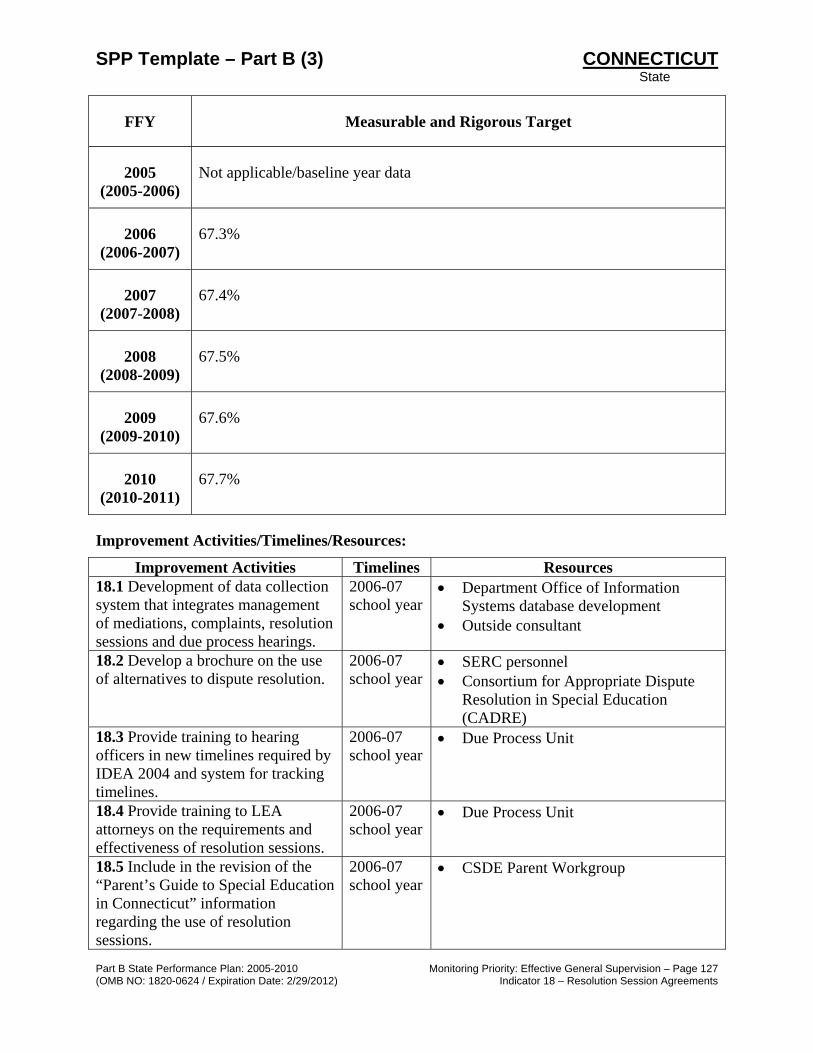
SPP Template – Part B (3) CONNECTICUT State
Part B State Performance Plan: 2005-2010 Monitoring Priority: Effective General Supervision – Page 127 (OMB NO: 1820-0624 / Expiration Date: 2/29/2012) Indicator 18 – Resolution Session Agreements
FFY Measurable and Rigorous Target
2005 (2005-2006)
Not applicable/baseline year data
2006 (2006-2007)
67.3%
2007 (2007-2008)
67.4%
2008 (2008-2009)
67.5%
2009 (2009-2010)
67.6%
2010 (2010-2011)
67.7%
Improvement Activities/Timelines/Resources:
Improvement Activities Timelines Resources 18.1 Development of data collection system that integrates management of mediations, complaints, resolution sessions and due process hearings.
2006-07 school year
• Department Office of Information Systems database development
• Outside consultant
18.2 Develop a brochure on the use of alternatives to dispute resolution.
2006-07 school year
• SERC personnel • Consortium for Appropriate Dispute
Resolution in Special Education (CADRE)
18.3 Provide training to hearing officers in new timelines required by IDEA 2004 and system for tracking timelines.
2006-07 school year
• Due Process Unit
18.4 Provide training to LEA attorneys on the requirements and effectiveness of resolution sessions.
2006-07 school year
• Due Process Unit
18.5 Include in the revision of the “Parent’s Guide to Special Education in Connecticut” information regarding the use of resolution sessions.
2006-07 school year
• CSDE Parent Workgroup

SPP Template – Part B (3) CONNECTICUT State
Part B State Performance Plan: 2005-2010 Monitoring Priority: Effective General Supervision – Page 128 (OMB NO: 1820-0624 / Expiration Date: 2/29/2012) Indicator 18 – Resolution Session Agreements
Improvement Activities Timelines Resources 18.6 Complete an assessment of the Dispute Resolution System and alignment to general supervision of compliance indicators
2007-08 school year
• Due Process Unit • CADRE assessment tools • Storage system to maintain results of
Dispute Resolution System assessment 18.7 Notification to school districts of each hearing request will contain a form to be filled out and returned to the Department indicating whether a resolution session was convened or waived and the outcome of the session if convened.
2006-07 school year through 2011
• Due Process Unit
18.8 Provide training and technical assistance to mediators, LEAs and families on alternatives to dispute resolution including IEP facilitation and resolution sessions.
2006-07 school year through 2008
• SERC personnel • CADRE • Parent Training and Information Center
(PTI)- Connecticut Parent Advocacy Center (CPAC)
18.9 Provide training to hearing officers on the requirements for use of resolution sessions.
2006-07 school year through 2011
• Due Process Unit
18.10 Provide data on the success of resolution sessions to hearing officers and LEAs on an annual basis.
2006-07 school year through 2011
• Due Process Unit

SPP Template – Part B (3) CONNECTICUT State
Part B State Performance Plan: 2005-2010 Monitoring Priority: Effective General Supervision – Page 129 (OMB NO: 1820-0624 / Expiration Date: 2/29/2012) Indicator 19 – Mediation Agreements
Part B State Performance Plan (SPP) for 2005-2010
Overview of the State Performance Plan Development:
See Overview page i (The following items are to be completed for each monitoring priority/indicator.)
Monitoring Priority: Effective General Supervision Part B / General Supervision
Indicator 19: Percent of mediations held that resulted in mediation agreements.
(20 U.S.C. 1416(a)(3)(B))
Measurement: Percent = [(2.1(a)(i) + 2.1(b)(i)) divided by 2.1] times 100.
Overview of Issue/Description of System or Process: Connecticut General Statues Section 10-76h(f)(1)(a) provides that “the mediator shall attempt to resolve the issues in a manner which is acceptable to the parties within 30 days from the request of the mediation.”
Baseline Data for FFY 2004 (2004-2005): Sixty-six percent of mediations resulted in agreements.
35 + 64 = 99 / 150 = 66%
Discussion of Baseline Data: The Department’s 2004-05 school year data shows a slight increase in the percent of mediations (66 percent) that resulted in agreements in comparison to the 2003-04 year (64 percent). The Department does not believe that tracking the number of agreements is an effective means of assessing the effectiveness of the mediation process. Fifty-one mediations did not result in agreements. Of these 51 non-agreements, only eight went on to hearing with four pending. Of the 150 mediations held, 142 did not result in an adjudicated hearing decision. In 95 percent of the cases (with four pending) a hearing was not pursued after mediation. The goal of mediation is to maximize the opportunity for the parties to reach a settlement. The effectiveness of mediation should not be rated on a percentage of written agreements.
FFY Measurable and Rigorous Target
2005 (2005-2006)
67%

SPP Template – Part B (3) CONNECTICUT State
Part B State Performance Plan: 2005-2010 Monitoring Priority: Effective General Supervision – Page 130 (OMB NO: 1820-0624 / Expiration Date: 2/29/2012) Indicator 19 – Mediation Agreements
FFY Measurable and Rigorous Target
2006 (2006-2007)
68%
2007 (2007-2008)
69%
2008 (2008-2009)
70%
2009 (2009-2010)
71%
2010 (2010-2011)
72%
Improvement Activities/Timelines/Resources:
Improvement Activities Timelines Resources 19.1 Develop a brochure for LEAs and families on alternatives to dispute resolution.
2005-06 school year
• SERC personnel
19.2 Conduct mediator meetings and provide on-going functional supervision.
2005-06 school year through 2007
• Due Process Unit
19.3 Promote the use of mediation for families through updated Parent’s Guide to Special Education in Connecticut.
2005-06 school year through 2007
• CSDE Parent Workgroup • Parent Training and Information
Center (PTI) - Connecticut Parent Advocacy Center (CPAC)
• State Education Resource Center (SERC) personnel
19.4 Provide training and technical assistance to mediators, LEAs and families on alternatives to dispute resolution.
2005-06 school year through 2007
• SERC personnel • Consortium for Appropriate Dispute
Resolution (CADRE) • CPAC
19.5 Develop and implement evaluation checklist and procedures for mediator selection.
2007-08 school year
• Department personnel

SPP Template – Part B (3) CONNECTICUT State
Part B State Performance Plan: 2005-2010 Monitoring Priority: Effective General Supervision – Page 131 (OMB NO: 1820-0624 / Expiration Date: 2/29/2012) Indicator 19 – Mediation Agreements
Improvement Activities Timelines Resources 19.6 Monitor data on mediation agreements and track future use of due process system for non-agreements on an annual basis. Measure progress using both indicators.
2005-06 school year through 2011
• Office of Information Systems database development
19.7 Provide training and a mentorship program for new mediators.
2008-09 school year through 2011
• Due Process Unit • Department personnel • SERC
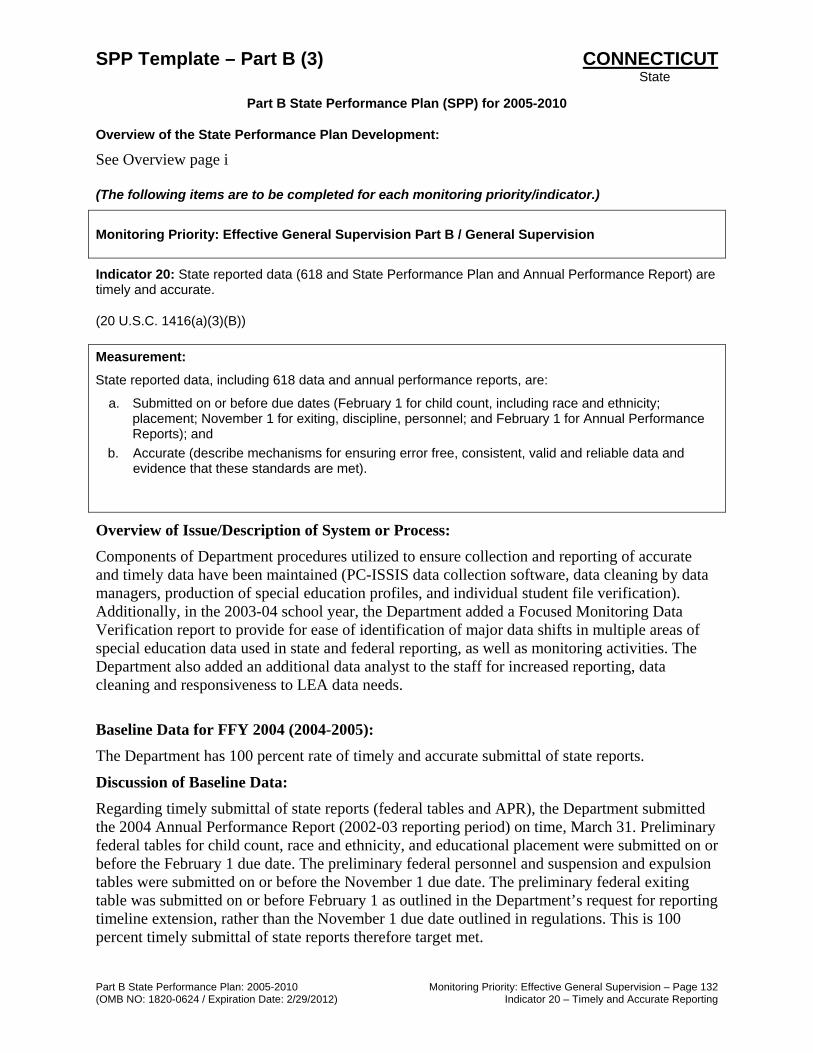
SPP Template – Part B (3) CONNECTICUT State
Part B State Performance Plan: 2005-2010 Monitoring Priority: Effective General Supervision – Page 132 (OMB NO: 1820-0624 / Expiration Date: 2/29/2012) Indicator 20 – Timely and Accurate Reporting
Part B State Performance Plan (SPP) for 2005-2010
Overview of the State Performance Plan Development:
See Overview page i (The following items are to be completed for each monitoring priority/indicator.)
Monitoring Priority: Effective General Supervision Part B / General Supervision
Indicator 20: State reported data (618 and State Performance Plan and Annual Performance Report) are timely and accurate.
(20 U.S.C. 1416(a)(3)(B))
Measurement:
State reported data, including 618 data and annual performance reports, are:
a. Submitted on or before due dates (February 1 for child count, including race and ethnicity; placement; November 1 for exiting, discipline, personnel; and February 1 for Annual Performance Reports); and
b. Accurate (describe mechanisms for ensuring error free, consistent, valid and reliable data and evidence that these standards are met).
Overview of Issue/Description of System or Process: Components of Department procedures utilized to ensure collection and reporting of accurate and timely data have been maintained (PC-ISSIS data collection software, data cleaning by data managers, production of special education profiles, and individual student file verification). Additionally, in the 2003-04 school year, the Department added a Focused Monitoring Data Verification report to provide for ease of identification of major data shifts in multiple areas of special education data used in state and federal reporting, as well as monitoring activities. The Department also added an additional data analyst to the staff for increased reporting, data cleaning and responsiveness to LEA data needs.
Baseline Data for FFY 2004 (2004-2005): The Department has 100 percent rate of timely and accurate submittal of state reports.
Discussion of Baseline Data: Regarding timely submittal of state reports (federal tables and APR), the Department submitted the 2004 Annual Performance Report (2002-03 reporting period) on time, March 31. Preliminary federal tables for child count, race and ethnicity, and educational placement were submitted on or before the February 1 due date. The preliminary federal personnel and suspension and expulsion tables were submitted on or before the November 1 due date. The preliminary federal exiting table was submitted on or before February 1 as outlined in the Department’s request for reporting timeline extension, rather than the November 1 due date outlined in regulations. This is 100 percent timely submittal of state reports therefore target met.
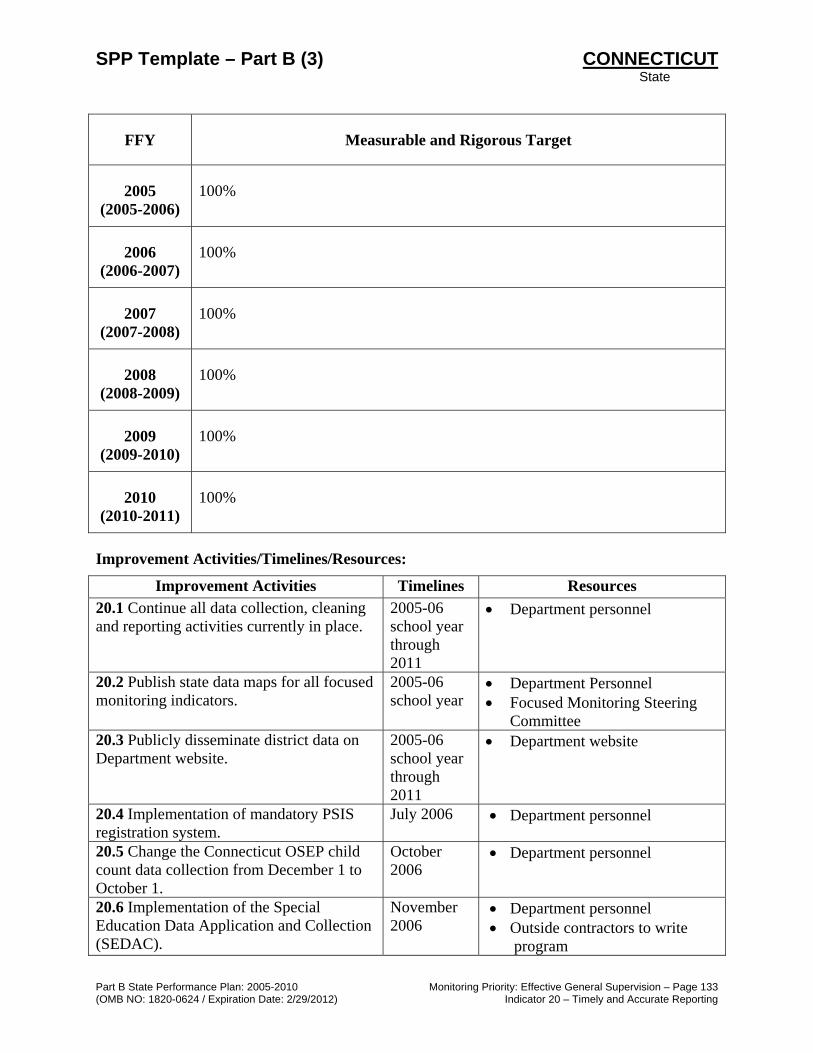
SPP Template – Part B (3) CONNECTICUT State
Part B State Performance Plan: 2005-2010 Monitoring Priority: Effective General Supervision – Page 133 (OMB NO: 1820-0624 / Expiration Date: 2/29/2012) Indicator 20 – Timely and Accurate Reporting
FFY Measurable and Rigorous Target
2005 (2005-2006)
100%
2006 (2006-2007)
100%
2007 (2007-2008)
100%
2008 (2008-2009)
100%
2009 (2009-2010)
100%
2010 (2010-2011)
100%
Improvement Activities/Timelines/Resources:
Improvement Activities Timelines Resources 20.1 Continue all data collection, cleaning and reporting activities currently in place.
2005-06 school year through 2011
• Department personnel
20.2 Publish state data maps for all focused monitoring indicators.
2005-06 school year
• Department Personnel • Focused Monitoring Steering
Committee 20.3 Publicly disseminate district data on Department website.
2005-06 school year through 2011
• Department website
20.4 Implementation of mandatory PSIS registration system.
July 2006 • Department personnel
20.5 Change the Connecticut OSEP child count data collection from December 1 to October 1.
October 2006
• Department personnel
20.6 Implementation of the Special Education Data Application and Collection (SEDAC).
November 2006
• Department personnel • Outside contractors to write
program

SPP Template – Part B (3) CONNECTICUT State
Part B State Performance Plan: 2005-2010 Monitoring Priority: Effective General Supervision – Page 134 (OMB NO: 1820-0624 / Expiration Date: 2/29/2012) Indicator 20 – Timely and Accurate Reporting
Improvement Activities Timelines Resources 20.7 Convene meetings across multiple bureaus to address timely data collection and reporting.
2006-07 school year through 2011
• Department personnel
20.8 Convene meetings across multiple bureaus to address collection procedures and timelines for discipline data.
2006-07 school year
• Department personnel

*Please turn the document over for the Spanish version of the survey.*
District Name Please continue Page 135
2005 – 2006 CT Special Education Parent Survey Please share your thoughts and experiences regarding your child’s special education program. Information from this survey will be used to monitor progress in improving special education services in Connecticut.
Please mark the circles below to describe your child. If you have more than one child who receives special
education services or who has an IEP, please complete the survey according to your experiences with the child identified on the front of your survey envelope. Please return the completed survey in the stamped envelope provided to:
SERC, 25 Industrial Park Road, Middletown, CT 06457-1520. This information will help determine, as mandated by the U.S. Department of Education, whether the Parent
Survey response properly represents the state as a whole. It will not be used to identify you, your child or your family in any way. All of your responses will be confidential. Only an independent evaluator will have direct access to this information.
Age Gender Race/Ethnicity [Choose One Only]
Grade Level
3 – 5
Male American Indian or
Alaskan Native
Pre-school
6 – 12
Female
Asian or Pacific Islander Elementary
(includes Kindergarten)
13 – 14
Black not Hispanic
Middle
15 – 17
Hispanic
High
18 – 21
White not Hispanic
Transition/18-21 yrs.
Primary Eligibility for Services
[Choose One Only; Eligibility is listed on Page 1 of your child’s IEP.]
Autism
Orthopedic Impairment
Deaf-Blindness Other Health Impairment (OHI) ADD/ADHD? Yes No
Developmental Delay (ages 3-5 only) Speech or Language Impaired
Emotional Disturbance Traumatic Brain Injury
Hearing Impairment Visual Impairment
Intellectual Disability/Mental Retardation
To Be Determined
Specific Learning Disabilities Other ______________________
Multiple Disabilities Don’t Know
Type of Placement [Choose One Only] Public School Out-of-State
Out-of-District Special Education School Hospital/Homebound
Residential School Other _________________
Private/Parochial

Please continue Page 136
Please report your experience with your child’s special education program over the past 12 months.
CT Special Education Parent Survey
STR
ON
GLY
A
gree
MO
DE
RA
TELY
A
gree
SLIG
HTL
Y A
gree
SLIG
HTL
Y D
isag
ree
MO
DE
RA
TELY
D
isag
ree
STR
ON
GLY
D
isag
ree
DO
N’T
K
NO
W
NO
T
APP
LIC
AB
LE
Satisfaction with My Child’s Program 1. I am satisfied with my child’s overall special
education program.
2. I have the opportunity to talk to my child’s teachers on a regular basis to discuss my questions and concerns.
3. My child’s school day has been shortened to accommodate his/her transportation needs.
4. My child has been sent home from school due to behavioral difficulties (not considered suspension).
5. My child is accepted within the school community.
6. My child’s IEP is meeting his or her educational needs.
7. All special education services identified in my child’s IEP have been provided.
8. Staff is appropriately trained and able to provide my child’s specific program and services.
9. Special education teachers make accommodations and modifications as indicated on my child’s IEP.
10. General education teachers make accommodations and modifications as indicated on my child’s IEP.
11. General education and special education teachers work together to assure that my child’s IEP is being implemented.
Participation in Developing and Implementing My Child’s Program 12. In my child’s school, administrators and teachers
encourage parent involvement in order to improve services and results for children with disabilities.
13. At meetings to develop my child’s Individualized Education Plan (IEP), I feel encouraged to give input and express my concerns.
14. I understand what is discussed at meetings to develop my child’s IEP.
15. My concerns and recommendations are documented in the development of my child’s IEP.
16. My child’s evaluation report is written in terms I understand.
17. PPT meetings for my child have been scheduled at times and places that met my needs.

Please continue Page 137
CT Special Education Parent Survey
STR
ON
GLY
A
gree
MO
DE
RA
TELY
A
gree
SLIG
HTL
Y A
gree
SLIG
HTL
Y D
isag
ree
MO
DE
RA
TELY
D
isag
ree
STR
ON
GLY
D
isag
ree
DO
N’T
K
NO
W
NO
T
APP
LIC
AB
LE
18. At my child’s PPT, the school district proposed programs and services to meet my child’s individual needs.
19. When we implement my child’s IEP, I am encouraged to be an equal partner with my child’s teachers and other service providers.
20. I have received a copy of my child’s IEP within 5 school days after the PPT.
21. If necessary, a translator was provided at the PPT meetings.
22. The translation services provided at the PPT meetings were useful and accurate.
23. The school district proposed the regular classroom for my child as the first placement option.
My Child’s Participation 24. My child has the opportunity to participate in school-
sponsored activities such as field trips, assemblies and social events (dances, sports events).
25. My child has the opportunity to participate in extracurricular school activities such as sports or clubs with children without disabilities.
26. My child has been denied access to non-school sponsored community activities due to his/her disability.
27. My child’s school provides supports, such as extra staff, that are necessary for my child to participate in extracurricular school activities (for example, clubs and sports).
Transition Planning for Preschoolers Answer only if your child has transitioned from early intervention (Birth to Three System) to Preschool in the past 3 years. 28. I am satisfied with the school district’s transition
activities that took place when my child left Birth to Three.
Transition Planning for Secondary Students 29. I am satisfied with the way secondary transition
services were implemented for my child.
30. When appropriate, outside agencies have been invited to participate in secondary transition planning.
Answer only if your child was age 13 at his/her last PPT meeting. 31. My child is age 13 and the PPT introduced planning
for his/her transition to adulthood.

Thank you for your valuable response! Page 138
CT Special Education Parent Survey
STR
ON
GLY
A
gree
MO
DE
RA
TELY
A
gree
SLIG
HTL
Y A
gree
SLIG
HTL
Y D
isag
ree
MO
DE
RA
TELY
D
isag
ree
STR
ON
GLY
D
isag
ree
DO
N’T
K
NO
W
NO
T
APP
LIC
AB
LE
Answer only if your child is age 13 or older. 32. The school district actively encourages my child to
attend and participate in PPT meetings.
Answer only if your child was age 13 or 14 at his/her last PPT meeting. 33. My child is age 13 or 14 and the PPT discussed an
appropriate course of study at the high school.
Answer only if your child is age 15 or older. 34. My child is age 15 or older and the PPT developed
individualized goals related to employment/postsecondary education, independent living and community participation, if appropriate.
Parent Training and Support 35. In the past year, I have attended parent training or
information sessions (provided by my district, other districts or agencies) that addressed the needs of parents and of children with disabilities.
36. I am involved in a support network for parents of students with disabilities available through my school district or other sources.
37. There are opportunities for parent training or information sessions regarding special education provided by my child’s school district.
38. A support network for parents of students with disabilities is available to me through my school district or other sources.
My Child’s Skills 39. My child is learning skills that will enable him/her to
be as independent as possible.
40. My child is learning skills that will lead to a high school diploma, further education, or a job.
COMMENTS: Please use this space to comment on your experience with your child’s special education program. These comments may refer to your experiences overall and are not limited to the past 12 months.
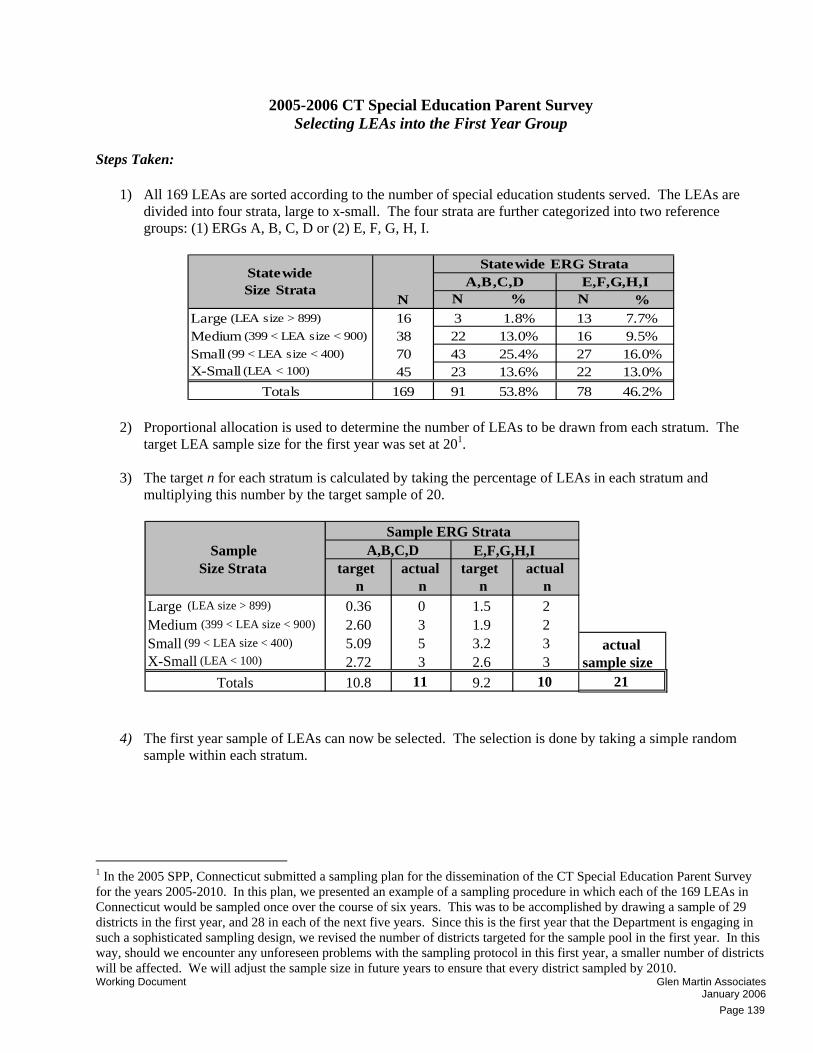
Working Document Glen Martin Associates January 2006 Page 139
2005-2006 CT Special Education Parent Survey Selecting LEAs into the First Year Group
Steps Taken:
1) All 169 LEAs are sorted according to the number of special education students served. The LEAs are divided into four strata, large to x-small. The four strata are further categorized into two reference groups: (1) ERGs A, B, C, D or (2) E, F, G, H, I.
N % N %Large (LEA size > 899) 16 3 1.8% 13 7.7%Medium (399 < LEA size < 900) 38 22 13.0% 16 9.5%Small (99 < LEA size < 400) 70 43 25.4% 27 16.0%X-Small (LEA < 100) 45 23 13.6% 22 13.0%
Totals 169 91 53.8% 78 46.2%
StatewideSize Strata E,F,G,H,IA,B,C,D
Statewide ERG Strata
N
2) Proportional allocation is used to determine the number of LEAs to be drawn from each stratum. The target LEA sample size for the first year was set at 201.
3) The target n for each stratum is calculated by taking the percentage of LEAs in each stratum and
multiplying this number by the target sample of 20.
4) The first year sample of LEAs can now be selected. The selection is done by taking a simple random sample within each stratum.
1 In the 2005 SPP, Connecticut submitted a sampling plan for the dissemination of the CT Special Education Parent Survey for the years 2005-2010. In this plan, we presented an example of a sampling procedure in which each of the 169 LEAs in Connecticut would be sampled once over the course of six years. This was to be accomplished by drawing a sample of 29 districts in the first year, and 28 in each of the next five years. Since this is the first year that the Department is engaging in such a sophisticated sampling design, we revised the number of districts targeted for the sample pool in the first year. In this way, should we encounter any unforeseen problems with the sampling protocol in this first year, a smaller number of districts will be affected. We will adjust the sample size in future years to ensure that every district sampled by 2010.
target n
actual n
target n
actual n
Large (LEA size > 899) 0.36 0 1.5 2Medium (399 < LEA size < 900) 2.60 3 1.9 2Small (99 < LEA size < 400) 5.09 5 3.2 3X-Small (LEA < 100) 2.72 3 2.6 3
Totals 10.8 11 9.2 10 21
A,B,C,D E,F,G,H,I
actual sample size
Sample Size Strata
Sample ERG Strata

Working Document Glen Martin Associates January 2006 Page 140
A,B,C,D E,F,G,H,ISelected LEAs
Selected LEAs
Large (LEA size > 899) - Waterbury, New BritainMedium (399 < LEA size < 900) Wilton, Madison, Windsor Killingly, New London
Small (99 < LEA size < 400)Orange, Canton, Preston, East
Lyme, SheltonLebanon, North Stonington,
DerbyX-Small (LEA < 100) Easton, Andover, Westbrook Ashford, Chester, Sharon
Totals 11 10
SampleSize Strata
Sample ERG Strata
Selecting Students into the First Year Sample
Steps Taken:
1) The number of students to be taken from each district is calculated by the sample size needed to have a 95% confidence interval, +-5% ME and a 40% response rate (assuming a population proportion of 50%).
2) As a result, all students in the following districts will be included in the survey.
Elem. Middle High Total Elem. Middle High Total1 Andover 1 0 0 1 25 - - 253 Ashford 1 0 0 1 66 - - 6623 Canton 2 1 1 4 55 38 59 15226 Chester 1 0 0 1 46 - - 4637 Derby 2 0 1 3 72 - 77 14945 Easton 1 1 0 2 0 57 - 5746 East Lyme 3 1 1 5 110 89 148 34769 Killingly 3 1 1 5 193 110 105 40871 Lebanon 1 1 1 3 57 56 79 19276 Madison 4 1 1 6 229 82 152 46395 New London 6 2 1 9 210 135 119 464
102 North Stonington 1 1 1 3 49 19 32 100107 Orange 4 0 0 4 134 - - 134114 Preston 1 1 0 2 67 33 - 100125 Sharon 1 0 0 1 53 - - 53126 Shelton 6 1 2 9 206 62 131 399154 Westbrook 1 1 1 3 31 23 27 81161 Wilton 3 1 1 5 253 129 127 509164 Windsor 5 1 1 7 194 158 190 542
Totals 21 47 14 13 74 2050 991 1246 4287
Year 1 District Group
Special Education numbers represent 2004-2005 data received from the CT Dept. of Special Ed. on 11/8/05
Schools Special Ed. Students District # District
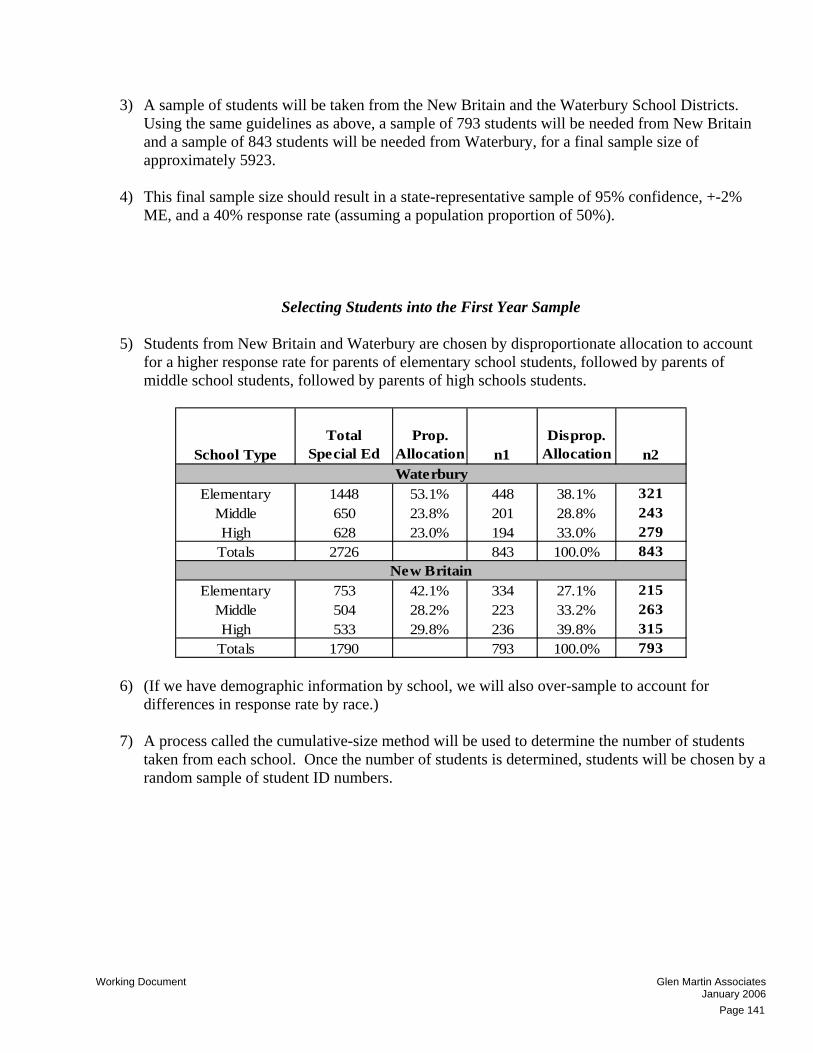
Working Document Glen Martin Associates January 2006 Page 141
3) A sample of students will be taken from the New Britain and the Waterbury School Districts. Using the same guidelines as above, a sample of 793 students will be needed from New Britain and a sample of 843 students will be needed from Waterbury, for a final sample size of approximately 5923.
4) This final sample size should result in a state-representative sample of 95% confidence, +-2%
ME, and a 40% response rate (assuming a population proportion of 50%).
Selecting Students into the First Year Sample 5) Students from New Britain and Waterbury are chosen by disproportionate allocation to account
for a higher response rate for parents of elementary school students, followed by parents of middle school students, followed by parents of high schools students.
School TypeTotal
Special EdProp.
Allocation n1Disprop.
Allocation n2
Elementary 1448 53.1% 448 38.1% 321Middle 650 23.8% 201 28.8% 243High 628 23.0% 194 33.0% 279
Totals 2726 843 100.0% 843
Elementary 753 42.1% 334 27.1% 215Middle 504 28.2% 223 33.2% 263High 533 29.8% 236 39.8% 315
Totals 1790 793 100.0% 793
Waterbury
New Britain
6) (If we have demographic information by school, we will also over-sample to account for differences in response rate by race.)
7) A process called the cumulative-size method will be used to determine the number of students
taken from each school. Once the number of students is determined, students will be chosen by a random sample of student ID numbers.

Working Document Glen Martin Associates January 2006 Page 142
First Year LEA Group Compared to State
N Percent N PercentLearning Disability 25919 35.5% 3290 36.7%Intellectual Disability 3191 4.4% 463 5.2%Emotional Disturbance 6957 9.5% 914 10.2%Speech Impairment 15727 21.5% 1878 21.0%Other Health Impairment 10443 14.3% 1359 15.2%Other Disability 8044 11.0% 715 8.0%Autism 2747 3.8% 341 3.8%Total 73028 100.0% 8960 100.0%Statewide data is from the Dept. of Special Ed. District information is from on-line district profiles and does not include Pre-K students.
2004-2005 Special Education Students
DisabilityStatewide Year 1 District Group
N Percent N PercentNative American/Alaskan 271 0.4% 37 0.4%Asian/Pacific Islander 1000 1.4% 102 1.1%Black 11650 16.0% 1768 18.3%White 47555 65.1% 5001 52.0%Hispanic 12552 17.2% 2772 28.6%Total 73028 100.0% 9680 100.0%
2004-2005 Special Education Students
Statewide data is from the Dept. of Special Ed. District information is from on-line district profiles.
Statewide Year 1 District GroupRace/Ethnicity
N % n %Elementary School 685 64.5% 79 66.4%Middle School 176 16.6% 21 17.6%High School 201 18.9% 19 16.0%
Totals 1062 100.0% 119 100.0%
N % n %Elementary 30,643 47.5% 4,251 48.3%Middle 13,873 21.5% 2,145 24.4%High 20,045 31.0% 2,406 27.3%
Totals 64,561 100.0% 8,802 100.0%
Year 1 District Group
Special Education numbers represent 2004-2005 data received from the CT Dept. of Special Ed. on 11/8/05
Special Education Students
Statewide Year 1
School TypeStatewide Year 1

Working Document Glen Martin Associates January 2006 Page 143
First Year LEA Group Compared to State
# % # %A 12 7.1% 2 9.5%B 19 11.2% 2 9.5%C 38 22.5% 4 19.0%D 21 12.4% 3 14.3%E 26 15.4% 5 23.8%F 16 9.5% 0 0.0%G 15 8.9% 0 0.0%H 13 7.7% 2 9.5%I 6 3.6% 3 14.3%- 3 1.8% 0 0.0%
Total 169 100.0% 21 100.0%
Year 1 District Group
The "-" represents the Unified School Districts #1, #2, and CT Technical High School System.
ERGAll LEAs Year 1
# % # %CREC 36 21.3% 3 14.3%CES 14 8.3% 2 9.5%ACES 27 16.0% 4 19.0%ED.C 30 17.8% 1 4.8%LEARN 24 14.2% 7 33.3%EASTCONN 35 20.7% 4 19.0%
- 3 1.8% - -Total 169 100.0% 21 100.0%
Year 1 District Group
RESCAll LEAs Year 1
The "-" represents the Unified School Districts #1, #2, and CT Technical High School System.

Page 144
Code # _______________ Responses will not be linked to name
Survey of 2005 Graduates/Exiters of Connecticut High Schools
Introduction: This survey gathers information about your employment and/or postsecondary school experiences since you left high school. Please fill it out and return to us in the enclosed envelope. If you have any difficulty answering the survey questions, please ask someone who knows you well to help you complete it. All information you provide will be kept confidential. Please place a “ ” mark in front of the appropriate response. Part I: Employment Status
1. Have you been employed since leaving high school? (check only one) Yes, Full-time (35 hours or more, per week) Yes, Part-time (less than 35 hours per week) Yes, I was employed at one time but am not now No, I have not been employed (go to question #4)
2. If yes to Question 1, how much do you currently earn (or did you earn at your most recent
job)? Below minimum wage (less than $7.65/hr.) Minimum wage ($7.65/hr.) Above minimum wage (greater than $7.65/hr.) Part II: Postsecondary Education and Training Status
3. Have you enrolled in any type of postsecondary school (college or training program) since leaving high school? (check only one)
Yes, I am a full-time student (12 or more credits per semester) Yes, I am a part-time student (less than 12 credits per semester) Yes, I was enrolled but am not now No, I have never enrolled in postsecondary education or a training program
4. If yes to Question 3, what type of postsecondary school did you enroll in? (Check only one) Community or two-year college Four-year college or university Technical/trade School (e.g., hairdressing, welding, computing, bartending) Military or Military Training School or Program Adult Education (e.g., GED, High School Completion Program, Continuing Education) College Prep/Postgraduate Program Other – Please specify:
Please continue to last page . . .

Page 145
Part III: Additional Information 5. Have you received services through any of these agencies since leaving high school?
(Check all that apply) Bureau of Rehabilitation Services (BRS) Department of Mental Retardation (DMR) Department of Mental Health and Addiction Services (DMHAS) Board of Education and Services for the Blind (BESB) Department of Social Services (DSS) (e.g., Medicaid/Title 19; Food stamps; Care for Kids) Social Security Administration (SSA) (e.g., SSI, SSDI, Medicare) Department of Labor One-Stop Centers e.g., Employment Centers, Career Centers) Other agencies: please specify
No help received, it is not necessary No help received; Did not know that any agencies were available
6. If you are not employed, or are not enrolled in postsecondary school, are you participating in any of the following?
Adult day service programs Adult day vocational programs Independent living skills programs Volunteer work/community service Other, please specify:
7. Please circle the statement that best describes your agreement with this statement:
“I am satisfied with my life since leaving high school” Strongly Disagree
Disagree Unsure Agree Strongly Agree
8. Is there anything else you would like to tell us about your life after you have left high school? (Please continue to the back of this page if necessary) ____________________________________________________________________________ ____________________________________________________________________________ ____________________________________________________________________________ ____________________________________________________________________________ ____________________________________________________________________________
Thank you very much for completing this survey!
Please return in the enclosed envelope