Embed Size (px)
Citation preview

State ownership in Slovenia and the strategy for management of SOEs
European Semester Conference, 5 June 2015, Ljubljana
Svetoslava GeorgievaDG Economic and Financial Affairs
European Commission

AGENDA
The role of SOEs in the SI economy – why is the strategy important?
Facts & Figures from the strategy
Implications and potential traps
Next steps
2

State involvement in SI is high compared to other member states and in sectors that are typically private owned
SOEs are present across sectors
Book value of equity in SOEs/SCEs (%of GDP) Share of SOEs/SCEs in sectoral value added(% of total sectoral value added), 2013
State ownership among the highest
Source: OECD, 2015 Country report for Slovenia, European Commission
Source: 2015 Country report for Slovenia, European Commission
3
0%
5%
10%
15%
20%
25%
30%
35%
40%
45%
50%
ES
BE
DE
PT
DK EL
FR AT
HU NL
SE PL IT IE LT LV FI
CZ
EE SI
Minority holdings Majority holdings
0%
10%
20%
30%
40%
50%
60%
70%
80%
90%
100%
Co
nsu
me
r st
aple
s
Ch
emic
al a
nd p
har
ma
Met
al p
roce
ssin
g in
dust
ry
Oth
er
man
ufa
ctu
ring
& r
epai
r Ene
rgy
Pub
lic u
tiliti
es
Co
nstr
uctio
n
Tra
nsp
ort
& s
tora
ge
Tou
rism
Pos
tal s
ervi
ces
& I
CT
SI RO HR
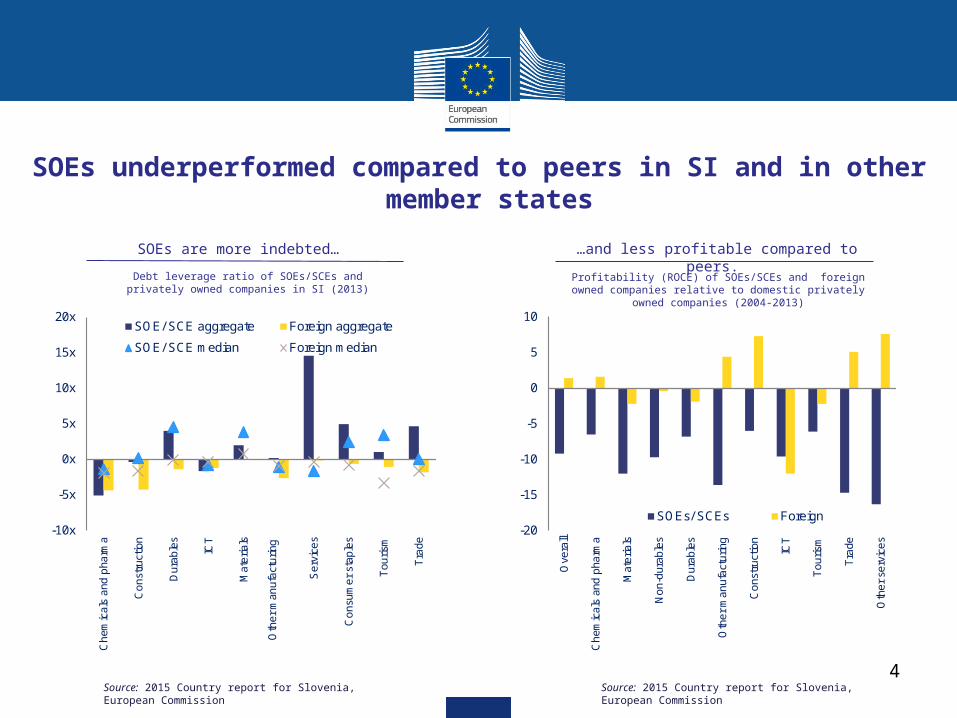
SOEs underperformed compared to peers in SI and in other member states
…and less profitable compared to peers. SOEs are more indebted…
Debt leverage ratio of SOEs/SCEs and privately owned companies in SI (2013)
Source: 2015 Country report for Slovenia, European Commission
Profitability (ROCE) of SOEs/SCEs and foreign owned companies relative to domestic privately owned
companies (2004-2013)
Source: 2015 Country report for Slovenia, European Commission
4
-10x
-5x
0x
5x
10x
15x
20x
Ch
emic
als
and
pha
rma
Co
nstr
uctio
n
Du
rab
les
ICT
Mat
eria
ls
Oth
er
man
ufa
ctu
ring
Ser
vice
s
Co
nsu
me
r st
aple
s
Tou
rism
Tra
de
SOE/ SCE aggregate Foreign aggregate
SOE/ SCE median Foreign median
-20
-15
-10
-5
0
5
10
Ove
rall
Ch
emic
als
and
pha
rma
Mat
eria
ls
No
n-d
urab
les
Du
rab
les
Oth
er
man
ufa
ctu
ring
Co
nstr
uctio
n
ICT
Tou
rism
Tra
de
Oth
er
serv
ice
s
SOEs/ SCEs Foreign

Risks linked to the complex network of state ownership could be reduced by divesting non-core assets
Gorenjska Banka (26%)Prvi Faktor (100%)
(finance)Factor Banka (10%) Abanka (52%)
Probanka (4%) SID Banka (100%)
KAD (100%)(state fund)
SOD (100%)(state fund)
Triglav (67%)(insurance)
PivovarnaUnion(39%)(SOE, retail)
NKBM (51%)(bank)
NLB (57%)(bank)
Mercator (31%)(SOE, retail)
Republic of Slovenia
Lasko (40%)(SOE, brewery)
Source: 2013 Country Focus, Slovenia: State-owned and State-controlled Enterprises in Slovenia, European Commission
5

Indirect state ownership and cross-links between SOEs are not considered in the strategy
15% of state-owned and state-controlled companies reviewed (75% in terms of book value)
5%
1%
(Indirect)32%
3rd Leg of Ownership
(Indirect)
4rd Leg of Ownership(Indirect)
2nd Leg of Ownership
Direct ownership
62%1st Leg of Ownership
(Quasi Direct)
Republic of Slovenia
SOEs/SCEs
Stated-owned banks, other financial and
insurance companies
State management funds (SSH, DSU, KAD, PDP, Modra)
Municipalities
Mutual and Pension Funds
BAMC
SOEs/SCEs
SOEs/SCEs
SOEs/SCEs
SOEs/SCEs
Other entities (ZPIZ, humanitarian foundations)
REVIEWED15% of
companies
NOT REVIEWED
85% of companies
Source: European Commission, SI Chamber of Commerce 6

The majority of the assets reviewed are classified as strategic or important, some sectors remain out of scope
Book value of equity (in EUR 000) by sector Book value of equity (in EUR 000) by sector
Major sectors classified as strategic or important Some sectors were not fully reviewed
Source: European Commission Source: European Commission7
00
1,000
2,000
3,000
4,000
5,000
6,000 Not reviewed
Portfolio
Important
Strategic
00
100
200
300
400
500
600
700
800
900
1,000 Not reviewed
Portfolio
Important
Strategic

New commitments account for 1.5% of the total state assets reviewed
Classification of state assets
Book value of equity (% of total included in strategy)
Strategic assets68.3%
Important assets18.2%
Portfolio -list of 15 &
banks 12.1%
Portfolio -new 1.5%
8
New portfolio assets by sector
Book value of equity (in EUR 000)
0
20
40
60
80
100
120
140
160
180 Telecommunications
Media
Financial services(holdings)Transport
Banking
In bankruptcy
Services and others
Manufacturing
Energy
Tourism & leisure

0%
10%
20%
30%
40%
50%
60%
70%
80%
90%
100%
Baseline Scenario 1 Scenario 2
Portfolio assets
Important assets
Strategic assets
The classification of assets is largely influenced by the choice of criteria and thresholds
•Highest weight of criteria 11 and 14
•Classification sensitive to selection of criteria and thresholds
•The ranking of companies does not change in the different scenarios
Source: European Commission
Book value of equity (% of total)
Scenario analysis of classification methodology Preliminary conclusions
Scenario 1: Excluding criteria 11 & 14 Scenario 2: Excluding reference to strategic documents which are still work in progress
9
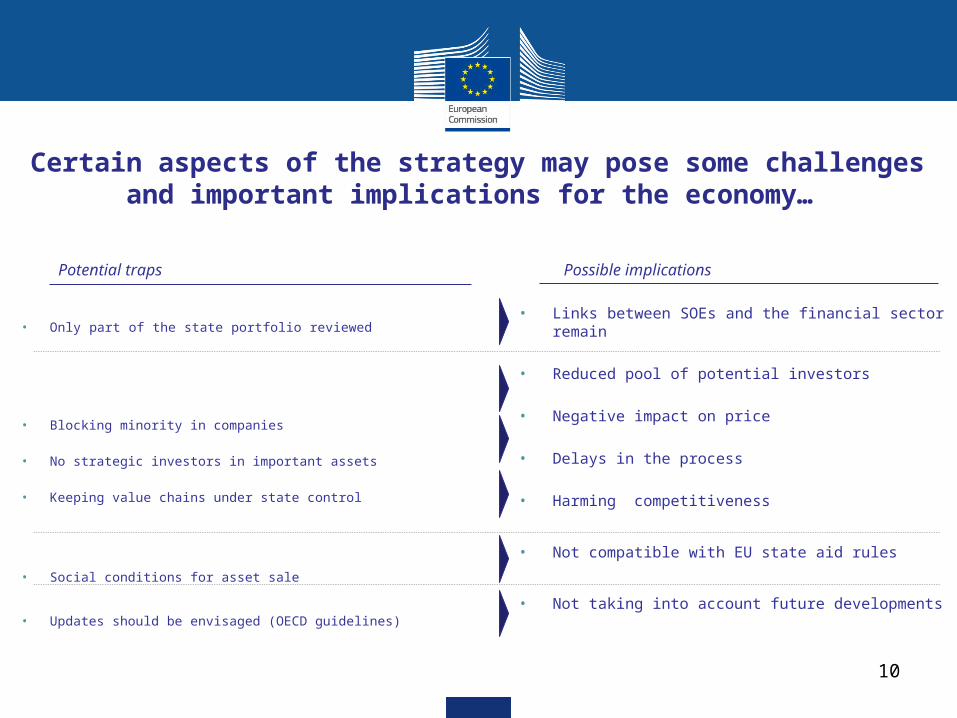
Certain aspects of the strategy may pose some challenges and important implications for the economy…
Potential traps Possible implications
• Only part of the state portfolio reviewed
• Blocking minority in companies
• No strategic investors in important assets
• Keeping value chains under state control
• Social conditions for asset sale
• Updates should be envisaged (OECD guidelines)
• Links between SOEs and the financial sector remain
• Reduced pool of potential investors
• Negative impact on price
• Delays in the process
• Harming competitiveness
• Not compatible with EU state aid rules
• Not taking into account future developments
10

…linked to risks of incurring further costs to the state and slowing down private investment recovery
Private investment dropped below all benchmarks
Source: European Commission
14
16
18
20
22
24
26
02 03 04 05 06 07 08 09 10 11 12 13 14
Priv
ate
inve
stm
ent,
% o
f G
DP
Slovenia EA V4
SI historical average(since 1995)
13bn of direct and indirect costs to SI
Cumulative 2007-2014
EUR bn
Total fiscal and economic implications 13.4
as % of GDP 36%
with direct fiscal impact (debt, deficit or both) 8.3
as % of GDP 22%
with wider economic impact (foregone profits) 5.1
as % of GDP 14%
Source: 2015 Country Report for Slovenia European Commission, SI Chamber of Commerce
11

Next steps
12
June 2015
Sept/ Oct 2015
Nov/ Dec 2015
• CSR on SOEs management adopted
• Monitoring mission
• Report on progress

Hvala!


![Thesis Antoniya Georgieva[1]](https://img.pdfslide.us/doc/110x75/6175bae2bb44291fce118c1d/thesis-antoniya-georgieva1.jpg)