Embed Size (px)
Citation preview

195 North 1950 West • Salt Lake City, Utah Mailing Address: P.O. Box 144820 • Salt Lake City, Utah 84114-4820
Telephone (801) 536-4000 • Fax (801) 536-4099 • T.D.D. (801) 536-4414 www.deq.utah.gov
Printed on 100% recycled paper
State of Utah
GARY R. HERBERT Governor
SPENCER J. COX
Lieutenant Governor
Department of Environmental Quality
Amanda Smith
Executive Director
DIVISION OF AIR QUALITY Bryce C. Bird
Director
Air Quality Board Stephen C. Sands II, Chair
Kerry Kelly, Vice-Chair Tammie G. Lucero
Erin Mendenhall Robert Paine III Amanda Smith Michael Smith
Karma M. Thomson Kathy Van Dame
Bryce C. Bird, Executive Secretary
DAQ-004-15a
UTAH AIR QUALITY BOARD MEETING
FINAL AGENDA
Wednesday, March 4, 2015 - 1:30 p.m. 195 North 1950 West, Room 1015
Salt Lake City, Utah 84116 I. Call-to-Order II. Date of the Next Air Quality Board Meeting: May 6, 2015 III. Approval of the Minutes for February 4, 2015, Board Meeting. IV. Final Adoption: Amend R307-120. General Requirements: Tax Exemption for Air Pollution
Control Equipment. Presented by Mark Berger. V. Final Adoption: Amend R307-311. Utah County: Trading of Emission Budgets for Transportation
Conformity. Presented by Mark Berger. VI. Propose for Public Comment: Amend Utah State Implementation Plan Section XX.D.6. Regional
Haze. Long-Term Strategy for Stationary Sources. Best Available Retrofit Technology (BART) Assessment for NOx and PM; add new Utah State Implementation Plan Subsections IX.H.21 and 22. General Requirements: Control Measures for Area and Point Sources, Emission Limits and Operating Practices, Regional Haze Requirements; and Source Specific Emission Limitations: Regional Haze Requirements, Best Available Retrofit Technology. Presented by Colleen Delaney.
VII. Propose for Public Comment: Amend R307-110-17. General Requirements: State Implementation Plan. Section IX, Control Measures for Area and Point Sources, Part H, Emissions Limits; and R307-110-28. General Requirements: State Implementation Plan. Regional Haze. Presented by Mark Berger.
VIII. Propose for Public Comment: Amend R307-210. Stationary Sources. Presented by Mark Berger. IX. Propose for Public Comment: Amend R307-214. National Emission Standards for Hazardous Air
Pollutants. Presented by Mark Berger.

DAQ-004-15a Page 2 X. Informational Items. A. Air Toxics. Presented by Robert Ford. B. Compliance. Presented by Jay Morris and Harold Burge. C. Monitoring. Presented by Bo Call. D. Other Items to be Brought Before the Board. In compliance with the American with Disabilities Act, individuals with special needs (including auxiliary communicative aids and services) should contact Dana Powers, Office of Human Resources at (801) 536-4413 (TDD 536-4414).
ITEM 3

195 North 1950 West • Salt Lake City, Utah Mailing Address: P.O. Box 144820 • Salt Lake City, Utah 84114-4820
Telephone (801) 536-4000 • Fax (801) 536-4099 • T.D.D. (801) 536-4414 www.deq.utah.gov
Printed on 100% recycled paper
State of Utah
GARY R. HERBERT Governor
SPENCER J. COX
Lieutenant Governor
Department of Environmental Quality
Amanda Smith
Executive Director
DIVISION OF AIR QUALITY Bryce C. Bird
Director
Air Quality Board Stephen C. Sands II, Chair
Kerry Kelly, Vice-Chair Erin Mendenhall
Tammie G. Lucero Robert Paine III Amanda Smith Michael Smith
Karma M. Thomson Kathy Van Dame
Bryce C. Bird, Executive Secretary
UTAH AIR QUALITY BOARD MEETING February 4, 2015 – 1:30 p.m.
195 North 1950 West, Room 1015 Salt Lake City, Utah 84116
DRAFT MINUTES
____________________________ I. Call-to-Order Steve Sands called the meeting to order at 1:30 p.m. Board members present: Steve Sands, Kerry Kelly, Kathy Van Dame, Michael Smith, Karma
Thomson, Tammie Lucero, and Robert Paine Excused: Amanda Smith and Erin Mendenhall Executive Secretary: Bryce Bird II. Date of the Next Air Quality Board Meeting: March 4, 2015 III. Approval of the Minutes for December 3, 2014, Board Meeting.
● Tammie Lucero motioned that the Board approve the minutes. Robert Paine seconded. The Board approved unanimously.
IV. Final Adoption: Amend R307-401-19. General Approval Order. Presented by Mark Berger.
Mark Berger, Air Quality Policy Section Manager at DAQ, stated that in October 2014 the Board proposed amendments to R307-401-19 to allow coverage under a general approval order if a demonstration is completed that meets the requirements of R307-410-5 (1)(c)(2). No comments were received during the 30-day public comment period and no hearing was requested. Staff recommends the Board adopt R307-401-19, General Approval Order, as proposed. ● Kerry Kelly moved that the Board adopt to amend R307-401-19, General Approval Order.
Kathy Van Dame seconded. The Board approved unanimously. V. Five-Year Reviews: R307-103, R307-165, R307-201 through R307-207, R307-305 through
R307-307, R307-309, R307-310, R307-841, and R307-842. Presented by Mark Berger.

Air Quality Board February 4, 2015 Page 2 of 5
Mark Berger, Air Quality Policy Section Manager at DAQ, stated that Utah code requires that all administrative rules be reviewed every five years to determine if the rule is still necessary and to determine if the rule is still allowed under state and federal rule. This process is done through a five-year analysis form that is submitted to the Division of Administrative Rules. The five-year review process is not a time to amend a rule, but is simply a time to determine if the rule is still necessary. We have completed the five-year review for 16 air quality rules and have determined that each rule is both allowed under state and federal rule and is also necessary and therefore should be continued for another five years. Staff recommends that the Board continue R307-103, R307-165, R307-201 through R307-207, R307-305 through R307-307, R307-309, R307-310, R307-841, and R307-842 by approving each rule’s attached Five-Year Notice of Review and Statement of Continuation form which staff will file with the Division of Administrative Rules. ● Kathy Van Dame moved that the Board approve the five-year reviews for R307-103,
R307-165, R307-201 through R307-207, R307-305 through R307-307, R307-309, R307-310, R307-841, and R307-842. Robert Paine seconded. The Board approved unanimously.
Bryce Bird announced Mark Berger’s promotion as the new Air Quality Policy Section Manager at DAQ. Mark will be recruiting for his replacement as the Environmental Planning Consultant over the next couple of weeks.
VI. Informational Items. A. Mountain View Corridor Air Working Group Update. Presented by Cameron Cova
and Paul Roberts. Cameron Cova from Breathe Utah and a member of the Mountain View Corridor (MVC) Air Working Group (AWG) and Paul Roberts of Sonoma Technology, Inc. updated the Board on the MVC AWG projects associated with the air quality issues with the Utah Department of Transportation’s (UDOT) construction of the MVC. They explained that the MVC is a planned freeway from Interstate 80 in Salt Lake County to State Route 73 in Lehi. During UDOT’s review, members of the public were concerned about future air quality at schools along the new roadway and the MVC Air Working Group was formed. The objectives of the AWG were to monitor air quality effects of the new roadway and to address potential impacts resulting from the new roadway’s construction near five schools in the Granite School District. Ms. Cova and Mr. Roberts gave a detailed presentation on the working group and its contractor’s initial work and found that background air monitoring has confirmed typical urban concentrations of air pollutants; it is expected that concentrations of toxic air pollutants from vehicular traffic will increase when the MVC is completed; results from other studies at schools near busy freeways demonstrate that concentrations of diesel particulate matter can be significantly reduced in classrooms by a program of improved ventilations systems and filtration; that a mitigation strategy at the five schools is being recommended; and the mitigation strategy includes immediate changes to ventilations systems and ongoing increases in operating costs at the five schools. In discussion, it was commented that this process is a good example of what can be accomplished when community concerns are brought forward and when agencies react proactively. In addition, as part of the construction there will be improvements in mass transit, there will be another monitoring sessions, changes to intersections, and eventually overpasses. Also, monitoring on the current performance of the current HVAC systems

Air Quality Board February 4, 2015 Page 3 of 5
was done and found that one of the classrooms and several portable classrooms had high levels of carbon dioxide (CO2). Finally, Mr. Roberts responded to what the effect of black carbon and particulate matter to people who are driving might be. He stated that in looking at fixed-site monitors in Los Angeles, that if people are commuting for 30 minutes to an hour they are exposed to higher concentrations and according to his calculations can be 80% of their daily commute.
B. Request for Rulemaking for Ultra-Low NOx Water Heaters. Presented by Envision
Utah. Robert Grow, team facilitator of Envision Utah’s Clean Air Action Team (CAAT), stated that the Governor asked Envision Utah to facilitate the CAAT with the task to provide recommendations to improve air quality in Utah. One of those recommendations is that the Air Quality Board adopt a rule to require suppliers to sell only ultra-low nitrogen oxide (NOx) water heaters and that by replacing all water heaters with ultra-low NOx models it would reduce daily area emissions by about 5.3% in 2050. Mr. Grow gave a brief presentation on their recommendation and provided draft rule language. This would be a statewide implementation with a phase-in period by certain counties by 2018 with the remaining portions of Utah by 2019. As this is not an action item, the Board was asked to instruct the staff to bring back a proposed rule for the Board’s consideration. After further discussion, the Board then instructed staff to present a proposed rule for public comment by the March Board meeting.
C. Comments on Utah’s Regional Haze Re-Proposal. Presented by Healthy Environment Alliance of Utah and the National Parks Conservation Association. Robert DeBirk from Healthy Environment Alliance of Utah (HEAL Utah) stated that HEAL Utah and the National Parks Conservation Association (NPCA) facilitated thousands of comments expressing concerns about Utah’s regional haze implementation plan ending on December 22, 2014. They urge the Board and Utah to seize the opportunity presented by the regional haze state implementation planning process to cut pollution in Utah. It is their understanding that Utah plans to repropose a regional haze (RH) state implementation plan (SIP) in March and that after a public comment period the Board will get a chance to submit it to EPA in May 2015. This repropsal signals to them that the Department of Environmental Quality has recognized deficiencies in the previous plan released to the public by the Board in October 2014. Cory MacNulty from the NPCA stated that they work to protect air quality and the scenic vistas of our national parks. Utah’s RH SIP is the plan that proposes best available retrofit technology (BART) to control NOx pollution and PM2.5 emissions for two units each at Hunter and Huntington facilities as required by the Clean Air Act. They have concerns of the state’s failure to require these facilities to put on the BART. After working with experts, they believe that selective catalytic reduction (SCR) are the BART, specifically on the BART eligible units at Hunter and Huntington. They are concerned about the incomplete information available during the public comment period and the timing of release of information, in particular the modeling. They have concerns with the cost estimates in which their technical experts believe PacifiCorp overstated the cost of key pollution control technologies while also understating the benefits of SCR. Every hour that the Hunter and Huntington coal plants are allowed to emit the pollution without

Air Quality Board February 4, 2015 Page 4 of 5
BART, thousands of smog producing NOx pollution are released in the air. They are disappointed Utah has not yet acted to control these facilities. Finally, it is their hope the state’s reproposal will lead to real and significant reductions in NOx and PM2.5, specifically from each of the units at Hunter and Huntington. Ms. MacNulty briefly described the GCVTC’s stakeholder process that put a plan together to reduce sulfur dioxide (SO2) emissions on the Colorado Plateau. EPA’s approval of that part of Utah’s RH plan for SO2 is a testament to that process and the reductions that were achieved, but EPA is clear that the 309 plan is not a replacement for reducing NOX and PM2.5, particularly at the BART eligible sources. Ms. Van Dame stated some of her concerns and commented that the stakeholder process in the early 90’s was well represented all through the Four Corners. The outcome of that work was a regional haze rule in which Utah is the only state that goes under the 309 section of the rules. Utah’s RH SIP, originally adopted in 2003, was based on the recommendations of the GCVTC. The GCVTC’s 70 recommendations made it so that if we met those recommendations that would be our SIP requirement until 2018. Now, in her mind, there is a decision being made by people that are not in Utah to go after industries in Utah and undo the excellent work of the GCVTC and others to get pollution control installed and early reductions at Hunter and Huntington. In addition, there was significant NOx reduction in the pollution control that was installed which is about half of what you can get with SCR. She feels that it is destructive to take the hard work of the stakeholders in this case and dismantle it. We need to be able to make agreements that industry and people will know that we will continue to meet, especially with the work we’ve started in the Uinta Basin. If we want Utah solutions for Utah problems we have to figure a way that we solve our problems and that we don’t let EPA in any way limit us.
D. Air Toxics. Presented by Robert Ford.
E. Compliance. Presented by Jay Morris and Harold Burge.
F. Monitoring. Presented by Kimberly Kreykes. Kimberly Kreykes updated the Board on the monitoring information. In discussion it was noted there were no exceedances in December 2014 which was in contrast from the previous year. Staff was asked to provide at the next meeting a comparison of exceedances in the 2013/2014 winter versus the 2014/2015 winter data.
G. Other Items to be Brought Before the Board. Public comment from George Chapman, retired engineer, was introduced. Mr. Chapman commented on his concerns that DAQ might approve Navitus’, a recycling facility, air permit. In his work as an engineer incineration systems don’t work very well in nonhomogeneous feed stock which is what this facility is. This is an intent to approve a facility that has not been fully tested. He asks the Board to take action and make sure that DAQ does not approve the plant. Mr. Chapman also has concerns with gravel pits and their seemingly rubber-stamp approval for operation. He is asking the Board to increase mitigation measures for such facilities, in particular those in the Capitol Hill area and he would like rules that require hazardous waste burn plants, cement kilns, and refineries to cover their hazardous waste. Finally, he asks the Board to provide more funding for portable air monitors. He feels the reason fireworks were almost banned in Ogden last
Air Quality Board February 4, 2015 Page 5 of 5
year was the poor location of a monitoring trailer and if hand-held monitors were available that would not have been an issue. Mr. Bird gave an update on the current legislative session by stating that most of discussion so far has been on budget items, the base budget and building blocks. Mr. Bird went over five appropriation requests: a request for $600,000 to build a system to take information collected so far and put it in a geographic information systems formant so that it is available to state, county, and city agencies; a request for an additional Attorney General staff member to support air quality efforts; a request to change the one-time $1 million funding received last year to an on-going appropriation of $750,000 per year for research; a request for three new compliance inspectors, a vehicle, and additional resources to address growth in the Uinta Basin; and finally a request to feed the clean air retrofit, replacement, and off-road technology program. Mr. Bird also updated the Board on statements he made to a legislative committee regarding wood burning restrictions. DAQ has heard the comments and now understands more about the impacts, and also understanding more of the reasons that people choose to burn and the constraints in areas of those large nonattainment areas not serviced by natural gas. DAQ still acknowledges that we have a problem and that wood burning is still contributing to our air pollution not only regionally but the local impacts as well. As we move forward, the Board accepts public comment, makes reasonable rules that both provide air quality benefit but also are not overly burdensome as they are implemented. The comment period regarding wood burning restrictions ends on February 9, staff will collect those comments and will provide written responses to the Board, and come back with a recommended path forward that will address and respond to those comments. In discussion with the Board, everyone is encouraged to use the best data available and to not try to angle the data to suit individual needs. There are serious health effects to wood smoke and we need to figure out a way to go forward that will have broad buy-in. The important thing is that we have started important conversions on this issue.
______________________________________________________________________________ Meeting adjourned at 3:14 p.m.
ITEM 4

State of Utah
GARY R. HERBERT Governor
SPENCER J. COX
Lieutenant Governor
Department of Environmental Quality
Amanda Smith
Executive Director
DIVISION OF AIR QUALITY Bryce C. Bird
Director
DAQ-005-15
M E M O R A N D U M TO: Air Quality Board THROUGH: Bryce C. Bird, Executive Secretary FROM: Alan Humpherys, Minor New Source Review Section Manager DATE: February 17, 2015 SUBJECT: FINAL ADOPTION: Amend R307-120. General Requirements: Tax Exemption for Air
Pollution Control Equipment. ______________________________________________________________________________________ On December 3, 2014, the Air Quality Board proposed amendments to R307-120, General Requirements: Tax Exemption for Air Pollution Control Equipment. Changes were made to R307-120 to be consistent with House Bill 31. A 30-day public comment period was held from January 1 through February 2, 2015. No public comments were received and a public hearing was not requested. Staff Recommendation: Staff recommends the Board adopt R307-120 as proposed.
195 North 1950 West • Salt Lake City, Utah Mailing Address: P.O. Box 144820 • Salt Lake City, Utah 84114-4820
Telephone (801) 536-4000 • Fax (801) 536-4099 • T.D.D. (801) 536-4414 www.deq.utah.gov
Printed on 100% recycled paper

R307-120 February 17, 2015 Page 1 of 2 R307. Environmental Quality, Air Quality. 1 R307-120. General Requirements: Tax Exemption for Air Pollution 2 Control Equipment. 3 R307-120-1. Applicability. 4 This rule shall apply to purchases described in Section 5 19-12-201. 6 7 R307-120-2. Definitions. 8 The following definitions apply to R307-120: 9 “Freestanding pollution control property” means freestanding 10 pollution control property as defined in Section 19-12-102. 11 “Pollution control facility” means pollution control facility 12 as defined in Section 19-12-102. 13 14 R307-120-3. Application for Certification. 15 (1) An application for certification shall be made on the form 16 provided by the director. 17
(2) The application shall include all information requested 18 thereon and such additional information as is requested by the 19 director. At a minimum, the application shall contain: 20 (a) a description of the pollution control facility or the 21 freestanding pollution control property; 22 (b) a description of the property, part, product, or service 23 for a purchase or lease of property, a part, a product or a service 24 for which a person seeks to claim a sales and use tax exemption under 25 Section 19-12-201; 26 (c) the existing or proposed operation procedure for the 27 pollution control facility or freestanding pollution control 28 property; and 29 (d) a statement of the purpose served or to be served by the 30 pollution control facility or freestanding pollution control 31 property. 32 (3) Applications for certification shall include: 33 (a) a reference to the approval order issued under R307-401-8 34 that requires the pollution control facility or the freestanding 35 pollution control property; or 36
(b) a reference to the section of the State Implementation Plan 37 that requires the pollution control facility or the freestanding 38 pollution control property; or 39 (c) an estimate of emission reductions (in tons per year) 40 resulting from the use of the pollution control facility or the 41 freestanding pollution control property. 42 (4) The director may require an application to contain 43 additional information that the director finds necessary to determine 44 whether to grant certification under Section 19-12-303. 45 46 47 R307-120-4. Issuance of Certification. 48 (1) The filing date of the application shall be the date the 49 director receives a complete application with all of the information 50 as described in R307-120-3. Within 120 days of the filing date of 51
R307-120 February 17, 2015 Page 2 of 2 the application, the director will: 1 (a) issue a written certification of the pollution control 2 facility or the freestanding pollution control property; or 3 (b) provide a written statement of the reason for the denial 4 of certification. 5 (2) The director shall issue a certification of a pollution 6 control facility or a freestanding pollution control property to the 7 applicant if the director determines that: 8 (a) the application meets the requirements of Section 9 19-12-301(3) or 19-12-302(2); 10 (b) the facility or property that is the subject of the 11 application is a pollution control facility or a freestanding 12 pollution control property. 13 (c) the person who files the application is a person described 14 in Section 19-12-301(1) or 19-12-302(1); and 15 (d) the purchases or leases for which the person seeks to claim 16 a sales and use tax exemption are exempt under Section 19-12-201. 17
(3) The director may issue one certification for one or more 18 pollution control facilities or freestanding pollution control 19 properties that constitute an operational unit. 20 (4) If the director does not issue or deny a certification within 21 120 days after the date a person files an application, the director 22 shall issue a certification to the person at the person’s request. 23 24 25 R307-120-5. Exemptions from Certification. 26 The director shall not issue a certification for the following: 27 (1) a replacement of freestanding pollution control property; 28 or 29 (2) property, a part, a product, or a service described in 30 Sections 19-12-201(1)(b) through (e) used or performed in a repair 31 or replacement related to: 32 (a) a pollution control facility; or 33 (b) a freestanding pollution control property. 34 (3) a pollution control facility or a freestanding pollution 35 control property that has already received a certification under 36 R307-120-5. 37 38 R307-120-6. Appeal and Revocation. 39 (1) A decision of the director may be reviewed by filing a 40 Request for Agency Action as provided in R305-7. 41 (2) The director may revoke a certification issued under Section 42 19-12-303 if the director makes a determination as contained in Section 43 19-12-304. 44 45 KEY: air pollution, tax exemptions, equipment 46 Date of Enactment or Last Substantive Amendment: 2015 47 Notice of Continuation: February 1, 2012 48 Authorizing, and Implemented or Interpreted Law: 19-12-101; 49 19-12-102; 19-12-201; 19-12-202; 19-12-203; 19-12-301; 19-12-302; 50 19-12-303; 19-12-304; 19-12-305 51

ITEM 5
State of Utah
GARY R. HERBERT Governor
SPENCER J. COX
Lieutenant Governor
Department of Environmental Quality
Amanda Smith
Executive Director
DIVISION OF AIR QUALITY Bryce C. Bird
Director
DAQ-010-15
M E M O R A N D U M TO: Air Quality Board THROUGH: Bryce C. Bird, Executive Secretary FROM: Bill Reiss, Environmental Engineer DATE: February 19, 2015 SUBJECT: FINAL ADOPTION: New Rule, R307-311. Utah County: Trading of Emission Budgets
for Transportation Conformity. ______________________________________________________________________________________ The rule proposed for the Board’s consideration today would affect the way the metropolitan planning organization (MPO) for Utah County is able to demonstrate that the emissions associated with transportation plans, programs, and projects conform to emission budgets established in the PM10 State Implementation Plan (SIP) for Utah County. It would alleviate a problem demonstrating conformity to the NOx budget, brought on by EPA’s release of a new mobile source emissions model. The new MOVES model predicts much more NOx from tailpipes than the old MOBILE6. The old model was used to develop the NOx budget in the 2002 PM10 SIP, but it is the new model that must be used by the MPO as it prepares its conformity demonstration. The proposed rule would allow the MPO to apply a potential surplus in its budget for direct PM10 to a potential shortfall in its budget for NOx, at a ratio of one-to-one. It would not, however, allow such trading in the opposite direction (e.g. to apply a surplus of NOx to a shortfall in direct PM10.) The reasoning behind both the directional nature of the trading and the ratio specified is explained in the second attachment to this memo. The proposed rule would essentially be a duplication of R307-310, which allows the same type of trading when demonstrating transportation conformity to the PM10 SIP for Salt Lake County. A public comment period was held from January 1 to February 12, 2015. No comments were received on proposed rule R307-311; however, EPA did comment on the technical basis underlying the rule. Those comments may be summarized as follows:
195 North 1950 West • Salt Lake City, Utah Mailing Address: P.O. Box 144820 • Salt Lake City, Utah 84114-4820
Telephone (801) 536-4000 • Fax (801) 536-4099 • T.D.D. (801) 536-4414 www.deq.utah.gov
Printed on 100% recycled paper

DAQ-010-15 Page 2
1. DAQ’s draft technical support document (TSD) had relied upon an EPA proposal from 1996 to support the direction of trade prescribed in proposed rule R307-311. The 1996 position was also used in support of a similar trading rule for Salt Lake County, which was approved in 2002, but since that time EPA has issued additional guidance: "Revised Policy to Address Reconsideration of Interpollutant Trading Provisions for Fine Particles ( PM2.5), July 21, 2011." EPA recommends that DAQ make use of this more recent guidance in its TSD.
2. DAQ’s draft TSD had also relied upon some sensitivity modeling from Utah’s 2013 PM2.5 SIP for
the Provo nonattainment area. That modeling had determined an equivalence ratio between NOx and PM2.5, and the ratio had been used to support the one-to-one trading ratio prescribed in proposed rule R307-311. Application of the NOx to PM2.5 ratio was justified with an assertion that, in Utah County, wintertime PM2.5 is sufficiently similar to wintertime PM10. The 2013 SIP has since been superseded, and EPA recommends instead that DAQ use the modeling from the December 2014 PM2.5 SIP revision. This more recent modeling would: a) more directly address the relationship between NOx and PM10 in order to support proposed rule R307-311, and b) more correctly establish the relationship between NOx and PM2.5 for the additional purpose of evaluating any potential impacts due to the proposed rule with respect to attainment of the 24-hour PM2.5 standard and reasonable further progress toward that end.
3. Concerning potential impacts due to proposed rule R307-311 with respect to attainment and
reasonable further progress toward attainment of other National Ambient Air Quality Standards, EPA comments that DAQ should consider ozone and NO2 in addition to CO and PM2.5, the pollutants for which Utah County is (or was) designated as not attaining.
In response to those comments, DAQ has worked with EPA Region 8 to apply the community multi-scaled air quality modeling from the December 2014 SIP revision directly to the proposal for R307-311. The model was run using inventories of both PM10 and PM2.5, and determinations of equivalence with respect to NOx were made for each. The modeling is consistent with the approach presented in EPA’s July 21, 2011, guidance document, and its conclusions support both the one-to-one ratio and the direction of trade prescribed by proposed rule R307-311. In addition, the equivalence ratio determined for NOx to PM2.5 supports the conclusion that the proposed rule would not adversely affect 24-hour PM2.5 concentrations in Utah County. The revised TSD also includes an assessment of the proposed rule with respect to CO, ozone, and NO2. Staff Recommendation: Staff recommends the Board adopt R307-311, Utah County: Trading of Emission Budgets for Transportation Conformity, as proposed. A copy of the proposal is attached, as is documentation describing the technical basis for the proposed rule.

R307-311 February 19, 2015 Page 1 of 2
R307. Environmental Quality, Air Quality. 1 R307-311. Utah County: Trading of Emission Budgets for 2 Transportation Conformity. 3 R307-311-1. Purpose. 4 This rule establishes the procedures that may be used to trade 5 a portion of the primary PM10 budget when demonstrating that a 6 transportation plan, transportation improvement program, or project 7 conforms with the motor vehicle emission budgets in the Utah County 8 portion of Section IX, Part A of the State Implementation Plan, "Fine 9 Particulate Matter (PM10)." 10 11 R307-311-2. Definitions. 12 The definitions contained in 40 CFR 93.101, effective as of the 13 date referenced in R307-101-3, are incorporated into this rule by 14 reference. The following additional definitions apply to this rule. 15 "Budget" means the motor vehicle emission projections used in 16 the attainment demonstration in the Utah County portion of Section 17 IX, Part A of the State Implementation Plan, "Fine Particulate Matter 18 (PM10)." 19 "NOx" means oxides of nitrogen. 20 "Primary PM10" means PM10 that is emitted directly by a source. 21 Primary PM10 does not include particulate matter that is formed when 22 gaseous emissions undergo chemical reactions in the ambient air. 23 "Transportation Conformity" means a demonstration that a 24 transportation plan, transportation improvement program, or project 25 conforms with the emissions budgets in a state implementation plan, 26 as outlined in 40 CFR, Chapter 1, Part 93, "Determining Conformity 27 of Federal Actions to State or Federal Implementation Plans." 28 29 R307-311-3. Applicability. 30 (1) This rule applies to agencies responsible for demonstrating 31 transportation conformity with the Utah County portion of Section 32 IX, Part A of the State Implementation Plan, "Fine Particulate Matter 33 (PM10)." 34 (2) This rule does not apply to emission budgets from Section 35 IX, Part C.6 of the State Implementation Plan, "Carbon Monoxide 36 Maintenance Plan." 37 38 R307-311-4. Trading Between Emission Budgets. 39 (1) The agencies responsible for demonstrating transportation 40 conformity are authorized to supplement the budget for NOx with a 41 portion of the budget for primary PM10 for the purpose of demonstrating 42 transportation conformity for NOx. The NOx budget shall be 43 supplemented using the following procedures. 44 (a) The metropolitan planning organization shall include the 45 following information in the transportation conformity demonstration: 46 (i) The budget for primary PM10 and NOx for each required year 47 of the conformity demonstration, before trading allowed by this rule 48 has been applied; 49 (ii) The portion of the primary PM10 budget that will be used 50 to supplement the NOx budget, specified in tons per day using a 1:1 51 ratio of primary PM10 to NOx, for each required year of the conformity 52

R307-311 February 19, 2015 Page 2 of 2
demonstration; 1 (iii) The remainder of the primary PM10 budget that will be 2 used in the conformity demonstration for primary PM10, specified in 3 tons per day for each required year of the conformity demonstration; 4 and 5 (iv) The budget for primary PM10 and NOx for each required year 6 of the conformity demonstration after the trading allowed by this 7 rule has been applied. 8 (b) Transportation conformity for NOx shall be demonstrated 9 using the NOx budget supplemented by a portion of the primary PM10 10 budget as described in (a)(ii). Transportation conformity for 11 primary PM10 shall be demonstrated using the remainder of the primary 12 PM10 budget described in (a)(iii). 13 (c) The primary PM10 budget shall not be supplemented by using 14 a portion of the NOx budget. 15 16 17 KEY: air pollution, transportation conformity, PM10 18 Authorizing, and Implemented or Interpreted Law: 19-2-104 19

Technical Support Documentation for Conformity Budget Trading in Utah County
PM10 is particulate matter with diameters smaller than 10 micrometers. PM10 consists of solid and/or liquid particles of (1) primary particles: directly emitted PM or PM that quickly condenses upon release and (2) secondary particles: PM that is formed in the atmosphere from gaseous precursors. Important gaseous precursors to PM include sulfur dioxide (S02) which converts to sulfate (S04
=) particles, nitrogen oxides (NOx) which convert to nitrate (N03
-) particles, volatile organic compounds (VOCs), some of which convert to secondary organic aerosols, and ammonia (NH3) which adds to the mass of sulfate PM and allows nitric acid to convert to PM10 in the form of ammonium nitrate.
Currently in Utah County, transportation plans must conform to emission budgets for PM10 and NOx that were derived from the 2002, EPA-approved, PM10 SIP. Since the regulatory goal is to achieve attainment of the NAAQS, it should not matter in a conformity analysis whether PM10 consists of directly emitted (primary) PM10 or (secondary) nitrate formed in the atmosphere from gaseous NOx emissions, a precursor to PM10. This paper outlines the scientific rationale for why excess NOx emissions can be offset on a one-to-one (1:1) basis with available PM10 budget, and why proposed rule R307-311 is conservative (i.e., protective of the environment) in specifying both a one-way direction of trade and a trading ratio of 1:1.
What Fraction of the NOx Emissions Convert to PM10?
Each ton of gaseous NOx that gets converted to PM10 creates more than a ton of PM10 because the molecular weight of ammonium nitrate PM10 is greater than the molecular weight of NOx gaseous emissions. Considering the ratio of the molecular weights of the NOx precursor gas and the resulting ammonium nitrate aerosol (PM10), a ton of NOx that is converted from a gas to a particle can form as much as 1.74 tons of PM10.
However, not all NOx emissions are converted because it takes time to convert NOx to nitric acid (HN03), which is the necessary gaseous precursor to ammonium nitrate PM10. These reactions generally occur at rates of 1 to 10 percent per hour. Thus, it would take at least 10 hours to fully convert to nitric acid. After this initial conversion, only a fraction of the gaseous nitric acid will condense as ammonium nitrate PM10, depending on equilibrium considerations. Finally, during the gas-to-particle conversion process, deposition will remove a significant amount of material. Throughout this process of NOx conversion to nitric acid, and then to PM10 with deposition, an equivalent amount of directly emitted PM10 is having a much larger effect on PM10 concentration. Directly emitted PM10 has an effect on ambient concentration immediately upon its release, while NOx emissions require hours to have an effect.
The conversion of NOx to PM10 has been discussed at EPA since at least 1996:
1

"The conversion process may depend on several variables, including the availability of chemical reactants in the atmosphere for the conversion process, and the difference in mass between the PM-10 precursor molecule and the PM-10 particle that the precursor reacts to become. Another concern is that the rate of conversion of the precursor to PM-10 may be so long that the precursor may not entirely convert to PM-10 within the same nonattainment area. Thus, there would be less counteracting effect and no net improvement to air quality in the area. Under the EPA's proposal, a source of a PM-10 precursor may offset its increased emissions with the same precursor type or PM-10 (or a combination of the two). In this situation, a net improvement in air quality would be assured. At this point, however, the EPA is not proposing to allow offsetting among different types of PM-10 precursors, or offsetting PM-10 increases with reduction in PM-10 precursors, because the Agency does not now have a scientific basis to propose conversion factors.” (FR, Vo1.61 , No.142, page 38305, July 23, 1996, emphasis added)
EPA’s most recent guidance (Revised Policy to Address Reconsideration of Interpollutant Trading Provisions for Fine Particles (PM2.5), July 21, 2011) speaks to an earlier (2008) rule in which EPA had provided presumptive trading ratios between PM2.5 and precursors, including NOx, that could be applied without any additional analysis to conclude that there would be no dis-benefit to overall PM2.5 concentrations. As with the 1996 guidance, the ratio provided in the 2008 rule (200 tons of NOx being equivalent to 1 ton of PM2.5) supported the one-way direction of trading offered in proposed rule R307-311. Legal challenges to the 2008 rule forced EPA to revisit the issue and agree that the presumptive ratios therein were not sufficiently conservative to ensure the net air quality benefit to ambient PM2.5 concentrations across all areas of the country, and that the modeling behind the presumptive ratios was not applicable to situations involving 24-hour averaging periods. Thus, the Revised Policy from 2011 indicates that “states will be expected to develop separate PM2.5 precursor offset ratios that are demonstrated to be suitable for addressing the particular precursor’s relationship with ambient PM2.5 concentrations for 24-hour averaging periods that are causing violations in that nonattainment area.” “Each ratio will need to be supported by modeling or other technical demonstration to show that such ratio is suitable for the particular PM2.5 nonattainment area of concern.” It goes on to provide a general framework for such efforts, involving the following steps:
1) Definition of the appropriate geographical area 2) Sensitivity runs with appropriate air quality models 3) Calculation of interpollutant ratios, and 4) Quality assurance of the results
In support of proposed rule R307-311, UDAQ has applied this methodology to the Utah County PM10 nonattainment area. Although the guidance is specific to PM2.5, it has direct applicability to the PM10 situation in Utah County, which was designated a nonattainment area for violations of the 24-hour standard (only). Exceedances of the 24-hour standard are characterized by spikes in secondary aerosol formation under conditions of wintertime temperature inversions which prevent good atmospheric mixing and facilitate conversion of secondary PM10. A high percentage of the PM10 monitored in Utah County, during winter episodes of elevated concentration, lies also within the PM2.5 fraction. The Utah County PM10 SIP identified both NOx and SO2 as precursors to PM10.
2

Parts of Utah County (the valley regions) are also designated as nonattainment for PM2.5, and a SIP for that area was developed and submitted to EPA in December of 2014. The air quality modeling for that SIP was conducted using the Community Multi-Scale Air Quality model (CMAQ). CMAQ is capable of determining the relative importance of NOx and PM10. The emission inventories that were developed for the 2014 SIP included PM2.5, SO2, NOx, VOC, and Ammonia, but PM10 was also inventoried at the same time. Thus, the sensitivity runs made for the purpose of supporting proposed rule R307-311 employed the CMAQ model, as developed for Utah County, with a substitution of PM10 emissions for PM2.5. The model was also re-validated with respect to PM10 emissions data from the episode period prior to making the sensitivity runs.
Having made these adjustments, the model was run to provide a time-series plot (see Appendix A.) The ratio of NOx to PM10 equivalence was determined to be 5.702 to one. Since the ratio is greater than 1:1, it can be concluded that reducing primary PM10 is more beneficial than reducing NOx for improving Utah County’s air quality.
This conclusion supports the proposed rule which would only allow the trading of the PM10 budget to the NOx budget, at a ratio of 1:1, but would not allow the substitution of NOx for primary PM10. With these terms, there would be no adverse impact to overall ambient 24-hour PM10 concentrations within Utah County. Such terms are consistent with current and former EPA policy.
3

Impact of the Combined Budget Program on Other Pollutants
The analysis discussed in the preceding section made an evaluation with respect to the potential impact that proposed rule R307-311 could have on the overall levels of ambient PM10 in Utah County. There are several other pollutants to be concerned about as well in Utah County, and this next section will make some evaluations with respect to each of those.
Most importantly, Utah County is a nonattainment area for PM2.5, and the Provo-Orem area within Utah County is a carbon monoxide (CO) maintenance area. Also of note however are the Ozone and NO2 standards. Both could be affected by additional emissions of NOx. Each of these pollutants will be discussed in turn.
PM2.5 - Parts of Utah County (the valley regions) are also designated as nonattainment for PM2.5, and a SIP for the area was developed and submitted to EPA in December of 2014. As with PM10 (described above), sensitivity runs were made using the CMAQ model, as developed for the 2014 PM2.5 SIP, in order to determine an equivalence ratio between NOx and PM2.5. The resulting ratio of NOx to PM2.5 was determined to be 13.09 to one. Like the result for PM10, the ratio is greater than one to one, and therefore shows that reducing primary PM2.5 is more beneficial than reducing the same quantity of NOx.
However, in order that this result supports a determination that the proposed rule R307-311 would not have an adverse impact on overall PM2.5 concentrations in Utah County, it becomes necessary to look at the physical make-up of PM10 emissions from on-road mobile sources and determine the fraction thereof that would also be defined as PM2.5. The following table considers PM emissions as they were inventoried, for the year 2015, in the 2014 PM2.5 SIP, for the Provo, UT. nonattainment area.
Note that “direct” PM is the combined sum of brake wear, tire wear, and tailpipe emissions which include elemental carbon, organic carbon, and sulfate as SO4.
The overall percentage of PM2.5 emissions shows that for every ton of PM10 emissions due to on-road mobile sources, 0.409 tons would also be PM2.5. Proposed rule R307-311 would allow a one-ton increase in NOx emissions to be offset by a one-ton decrease in the PM10 emissions. By extension, that
Utah County; On-Road Mobile Source Emissions
tpd in 2015 PM10 PM2.5 %PM2.5
Road Dust 3.950 0.99 25.1%Direct PM 1.840 1.38 75.0%
Total 5.790 2.370 40.9%
4

one-ton increase in NOx would be offset by a 0.409-ton decrease in PM2.5 emissions. In terms of an equivalence ratio (NOx to PM2.5), this could be expressed as 2.44 to one.
The NOx to PM2.5 ratio determined for this area using CMAQ (13.09 to 1) is greater than 2.44 to 1. Therefore, it can be concluded that the proposed rule which would only allow the trading of the PM10 budget to the NOx budget, at a ratio of 1:1, and would not allow the substitution of NOx for primary PM10, would have no adverse impact on overall ambient 24-hour PM2.5 concentrations within Utah County.
As an additional point for consideration: The 2014 SIP for PM2.5 includes an assessment of NOx emissions for the year 2015, even if there is no corresponding motor vehicle emissions budget. Within Utah County, on-road mobile sources are expected to account for 21.48 tons per winter weekday (based on MOVES2010a). It is perhaps worth noting that this estimate is greater than the combined sum of the 2020 MVEB for both PM10 and NOx. In other words, even if the entire PM10 budget were traded to increase the NOx budget as a result of proposed rule R307-311, the resulting total would still be less than the 2015 NOx estimate within the PM2.5 SIP.
CO – As mentioned above, the Provo-Orem area is a carbon monoxide (CO) maintenance area. NOx emissions do not act as a precursor to carbon monoxide, and nothing in this proposal would be expected to impact the Provo-Orem area’s current CO maintenance status. The CO maintenance plan has its own CO budget, which has been set at a level demonstrated to keep the Provo-Orem area in attainment with the CO standard. Nothing in this proposal changes this budget, and the MPO has been able to demonstrate compliance with this budget by a wide margin.
A look at recently monitored data from Utah County can also be useful in looking at any potential impact from proposed rule R307-311. The following table shows that Utah continues to monitor compliance with the NAAQS for CO, which is set at 35 ppm for a one-hour averaging period and 9 ppm for an 8-hour averaging period.
Utah CountyCO CO 1-Hr (ppm) CO 8-Hr (ppm) CO 1-Hr (ppm) CO 8-Hr (ppm)
Year North Provo North Provo North Provo North Provo2007 3.8 2.42008 3.9 1.82009 3.9 2.5 3.9 2.22010 2.8 1.9 3.5 2.12011 2.9 2 3.2 2.12012 2.7 1.8 2.8 1.92013 3 2.1 2.9 2.02014 2.7 1.9 2.8 1.9
Annual 3-Yr DV
5

Ozone – Again, a look at recently monitored data from Utah County can be useful in looking at any potential impact from proposed rule R307-311. The following table shows that Utah continues to monitor compliance with the NAAQS for ozone, which is set at 75 ppb based on a three-year average of the annual 4th highest daily eight-hour average concentration.
NO2 - Again, it is useful to look at recently monitored data from Utah County. The following table shows that Utah continues to monitor compliance with the NAAQS for NO2, which is set at 100 ppb for a one-hour averaging period and determined as the three-year average of annually determined, 98th percentile, one-hour values. Utah has never experienced difficulty with the NO2 standard anywhere in the state, so it is no surprise that it is not an issue in Utah County.
Note: There is also an annual standard of and 53 ppb for an annual averaging period, but the hourly standard is more constraining.
Utah CountyOzone
Year North Provo Spinish Fork North Provo Spinish Fork2007 75 772008 74 712009 68 69 72.3 72.32010 70 70 70.7 70.02011 65 65 67.7 68.02012 77 76 70.7 70.32013 77 70 73.0 70.32014 65 69 73.0 71.7
O3 4th Max (ppb)Annual 3-Yr DV
O3 4th Max (ppb)
Utah County Annual 3-Yr DVNO2 NO2 98% (ppb) NO2 98% (ppb)
Year North Provo North Provo2007 632008 572009 56 58.72010 50 54.32011 58 54.72012 66 58.02013 75 66.32014 64 68.3
6

The preceding discussion shows that proposed rule R307-311 would not interfere with attainment or reasonable further progress toward attainment of any National Ambient Air Quality Standard. This is in keeping with section 110(l) of the Clean Air Act.
Furthermore, the projected trend in NOx emissions from on-road mobile sources is showing a significant decline. Looking at projected trends in NOx emissions from on-road mobile sources, EPA has just finalized an important rule designed to reduce air pollution from passenger cars and trucks. Starting in 2017, Tier 3 sets new vehicle emissions standards and lowers the sulfur content of gasoline. The tailpipe standards include different phase-in schedules that vary by vehicle class but generally phase in between model years 2017 and 2025. The vehicle emission standards combined with the reduction of gasoline sulfur content will significantly reduce motor vehicle emissions, including nitrogen oxides (NOx), volatile organic compounds (VOC), direct particulate matter (PM2.5), carbon monoxide (CO) and air toxics. Compared to current standards, the non-methane organic gases (NMOG) and nitrogen oxides (NOx), presented as NMOG+NOx, tailpipe standards for light-duty vehicles represent approximately an 80% reduction from today’s fleet average. Both of these pollutants contribute to the formation of ozone and secondary PM2.5. Reductions of this magnitude suggest that the trends of ozone, PM10, and PM2.5 concentrations will reflect these improvements.
Conclusion
Based on both EPA’s interpollutant policy and a current scientific analysis addressing the formation of secondary ammonium nitrate in Utah County, it may be concluded that reducing primary PM10 is more beneficial than reducing NOx for improving Utah County’s overall 24-hour PM10 concentrations.
The modeling analysis shows that the equivalence ratio of NOx to PM10 is greater than 1:1. In doing so, it confirms that the terms of proposed rule R307-311, a) trading in one direction only (increases in NOx offset by decreases in PM10), and b) at a ratio of 1:1, are conservative from the standpoint of ambient 24-hour PM10 concentrations.
Additionally, the rule does not adversely impact air quality, and will not interfere with attainment, maintenance, or reasonable further progress toward attainment, with respect to PM2.5, CO, ozone, or NO2.
7

Appendix A: CMAQ Air Quality Model Sensitivities used for Conformity Budget Trading in Utah County The Utah Division of Air Quality performed a series of model sensitivity analyses to estimate the reductions in 24-hr PM10 and 24-hr PM2.5 concentrations, given corresponding per-ton reductions of NOx, direct PM2.5, and direct PM10 emissions1. This analysis was used to assess the relative importance of NOx vs. PM, and to determine would-be budget trading ratios between the two for transportation conformity purposes in Utah County. These would-be ratios were compared to the actual budget trading terms of proposed rule R307-311, to assess whether or not the proposed rule would be protective of the 24-hour NAAQS for both PM10 and PM2.5.
The simulations were performed using the Community Multiscale Air Quality (CMAQ) Model along with a Utah County emissions inventory for 2015. That inventory was prepared as part of a PM2.5 SIP that was submitted to EPA in December of 2014.
In the simulations, CMAQ was successively run assuming a 1 ton per day (TPD) reduction from the on-road mobile source emissions inventory for (each of) NOx, direct PM2.5, and direct PM10 emissions. Each of these runs was then compared against a base-case simulation in which no emissions were eliminated.
Figure A.1 shows the results for PM10. The modeled concentrations for the Base simulation are shown as a blue trace. The concentrations resulting from a corresponding 1-ton reduction in mobile source NOx emissions are shown as the red trace, and the concentrations corresponding to a 1-ton reduction in direct mobile source PM10 emissions are shown as the green trace.
Figure A.2 gives the results for PM2.5 using the same color scheme.
From these modeling sensitivities, equivalence ratios between NOx and direct PM10, and NOx and direct PM2.5 can be determined. The resulting ratios are:
NOx to PM10 = 5.702
NOx to PM2.5 = 13.09
In each case, the model sensitivities show that a 1-ton reduction in either direct PM10 or direct PM2.5 emissions is more beneficial than a 1-ton reduction in NOx emissions.
1 The term “direct” particulate matter refers to the sum of brake wear, tire wear and tailpipe emissions which includes: elemental carbon, organic carbon and sulfate as SO4.
8

Figure A.1: CMAQ model times series for 24-hr PM10 concentrations for 2015 Base Emissions, 1-ton reduction in mobile NOx
emissions (red trace), and a 1-ton reduction in direct mobile PM10 emissions (green trace).
Figure A.2: CMAQ model times series for 24-hr PM2.5 concentrations for 2015 Base Emissions, 1-ton reduction in mobile NOx
emissions (red trace), and a 1-ton reduction in direct mobile PM2.5 emissions (green trace).
PM10/NOx Ratio = 5.7024
9

ITEM 6

State of Utah
GARY R. HERBERT Governor
SPENCER J. COX
Lieutenant Governor
Department of Environmental Quality
Amanda Smith
Executive Director
DIVISION OF AIR QUALITY Bryce C. Bird
Director
DAQ-008-15
M E M O R A N D U M TO: Air Quality Board THROUGH: Bryce C. Bird, Executive Secretary FROM: Colleen Delaney, Environmental Scientist DATE: February 19, 2015 SUBJECT: PROPOSE FOR PUBLIC COMMENT: Amend Utah State Implementation Plan Section
XX.D.6. Regional Haze. Long-Term Strategy for Stationary Sources. Best Available Retrofit Technology (BART) Assessment for NOx and PM; add new Utah State Implementation Plan Subsections IX.H.21 and 22. General Requirements: Control Measures for Area and Point Sources, Emission Limits and Operating Practices, Regional Haze Requirements; and Source Specific Emission Limitations: Regional Haze Requirements, Best Available Retrofit Technology.
______________________________________________________________________________________ On October 1, 2014, the Air Quality Board proposed a revision to Utah’s Regional Haze State Implementation Plan (SIP) to address the Environmental Protection Agency’s partial disapproval of the Best Available Retrofit Technology (BART) provisions for nitrogen oxides (NOx) and particulate matter (PM). The proposed change to the SIP maintained the BART determination that had been established in 2008 and also made enforceable the planned closure of the PacifiCorp Carbon plant this spring due to the substantial reduction in visibility impairing pollutants that would be achieved. The proposal was based on a 5-factor analysis of available control technologies for NOx and PM and visibility modeling that had been completed by PacifiCorp in 2012. The Division of Air Quality (DAQ) analysis concluded that the most stringent PM controls were already required and the NOx controls established in the 2008 SIP were cost-effective and met the presumptive BART requirements established by EPA. Additional NOx controls were not warranted due to the very high cost of control and uncertainty regarding the visibility improvement that would occur. The significant NOx reductions required by the 2008 SIP did not result in improvements in nitrate values during the winter months as expected and the benefit of further NOx reductions is therefore uncertain. Sulfur dioxide (SO2) reductions have resulted in improvements in sulfate values throughout the year. DAQ completed additional visibility modeling after the proposal to evaluate the visibility improvement due to all of the reductions, including the closure of the Carbon Plant, and the results of this modeling were added to the technical support documentation for the proposal in November for public review.
195 North 1950 West • Salt Lake City, Utah Mailing Address: P.O. Box 144820 • Salt Lake City, Utah 84114-4820
Telephone (801) 536-4000 • Fax (801) 536-4099 • T.D.D. (801) 536-4414 www.deq.utah.gov
Printed on 100% recycled paper

DAQ-008-15 Page 2 A public comment period was held from November 1 through December 22, 2014, and a number of public comments were received. After reviewing the comments and consulting with EPA, DAQ staff determined that the additional emission reductions due to the expected closure of the Carbon Plant would be better addressed as an alternative to BART under 40 CFR 51.308(e)(2) rather than through the case-by-case analysis under 40 CFR 51.308(1). In addition, commenters identified several issues with DAQ’s visibility modeling that have been addressed. For these reasons, DAQ staff prepared a new proposal to ensure adequate public review of these changes.
1. The SIP has been revised to explicitly identify an alternative to BART for NOx that keeps in place the current NOx emission limits for PacifiCorp Hunter 1 and 2 and PacifiCorp Huntington 1 and 2 that are more stringent than EPA’s presumptive BART limits; makes enforceable the expected closure of PacifiCorp Carbon 1 and 2; and takes credit for the installation of low-NOx burners at PacifiCorp Hunter 3 in 2008.
2. A demonstration that the alternative to BART will achieve greater reasonable progress than BART is attached and will be included in the technical support documentation for the SIP. Combined emissions of NOx, SO2 and PM will be 2,856 tons/yr lower under the alternative program than would be achieved by the most stringent technology available to reduce NOx from the sources subject to BART. Visibility modeling shows that the alternative will provide visibility improvement on a greater number of days, greater average improvement, and greater improvement on the 90th percentile day. Reductions under the alternative were also achieved earlier than was required by the rule.
3. Enforceable emission limits for the alternative to BART have been added to SIP Section IX, Part H.21 and H.22.
Staff Recommendation: Staff recommends that the Board propose the revision to SIP Section XX, Part D.6 and new SIP Sections IX, Part H.21 and H.22 for public comment.

SIP Section XX.D.6 February 17, 2015
1 2 3
Utah State Implementation Plan 4
5
Section XX 6
7
Regional Haze 8
9 10
Addressing Regional Haze Visibility Protection for the Mandatory Federal Class I 11 Areas Required Under 40 CFR 51.309 12
13 14 15 16 17 18 19 20 21 22 23 24 25 26 27 28 29 30 31 32 33
34 Adopted by the Air Quality Board 35
[April 6, 2011]June 3, 201536

SIP Section XX.D.6 February 17, 2015
1

SIP Section XX.D.6 February 17, 2015
1
2
3
4
5
6
7 8
6. Best Available [Control]Retrofit Technology (BART) 9 Assessment for NOx and PM. 10
a. Regional Haze Rule BART Requirements 11
Pursuant to 40 CFR 51.309(d)(4)(vii), certain major stationary sources are required to 12 evaluate, install, operate and maintain BART technology or an approved BART 13 alternative for NOx and PM emissions. [BART requirements can be addressed through a 14 case-by-case review under 40 CFR 51.308(e)(1) or through an alternative program under 15 40 CFR 51.308(e)(2). ]The State of Utah has chosen to evaluate BART for [NOx and 16 ]PM under the case-by-case provisions of 40 CFR 51.308(e)(1) and BART for NOx 17 through alternative measures under 40 CFR 51.308(e)(2). BART for SO2 is addressed 18 through an alternative program under 40 CFR 51.309 that is described in Part E of this 19 plan. 20 21
b. BART for Particulate Matter 22
EPA issued guidelines for case-by-case BART determinations on July 6, 2005 that are 23 codified in Appendix Y to 40 CFR Part 51. These guidelines establish a three step 24 process. 25
• States identify sources which meet the definition of BART eligible 26 • States determine which BART eligible sources are “subject to BART” 27 • For each source subject to BART States identify the appropriate control 28
technology. 29 30
[The determination of NOx limits for fossil-fuel fired power plants having a total 31 generating capacity greater than 750 megawatts must be made pursuant to the guidelines 32 in 40 CFR 51 Appendix Y, Section E.5. 1] 33
[CFR Part 51 Appendix Y Guidelines for BART Determinations under the Regional Haze Rule (70 FR 39158)]
20

SIP Section XX.D.6 February 17, 2015
(1) BART-Eligible Sources. 1 2 BART-eligible sources are those sources that fall within one of 26 specific source 3 categories, were built during the 15-year window of time from 1962 to 1977, and have 4 potential emissions of at least 250 tons per year of any visibility impairing air pollutant 5 (40 CFR 51.301). Pursuant to 40 CFR 51.308 (e)(1)(i) a State is required to list all 6 BART-eligible sources within the State. 7 8 Four BART-eligible electric generating units have been identified in the State of Utah: 9 PacifiCorp’s Hunter Units 1 and 2 and Huntington Units 1 and 2. The units are located at 10 fossil-fuel fired steam electric plants of more than 250 million Btu per hour heat input, 11 one of the 26 specific BART source categories. The units have potential emissions greater 12 than 250 tons per year of a visibility impairing pollutant. The units had commenced 13 construction within the BART time frame of August 7, 1962 to August 7, 1977. 14 15 Table 3. BART-Eligible Sources in Utah. 16
SOURCE UNIT
ID SERVICE
DATE
NET DEPENDABLE
CAPACITY (MWn)
BART CATEGORY COAL TYPE
BOILER TYPE
Hunter 1 1978 430 Fossil fuel fired Bituminous Tangential Hunter 2 1980 430 Fossil fuel fired Bituminous Tangential
Huntington 1 1977 430 Fossil fuel fired Bituminous Tangential Huntington 2 1974 430 Fossil fuel fired Bituminous Tangential
17 Note: Hunter Unit 3 commenced construction after 1977 and is therefore not BART-eligible. 18 19
(2) Sources Subject to BART 20 21 Pursuant to 40 CFR 51.308(e)(1)(ii) the State is required to determine which BART-22 eligible sources are also “subject to BART.” BART-eligible sources are subject to BART 23 if they emit any air pollutant that may reasonably be anticipated to cause or contribute to 24 any impairment of visibility in any mandatory Class I Federal area. 25 26 PacifiCorp’s Hunter Units 1 and 2 and Huntington Units 1 and 2 were determined by the 27 State to be subject to BART. The State utilized the technical modeling services of the 28 WRAP Regional Modeling Center (RMC). Modeling was performed according to the 29 RMC modeling protocols2. For the WRAP BART exemption screening modeling, the 30 RMC followed the EPA BART Guidelines in 40 CFR 51, Appendix Y and the applicable 31 CALMET/CALPUFF modeling guidance (e.g., IWAQM, 1998; FLAG, 2000; EPA, 32
2 CALMET/CALPUFF Protocol for BART Exemption Screening Analysis for Class I Areas in the Western United States
21

SIP Section XX.D.6 February 17, 2015
2003c) including EPA’s March 16, 2006 memorandum: “Dispersion Coefficients for 1 Regulatory Air Quality Modeling in CALPUFF”.3 2 3 The basic assumptions of the WRAP BART CALMET/CALPUFF modeling protocols 4 are as follows: 5
• Three years of modeling (2001, 2002 and 2003) were used. 6 • Visibility impacts due to emissions of SO2, NOx and primary PM emissions were 7
calculated 8 • Visibility was calculated using the Original IMPROVE equation and Annual 9
Average Natural Conditions. 10 • The effective range of CALPUFF modeling was set at 300km from the sources 11 • For pre-control modeling, maximum 24-hour average actual emissions from the 12
Acid Rain database were used in CALPUFF model. 13 • [For post-control modeling, expected New Source Review (NSR) permitted limits 14
were used in the CALPUFF model.] 15 16 According to 40 CFR Part 51, Appendix Y, a BART-eligible source is considered to 17 “contribute” to visibility impairment in a Class I area if the modeled 98th percentile 18 change in deciviews is equal to or greater than the “contribution threshold.” The State of 19 Utah evaluated BART exemption screening modeling results at the EPA-suggested 20 contribution threshold of 0.5 deciviews within a 300 Km radius of the BART-eligible 21 sources.4 BART-eligible sources Hunter Unit 1, Hunter Unit 2, Huntington Unit 1, and 22 Huntington Unit 2 had a modeled impact greater than the threshold level of 0.5 change in 23 deciviews in at least one of the seven Class I areas within a 300 km radius of the sources. 24 25
3 Atkinson and Fox, 2006
4 WRAP RMC BART Modeling for Utah Draft #6 April 21, 2007
22
SIP Section XX.D.6 February 17, 2015
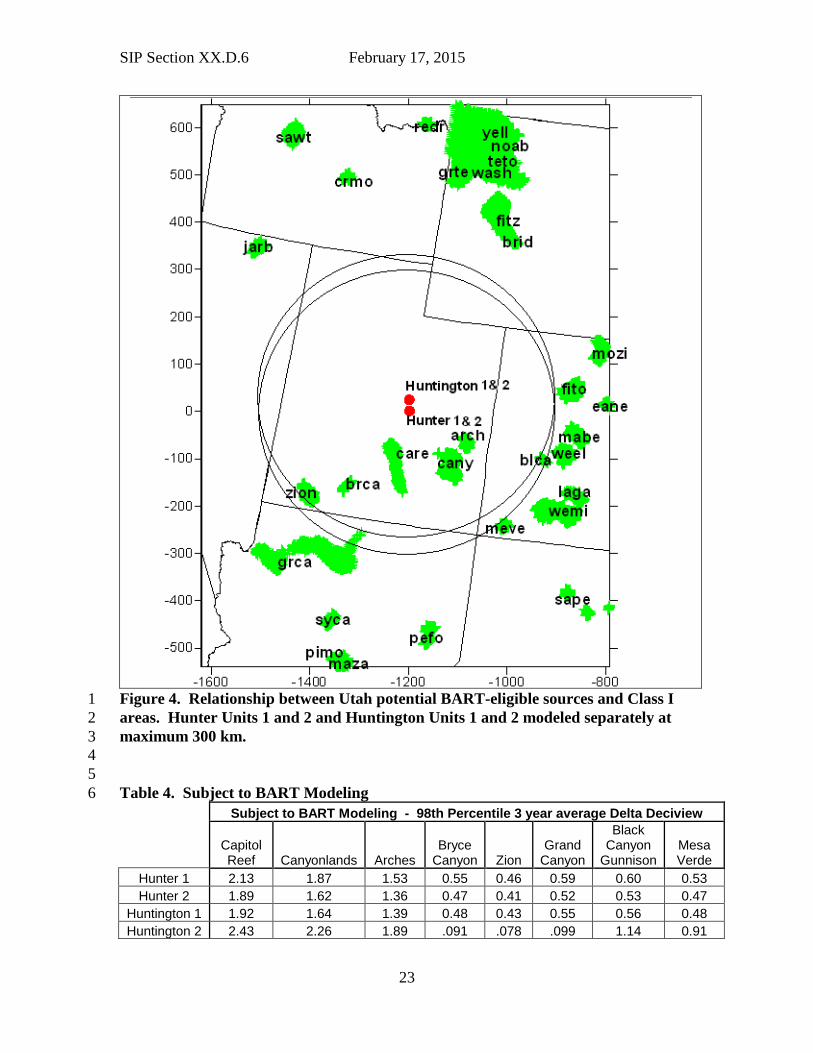
Figure 4. Relationship between Utah potential BART-eligible sources and Class I 1 areas. Hunter Units 1 and 2 and Huntington Units 1 and 2 modeled separately at 2 maximum 300 km. 3 4 5 Table 4. Subject to BART Modeling 6
Subject to BART Modeling - 98th Percentile 3 year average Delta Deciview
Capitol Reef Canyonlands Arches
Bryce Canyon Zion
Grand Canyon
Black Canyon
Gunnison Mesa Verde
Hunter 1 2.13 1.87 1.53 0.55 0.46 0.59 0.60 0.53 Hunter 2 1.89 1.62 1.36 0.47 0.41 0.52 0.53 0.47
Huntington 1 1.92 1.64 1.39 0.48 0.43 0.55 0.56 0.48 Huntington 2 2.43 2.26 1.89 .091 .078 .099 1.14 0.91
23

SIP Section XX.D.6 February 17, 2015
1 (3) BART [Determination]Analysis 2
3 As required under 51.308 (e)(1)(A) the determination of BART must be based on an 4 analysis of the best system of continuous emission control technology available. In the 5 analysis the State must take in to account five factors: 6
• Available technology 7 • Costs of compliance 8 • Energy and non-air quality environmental impacts 9 • Existing control equipment and the remaining useful life of the facility 10 • The degree of improvement in visibility reasonably anticipated to result from 11
the use of such technology 12 13
In 2008, Utah determined that BART for PM was the replacement of existing electrostatic 14 precipitators with pulse-jet fabric filter baghouses with a PM emission rate of 0.015 15 lb/MMBtu at all four EGUs that were subject-to-BART. PacifiCorp installed the control 16 technology, as required, and significant emission reductions of PM were achieved. On 17 December 12, 2012, the EPA disapproved Utah’s BART determination for PM after 18 concluding that Utah did not submit an adequate 5-factor analysis as required by the 19 BART Rule. In June 2012, PacifiCorp provided a new 5-factor analysis for each of the 20 four subject to BART EGUs. On August 4, 2014, PacifiCorp provided additional 21 information to supplement that analysis. DAQ reviewed the analysis, and determined that 22 the required controls for PM were the most stringent controls available. 23 24
(4) BART Determination for PM 25 26 Appendix Y allows a streamlined 5-factor analysis when the most stringent controls are 27 already required. 28 29
“If you find that a BART source has controls already in place which are 30 the most stringent controls available (note that this means that all possible 31 improvements to any control devices have been made), then it is not 32 necessary to comprehensively complete each following step of the BART 33 analysis in this section. As long as these most stringent controls available 34 are made federally enforceable for the purpose of implementing BART for 35 that source, you may skip the remaining analyses in this section, including 36 the visibility analysis in step 5. Likewise, if a source commits to a BART 37 determination that consists of the most stringent controls available, then 38 there is no need to complete the remaining analyses in this section.” (40 39 CFR Part 51, Appendix Y, Section D.9) 40 41
Because the most stringent technology is in place and the PM emission rates have been 42 made enforceable in SIP Section IX Part H.21 and H.22, no further analysis is required. 43 44
24

SIP Section XX.D.6 February 17, 2015
c. BART for NOx 1
2 BART for NOx is addressed through alternative measures as provided under 40 CFR 3 51.308(e)(2). The following emission reduction measures are required, and are made 4 enforceable through emission limits established in Section IX, Part H.21 and H.22 of the 5 State Implementation Plan. 6 7
• PacifiCorp Hunter Units 1 and 2 and Huntington Units 1 and 2: The replacement 8 of existing, first generation low-NOx burners with Alstom TSF 2000TM low-NOx 9 firing system and installation of two elevations of separated overfire air with an 10 emission limit of 0.26 lb/MMBtu. 11
12 • PacifiCorp Hunter Unit 3: The replacement of existing, first generation low-NOx 13
burners with improved low-NOx burners with overfire air with an emission limit 14 of 0.34 lb/MMBtu. 15
16 • PacifiCorp Carbon Units 1 and 2: PacifiCorp shall permanently retire Carbon 17
Units 1 and 2 by August 15, 2015. 18 19 40 CFR 51.308(e)(2) requires an analysis to demonstrate that the alternative measures 20 achieve greater reasonable progress than would be achieved through the installation and 21 operation of BART. This demonstration is included in the TSD5. Combined emissions 22 of NOx, SO2, and PM10 will be 2,876 tons/yr lower under the alternative than the most-23 stringent BART scenario for NOx, visibility will improve on a greater number of days 24 under the alternative, and the average deciview impairment and 90th percentile deciview 25 impairment will be better under the alternative. 26 27
d. BART Summary 28
29 The BART emission rates for NOx and PM are summarized in Table 5. While Utah has 30 chosen to meet the NOx BART requirement through alternative measures established in 31 Section XX Part D.6 of the SIP, and the SO2 BART requirement through an alternative to 32 BART program established in Section XX Part E of the SIP, the enforceable emission 33 rates for both NOx and SO2 established in the approval orders and in the SIP for the four 34 EGUs also meet the presumptive emission rates for both NOx and SO2 established in 35 Appendix Y independently of the alternative programs. 36 37
5 Review of 2008 BART Determination and Recommended Alternative to BART for NOx, Utah Division of Air Quality, February 13, 2015.
25

SIP Section XX.D.6 February 17, 2015
Table 5. Emission Rates for the Retrofitted Hunter and Huntington Units 1
2 [PacifiCorp has installed or has received permits to install the following retrofit control 3 equipment at the Hunter Unit 1, Hunter Unit 2, Huntington Unit 1, and Huntington Unit 2 4 fossil fuel fired electric generating units (EGU):] 5 6 Hunter Units 1 and 2: 7
• Conversion of existing electrostatic precipitators to pulse jet fabric filter bag-8 houses 9
• The replacement of existing, first generation low-NOx burners with Alstom TSF 10 2000TM low-NOx firing system and installation of two elevations of separated 11 overfire air. 12
• Upgrade of existing flue gas desulfurization system to > 90% sulfur dioxide 13 removal. 14
15 Huntington Units 1 and 2: 16
• Conversion of existing electrostatic precipitators to pulse jet fabric filter bag-17 houses 18
• The replacement of existing, first generation low-NOx burners with Alstom TSF 19 2000TM low-NOx firing system and installation of two elevations of separated 20 overfire air. 21
• Installation of a new wet-lime, flue gas de-sulfurization system at Unit 2 (FGD). 22 • Upgrade of existing flue gas desulfurization system to > 90% sulfur dioxide 23
removal at Unit 1.] 24
6 Utah Division of Air Quality Approval Orders: Huntington Unit 2 - AN0238012-05, Huntington Unit 1 - DAQE-AN0102380019-09 (note – on January 19, 2010 an administrative amendment was made to the 2009 AO), Hunter Units I and 2 - DAQE-AN0102370012-08, and Section IX Part H.21 and H.22 of the SIP.
7 40 CFR Part 51 Appendix Y Guidelines for BART Determinations under the Regional Haze Rule (70 Federal Register 39135)
Units Utah Permitted Rates6 Presumptive BART Limits7
SO2
lb/MMBtu NOx
lb/MMBtu PM
lb/MMBtu SO2
lb/MMBtu NOx
lb/MMBtu Hunter 1 0.12 0.26 0.015 0.15 0.28 Hunter 2 0.12 0.26 0.015 0.15 0.28 Hunter 3 0.34
Huntington 1 0.12 0.26 0.015 0.15 0.28 Huntington 2 0.12 0.26 0.015 0.15 0.28
26
SIP Section XX.D.6 February 17, 2015
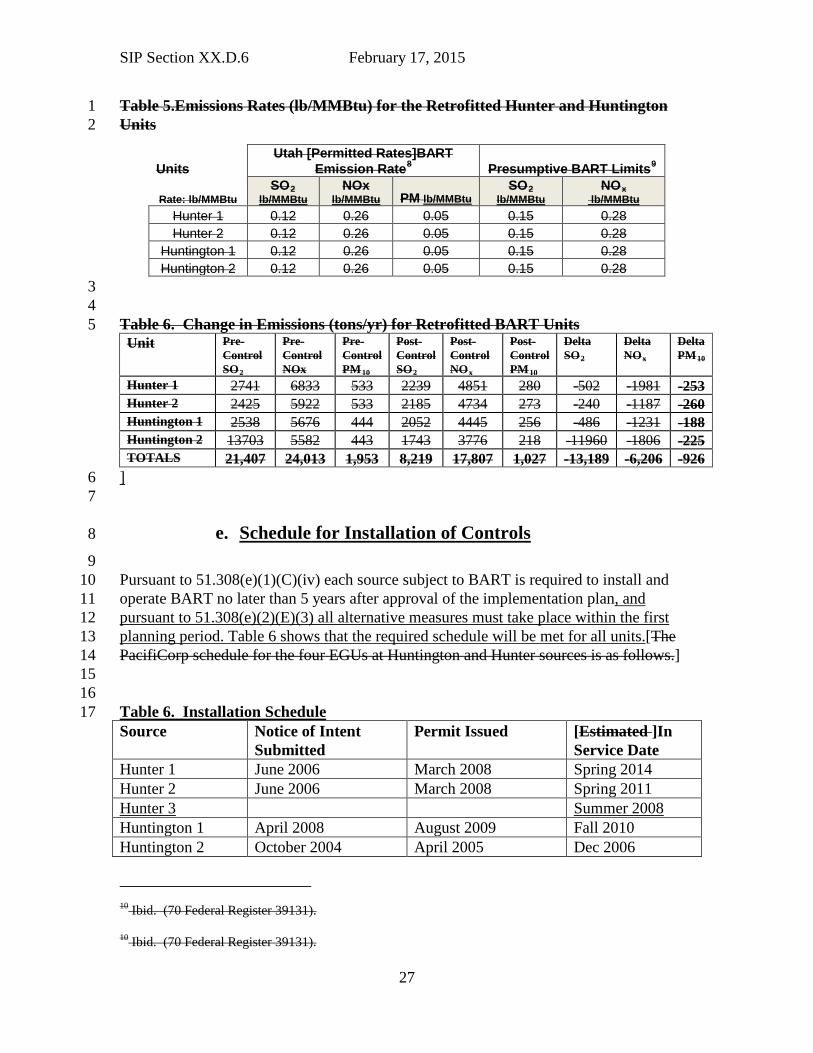
Table 5.Emissions Rates (lb/MMBtu) for the Retrofitted Hunter and Huntington 1 Units 2
3 4 Table 6. Change in Emissions (tons/yr) for Retrofitted BART Units 5 Unit Pre-
Control SO2
Pre-Control NOx
Pre-Control PM10
Post-Control SO2
Post-Control NOx
Post-Control PM10
Delta SO2
Delta NOx
Delta PM10
Hunter 1 2741 6833 533 2239 4851 280 -502 -1981 -253 Hunter 2 2425 5922 533 2185 4734 273 -240 -1187 -260 Huntington 1 2538 5676 444 2052 4445 256 -486 -1231 -188 Huntington 2 13703 5582 443 1743 3776 218 -11960 -1806 -225 TOTALS 21,407 24,013 1,953 8,219 17,807 1,027 -13,189 -6,206 -926
] 6 7
e. Schedule for Installation of Controls 8
9 Pursuant to 51.308(e)(1)(C)(iv) each source subject to BART is required to install and 10 operate BART no later than 5 years after approval of the implementation plan, and 11 pursuant to 51.308(e)(2)(E)(3) all alternative measures must take place within the first 12 planning period. Table 6 shows that the required schedule will be met for all units.[The 13 PacifiCorp schedule for the four EGUs at Huntington and Hunter sources is as follows.] 14 15 16 Table 6. Installation Schedule 17 Source Notice of Intent
Submitted Permit Issued [Estimated ]In
Service Date Hunter 1 June 2006 March 2008 Spring 2014 Hunter 2 June 2006 March 2008 Spring 2011 Hunter 3 Summer 2008 Huntington 1 April 2008 August 2009 Fall 2010 Huntington 2 October 2004 April 2005 Dec 2006
10 Ibid. (70 Federal Register 39131).
10 Ibid. (70 Federal Register 39131).
Units Utah [Permitted Rates]BART
Emission Rate8 Presumptive BART Limits9
Rate: lb/MMBtu SO2
lb/MMBtu NOx
lb/MMBtu PM lb/MMBtu SO2
lb/MMBtu NOx
lb/MMBtu Hunter 1 0.12 0.26 0.05 0.15 0.28 Hunter 2 0.12 0.26 0.05 0.15 0.28
Huntington 1 0.12 0.26 0.05 0.15 0.28 Huntington 2 0.12 0.26 0.05 0.15 0.28
27

SIP Section XX.D.6 February 17, 2015
Carbon 1 Shut down August 2015
Carbon 2 Shut down August 2015
1 [EPA under the BART Rule requires coal-fired electric generating plants of greater than 2 750 MW to meet BART presumptive limits. While EPA considers presumptive limits to 3 be appropriate for all coal-fired power plants greater than 750 MW, the State may 4 establish different requirements if the State can demonstrate that an alternative is justified 5 based on a consideration of the five BART factors. 6 7
“States, as a general matter, must require owners and operators of greater than 750 8 MW power plants to meet these BART emission limits… a State may establish 9 different requirements if the State can demonstrate that an alternative 10 determination is justified based on a consideration of the five statutory factors.”10 11
12 “For Coal-fired EGU’s greater than 200 MW located at greater than 750 MW 13 power plants and operating without post-combustion controls (i.e. SCR or 14 SNCR), we have provided presumptive NOx limits, differentiated by boiler design 15 and type of coal burned. You may determine that an alternative control level is 16 appropriate based on careful consideration of the statutory factors.” (Appendix Y 17 Part 51 – IV (E)(5).11 18
19 EPA determined presumptive limits for SO2 and NOx for EGUs based on a methodology 20 equivalent to that required in 50 CFR 51 Appendix Y for BART Rule. The EPA 21 determination of presumptive limits included: 22
• Identification of all potential BART-eligible EGUs (all BART-eligible 23 EGU’s were assumed to be Subject to BART) 24
• Technical analyses and industry research to determine applicable and 25 appropriate SO2 and NOx control options, 26
• Economic analysis to determine cost effectiveness for each potentially 27 BART-eligible EGU 28
• Evaluation of historical emissions and forecast emission reductions for 29 each potentially BART-eligible EGU12. 30
• NOx and SO2 CALPUFF modeling of emission impacts at model Class I 31 area. 32
33 The analysis included 491 potential BART EGUs including Hunter Units 1 and 2 34 and Huntington Units 1 and 2. The technical analysis conducted by EPA to 35
10 Ibid. (70 Federal Register 39131).
11 70 Federal Register 39171
12 Ibid. (70 Federal Register 39134)
28

SIP Section XX.D.6 February 17, 2015
determine presumptive BART limits for SO2 and NOx is in effect a BART 1 determination analysis for 419 EGUs including Hunter Units 1 and 2 and 2 Huntington Units 1 and 2.13 3
4 Section IV (E) (5) of Appendix Y Part 51 clearly requires the implementation of 5 presumptive NOx limits for coal-fired EGU’s greater than 200 MW located at greater 6 than 750 MW power plants. Under Appendix Y, states are given the discretion to 7 challenge presumptive limits through a five factor analysis, but presumptive limits were 8 developed by EPA as a reasonable, equivalent and mandated substitution for a five factor 9 analysis.14 10 ] 11 Utah’s long-standing Prevention of Significant Deterioration (PSD) permitting program 12 (SIP Section VII and R307-405), New Source Review permitting program (SIP Section II 13 and R307-401) and Visibility program (SIP section XVII and R307-406) will continue to 14 protect Class I area visibility by ensuring that the BART emission rates established in Part 15 H.21 and H.22 of this plan are maintained, requiring best available control technology for 16 new sources, and assuring that there is not a significant degradation in visibility at Class I 17 areas due to new or modified major sources. 18
13 “Methodology for Developing BART NOx Presumptive Limits” EPA Clean Air Market Division June 15, 2005 HQ-OAR-2002-0076-0445 and “Technical Support Document for BART NOx Limits for Electric Generating Units Excel Spreadsheet, Memorandum April 15, 2005 HQ-OAR-2002-0076-0369
14 CFR Part 51 Appendix Y Guidelines for BART Determinations under the Regional Haze Rule (70 Federal Register 39171)
29

Page 1 of 6 SIP Section IX.H.21 and 22 February 17, 2015
1
2
Utah State Implementation Plan 3
4
Emission Limits and 5
Operating Practices 6
7
8
Section IX, Part H 9
10
11
12
13
14
15
16
17
18
19
20
21
22
23
24
25
26
27
28
29
30
Adopted by the Air Quality Board [December 3, 2014]June 3, 2015 31
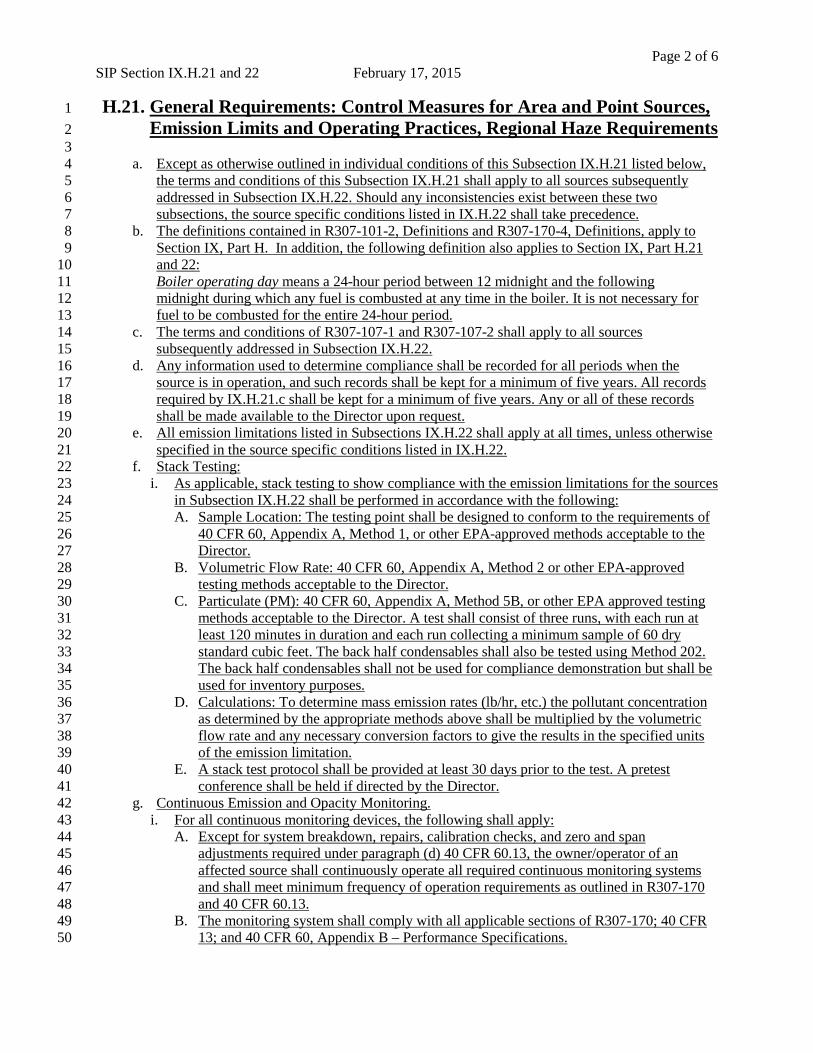
Page 2 of 6 SIP Section IX.H.21 and 22 February 17, 2015
H.21. General Requirements: Control Measures for Area and Point Sources, 1
Emission Limits and Operating Practices, Regional Haze Requirements 2 3
a. Except as otherwise outlined in individual conditions of this Subsection IX.H.21 listed below, 4 the terms and conditions of this Subsection IX.H.21 shall apply to all sources subsequently 5 addressed in Subsection IX.H.22. Should any inconsistencies exist between these two 6 subsections, the source specific conditions listed in IX.H.22 shall take precedence. 7
b. The definitions contained in R307-101-2, Definitions and R307-170-4, Definitions, apply to 8 Section IX, Part H. In addition, the following definition also applies to Section IX, Part H.21 9 and 22: 10 Boiler operating day means a 24-hour period between 12 midnight and the following 11 midnight during which any fuel is combusted at any time in the boiler. It is not necessary for 12 fuel to be combusted for the entire 24-hour period. 13
c. The terms and conditions of R307-107-1 and R307-107-2 shall apply to all sources 14 subsequently addressed in Subsection IX.H.22. 15
d. Any information used to determine compliance shall be recorded for all periods when the 16 source is in operation, and such records shall be kept for a minimum of five years. All records 17 required by IX.H.21.c shall be kept for a minimum of five years. Any or all of these records 18 shall be made available to the Director upon request. 19
e. All emission limitations listed in Subsections IX.H.22 shall apply at all times, unless otherwise 20 specified in the source specific conditions listed in IX.H.22. 21
f. Stack Testing: 22 i. As applicable, stack testing to show compliance with the emission limitations for the sources 23
in Subsection IX.H.22 shall be performed in accordance with the following: 24 A. Sample Location: The testing point shall be designed to conform to the requirements of 25
40 CFR 60, Appendix A, Method 1, or other EPA-approved methods acceptable to the 26 Director. 27
B. Volumetric Flow Rate: 40 CFR 60, Appendix A, Method 2 or other EPA-approved 28 testing methods acceptable to the Director. 29
C. Particulate (PM): 40 CFR 60, Appendix A, Method 5B, or other EPA approved testing 30 methods acceptable to the Director. A test shall consist of three runs, with each run at 31 least 120 minutes in duration and each run collecting a minimum sample of 60 dry 32 standard cubic feet. The back half condensables shall also be tested using Method 202. 33 The back half condensables shall not be used for compliance demonstration but shall be 34 used for inventory purposes. 35
D. Calculations: To determine mass emission rates (lb/hr, etc.) the pollutant concentration 36 as determined by the appropriate methods above shall be multiplied by the volumetric 37 flow rate and any necessary conversion factors to give the results in the specified units 38 of the emission limitation. 39
E. A stack test protocol shall be provided at least 30 days prior to the test. A pretest 40 conference shall be held if directed by the Director. 41
g. Continuous Emission and Opacity Monitoring. 42 i. For all continuous monitoring devices, the following shall apply: 43
A. Except for system breakdown, repairs, calibration checks, and zero and span 44 adjustments required under paragraph (d) 40 CFR 60.13, the owner/operator of an 45 affected source shall continuously operate all required continuous monitoring systems 46 and shall meet minimum frequency of operation requirements as outlined in R307-170 47 and 40 CFR 60.13. 48
B. The monitoring system shall comply with all applicable sections of R307-170; 40 CFR 49 13; and 40 CFR 60, Appendix B – Performance Specifications. 50

Page 3 of 6 SIP Section IX.H.21 and 22 February 17, 2015
C. For any hour in which fuel is combusted in the unit, the owner/operator of each unit 1 shall calculate the hourly average NOx concentration in lb/MMBtu. 2
D. At the end of each boiler operating day, the owner/operator shall calculate and record a 3 new 30-day rolling average emission rate in lb/MMBtu from the arithmetic average of 4 all valid hourly emission rates from the CEMS for the current boiler operating day and 5 the previous 29 successive boiler operating days. 6
E. An hourly average NOx emission rate in lb/MMBtu is valid only if the minimum 7 number of data points, as specified in R307-170, is acquired by the owner/operator for 8 both the pollutant concentration monitor (NOx) and the diluent monitor (O2 or CO2). 9
10

Page 4 of 6 SIP Section IX.H.21 and 22 February 17, 2015
H.22. Source Specific Emission Limitations: Regional Haze Requirements, Best Available Retrofit Technology
a. PacifiCorp Hunter
i. Particulate Limitations on Units #1 and #2
A. Emissions of particulate (PM) shall not exceed 0.015 lb/MMBtu heat input from each
boiler based on a 3-run test average.
B. Stack testing for the emission limitation shall be performed each year on each boiler.
C. Monitoring for PM shall be conducted in accordance with the compliance assurance monitoring requirements of 40 CFR 64 as detailed in the source’s operating permit.
ii. NOx Limitations on Units #1 and #2
A. Emissions of NOx from each boiler shall not exceed 0.26 lb/MMBtu heat input for a 30-
day rolling average.
B. Measuring of all NOx emissions shall be performed by CEM.

Page 5 of 6 SIP Section IX.H.21 and 22 February 17, 2015
b. PacifiCorp Huntington
i. Particulate Limitations on Units #1 and #2
A. Emissions of particulate (PM) shall not exceed 0.015 lb/MMBtu heat input from each boiler based on a 3-run test average.
B. Stack testing for the emission limitation shall be performed each year on each boiler.
C. Monitoring for PM shall be conducted in accordance with the compliance assurance monitoring requirements of 40 CFR 64 as detailed in the source’s operating permit.
ii. NOx Limitations on Units #1 and #2
A. Emissions of NOx from each boiler shall not exceed 0.26 lb/MMBtu heat input for a 30-
day rolling average.
B. Measuring of all NOx emissions shall be performed by CEM.

Page 6 of 6 SIP Section IX.H.21 and 22 February 17, 2015
c. PacifiCorp Carbon
i. Conditions on Units #1 and #2 A. The owner/operator shall permanently close Carbon units #1 and #2 by August 15,
2015. B. The owner/operator shall rescind Operating Permit # 700002004 by no later than
December 31, 2015.
Review of 2008 PM BART Determination and
Recommended Alternative to BART for NOx
Utah Division of Air Quality
February 13, 2015
I. Purpose
On December 14, 2012, the Environmental Protection Agency (EPA) disapproved the Best Available Retrofit Technology (BART) determination for nitrogen oxides (NOx) and particulate matter (PM) that was adopted in Utah’s 2008 Regional Haze State Implementation Plan (RH SIP). The purpose of this analysis is to provide additional documentation to support the 2008 BART determination for PM and to recommend an alternative to BART for NOx that will provide greater visibility improvement than would be achieved through the installation of the most stringent NOx controls on the four electrical generating units (EGU) that are subject to BART.
II. History
Utah’s RH SIP, originally adopted in 2003, was based on the recommendations of the Grand Canyon Visibility Transport Commission (GCVTC). The GCVTC evaluated haze at Class I Areas on the Colorado Plateau, and determined that stationary source reductions should be focused on sulfur dioxide (SO2) because it is the pollutant that has the most significant impact on haze on the Colorado Plateau. Utah’s 2008 BART determination was developed within the context of the overall SIP and reflected this focus on SO2. Figure 1 shows the contributions of various species to visibility impairment at Canyonlands National Park. As can be seen, sulfate (ammSO4) is the most significant contributor to haze. Fire (OMC) and dust (CM) are also a significant components but the impact is variable from year to year.
1

Figure 1. Speciated Annual Average Light Extinction at Canyonlands.
Utah’s 2003 RH SIP included SO2 emission milestones with a backstop regulatory trading program to ensure that SO2 emissions in the transport region decreased substantially between 2003 and 2018. The milestones were adjusted in 2008 and 2011 to reflect changes in the number of states participating in the regional program. Actual SO2 emissions decreased by 51% between 2003 and 2013 in the current 3-state region, and in 2013 were significantly below the 2018 milestone in Utah’s RH SIP (See Figure 2).
Figure 2. SO2 Milestones and Emission Trends
2

While Utah’s RH SIP is focused on achieving SO2 reductions from stationary sources, substantial reductions in nitrogen oxide (NOx) emissions will also occur from stationary sources as well as mobile and non-road sources. Figure 3 shows the projected decrease in NOx emissions between 2002 and 2018 as documented in Section K of Utah’s 2008 RH SIP.1
Figure 3. Utah RH SIP Expected NOx Reductions 2002-2018.
A. BART Determination in 2008 RH SIP On September 3, 2008, the Utah Air Quality Board adopted a revision to Utah’s RH SIP to include Best Available Retrofit Technology (BART) requirements for NOx and particulate matter (PM) as required by 40 CFR 51.309(d)(4)(vii). PacifiCorp’s Hunter Unit 1, Hunter Unit 2, Huntington Unit 1, and Huntington Unit 2 fossil fuel fired electric generating units (EGUs) were determined to be subject to BART. The 2008 RH SIP required PacifiCorp to install the following BART controls at these EGUs:
Hunter Units 1 and 2:
• Conversion of existing electrostatic precipitators to pulse jet fabric filter bag-houses. • The replacement of existing, first generation low-NOx burners with Alstom TSF 2000TM low-NOx
firing system and installation of two elevations of separated overfire air. • Upgrade of existing flue gas desulfurization system to > 90% sulfur dioxide removal.
1 WRAP Plan 02d and PRP 18b inventory (PRP 18a mobile) http://vista.cira.colostate.edu/TSS/Results/Emissions.aspx
3

Huntington Units 1 and 2:
• Conversion of existing electrostatic precipitators to pulse jet fabric filter bag-houses. • The replacement of existing, first generation low-NOx burners with Alstom TSF 2000TM low-NOx
firing system and installation of two elevations of separated overfire air. • Installation of a new wet-lime, flue gas de-sulfurization system at Unit 2 (FGD). • Upgrade of existing flue gas desulfurization system to > 90% sulfur dioxide removal at Unit 1.
The emission rates established in the 2008 RH SIP for Hunter Units 1 and 2 and Huntington Units 1 and 2 were more stringent than the presumptive BART emission rates for SO2 and NOx established in 40 CFR Part 51 Appendix Y, Guidelines for BART Determinations under the Regional Haze Rule as shown in Table 1. (Note, Table 1 corrects a typographical error in Table 5 of the RH SIP where the permitted rate for PM was listed as 0.05 lb/MMBtu when it should have been 0.015 lb/MMBtu, the limit established in the approval orders for each of the units.)
Table 1. BART Emission Rates in Utah's 2008 SIP
Units Utah Permitted Rates2 Presumptive BART Limits3 Year of Installation
Rate: lb/MMBtu SO2a NOxa PM SO2 NOx
Hunter 1 0.12 0.26 0.015 0.15 0.28 2014
Hunter 2 0.12 0.26 0.015 0.15 0.28 2011
Huntington 1 0.12 0.26 0.015 0.15 0.28 2010
Huntington 2 0.12 0.26 0.015 0.15 0.28 2006
a30-day rolling average
2 Utah Division of Air Quality Approval Orders: Huntington Unit 2 - AN0238012-05, Huntington Unit 1 - DAQE-AN0102380019-09 (note – on January 19, 2010 an administrative amendment was made to the 2009 AO), Hunter Units I and 2 - DAQE-AN0102370012-08.
3 40 CFR Part 51 Appendix Y Guidelines for BART Determinations under the Regional Haze Rule (70 Federal Register 39135)
4

B. Partial Approval, Partial Disapproval of Utah’s Regional Haze SIP On December 14, 2012, EPA approved the majority of Utah’s Regional Haze SIP but disapproved Utah’s BART determinations for NOx and PM for PacifiCorp’s Hunter Unit 1, Hunter Unit 2, Huntington Unit 1, and Huntington Unit 24. EPA determined that the SIP did not contain a full 5-factor analysis as required by the rule. Prior to EPA’s disapproval, Utah’s BART determination was in place and enforceable under state law and state permits. The required controls were installed and operating on three of the four EGUs prior to EPA’s proposed disapproval, and were installed on the 4th EGU in 2014 as required by Utah’s SIP under state law.
III. BART for Particulate Matter In June 2012, after EPA had proposed to disapprove Utah’s BART determination, PacifiCorp prepared a new 5-factor BART analysis to satisfy the requirements of the BART rule. PacifiCorp submitted an update to that analysis on August 5, 2014 to address issues that EPA had raised with other regional haze SIPs.
PacifiCorp’s 5-Factor analysis identified three available technologies: upgraded electrostatic precipitator (ESP) and flue gas conditioning (0.040 lb PM10/MMBtu); polishing fabric filter (0.015 lb PM10/MMBtu); and replacement fabric filter (0.015 lb PM10/MMBtu). The 2008 BART determination had required PacifiCorp to install a fabric filter baghouse with a PM emission limit of 0.015 lb/MMBtu at Hunter Units 1 and 2 and Huntington Units 1 and 25. DAQ staff have reviewed PacifiCorp’s 2012 analysis and determined that the baghouse technology required in 2008 is still the most stringent technology available and 0.015 lb PM/MMBtu represents the most stringent emission limit. The PM emission limit has been added to SIP Section IX, Part H.21 and H.22 to ensure that it is federally enforceable.
40 CFR Part 51, Appendix Y, Guidelines for BART Determinations Under the Regional Haze Rule, allows a streamlined 5-factor analysis when the most stringent controls are already required.
“If you find that a BART source has controls already in place which are the most stringent controls available (note that this means that all possible improvements to any control devices have been made), then it is not necessary to comprehensively complete each following step of the BART analysis in this section. As long as these most stringent controls available are made federally enforceable for the purpose of implementing BART for that source, you may skip the remaining analyses in this section, including the visibility analysis in step 5. Likewise, if a source commits to a BART determination that consists of the most stringent controls available, then there is no need to complete the remaining analyses in this section.” (40 CFR Part 51, Appendix Y, Section D.9)
4 77 FR 74355 5 The AOs established a PM10 emission limit of 74 lb/hr at Huntington Unit 1; and a PM emission limit of 70 lb/hr at
Huntington Unit 2. The pound per hour emission limit for the Huntington units was based on a 0.015 lb/MMBtu emission rate and a maximum hourly heat input.
5
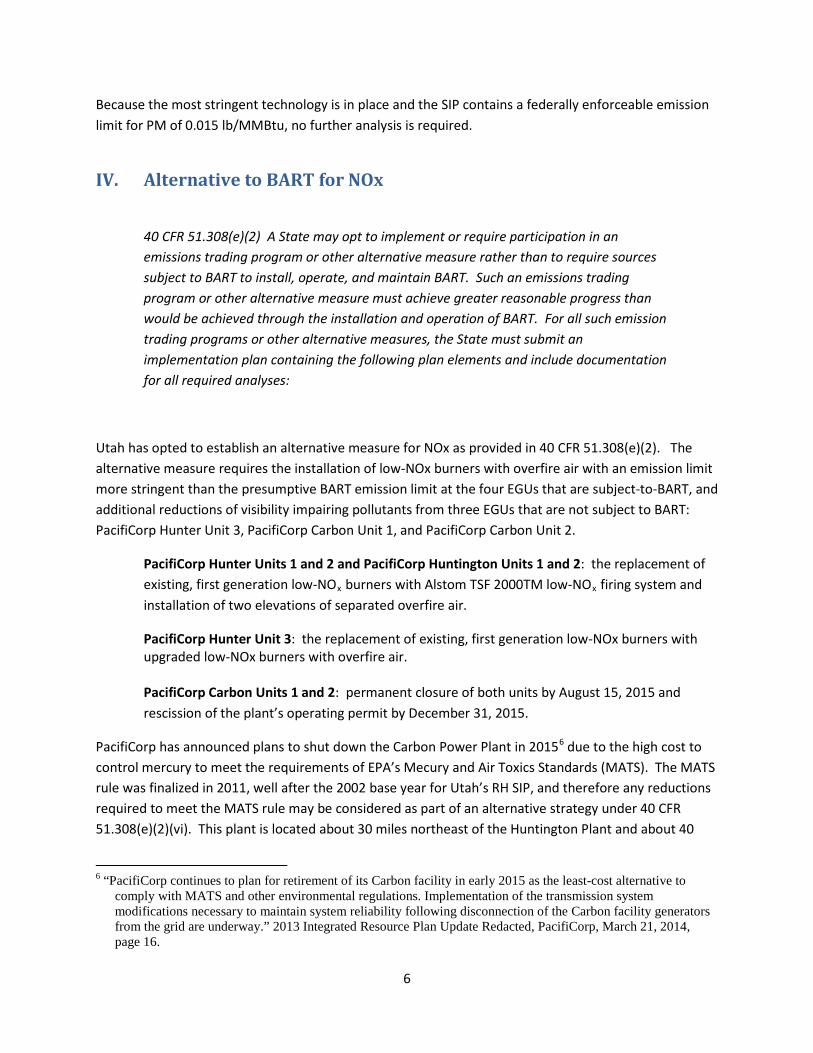
Because the most stringent technology is in place and the SIP contains a federally enforceable emission limit for PM of 0.015 lb/MMBtu, no further analysis is required.
IV. Alternative to BART for NOx
40 CFR 51.308(e)(2) A State may opt to implement or require participation in an emissions trading program or other alternative measure rather than to require sources subject to BART to install, operate, and maintain BART. Such an emissions trading program or other alternative measure must achieve greater reasonable progress than would be achieved through the installation and operation of BART. For all such emission trading programs or other alternative measures, the State must submit an implementation plan containing the following plan elements and include documentation for all required analyses:
Utah has opted to establish an alternative measure for NOx as provided in 40 CFR 51.308(e)(2). The alternative measure requires the installation of low-NOx burners with overfire air with an emission limit more stringent than the presumptive BART emission limit at the four EGUs that are subject-to-BART, and additional reductions of visibility impairing pollutants from three EGUs that are not subject to BART: PacifiCorp Hunter Unit 3, PacifiCorp Carbon Unit 1, and PacifiCorp Carbon Unit 2.
PacifiCorp Hunter Units 1 and 2 and PacifiCorp Huntington Units 1 and 2: the replacement of existing, first generation low-NOx burners with Alstom TSF 2000TM low-NOx firing system and installation of two elevations of separated overfire air.
PacifiCorp Hunter Unit 3: the replacement of existing, first generation low-NOx burners with upgraded low-NOx burners with overfire air.
PacifiCorp Carbon Units 1 and 2: permanent closure of both units by August 15, 2015 and rescission of the plant’s operating permit by December 31, 2015.
PacifiCorp has announced plans to shut down the Carbon Power Plant in 20156 due to the high cost to control mercury to meet the requirements of EPA’s Mecury and Air Toxics Standards (MATS). The MATS rule was finalized in 2011, well after the 2002 base year for Utah’s RH SIP, and therefore any reductions required to meet the MATS rule may be considered as part of an alternative strategy under 40 CFR 51.308(e)(2)(vi). This plant is located about 30 miles northeast of the Huntington Plant and about 40
6 “PacifiCorp continues to plan for retirement of its Carbon facility in early 2015 as the least-cost alternative to comply with MATS and other environmental regulations. Implementation of the transmission system modifications necessary to maintain system reliability following disconnection of the Carbon facility generators from the grid are underway.” 2013 Integrated Resource Plan Update Redacted, PacifiCorp, March 21, 2014, page 16.
6

miles northeast of the Hunter Plant and its emissions impact the same general area as the Hunter and Huntington Plants. Average SO2 emissions from the Carbon Plant in 2012-13 were 8,005 tons/yr, and average NOx emissions were 3,342 tons /yr. PacifiCorp and ultimately Utah rate payers must pay the cost to replace the electricity generated by this plant, but there will also be a visibility benefit due to the emission reductions. Overall emission reductions of SO2 and NOx due to the closure of this plant will be greater than the NOx reductions that could be achieved by installing the most stringent NOx control, SCR, on the four subject-to-BART EGUs and the emission reductions will occur close to the location of the Hunter and Huntington plants.
While PacifiCorp has announced plans to shut down the Carbon Plant, this decision is not enforceable, and PacifiCorp could choose to meet the MATS requirements through other measures. On November 25, 2014, the Supreme Court agreed to consider challenges to the MATS rule, so there is a possibility that the mercury control requirements could be overturned or delayed. An enforceable requirement in the RH SIP to permanently close the Carbon Plant as part of an alternative to BART would lock in substantial emission reductions.
V. BART-eligible Sources Covered by Alternative Measure for NOx 40 CFR 51.308(e)(2)(i)(A) A list of all BART-eligible sources within the state.
40 CFR 51.308(e)(2)(i)(B) A list of all BART-eligible sources and all BART source categories covered by the alternative program. The state is not required to include every BART source category or every BART-eligible source with a BART source category in an alternative program, but each BART-eligible source in the state must be subject to the requirements of the alternative program, have a federally enforceable emission limitation determined by the state and approved by EPA as meeting BART in accordance with section 302(c) or paragraph (e)(1) of this section, or otherwise addressed under paragraphs (e)(1) or (e)(4) of this section.
Four EGUs were the only BART-eligible sources identified in Utah’s 2008 RH SIP. All four of these EGUs are covered by the alternative program.
• PacifiCorp Hunter, Unit 1 • PacifiCorp Hunter, Unit 2 • PacifiCorp Huntington, Unit 1 • PacifiCorp Huntington, Unit 2
7

VI. NOx emission reductions achievable
40 CFR 51.308(e)(2)(i)(C) An analysis of the best system of continuous emission control technology available and associated emission reductions achievable for each source within the state subject to BART and covered by the alternative program. This analysis must be conducted by making a determination of BART for each source subject to BART and covered by the alternative program as provided for in paragraph (e)(1) of this section, unless the emissions trading program or other alternative measure has been designed to meet a requirement other than BART (such as the core requirement to have a long-term strategy to achieve the reasonable progress goals established by the states). In this case, the state may determine the best system of continuous emission control technology and associated emission reductions for similar types of sources within a source category based on both source-specific and category-wide information, as appropriate.
In June 2012, PacifiCorp prepared a new 5-factor BART analysis to satisfy the requirements of the BART rule. PacifiCorp submitted an update to that analysis on August 5, 2014 to address issues that EPA had raised with other regional haze SIPs. The technologies identified in the analysis range from the currently required low NOx burners with overfire air (presumptive BART) to the most-stringent NOx technology (SCR + low NOx burners with overfire air). DAQ reviewed PacifiCorp’s analysis and agreed that SCR + low NOx burners with overfire air with an annual emission rate of 0.05 lb/MMBtu was the most stringent technology available to reduce NOx emissions from the four subject-to-BART EGUs. This technology is very expensive to install on the subject-to-BART EGUs considering their current configuration and the unique characteristics of Utah’s coal and would require careful consideration through a case-by-case 5-factor analysis. However, this technology can be used as a stringent benchmark for comparison with an alternative program. DAQ’s use of this technology as a benchmark is not a determination that this technology is BART, it is merely a conservative approach to evaluate the effectiveness of the alternative program (see Table 2).
8

VII. Projected Emission Reductions from Alternative Measures
40 CFR 51.308(e)(2)(i)(D) An analysis of the projected emissions reductions achievable through the trading program or other alternative measure.
Table 2 shows the estimated annual emissions for NOx, SO2, and PM10 for the most stringent NOx scenario and the alternative measure. As can be seen, NOx emissions are higher under the alternative measure, but emissions of SO2 and PM10 are both lower under the alternative measure. Combined emissions of all three pollutants are 2,856 tons/yr lower under the alternative measure. Table 2. Estimated emissions under the most stringent NOx scenario and the alternative scenario
Units
NOx emissions (tons/yr) SO2 emissions (tons/yr) PM10 emissions (tons/yr)d Combined
Most Stringent NOxb
Alternativec Most Stringent NOxb
Alternativec Most Stringent NOx
Alternative Most Stringent NOx
Alternative
Carbon 1 1,408 0 3,388 0 221 0 5,016 0
Carbon 2 1,940 0 4,617 0 352 0 6,909 0
Hunter 1a 775 3,412 1,529 1,529 169 169 2,473 5,100
Hunter 2 843 3,412 1,529 1,529 169 169 2,541 5,110
Hunter 3 6,530 4,622 1,033 1,033 122 122 7,685 5,777 Huntington 1
809 3,593 1,168 1,168 176 176 2,153 4,937 Huntington 2
856 3,844 1,187 1,187 200 200 2,243 5,231
Total 13,161 18,882 14,451 6,446 1409 836 29,020 26,164
a Hunter 1 controls were installed in the spring of 2014, therefore Hunter 2 actual emissions are used as a surrogate b Most stringent NOx rate for BART-eligible units (see spreadsheet BART Analysis.pdf in the TSD), 2012-13 actual emissions Carbon, 2001-3 actual emissions Hunter 3 (EPA Acid Rain Program) c Average actual emissions 2012-13 for Hunter and Huntington units, EPA Acid Rain Program d Actual emissions for 2012, DAQ annual inventory
9

VIII. Greater Reasonable Progress than BART
40 CFR 51.308(e)(2)(i) Demonstration that the emissions trading program or other alternative measure will achieve greater reasonable progress than would have resulted from the installation and operation of BART at all sources subject to BART in the state and covered by the alternative program.
40 CFR 51.308(e)(2)(i)(E) A determination under paragraph (e)(3) if this section or otherwise based on the clear weight of evidence that the trading program or other alternative measure achieves greater reasonable progress than would be achieved through the installation and operation of BART at the covered sources.
The weight of evidence shows that the alternative program will provide greater reasonable progress than BART. DAQ used a number of different metrics to reach this conclusion. First, as outlined in section VI, combined emissions of NOx, SO2, and PM will be 2,856 tons/yr lower under the alternative scenario. The NOx reductions at Huntington 1 and 2 and Hunter 2 and 3 occurred between 2006 and 2011, earlier than was required by the rule, providing a corresponding early and on-going visibility improvement. The alternative provides greater reductions of SO2, the most significant anthropogenic pollutant affecting Class I Areas on the Colorado Plateau that affects visibility year-round, including the high visitation seasons of Spring, Summer, and Fall. Finally, visibility modeling shows that the alternative will provide greater visibility improvement.
DAQ conducted dispersion modeling using the CALPUFF model to compare the visibility improvement anticipated under the alternative measure with the visibility improvement under the most stringent NOx technology for the four subject-to-BART EGUs. The seven EGUs shown in Table 3 were included in the modeling. Detailed information regarding the modeling inputs, emission scenarios, and methods are described in the February 13, 2014 modeling protocol.7
7 Air Quality Modeling Protocol: Utah Regional Haze State Implementation Plan, Utah Division of Air Quality, February 13, 2015
10

Table 3. Emission units and Class I areas modeled
Company Name Plant Name Units PacifiCorp Hunter Boilers #1,2,3 PacifiCorp Huntington Boilers #1,2 PacifiCorp Carbon Boilers #1,2
Source Class I Areas to be Evaluated PacifiCorp Hunter Plant, PacifiCorp Huntington Plant, PacifiCorp Carbon Plant
Arches National Park, Canyonlands National Park, Capitol Reef National Park, Bryce National Park, Zion National Park, Mesa Verde National Park, Black Canyon of the Gunnison National Park, Grand Canyon National Park, Flat Tops Wilderness
Because the emission reductions under the alternative included reductions of SO2 in addition to reductions of NOx, visibility improvement under the two scenarios could occur during different episodes and during different times of the year. For this reason, a number of different metrics were evaluated to compare the two scenarios.
A. Continued Focus on SO2 Reductions Utah’s 2003 RH SIP focused on SO2 reductions because SO2 has the greatest overall impact at Class I areas on the Colorado Plateau and revisions in 2008 and 2011 continued this focus. The alternative measures enhance that approach through additional, significant emission reductions of over 8,000 tons/yr SO2 due to the closure of the Carbon Plant. Figure 1 shows that sulfates are the dominant visibility impairing pollutant at Canyonlands, the Class I area with the greatest overall impact from the four subject-to-BART sources. Figure 4 shows that sulfates affect visibility throughout the year and are the dominant visibility impairing pollutant from anthropogenic sources during the high visitation period of March through November. Similar results are seen at the other Class I areas and are documented in the TSD.
11

Figure 4. Canyonlands ammonium sulfate and ammonium nitrate
DAQ has confidence that SO2 reductions will achieve meaningful visibility improvement. The visibility improvement during the winter months due to NOx reductions is much more uncertain. Figure 5 shows the significant emission reductions of both SO2 and NOx that have occurred from the four subject-to-BART EGUs over the last 15 years. Figure 6 shows corresponding improvements in ammonium sulfate values at Canyonlands throughout the year. However, ammonium nitrate values do not show similar improvement in the winter months, despite a 50% reduction in NOx over this time period. For this reason, DAQ has greater confidence that modeled improvements due to reductions in SO2 will be reflected in improved visibility for visitors to the Class I areas over the next decade, while modeled improvements due to reductions in NOx will have a more uncertain benefit.
12

Figure 5. SO2 and NOx Emission Trends
13

Figure 6. Sulfate and Nitrate Trends at Canyonlands
14

B. Comparison of Modeled Results
The visibility modeling demonstrated greater visibility improvement across all Class I areas. The results of this modeling are described in sections VIII.B.1 through 4. The detailed modeling results are included in the TSD.8
1. Improvement in number of days with significant visibility impairment.
Modeled visibility improved more often under the alternative scenario leading to an average of six fewer days with a deciview impact greater than 1.0 dV per year and 58 fewer days with a deciview impact greater than 0.5 dV per year.
Table 4. Average Number of Days > 1.0 dV Impact
Basecase Alternative
Most Stringent NOx Control
Arches 128 68 77 Black Canyon of the Gunnison 36 10 9 Bryce Canyon 19 9 8 Canyonlands 141 87 87 Capitol Reef 68 42 41 Flat Tops 46 13 15 Grand Canyon 22 11 10 Mesa Verde 40 13 12 Zion 11 6 6 Total 511 258 264
8 Technical Support Document for Regional Haze SIP
15

Table 5. Average Number of Days > 0.5 dV Impact
Basecase Alternative
Most Stringent NOx Control
Arches 176 109 130 Black Canyon of the Gunnison 75 27 34 Bryce Canyon 36 17 19 Canyonlands 178 131 140 Capitol Reef 96 63 65 Flat Tops 93 34 44 Grand Canyon 38 19 20 Mesa Verde 71 32 37 Zion 21 10 10 Total 784 441 499
2. Average deciview impact
The average deciview impact at all Class I areas is better or the same under the alternative at six of the nine Class I areas, and is better on average across all the Class I areas.
Table 6. Average ∆dV across all Class I Areas
Basecase Alternative
Most Stringent Nox
Arches 1.236 0.616 0.688 Black Canyon of the Gunnison 0.334 0.137 0.158 Bryce Canyon 0.192 0.089 0.090 Canyonlands 1.389 0.791 0.760 Capitol Reef 0.719 0.398 0.367 Flat Tops 0.427 0.167 0.210 Grand Canyon 0.211 0.102 0.100 Mesa Verde 0.338 0.148 0.154 Zion 0.119 0.056 0.056 Average 0.552 0.278 0.287
16

3. 90th percentile deciview impact
The 90th percentile deciview impact is better or the same under the alternative at seven of the nine Class I areas, and is slightly better on average across all Class I areas.
Table 7. 90th Percentile (110th highest) across all 3 years
Basecase Alternative Most Stringent NOx
Arches 3.721 1.859 1.999 Black Canyon of the Gunnison 0.977 0.400 0.465 Bryce Canyon 0.495 0.189 0.227 Canyonlands 4.183 2.447 2.148 Capitol Reef 2.416 1.234 1.150 Flat Tops 1.221 0.466 0.555 Grand Canyon 0.559 0.222 0.241 Mesa Verde 1.124 0.430 0.501 Zion 0.183 0.067 0.089 Average 1.653 0.813 0.819
4. 98th percentile deciview impact
The only metric evaluated that showed greater improvement under the most stringent NOx scenario was the visibility impact on the most impaired days. Because high nitrate values occur primarily in the winter months, the most stringent NOx scenario achieved greater modeled visibility improvement on these high nitrate days. As discussed earlier, there is greater uncertainty regarding the effect of NOx reductions on wintertime nitrate values because past emission reductions have not resulted in corresponding reductions in monitored nitrate values during the winter months. DAQ has greater confidence in the visibility improvement due to reductions of SO2 because past reductions have resulted in corresponding reductions in monitored sulfate values throughout the year.
17

Table 8. Average 98th Percentile (24th High) Across 3 Years
Basecase Alternative Most Stringent NOx
Arches 7.167 4.282 4.469 Black Canyon of the Gunnison 2.366 1.123 1.053 Bryce Canyon 2.401 1.157 1.059 Canyonlands 8.328 5.728 5.057 Capitol Reef 6.364 4.125 3.662 Flat Tops 2.753 1.210 1.292 Grand Canyon 2.814 1.457 1.200 Mesa Verde 2.815 1.287 1.137 Zion 1.464 0.638 0.709 Average 4.052 2.334 2.182
Table 9. 98th Percentile (8th High) in Highest Year
Alternative Most Stringent NOx
Arches
4.92
4.87 Black Canyon of the Gunnison 1.32 1.36 Bryce Canyon 1.89 1.96 Canyonlands 6.32 5.56 Capitol Reef 4.78 3.39 Flat Tops 1.37 1.81 Grand Canyon 1.98 1.81 Mesa Verde 1.52 1.48 Zion 1.14 1.22 Average 2.81 2.61
5. Weight of Evidence The weight of evidence shows that the alternative program will provide greater reasonable progress than BART. Combined emissions of NOx, SO2, and PM will be 2,856 tons/yr lower under the alternative scenario. Reductions were achieved earlier than was required by the rule, providing a corresponding early and on-going visibility improvement. The alternative program provides greater reductions of SO2, the most significant anthropogenic pollutant affecting Class I Areas on the Colorado Plateau that affects visibility year-round, including the high visitation seasons of Spring, Summer, and Fall. Finally, visibility modeling shows that the alternative will provide visibility improvement on a greater number of days, greater average improvement, and greater improvement on the 90th percentile deciviews across all Class I areas.
18
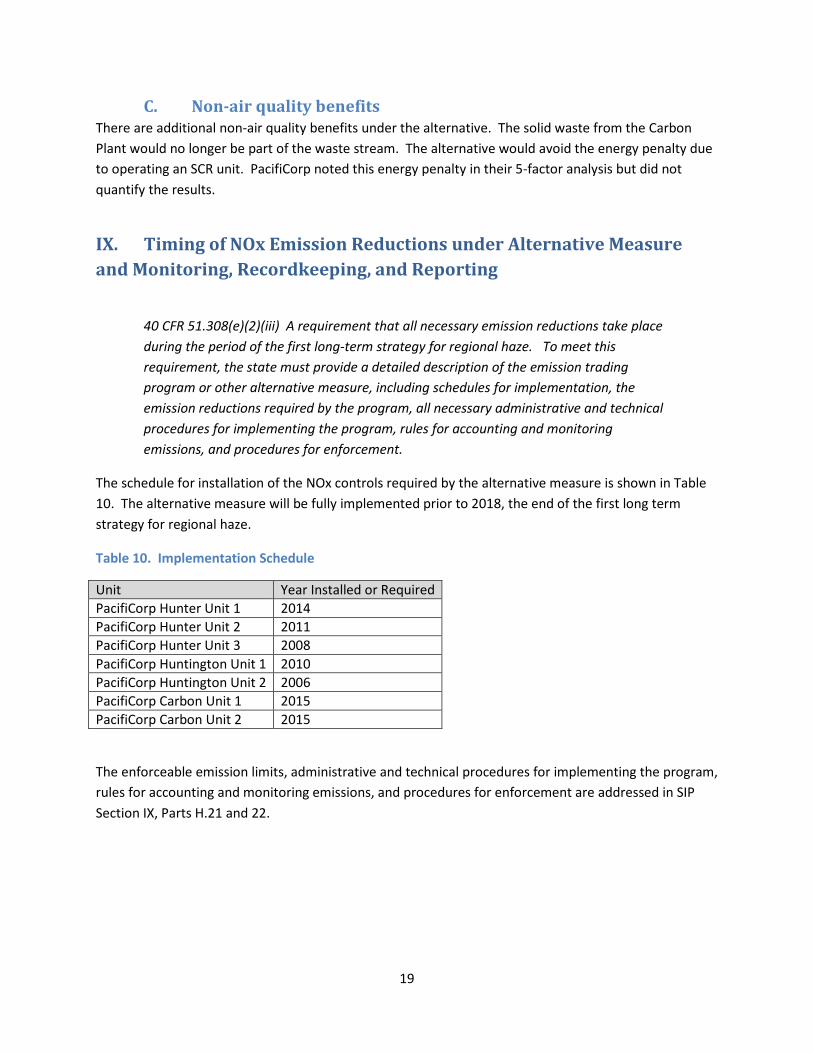
C. Non-air quality benefits There are additional non-air quality benefits under the alternative. The solid waste from the Carbon Plant would no longer be part of the waste stream. The alternative would avoid the energy penalty due to operating an SCR unit. PacifiCorp noted this energy penalty in their 5-factor analysis but did not quantify the results.
IX. Timing of NOx Emission Reductions under Alternative Measure and Monitoring, Recordkeeping, and Reporting
40 CFR 51.308(e)(2)(iii) A requirement that all necessary emission reductions take place during the period of the first long-term strategy for regional haze. To meet this requirement, the state must provide a detailed description of the emission trading program or other alternative measure, including schedules for implementation, the emission reductions required by the program, all necessary administrative and technical procedures for implementing the program, rules for accounting and monitoring emissions, and procedures for enforcement.
The schedule for installation of the NOx controls required by the alternative measure is shown in Table 10. The alternative measure will be fully implemented prior to 2018, the end of the first long term strategy for regional haze.
Table 10. Implementation Schedule
Unit Year Installed or Required PacifiCorp Hunter Unit 1 2014 PacifiCorp Hunter Unit 2 2011 PacifiCorp Hunter Unit 3 2008 PacifiCorp Huntington Unit 1 2010 PacifiCorp Huntington Unit 2 2006 PacifiCorp Carbon Unit 1 2015 PacifiCorp Carbon Unit 2 2015
The enforceable emission limits, administrative and technical procedures for implementing the program, rules for accounting and monitoring emissions, and procedures for enforcement are addressed in SIP Section IX, Parts H.21 and 22.
19
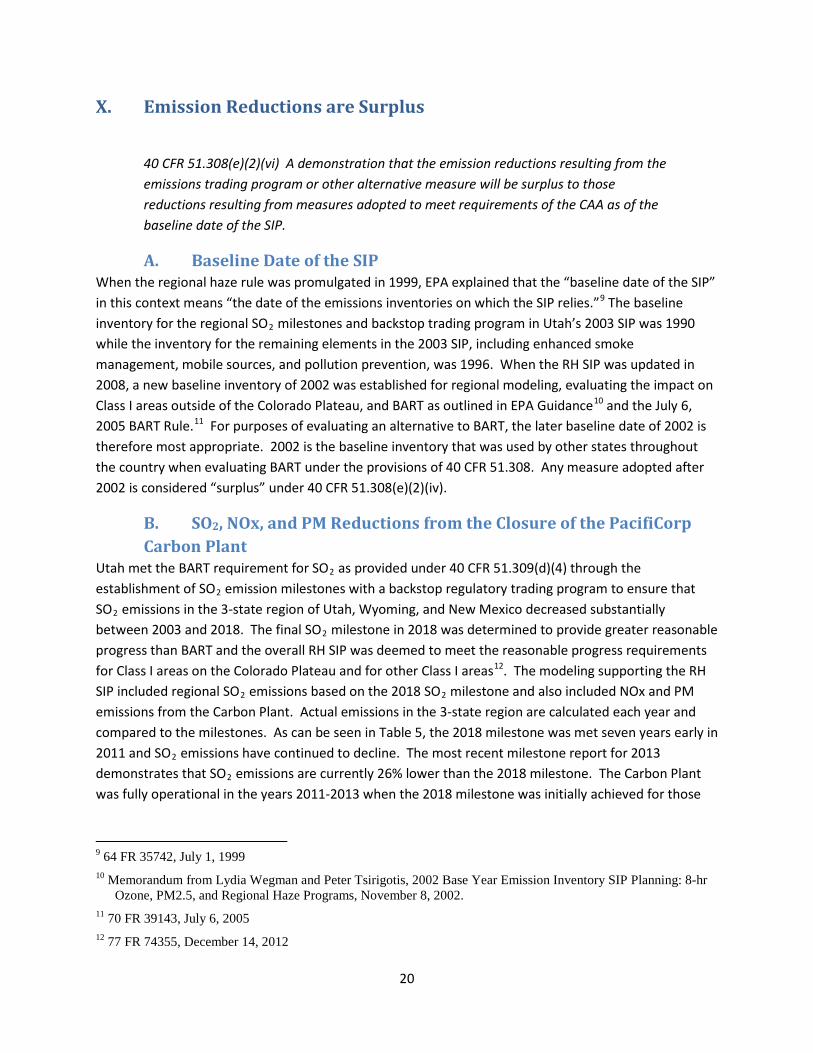
X. Emission Reductions are Surplus
40 CFR 51.308(e)(2)(vi) A demonstration that the emission reductions resulting from the emissions trading program or other alternative measure will be surplus to those reductions resulting from measures adopted to meet requirements of the CAA as of the baseline date of the SIP.
A. Baseline Date of the SIP When the regional haze rule was promulgated in 1999, EPA explained that the “baseline date of the SIP” in this context means “the date of the emissions inventories on which the SIP relies.”9 The baseline inventory for the regional SO2 milestones and backstop trading program in Utah’s 2003 SIP was 1990 while the inventory for the remaining elements in the 2003 SIP, including enhanced smoke management, mobile sources, and pollution prevention, was 1996. When the RH SIP was updated in 2008, a new baseline inventory of 2002 was established for regional modeling, evaluating the impact on Class I areas outside of the Colorado Plateau, and BART as outlined in EPA Guidance10 and the July 6, 2005 BART Rule.11 For purposes of evaluating an alternative to BART, the later baseline date of 2002 is therefore most appropriate. 2002 is the baseline inventory that was used by other states throughout the country when evaluating BART under the provisions of 40 CFR 51.308. Any measure adopted after 2002 is considered “surplus” under 40 CFR 51.308(e)(2)(iv).
B. SO2, NOx, and PM Reductions from the Closure of the PacifiCorp Carbon Plant
Utah met the BART requirement for SO2 as provided under 40 CFR 51.309(d)(4) through the establishment of SO2 emission milestones with a backstop regulatory trading program to ensure that SO2 emissions in the 3-state region of Utah, Wyoming, and New Mexico decreased substantially between 2003 and 2018. The final SO2 milestone in 2018 was determined to provide greater reasonable progress than BART and the overall RH SIP was deemed to meet the reasonable progress requirements for Class I areas on the Colorado Plateau and for other Class I areas12. The modeling supporting the RH SIP included regional SO2 emissions based on the 2018 SO2 milestone and also included NOx and PM emissions from the Carbon Plant. Actual emissions in the 3-state region are calculated each year and compared to the milestones. As can be seen in Table 5, the 2018 milestone was met seven years early in 2011 and SO2 emissions have continued to decline. The most recent milestone report for 2013 demonstrates that SO2 emissions are currently 26% lower than the 2018 milestone. The Carbon Plant was fully operational in the years 2011-2013 when the 2018 milestone was initially achieved for those
9 64 FR 35742, July 1, 1999 10 Memorandum from Lydia Wegman and Peter Tsirigotis, 2002 Base Year Emission Inventory SIP Planning: 8-hr
Ozone, PM2.5, and Regional Haze Programs, November 8, 2002. 11 70 FR 39143, July 6, 2005 12 77 FR 74355, December 14, 2012
20

years. Therefore the SO2 emission reductions from the closure of the Carbon Plant are surplus to what is needed to meet the 2018 milestone established in Utah’s RH SIP.
The Carbon Plant was built in the 1950s and is therefore grandfathered under Utah’s permitting rules. The plant is equipped with an electrostatic precipitator for PM control and has no SO2 or NOx controls. PacifiCorp has announced plans to shut down the Carbon Power Plant in 2015 due to the high cost to control mercury to meet the requirements of EPA’s new Mecury and Air Toxics Standards (MATS) rule. The MATS rule was finalized in 2011, well after the 2002 base year for Utah’s RH SIP, and therefore any reductions required to meet the MATS rule may be considered as part of an alternative strategy under 40 CFR 51.308(e)(2)(vi). While PacifiCorp has announced plans to shut down the Carbon Plant, this decision is not enforceable, and PacifiCorp could choose to meet the MATS requirements through other measures. On November 25, 2014, the Supreme Court agreed to consider challenges to the MATS rule, so there is a possibility that the mercury control requirements could be overturned or delayed. An enforceable requirement in the RH SIP to permanently close the Carbon Plant as part of an alternative to BART would lock in substantial emission reductions.
Table 11. SO2 Milestone Trends
Milestone Three Year Average SO2 Emissions (tons/yr)
Carbon Plant SO2 Emissions (tons/yr)
2003 303,264 214,780 5,488 2004 303,264 223,584 5,642 2005 303,264 220,987 5,410 2006 303,264 218,499 6,779 2007 303,264 203,569 6,511 2008 269,083 186,837 5,057 2009 234,903 165,633 5,494 2010 200,722 146,808 7,462 2011 200,722 130,935 7,740 2012 200,722 115,115 8,307 2013 185,795 105,084 7,702 2014 170,868 2015 155,940 2016 155,940 2017 155,940 2018 141,849
21

C. PacifiCorp Hunter Unit 3 PacifiCorp upgraded the low-NOx burners on Hunter Unit 3 in 2008. This upgrade was not required under the requirements of the Clean Air Act as of the 2002 baseline date of the SIP. Prior to the 2008 upgrade, the emission rate for Hunter Unit 2 was 0.46 lb/MMBtu heat input for a 30-day rolling average as required by Phase II of the Acid Rain Program.
XI. Visibility Analysis 40 CFR 51.308(e)(3) A State which opts under 40 CFR 51.308(e)(2) to implement an emissions trading program or other alternative measure rather than to require sources subject to BART to install, operate, and maintain BART may satisfy the final step of the demonstration required by that section as follows: If the distribution of emissions is not substantially different than under BART, and the alternative measure results in greater emission reductions, then the alternative measure may be deemed to achieve greater reasonable progress. If the distribution of emissions is significantly different, the State must conduct dispersion modeling to determine differences in visibility between BART and the trading program for each impacted Class I area, for the worst and best 20% of days. The modeling would demonstrate “greater reasonable progress” if both of the following two criteria are met:
(i) Visibility does not decline in any Class I area, and
(ii) There is an overall improvement in visibility, determined by comparing the average differences between BART and the alternative over all affected Class I areas.
The Hunter, Huntington, and Carbon plants are all located within 40 miles of each other in Central Utah. Because of the close proximity of the three plants, the distribution of emissions will not be substantially different under the alternative program. As described in section VII, combined emissions of all three pollutants are 2,856 tons/yr lower under the alternative measure . Therefore, the alternative measure may be deemed to achieve greater reasonable progress than BART.
22

Regional Haze SIP Alternative to BART Proposal
Colleen Delaney, Environmental ScientistUtah Division of Air Quality
March 4, 2015


0
10,000
20,000
30,000
40,000
50,000
60,000
70,000
0
0.5
1
1.5
2
2.5
3
3.5
Jan‐01 Jan‐02 Jan‐03 Jan‐04
Canyonlands Ammonium Nitrate
Amm_nitrate
Amm_sulfate
Visitation


0
0.5
1
1.5
2
2.5
31/2/95
1/2/96
1/1/97
1/1/98
1/2/99
1/2/00
1/1/01
1/1/02
1/2/03
1/2/04
1/1/05
1/1/06
1/2/07
1/2/08
1/1/09
1/1/10
1/2/11
1/2/12
1/1/13
1/1/14
1/2/15
µg/m
3
Canyonlands Sulfate, Nitrate, and Ammonium Trends, March‐November
Nitrate
Sulfate
Ammonium
Linear (Nitrate)
Linear (Sulfate)
Linear (Ammonium)
Sulfate trending down
Nitrate trending down
Source: IMPROVE
Ammonium trending down

0
0.5
1
1.5
2
2.5
31/2/95
1/2/96
1/1/97
1/1/98
1/2/99
1/2/00
1/1/01
1/1/02
1/2/03
1/2/04
1/1/05
1/1/06
1/2/07
1/2/08
1/1/09
1/1/10
1/2/11
1/2/12
1/1/13
1/1/14
1/2/15
µg/m
3
Canyonlands Sulfate, Nitrate, and Ammonium Trends, Dec‐Feb
Nitrate
Sulfate
Ammonium
Linear (Nitrate)
Linear (Sulfate)
Linear (Ammonium)
Nitrate Trending Up
Sulfate TrendingDown
Source: IMPROVE
Ammonium No Trend
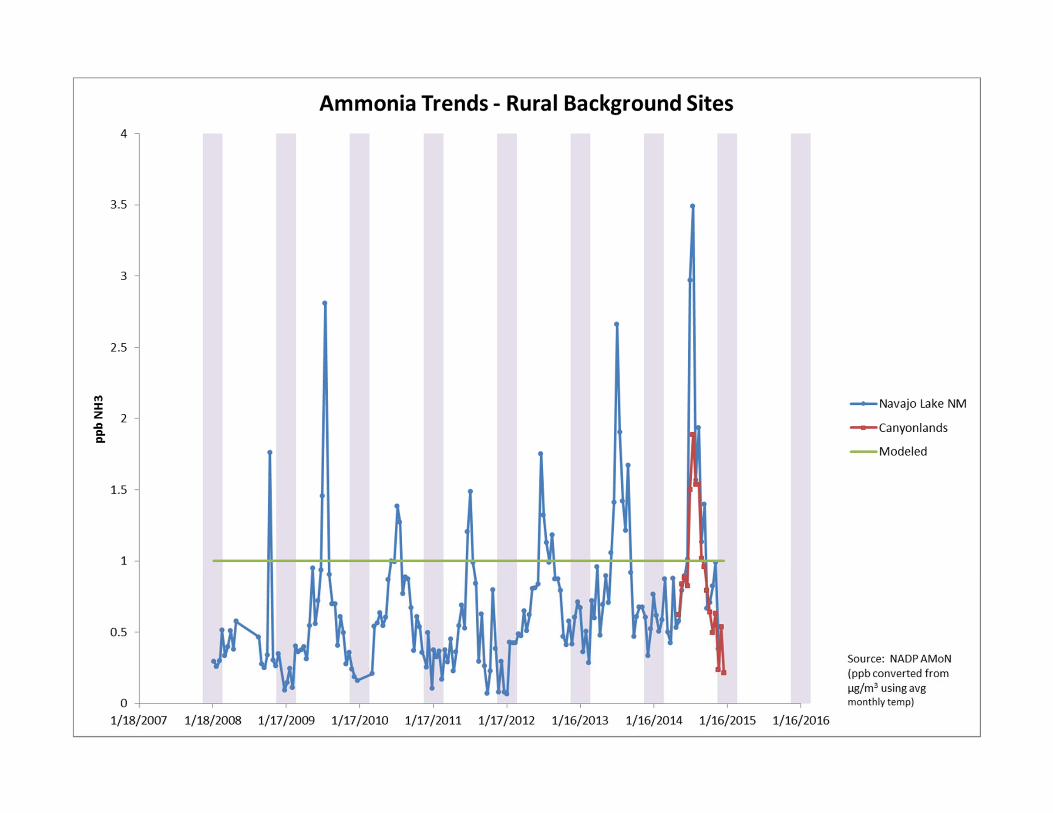
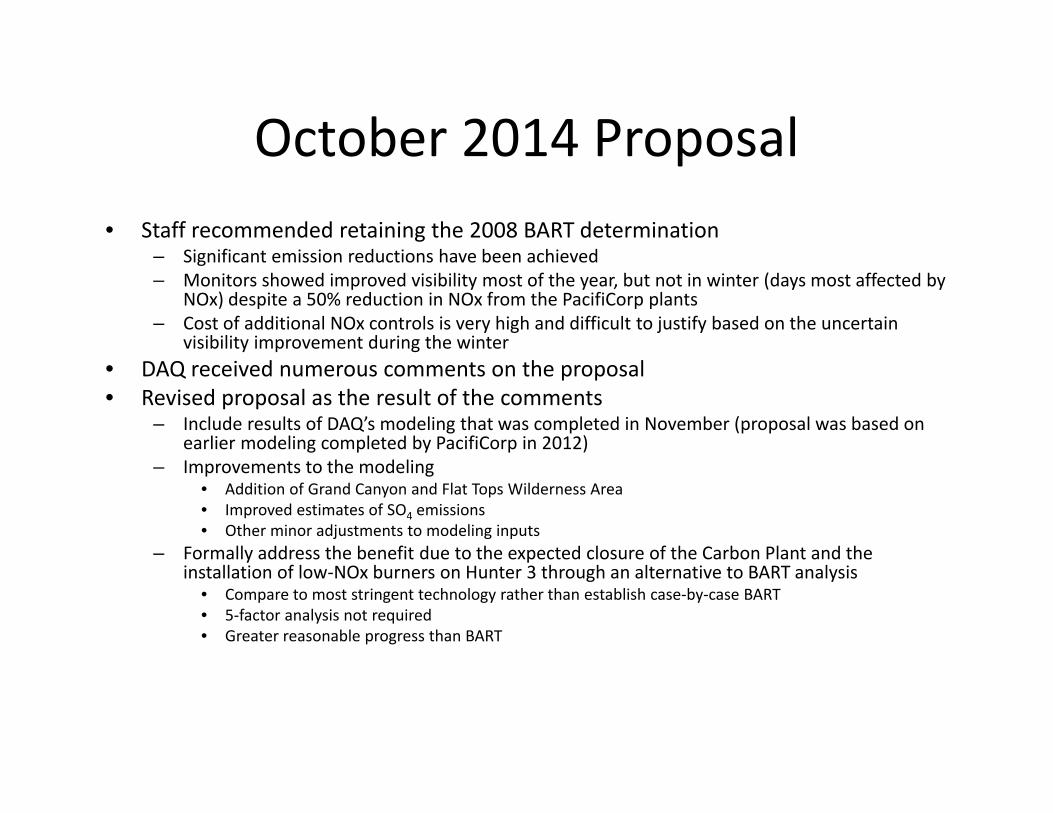
October 2014 Proposal• Staff recommended retaining the 2008 BART determination
– Significant emission reductions have been achieved– Monitors showed improved visibility most of the year, but not in winter (days most affected by
NOx) despite a 50% reduction in NOx from the PacifiCorp plants– Cost of additional NOx controls is very high and difficult to justify based on the uncertain
visibility improvement during the winter• DAQ received numerous comments on the proposal• Revised proposal as the result of the comments
– Include results of DAQ’s modeling that was completed in November (proposal was based on earlier modeling completed by PacifiCorp in 2012)
– Improvements to the modeling• Addition of Grand Canyon and Flat Tops Wilderness Area• Improved estimates of SO4 emissions• Other minor adjustments to modeling inputs
– Formally address the benefit due to the expected closure of the Carbon Plant and the installation of low‐NOx burners on Hunter 3 through an alternative to BART analysis
• Compare to most stringent technology rather than establish case‐by‐case BART• 5‐factor analysis not required• Greater reasonable progress than BART

Emission Reductions ComparisonNOx emissions (tons/yr) SO2 emissions (tons/yr) PM10 emissions (tons/yr)d Combined
Most Stringent NOxb Alternativec
Most Stringent NOx Alternativec
Most Stringent NOx Alternative
Most Stringent NOx Alternative
Carbon 1 1,408 0 3,388 0 221 0 5,016 0
Carbon 2 1,940 0 4,617 0 352 0 6,909 0
Hunter 1a 775 3,412 1,529 1,529 169 169 2,473 5,110
Hunter 2 843 3,412 1,529 1,529 169 169 2,541 5,110
Hunter 3 6,530 4,622 1,033 1,033 122 122 7,685 5,777
Huntington 1 809 3,593 1,168 1,168 176 176 2,153 4,937
Huntington 2 856 3,844 1,187 1,187 200 200 2,243 5,231
Total 13,161 18,882 14,451 6,446 1,409 836 29,020 26,164
a Hunter 1 controls were installed in the spring of 2014, therefore Hunter 2 actual emissions are used as a surrogateb Most stringent NOx rate for BART‐eligible units(see spreadsheet BART Analysis.pdf in the TSD), 2012‐13 actual emissions Carbon, 2001‐3
actual emissions Hunter 3 (EPA Acid Rain Program)c Average actual emissions 2012‐13 for Hunter and Huntington units, EPA Acid Rain Programd Actual emissions for 2012, DAQ annual inventory

Modeling Results
All Class I areas Basecase AlternativeMost stringent
NOx
# Days > 0.5 dV impact1 784 441 499
# Days > 1.0 dV impact1 511 258 264Average 98th percentile (∆dV) 4.25 2.39 2.25average (∆dV) 0.55 0.28 0.29
• The three PacifiCorp plants are located within 40 miles of each other and impact the same general area.
• The Alternative Scenario achieves greater SO2 reductions that provide a benefit year round. The most stringent NOx scenario achieves greater NOx reduction with the benefit concentrated during the winter months.


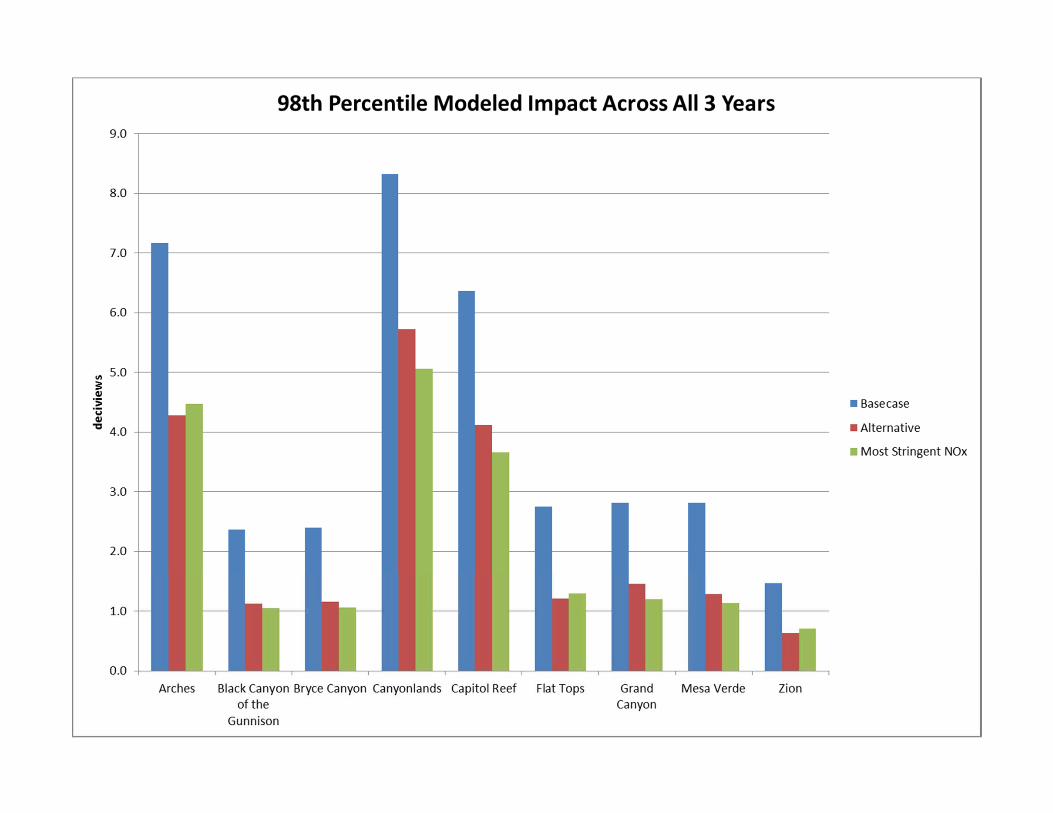

Recommendation
• Retain the 2008 BART determination for PM• Establish an alternative to BART for NOx
– NOx Emission limit of 0.26 lb/MMBtu that meets the presumptive BART rate for Hunter 1 and 2, Huntington 1 and 2
– NOx Emission limit of 0.34 lb/MMBtu for Hunter 3– Closure of Carbon Plant by August 15, 2015
• Add enforceable BART conditions to Part H of the SIP to address EPA’s determination that the approval orders and operating permits for PacifiCorp’s Hunter and Huntington plants are not practicably enforceable.

ITEM 7

State of Utah
GARY R. HERBERT Governor
SPENCER J. COX
Lieutenant Governor
Department of Environmental Quality
Amanda Smith
Executive Director
DIVISION OF AIR QUALITY Bryce C. Bird
Director
DAQ-006-15
M E M O R A N D U M TO: Air Quality Board THROUGH: Bryce C Bird, Executive Secretary FROM: Mark Berger, Air Quality Policy Section Manager DATE: February 17, 2015 SUBJECT: PROPOSE FOR PUBLIC COMMENT: Amend R307-110-17. General Requirements:
State Implementation Plan, Section IX, Control Measures for Area and Point Sources, Part H, Emissions Limits; and R307-110-28. General Requirements: State Implementation Plan, Regional Haze.
______________________________________________________________________________________ The new State Implementation Plan for Regional Haze, along with the new emission limits added to Part H, will have to be incorporated into the Air Quality Rules. R307-110-17 and R307-110-28 are the rules that do this. The proposed rules will update the versions of these SIPs incorporated into the rules to be the versions adopted by the Air Quality Board in June. Staff Recommendation: Staff recommends that R307-110-17 and R307-110-28 be proposed for public comment.
195 North 1950 West • Salt Lake City, Utah Mailing Address: P.O. Box 144820 • Salt Lake City, Utah 84114-4820
Telephone (801) 536-4000 • Fax (801) 536-4099 • T.D.D. (801) 536-4414 www.deq.utah.gov
Printed on 100% recycled paper

R307-110-17 and 28 February 17, 2015 Page 1 of 1 R307. Environmental Quality, Air Quality. 1 R307-110. General Requirements: State Implementation Plan. 2 R307-110-17. Section IX, Control Measures for Area and Point Sources, 3 Part H, Emissions Limits. 4 The Utah State Implementation Plan, Section IX, Control Measures 5 for Area and Point Sources, Part H, Emissions Limits, as most recently 6 amended by the Utah Air Quality Board on [December 3, 2014]June 3, 7 2015, pursuant to Section 19-2-104, is hereby incorporated by 8 reference and made a part of these rules. 9 10 11 R307-110-28. Regional Haze. 12 The Utah State Implementation Plan, Section XX, Regional Haze, 13 as most recently amended by the Utah Air Quality Board on [April 6, 14 2011]June 3, 2015, pursuant to Section 19-2-104, is hereby 15 incorporated by reference and made a part of these rules. 16 17 18 KEY: air pollution, PM10, PM2.5, ozone 19 Date of Enactment or Last Substantive Amendment: [January 9, 20 2014]2015 21 Notice of Continuation: February 1, 2012 22 Authorizing, and Implemented or Interpreted Law: 19-2-104(3)(e) 23

ITEM 8

State of Utah
GARY R. HERBERT Governor
SPENCER J. COX
Lieutenant Governor
Department of Environmental Quality
Amanda Smith
Executive Director
DIVISION OF AIR QUALITY Bryce C. Bird
Director
DAQ-009-15
M E M O R A N D U M TO: Air Quality Board THROUGH: Bryce C. Bird, Executive Secretary FROM: Martin Gray, Major New Source Review Section Manager DATE: February 19, 2015 SUBJECT: PROPOSE FOR PUBLIC COMMENT: R307-210. Stationary Sources. ______________________________________________________________________________________ Background In accordance with Section 111 of the Federal Clean Air Act, the Environmental Protection Agency (EPA) promulgates standards for groups of stationary sources that have been identified as significant contributors to air pollution. The new standards are then applicable to new sources as they commence operation. The Utah Code Annotated (UCA) 19-2-104(3)(b)(iv) provides for the Board to make rules that meet the requirements of federal air pollution laws. This rulemaking satisfies the requirements of the UCA by incorporating standards promulgated by the EPA into the Utah Administrative Code R307-210. Proposed Changes to the Rule The Board last adopted substantive amendments to R307-210-1 on October 6, 2011. The rule incorporates the majority of 40 Code of Federal Regulations (CFR) Part 60, Standards of Performance for Stationary Sources. 40 CFR 60 has undergone many substantive changes that have not been incorporated into R307-210-1. R307-210-1 needs to be amended to incorporate the changes to 40 CFR 60. A list of the substantive changes to 40 CFR Part 60 that are proposed to be adopted by reference to R307-210-1, along with their summaries, is attached. Upon completion of this rulemaking, the new date of substantive amendment will be July 1, 2014. On September 23, 2013, the Board approved R307-210-2 (Oil and Gas Sector: New Source Performance Standards) as an interim rule. This rule incorporated by reference the "Oil and Gas Sector: New Source Performance Standards" in 40 CFR 60.17, 40 CFR Part 60 Subpart KKK, 40 CFR Part 60 Subpart LLL, and 40 CFR Part 60 Subpart OOOO promulgated by the Environmental Protection Agency on August 16,
195 North 1950 West • Salt Lake City, Utah Mailing Address: P.O. Box 144820 • Salt Lake City, Utah 84114-4820
Telephone (801) 536-4000 • Fax (801) 536-4099 • T.D.D. (801) 536-4414 www.deq.utah.gov
Printed on 100% recycled paper

DAQ-009-15 Page 2 2012, in 77 FR 49490 and revised on September 23, 2013, in 78 FR 58435. This rulemaking was undertaken to ensure Utah had the authority the address ozone pollution problems. Volatile organic compounds stemming from oil and gas industry activities are considered to be a contributor to ozone pollution. R307-210-2 is no longer needed as the federal standards incorporated by this rule will be adopted into R307-210-1with this action. Staff Recommendation: Staff recommends the Board propose the amendments to R307-210 for public comment.

Final Standards of Performance for Stationary Sources (NSPS) for Adoption From July 1, 2011 to July 1, 2014
FR Info (Title, Volume, Pages) CFR Reference Summary 01/18/2012 FR Vol. 77, No. 11 Pages 2456 - 2466 [FR DOC # 2012-712] PDF
40 CFR Part 60, Appendix A This final rule incorporates the most recent versions of ASTM International (ASTM) standards into EPA regulations that provide flexibility to use alternatives to mercury-containing industrial thermometers. This final rule allows the use of alternatives in field and laboratory applications previously impermissible as part of compliance with EPA regulations. The older embedded ASTM standards unnecessarily impede the use of effective, comparable, and available alternatives to mercury-containing industrial thermometers. Due to mercury’s high toxicity, EPA seeks to reduce potential mercury exposures by reducing the overall use of mercury-containing products, including mercury-containing industrial thermometers.
02/16/2012 FR Vol. 77, No. 32 Pages 9303 - 9513 [FR DOC # 2012-806] PDF
40 CFR Part 60, Subpart A, B, D, Da, Db, Dc The EPA revised standards of performance in response to a voluntary remand of a final rule. Specifically, they amended new source performance standards (NSPS) after analysis of the public comments. The EPA also finalized several minor amendments, technical clarifications, and corrections to existing NSPS provisions for fossil fuel-fired EGUs and large and small industrial-commercial-institutional steam generating units.
04/19/2012 FR Vol. 77, No. 76 Pages 23399 - 23409 [FR DOC # 2012-8703] PDF
40 CFR Part 60, Subpart Da This document corrects certain preamble and regulatory text. This action corrects typographical errors, such as cross-reference errors and certain preamble text that is not consistent with the final regulatory text, which published in the Federal Register on Thursday, February 16, 2012.
07/30/2012 FR Vol. 77, No. 146 Pages 44488 - 44494
40 CFR Part 60, Appendix A This action promulgates Method 16C for measuring total reduced sulfur (TRS) emissions from stationary sources. Method 16C offers the
1

Final Standards of Performance for Stationary Sources (NSPS) for Adoption From July 1, 2011 to July 1, 2014
FR Info (Title, Volume, Pages) CFR Reference Summary [FR DOC # 2012-18513] PDF advantages of real-time data collection and uses
procedures that are already in use for measuring other pollutants. Method 16C will be a testing option that is used at the discretion of the tester.
08/14/2012 FR Vol. 77, No. 157 Pages 48433 - 48448 [FR DOC # 2012-19691] PDF
40 CFR Part 60, Subpart A, Ga New source performance standards (NSPS) for nitric acid plants. Nitric acid plants include one or more nitric acid production units (NAPUs). These revisions include a change to the nitrogen oxides (NOX) emission limit, which applies to each NAPU commencing construction, modification, or reconstruction after October 14, 2011. These revisions also include additional testing and monitoring requirements.
08/16/2012 FR Vol. 77, No. 159 Pages 49489 – 49600 [FR DOC # 2012-16806] PDF
40 CFR Part 60, Subparts KKK, LLL, OOOO This action finalizes the review of new source performance standards for certain oil and natural gas source sources. In this action the EPA revised the new source performance standards for volatile organic compounds from leaking components at onshore natural gas processing plants and new source performance standards for sulfur dioxide emissions from natural gas processing plants. The rule also establishes standards for certain oil and gas operations not covered by the existing standards. In addition to the operations covered by the existing standards, the newly established standards will regulate volatile organic compound emissions from gas wells, centrifugal compressors, reciprocating compressors, pneumatic controllers and storage vessels. This action also finalizes the residual risk and technology review for the Oil and Natural Gas Production source category and the Natural Gas Transmission and Storage source category. This action includes revisions to the existing leak detection and repair requirements.
2

Final Standards of Performance for Stationary Sources (NSPS) for Adoption From July 1, 2011 to July 1, 2014
FR Info (Title, Volume, Pages) CFR Reference Summary This action finalizes revisions to the regulatory provisions related to emissions during periods of startup, shutdown and malfunction. This final rule became effective on October 15, 2012.
09/12/2012 FR Vol. 77, No. 177 Pages 56421 - 56480 [FR DOC # 2012-20866] PDF
40 CFR Part 60, Subpart A, J, Ja, On June 24, 2008, the EPA promulgated amendments to the Standards of Performance for Petroleum Refineries and new standards of performance for petroleum refinery process units constructed, reconstructed or modified after May 14, 2007. The EPA subsequently received three petitions for reconsideration of these final rules. On September 26, 2008, the EPA granted reconsideration and issued a stay for the issues raised in the petitions regarding process heaters and flares. On December 22, 2008, the EPA addressed those specific issues by proposing amendments to certain provisions for process heaters and flares and extending the stay of these provisions until further notice. The EPA also proposed technical corrections to the rules for issues that were raised in the petitions for reconsideration. In this action, the EPA finalized those amendments and technical corrections and lifted the stay of all the provisions granted on September 26, 2008 and extended until further notice on December 22, 2008.
01/30/2013 FR Vol. 78, No. 20 Pages 6673 - 6724 [FR DOC # 2013-01288] PDF
40 CFR Part 60 Subpart A, IIII, JJJJ
Final amendments to the national emission standards for hazardous air pollutants for stationary reciprocating internal combustion engines. The final amendments include alternative testing options for certain large spark ignition (generally natural gas-fueled) stationary reciprocating internal combustion engines, management practices for a subset of existing spark ignition stationary reciprocating internal combustion engines in
3

Final Standards of Performance for Stationary Sources (NSPS) for Adoption From July 1, 2011 to July 1, 2014
FR Info (Title, Volume, Pages) CFR Reference Summary sparsely populated areas and alternative monitoring and compliance options for the same engines in populated areas. The EPA established management practices for existing compression ignition engines on offshore vessels. The EPA also finalized limits on the hours that stationary emergency engines may be used for emergency demand response and establishing fuel and reporting requirements for certain emergency engines used for emergency demand response. The final amendments also correct minor technical or editing errors in the current regulations for stationary reciprocating internal combustion engines.
02/07/2013 FR. Vol. 78, No. 26 Pages 9111 – 9113 [FR DOC # 2012-31632]
40 CFR Part 60, Subpart CCCC, and DDDD This action implemented the final decision on the issues for which EPA granted reconsideration in December 2011, which pertain to certain aspects of the March 21, 2011, final rule titled ‘‘Standards of Performance for New Stationary Sources and Emissions Guidelines for Existing Sources: Commercial and Industrial Solid Waste Incineration Units’’ (CISWI rule). This final action establishes effective dates for the standards and makes technical corrections to the final rule to clarify definitions, references, applicability and compliance issues. The purpose of these amendments is to clarify several provisions in order to implement the non-hazardous secondary materials rule as the agency originally intended.
02/12/2013 FR Vol. 78, No. 29 Pages 10005 - 10054 [FR DOC #2012-31633] PDF
40 CFR Part 60, Subpart F The EPA amended the new source performance standard for particulate matter for the Portland cement industry. These amendments promote flexibility, reduce costs, ease compliance and preserve health benefits. The EPA set the date for compliance with the existing source national
4

Final Standards of Performance for Stationary Sources (NSPS) for Adoption From July 1, 2011 to July 1, 2014
FR Info (Title, Volume, Pages) CFR Reference Summary emission standards for hazardous air pollutants to be September 9, 2015.
03/06/2013 FR Vol. 78, No. 44 Pages 14457 - 14457 [FR DOC # C1-2013-01288] PDF
40 CFR Part 60 Subpart A, IIII, JJJJ
In rule document 2013–01288, appearing on pages 6674–6724 in the issue of Wednesday, January 30, 2013, changes were made to Table 2c of Subpart ZZZZ.
04/24/2013 FR Vol. 78, No. 79 Pages 24073 – 24094 [FR DOC # 2013-07859]
40 CFR Part 60 Subpart Da The EPA took final action on its reconsideration of certain issues in the final MATS NESHAP issued pursuant to CAA section 112, and the New Source Performance Standards rule issued pursuant to CAA section 111which is referred to as the Utility NSPS. The Administrator received petitions for reconsideration of certain aspects of the MATS NESHAP and the Utility NSPS. On November 30, 2012, the EPA granted reconsideration of, proposed, and requested comment on a limited set of issues. The EPA is now taking final action on the revised new source numerical standards in the MATS NESHAP and the definitional and monitoring provisions in the Utility NSPS that were addressed in the proposed reconsideration rule. As part of this action, the EPA is also making certain technical corrections to both the MATS NESHAP and the Utility NSPS. The EPA is not taking final action on requirements applicable during periods of startup and shutdown in the MATS NESHAP or on startup and shutdown provisions related to the PM standard in the Utility NSPS.
05/13/2013 FR Vol. 78, No. 92 Pages 28051 – 28078 [FR DOC # 2013-09427]
40 CFR Part 60 Subpart Ec This action finalizes amendments to the federal plan and the new source performance standards for hospital/medical/infectious waste incinerators. These final actions implement national standards promulgated in the 2009 amendments to the
5

Final Standards of Performance for Stationary Sources (NSPS) for Adoption From July 1, 2011 to July 1, 2014
FR Info (Title, Volume, Pages) CFR Reference Summary hospital/medical/infectious waste incinerator emissions guidelines that results in reductions in emissions of certain pollutants from all affected units. This rule became effective June 12, 2013.
07/07/2013 FR Vol. 78, No. 26 Pages 9111 - 9213 [FR DOC # 2012-31632] PDF
40 CFR Part 60, Subpart CCCC This action sets forth the EPA’s final decision on the issues for which it granted reconsideration in December 2011, which pertain to certain aspects of the March 21, 2011, final rule titled ‘‘Standards of Performance for New Stationary Sources and Emissions Guidelines for Existing Sources: Commercial and Industrial Solid Waste Incineration Units’’ (CISWI rule). This action also includes the final decision to deny the requests for reconsideration with respect to all issues raised in the petitions for reconsideration of the final commercial and industrial solid waste incineration rule for which reconsideration was not granted. Among other things, this final action establishes effective dates for the standards and makes technical corrections to the final rule to clarify definitions, references, applicability and compliance issues. In addition, the EPA issued final amendments to the regulations that were codified by the Non-Hazardous Secondary Materials rule (NHSM rule). The purpose of these amendments is to clarify several provisions in order to implement the non-hazardous secondary materials rule as the agency originally intended. This subpart took effect on August 7, 2013.
09/23/2013 FR Vol. 78, No. 184 Pages 58415 – 58448 [FR DOC # 2013-22010]
40 CFR Part 60 Subpart OOOO This action finalized the amendments to new source performance standards for the oil and natural gas sector. The Administrator received petitions for reconsideration of certain aspects of the August 12, 2012, final standards. These amendments are a
6

Final Standards of Performance for Stationary Sources (NSPS) for Adoption From July 1, 2011 to July 1, 2014
FR Info (Title, Volume, Pages) CFR Reference Summary result of reconsideration of certain issues raised by petitioners related to implementation of storage vessel provisions. The final amendments provide clarity of notification and compliance dates, ensure control of all storage vessel affected facilities and update key definitions. This action also corrects technical errors that were inadvertently included in the final standards. This final rule was effective on September 23, 2013.
12/19/2013 FR Vol. 78, No. 244 Pages 76753 – 76756 [FR DOC # 2013-29731]
40 CFR Part 60, Subpart Ja The Environmental Protection Agency (EPA) took direct final action to amend the Standards of Performance for Petroleum Refineries for Which Construction, Reconstruction, or Modification Commenced After May 14, 2007. This direct final rule amends the definition of ‘‘delayed coking unit’’ by removing process piping and associated equipment (pumps, valves, and connectors) from the definition. This final rule also removes a redundant definition of ‘‘delayed coking unit’’ from the rule text.
02/27/2014 FR Vol. 79, No. 39 Pages 11227 – 11294 [FR DOC # 2014-02704]
40 CFR Part 60, Subparts and Appendices This action promulgated technical and editorial corrections for source testing of emissions and operations. Some current testing provisions contain inaccuracies and outdated procedures, and new alternatives are being added. These revisions will improve the quality of data and will give testers additional flexibility to use the newly approved alternative procedures. This rule became effective on February 27, 2014.
4/4/2014 FR Vol. 79, No. 65 Pages 18951 – 18972 [FR DOC # 2014-06719]
40 CFR Part 60, Subparts A, BBa This action finalizes revisions to the new source performance standards for kraft pulp mills. These revised standards include particulate matter emission limits for recovery furnaces; smelt
7

Final Standards of Performance for Stationary Sources (NSPS) for Adoption From July 1, 2011 to July 1, 2014
FR Info (Title, Volume, Pages) CFR Reference Summary dissolving tanks and lime kilns, and opacity limits
for recovery furnaces and lime kilns equipped with electrostatic precipitators. These revised standards apply to emission units commencing construction, reconstruction or modification after May 23, 2013. This final rule removes the General Provisions exemption for periods of startup, shutdown and malfunction resulting in a standard that applies at all times. This final rule also includes additional testing requirements and updated monitoring, recordkeeping and reporting requirements for affected sources, including electronic reporting of performance test data. These revisions to the testing, monitoring, recordkeeping and reporting requirements are expected to ensure that control systems are properly maintained over time, ensure continuous compliance with standards and improve data accessibility for the Environmental Protection Agency (EPA), states, tribal governments and communities. This final action is effective on April 4, 2014.
05/06/2014 FR Vol. 79, No. 87 Pages 25681 - 25682 [FR DOC # C1-2012-19691]
40 CFR Part 60 Subpart A, Ga In rule document 2012–19691 appearing on pages 48433 through 48448 in the issue of Tuesday, August 14, 2012, this action makes a change to a calculation.
05/16/2014 FR VOL. 79, No. 95 Pages 28439 – 28444 [FR DOC # 2014-11226]
40 CFR Part 60, Appendix F This action promulgated quality assurance and quality control (QA/QC) procedures (referred to as Procedure 3) for continuous opacity monitoring systems (COMS) used to demonstrate continuous compliance with opacity standards specified in new source performance standards (NSPS) issued by the EPA pursuant to section 111(b).
8

R307-210 February 19, 2015 Page 1 of 1 R307. Environmental Quality, Air Quality. 1 R307-210. Stationary Sources. 2 R307-210-1. Standards of Performance for New Stationary Sources 3 (NSPS). 4 The provisions of 40 Code of Federal Regulations (CFR) Part 60, 5 effective on July 1, [2011]2014, except for Subparts Cb, Cc, Cd, Ce, 6 BBBB, DDDD, and HHHH, are incorporated by reference into these rules 7 with the exception that references in 40 CFR to "Administrator" shall 8 mean "director" unless by federal law the authority referenced is 9 specific to the Administrator and cannot be delegated. 10 11 [R307-210-2. Oil and Gas Sector: New Source Performance Standards. 12 The "Oil and Gas Sector: New Source Performance Standards" in 13 40 CFR 60.17, 40 CFR Part 60 Subpart KKK, 40 CFR Part 60 Subpart LLL, 14 and 40 CFR Part 60 Subpart OOOO promulgated by the Environmental 15 Protection Agency on August 16, 2012 in 77 FR 49490 and revised on 16 September 23, 2013 in 78 FR 58435 are hereby incorporated by 17 reference.] 18 19 KEY: air pollution, stationary sources, new source review 20 Date of Enactment or Last Substantive Amendment: [March 6, 2014]2015 21 Notice of Continuation: April 6, 2011 22 Authorizing, and Implemented or Interpreted Law: 19-2-104(3)(q); 23 19-2-108 24

ITEM 9

State of Utah
GARY R. HERBERT Governor
SPENCER J. COX
Lieutenant Governor
Department of Environmental Quality
Amanda Smith
Executive Director
DIVISION OF AIR QUALITY Bryce C. Bird
Director
DAQ-007-15
M E M O R A N D U M TO: Air Quality Board THROUGH: Bryce C. Bird, Executive Secretary FROM: Steven C. Packham, Toxicologist DATE: February 18, 2015 SUBJECT: PROPOSE FOR PUBLIC COMMENT: Amend R307-214. National Emission Standards
for Hazardous Air Pollutants. ______________________________________________________________________________________ The Utah Air Quality Rule R307-214, National Emission Standards for Hazardous Air Pollutants (NESHAPs), must be updated periodically to reflect changes to the NESHAPs as published in Title 40 of the Code of Federal Regulations (40 CFR) Parts 61 and 63. All published changes to 40 CFR Parts 61 and 63 from July 1, 2013, (the last update of R307-214) to June 30, 2014, are listed in the attached document. To reflect these changes R307-214 needs to be amended to incorporate by reference the July 1, 2014, version of 40 CFR Parts 61 and 63. Staff Recommendation: Staff recommends the Board propose the amended R307-214 for public comment.
195 North 1950 West • Salt Lake City, Utah Mailing Address: P.O. Box 144820 • Salt Lake City, Utah 84114-4820
Telephone (801) 536-4000 • Fax (801) 536-4099 • T.D.D. (801) 536-4414 www.deq.utah.gov
Printed on 100% recycled paper

Changes to 40 CFR Parts 61 and 63 – July 1, 2014 to June 30, 2014
Part 61 Rules and Regulations Changes July 1, 2013 to June 30, 2014
Revisions to Test Methods and Testing Regulations
Pages 11227 - 11294 [FR DOC # 2014-02704]
Part 63 Rules and Regulations Changes July 1, 2013 to June 30, 2014 National Emissions Standards for Hazardous Air Pollutants from Secondary Lead Smelting
Pages 367 - 372 [FR DOC # 2013-31267]
Revisions to Test Methods and Testing Regulations Pages 11227 - 11294 [FR DOC # 2014-02704]
National Emission Standards for Hazardous Air Pollutant Emissions: Group IV Polymers and Resins; Pesticide Active Ingredient Production; and Polyether Polyols Production
Pages 17339 - 17382 [FR DOC # 2014-04305]

R307-214 February 18, 2015 Page 1 of 7 R307. Environmental Quality, Air Quality. 1 R307-214. National Emission Standards for Hazardous Air Pollutants. 2 R307-214-1. Pollutants Subject to Part 61. 3 The provisions of Title 40 of the Code of Federal Regulations 4 (40 CFR) Part 61, National Emission Standards for Hazardous Air 5 Pollutants, effective as of July 1, [2013]2014, are incorporated into 6 these rules by reference. For pollutant emission standards delegated 7 to the State, references in 40 CFR Part 61 to "the Administrator" 8 shall refer to the director. 9 10 R307-214-2. Sources Subject to Part 63. 11 The provisions listed below of 40 CFR Part 63, National Emission 12 Standards for Hazardous Air Pollutants for Source Categories, 13 effective as of July 1, [2013]2014, are incorporated into these rules 14 by reference. References in 40 CFR Part 63 to "the Administrator" 15 shall refer to the director, unless by federal law the authority is 16 specific to the Administrator and cannot be delegated. 17 (1) 40 CFR Part 63, Subpart A, General Provisions. 18 (2) 40 CFR Part 63, Subpart B, Requirements for Control 19 Technology Determinations for Major Sources in Accordance with 42 20 U.S.C. 7412(g) and (j). 21 (3) 40 CFR Part 63, Subpart F, National Emission Standards for 22 Organic Hazardous Air Pollutants from the Synthetic Organic Chemical 23 Manufacturing Industry. 24 (4) 40 CFR Part 63, Subpart G, National Emission Standards for 25 Organic Hazardous Air Pollutants from the Synthetic Organic Chemical 26 Manufacturing Industry for Process Vents, Storage Vessels, Transfer 27 Operations, and Wastewater. 28 (5) 40 CFR Part 63, Subpart H, National Emission Standards for 29 Organic Hazardous Air Pollutants for Equipment Leaks. 30 (6) 40 CFR Part 63, Subpart I, National Emission Standards for 31 Organic Hazardous Air Pollutants for Certain Processes Subject to 32 the Negotiated Regulation for Equipment Leaks. 33 (7) 40 CFR Part 63, Subpart J, National Emission Standards for 34 Polyvinyl Chloride and Copolymers Production. 35 (8) 40 CFR Part 63, Subpart L, National Emission Standards for 36 Coke Oven Batteries. 37 (9) 40 CFR Part 63, Subpart M, National Perchloroethylene Air 38 Emission Standards for Dry Cleaning Facilities. 39 (10) 40 CFR Part 63, Subpart N, National Emission Standards 40 for Chromium Emissions From Hard and Decorative Chromium 41 Electroplating and Chromium Anodizing Tanks. 42 (11) 40 CFR Part 63, Subpart O, National Emission Standards 43 for Hazardous Air Pollutants for Ethylene Oxide Commercial 44 Sterilization and Fumigation Operations. 45 (12) 40 CFR Part 63, Subpart Q, National Emission Standards 46 for Hazardous Air Pollutants for Industrial Process Cooling Towers. 47 (13) 40 CFR Part 63, Subpart R, National Emission Standards 48 for Gasoline Distribution Facilities (Bulk Gasoline Terminals and 49 Pipeline Breakout Stations). 50 (14) 40 CFR Part 63, Subpart T, National Emission Standards 51

R307-214 February 18, 2015 Page 2 of 7 for Halogenated Solvent Cleaning. 1 (15) 40 CFR Part 63, Subpart U, National Emission Standards 2 for Hazardous Air Pollutant Emissions: Group I Polymers and Resins. 3 (16) 40 CFR Part 63, Subpart AA, National Emission Standards 4 for Hazardous Air Pollutants for Phosphoric Acid Manufacturing. 5 (17) 40 CFR Part 63, Subpart BB, National Emission Standards 6 for Hazardous Air Pollutants for Phosphate Fertilizer Production. 7 (18) 40 CFR Part 63, Subpart CC, National Emission Standards 8 for Hazardous Air Pollutants from Petroleum Refineries. 9 (19) 40 CFR Part 63, Subpart DD, National Emission Standards 10 for Hazardous Air Pollutants from Off-Site Waste and Recovery 11 Operations. 12 (20) 40 CFR Part 63, Subpart EE, National Emission Standards 13 for Magnetic Tape Manufacturing Operations. 14 (21) 40 CFR Part 63, Subpart GG, National Emission Standards 15 for Aerospace Manufacturing and Rework Facilities. 16 (22) 40 CFR Part 63, Subpart HH, National Emission Standards 17 for Hazardous Air Pollutants for Oil and Natural Gas Production. 18 (23) 40 CFR Part 63, Subpart JJ, National Emission Standards 19 for Wood Furniture Manufacturing Operations. 20 (24) 40 CFR Part 63, Subpart KK, National Emission Standards 21 for the Printing and Publishing Industry. 22 (25) 40 CFR Part 63, Subpart MM, National Emission Standards 23 for Hazardous Air Pollutants for Chemical Recovery Combustion Sources 24 at Kraft, Soda, Sulfite, and Stand-Alone Semichemical Pulp Mills. 25 (26) 40 CFR Part 63, Subpart OO, National Emission Standards 26 for Tanks - Level 1. 27 (27) 40 CFR Part 63, Subpart PP, National Emission Standards 28 for Containers. 29 (28) 40 CFR Part 63, Subpart QQ, National Emission Standards 30 for Surface Impoundments. 31 (29) 40 CFR Part 63, Subpart RR, National Emission Standards 32 for Individual Drain Systems. 33 (30) 40 CFR Part 63, Subpart SS, National Emission Standards 34 for Closed Vent Systems, Control Devices, Recovery Devices and Routing 35 to a Fuel Gas System or a Process (Generic MACT). 36 (31) 40 CFR Part 63, Subpart TT, National Emission Standards 37 for Equipment Leaks- Control Level 1 (Generic MACT). 38 (32) 40 CFR Part 63, Subpart UU, National Emission Standards 39 for Equipment Leaks-Control Level 2 Standards (Generic MACT). 40 (33) 40 CFR Part 63, Subpart VV, National Emission Standards 41 for Oil-Water Separators and Organic-Water Separators. 42 (34) 40 CFR Part 63, Subpart WW, National Emission Standards 43 for Storage Vessels (Tanks)-Control Level 2 (Generic MACT). 44 (35) 40 CFR Part 63, Subpart XX, National Emission Standards 45 for Ethylene Manufacturing Process Units: Heat Exchange Systems and 46 Waste Operations. 47 (36) 40 CFR Part 63, Subpart YY, National Emission Standards 48 for Hazardous Air Pollutants for Source Categories: Generic MACT. 49 (37) 40 CFR Part 63, Subpart CCC, National Emission Standards 50 for Hazardous Air Pollutants for Steel Pickling-HCl Process Facilities 51

R307-214 February 18, 2015 Page 3 of 7 and Hydrochloric Acid Regeneration Plants. 1 (38) 40 CFR Part 63, Subpart DDD, National Emission Standards 2 for Hazardous Air Pollutants for Mineral Wool Production. 3 (39) 40 CFR Part 63, Subpart EEE, National Emission Standards 4 for Hazardous Air Pollutants from Hazardous Waste Combustors. 5 (40) 40 CFR Part 63, Subpart GGG, National Emission Standards 6 for Hazardous Air Pollutants for Pharmaceuticals Production. 7 (41) 40 CFR Part 63, Subpart HHH, National Emission Standards 8 for Hazardous Air Pollutants for Natural Gas Transmission and Storage. 9 (42) 40 CFR Part 63, Subpart III, National Emission Standards 10 for Hazardous Air Pollutants for Flexible Polyurethane Foam 11 Production. 12 (43) 40 CFR Part 63, Subpart JJJ, National Emission Standards 13 for Hazardous Air Pollutants for Group IV Polymers and Resins. 14 (44) 40 CFR Part 63, Subpart LLL, National Emission Standards 15 for Hazardous Air Pollutants for Portland Cement Manufacturing 16 Industry. 17 (45) 40 CFR Part 63, Subpart MMM, National Emission Standards 18 for Hazardous Air Pollutants for Pesticide Active Ingredient 19 Production. 20 (46) 40 CFR Part 63, Subpart NNN, National Emission Standards 21 for Hazardous Air Pollutants for Wool Fiberglass Manufacturing. 22 (47) 40 CFR Part 63, Subpart OOO, National Emission Standards 23 for Hazardous Air Pollutants for Amino/Phenolic Resins Production 24 (Resin III). 25 (48) 40 CFR Part 63, Subpart PPP, National Emission Standards 26 for Hazardous Air Pollutants for Polyether Polyols Production. 27 (49) 40 CFR Part 63, Subpart QQQ, National Emission Standards 28 for Hazardous Air Pollutants for Primary Copper Smelters. 29 (50) 40 CFR Part 63, Subpart RRR, National Emission Standards 30 for Hazardous Air Pollutants for Secondary Aluminum Production. 31 (51) 40 CFR Part 63, Subpart TTT, National Emission Standards 32 for Hazardous Air Pollutants for Primary Lead Smelting. 33 (52) 40 CFR Part 63, Subpart UUU, National Emission Standards 34 for Hazardous Air Pollutants for Petroleum Refineries: Catalytic 35 Cracking Units, Catalytic Reforming Units, and Sulfur Recovery Units. 36 (53) 40 CFR Part 63, Subpart VVV, National Emission Standards 37 for Hazardous Air Pollutants: Publicly Owned Treatment Works. 38 (54) 40 CFR Part 63, Subpart AAAA, National Emission Standards 39 for Hazardous Air Pollutants for Municipal Solid Waste Landfills. 40 (55) 40 CFR Part 63, Subpart CCCC, National Emission Standards 41 for Manufacturing of Nutritional Yeast. 42 (56) 40 CFR Part 63, Subpart DDDD, National Emission Standards 43 for Hazardous Air Pollutants for Plywood and Composite Wood Products. 44 (57) 40 CFR Part 63, Subpart EEEE, National Emission Standards 45 for Hazardous Air Pollutants for Organic Liquids Distribution 46 (non-gasoline). 47 (58) 40 CFR Part 63, Subpart FFFF, National Emission Standards 48 for Hazardous Air Pollutants for Miscellaneous Organic Chemical 49 Manufacturing. 50 (59) 40 CFR Part 63, Subpart GGGG, National Emission Standards 51

R307-214 February 18, 2015 Page 4 of 7 for Vegetable Oil Production; Solvent Extraction. 1 (60) 40 CFR Part 63, Subpart HHHH, National Emission Standards 2 for Wet-Formed Fiberglass Mat Production. 3 (61) 40 CFR Part 63, Subpart IIII, National Emission Standards 4 for Hazardous Air Pollutants for Surface Coating of Automobiles and 5 Light-Duty Trucks. 6 (62) 40 CFR Part 63, Subpart JJJJ, National Emission Standards 7 for Hazardous Air Pollutants for Paper and Other Web Surface Coating 8 Operations. 9 (63) 40 CFR Part 63, Subpart KKKK, National Emission Standards 10 for Hazardous Air Pollutants for Surface Coating of Metal Cans. 11 (64) 40 CFR Part 63, Subpart MMMM, National Emission Standards 12 for Hazardous Air Pollutants for Surface Coating of Miscellaneous 13 Metal Parts and Products. 14 (65) 40 CFR Part 63, Subpart NNNN, National Emission Standards 15 for Large Appliances Surface Coating Operations. 16 (66) 40 CFR Part 63, Subpart OOOO, National Emission Standards 17 for Hazardous Air Pollutants for Fabric Printing, Coating and Dyeing 18 Surface Coating Operations. 19 (67) 40 CFR Part 63, Subpart PPPP, National Emissions Standards 20 for Hazardous Air Pollutants for Surface Coating of Plastic Parts 21 and Products. 22 (68) 40 CFR Part 63, Subpart QQQQ, National Emission Standards 23 for Hazardous Air Pollutants for Surface Coating of Wood Building 24 Products. 25 (69) 40 CFR Part 63, Subpart RRRR, National Emission Standards 26 for Hazardous Air Pollutants for Metal Furniture Surface Coating 27 Operations. 28 (70) 40 CFR Part 63, Subpart SSSS, National Emission Standards 29 for Metal Coil Surface Coating Operations. 30 (71) 40 CFR Part 63, Subpart TTTT, National Emission Standards 31 for Leather Tanning and Finishing Operations. 32 (72) 40 CFR Part 63, Subpart UUUU, National Emission Standards 33 for Cellulose Product Manufacturing. 34 (73) 40 CFR Part 63, Subpart VVVV, National Emission Standards 35 for Boat Manufacturing. 36 (74) 40 CFR Part 63, Subpart WWWW, National Emissions Standards 37 for Hazardous Air Pollutants for Reinforced Plastic Composites 38 Production. 39 (75) 40 CFR Part 63, Subpart XXXX, National Emission Standards 40 for Tire Manufacturing. 41 (76) 40 CFR Part 63, Subpart YYYY, National Emission Standards 42 for Hazardous Air Pollutants for Stationary Combustion Turbines. 43 (77) 40 CFR Part 63, Subpart ZZZZ, National Emission Standards 44 for Hazardous Air Pollutants for Stationary Reciprocating Internal 45 Combustion Engines. 46 (78) 40 CFR Part 63, Subpart AAAAA, National Emission Standards 47 for Hazardous Air Pollutants for Lime Manufacturing Plants. 48 (79) 40 CFR Part 63, Subpart BBBBB, National Emission Standards 49 for Hazardous Air Pollutants for Semiconductor Manufacturing. 50 (80) 40 CFR Part 63, Subpart CCCCC, National Emission Standards 51

R307-214 February 18, 2015 Page 5 of 7 for Hazardous Air Pollutants for Coke Ovens: Pushing, Quenching, and 1 Battery Stacks. 2 (81) 40 CFR Part 63, Subpart DDDDD, National Emission Standards 3 for Hazardous Air Pollutants for Industrial, Commercial, and 4 Institutional Boilers and Process Heaters. 5 (82) 40 CFR Part 63, Subpart EEEEE, National Emission Standards 6 for Hazardous Air Pollutants for Iron and Steel Foundries. 7 (83) 40 CFR Part 63, Subpart FFFFF, National Emission Standards 8 for Hazardous Air Pollutants for Integrated Iron and Steel 9 Manufacturing. 10 (84) 40 CFR Part 63, Subpart GGGGG, National Emission Standards 11 for Hazardous Air Pollutants for Site Remediation. 12 (85) 40 CFR Part 63, Subpart HHHHH, National Emission Standards 13 for Hazardous Air Pollutants for Miscellaneous Coating Manufacturing. 14 (86) 40 CFR Part 63, Subpart IIIII, National Emission Standards 15 for Hazardous Air Pollutants for Mercury Emissions from Mercury Cell 16 Chlor-Alkali Plants. 17 (87) 40 CFR Part 63, Subpart JJJJJ, National Emission Standards 18 for Hazardous Air Pollutants for Brick and Structural Clay Products 19 Manufacturing. 20 (88) 40 CFR Part 63, Subpart KKKKK, National Emission Standards 21 for Hazardous Air Pollutants for Clay Ceramics Manufacturing. 22 (89) 40 CFR Part 63, Subpart LLLLL, National Emission Standards 23 for Hazardous Air Pollutants for Asphalt Processing and Asphalt 24 Roofing Manufacturing. 25 (90) 40 CFR Part 63, Subpart MMMMM, National Emission Standards 26 for Hazardous Air Pollutants for Flexible Polyurethane Foam 27 Fabrication Operations. 28 (91) 40 CFR Part 63, Subpart NNNNN, National Emission Standards 29 for Hazardous Air Pollutants for Hydrochloric Acid Production. 30 (92) 40 CFR Part 63, Subpart PPPPP, National Emission Standards 31 for Hazardous Air Pollutants for Engine Test Cells/Stands. 32 (93) 40 CFR Part 63, Subpart QQQQQ, National Emission Standards 33 for Hazardous Air Pollutants for Friction Materials Manufacturing 34 Facilities. 35 (94) 40 CFR Part 63, Subpart RRRRR, National Emission Standards 36 for Hazardous Air Pollutants for Taconite Iron Ore Processing. 37 (95) 40 CFR Part 63, Subpart SSSSS, National Emission Standards 38 for Hazardous Air Pollutants for Refractory Products Manufacturing. 39 (96) 40 CFR Part 63, Subpart TTTTT, National Emission Standards 40 for Hazardous Air Pollutants for Primary Magnesium Refining. 41 (97) 40 CFR Part 63, Subpart UUUUU, National Emission Standards 42 for Hazardous Air Pollutants for Coal- and Oil-Fired Electric Utility 43 Steam Generating Units. 44 (98) 40 CFR Part 63, Subpart WWWWW, National Emission Standards 45 for Hospital Ethylene Oxide Sterilizers. 46 (99) 40 CFR Part 63, Subpart YYYYY, National Emission Standards 47 for Hazardous Air Pollutants for Area Sources: Electric Arc Furnace 48 Steelmaking Facilities. 49 (100) 40 CFR Part 63, Subpart ZZZZZ, National Emission Standards 50 for Hazardous Air Pollutants for Iron and Steel Foundries Area Sources. 51
R307-214 February 18, 2015 Page 6 of 7 (101) 40 CFR Part 63 Subpart BBBBBB National Emission Standards 1 for Hazardous Air Pollutants for Source Category: Gasoline 2 Distribution Bulk Terminals, Bulk Plants, and Pipeline Facilities 3 (102) 40 CFR Part 63 Subpart CCCCCC National Emission Standards 4 for Hazardous Air Pollutants for Source Category: Gasoline Dispensing 5 Facilities. 6 (103) 40 CFR Part 63, Subpart DDDDDD, National Emission 7 Standards for Hazardous Air Pollutants for Polyvinyl Chloride and 8 Copolymers Production Area Sources. 9 (104) 40 CFR Part 63, Subpart EEEEEE, National Emission 10 Standards for Hazardous Air Pollutants for Primary Copper Smelting 11 Area Sources. 12 (105) 40 CFR Part 63, Subpart FFFFFF, National Emission 13 Standards for Hazardous Air Pollutants for Secondary Copper Smelting 14 Area Sources. 15 (106) 40 CFR Part 63, Subpart GGGGGG, National Emission 16 Standards for Hazardous Air Pollutants for Primary Nonferrous Metals 17 Area Sources--Zinc, Cadmium, and Beryllium. 18 (107) 40 CFR Part 63, Subpart JJJJJJ, National Emission 19 Standards for Hazardous Air Pollutants for Industrial, Commercial, 20 and Institutional Boilers Area Sources. 21 (108) 40 CFR Part 63, Subpart LLLLLL, National Emission 22 Standards for Hazardous Air Pollutants for Acrylic and Modacrylic 23 Fibers Production Area Sources. 24 (109) 40 CFR Part 63, Subpart MMMMMM, National Emission 25 Standards for Hazardous Air Pollutants for Carbon Black Production 26 Area Sources. 27 (110) 40 CFR Part 63, Subpart NNNNNN, National Emission 28 Standards for Hazardous Air Pollutants for Chemical Manufacturing 29 Area Sources: Chromium Compounds. 30 (111) 40 CFR Part 63, Subpart OOOOOO, National Emission 31 Standards for Hazardous Air Pollutants for Flexible Polyurethane Foam 32 Production and Fabrication Area Sources. 33 (112) 40 CFR Part 63, Subpart PPPPPP, National Emission 34 Standards for Hazardous Air Pollutants for Lead Acid Battery 35 Manufacturing Area Sources. 36 (113) 40 CFR Part 63, Subpart QQQQQQ, National Emission 37 Standards for Hazardous Air Pollutants for Wood Preserving Area 38 Sources. 39 (114) 40 CFR Part 63, Subpart RRRRRR, National Emission 40 Standards for Hazardous Air Pollutants for Clay Ceramics Manufacturing 41 Area Sources. 42 (115) 40 CFR Part 63, Subpart SSSSSS, National Emission 43 Standards for Hazardous Air Pollutants for Glass Manufacturing Area 44 Sources. 45 (116) 40 CFR Part 63, Subpart VVVVVV, National Emission 46 Standards for Hazardous Air Pollutants for Chemical Manufacturing 47 Area Sources. 48 (117) 40 CFR Part 63, Subpart TTTTTT, National Emission 49 Standards for Hazardous Air Pollutants for Secondary Nonferrous Metals 50 Processing Area Sources. 51

R307-214 February 18, 2015 Page 7 of 7 (118) 40 CFR Part 63, Subpart WWWWWW, National Emission 1 Standards for Hazardous Air Pollutants: Area Source Standards for 2 Plating and Polishing Operations. 3 (119) 40 CFR Part 63, Subpart XXXXXX, National Emission 4 Standards for Hazardous Air Pollutants Area Source Standards for Nine 5 Metal Fabrication and Finishing Source Categories. 6 (120) 40 CFR Part 63, Subpart YYYYYY, National Emission 7 Standards for Hazardous Air Pollutants for Area Sources: Ferroalloys 8 Production Facilities. 9 (121) 40 CFR Part 63, Subpart ZZZZZZ, National Emission 10 Standards for Hazardous Air Pollutants: Area Source Standards for 11 Aluminum, Copper, and Other Nonferrous Foundries. 12 (122) 40 CFR Part 63, Subpart AAAAAAA, National Emission 13 Standards for Hazardous Air Pollutants for Area Sources: Asphalt 14 Processing and Asphalt Roofing Manufacturing. 15 (123) 40 CFR Part 63, Subpart BBBBBBB, National Emission 16 Standards for Hazardous Air Pollutants for Area Sources: Chemical 17 Preparations Industry. 18 (124) 40 CFR Part 63, Subpart CCCCCCC, National Emission 19 Standards for Hazardous Air Pollutants for Area Sources: Paints and 20 Allied Products Manufacturing. 21 (125) 40 CFR Part 63, Subpart DDDDDDD, National Emission 22 Standards for Hazardous Air Pollutants for Area Sources: Prepared 23 Feeds Manufacturing. 24 (126) 40 CFR Part 63, Subpart EEEEEEE, National Emission 25 Standards for Hazardous Air Pollutants: Gold Mine Ore Processing and 26 Production Area Source Category. 27 28 KEY: air pollution, hazardous air pollutant, MACT, NESHAP 29 Date of Enactment or Last Substantive Amendment: [August 7, 2014]2015 30 Notice of Continuation: November 8, 2012 31 Authorizing, and Implemented or Interpreted Law: 19-2-104(1)(a) 32

ITEM 10

State of Utah
GARY R. HERBERT Governor
SPENCER J. COX
Lieutenant Governor
Department of Environmental Quality
Amanda Smith
Executive Director
DIVISION OF AIR QUALITY Bryce C. Bird
Director
DAQA-194-15
M E M O R A N D U M TO: Air Quality Board FROM: Bryce C. Bird, Executive Secretary DATE: February 10, 2015 SUBJECT: Air Toxics, Lead-Based Paint, and Asbestos (ATLAS) Section Compliance Activities –
January 2015 ______________________________________________________________________________________ MACT Compliance Inspections 3
Asbestos Demolition/Renovation NESHAP Inspections 35
Asbestos AHERA Inspections 41
Asbestos State Rules Only Inspections 8
Asbestos Notifications Accepted 95
Asbestos Telephone Calls Answered 425
Asbestos Individuals Certifications Approved/Disapproved 127/4
Asbestos Company Certifications/Re-Certifications 3/20
Asbestos Alternate Work Practices Approved/Disapproved 4/0
Lead-Based Paint (LBP) Inspections 9
LBP Notifications Approved 0
LBP Telephone Calls Answered 64
LBP Letters Prepared and Mailed 56
LBP Courses Reviewed/Approved 0/0
LBP Course Audits 2
LBP Individual Certifications Approved/Disapproved 20/2
195 North 1950 West • Salt Lake City, UT Mailing Address: P.O. Box 144820 • Salt Lake City, UT 84114-4820
Telephone (801) 536-4000 • Fax (801) 536-4099 • T.D.D (801) 536-4414 www.deq.utah.gov
Printed on 100% recycled paper

DAQA-194-15 Page 2 LBP Firm Certifications 10
Notices of Violation Issued 0
Compliance Advisories Issued 24
Warning Letters Issued 10
Settlement Agreements Finalized 1
Penalties Agreed to:
Cacique, Inc. $1,442.00
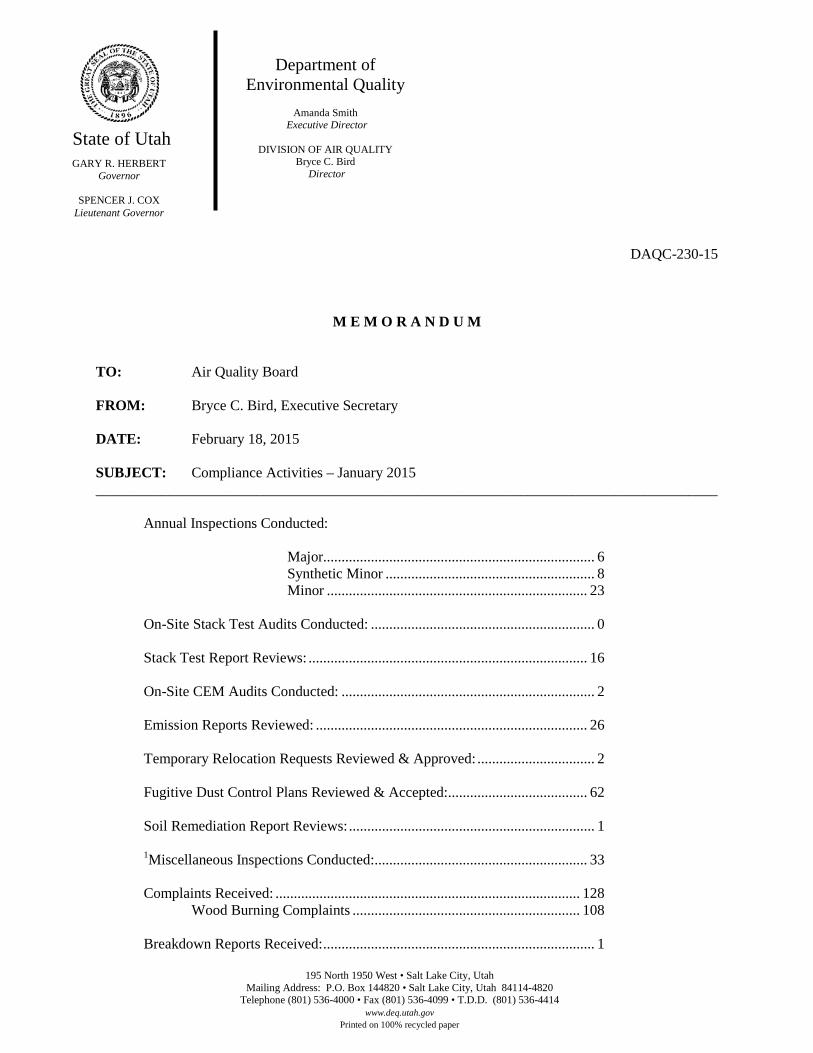
State of Utah
GARY R. HERBERT Governor
SPENCER J. COX
Lieutenant Governor
Department of Environmental Quality
Amanda Smith
Executive Director
DIVISION OF AIR QUALITY Bryce C. Bird
Director
DAQC-230-15
M E M O R A N D U M TO: Air Quality Board FROM: Bryce C. Bird, Executive Secretary DATE: February 18, 2015 SUBJECT: Compliance Activities – January 2015 _____________________________________________________________________________________
Annual Inspections Conducted:
Major.......................................................................... 6 Synthetic Minor ......................................................... 8 Minor ....................................................................... 23
On-Site Stack Test Audits Conducted: ............................................................. 0 Stack Test Report Reviews: ............................................................................ 16 On-Site CEM Audits Conducted: ..................................................................... 2 Emission Reports Reviewed: .......................................................................... 26
Temporary Relocation Requests Reviewed & Approved: ................................ 2
Fugitive Dust Control Plans Reviewed & Accepted: ...................................... 62 Soil Remediation Report Reviews: ................................................................... 1 1Miscellaneous Inspections Conducted: .......................................................... 33 Complaints Received: ................................................................................... 128 Wood Burning Complaints .............................................................. 108 Breakdown Reports Received: .......................................................................... 1
195 North 1950 West • Salt Lake City, Utah Mailing Address: P.O. Box 144820 • Salt Lake City, Utah 84114-4820
Telephone (801) 536-4000 • Fax (801) 536-4099 • T.D.D. (801) 536-4414 www.deq.utah.gov
Printed on 100% recycled paper

DAQC-230-15 Page 2
Compliance Actions Resulting From a Breakdown .......................................... 0 Warning Letters Issued: .................................................................................... 0 Notices of Violation Issued: .............................................................................. 0 Compliance Advisories Issued: ....................................................................... 16 Wood Burning ................................................................................... 11 Settlement Agreements Reached: ..................................................................... 2
CCI Paradox Mainstream – Bullhorn .................................... $5,600.00 Wood Burning Violation (Utah County) .................................... $25.00
1Miscellaneous inspections include, e.g., surveillance, level I inspections, VOC inspections, complaints, on-site training, dust patrol, smoke patrol, open burning, etc.


Utah Division of Air Quality
0
10
20
30
40
50
60
70
80
1 2 3 4 5 6 7 8 9 10 11 12 13 14 15 16 17 18 19 20 21 22 23 24 25 26 27 28 29 30 31
PM2.
5 (u
g/m
3)
Days
Utah 24-Hr PM2.5 Data January 2015Bountiful Brigham City Hawthorne
Hurricane Lindon Logan
Magna North Provo Ogden
Rose Park Smithfield Spanish Fork
Tooele 24-hr Exceedence Value is 35 ug/m3 Heber
Exceedence Value is 35 ug/m3

Utah Division of Air Quality
0
10
20
30
40
50
60
70
80
1 2 3 4 5 6 7 8 9 10 11 12 13 14 15 16 17 18 19 20 21 22 23 24 25 26 27 28
PM2.
5 (u
g/m
3)
Days
Utah 24-Hr PM2.5 Data February 2015Bountiful Brigham City Hawthorne HurricaneLindon Logan Magna North ProvoOgden Rose Park Spanish Fork Tooele24-hr Standard is 35 ug/m3
Standard is 35 ug/m3

Utah Division of Air Quality
0
20
40
60
80
100
120
140
160
1 2 3 4 5 6 7 8 9 10 11 12 13 14 15 16 17 18 19 20 21 22 23 24 25 26 27 28 29 30 31
PM10
(ug/
m3)
Days
Utah 24-hr PM10 Data January 2015Hawthorne HerrimanHurricane LindonLogan MagnaNorth Provo OgdenSmithfield 24-hr Exceedance Value is 150 ug/m3
Exceedance Value is 155 ug/m3

Utah Division of Air Quality
0
20
40
60
80
100
120
140
160
1 2 3 4 5 6 7 8 9 10 11 12 13 14 15 16 17 18 19 20 21 22 23 24 25 26 27 28
PM10
(ug/
m3)
Days
Utah 24-hr PM10 Data February 2015Hawthorne HerrimanHurricane LindonLogan MagnaNorth Provo Ogden24-hr Exceedance Value is 150 ug/m3
Exceedance Value is 155 ug/m3

-4.7-3.3
-0.7
2.3
6.8
10.49.0
7.9
6.6
3.7
7.0
4.2 3.2
0.93.2
3.8
8.5
11.6
7.9
4.6
2.1
4.0
3.2
4.5
10.2 10.2
14.0
9.8
7.16.3
7.6
-10.0
0.0
10.0
20.0
30.0
40.0
50.0
60.0
70.0
0.000
0.010
0.020
0.030
0.040
0.050
0.060
0.070
0.080
1 2 3 4 5 6 7 8 9 10 11 12 13 14 15 16 17 18 19 20 21 22 23 24 25 26 27 28 29 30 31
Dai
ly M
axim
um T
empe
ratu
re (S
LC)
Ozo
ne (p
pm)
Days
Highest 8-hr Ozone Concentration & Daily Maximum Temperature January 2015
Bountiful Herriman #3 Hawthorne Ogden #2 Exceed. TM

-10.3
-6.6
-3.9-2.5
1.5
6.6 5.75.3
-0.71.0
2.2
1.8
6.2
-1.8 -0.8
0.0 -0.1
-1.3 -2.3
1.1 1.8
1.1
3.1
2.2
6.0
8.78.1
10.910.3
4.1
6.5
-15.0
-5.0
5.0
15.0
25.0
35.0
45.0
55.0
65.0
0.000
0.010
0.020
0.030
0.040
0.050
0.060
0.070
0.080
1 2 3 4 5 6 7 8 9 10 11 12 13 14 15 16 17 18 19 20 21 22 23 24 25 26 27 28 29 30 31
Dai
ly M
axim
um T
empe
ratu
re (
SLC
)
Ozo
ne (
ppm
)
Days
Highest 8-hr Ozone Concentration & Daily Maximum Temperature January 2015
Price #2 Roosevelt Vernal #4 Exceed. TM

-9.4-7.5
-2.6
0.6
3.4
6.35.5
4.1
-1.1-1.3
3.82.0
0.7
-2.0-2.1
2.3
1.3
7.38.0
2.0
-0.3
0.4 0.8
0.0
6.57.2
6.26.2
3.5 4.0
4.9
-20.0
-10.0
0.0
10.0
20.0
30.0
40.0
50.0
60.0
0.000
0.010
0.020
0.030
0.040
0.050
0.060
0.070
0.080
1 2 3 4 5 6 7 8 9 10 11 12 13 14 15 16 17 18 19 20 21 22 23 24 25 26 27 28 29 30 31
Dai
ly M
axim
um T
empe
ratu
re (S
LC)
Ozo
ne (p
pm)
Days
Highest 8-hr Ozone Concentration & Daily Maximum Temperature January 2015
Logan #4 Exceed. TM
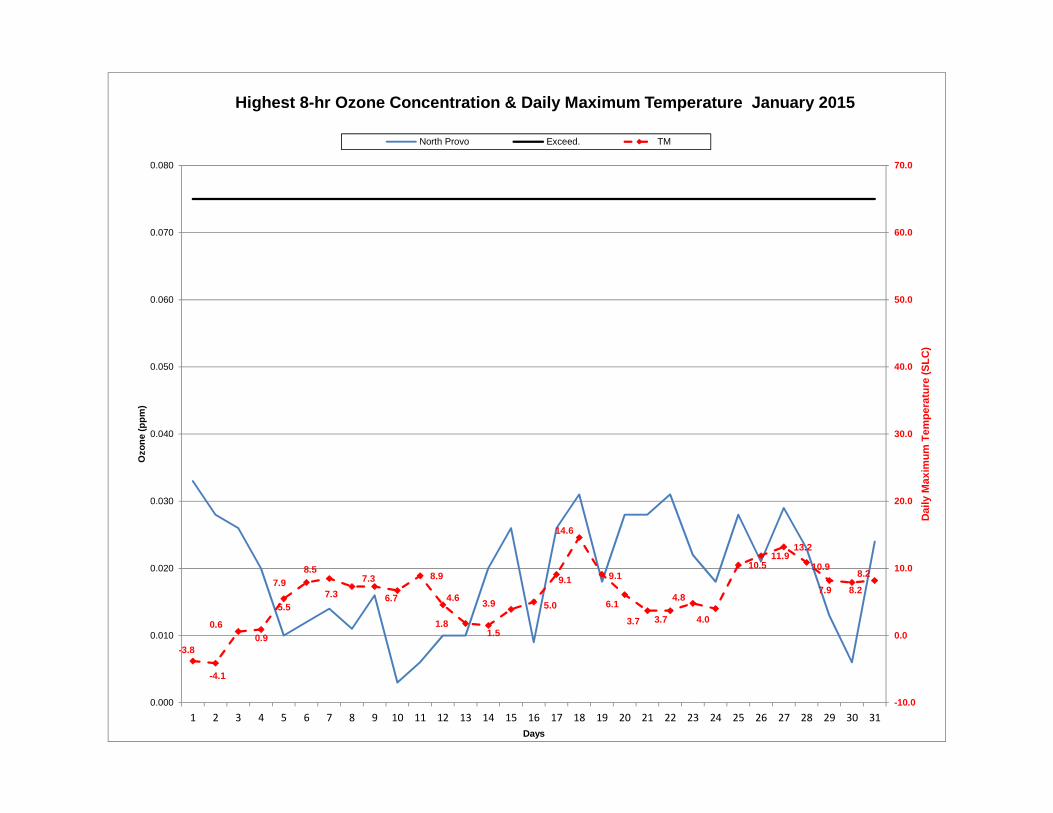
-3.8
-4.1
0.60.9
5.5
7.98.5
7.37.3
6.7
8.9
4.6
1.81.5
3.9 5.0
9.1
14.6
9.1
6.1
3.7 3.7
4.8
4.0
10.511.9
13.2
10.9
8.27.9
8.2
-10.0
0.0
10.0
20.0
30.0
40.0
50.0
60.0
70.0
0.000
0.010
0.020
0.030
0.040
0.050
0.060
0.070
0.080
1 2 3 4 5 6 7 8 9 10 11 12 13 14 15 16 17 18 19 20 21 22 23 24 25 26 27 28 29 30 31
Dai
ly M
axim
um T
empe
ratu
re (S
LC)
Ozo
ne (p
pm)
Days
Highest 8-hr Ozone Concentration & Daily Maximum Temperature January 2015
North Provo Exceed. TM

1.52.7
5.46.8
9.9
14.2
16.8
15.815.6
10.1
12.411.5
9.211.6
11.912.0 12.6
14.112.1
10.5
9.8 9.8
13.7 15.6
17.2 20.2
15.1
13.2
14.8
12.0
12.2
-10.0
0.0
10.0
20.0
30.0
40.0
50.0
60.0
70.0
0.000
0.010
0.020
0.030
0.040
0.050
0.060
0.070
0.080
1 2 3 4 5 6 7 8 9 10 11 12 13 14 15 16 17 18 19 20 21 22 23 24 25 26 27 28 29 30 31
Ozo
ne (
ppm
)
Days
Highest 8-hr Ozone Concentration & Daily Maximum Temperature January 2015Hurricane Exceed. TM

8.6
12.5
14.513.6
19.1 19.5 19.0
17.214.4
9.4
11.3
14.1
14.115.0
10.3
8.3 7.9
0
5
10
15
20
25
30
35
40
45
50
55
60
65
70
75
80
85
90
95
100
0.000
0.010
0.020
0.030
0.040
0.050
0.060
0.070
0.080
0.090
0.100
1 2 3 4 5 6 7 8 9 10 11 12 13 14 15 16 17 18 19 20 21 22 23 24 25 26 27 28
Dai
ly M
axim
um T
empe
ratu
re (0 C
) (H
awth
orne
)
Ozo
ne (p
pm)
Days
Highest 8-hr Ozone Concentration & Daily Maximum Temperature February 2015
Bountiful Herriman #3 Hawthorne Ogden #2 Exceed. TM

6.9
11.212.5
14.3
12.2
16.2
17.6
16.615.8
13.0
13.3
11.0
14.4
11.9
13.7
7.57.6
-10
-5
0
5
10
15
20
25
30
35
40
45
50
55
60
65
70
75
80
85
90
0.000
0.010
0.020
0.030
0.040
0.050
0.060
0.070
0.080
0.090
0.100
1 2 3 4 5 6 7 8 9 10 11 12 13 14 15 16 17 18 19 20 21 22 23 24 25 26 27 28
Dai
ly M
axim
um T
empe
ratu
re (
0 C)
(Roo
seve
lt)
Ozo
ne (
ppm
)
Days
Highest 8-hr Ozone Concentration & Daily Maximum Temperature February 2015
Price #2 Roosevelt Vernal #4 Exceed. TM

4.7
9.710.9
10.2
15.117.0
16.6
14.7 12.9
7.9
9.6 12.4
13.5 12.9
10.7
7.36.5
-10.0
-5.0
0.0
5.0
10.0
15.0
20.0
25.0
30.0
35.0
40.0
45.0
50.0
55.0
60.0
65.0
70.0
75.0
80.0
85.0
90.0
0.000
0.010
0.020
0.030
0.040
0.050
0.060
0.070
0.080
0.090
0.100
1 2 3 4 5 6 7 8 9 10 11 12 13 14 15 16 17 18 19 20 21 22 23 24 25 26 27 28
Dai
ly M
axim
um T
empe
ratu
re (0 C
) (L
ogan
#4)
Ozo
ne (
ppm
)
Days
Highest 8-hr Ozone Concentration & Daily Maximum Temperature February 2015
Logan #4 Exceed. TM

9.6
12.9
14.914.6
19.6 19.719.1
18.2 16.1
10.412.2
15.4
16.0 16.9
11.5
9.0
10.0
-10.0
-5.0
0.0
5.0
10.0
15.0
20.0
25.0
30.0
35.0
40.0
45.0
50.0
55.0
60.0
65.0
70.0
75.0
80.0
85.0
90.0
0.000
0.010
0.020
0.030
0.040
0.050
0.060
0.070
0.080
0.090
0.100
1 2 3 4 5 6 7 8 9 10 11 12 13 14 15 16 17 18 19 20 21 22 23 24 25 26 27 28
Dai
ly M
axim
um T
empe
ratu
re (0 C
) (N
orth
Pro
vo)
Ozo
ne (p
pm)
Days
Highest 8-hr Ozone Concentration & Daily Maximum Temperature February 2015
North Provo Exceed. TM

13.7
15.315.4
17.5 18.719.6
19.8
21.2 21.0
18.0 18.6
19.121.5 21.5
19.9
16.5 14.7
0.0
5.0
10.0
15.0
20.0
25.0
30.0
35.0
40.0
45.0
50.0
55.0
60.0
65.0
70.0
75.0
80.0
85.0
90.0
95.0
100.0
0.000
0.010
0.020
0.030
0.040
0.050
0.060
0.070
0.080
0.090
0.100
1 2 3 4 5 6 7 8 9 10 11 12 13 14 15 16 17 18 19 20 21 22 23 24 25 26 27 28
Dai
ly M
axim
um T
empe
ratu
re (
0 C)
(Hur
rican
e)
Ozo
ne (
ppm
)
Days
Highest 8-hr Ozone Concentration & Daily Maximum Temperature February 2015
Hurricane Exceed. TM