Embed Size (px)
Citation preview

© 2015 Hay Group. All rights reserved.
www.haygroup.com
State of Utah Employee Other Postemployment Benefit Plan
December 31, 2014 Actuarial Valuation GASB Statements No. 43 and 45
Hay Group, Inc. 5001 Spring Valley Road Suite 800 West Dallas, TX 75244
Robert E. Russell ASA, MAAA, FCA

www.haygroup.com
Contents
1. ..... Executive Summary ............................................ 1
2. ..... Description of GASB 45 ...................................... 7
3. ..... The Valuation Results ....................................... 10
4. ..... Funding .............................................................. 11
5. ..... Actuarial Assumptions ..................................... 13
6. ..... Financial Accounting Information.................... 17
7. ..... Summary of Plan Provisions ............................ 20
8. ..... Participant Data ................................................. 23
9. ..... Appendices ........................................................ 25
9.1. Actuarial Assumptions .............................................. 25
9.2. 20 Year Projection of OPEB Cost and Net Cash Flow
(retiree claims costs less retiree contributions) ...................... 31

1/31 Post-Employment Health Benefit Plan www.haygroup.com
1. Executive Summary
The State of Utah (the State) sponsors the State Employee Other Postemployment Benefit Plan
(State Employee OPEB Plan) in which retirees participate in health insurance and life insurance
benefits. Eligible retirees and their dependents may continue health care coverage through the
State plan upon retirement.
The updated calculations in this GASB 43/45 report were made as of December 31, 2014 using
census data which was provided by the State and health care premium information and plan
provisions in effect as of the date of the 2014 valuation.
The ending Net OPEB Obligation/(Asset) was ($5,667,558) as of June 30, 2015.
GASB Accounting Standard
The Governmental Accounting Standards Board in 2004 finalized an accounting standard (GASB
45) Accounting and Financial Reporting by Employers for Postemployment Benefits Other Than
Pensions (OPEB). This standard requires the State to account for these benefits on an accrual
basis. A brief description of the GASB accounting standard can be found in Section 2. The
purpose of this report is to provide the State with the Actuarial Accrued Liability and the accrual
costs that the State will book as the Annual OPEB Cost for the fiscal years beginning in 2015 and
2016.
Amortization Periods
The GASB standard also allows a choice of amortization periods, with a maximum amortization
period of 30 years. The results are presented using a 10-year open amortization period for the
Unfunded Actuarial Accrued Liability; the prior valuation in 2012 used a 20-year open
amortization period.
Actuarial Cost Method
A fundamental principle in financing the liabilities of any retirement program is that the cost of
the benefits should be related to the period in which benefits are earned, rather than to the period
of benefit distribution. The current GASB 45 standard requires the choice of one of six different
actuarial cost methods.
2/31 Post-Employment Health Benefit Plan www.haygroup.com
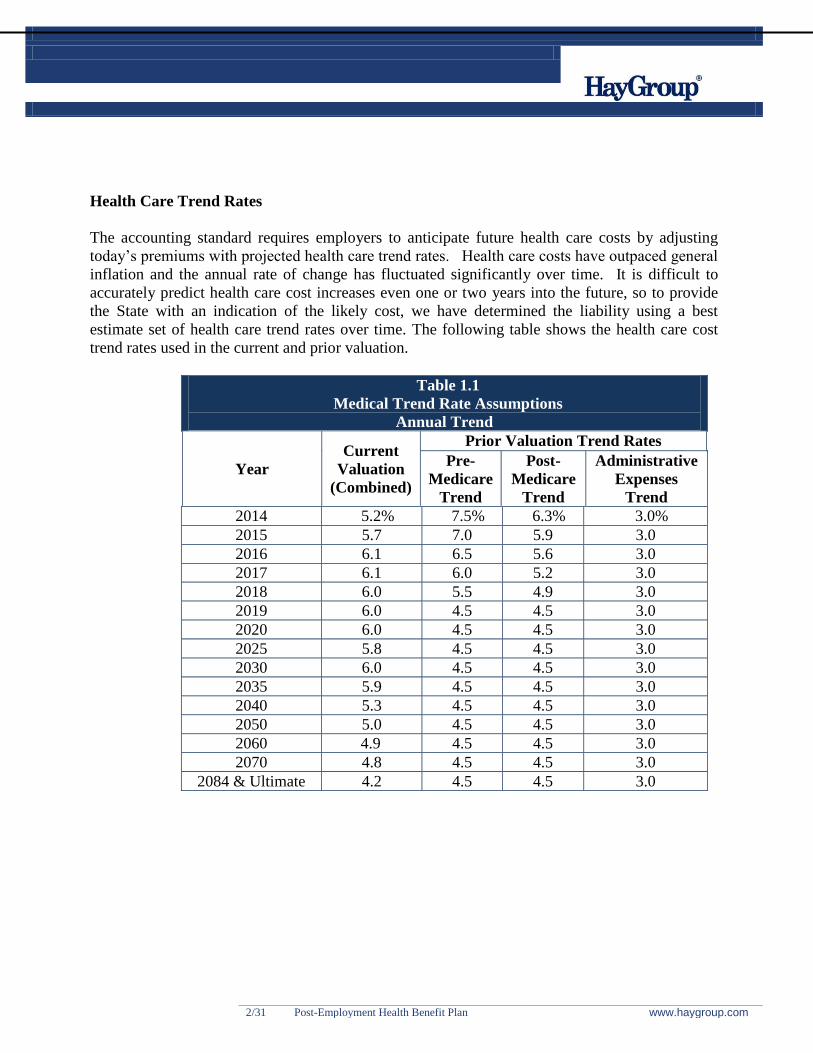
Health Care Trend Rates
The accounting standard requires employers to anticipate future health care costs by adjusting
today’s premiums with projected health care trend rates. Health care costs have outpaced general
inflation and the annual rate of change has fluctuated significantly over time. It is difficult to
accurately predict health care cost increases even one or two years into the future, so to provide
the State with an indication of the likely cost, we have determined the liability using a best
estimate set of health care trend rates over time. The following table shows the health care cost
trend rates used in the current and prior valuation.
Table 1.1
Medical Trend Rate Assumptions
Annual Trend
Year
Current
Valuation
(Combined)
Prior Valuation Trend Rates
Pre-
Medicare
Trend
Post-
Medicare
Trend
Administrative
Expenses
Trend
2014 5.2% 7.5% 6.3% 3.0%
2015 5.7 7.0 5.9 3.0
2016 6.1 6.5 5.6 3.0
2017 6.1 6.0 5.2 3.0
2018 6.0 5.5 4.9 3.0
2019 6.0 4.5 4.5 3.0
2020 6.0 4.5 4.5 3.0
2025 5.8 4.5 4.5 3.0
2030 6.0 4.5 4.5 3.0
2035 5.9 4.5 4.5 3.0
2040 5.3 4.5 4.5 3.0
2050 5.0 4.5 4.5 3.0
2060 4.9 4.5 4.5 3.0
2070 4.8 4.5 4.5 3.0
2084 & Ultimate 4.2 4.5 4.5 3.0

3/31 Post-Employment Health Benefit Plan www.haygroup.com
Funding
The State established an irrevocable retiree health trust fund in 2007 to begin advance funding the
benefits. A description of the proposed funding policy and source of funds is provided in Section
4.
Key Valuation Results
We have measured the post-employment medical liabilities for the retirees currently covered by
the post-employment health plans and for active employees covered under the State Employees’
Other Postemployment Benefit Plan as of December 31, 2014. The liabilities were calculated
using a discount rate of 4.5 percent, which is the same discount rate used in the prior valuation.
In Table 1.2 we have shown three measures of the liability: the present value of future benefits,
the actuarial accrued liability, and the normal cost. The present value of future benefits is the
discounted present value of all future employer-paid health premiums for both current and future
retirees. The actuarial accrued liability is the portion of the present value of future benefits
attributable to employee service rendered prior to measurement date. The normal cost is the
portion of the present value of benefits earned in the fiscal year. The table also shows the market
value of assets and the unfunded actuarial accrued liability.
The present value of future benefits, actuarial accrued liability, and normal cost has decreased
significantly since the prior valuation. The key reasons for the decrease are:
Decrease in number of active employees who were hired prior to 2006;
Decrease in average Program I balances for remaining retirees and active
employees;
Increase in Trust assets
The complete valuation results are shown Section 3.
4/31 Post-Employment Health Benefit Plan www.haygroup.com
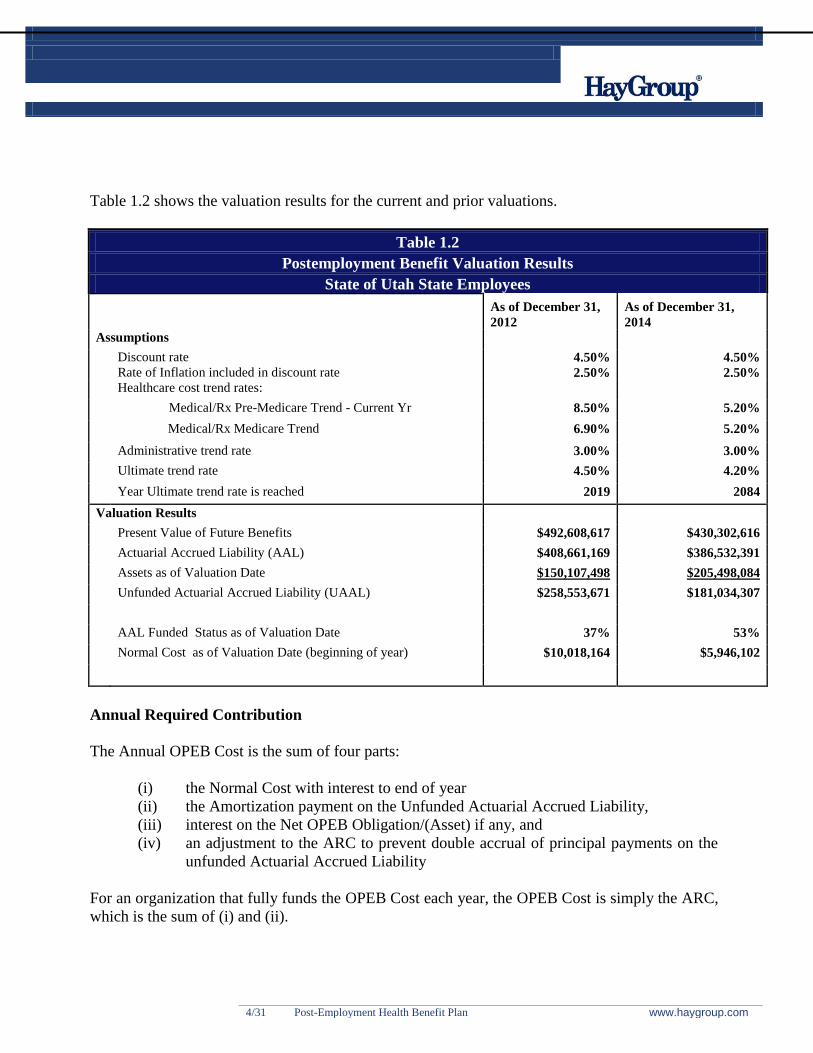
Table 1.2 shows the valuation results for the current and prior valuations.
Table 1.2
Postemployment Benefit Valuation Results
State of Utah State Employees As of December 31,
2012
As of December 31,
2014
Assumptions
Discount rate
Rate of Inflation included in discount rate 4.50%
2.50%
4.50%
2.50%
Healthcare cost trend rates:
Medical/Rx Pre-Medicare Trend - Current Yr 8.50% 5.20%
Medical/Rx Medicare Trend 6.90% 5.20%
Administrative trend rate 3.00% 3.00%
Ultimate trend rate 4.50% 4.20%
Year Ultimate trend rate is reached 2019 2084
Valuation Results
Present Value of Future Benefits $492,608,617 $430,302,616
Actuarial Accrued Liability (AAL) $408,661,169 $386,532,391
Assets as of Valuation Date $150,107,498 $205,498,084
Unfunded Actuarial Accrued Liability (UAAL) $258,553,671 $181,034,307
AAL Funded Status as of Valuation Date 37% 53%
Normal Cost as of Valuation Date (beginning of year) $10,018,164 $5,946,102
Annual Required Contribution
The Annual OPEB Cost is the sum of four parts:
(i) the Normal Cost with interest to end of year
(ii) the Amortization payment on the Unfunded Actuarial Accrued Liability,
(iii) interest on the Net OPEB Obligation/(Asset) if any, and
(iv) an adjustment to the ARC to prevent double accrual of principal payments on the
unfunded Actuarial Accrued Liability
For an organization that fully funds the OPEB Cost each year, the OPEB Cost is simply the ARC,
which is the sum of (i) and (ii).

5/31 Post-Employment Health Benefit Plan www.haygroup.com
The State has decided beginning in fiscal year 2016 to amortize the unfunded actuarial accrued
liability over 10 years as a level dollar amount and an open amortization method. In the previous
valuation, a 20 year level dollar open amortization method was used.
Table 1.3 shows the derivation of the Annual Required Contribution and the Annual OPEB Cost
for the current and prior valuations.
Table 1.3
Postemployment Benefit Valuation Results
State of Utah State Employees Fiscal Year Ending
6/30/14
Fiscal Year Ending
6/30/16
Normal Cost $10,468,981 $6,213,677
Amortization Cost $19,873,457 $22,886,764
Annual Required Contribution (ARC) $30,342,438 $29,100,441
Interest on Net OPEB Obligation NOO/(NOA) ($272,104)
($255,040)
ARC adjustment $464,778 $716,505
Annual OPEB Cost
$30,535,112
$29,561,906
Table 1.3 shows the development of the Net OPEB Liability/(Asset). The Net OPEB Liability is the
excess of the Annual Required Contribution over the amount funded by the employer. In FY 2014
and FY 2015, the State contributed an amount equal to the ARC as determined in the 12/31/2012
valuation.
Table 1.4
Postemployment Benefit Valuation Results
Net OPEB Obligation/(Asset) for State of Utah State Employees
FY2014 FY2015
Net OPEB Liability (Asset) as of July 1 ($6,046,766) ($5,854,092)
Annual OPEB Cost $30,535,112 $30,528,972
State Contribution to Trust Fund $30,342,438 $30,342,438
Net OPEB Liability/(Asset) as of June 30 ($5,854,092) ($5,667,558)

6/31 Post-Employment Health Benefit Plan www.haygroup.com
Actuarial Certification
The State selected Hay Group to perform an actuarial valuation of the Post-Employment Benefits
Plans to provide an estimate of the Actuarial Accrued Liability, the Annual Required Contribution
(ARC), and the Annual OPEB Cost under the GASB 45 accounting standard. Use of the valuation
results for other purposes may not be appropriate.
This valuation has been conducted in accordance with generally accepted actuarial principles and
practices.
The results shown in this report are reasonable actuarial results. However, a different set of
results could also be considered reasonable actuarial results. The reason for this is that actuarial
standards of practice describe a "best-estimate range" for each assumption, rather than a single
best-estimate value. Thus, reasonable results differing from those presented in this report could
have been developed by selecting different points within the best-estimate ranges for each of the
various assumptions.
The actuary certifying to this valuation is a member of the Society of Actuaries and other
professional actuarial organizations, and meets the General Qualification Standards of the
American Academy of Actuaries for purposes of issuing Prescribed Statements of Actuarial
Opinion.
By:
Robert E. Russell, ASA, MAAA, FCA
Hay Group, Inc.
By:
_____________________________
Justin Frerich, ASA, MAAA
Hay Group, Inc..

7/31 Post-Employment Health Benefit Plan www.haygroup.com
2. Description of GASB 45
Governmental Accounting Standards Board (GASB)
In June, 2004, the Governmental Accounting Standards Board (GASB) issued its standard on
Accounting and Financial Reporting by Employers for Postemployment Benefits Other Than
Pensions (OPEBs).
The standard covers post-employment benefits other than pension benefits. The types of benefits
covered include:
Medical
Dental
Vision
Hearing
Life insurance
Long term disability
Long term care
If any of these benefits are provided through a pension plan they would be accounted for under
GASB 25 otherwise they will be accounted for under GASB 45.
The effective date for the new standard depends on the size of the employer. For entities with
revenues in FY 2000 over $100 million, the effective date is the fiscal year beginning after
December 15, 2006, although earlier adoption was encouraged. Entities with smaller revenues
have later effective dates.
The purpose of the standard is to treat post-retirement benefit costs in a manner similar to pension
costs. Governmental employers should recognize that OPEBs constitute compensation for
employee service and they should recognize the cost of benefits during the periods when
employee service is rendered. By accounting for OPEBs, GASB believes the accounting
statement will improve the relevance and usefulness of financial reporting, provide information
about the size of the liabilities and the extent to which they are funded, and ensure systematic
accrual-basis measurement over employee service.
While the standard will require governmental employers to adopt accrual accounting, the standard
sets out a broad range of valuation options for employers. These options include the ability to
choose, within limits, the:

8/31 Post-Employment Health Benefit Plan www.haygroup.com
Actuarial cost method,
Period for amortizing the unfunded actuarial accrued liability
Amortization method,
Measurement date, and
Frequency of valuations
The most common and most expensive of the OPEBs are retiree medical benefits, which provide
a valuable component in employees’ retirement benefits program. Most governmental employers
currently fund their retiree medical plans on a pay-as-you-go basis. The GASB standard does not
require employers to advance fund these benefits; however employers who do not advance fund
these benefits must begin to report OPEB liabilities in their full accrual financial statements.
Actuarial Cost Method
A fundamental principle in financing the liabilities of any retirement program is that the cost of
the benefits should be related to the period in which benefits are earned, rather than to the period
of benefit distribution.
Under the Entry Age Normal cost method, the actuarial present value of each individual’s
projected benefits is allocated on a level basis over the earnings or service of the individual
between the individual’s entry age and the assumed exit ages. The portion of the actuarial present
value that is allocated to the year immediately following the valuation date is called the Normal
Cost under the actuarial cost method.
Actuarial Accrued Liability
The actuarial accrued liability is that portion of the present value of projected benefits which has
been attributed to the employee’s working life from the date of hire to the valuation date.
Another way of viewing this liability is as the portion of the present value of projected benefits
that will not be funded by future normal costs. Therefore, as long as participants enter the system
with no past service credit (as is assumed in this case), there is no actuarial liability for a new
entrant. Furthermore, the full present value of benefits is funded by the end of each employee’s
working life.
The difference between the actuarial accrued liability and the value of trust assets accumulated as
of the valuation date is referred to as the Unfunded Actuarial Accrued Liability. Unfunded
actuarial accrued liabilities generally exist when (1) the liabilities are not funded, (2) benefits
have been earned for periods in which no normal cost has been paid or (3) the amounts that have
been funded were inadequate because of losses, changes in assumptions, changes in the funding

9/31 Post-Employment Health Benefit Plan www.haygroup.com
method, or benefit improvements. The unfunded actuarial accrued liability equals the actuarial
accrued liability less the value of the trust assets.
Development of the Normal Cost
The normal cost represents the present value of future benefits allocated to the current reporting
period. The Entry Age Normal actuarial cost method is used in determining the normal cost, as a
level percentage of pay. When projected benefits are not related to an employee’s pay, a rate of
inflation is used instead of an assumed rate of pay increases.
Amortization Method
GASB 45 allows for the use of either a level dollar amortization or a level percentage of pay
amortization, over either an open or closed amortization period. The maximum amortization
period is 30 years.
Recent Changes in GASB Accounting Standard
The Governmental Accounting Standards Board (GASB) recently issued new statements that will
replace the requirements of GASB 43 (related to OPEB Plans) and GASB 45 (related to
Employers who provide OPEB benefits to employees). The new requirements will apply to plans
starting fiscal years beginning after June 15, 2016, and will apply to governmental employers
starting with fiscal years beginning after June 15, 2017. The new standards will require
recognition of the Net OPEB Liability in the statement of financial position. In addition, the new
statements will require a more extensive set of footnote disclosures and required supplementary
information.

10/31 Post-Employment Health Benefit Plan www.haygroup.com
3. The Valuation Results
Table 3.1 shows the combined present value of future benefits, actuarial accrued liability, assets,
unfunded actuarial accrued liability and the normal cost, as of December 31, 2012 and as of
December 31, 2014. The table also shows the Annual Required Contribution and the Annual
OPEB Cost.
** AARRCC ffoorr ffiissccaall yyeeaarrss eennddiinngg iinn 22001144 aanndd 22001155
**** AARRCC ffoorr ffiissccaall yyeeaarrss eennddiinngg iinn 22001166 aanndd 22001177
Table 3.1
Post-Retirement Medical
State of Utah State Employees
Valuation As of
December 31, 2012
Valuation As of
December 31, 2014
Actuarial Accrued Liability (AAL)
Medical
Actives $215,577,154 $217,782,030
Retirees 191,176,650 166,729,242
Total Medical 406,753,804 384,511,272
Life Insurance 1,907,366 2,021,119
Total AAL $408,661,170 $386, 532,391
Fair Value Assets $150,107,498 $205,498,084
Unfunded AAL (UAAL) $258,553,672 $181,034,307
Funded Percentage 36.7% 53.2%
Normal Cost (boy) $10,018,164 $5,946,102
Normal Cost with interest $10,468,981 $6,213,677
10 year amortization factor (2012 is
20 year amortization) 13.01 7.91
Amortization Payment 19,873,457 22,886,764
Annual Required Contribution
(ARC) $30,342,438* $29,100,441**
Net OPEB Obligation/(Asset) (6,046,766) (5,667,558)
Interest on NOO/NOA (272,104) (255,040)
ARC Adjustment 464,778 716,505
Annual OPEB Cost $30,535,112 $29,561,906

11/31 Post-Employment Health Benefit Plan www.haygroup.com
Allocation of the Annual Required Contribution
For financial planning and reporting purposes, the State required that the valuation report include
an allocation of the Net OPEB Obligation. A separate cost for the State employees was developed
for each OPEB trust fund: Office of Education, Office of Transportation, Public Safety, and Other
State Employees.
Table 3.2
Post-Retirement Medical
State Employees
Office of
Education
Office of
Transportation
Public
Safety
Other State
Employees
Total As of
December 31,
2014
Actuarial Accrued
Liability (AAL)
Medical
Actives $8,197,779 $30,473,528 $11,979,289 $167,131,434 $217,782,030
Retirees 4,485,692 24,273,158 17,973,910 119,996,482 166,729,242
Total Medical $1,268,471 $54,746,686 $29,953,199 $287,127,916 $384,511,272
Life Insurance 65,918 242,739 202,927 1,509,535 2,021,119
Total AAL $12,749,389 $54,989,425 $30,156,126 $288,637,451 $386,532,391
Fair Value Assets $8,523,473 $23,344,045 $14,511,851 $159,118,714 $205,498,083
Unfunded AAL (UAAL) $4,225,916 $31,645,380 $15,644,275 $129,518,737 $181,034,308
Funded Percentage 66.9% 42.5% 48.1% 55.1% 53.2%
Normal Cost (boy) $263,142 $680,153 $299,712 $4,703,095 $5,946,102
Normal Cost with interest 274,983 710,760 313,199 4,914,735 6,213,677
10 year amortization factor 7.91 7.91 7.91 7.91 7.91
Amortization Payment ( eoy) $534,250 $4,000,680 $1,977,784 $16,374,050 $22,886,764
Annual Required
Contribution (ARC)* $809,233 $4,711,440 $2,290,983 $21,288,785 $29,100,441
Net OPEB
Obligation/(Asset) ($32,161) ($808,841) ($882,942) ($3,943,613) ($5,667,558)
Interest on NOO/NOA (1,447) (36,398) (39,732) (177,463) (255,040)
ARC Adjustment 4,066 102,255 111,624 498,560 716,505
Annual OPEB Cost $811,852 $4,777,297 $2,362,875 $21,609,882 $29,561,906
*ARC for fiscal years ending in 2016 and 2017

12/31 Post-Employment Health Benefit Plan www.haygroup.com
4. Funding
The State established a State Post-Retirement Benefits Trust Fund for purposes of advance
funding retiree health benefits of current and future retirees.
Table 4.1 shows the State contributions to the Trust Fund for the fiscal years ended June 30, 2014
and June 30, 2015.
Table 4.1
Employer Contribution to Trust Fund
Period Ending Office of
Education
Office of
Transportation
Public
Safety
Other State
Employees
Total
June 30, 2014 $894,860 $4,342,197 $2,151,644 $22,953,737 $30,342,438
June 30, 2015 $894,860 $4,342,197 $2,151,644 $22,953,737 $30,342,438
Table 4.2 shows the market value of assets as of December 31, 2012 and December 31, 2014.
Table 4.2
Market Value of Assets
Office of
Education
Office of
Transportation
Public
Safety
Other State
Employees
Total
As of December 31, 2012 $6,090,990 $16,376,452 $11,197,345 $116,442,711 $150,107,498
As of December 31, 2014 $8,523,473 $23,344,045 $14,511,851 $159,118,714 $205,498,083
13/31 Post-Employment Health Benefit Plan www.haygroup.com
5. Actuarial Assumptions
The selection of all actuarial assumptions, in valuations of post-retirement health care plans
including the health care cost trend rate, should be guided by Actuarial Standard of Practice No.
6, Measuring Retiree Group Benefit Obligations, as revised from time to time by the Actuarial
Standards Board. Accordingly, actuarial assumptions should be based on the actual experience of
the covered group, to the extent that credible experience data are available, but should emphasize
expected long-term future trends rather than give undue weight to recent past experience. The
reasonableness of each actuarial assumption should be considered independently based on its own
merits, its consistency with each other assumption, and the combined impact of all assumptions.
The actuarial assumptions used to value the post-retirement medical liabilities can be categorized
into three groups: economic assumptions, medical assumptions, and demographic assumptions
Economic Assumptions
The two economic assumptions used in the valuation are the discount rate and the health care cost
trend rates. The economic assumptions are used to account for changes in the cost of benefits
over time and to discount future benefit payments for the time value of money.
Discount Rate
The investment return assumption (discount rate) should be the estimated long-term investment
yield on the investments that are expected to be used to finance the payment of benefits. The
investments expected to be used to finance the payment of benefits would be plan assets for
funded plans, assets of the employer for pay-as-you-go plans, or a combination of the two for
plans that are being partially funded. The valuation discount rate is 4.50 percent.
Health Care Cost Trend Rates
The following table shows the health care cost trend rates that were used for the actuarial
valuation of the State of Utah Employees’ Retiree Health Care Plan.
The medical trend assumptions used in the valuation were developed using the Society of
Actuaries (SOA) Long-Run Medical Cost Trend Model (Version 12.2). The SOA model was first
released in December 2007. The following assumptions were used as input variables into this
model:

14/31 Post-Employment Health Benefit Plan www.haygroup.com
Rate of Inflation
2.5%
Rate of Growth in Real Income/ GDP per capita 1.7%
Income Multiplier for Health Spending 1.4
Extra Trend due to Technology and other factors 1.1%
Health Share of GDP Resistance Point 25.0%
Year for Limiting Cost Growth to GDP Growth 2075
The SOA Long-Run Medical Cost Trend Getzen Model and its baseline projection are based on
an econometric analysis of historical U.S. medical expenditures and the judgments of experts in
the field. The long-run baseline projection and input variables were developed under the guidance
of the SOA Project Oversight Group.
Table 5.1 shows the health care cost trends used in the valuation, which are outputs of the SOA
Long-Run Medical Cost Trend Getzen Model. The Table also shows the health care cost trend
used in the prior valuation. The set of health care trend rates has an initial health care cost trend
rate of 5.2 percent, increases smoothly to 6.1 percent in 2016, and declines gradually, over 70
years, to an ultimate rate of 4.2 percent in 2084 and later years. Table 5.1 Medical Trend Rate Assumptions
Annual Trend
Year
Current
Valuation
(Combined)
Prior Valuation Trend Rates
Pre-
Medicare
Trend
Post-
Medicare
Trend
Administrative
Expenses
Trend
2014 5.2% 7.5% 6.3% 3.0%
2015 5.7 7.0 5.9 3.0
2016 6.1 6.5 5.6 3.0
2017 6.1 6.0 5.2 3.0
2018 6.0 5.5 4.9 3.0
2019 6.0 4.5 4.5 3.0
2020 6.0 4.5 4.5 3.0
2025 5.8 4.5 4.5 3.0
2030 6.0 4.5 4.5 3.0
2035 5.9 4.5 4.5 3.0
2040 5.3 4.5 4.5 3.0
2050 5.0 4.5 4.5 3.0
2060 4.9 4.5 4.5 3.0
2070 4.8 4.5 4.5 3.0
2084 & Ultimate 4.2 4.5 4.5 3.0

15/31 Post-Employment Health Benefit Plan www.haygroup.com
Medical Assumptions
A fundamental building block of the actuarial valuation is the current per capita cost of benefits.
The per capita costs for pre-65 retirees were developed based upon 30 consecutive months of
claims and enrollments in the medical plans, as provided by PEHP. Medicare supplement claims
costs were based on total premium rates in effect as of the 2014 valuation date. The per capita
rates were then spread across five year age categories using actuarial morbidity factors that reflect
the average increase in utilization due to aging.
Table 5.2 shows the baseline per capita claims costs that were used in the valuation for current
retirees.

16/31 Post-Employment Health Benefit Plan www.haygroup.com
Table 5.2
State of Utah
Per Capita Claims Costs for 12/31/14 Valuation
Age Preferred Advantage/Summit
Medicare
Supplement
<45 $7,513 $5,252
45 - 49 $7,922 $5,538
50 - 54 $9,156 $6,421
55 - 59 $10,880 $7,606
60 - 61 $12,260 $8,570
62 - 64 $13,430 $9,388
65 - 70 $2,907
70 - 75 $3,289
75 - 80 $3,722
80 - 85 $4,109
>85 $4,319
Demographic Assumptions
The demographic assumptions used for valuing the liabilities of the post-retirement medical plan
are those used for the actuarial valuation of the State Employees’ Retirement System.
The demographic assumptions include the rate of mortality, the rate of withdrawal, the rate of
retirement, and the rate of disability. Ancillary demographic assumptions include the age of
female spouses, coverage rates, and participation rates. The complete set of demographic
assumptions is included in Appendix B.

17/31 Post-Employment Health Benefit Plan www.haygroup.com
6. Financial Accounting Information
In addition to establishing the Annual Required Contribution (ARC), this report shows the
progress toward funding of the plan benefits. This section includes a schedule of the funding
progress, which is a statement of disclosure to report the information required by Governmental
Accounting Standards Board (GASB) Statements No. 43 and 45.
Also included is a schedule of employer contributions. This schedule compares the expected
contribution to the plan with the Annual Required Contribution. Since there is a lag-period
between the determination of the ARC and the determination of the amounts actually funded, the
tables show estimated amounts based on the funding policy as of the measurement date.
GASB 43/45 Disclosures
Table 6.1 shows the schedule of funding progress for the State of Utah Employee Other
Postemployment Benefit Plan.
Table 6.1
Postretirement Medical Benefit Valuation Results
Schedule of Funding Progress
Actuarial
Valuation
Date
Actuarial
Value of
Assets
Actuarial
Accrued
Liability
(AAL)
Unfunded
Actuarial
Accrued
Liability
(UAAL)
Funded
Ratio
Estimated
Covered
Payroll
UAAL as
a Percentage of
Covered Payroll
(a) (b) (c) = (b-a) (d) = (a/b) (e) (f) = (c)/(e)
12/31/2010 $106,604,713 $481,392,530 $374,787,817 22% $589,817,000 64%
12/31/2012 $150,107,498 $408,661,170 $258,553,672 37% $496,491,000 52%
12/31/2014 $205,498,084 $386,532,391 $181,034,307 53% $440,029,325 41%

18/31 Post-Employment Health Benefit Plan www.haygroup.com
Table 6.2 shows the Annual OPEB Cost for FY 2011 through FY 2015 and the actual employer
contributions to the Trust Fund.
Table 6.2
Postretirement Medical Benefit Valuation Results
Schedule of Employer Contributions
Fiscal Year
Ending
June 30
Annual
OPEB Cost Employer Contributions
Percentage of Annual OPEB Cost
Contributed
2011 $43,819,000 $43,819,000 100%
2012 $37,594,000 $43,293,000 115%
2013 $37,721,835 $38,069,538 101%
2014 $30,535,112 $30,342,438 99%
2015 $30,528,972 $30,342,438 99%

19/31 Post-Employment Health Benefit Plan www.haygroup.com
Required Supplemental Information
Table 6.3
Development of Net OPEB Obligation / (Asset)
Fiscal Year ending
June 30
Annual
Required
Contribution
(a)
Interest on
Unfunded
ARC (b)
Adjustment
of the ARC
(c)
Annual
OPEB Cost
(d) = (a) +
(b) + (c)
Actual
Contribution
(e)
Increase in
OPEB
obligation
(f) = (d) –
(e)
Net OPEB
Obligation
(Asset) at
end of year
(g) = prior
year (g) +
(f)
2012 $37,594,000 ($0) ($0) $37,594,000 $43,293,063 ($5,699,063) ($5,699,063)
2013 $37,594,000 ($256,458) $384,293 $37,721,835 $38,069,538 ($347,703) ($6,046,766)
2014 $30,342,438 ($272,104) $464,778 $30,535,112 $30,342,438 $192,674 ($5,854,092)
2015 $30,342,438 ($263,434) $449,969 $30,528,973 $30,342,438 $186,535 ($5,667,557)

20/31 Post-Employment Health Benefit Plan www.haygroup.com
7. Summary of Plan Provisions
State of Utah Employees Other Postemployment Benefit Plan
State employees hired prior to January 1, 2006 who retire from the state are eligibile for post-
retiree medical and life insurance benefits. The following retirement eligibility criteria applies:
State Employees Judges
Age Years of Service Age Years of Service
60 20 55 20
62 10 62 10
65 4 70 6
Any age 25 Any age 25
Retiree Medical Benefits
Employees who retire under the plan are eligible to use Program I sick leave balances to purchase
retiree health care coverage. 75% of Program I balances, both converted and non-converted, as of
12/31/2005 may be used to purchase retiree health care coverage at the rate of eight hours of sick
leave for one month of medical coverage.
Pre-65 retirees are eligible to choose from six different medical plan designs of the Utah Public
Employees Health Program (PEHP): Preferred Care, Preferred Care STAR, Advantage Care,
Advantage Care STAR, Summit Care, Summit Care STAR. Program I balances purchase access
to these medical plans with cost-sharing for the retiree. In addition, dental and vision plans are
offered but the cost is fully paid by the retiree.
Post-65 retirees are eligible to choose from three separate Medicare Supplement plans (100, 75,
and 50) offered through PEHP, as well as three Pharmacy plans (basic pharmacy, basic plus
pharmacy, and enhanced pharmacy).
Retirees may elect spouse coverage both before and after age 65. However, a retiree who elects
spouse coverage prior to age 65 is only required to use 8 hours of sick leave for one month of
employee plus spouse medical coverage; at age 65 and after, a retiree electing spouse coverage
must use 16 hours of sick leave to purchase employee plus spouse coverage. If an active
employee or retiree is eligible for retiree medical benefits and dies with a Program I balance, the
surviving spouse may continue medical coverage using the retiree’s balance at the rate of eight
hours for one month of coverage.

21/31 Post-Employment Health Benefit Plan www.haygroup.com
Retiree Life Insurance Benefits:
Participants who are hired prior to January 1, 2006 are also eligibile for life insurance benefits
while receiving medical coverage up to age 65.
Participants who retire prior to July 1, 1999 receive $18,000 in life insurance.
Participants who retire after July 1, 1999 receive $25,000 in life insurance.
Retiree Contributions
The following monthly contributions apply for pre-65 retirees for the July 1, 2014 – June 30,
2015 year:
Retiree Share
Tier First 18 months of
retirement
After 18 months of
retirement
Advantage Care / Summit Care
Single $46.29 $59.00
Double $95.45 $121.66
Family $127.43 $162.41
Preferred Care
Single $192.66 $245.55
Double $397.22 $506.26
Family $530.27 $675.83
Advantage STAR / Summit STAR
Single $0.00 $0.00
Double $0.00 $0.00
Family $0.00 $0.00
Preferred STAR
Single $114.65 $146.13
Double $236.41 $301.32
Family $315.61 $402.25
Judges – Rule for Retiree Health Benefits
Under State Rule 3-501, justices, judges, and court commissioners are eligible for the following
benefits:
Earned benefits: - Participants who use less than four sick leave days in a year can accumulate 8
months of medical, dental, and life insurance benefits at retirement. These benefits
do not require retiree contributions.

22/31 Post-Employment Health Benefit Plan www.haygroup.com
Automatic benefits: - Regardless of the preceding benefits, retired judges are eligible for 5 years of
medical, dental, and life insurance benefits at retirement.
Earned benefits and automatic benefits are subject to a 7 year combined maximum payment
period. A qualifying senior judge and spouse will pay 50% of the cost of medical and dental
insurance premiums under this program.
Office of Education Plan
An employee of the Office of Education Plan may elect to retire either under the State plan or the
Office of Education plan. Eligibility requirements for the Office of Education plan are as follows:
At least five years of service with the Office of Education
Eligible to participate in the State Retirement System
Hired before July 1, 2012
Plan benefits include:
7.6% of annual salary (“stipend”) at retirement per year
Medical and life insurance benefits, subject to cost-sharing as under the State
Employee Retiree Health Care Plan
Benefits continue until the earlier of:
5 years
The employee becomes eligible for unreduced Social Security benefits

23/31 Post-Employment Health Benefit Plan www.haygroup.com
8. Participant Data
The following tables shows a historical comparison of enrollment in the State Employees’ Retiree
Health Care Plan.
12/31/2010 12/31/2012 12/31/2014
Actives 11,875 10,864 9,150
Retirees 3,272 3,327 3,411
Dependents 2,600 2,235 2,432
Total Inactives 5,872 5,562 5,843
Total 17,747 16,426 14,993
Number of Lives
Under 6565 and
OverTotal
Under
65
65 and
OverTotal
Retirees
Count 1,911 1,416 3,327 1,743 1,668 3,411
Average Age 59.9 68.7 63.7 60.0 69.0 64.4
Dependents
Count 1,478 757 2,235 1,281 1,151 2,432
Average Age 58.6 69.1 62.2 59.6 66.5 62.9
12/31/2012 12/31/2014
Inactives

24/31 Post-Employment Health Benefit Plan www.haygroup.com
*Above counts exclude employees hired after 1/1/2006.
Active State Employees - Age and Service*
Age <1 1-4 5-9 10-14 15-19 20-24 25-29 30-34 35-39 40+Grand
Total
25-29 0 1 13 4 0 0 0 0 0 0 18
30-34 0 0 123 216 11 0 0 0 0 0 350
35-39 0 0 135 589 263 4 0 0 0 0 991
40-44 0 1 95 496 607 138 7 0 0 0 1,344
45-49 0 1 48 339 460 388 120 2 0 0 1,358
50-54 0 0 61 316 394 432 331 82 5 0 1,621
55-59 0 0 67 279 370 436 374 169 35 2 1,732
60-64 0 0 46 221 278 277 266 103 49 5 1,245
65-69 0 0 15 81 90 85 71 35 17 8 402
70+ 0 0 4 20 27 18 11 6 0 3 89
Grand Total 0 3 607 2,561 2,500 1,778 1,180 397 106 18 9,150
Average Age 51.0
Average Service 18.6
Years of Service

25/31 Post-Employment Health Benefit Plan www.haygroup.com
9. Appendices
9.1. Actuarial Assumptions
The demographic assumptions used are the same ones as are used in the State of Utah Retirement
System actuarial valuation. As the timing of an employee’s decision as to when to retire is driven
primarily on their financial security, the use of consistent assumptions ensures any changes made
in the retirement system assumptions are reflected in both the annuitant costs and cost of their
retiree medical coverage.
DEMOGRAPHIC ASSUMPTIONS – REPRESENTATIVE RATES
Pre-Retirement Mortality Rates: See tables below.
Post-Retirement: Public educators (see table below)
All Others Post-Retirement: 80% of RP-2000 Combined, Males; 85% of RP-2000 Combined,
Females.
Public Educators
Public Safety and
Firefighters
Local
Government/Public
Employees
Age Male Female Male Female Male Female
20 0.00013 0.00049 0.00044 0.00044 0.00050 0.00028
25 0.00013 0.00021 0.00044 0.00044 0.00039 0.00028
30 0.00020 0.00007 0.00044 0.00044 0.00044 0.00028
35 0.00020 0.00021 0.00044 0.00044 0.00066 0.00033
40 0.00039 0.00042 0.00061 0.00061 0.00083 0.00044
45 0.00065 0.00084 0.00105 0.00105 0.00105 0.00066
50 0.00130 0.00126 0.00176 0.00176 0.00154 0.00105
55 0.00234 0.00175 0.00275 0.00275 0.00259 0.00154
60 0.00371 0.00238 0.00374 0.00374 0.00418 0.00220

26/31 Post-Employment Health Benefit Plan www.haygroup.com
Rates of Disability:
Public
Safety
Public
Employees
Public
Educators Firefighters
Age Unisex Unisex Unisex Unisex
20 0.00040 0.00024 0.00012 0.00045
25 0.00060 0.00036 0.00018 0.00068
30 0.00120 0.00072 0.00036 0.00135
35 0.00180 0.00108 0.00054 0.00203
40 0.00240 0.00144 0.00072 0.00270
45 0.00400 0.00240 0.00120 0.00450
50 0.00520 0.00312 0.00156 0.00585
55 0.00820 0.00492 0.00246 0.00923
60 0.01120 0.00672 0.00336 0.01260
Post-Retirement Mortality Rates:
Disabled Public Educators
Public Employees,
Firefighters, Public
Safety, Judges
Age Unisex Male Female Male Female
35 0.01272 0.00073 0.00046 0.00062 0.00040
40 0.01508 0.00092 0.00069 0.00086 0.00060
45 0.01787 0.00136 0.00094 0.00121 0.00096
50 0.02081 0.00222 0.00138 0.00171 0.00143
55 0.02443 0.00381 0.00339 0.00290 0.00231
60 0.02844 0.00358 0.00425 0.00540 0.00430
65 0.03256 0.00457 0.00392 0.01019 0.00825
70 0.03784 0.01198 0.00807 0.01777 0.01423
75 0.04911 0.01993 0.01280 0.03027 0.02389
80 0.07857 0.03945 0.02856 0.05149 0.03900
85 0.11770 0.07826 0.06656 0.08861 0.06583
90 0.16658 0.13702 0.12473 0.14673 0.11193
27/31 Post-Employment Health Benefit Plan www.haygroup.com
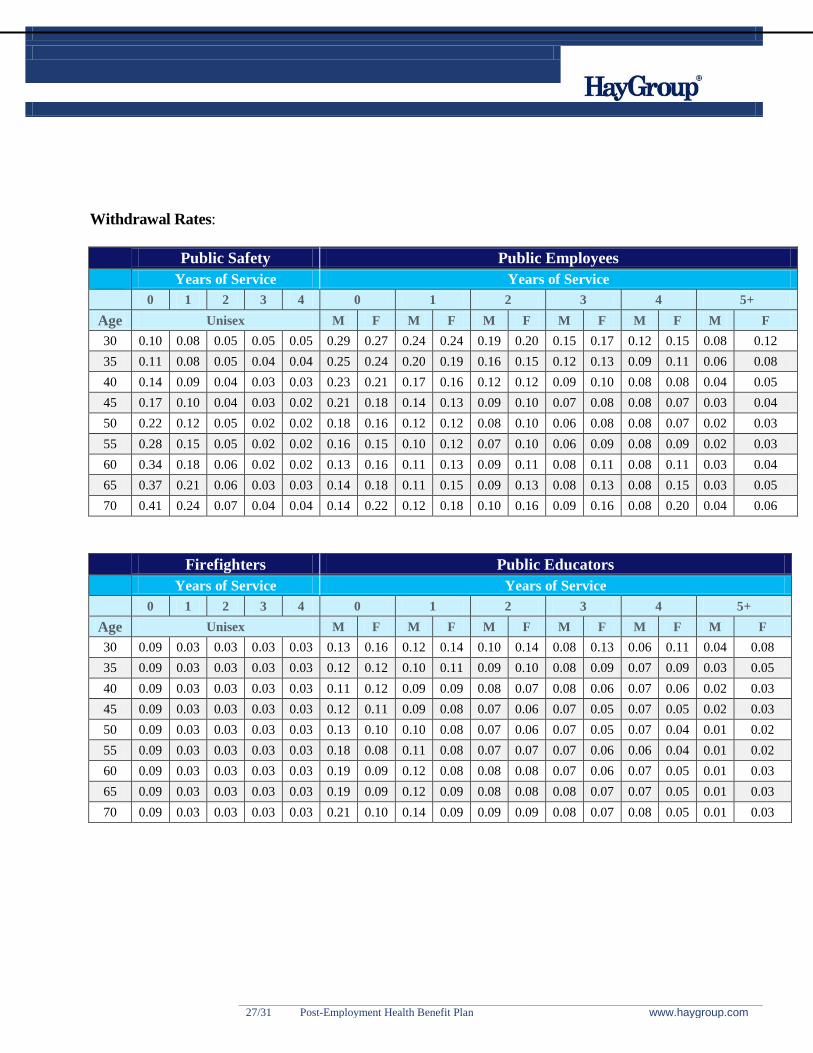
Withdrawal Rates:
Public Safety Public Employees
Years of Service Years of Service
0 1 2 3 4 0 1 2 3 4 5+
Age Unisex M F M F M F M F M F M F
30 0.10 0.08 0.05 0.05 0.05 0.29 0.27 0.24 0.24 0.19 0.20 0.15 0.17 0.12 0.15 0.08 0.12
35 0.11 0.08 0.05 0.04 0.04 0.25 0.24 0.20 0.19 0.16 0.15 0.12 0.13 0.09 0.11 0.06 0.08
40 0.14 0.09 0.04 0.03 0.03 0.23 0.21 0.17 0.16 0.12 0.12 0.09 0.10 0.08 0.08 0.04 0.05
45 0.17 0.10 0.04 0.03 0.02 0.21 0.18 0.14 0.13 0.09 0.10 0.07 0.08 0.08 0.07 0.03 0.04
50 0.22 0.12 0.05 0.02 0.02 0.18 0.16 0.12 0.12 0.08 0.10 0.06 0.08 0.08 0.07 0.02 0.03
55 0.28 0.15 0.05 0.02 0.02 0.16 0.15 0.10 0.12 0.07 0.10 0.06 0.09 0.08 0.09 0.02 0.03
60 0.34 0.18 0.06 0.02 0.02 0.13 0.16 0.11 0.13 0.09 0.11 0.08 0.11 0.08 0.11 0.03 0.04
65 0.37 0.21 0.06 0.03 0.03 0.14 0.18 0.11 0.15 0.09 0.13 0.08 0.13 0.08 0.15 0.03 0.05
70 0.41 0.24 0.07 0.04 0.04 0.14 0.22 0.12 0.18 0.10 0.16 0.09 0.16 0.08 0.20 0.04 0.06
Firefighters Public Educators
Years of Service Years of Service
0 1 2 3 4 0 1 2 3 4 5+
Age Unisex M F M F M F M F M F M F
30 0.09 0.03 0.03 0.03 0.03 0.13 0.16 0.12 0.14 0.10 0.14 0.08 0.13 0.06 0.11 0.04 0.08
35 0.09 0.03 0.03 0.03 0.03 0.12 0.12 0.10 0.11 0.09 0.10 0.08 0.09 0.07 0.09 0.03 0.05
40 0.09 0.03 0.03 0.03 0.03 0.11 0.12 0.09 0.09 0.08 0.07 0.08 0.06 0.07 0.06 0.02 0.03
45 0.09 0.03 0.03 0.03 0.03 0.12 0.11 0.09 0.08 0.07 0.06 0.07 0.05 0.07 0.05 0.02 0.03
50 0.09 0.03 0.03 0.03 0.03 0.13 0.10 0.10 0.08 0.07 0.06 0.07 0.05 0.07 0.04 0.01 0.02
55 0.09 0.03 0.03 0.03 0.03 0.18 0.08 0.11 0.08 0.07 0.07 0.07 0.06 0.06 0.04 0.01 0.02
60 0.09 0.03 0.03 0.03 0.03 0.19 0.09 0.12 0.08 0.08 0.08 0.07 0.06 0.07 0.05 0.01 0.03
65 0.09 0.03 0.03 0.03 0.03 0.19 0.09 0.12 0.09 0.08 0.08 0.08 0.07 0.07 0.05 0.01 0.03
70 0.09 0.03 0.03 0.03 0.03 0.21 0.10 0.14 0.09 0.09 0.09 0.08 0.07 0.08 0.05 0.01 0.03

28/31 Post-Employment Health Benefit Plan www.haygroup.com
Rates of Retirement:
Public Safety
Years of Service
0 5 10 15 20 25 30
Age Unisex
52 - - - - 0.16 0.16 0.33
55 - - - - 0.18 0.20 0.35
57 - - - - 0.18 0.20 0.35
60 - - 0.12 0.12 0.30 0.30 0.38
62 - - 0.12 0.12 0.30 0.30 0.38
65 1.00 1.00 1.00 1.00 1.00 1.00 1.00
67 - - - - - - -
70 - - - - - - -
Public Employees
Years of Service
0 5 10 15 20 25 30
Age M F M F M F M F M F M F M F
52 - - - - - - - - - - 0.03 0.03 0.16 0.20
55 - - - - - - - - - - 0.03 0.04 0.18 0.20
57 - - - - - - - - - - 0.03 0.04 0.18 0.20
60 - - - - - - - - 0.05 0.15 0.10 0.15 0.23 0.40
62 - - - - 0.15 0.20 0.20 0.20 0.20 0.30 0.25 0.30 0.40 0.60
65 - - 0.40 0.45 0.40 0.45 0.40 0.45 0.40 0.45 0.50 0.45 0.50 0.45
67 - - 0.20 0.25 0.20 0.25 0.20 0.25 0.20 0.25 0.20 0.25 0.20 0.25
70 1.00 1.00 1.00 1.00 1.00 1.00 1.00 1.00 1.00 1.00 1.00 1.00 1.00 1.00
Judges
Years of Service
0 5 10 15 20 25 30
Age Unisex
52 - - - - - 0.12 0.25
55 - - - - - 0.12 0.25
57 - - - - - 0.12 0.25
60 - - - - - 0.12 0.25
62 - - 0.15 0.15 0.15 0.15 0.25
65 - - 0.15 0.15 0.15 0.15 0.25
67 - - 0.15 0.15 0.15 0.15 0.25
70 1.00 1.00 1.00 1.00 1.00 1.00 1.00

29/31 Post-Employment Health Benefit Plan www.haygroup.com
Public Educators
Years of Service
0 5 10 15 20 25 30
Age M F M F M F M F M F M F M F
52 - - - - - - - - - - 0.01 0.01 0.25 0.20
55 - - - - - - - - - - 0.02 0.03 0.25 0.30
57 - - - - - - - - - - 0.02 0.03 0.25 0.30
60 - - - - - - - - 0.05 0.15 0.05 0.15 0.35 0.50
62 - - - - 0.15 0.20 0.15 0.20 0.25 0.20 0.25 0.25 0.65 0.70
65 - - 0.25 0.45 0.25 0.45 0.30 0.45 0.40 0.45 0.50 0.50 0.70 0.60
67 - - 0.20 0.30 0.20 0.30 0.25 0.35 0.25 0.35 0.25 0.35 0.30 0.35
70 1.00 1.00 1.00 1.00 1.00 1.00 1.00 1.00 1.00 1.00 1.00 1.00 1.00 1.00
Firefighters
Years of Service
0 5 10 15 20 25 30
Age Unisex
52 - - - - 0.12 0.12 0.16
55 - - - - 0.14 0.14 0.18
57 - - - - 0.14 0.14 0.18
60 - - 0.12 0.16 0.24 0.24 0.24
62 - - 0.12 0.16 0.24 0.24 0.24
65 1.00 1.00 1.00 1.00 1.00 1.00 1.00
67 - - - - - - -
70 - - - - - - -

30/31 Post-Employment Health Benefit Plan www.haygroup.com
Spouse Age Difference: Females are assumed to be 3 years younger than males.
Spouse Coverage: 80% of future retirees will elect spouse coverage
ECONOMIC ASSUMPTIONS
Interest Rate: 4.5 percent compounded annually.
Inflation Rate: 2.5 percent compounded annually
Pay Rate
Pay rates were provided by the State. Annual salary for Public Educators was estimated using 2,080
total annual hours. This salary was only used for purposes of estimating the 7.6% stipend benefit
under the Office of Education plan.
Ancillary Demographic Assumptions
Participation Rates
This valuation assumes 100% of future eligible retirees will elect participation in post-retirement
benefits. For Public Educators eligible to participate in the Office of Education plan, it is
assumed 50% of Public Educators with a Program I balance will participate in the Office of
Education plan. If a Public Education employee has a zero Program I balance, the valuation
assumes 100% participation in the Office of Education plan.

31/31 Post-Employment Health Benefit Plan www.haygroup.com
20 Year Projection of OPEB Cost and Net Cash Flow (retiree claims costs less retiree
contributions)
Assumptions:
1. Assets will earn 4.5% return each year
2. Employer contributes 100% of ARC to the Trust every year
3. No actuarial gains or losses
4. 10 year open amortization
2016 2017 2018 2019 2020 2021 2022 2023 2024 2025 2026 2027 2028 2029 2030 2031 2032 2033 2034 2035
Annual OPEB Cost 29.6 27.7 26.1 24.5 23.2 21.9 20.8 19.8 18.9 18.1 17.3 16.7 16.1 15.6 15.2 14.8 14.4 14.1 13.9 13.7
Expected Payments 33.8 35.0 36.2 36.8 37.0 37.1 37.0 36.1 34.5 32.8 31.3 29.7 27.9 25.9 24.4 22.6 20.7 18.5 16.2 13.6
10.0
15.0
20.0
25.0
30.0
35.0
40.0
10 Year Open Amortization Period Assumes the ARC is Funded Each Year