Embed Size (px)
Citation preview

State of U.S. Employee Retirement Preparedness
2015 More responsibility is being shifted onto employees to fund their own retirement with the growing trend in self-directed benefits, yet our research has shown that only 19 percent of employees are confident they are on track to retire. With more preparation as well as decisions to make, it’s crucial that more employees start preparing for retirement. This research report studies employees’ perceptions and concerns regarding retirement, whether or not they are on track for retirement, and their current state of retirement preparedness.

State of U.S. Employee Retirement Preparedness
©2015 Financial Finesse, Inc. All Rights Reserved
2
Contents
Executive Summary ....................................................................................................................................... 3
Overall State of Retirement Preparedness ................................................................................................... 5
Who are the Unprepared? .......................................................................................................................... 10
Disparity in Preparedness among Different Demographics ....................................................................... 12
From Participation to Better Preparation ................................................................................................... 17
Three Roads to Retirement for Millennials ................................................................................................. 21
Methodology ............................................................................................................................................... 23

State of U.S. Employee Retirement Preparedness
©2015 Financial Finesse, Inc. All Rights Reserved
3
Executive Summary
American employees are underprepared for retirement. Traditionally, plan sponsors and providers have used plan participation rates to gauge levels of retirement preparedness, but while plan participation is relatively high, a large majority of employees are still unprepared. Of employees that completed a financial wellness assessment in 2014, 88% reported participating in their employer-sponsored retirement savings plan, but only 19% reported being on track to reach their retirement goals. So who are these unprepared employees? We believe they fall into three categories:
The Unknowns: These employees are completely unprepared and overwhelmed, and don’t know if they are saving enough to retire comfortably.
The Underfunded: These employees have run a retirement projection and know they are not saving enough to retire comfortably.
The Underconfident: These employees are financially on track to retire but are not comfortable with economic and market uncertainties.
When we look at retirement preparedness demographically, we see even more trouble spots:
• African Americans and Latinos were less likely to report being on track for retirement. • Employees that make under $60,000 a year are half as likely to report being on track to retire
comfortably compared to those that make over $100,000 a year. • Only 17% of women compared to 24% of men are confident they are on track to achieve their
income-replacement goals. • Twenty-eight percent of Millennials do not have a handle on cash flow, and less than half (47%)
have an emergency fund, which may be contributing to lower participation, more retirement plan loans and hardships, and more cash-outs when they leave a job.
Key Trends The “Unknowns” make up the
greatest percentage of the workforce
African Americans and Latinos are at greater risk of retirement
unpreparedness
Millennials have time on their side but cash flow issues are
getting in the way
19%
19% 61%
On track Not on track
Don't know 21%
12%
13%
20%
Caucasian/White
African American/Black
Hispanic/Latino
Asian American/Asian
% on target to reach retirement goals
72%
47%
17%
28%
53%
83%
I have a handle on cash flow
I have an emergency fund
I am on target to achieve my
retirement goals
Yes No

State of U.S. Employee Retirement Preparedness
©2015 Financial Finesse, Inc. All Rights Reserved
4
From participation to preparation
To further increase retirement plan participation, many employers are turning to automatic features. A Towers Watson study found that 68% of surveyed companies offer automatic enrollment to all or newly hired workers, and 54% offer automatic rate escalation as a plan feature.i While automation has helped, low levels of retirement preparedness continue.
The good news is that employers are well-positioned to help employees meet these challenges. According to a TIAA-CREF survey, 81% of respondents trust financial information offered by their employer.ii Our research shows that the number of employees who say they are on track for retirement doubled with repeat utilization of workplace financial wellness programs.
In this report, we outline relatively simple and cost effective ways for employers to align plan design and benefits communications with the goal of increasing retirement preparation across all demographic groups.

State of U.S. Employee Retirement Preparedness
©2015 Financial Finesse, Inc. All Rights Reserved
5
Overall State of Retirement Preparedness
Confidence has not improved retirement preparedness
The number of employees that reported being on track to reach their income-replacement goals by the time they retire remained relatively unchanged from 20% in 2013 to 19% in 2014. Employees reported being less worried about the economy, with 36% citing this as a main cause of stress in 2014, down from 43% in 2013.
2012 2013 2014
I know I am on target to replace at least 80% of my income (or my goal) in retirement 17% 20% 19%
I am confident that my investments are allocated appropriately 33% 39% 40%
The U.S. economy and/or stock market are a main cause of financial stress for me 47% 43% 36%
Note: All figures are rounded to the nearest whole percentage.
Less than one in five employees report being on track for retirement
The percentage of employees who say they are on track for retirement remains relatively unchanged at under 20%, which means the number of those who say they are not prepared for retirement or are unsure still hovers at just over 80%. Among those who reported not being on track for retirement, a deeper analysis shows a lack of proactive retirement planning. Seventy-six percent of those that are not on track have not used a retirement calculator to run a projection—a first step in knowing how much they need to save. Additionally, only 47% have taken an investment risk tolerance assessment and only 31% rebalance their investment portfolio.
Prepared for retirement
19%
Employee Self Assessment of Retirement Preparedness
Not prepared for retirement
81%
Of those that are not prepared…
76% Have not run a retirement projection

State of U.S. Employee Retirement Preparedness
©2015 Financial Finesse, Inc. All Rights Reserved
6
Financial Behaviors Highly Correlated With Effectively Saving and Investing for Retirement
Retirement preparation requires that people know how much they need to save, save sufficiently, and invest their savings wisely to grow their balances over time.
Employees that are on track for retirement tend to focus on the basics, such as controlling cash flow, keeping debt in check, saving for various goals, and investing appropriately, while those not on track lack these fundamental behaviors.* Employers that offer financial wellness programs can help get employees on track by focusing on those basic needs.
On Track Not On
Track Difference
1. I feel confident that my investments are allocated appropriately based on my risk tolerance and time horizon. 74% 36% 38%
2. I have an emergency fund to cover unexpected expenses or to pay bills for a few months if I lose my job. 78% 40% 37%
3. I rebalance my investment accounts to keep my asset allocation plans on track. 63% 31% 32%
4. I have taken a risk tolerance assessment. 77% 47% 31%
5. I regularly pay off my credit card balances in full. 74% 44% 30%
6. I am comfortable with the amount of non-mortgage debt I have. 78% 49% 29%
7. I know how much I need to save for college. 46% 17% 29%
8. I look at all my combined assets to develop a master asset allocation strategy. 51% 23% 28%
9. I understand the tax implications of each of my investment and retirement accounts. 71% 44% 27%
10. I contribute to a Traditional or Roth IRA. 50% 24% 26%
* All numbers have been rounded to the nearest whole percentage.

State of U.S. Employee Retirement Preparedness
©2015 Financial Finesse, Inc. All Rights Reserved
7
Repeat Users of Workplace Financial Wellness Programs Make Substantial Progress in Retirement Preparedness
Multiple touches with a financial wellness program dramatically increase retirement preparedness. Improvements in cash and debt management, along with improvements in retirement and investing behavior have likely contributed to the overall improvement in retirement preparedness for these repeat users. In particular, we saw a 77% increase in financial wellness program users’ confidence that they are on track to reach their retirement goals.
Initial Response Last Response Magnitude of Improvement
I know I am on target to reach my income goals in retirement 17% 31% 77%
I feel confident that my investments are allocated appropriately 31% 46% 51%
I rebalance my investment accounts 35% 47% 35%
I have used a financial calculator to run a retirement projection 40% 53% 34%
I have taken a risk tolerance assessment 45% 60% 34%
I have an emergency fund 52% 60% 14%
I contribute to a Traditional or Roth IRA 29% 32% 12%
I have a handle on my cash flow 67% 75% 11%
I am comfortable with my debt 42% 46% 10%
I regularly pay off my credit card balances in full 49% 53% 7%
I pay my bills on time each month 86% 90% 4%

State of U.S. Employee Retirement Preparedness
©2015 Financial Finesse, Inc. All Rights Reserved
8
Demographic Analysis of Retirement Preparedness
The following charts show employees’ self-reported retirement preparedness broken down by age, income, and gender.†
Age Breakdown
Under 30 30–44 45–54 55–64 65+
Prep
ared
On Track 17% 17% 19% 29% 33%
Unp
repa
red
Don’t Know/Haven’t Run a Retirement Projection
72% 64% 58% 50% 47%
Not on Track 11% 19% 23% 21% 21%
Income Breakdown
Under $35,000
$35,000–$59,999
$60,000–$74,999
$75,000–$99,999
$100,000–$149,999
$150,000–$199,999
Over $199,999
Prep
ared
On Track 7% 14% 16% 19% 22% 29% 34%
Unp
repa
red
Don’t Know / Haven’t Run a Retirement Projection
72% 65% 63% 60% 60% 55% 53%
Not on Track 22% 22% 21% 21% 17% 15% 13%
† All numbers have been rounded to the nearest whole percentage.

State of U.S. Employee Retirement Preparedness
©2015 Financial Finesse, Inc. All Rights Reserved
9
Gender Breakdown
Female Male
Prep
ared
On Track 17% 24%
Unp
repa
red
Don’t Know/Haven’t Run a Retirement Projection 63% 60%
Not on Track 20% 16%

State of U.S. Employee Retirement Preparedness
©2015 Financial Finesse, Inc. All Rights Reserved
10
Who are the Unprepared?
There are a number of reasons why an employee may feel unprepared for retirement, but whatever the reason the lack of preparedness affects not only the employee but the employer as well. It is estimated that for every year an employee that wants to retire delays retirement because they cannot afford to, there is an average cost to the employer of at least $10,000.iii Unlike employees that work as a choice and not as a necessity, employees that delay retirement for financial reasons tend not to be as engaged at work. This coupled with higher wages for more seasoned workers and higher healthcare costs based on age and health issues accounts for a majority of the cost associated with delayed retirement.
To avoid these costs, it will benefit employers to know more about today’s unprepared employee. Most of the employees that are not on track for retirement will fall into one of these three groups:
The Unknowns
The largest segment of the workforce, these employees have no idea if they are on track for retirement or not. According to the 15th Annual Transamerica Retirement Survey, half of American workers (50%) simply guess when it comes to figuring out how much they will need to save for retirement, and less than one in ten (7%) use a retirement calculator. Although it is no surprise that employees under age 30 are the most likely to fall into this category (72%), it is alarming to find nearly half (49%) of employees age 55+ also falling into this category.
Employers should respond to this group by offering online financial resources and calculators paired with no-cost access to an unbiased financial coach who can run projections for them. The financial coach should be a CERTIFIED FINANCIAL PLANNER™ professional with enough practical experience to help employees create a financial plan based on these projections.
The Underfunded
This group makes up about one-fifth of the workforce. These employees have used a financial calculator but are projected to come up short with their retirement savings. Twenty-three percent of employees age 45 – 54, 20% of women, and 22% of employees with household incomes below $60,000 fall into this group. In addition to a projected retirement savings shortfall, this group also struggles with cash and debt management. Only 62% have a handle on cash flow, 40% have an emergency fund, and less than half (49%) are comfortable with their debt.
Employers can help this group by providing interactive workshops and webcasts on budgeting and debt management. Sessions should teach employees how to integrate other employer-sponsored benefits as part of a holistic approach to financial wellness. This will help maximize the value of the employer’s benefits program while also helping employees free up funds to save toward retirement.

State of U.S. Employee Retirement Preparedness
©2015 Financial Finesse, Inc. All Rights Reserved
11
The Underconfident
A small percentage of the workforce, this group consists of employees that are adequately funding their retirement but lack investment confidence and struggle with financial stress. Over one in four (26%) employees that indicated they were on track to fund their retirement goals are not confident in how their investments are allocated. Nearly seven in ten (69%) report at least some level of financial stress, with 45% of workers in this group citing worry about the U.S. economy and stock market as the main cause of their stress.
These employees are looking for confirmation from a financial expert that they are on the right path, so employers can address this group by offering individual financial planning sessions with a CERTIFIED FINANCIAL PLANNER™ professional. Eighty-five percent of employees that received individual financial coaching felt more confident after their session.

State of U.S. Employee Retirement Preparedness
©2015 Financial Finesse, Inc. All Rights Reserved
12
Disparity in Preparedness among Different Demographics
African-Americans and Latinos trail in retirement preparedness
Only 12% of African-Americans and 13% of Latinos report being on target to replace at least 80% of their income (or their goal) in retirement. This trails Caucasians (21%) and Asian-Americans (20%). These numbers have remained relatively unchanged from 2013. Additionally, African-Americans and Latinos were less likely to participate in their employer-sponsored plan, save up to the matching percentage, or feel confident in their investment strategy, but were more likely to have taken a retirement plan loan or hardship withdrawal.
The results may be correlated to African-American and Latino employees’ worries about cash management and debt. When asked to select their three most important topics, African-American employees were more likely to select managing cash flow and getting out of debt as one of them.
Managing Cash
Flow Getting Out of
Debt Retirement
Planning
Caucasian/White 52% 46% 79%
African American/Black 70% 77% 56%
Hispanic/Latino 62% 62% 66%
Asian American/Asian 40% 29% 67%
All employees 54% 51% 74%
91% 84%
41%
21%
86% 72%
26% 12%
83% 71%
27% 13%
92% 90%
34% 20%
I contribute to my retirement plan at work
I save up to the matching percentage
I am confident in my investment strategy
I know I am on target to retire comfortably
Retirement Preparedness Metrics by Ethnicity Caucasian/White
African American/Black
Hispanic/Latino
Asian American/Asian

State of U.S. Employee Retirement Preparedness
©2015 Financial Finesse, Inc. All Rights Reserved
13
Lower Income Americans still lagging in retirement preparedness
Only 11% of households that make under $60,000 a year report being on target to replace at least 80% of their income (or their goal) in retirement. Those that made over $100,000 a year are more than twice as likely to report being on track to retire. Only 33% of employees with household incomes below $60,000 report running a retirement calculator that can help indicate how much to save for retirement as opposed to the 42% percent of those making over $100,000. Lower income employees are not taking full advantage of the company match, with only 73% indicating that they contribute up to the match versus 89% of employees with household incomes over $100,000 a year.
There is some good news. Of employees with household incomes below $60,000, the percentage that reported having taken a retirement plan loan or hardship withdrawal fell six points in 2014. This may be because a three-point greater percentage of these employees report having an emergency fund to cover unexpected expenses or to pay bills for a few months if they lose their jobs. Lastly, more lower-income employees are living within their means and paying off their credit card balances in full.
73%
33%
11%
80%
37%
16%
83%
40%
19%
89%
42%
27%
I capture the full company match in my retirement plan
I have used a retirement calculator I know I am on target to retire comfortably
Retirement Preparedness Metrics by Income
Under $60k $60-$75k $75-$100k $100k+

State of U.S. Employee Retirement Preparedness
©2015 Financial Finesse, Inc. All Rights Reserved
14
Lower-income households may not have to save as much for retirement in order to achieve their income-replacement goals. That’s because Social Security is designed to replace a larger percentage of their income in retirement. According to the Social Security Administration’s Annual Trustees’ Report, Social Security benefits could replace as much as 53% of income for “low” earning employees.iv
Source (data): Annual Trustees' Report, Social Security Administration, 2014; Table V.C7
Despite women participating in their company’s retirement plan at the same rate as men, they still remain at-risk of not being prepared for retirement
In 2014 women and men participated in their retirement accounts at the same rate of 89% but that is where the similarities end. Only 17% of women versus 24% of men report being on track to retire.
Struggles with money and debt management could be contributing factors. Sixty-three percent of men compared to 48% of women have an emergency fund to cover unexpected expenses. Eighty percent of men reported having a handle on their cash flow compared to 66% of women. Only 54% of women are comfortable with the debt they carry compared to 70% of men.
$21,054
$46,787
$74,859
$117,000
$11,077 $18,251
$24,198 $29,209
$-
$20,000
$40,000
$60,000
$80,000
$100,000
$120,000
Low Medium High Maximum taxable
Social Security Replacement Rates for a Retired Worker @ Age 65 in 2014
Past Wages
Social Security Benefits
53%
25% 32% 39%

State of U.S. Employee Retirement Preparedness
©2015 Financial Finesse, Inc. All Rights Reserved
15
Women Men
I have a handle on my cash flow. 66% 80%
I have an emergency fund to cover unexpected expenses. 48% 63%
I pay my bills on time each month. 86% 94%
I am comfortable with the amount of non-mortgage debt I have. 54% 70%
I regularly pay off my credit card balances in full. 50% 67%
Women employees are participating in retirement plans at equal rates to men. However, women are less likely to use a financial calculator to run a retirement projection. Only 37% of women that had taken an assessment reported having used a retirement calculator, three percentage points less than men. Since 2013, men’s use of a retirement calculator has decreased by three percentage points.
Because of longer life expectancies, women will generally need to save more than men to fund retirement. According to research we released in August, 2015, for a 45-year-old employee with median income, there is a Gender Gap in Retirement Preparedness of 26%. That gap grows to 95% when we look at achieving a neutral retirement lifestyle based on average retirement expenses for all Americans.v Education about saving for retirement benefits all employees. For women employees in particular, it is critical that financial wellness programs provide education and coaching that help women understand the need to save earlier and to save more.
89%
37% 17%
89%
40% 24%
I contribute to my retirement plan at work
I have used a retirement calculator
I know I am on target to retire comfortably
Retirement Preparedness Metrics by Gender
Female Male

State of U.S. Employee Retirement Preparedness
©2015 Financial Finesse, Inc. All Rights Reserved
16
Young Women in Lower-Income Households are Most at Risk of Not Being Prepared for Retirement
Women under age 45 in households making less than $60,000 a year that are confident they are on track for retirement increased slightly from 9% in 2013 to 11% in 2014. Men age 55+ in households making over $100,000 a year who reported being on track to retire remained relatively unchanged from 40% in 2013 to 41% in 2014.
Female Under 45
Under $60,000
Male 55 and up
$100,000 plus
I have a handle on my cash flow 50% 91%
I have an emergency fund 27% 86%
I pay my bills on time each month 73% 99%
I am comfortable with my debt 37% 82%
I regularly pay off my credit card balances in full 33% 77%
I contribute to my retirement plan at work 82% 95%
I know I am on target to replace at least 80% of my income (or my goal) in retirement 11% 41%
I feel confident that my investments are allocated appropriately between stocks, bonds, and cash 21% 62%
I capture the company match in my retirement plan by saving up to the matching percentage 71% 83%
I have not taken a retirement plan loan or hardship withdrawal from my 401(k) 70% 89%
I have taken a risk tolerance assessment 24% 74%
I rebalance my investment accounts to keep my asset allocation plans on track 15% 63%

State of U.S. Employee Retirement Preparedness
©2015 Financial Finesse, Inc. All Rights Reserved
17
From Participation to Better Preparation
Recent enhancements in plan design are not enough to increase preparation
Auto-enrollment has been shown to improve plan participation, but employees that are enrolled automatically tend not to contribute as much as those that enroll voluntarily. According to the Vanguard How America Saves 2015 report, plans that utilize auto-enrollment have a 46% higher participation rate than those that offer voluntary enrollment. However, employees that enrolled voluntarily had an average deferral rate of 7.3% versus 6.2% for those that were automatically enrolled.
One way to combat the lower contribution rates is to include an auto-escalation feature. According to Prudential Retirement, plans offering auto-escalation for five or more years had an average deferral rate 21% higher than those without auto-escalation,vi but a Towers Watson study found that only 54% of plan sponsors offer it as a plan feature.vii Even when auto-escalation is available, only 28% of employees are taking advantage of it, according to Putnam Investments.viii Of the 68% of companies that offer automatic enrollment to at least some of their workers, Towers found that only 35% mandate automatic escalation. Better communication of the benefits of the auto-escalation feature can help.
Employers must address cash management and overall financial wellness
One striking difference between employees that are on track for retirement and those that are not is how each is handling cash flow and debt. Employees that reported being on track are 39% more likely to have a handle on cash flow, 93% more likely to have an emergency fund, 59% more likely to be comfortable with debt, and 68% more likely to pay off credit card balances in full. Part of the problem may be the conflict between an employee’s need to save for retirement and their ability to satisfy current financial needs. Retirement education often focuses on plan features and benefits, but this does little to motivate employees to save more when they are struggling to make ends meet.
On track Not on track Magnitude of difference
I have a handle on my cash flow 87% 62% 39%
I have an emergency fund 78% 40% 93%
I am comfortable with my debt 78% 49% 59%
I pay off my credit card balances in full 74% 44% 68%
Employers are uniquely positioned to help employees meet these challenges. A TIAA-CREF survey found that 81% of respondents trust financial information offered by their employers; a greater percentage than those that trust information offered by financial institutions (69%), or their family (63%).ix

State of U.S. Employee Retirement Preparedness
©2015 Financial Finesse, Inc. All Rights Reserved
18
Integrating plan design enhancements with employee benefits education and communication can improve retirement preparedness
Making more aggressive enhancements to plan design that include higher initial deferral rates, mandatory contribution escalation, and automatic re-enrollment of employees that opt out can go a long way in preparing employees for retirement, but if employees don’t receive help with cash management and overall financial wellness, these plan design changes could create more problems than they solve. Employers can increase the likelihood that employees will be better prepared for retirement by integrating retirement education into an overall financial wellness program that looks at cash flow, employee benefits, and long-term financial goals. When in place, repeat users of workplace financial wellness benefits have shown a 77% improvement in the percentage that is on track for retirement. Employers should implement the following plan-design enhancements to stimulate participation, increase contribution rates, and ultimately improve employee retirement preparedness:
Increase the default deferral rate
The most common default deferral rate for auto-enrolled plans is 3%, yet most financial planners recommend saving between 10-15% of income for retirement. Plan sponsors that worry about increasing opt-out rates may be surprised to find out that Prudential reported higher participation rates from plans that had higher default contribution rates,x suggesting that participation was not directly related to the default rate.
Automatically enroll employees in auto-escalation
In Q1 2014, 77% of Fidelity 401(k) plan sponsors offered annual increase programs to participants, but only 12% automatically enrolled employees in the program. Of employees that were automatically enrolled, only 7% opted out.xi Plan sponsors have a tremendous opportunity to drive up retirement savings by implementing mandatory rate escalation.
Implement re-enrollment in the plan’s Qualified Default Investment Alternative (QDIA)
Plan sponsors can promote better investing behavior by implementing a re-enrollment strategy that requires participants to opt out of having their current and future contributions invested in the plan’s QDIA. This forces the participants to reevaluate their asset allocations each year and influences better diversification.
Offer benefits planning
Traditional benefits education is delivered in silos and tends to focus on plan features and benefits, often missing the importance of how these benefits fit together. Retirement preparedness is not isolated to just how well employees save for retirement, but includes planning for future healthcare,

State of U.S. Employee Retirement Preparedness
©2015 Financial Finesse, Inc. All Rights Reserved
19
insurance, and estate planning needs. Benefits such as health savings accounts (HSA), retiree medical benefits, prepaid legal plans, group long-term care insurance, and stock purchase plans are frequently overlooked when discussing retirement planning. Employers that fold these benefits into their retirement education generally see increases in HSA contributions, participation in voluntary benefits, and employee satisfaction with their benefits package.
Enhance employee communications
Traditional retirement plan communication has focused on informing participants of plan features and benefits, but targeted marketing and communication strategies based on employee demographics and/or life stages can have a more significant impact on employee engagement in the retirement planning process. According to the Bank of America Merrill Lynch 2015 Workplace Benefits Report, 1 in 5 large firms currently use targeted marketing to reach specific generations through their communication efforts.
Develop a comprehensive financial wellness program
Employees that heavily engage in a comprehensive financial wellness program are more likely to have a handle on cash flow, be better prepared for retirement, and invest with confidence.
72% 71%
74%
76%
I have a handle on my cash flow
47%
53% 57%
68%
I have an emergency fund to cover unexpected expenses
47% 53% 55%
64%
I pay off my credit card balance in full each month
92% 93%
96%
97%
I contribute to my 401(k) Plan at work
24% 27%
30%
37%
I know I am on target to replace at least 80% of my
income in retirement
50% 49%
54% 57%
I feel confident that my investments are allocated
appropriately
Online Only 1-2 engagements 3-4 engagements 5+ engagements

State of U.S. Employee Retirement Preparedness
©2015 Financial Finesse, Inc. All Rights Reserved
20

State of U.S. Employee Retirement Preparedness
©2015 Financial Finesse, Inc. All Rights Reserved
21
Three Roads to Retirement for Millennials
With so much of the spotlight on the Baby Boomers, employers have made substantial financial commitments to helping this generation prepare for retirement, but the next wave of employees will face even more challenges. What the next generation has working in their favor is more time, so employers have an opportunity to capitalize on this by devoting more energy and resources to making sure the next generation is more prepared for retirement. Such commitments can improve employee loyalty, productivity, and corporate goodwill.
By far the Millennials’ biggest opportunity is that they have time on their side. Small changes now can have an enormous difference in retirement preparedness later. Eighty-three percent of Millennials say they contribute to their retirement plan, five points less than employees overall. Only 17% say they know they are on target to achieve their income-replacement goal in retirement. Seventy nine percent are capturing the company match, which means 21% are not contributing enough to their retirement plan to capture the match.
Millennial employees by definition are not thinking much about retirement far in the future and have a different idea of what economic success means than previous generations. According to a 2014 White House Council of Economic Advisors report, Millennials value community, family, and creativity in their work, and value flexibility in order to make contributions to their community and spend time with family.xii
The challenge for employers is to develop employee communications that redefine retirement as “financial independence” and an ability to maintain quality of life. Communications from the plan provider and the financial wellness program must reframe retirement away from a distant, abstract concept to something that relates to the contemporary concerns of younger employees.

State of U.S. Employee Retirement Preparedness
©2015 Financial Finesse, Inc. All Rights Reserved
22
Millennials are the “CNBC generation” and are generally savvier about financial topics than Baby Boomers were at their age. Nonetheless, having come of age during the economic downturn, they lack confidence in their investing skills and the market in general. Sixty-six percent of Millennials say they have general investment knowledge, but only 31% are confident their investments are allocated appropriately. A low 25% are rebalancing their portfolios. Employers can offer target date funds which provide a hands-off and diversified investment strategy that does not require active rebalancing or sophisticated investment knowledge by the employee.
There is not one perfect way to achieve retirement preparedness, but employees that start early have a much better chance of achieving their retirement goals. To the left are three examples of how an employee who begins saving for retirement at age 22 with a $50,000 per year salary can approach retirement planning.xiii

State of U.S. Employee Retirement Preparedness
©2015 Financial Finesse, Inc. All Rights Reserved
23
Methodology
All of Financial Finesse’s research is primary—based on tracking employees’ most pressing financial concerns through their usage of our financial education services.
Trend analysis research is compiled by tracking questions received by planners through Financial Finesse’s Financial Helpline and Ask-a-Planner services. Financial Wellness data is compiled by tracking employees’ usage of Financial Finesse’s Online Financial Wellness Assessment and Learning Center, which provides employees with a personalized financial education plan and analysis of their current financial wellness. Employers and employees are located across the country—in similar proportion to the demographics of the national population.
This report is based on an analysis of 12,715 financial wellness assessments completed on January 1, 2014 through December 31, 2014.
About the Financial Wellness Assessment
The Financial Wellness Assessment is a proprietary tool designed and developed by our Think Tank of CERTIFIED FINANCIAL PLANNER™ professionals used to measure employees’ financial wellness. To get a realistic assessment of wellness in each category, planners determined the most important criteria for achieving financial success in that specific category. By asking key questions that determine employees’ progress on these different actions, we are able to approximate their financial wellness in those areas.
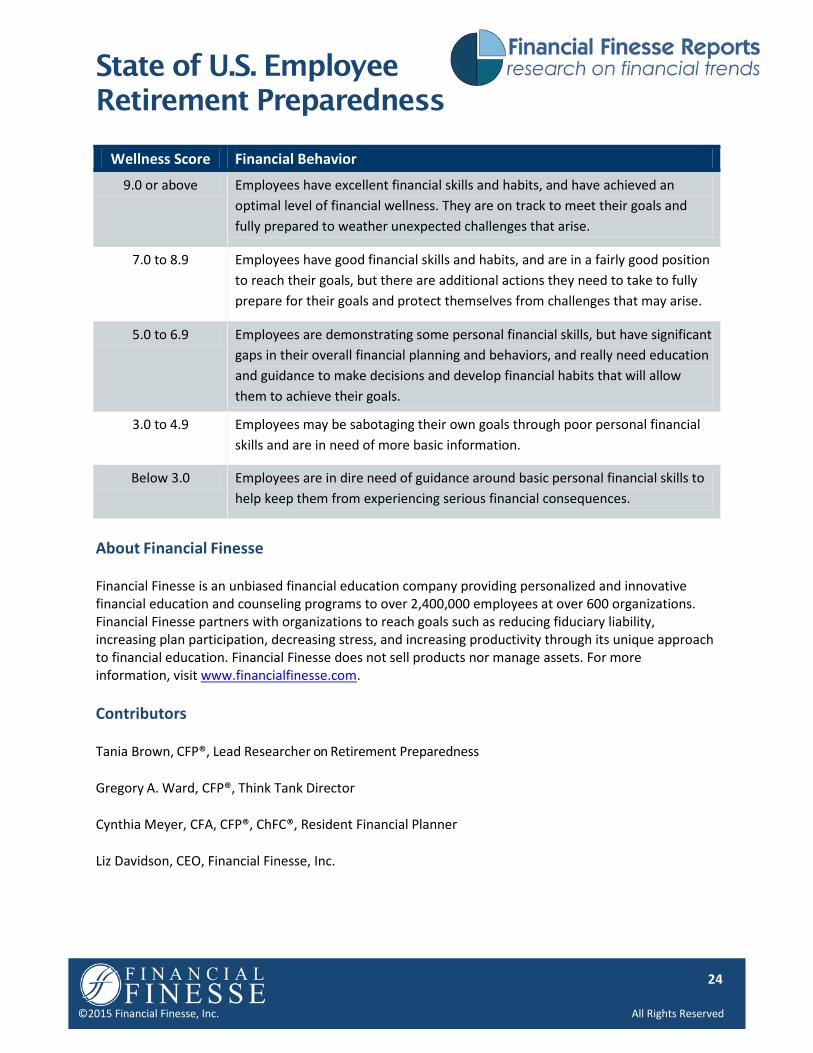
About the Financial Wellness Score
The Financial Wellness Score is measured on a scale of 0 to 10, with 0 indicating minimal financial wellness and 10 indicating optimal financial wellness. Scores are adjusted to consider age and income and determine how well employees are managing their finances based on these factors and the needs associated with different life stages and income levels. Employees who achieve a Financial Wellness Score within a specified range exhibit financial behavior as outlined in the following chart:
State of U.S. Employee Retirement Preparedness
©2015 Financial Finesse, Inc. All Rights Reserved
24
Wellness Score Financial Behavior
9.0 or above Employees have excellent financial skills and habits, and have achieved an optimal level of financial wellness. They are on track to meet their goals and fully prepared to weather unexpected challenges that arise.
7.0 to 8.9 Employees have good financial skills and habits, and are in a fairly good position to reach their goals, but there are additional actions they need to take to fully prepare for their goals and protect themselves from challenges that may arise.
5.0 to 6.9 Employees are demonstrating some personal financial skills, but have significant gaps in their overall financial planning and behaviors, and really need education and guidance to make decisions and develop financial habits that will allow them to achieve their goals.
3.0 to 4.9 Employees may be sabotaging their own goals through poor personal financial skills and are in need of more basic information.
Below 3.0 Employees are in dire need of guidance around basic personal financial skills to help keep them from experiencing serious financial consequences.
About Financial Finesse
Financial Finesse is an unbiased financial education company providing personalized and innovative financial education and counseling programs to over 2,400,000 employees at over 600 organizations. Financial Finesse partners with organizations to reach goals such as reducing fiduciary liability, increasing plan participation, decreasing stress, and increasing productivity through its unique approach to financial education. Financial Finesse does not sell products nor manage assets. For more information, visit www.financialfinesse.com.
Contributors
Tania Brown, CFP®, Lead Researcher on Retirement Preparedness
Gregory A. Ward, CFP®, Think Tank Director
Cynthia Meyer, CFA, CFP®, ChFC®, Resident Financial Planner
Liz Davidson, CEO, Financial Finesse, Inc.

State of U.S. Employee Retirement Preparedness
©2015 Financial Finesse, Inc. All Rights Reserved
25
End Notes & References
i 2014 Towers Watson North American Defined Contribution Plan Sponsor Survey Report, “Ready, Set, Retire: Using Defined Contribution Plans to Improve Retirement Readiness,” https://www.towerswatson.com/en-US/Insights/IC-Types/Survey-Research-Results/2014/11/ready-set-retire-using-defined-contribution-plans-to-improve-retirement-readiness.
ii TIAA-CREF 2014 Investment Options Survey
iii This estimate is derived from an analysis of the costs associated with tenured employees and includes expenses such as:
1. Salary differentials (http://www.bls.gov/news.release/pdf/wkyeng.pdf) o FICA/FUTA Tax o Workers Compensation
2. Benefit costs: o Healthcare costs (http://www.healthcostinstitute.org/files/Age-Curve-Study_0.pdf,
http://archive.ahrq.gov/research/findings/factsheets/costs/expriach/expriach2.html, https://kaiserfamilyfoundation.files.wordpress.com/2013/08/8465-employer-health-benefits-20131.pdf)
o Retirement benefits (http://www.ssa.gov/policy/docs/ssb/v63n4/v63n4p47.pdf) o Paid time off benefits (http://www.worldatwork.org/adimLink?id=38913)
3. Lost productivity (http://www.gallup.com/services/176735/state-global-workplace.aspx) We believe this estimate is conservative based on the information above along with discussions with HR professionals. No further analysis has been done on this figure, although we expect the figures may be higher based on increases in the variables mentioned above.
iv Social Security Administration, “The 2013 Annual Report of The Board of Trustees of the Federal Old-Age and Survivors Insurance and Federal Disability Insurance Trust Funds,” May 31, 2013, http://www.ssa.gov/oact/tr/2013/tr2013.pdf
v 2015 Gender Gap in Financial Wellness, Financial Finesse
vi Based on research conducted by Prudential Retirement, “OVERCOMING PARTICIPANT INERTIA: Automatic Features That Improve Outcomes While Improving Your Plan’s Bottom Line,” http://www.prudential.com/media/managed/overcoming-participant-inertia.pdf.
vii 2014 Towers Watson North American Defined Contribution Plan Sponsor Survey Report, “Ready, Set, Retire: Using Defined Contribution Plans to Improve Retirement Readiness,” https://www.towerswatson.com/en-US/Insights/IC-Types/Survey-Research-Results/2014/11/ready-set-retire-using-defined-contribution-plans-to-improve-retirement-readiness.
viii 2014 Lifetime Income Study, Putnam Investments
ix TIAA-CREF 2014 Investment Options Survey

State of U.S. Employee Retirement Preparedness
©2015 Financial Finesse, Inc. All Rights Reserved
26
x Prudential Retirement, 2013
xi Fidelity, “Fidelity® Announces Quarterly Data on Retirement Savings,” Press release, April 29, 2014, http://www.fidelity.com/inside-fidelity/employer-services/fidelity-announces-quarterly-data
xii The Council of Economic Advisers, “15 Economic Facts About Millennials,” October 2014, https://www.whitehouse.gov/sites/default/files/docs/millennials_report.pdf
xiii Each example assumes a $50,000 annual salary with no raises, a 50% match on the first 6% contributed to the plan, and an 8% annual return on investment. Depending on the scenario, HSA balances may be combined with retirement plan balances for a total balance available at retirement. To maintain a level of conservatism, we have not factored in raises, real estate investments, inherited money, or any other assets that may supplement retirement income. Also not factored are taxes or penalties for early withdrawal of retirement plan assets before age 59½.