Embed Size (px)
Citation preview
State of Transition 2021
Simon Dietz, TPI @ London School of Economics
Other report authors: Beata Bienkowska, Dan Gardiner, Nikolaus Hastreiter, Valentin Jahn, Vitaliy Komar, Antonina Scheer, and Rory Sullivan
About the Transition Pathway
Initiative and this report
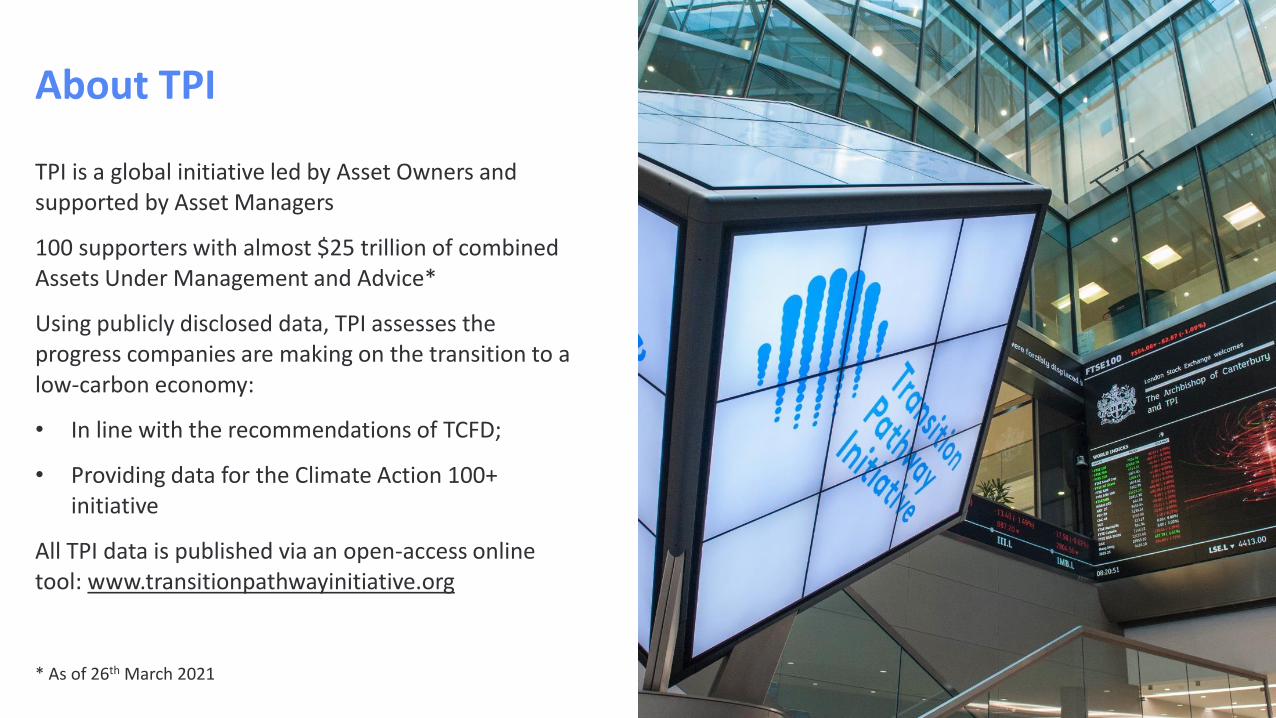
About TPI
TPI is a global initiative led by Asset Owners and supported by Asset Managers
100 supporters with almost $25 trillion of combined Assets Under Management and Advice*
Using publicly disclosed data, TPI assesses the progress companies are making on the transition to a low-carbon economy:
• In line with the recommendations of TCFD;
• Providing data for the Climate Action 100+ initiative
All TPI data is published via an open-access online tool: www.transitionpathwayinitiative.org
* As of 26th March 2021
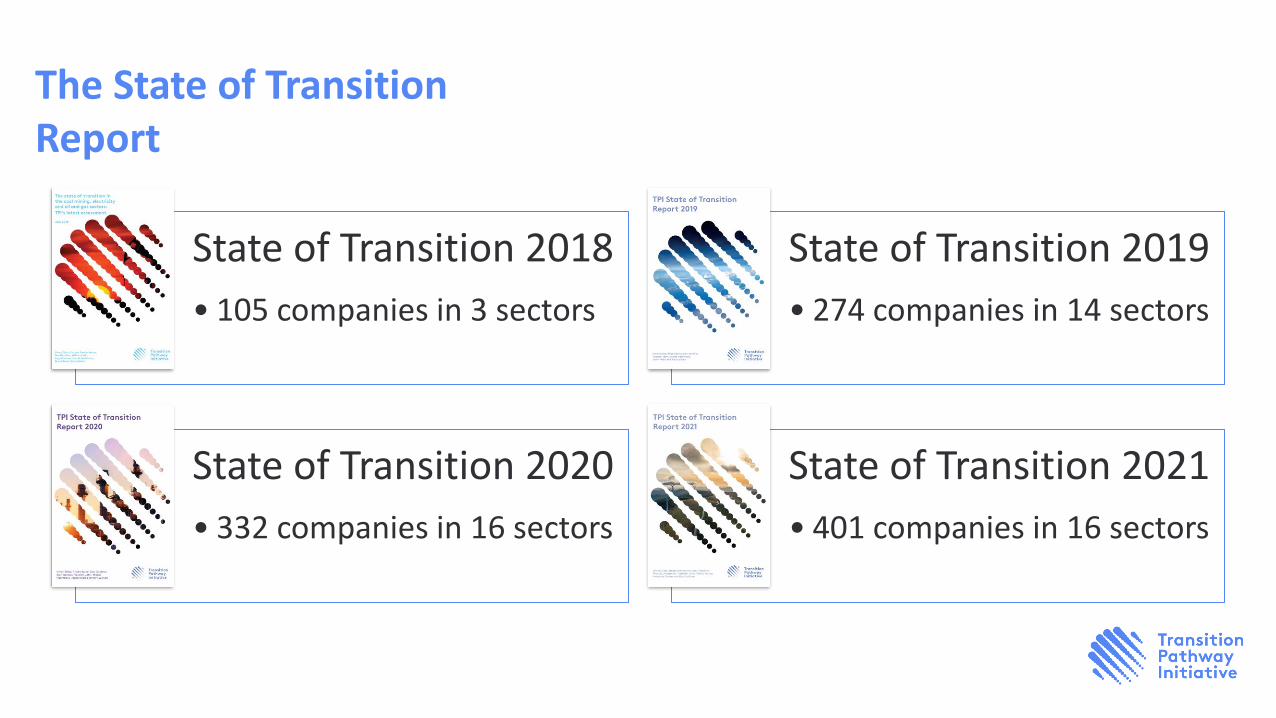
The State of Transition Report
State of Transition 2018
• 105 companies in 3 sectors
State of Transition 2019
• 274 companies in 14 sectors
State of Transition 2020
• 332 companies in 16 sectors
State of Transition 2021
• 401 companies in 16 sectors
An overview of the TPI methodology and tool
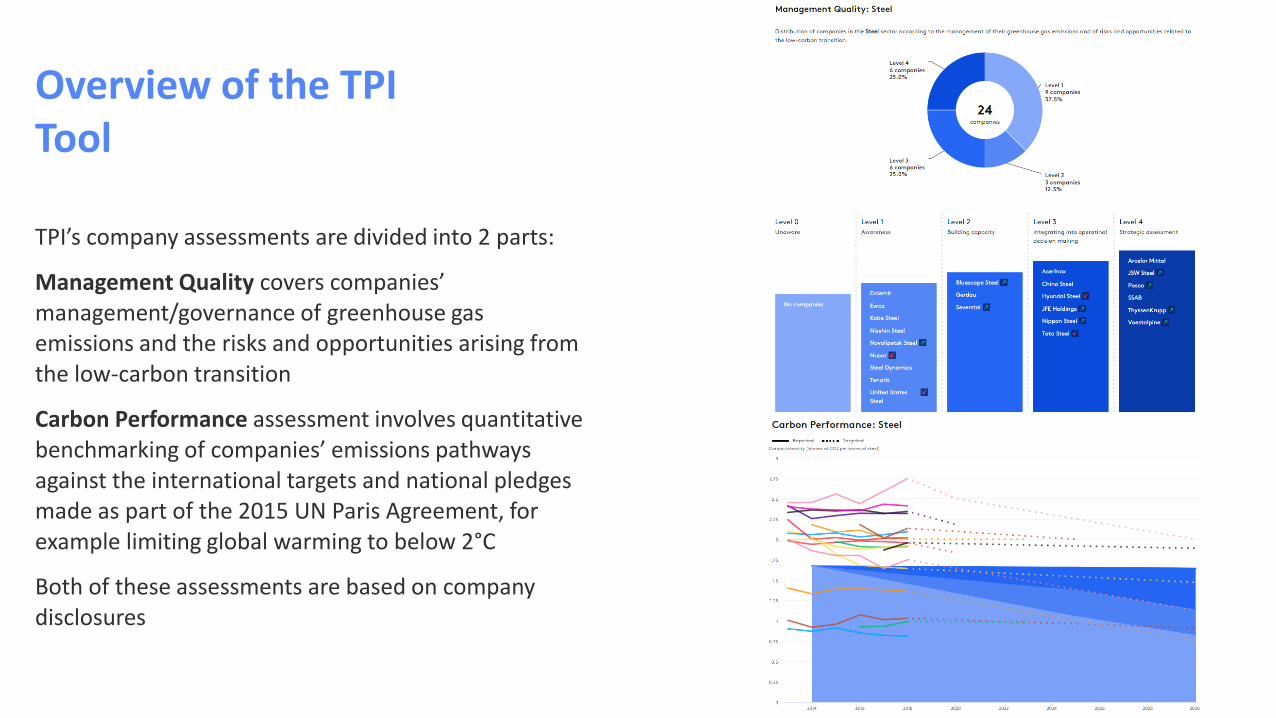
Overview of the TPI Tool
TPI’s company assessments are divided into 2 parts:
Management Quality covers companies’ management/governance of greenhouse gas emissions and the risks and opportunities arising from the low-carbon transition
Carbon Performance assessment involves quantitative benchmarking of companies’ emissions pathways against the international targets and national pledges made as part of the 2015 UN Paris Agreement, for example limiting global warming to below 2°C
Both of these assessments are based on company disclosures
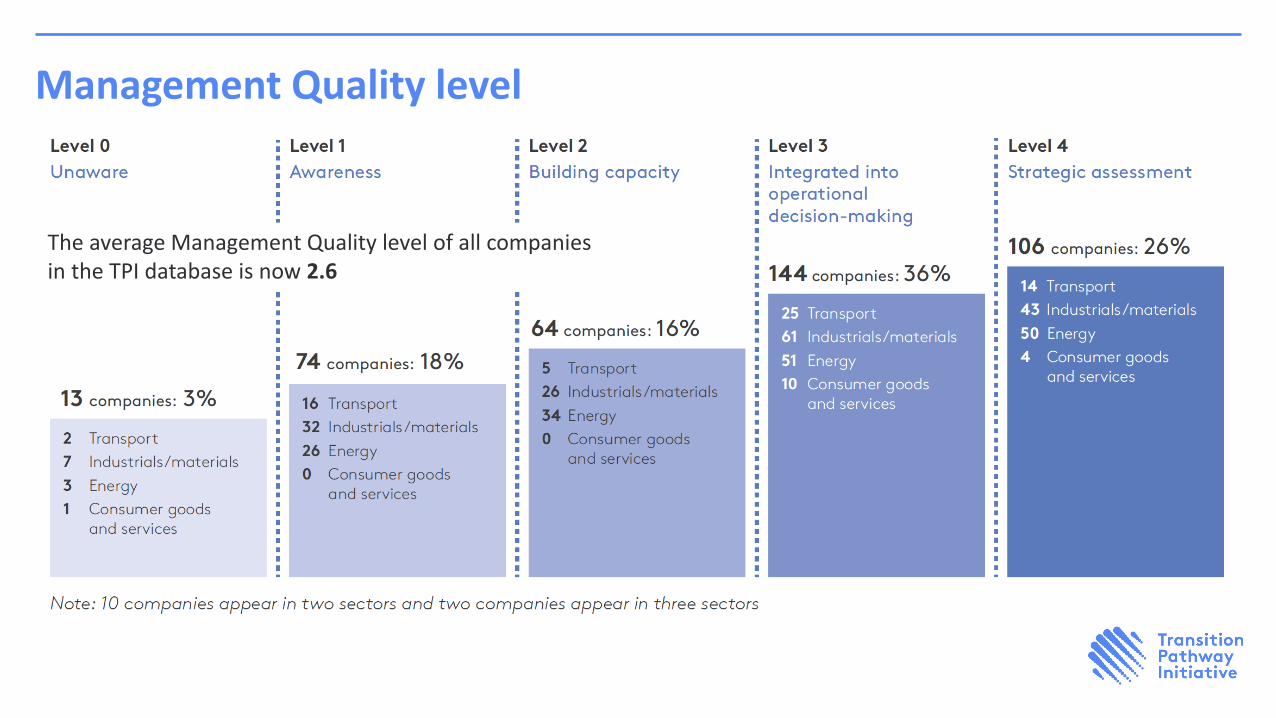
Level 0
Unaware
Level 1
Awareness
Level 2
Building capacity
Level 3
Integrating into operational decision making
Level 4
Strategic assessment
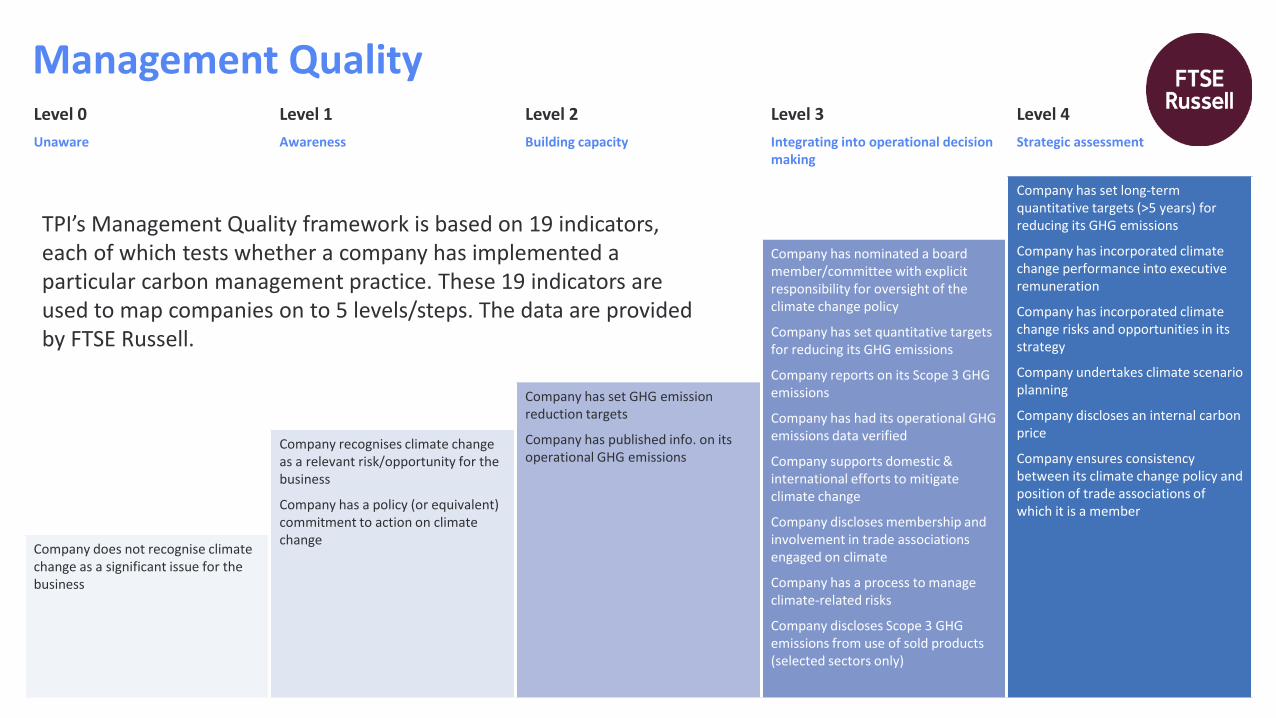
Company has set long-term quantitative targets (>5 years) for reducing its GHG emissions
Company has incorporated climate change performance into executive remuneration
Company has incorporated climate change risks and opportunities in its strategy
Company undertakes climate scenario planning
Company discloses an internal carbon price
Company ensures consistency between its climate change policy and position of trade associations of which it is a member
Company has nominated a board member/committee with explicit responsibility for oversight of the climate change policy
Company has set quantitative targets for reducing its GHG emissions
Company reports on its Scope 3 GHG emissions
Company has had its operational GHG emissions data verified
Company supports domestic & international efforts to mitigate climate change
Company discloses membership and involvement in trade associations engaged on climate
Company has a process to manage climate-related risks
Company discloses Scope 3 GHG emissions from use of sold products (selected sectors only)
Company has set GHG emission reduction targets
Company has published info. on its operational GHG emissions
Company recognises climate change as a relevant risk/opportunity for the business
Company has a policy (or equivalent) commitment to action on climate change
Company does not recognise climate change as a significant issue for the business
Management Quality
TPI’s Management Quality framework is based on 19 indicators, each of which tests whether a company has implemented a particular carbon management practice. These 19 indicators are used to map companies on to 5 levels/steps. The data are provided by FTSE Russell.
Carbon Performance
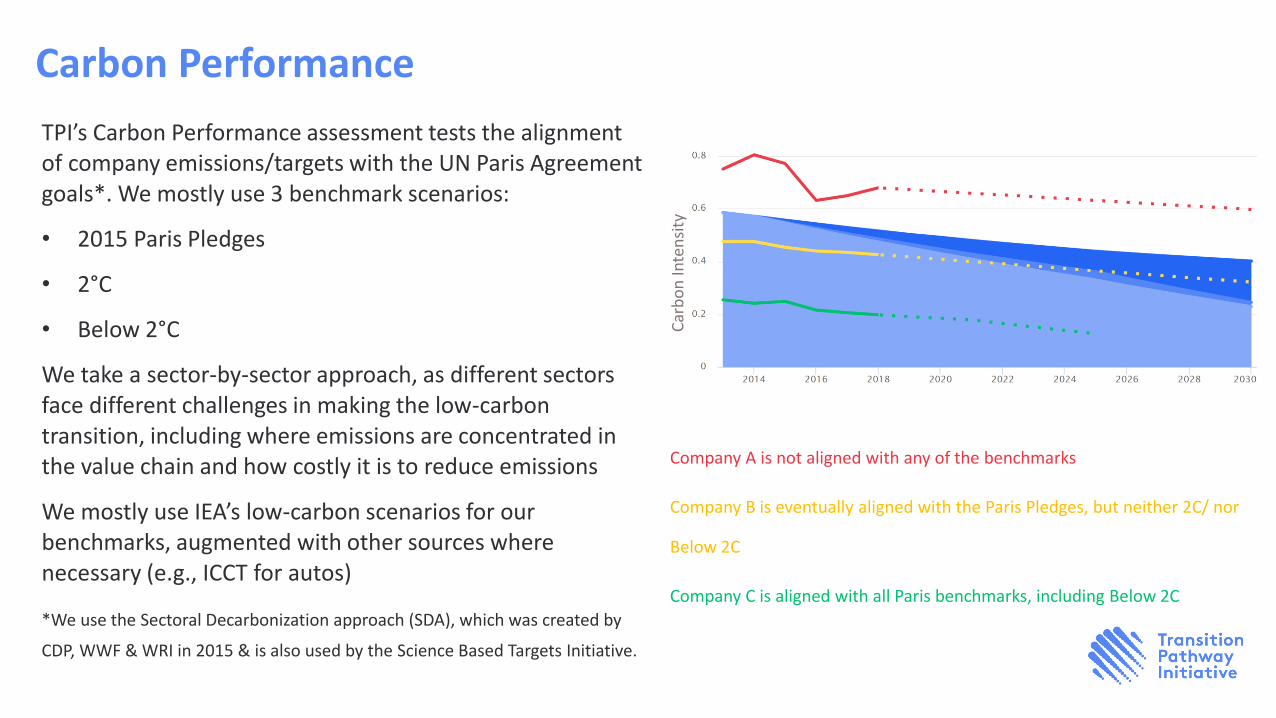
TPI’s Carbon Performance assessment tests the alignment of company emissions/targets with the UN Paris Agreement goals*. We mostly use 3 benchmark scenarios:
• 2015 Paris Pledges
• 2°C
• Below 2°C
We take a sector-by-sector approach, as different sectors face different challenges in making the low-carbon transition, including where emissions are concentrated in the value chain and how costly it is to reduce emissions
We mostly use IEA’s low-carbon scenarios for our benchmarks, augmented with other sources where necessary (e.g., ICCT for autos)
*We use the Sectoral Decarbonization approach (SDA), which was created by
CDP, WWF & WRI in 2015 & is also used by the Science Based Targets Initiative.
Company A is not aligned with any of the benchmarks
Company B is eventually aligned with the Paris Pledges, but neither 2C/ nor
Below 2C
Company C is aligned with all Paris benchmarks, including Below 2C
Car
bo
n In
ten
sity
The State of Transition 2021
Management Quality level
The average Management Quality level of all companies in the TPI database is now 2.6
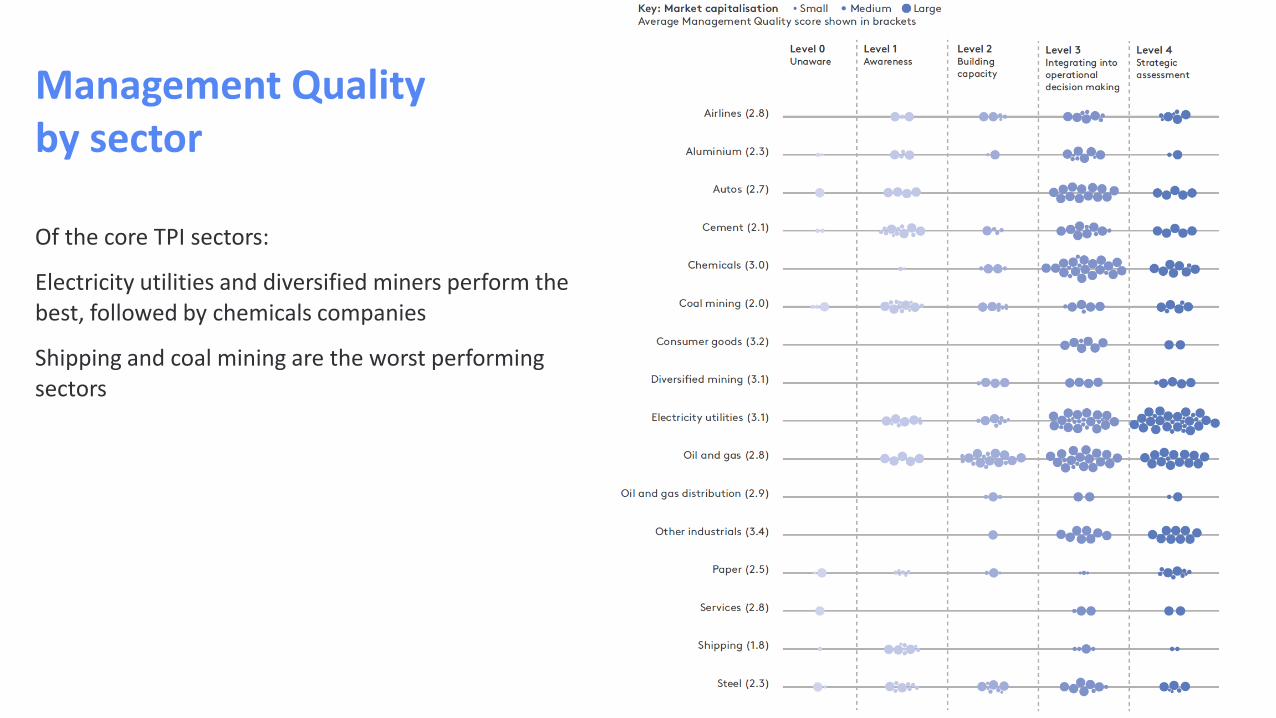
Management Quality by sector
Of the core TPI sectors:
Electricity utilities and diversified miners perform the best, followed by chemicals companies
Shipping and coal mining are the worst performing sectors
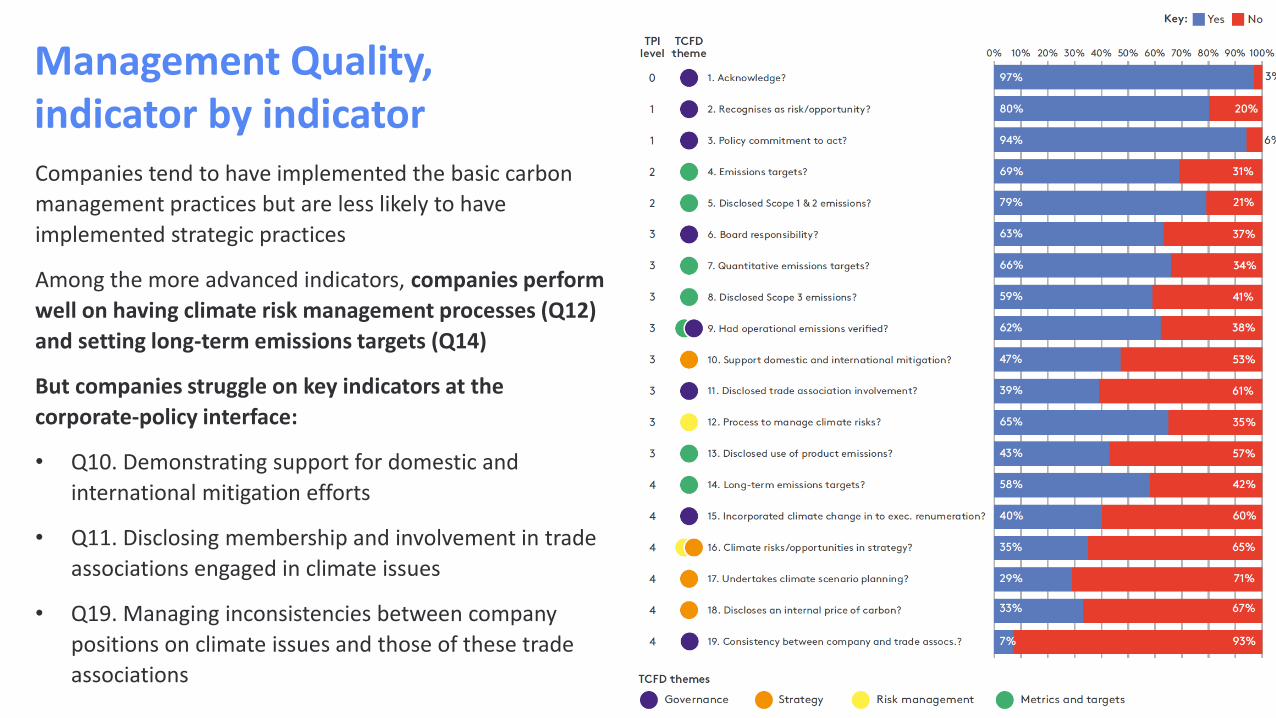
Management Quality, indicator by indicatorCompanies tend to have implemented the basic carbon
management practices but are less likely to have
implemented strategic practices
Among the more advanced indicators, companies perform
well on having climate risk management processes (Q12)
and setting long-term emissions targets (Q14)
But companies struggle on key indicators at the
corporate-policy interface:
• Q10. Demonstrating support for domestic and
international mitigation efforts
• Q11. Disclosing membership and involvement in trade
associations engaged in climate issues
• Q19. Managing inconsistencies between company
positions on climate issues and those of these trade
associations
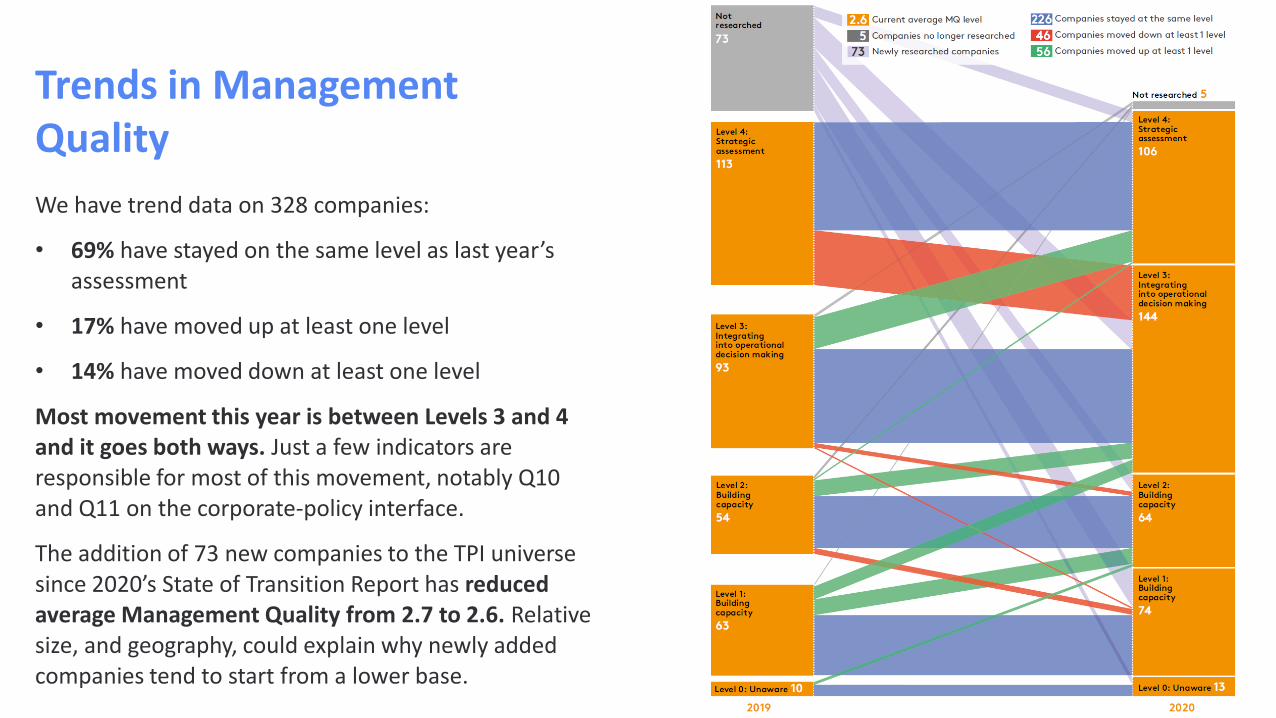
Trends in Management Quality
We have trend data on 328 companies:
• 69% have stayed on the same level as last year’s assessment
• 17% have moved up at least one level
• 14% have moved down at least one level
Most movement this year is between Levels 3 and 4 and it goes both ways. Just a few indicators are responsible for most of this movement, notably Q10 and Q11 on the corporate-policy interface.
The addition of 73 new companies to the TPI universe since 2020’s State of Transition Report has reduced average Management Quality from 2.7 to 2.6. Relative size, and geography, could explain why newly added companies tend to start from a lower base.
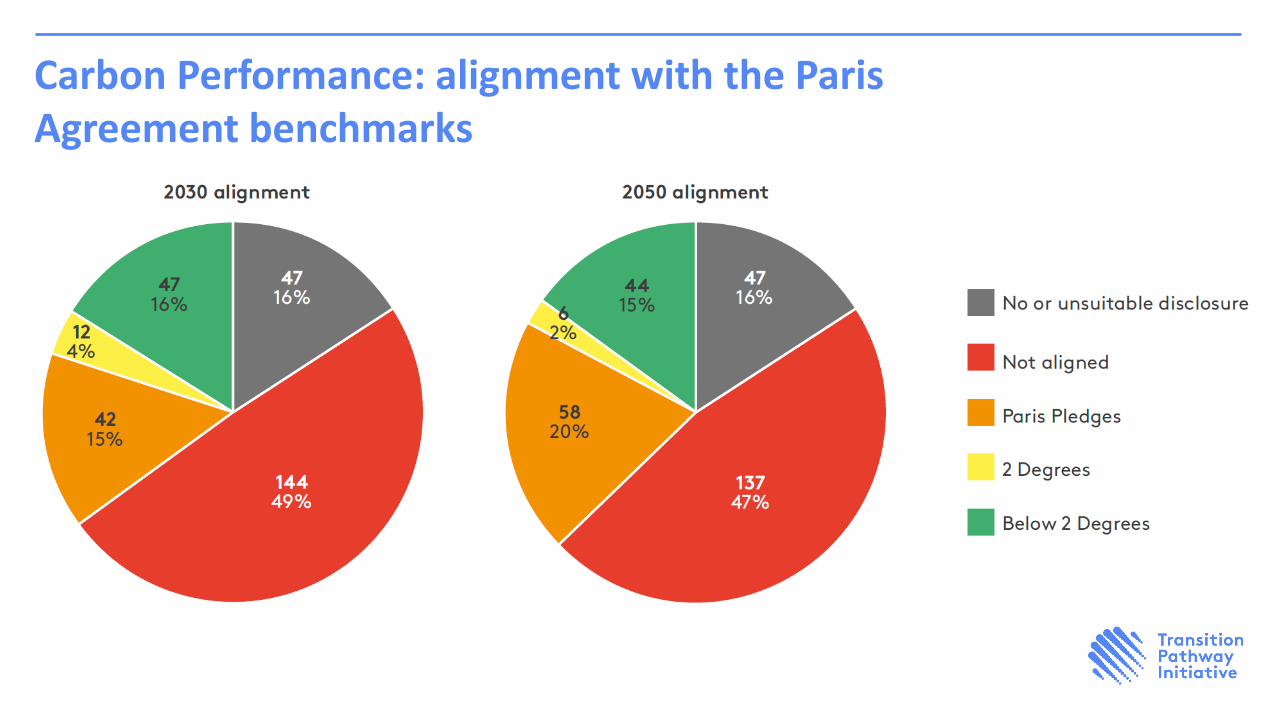
Carbon Performance: alignment with the Paris Agreement benchmarks
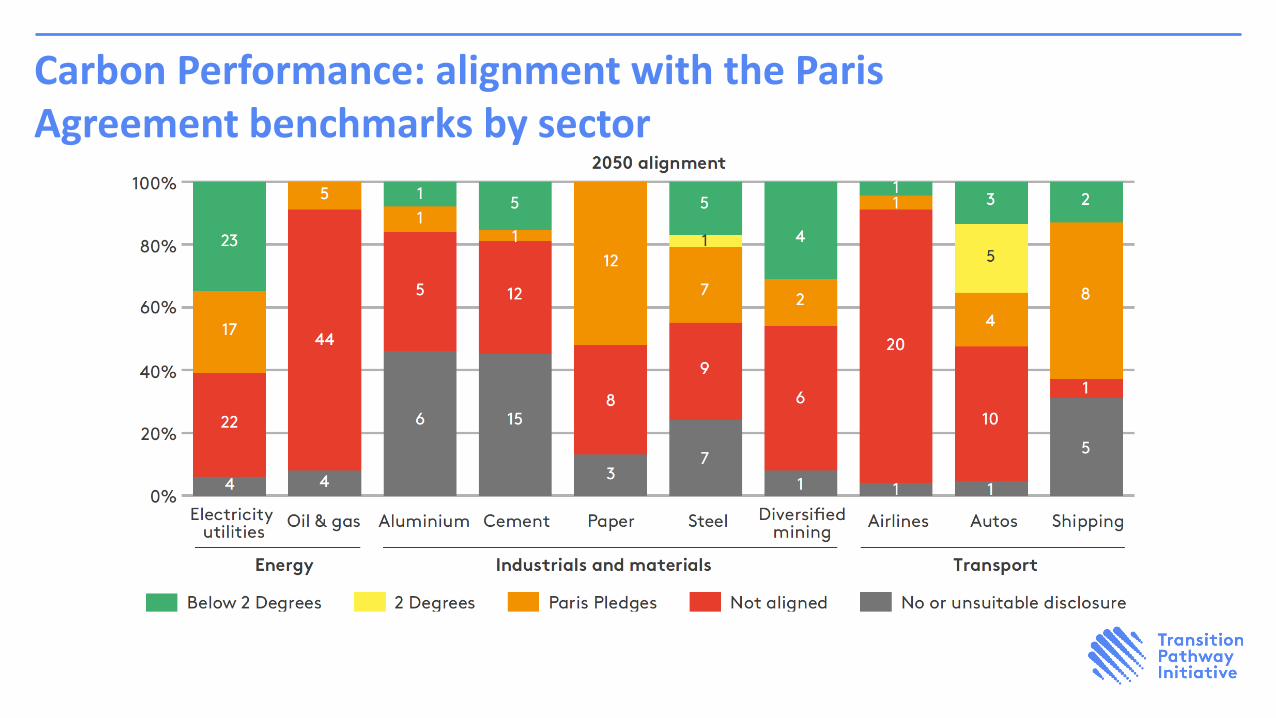
Carbon Performance: alignment with the Paris Agreement benchmarks by sector
Analysis of corporate emissions targets
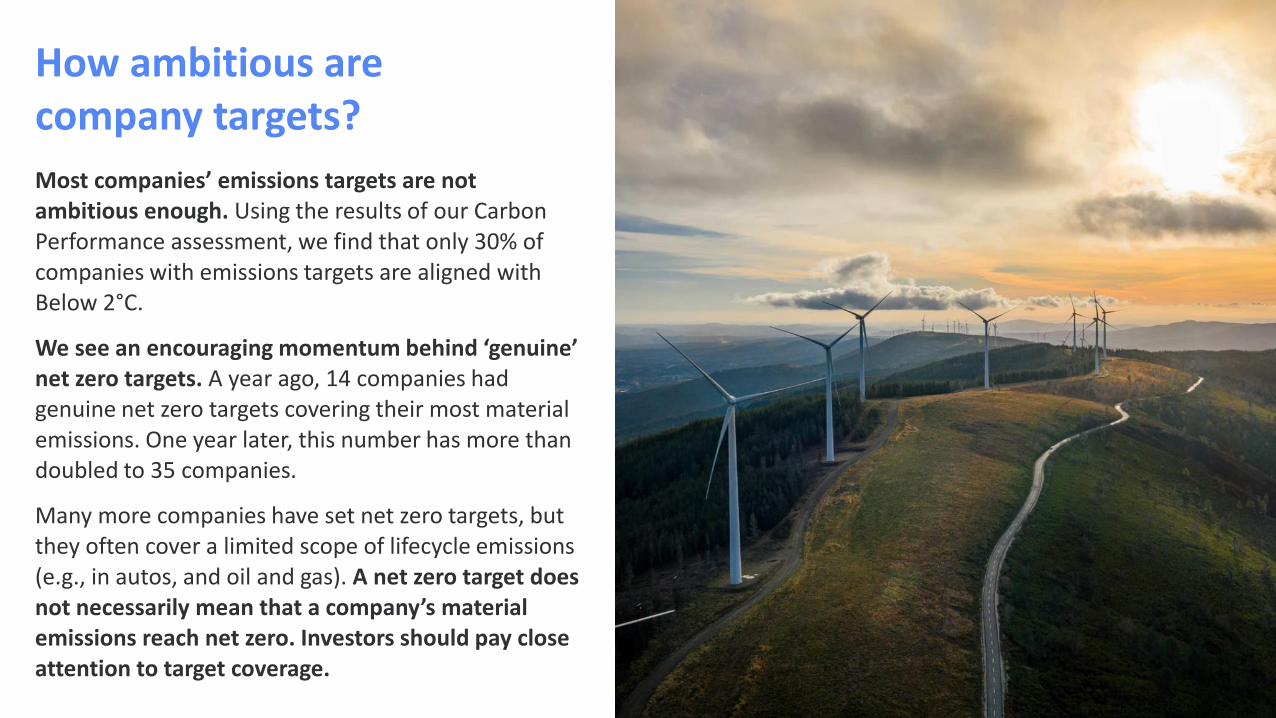
How ambitious are company targets?
Most companies’ emissions targets are not ambitious enough. Using the results of our Carbon Performance assessment, we find that only 30% of companies with emissions targets are aligned with Below 2°C.
We see an encouraging momentum behind ‘genuine’ net zero targets. A year ago, 14 companies had genuine net zero targets covering their most material emissions. One year later, this number has more than doubled to 35 companies.
Many more companies have set net zero targets, but they often cover a limited scope of lifecycle emissions (e.g., in autos, and oil and gas). A net zero target does not necessarily mean that a company’s material emissions reach net zero. Investors should pay close attention to target coverage.
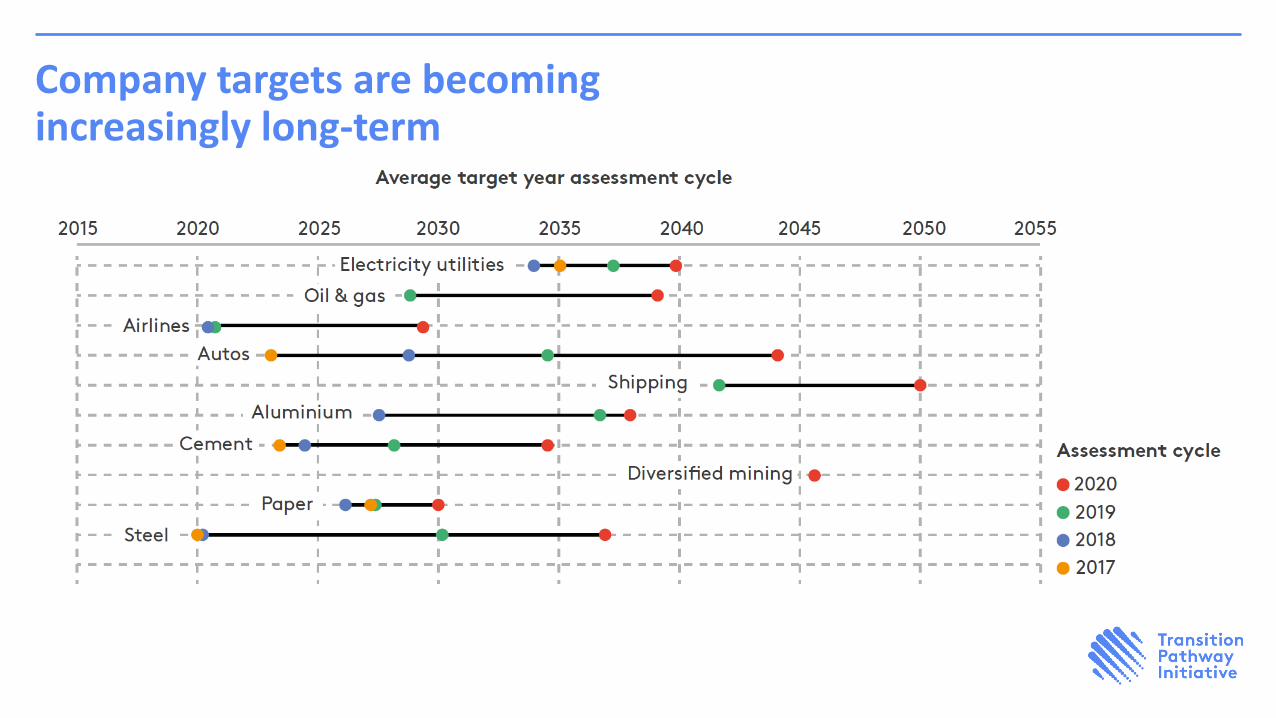
Company targets are becoming increasingly long-term
Are ambitious long-term targets underpinned by intermediate targets?
Out of the 42 companies that have set targets aligned with Below 2°C, 19 (45%) have not set any intermediate targets. This suggests that these companies are yet to define a precise roadmap from now until their target year, which tends to be relatively far off (their average target year is 2047). This absence of information makes it more difficult for investors to hold companies accountable for their commitments.
The remaining 23 companies have all set at least one interim target, seven have set two interim targets and two companies have set three.
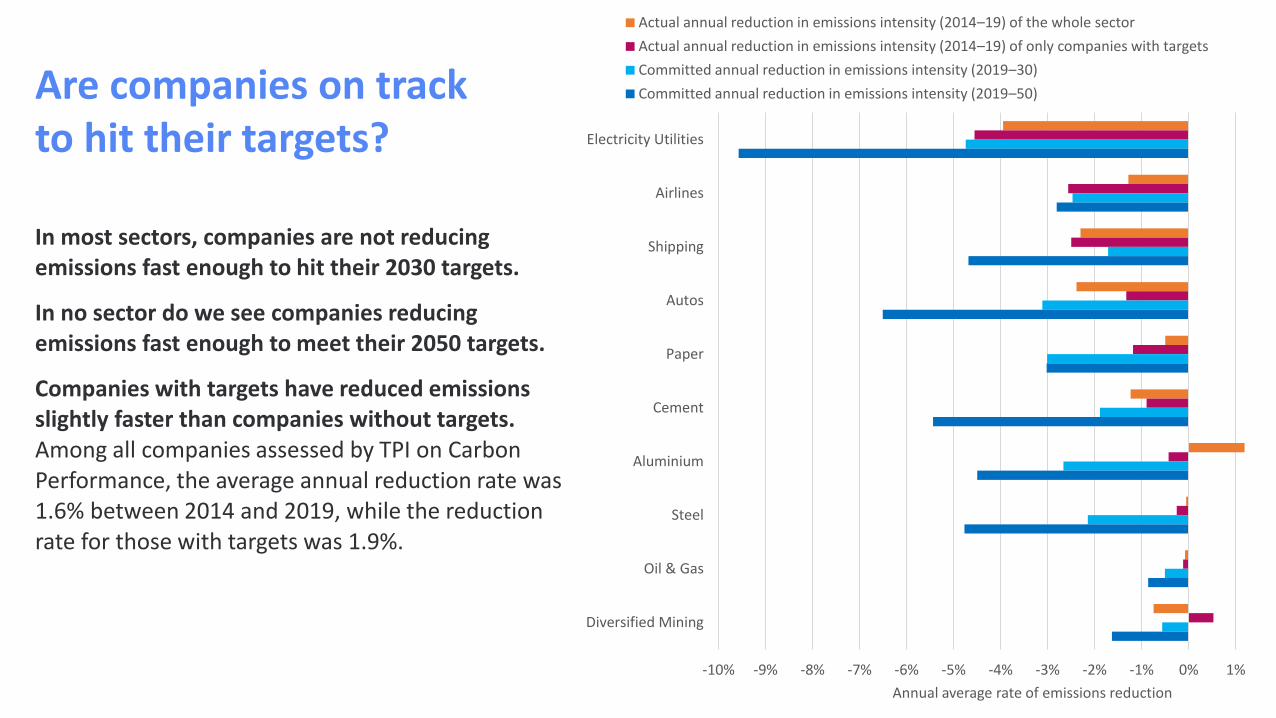
Are companies on track to hit their targets?
In most sectors, companies are not reducing emissions fast enough to hit their 2030 targets.
In no sector do we see companies reducing emissions fast enough to meet their 2050 targets.
Companies with targets have reduced emissions slightly faster than companies without targets.Among all companies assessed by TPI on Carbon Performance, the average annual reduction rate was 1.6% between 2014 and 2019, while the reduction rate for those with targets was 1.9%.
-10% -9% -8% -7% -6% -5% -4% -3% -2% -1% 0% 1%
Electricity Utilities
Airlines
Shipping
Autos
Paper
Cement
Aluminium
Steel
Oil & Gas
Diversified Mining
Annual average rate of emissions reduction
Actual annual reduction in emissions intensity (2014–19) of the whole sector
Actual annual reduction in emissions intensity (2014–19) of only companies with targets
Committed annual reduction in emissions intensity (2019–30)
Committed annual reduction in emissions intensity (2019–50)

Summary
Summary of results
Our 4th annual State of Transition Report covers 401 companies from 16 business sectors.
Most companies now have basic carbon management practices in place, but most companies are still not taking a truly strategic approach to the issue.
Average Management Quality is marginally lower than last year when it was 2.7. This is partly attributable to the addition of new companies, but we also see limited progress among companies scored previously by TPI.
On Carbon Performance, 15% of companies now align with Below 2°C in 2050, 2% align with 2°C, but 47% do not align with any of the benchmarks and 16% provide insufficient disclosure. The pattern of alignment in 2030 is similar.
Companies are not yet reducing their emissions fast enough to meet their targets.
Although Carbon Performance remains weak, we see some promising signs:
• Slightly more companies aligned with Below 2°C in 2030, slightly fewer companies providing insufficient disclosure
• Companies’ emissions targets are becoming longer-term
• More ‘genuine’ net zero targets (but watch out for net zero targets that do not cover companies’ most significant emissions sources)
Other parts of the report
Management Quality and Carbon Performance by geography
The link between Management Quality and Carbon Performance:
• Are Management Quality and Carbon Performance correlated?
• Does past Management Quality level correlate with subsequent emissions reductions?
Sector focus: Diversified mining
Explainer: Interpreting emissions scenarios and benchmarks
Disclaimer1. Data and information published in this report and on the TPI website is intended principally for investor use
but, before any such use, you should read the TPI website terms and conditions to ensure you are complying
with some basic requirements which are designed to safeguard the TPI whilst allowing sensible and open use
of TPI data. References in these terms and conditions to “data” or “information” on the website shall include
the carbon performance data, the management quality indicators or scores, and all related information.
2. By accessing the data and information published on this website, you acknowledge that you understand and
agree to these website terms and conditions. In particular, please read paragraphs 4 and 5 below which
details certain data use restrictions.
3. The data and information provided by the TPI can be used by you in a variety of ways – such as to inform your
investment research, your corporate engagement and proxy-voting, to analyse your portfolios and publish
the outcomes to demonstrate to your stakeholders your delivery of climate policy objectives and to support
the TPI in its initiative. However, you must make your own decisions on how to use TPI data as the TPI cannot
guarantee the accuracy of any data made available, the data and information on the website is not intended
to constitute or form the basis of any advice (investment, professional or otherwise), and the TPI does not
accept any liability for any claim or loss arising from any use of, or reliance on, the data or information.
Furthermore, the TPI does not impose any obligations on supporting organisations to use TPI data in any
particular way. It is for individual organisations to determine the most appropriate ways in which TPI can be
helpful to their internal processes.
4. Subject to paragraph 3 above, none of the data or information on the website is permitted to be used in
connection with the creation, development, exploitation, calculation, dissemination, distribution or
publication of financial indices or analytics products or datasets (including any scoring, indicator, metric or
model relating to environmental, climate, carbon, sustainability or other similar considerations) or financial
products (being exchange traded funds, mutual funds, undertakings collective investment in transferable
securities (UCITS), collective investment schemes, separate managed accounts, listed futures and listed
options); and you are prohibited from using any data or information on the website in any of such ways and
from permitting or purporting to permit any such use.
5. Notwithstanding any other provision of these website terms and conditions, none of the data or information
on the website may be reproduced or made available by you to any other person except that you may
reproduce an insubstantial amount of the data or information on the website for the uses permitted above.
6. The data and information on the website may not be used in any way other than as permitted above. If you
would like to use any such data or information in a manner that is not permitted above, you will need TPI’s
written permission. In this regard, please email all inquiries to [email protected].