Embed Size (px)
Citation preview
H2
www.steps.ucdavis.edu
State‐of‐the‐World Fuel Economy
Paris, 11 June 2015
Dr. Lewis Fulton, STEPS3 Program, Institute of Transportation StudiesUniversity of California, Davis

3
Typical national objectives related to transportation/fuels policies
• Reduce oil dependence (diversify fuels)
• Improve balance of payments• Reduce pollutant emissions• Reduce greenhouse gases• Promote domestic economies/jobs
3

4
IEA WEO 2012: heading toward 2 billion cars
OECD is fairly saturated, but rest of the world is not.:
© OECD/IEA 2012
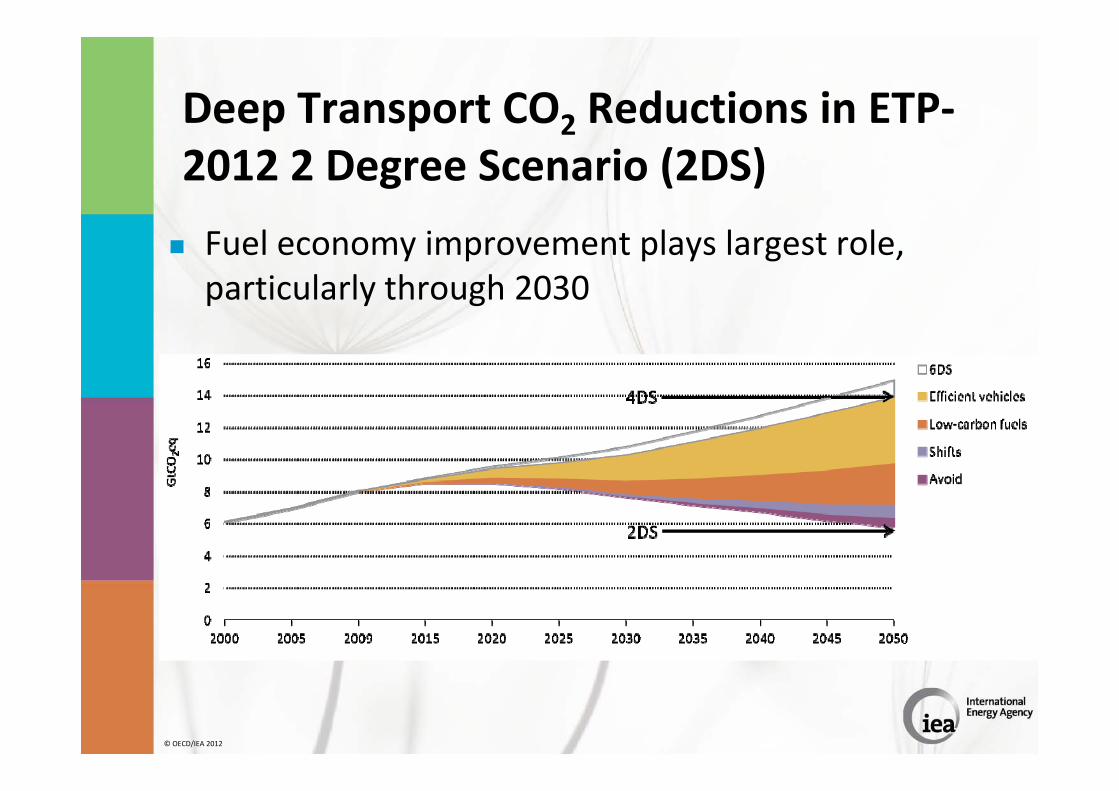
Deep Transport CO2 Reductions in ETP‐2012 2 Degree Scenario (2DS) Fuel economy improvement plays largest role, particularly through 2030
6
Fuel economy context
• Fuel economy improvement can be achieved through • Technical changes to vehicles• Changing the types of vehicles bought• Improving vehicle maintenance• Changing the way vehicles are driven (ecodriving)• Reducing traffic congestion
• Fuel economy improvement to vehicles should be part of a broader strategy:• Traffic management• City and regional planning• Promotion of public transit• Etc.
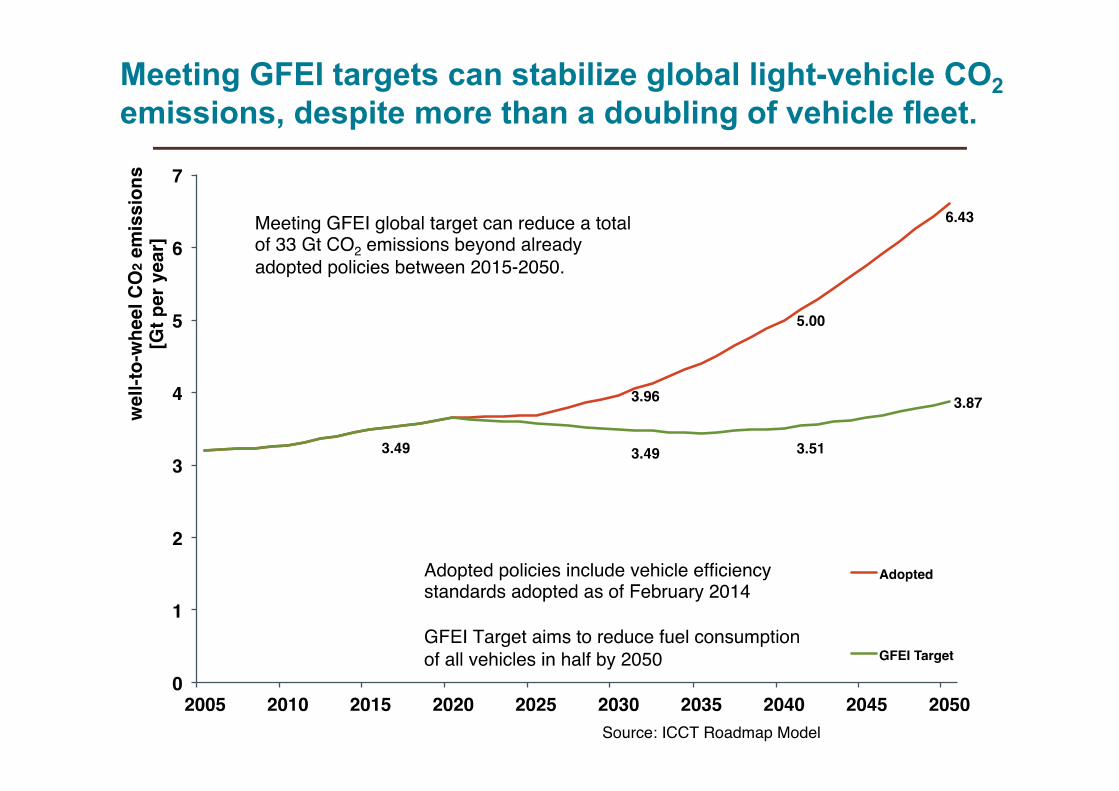
Meeting GFEI targets can stabilize global light-vehicle CO2emissions, despite more than a doubling of vehicle fleet.

© OECD/IEA 2012
Improving efficiency can save $billions
Countries could dramatically cut their fuel import bills in the future…
Source: IEA World Energy Outlook 2012

© OECD/IEA 2014
GFEI fuel economy report 2015 3rd edition since 2010 Unique compilation of OECD and non‐OECD new light duty vehicle fuel economy data
Dataset currently comprises 26 countries covering more than 80% of the global LDV market
Dataset covering eight years time series from 2008 to 2013
Next update will come in 2016 and will include data of GFEI pilot countries
© OECD/IEA 2014
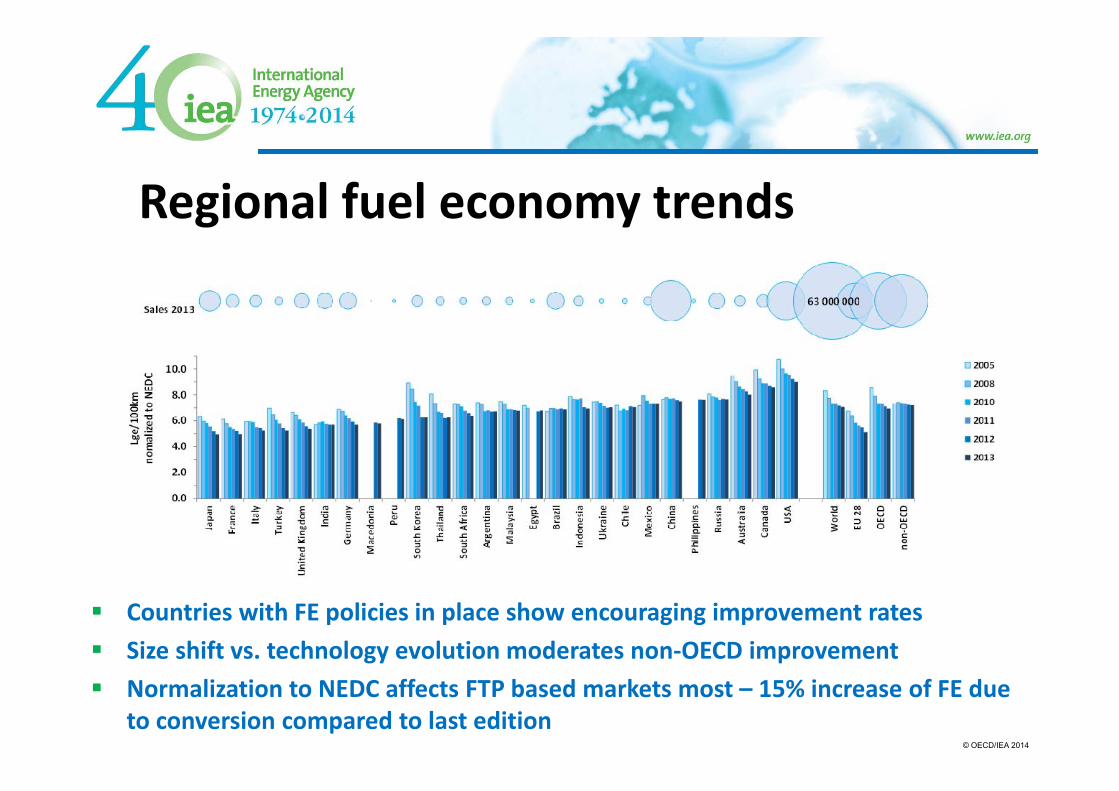
Regional fuel economy trends
Countries with FE policies in place show encouraging improvement rates Size shift vs. technology evolution moderates non‐OECD improvement Normalization to NEDC affects FTP based markets most – 15% increase of FE due
to conversion compared to last edition

© OECD/IEA 2014
FE improvement ‐ Targets and reality
2030: Improve global FE by 50%
OECD: rates close to target
Non‐OECD: little improvement
Global: Right trend at slow pace
2005 2013 2030
8.6 6.9
7.3 7.2
8.3 7.1
8.3 4.2
2005 base year
2014 base year
2008
OECD average
average fuel economy (Lge/100km) 7.9
annual improvement rate (% per year)‐2.7%
‐2.6%
2011
7.3
‐2.6% ‐2.6%
Non‐OECD average
average fuel economy (Lge/100km) 7.4
annual improvement rate (% per year)0.5%
‐0.2%
7.3
‐0.4% ‐0.9%
‐2.0%
GFEI target
average fuel economy (Lge/100km)
required annual improvement rate
(% per year)
‐2.7%
‐3.1%
‐1.9% ‐1.8%Global average
average fuel economy (Lge/100km) 7.7
annual improvement rate (% per year)‐2.3%
7.3
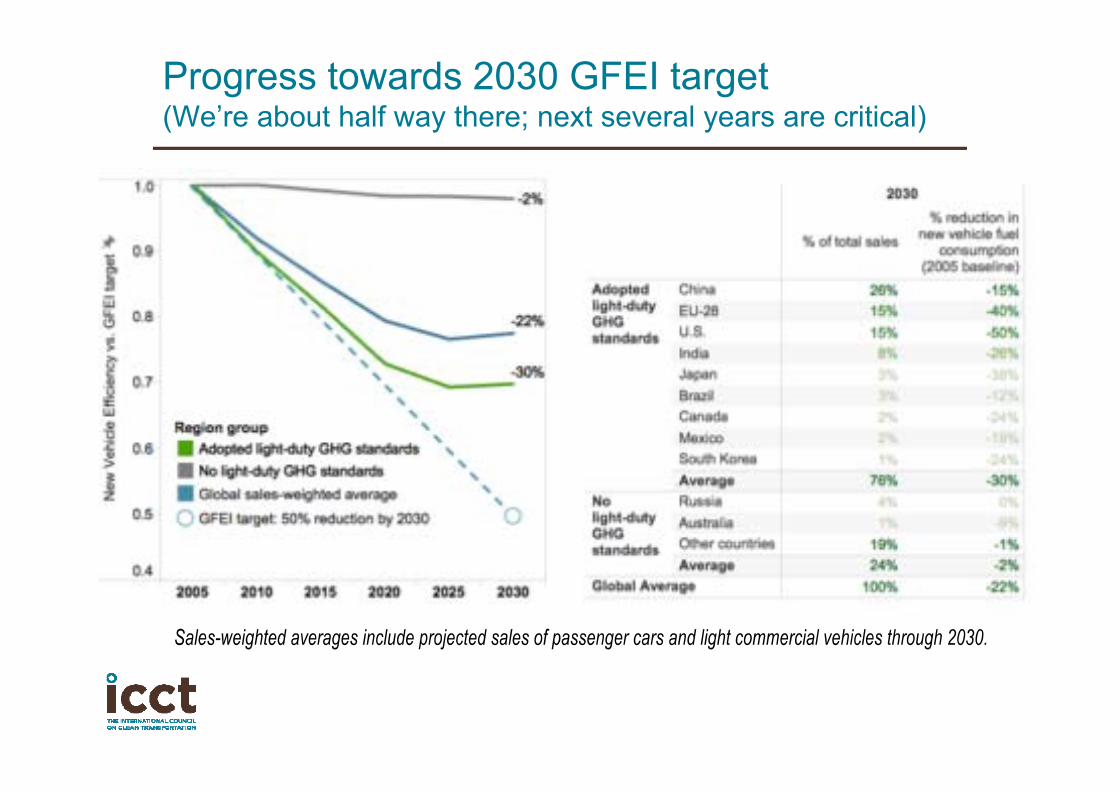
Progress towards 2030 GFEI target(We’re about half way there; next several years are critical)

© OECD/IEA 2014
FE in OECD is very heterogeneous
Both, least and most efficient markets are in OECD
Least efficient
Most efficient4.0
5.0
6.0
7.0
8.0
9.0
10.0
Lge/10
0km
norm
alized
to NED
C
OECD Non‐OECD
3 million vehicles
© OECD/IEA 2014
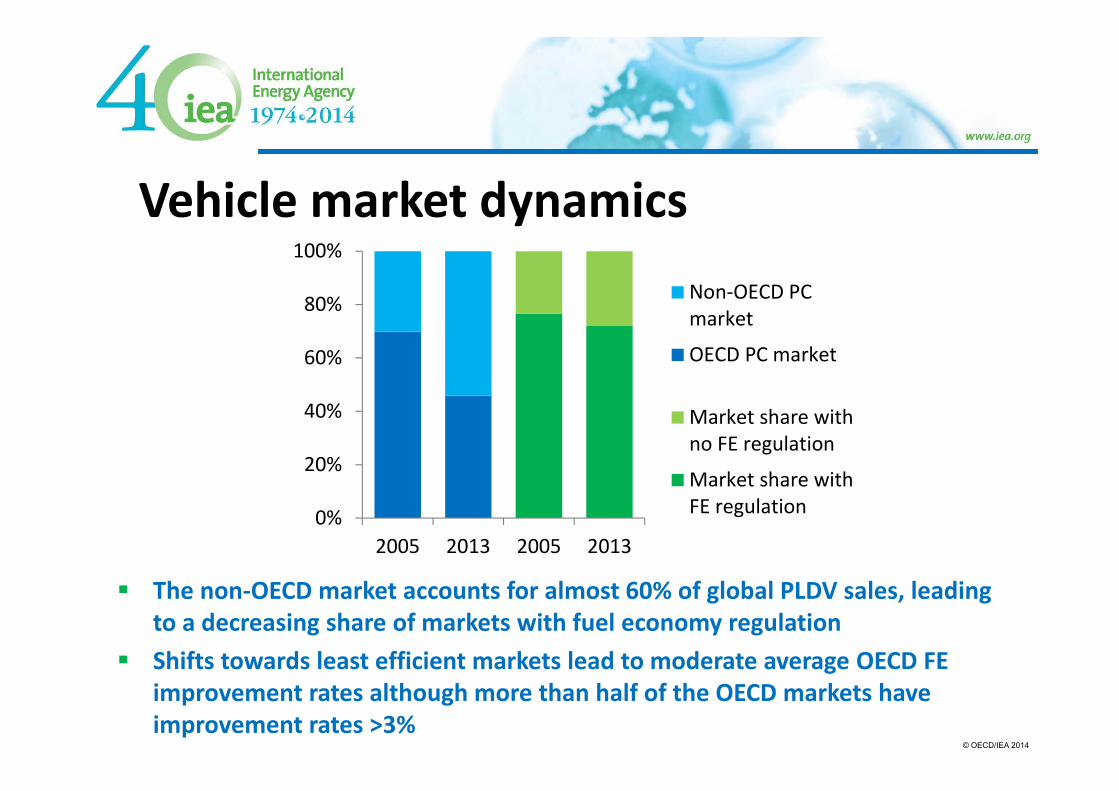
Vehicle market dynamics
The non‐OECD market accounts for almost 60% of global PLDV sales, leading to a decreasing share of markets with fuel economy regulation
Shifts towards least efficient markets lead to moderate average OECD FE improvement rates although more than half of the OECD markets have improvement rates >3%
0%
20%
40%
60%
80%
100%
2005 2013 2005 2013
Non‐OECD PCmarket
OECD PC market
Market share withno FE regulation
Market share withFE regulation
15
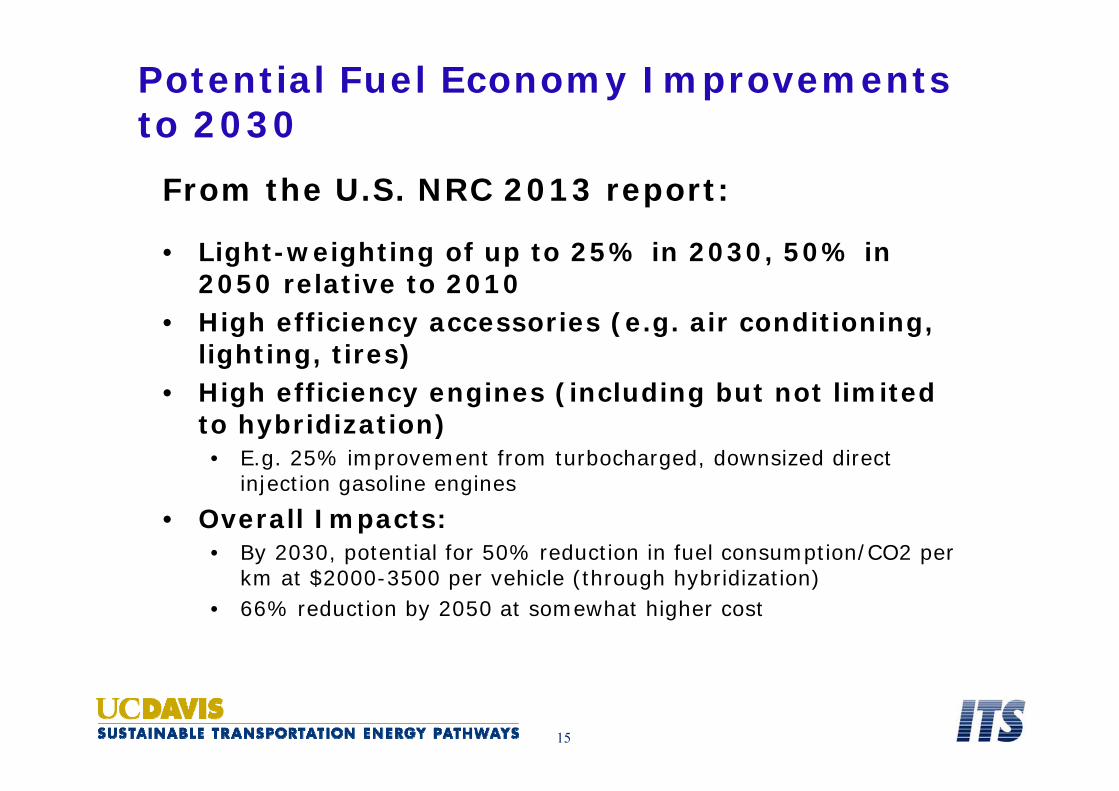
Potential Fuel Economy Improvements to 2030
From the U.S. NRC 2013 report:
• Light-weighting of up to 25% in 2030, 50% in 2050 relative to 2010
• High efficiency accessories (e.g. air conditioning, lighting, tires)
• High efficiency engines (including but not limited to hybridization)• E.g. 25% improvement from turbocharged, downsized direct
injection gasoline engines
• Overall Impacts:• By 2030, potential for 50% reduction in fuel consumption/CO2 per
km at $2000-3500 per vehicle (through hybridization)• 66% reduction by 2050 at somewhat higher cost

© OECD/IEA 2012
Fuel Economy Improvements are Cost-effectiveFuel savings more than pays for fuel economy improvements in light-duty vehicles
Source: IEA Fuel Economy Roadmap, July 2012
$0
$1,000
$2,000
$3,000
$4,000
$5,000
$6,000
$7,000
0% 10% 20% 30% 40% 50% 60%
Vehicle cost and
value
of fue
l savings
Percent improvement in fuel economy
Diesel
Gasoline
Fuel savings

17
Passenger Car Fuel Economy Standards Globally
US 20 25: 97 Canada 20 25: 97
Mexico 20 16: 145
EU 20 21: 95
Japan 20 20 : 122 China 20 20 : 117
S. Korea 20 20 :97
India 20 21: 113
Brazil 20 17: 138 KSA20 20 : 142
0
1
2
3
4
5
6
7
8
9
0
20
40
60
80
10 0
120
140
160
180
20 0
220
20 0 0 20 0 5 20 10 20 15 20 20 20 25
Lite
rs p
er 10
0 k
ilom
eter
s (g
asol
ine
equi
vale
nt)
Gra
ms
CO
2 per
kilo
met
er, n
orm
aliz
ed to
NED
C
historical performance enacted targets proposed targets or targets under study

Countries are at various points in developing fuel economy policies
Note: light vehicle fuel economy values normalized or NEDC test cycleSource: IEA ETP 2015 and ICCT
© OECD/IEA 2010
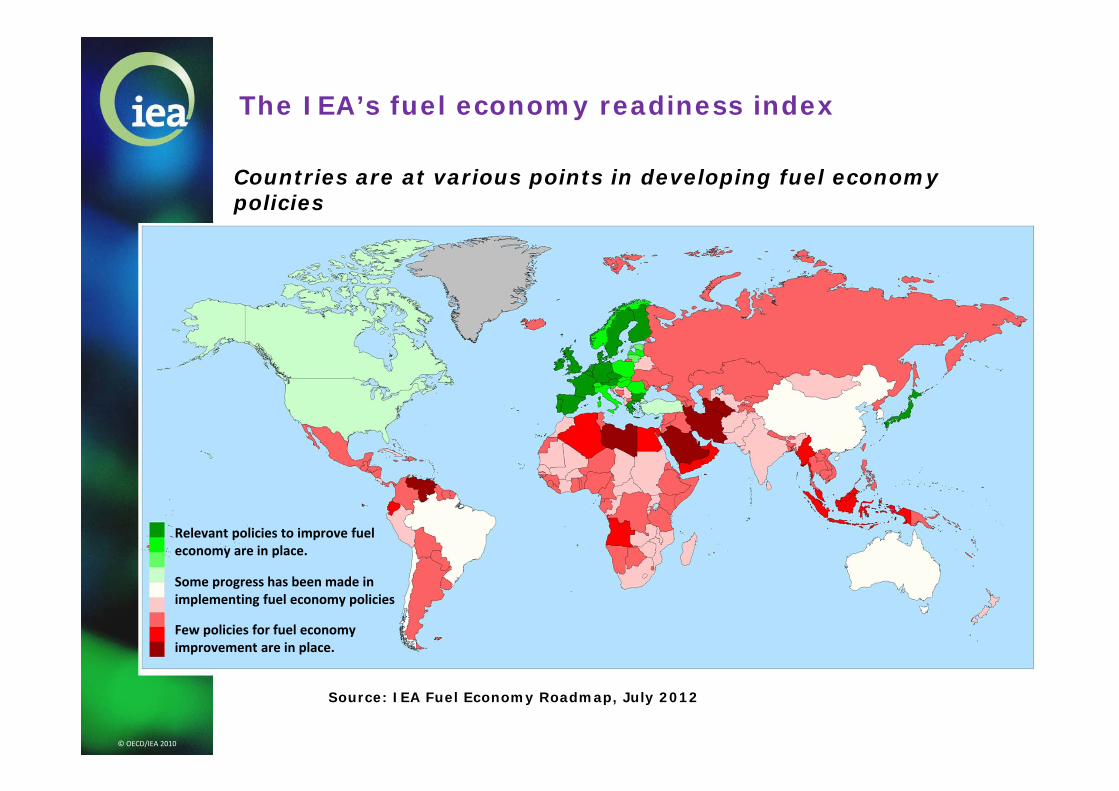
The IEA’s fuel economy readiness index
Countries are at various points in developing fuel economy policies
Source: IEA Fuel Economy Roadmap, July 2012
Few policies for fuel economy improvement are in place.
Some progress has been made in implementing fuel economy policies
Relevant policies to improve fuel economy are in place.
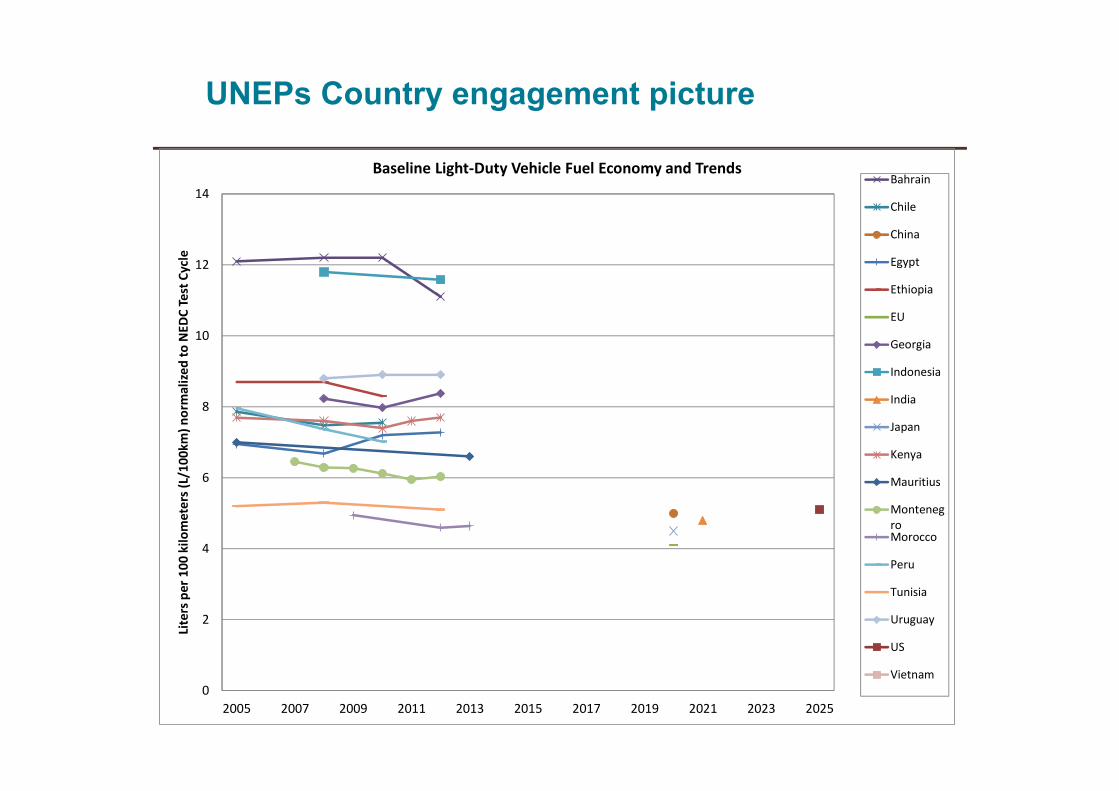
UNEPs Country engagement picture
0
2
4
6
8
10
12
14
2005 2007 2009 2011 2013 2015 2017 2019 2021 2023 2025
Liters per 100
kilo
meters (L/10
0km) n
ormalized
to NED
C Test Cycle
Baseline Light‐Duty Vehicle Fuel Economy and Trends Bahrain
Chile
China
Egypt
Ethiopia
EU
Georgia
Indonesia
India
Japan
Kenya
Mauritius
MontenegroMorocco
Peru
Tunisia
Uruguay
US
Vietnam
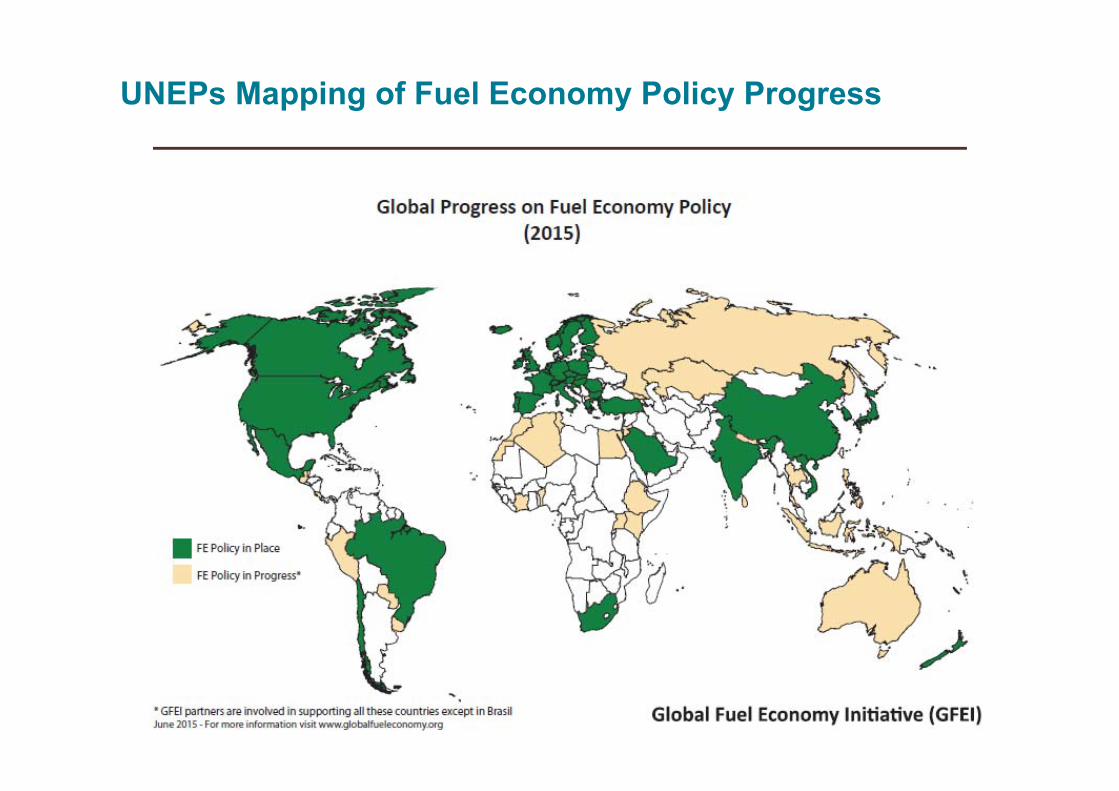
UNEPs Mapping of Fuel Economy Policy Progress
22
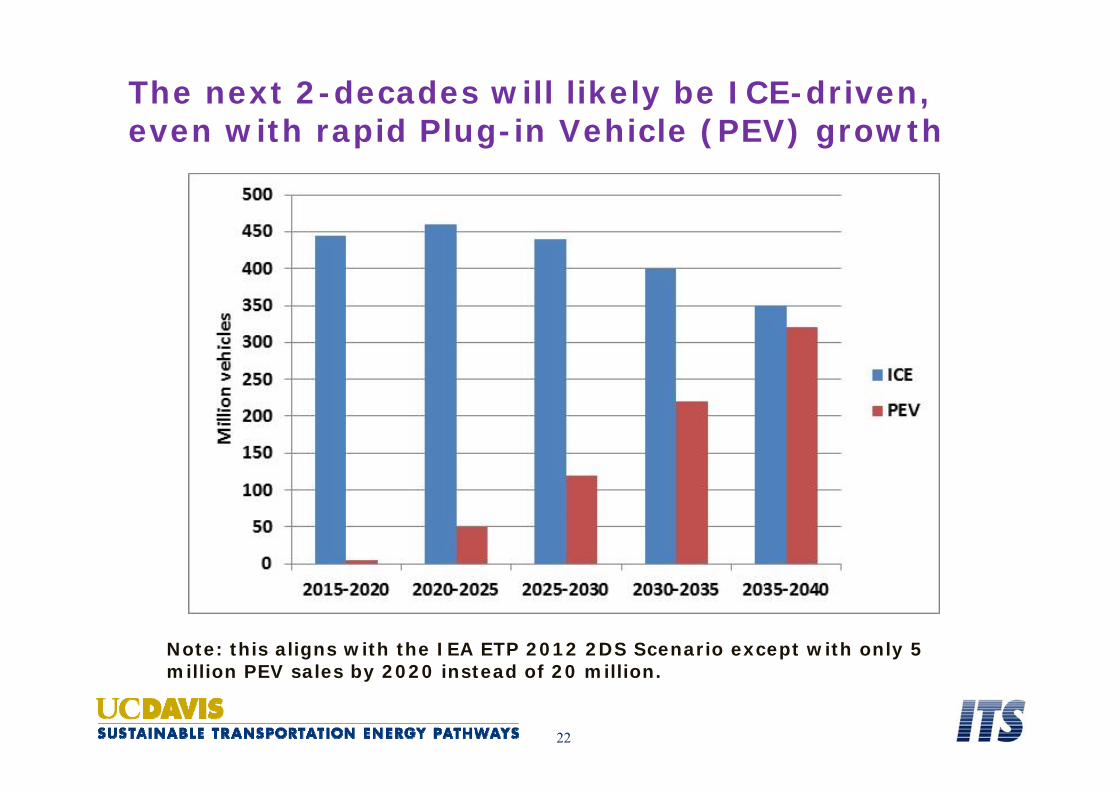
The next 2-decades will likely be ICE-driven, even with rapid Plug-in Vehicle (PEV) growth
Note: this aligns with the IEA ETP 2012 2DS Scenario except with only 5 million PEV sales by 2020 instead of 20 million.

23
020406080100120140160180200
800 600 400 200 0
Vehicle
CO2
emiss
ions g/km
Power plant CO2 emissions, g/kWh
BEV modest (0.25 kWh/km) BEV efficient (0.15 kWh/km)
Electric vehicles v. gasoline/diesel, with declining power plant CO2 emissions
Battery electric vehicles will probably be needed to get below 50 g/km, but we will also need deeply decarbonized electricity generation(Based on NRC, 2013 assumptions for fuel economy)
Best HEV, 2020?
BEV, modest efficiency
BEV, more efficient
Efficient ICE LDV, 2014
Best HEV, 2050?

© OECD/IEA 2014
ConclusionsReaching the GFEI target to cut by half specific light‐duty vehicle fuel consumption by 2030 requires: to keep scaling up the market coverage of fuel economy
regulations; to set strengthened fuel economy improvement targets for
the 2015‐2030 period (especially in the non‐OECD); to monitor the stringency of fuel economy improvement
targets already in place; to keep monitoring the developments of fuel economy
worldwide.