Embed Size (px)
Citation preview

State of the Student Experience: Fall 2020Higher Education During Disruption

C O P Y R I G H T S TA N D A R D S
This document contains proprietary research, copyrighted and trademarked materials of Gallup, Inc. Accordingly, international and domestic laws and penalties guaranteeing patent, copyright, trademark and trade secret protection safeguard the ideas, concepts and recommendations related within this document.
The materials contained in this document and/or the document itself may be downloaded and/or copied provided that all copies retain the copyright, trademark and any other proprietary notices contained on the materials and/or document. No changes may be made to this document without the express written permission of Gallup, Inc.
Any reference whatsoever to this document, in whole or in part, on any web page must provide a link back to the original document in its entirety. Except as expressly provided herein, the transmission of this material shall not be construed to grant a license of any type under any patents, copyright or trademarks owned or controlled by Gallup, Inc.
Gallup® is a trademark of Gallup, Inc. All other trademarks and copyrights are property of their respective owners.

Table of Contents
Background 1
Executive Summary 2
Findings 3
Methodology 15

State of the Student Experience: Fall 2020 | Higher Education During Disruption
Background
Higher education has faced unprecedented challenges amidst COVID-19. The pandemic’s economic impact continues to challenge students — and their families — as they struggle to finance their education. Students are also combatting mental health concerns and experiencing record-low wellbeing levels. At the same time, students are adapting to changes in how and where they learn as infections rise and fall in communities nationwide.
The impact of COVID-19 on students and their learning experiences has raised many questions about the state of higher education in the 2020-2021 academic year and beyond. As such, in the fall of 2020, Lumina Foundation and Gallup partnered to survey 2,064 students currently pursuing their associate degree and 3,941 pursuing their bachelor’s degree and assessed:
• How has COVID-19 changed the student experience?
• To what extent have changes resulting from COVID-19 impacted the quality of the student experience?
• How, if at all, will COVID-19 impact students’ ability to continue in their degree?
Throughout 2020, many students have transitioned between in-person and remote learning as schools continue to navigate the pandemic. It is important to note that most students interviewed for the Lumina-Gallup Student Study reported they were learning remotely (at least partially) when the survey was administered.
Copyright © 2020 Gallup, Inc. All rights reserved.1

State of the Student Experience: Fall 2020 | Higher Education During Disruption
Executive Summary
1 Most students pursuing their associate (72%) or bachelor’s degree (76%) rate the quality of their education as “excellent” or “very good.”
2 Students attending classes in-person are more positive about the quality of their education than those in a fully online learning model.
3 Those who transitioned from in-person learning in the spring of 2020 to a fully online learning model in the fall of 2020 are driving lower quality-level ratings among online learners.
4 Students who transitioned from an in-person learning model in the spring of 2020 to fully online learning in the fall of 2020 are also faring worse in their wellbeing, are less likely to feel their professors care about them as a person and are less likely to have a mentor.
5 First-time students in the fall of 2020 are more positive than their peers about the quality of education they are receiving. These students are also less likely than their peers to say they have considered withdrawing from courses in the past six months.
6 About a third of all currently enrolled students say they have considered withdrawing from courses in the past six months. When asked why they have considered stopping classes, the most-cited reasons are COVID-19 and emotional stress.
7 About half of currently enrolled students report that COVID-19 is “very likely” or “likely” to impact their ability to complete their degree.
8 Black and Hispanic students are more likely than their White peers to say COVID-19 is “very likely” or “likely” to impact their ability to complete their degree.
9 Black and first-generation students — two student populations who historically have lower completion rates than their peers — are the least likely to say their school offers many of the services designed to combat the impact of COVID-19 and other challenges, including mental health and financial services.
2Copyright © 2020 Gallup, Inc. All rights reserved.

State of the Student Experience: Fall 2020 | Higher Education During Disruption
Negative ratings and experiences are more common among students who have transitioned from a completely in-person to completely online instruction model.
Quality of Education Ratings by Degree Type
Which of the following best describes the quality of the education you are currently receiving in your [degree pursuing] program?
% ExcellentAssociate
degree students Bachelor’s
degree students Bachelor’s
degree students
% Very Good
39 41
% Good
% Fair
% Poor
1 1
Despite pandemic disruptions, 72% of students pursuing their associate degree and 76% of those pursuing their bachelor’s degree rate the quality of their education as “excellent” or “very good.”
7276
Findings
The majority of associate and bachelor’s degree students report the quality of education they received in the fall of 2020 as “excellent” or “very good.”
Copyright © 2020 Gallup, Inc. All rights reserved.LuminaReport_StateofStudentExperience_120920v8_kn
3

State of the Student Experience: Fall 2020 | Higher Education During Disruption
The largest predictor of perceived quality is the extent to which students receive instruction online — fully online students are more negative than those receiving instruction in-person.
Quality of Education Ratings by Curriculum Delivery Model*
Which of the following best describes the quality of the education you are currently receiving in your [degree pursuing] program?
Completely online
Mostly online
Equal time online/in-person
Mostly in-person
Completely in-person 34
44
43
42
39
1
1
*Among all currently enrolled associate and bachelor’s degree students
% Excellent % Very Good % Good % Fair % Poor
22% of associate and bachelor’s degree students say they are currently receiving instruction completely or mostly in-person, compared with 76% prior to the pandemic.
76
22
Copyright © 2020 Gallup, Inc. All rights reserved.LuminaReport_StateofStudentExperience_120920v8_kn
4
State of the Student Experience: Fall 2020 | Higher Education During Disruption
Dissatisfaction is driven by students who received coursework completely in-person prior to the pandemic and transitioned to fully online instruction in the fall of 2020.
Currently enrolled associate and bachelor’s degree students who were forced online during the pandemic give lower quality ratings than their peers. Given these students’ desire for an in-person education experience, some frustration is to be expected.
Quality of Education Ratings by Degree of Transition From In-Person to Online Instruction*
Which of the following best describes the quality of the education you are currently receiving in your [degree pursuing] program?
% Excellent % Very Good % Good % Fair % Poor
*Among all currently enrolled associate and bachelor’s degree students who took courses completely in-person prior to the pandemic
No change ininstruction model
Received more instruction online than prior to
the pandemic
Moved from completely in-person to
completely online
300
43
1
43
2
Copyright © 2020 Gallup, Inc. All rights reserved.LuminaReport_StateofStudentExperience_120920v8_kn
5

State of the Student Experience: Fall 2020 | Higher Education During Disruption
Quality ratings are highest among older students and those attending for-profit institutions; both groups have experienced less delivery model disruption.
Quality of Education Ratings by Age Group and Institution Type*
Which of the following best describes the quality of the education you are currently receiving in your [degree pursuing] program?
% Excellent/Very good
Age 18-24
Age 25+ Private not-for-profit
Public institution
79 Private for-profit
73
*Among all currently enrolled associate and bachelor’s degree students
7378
Although prior research indicates quality ratings are typically lower among students who attend for-profit institutions, quality ratings are higher among this group amidst COVID-19.**
These more positive ratings are driven by lower levels of disruption due to the pandemic, since most students attending for-profit institutions were learning online prior to the fall of 2020.
Similarly, older students have experienced lower levels of disruption as many received instruction fully online prior to the pandemic and continued to do so in the fall of 2020.
** Source: Rothwell, J. (2018, May 31). Assessing the validity of consumer ratings for higher education: Evidence from a new survey. The Journal of Consumer Affairs 53(1), 167-200. https://onlinelibrary.wiley.com/doi/abs/10.1111/joca.12201
Copyright © 2020 Gallup, Inc. All rights reserved.LuminaReport_StateofStudentExperience_120920v8_kn
6

State of the Student Experience: Fall 2020 | Higher Education During Disruption
Wellbeing and quality of the student experience are lowest among those who have transitioned from a completely in-person to completely online instruction model.
Wellbeing and Student Experience by Degree of Transition From In-Person to Online Instruction*
45
27
%Thriving in wellbeing
65
25
% Strongly agree a professorcares about them as a person
41
17
% Strongly agree they have a mentor
-18
-40
-24
59
36
% Strongly agree they belong at their institution -23
No change in instruction model
Received more instruction online than prior to the pandemic
Moved from completely in-person to completely online
*Among all currently enrolled associate and bachelor’s degree students who took courses completely in-person prior to the pandemic
Percentagepoint change
Copyright © 2020 Gallup, Inc. All rights reserved.LuminaReport_StateofStudentExperience_120920v8_kn
7

State of the Student Experience: Fall 2020 | Higher Education During Disruption
First-time enrollees in the fall of 2020 are more positive about the quality of their education than returning students.
Quality of Education Ratings by Enrollment Status*
Which of the following best describes the quality of the education you are currently receiving in your [degree pursuing] program?
% Excellent
% Very Good
% Good
% Fair
% Poor
Returningstudents
41
1
First-timestudents First-timestudents
40
0
*Among all currently enrolled associate and bachelor’s degree students
First-time enrollees are more positive than their peers across many metrics, including the quality of the student experience and wellbeing. Students’ expectations may influence the quality ratings they provide, as many first-time students entered the fall of 2020 understanding that their student experience would be different than that of students in years past.
In contrast, returning students who had an otherwise normal student experience prior to COVID-19 may give lower quality ratings because they have a comparison point and therefore had different expectations than first-time students.
Returning students who previously learned mostly or completely in-person and transitioned to a partially or fully online experience in the fall of 2020 report a decline in the quality of their education.
Quality of Education Ratings Pre- vs. Post-Pandemic*
How does the quality of the education you are currently receiving compare to the quality of education you received prior to COVID-19?
Quality is ________ now than it was in the spring.
Much better
Slightly better
About the same
Slightly worse
Much worse
83
% Associate degree students
% Bachelor’s degree students
13 16
* Among all currently enrolled associate and bachelor’s degree students who took courses at least partially in-person prior to the pandemic and have transitioned to a mostly or completely online learning model
Copyright © 2020 Gallup, Inc. All rights reserved.LuminaReport_StateofStudentExperience_120920v8_kn
8

State of the Student Experience: Fall 2020 | Higher Education During Disruption
About one-third of currently enrolled students report they considered stopping taking courses in the past six months, and about half of students say it is likely COVID-19 may impact their ability to continue.
Percentage of Currently Enrolled Students Who Have Considered Stopping Taking Courses
In the past six months, have you considered stopping taking courses?
Associate degree students
Bachelor’s degree students
62
38 33
67
% Yes % No
Copyright © 2020 Gallup, Inc. All rights reserved.LuminaReport_StateofStudentExperience_120920v8_kn
9

State of the Student Experience: Fall 2020 | Higher Education During Disruption
COVID-19 and emotional stress are the most cited reasons students give for considering stopping courses in the past six months.
Reasons Why Students Have Considered Stopping Taking Courses*
Which of the following describes why you considered stopping taking classes?
7 10
10 11
20
16
14 17
COVID-19/Coronavirus
Emotional stress
Cost of attendance
Childcare responsibilities/Care for a family member or friend
The coursework was too difficult
The education you werereceiving was low quality
Health-related reasons
You lost your job
You got a new job
You did not believe thedegree/credential would help you
achieve your personal goals
You did not believe thedegree/credential would help you
achieve your career goals
The courses you took were notrelevant to your future career
51360 70
% Associate degree students % Bachelor’s degree students
4224
3325
3224
158
14 14
12
11
7 7
Completing the degree/credentialwas taking longer than you expected
7 8
*Among all currently enrolled associate and bachelor’s degree students who report they considered stopping taking courses in the past six monthsNote: Ranked by most commonly selected reason for bachelor’s degree students; respondents were asked to report up to three main reasons they considered stopping taking a course; responses will add to more than 100% as respondents could select more than one reason
Copyright © 2020 Gallup, Inc. All rights reserved.LuminaReport_StateofStudentExperience_120920v8_kn
10

State of the Student Experience: Fall 2020 | Higher Education During Disruption
Consideration for stopping classes is highest among those who have transitioned from a completely in-person to completely online delivery model.
Percentage of Students Who Have Considered Stopping Taking Courses by Degree of Transition From In-Person to Online Instruction*
In the past six months, have you considered stopping taking courses?
36 44
No change ininstruction model
Received more instruction online than prior to
the pandemic
Moved from completely in-person to
completely online
* Among all currently enrolled associate and bachelor’s degree students who took courses completely in-person prior to the pandemic
Returning students are also more likely than their peers to report they have considered stopping taking courses.
Emotional stress is more commonly cited as a reason for stopping classes for those who have transitioned from completely in-person to completely online learning than for those who experienced no disruption in curriculum delivery (61% vs. 40%, respectively).
Copyright © 2020 Gallup, Inc. All rights reserved.LuminaReport_StateofStudentExperience_120920v8_kn
11

State of the Student Experience: Fall 2020 | Higher Education During Disruption
About half of currently enrolled associate and bachelor’s degree students say it is “likely” or “very likely” COVID-19 will negatively impact their ability to continue.
Black and Hispanic students are most likely to say COVID-19 will negatively impact their ability to complete their degree.
Students’ Perceived Likelihood COVID-19 Will Negatively Impact Their Ability to Complete Their Degree
How likely is it that the COVID-19 pandemic will negatively impact your ability to complete your [degree pursuing]?
% Very UnlikelyAssociate
degree students Bachelor’s
degree students Bachelor’s
degree students
% Unlikely
33 37
% Likely
% Very Likely
1720
Percentage of Students Who Say It Is Likely/Very Likely COVID-19 Will Negatively Impact Their Ability to Continue
Associate degree students
52
60
Black students
Hispanic students
White students
Bachelor’sdegree students
44
56
Black students
Hispanic students
White students
Copyright © 2020 Gallup, Inc. All rights reserved.LuminaReport_StateofStudentExperience_120920v8_kn
12
State of the Student Experience: Fall 2020 | Higher Education During Disruption
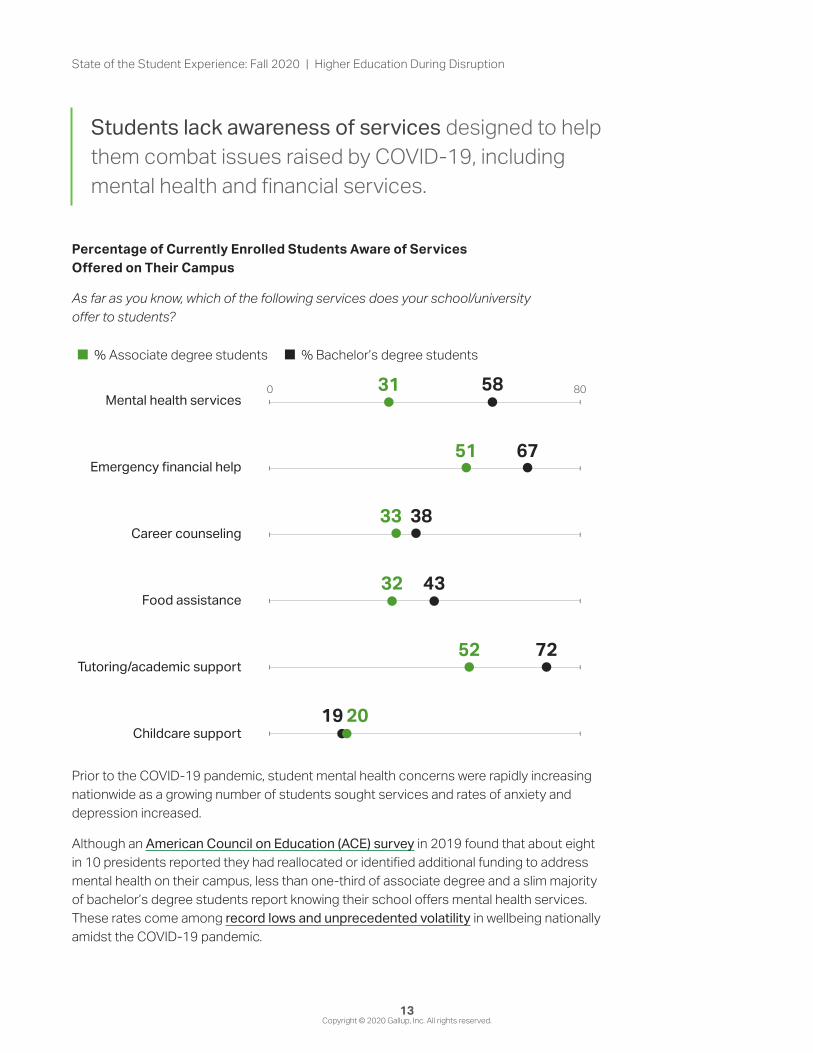
Students lack awareness of services designed to help them combat issues raised by COVID-19, including mental health and financial services.
Percentage of Currently Enrolled Students Aware of Services Offered on Their Campus
As far as you know, which of the following services does your school/university offer to students?
52 72
Mental health services
Emergency financial help
Career counseling
Food assistance
Tutoring/academic support
Childcare support
580 80
% Associate degree students % Bachelor’s degree students
6751
3833
4332
19 20
31
Prior to the COVID-19 pandemic, student mental health concerns were rapidly increasing nationwide as a growing number of students sought services and rates of anxiety and depression increased.
Although an American Council on Education (ACE) survey in 2019 found that about eight in 10 presidents reported they had reallocated or identified additional funding to address mental health on their campus, less than one-third of associate degree and a slim majority of bachelor’s degree students report knowing their school offers mental health services. These rates come among record lows and unprecedented volatility in wellbeing nationally amidst the COVID-19 pandemic.
Copyright © 2020 Gallup, Inc. All rights reserved.LuminaReport_StateofStudentExperience_120920v8_kn
13
State of the Student Experience: Fall 2020 | Higher Education During Disruption
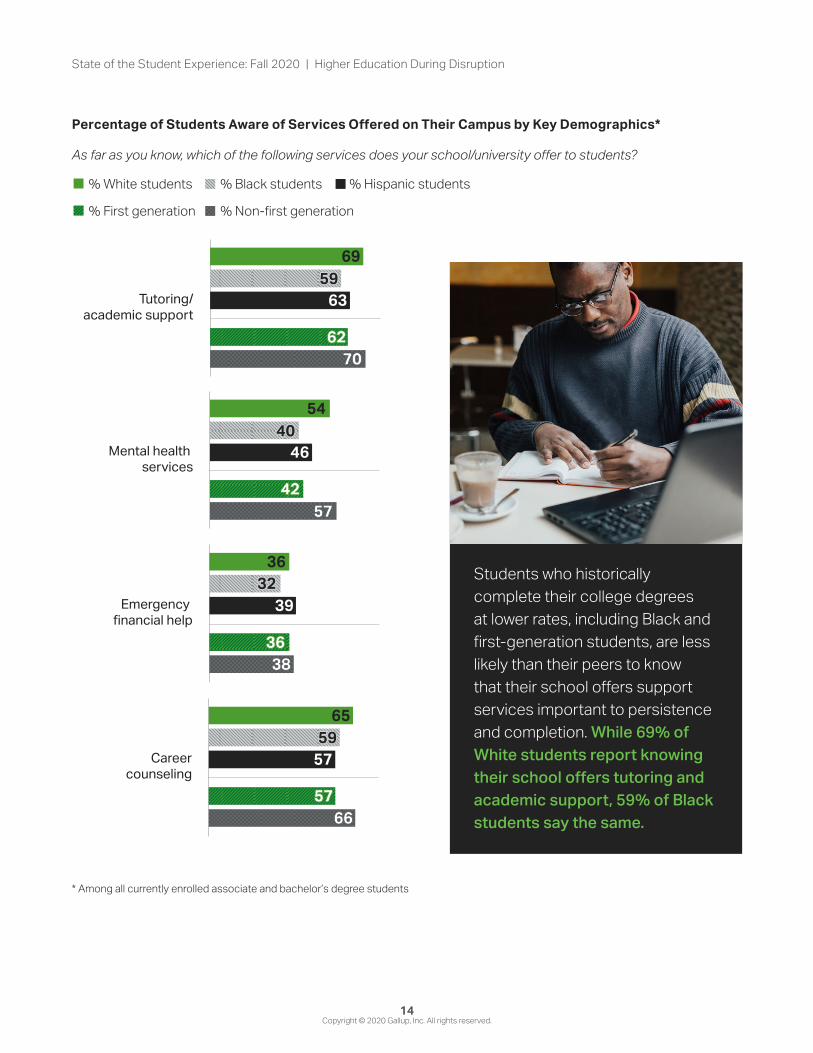
Percentage of Students Aware of Services Offered on Their Campus by Key Demographics*
As far as you know, which of the following services does your school/university offer to students?
Tutoring/academic support
69
63
Mental health services
54
46
Emergency financial help
36
39
Careercounseling
65
57
% White students % Black students % Hispanic students
% First generation % Non-first generation
* Among all currently enrolled associate and bachelor’s degree students
Students who historically complete their college degrees at lower rates, including Black and first-generation students, are less likely than their peers to know that their school offers support services important to persistence and completion. While 69% of White students report knowing their school offers tutoring and academic support, 59% of Black students say the same.
Copyright © 2020 Gallup, Inc. All rights reserved.LuminaReport_StateofStudentExperience_120920v8_kn
14

State of the Student Experience: Fall 2020 | Higher Education During Disruption
Methodology
Results for the Lumina-Gallup Student Study are based on web surveys conducted Sept. 22-Oct. 5, 2020, with a sample of 2,064 currently enrolled students pursuing an associate degree, 3,941 currently enrolled students pursuing a bachelor’s degree, 400 students pursuing a certification, industry certification or a certificate and 2,000 U.S. adults who are not currently enrolled in school but have some college and no degree. Respondents were interviewed via Dynata’s web-based panel.
The data are weighted to match national demographics of gender, age, race, Hispanic ethnicity and region. Demographic weighting targets are based on the most recent Current Population Survey figures for the aged 18 and older U.S. population.
All reported margins of sampling error for the study include the computed design effects for weighting.
• For results based on the total sample of 3,941 currently enrolled students pursuing a bachelor’s degree, the error range is ±2.3 percentage points.
• For results based on the total sample of 2,064 currently enrolled students pursuing an associate degree, the error range is ±3.0 percentage points.
In addition to sampling error, question wording and practical difficulties in conducting surveys can introduce error or bias into the findings of public opinion polls.
Copyright © 2020 Gallup, Inc. All rights reserved.15

T H I S R E P O R T WA S P R O V I D E D B Y