Embed Size (px)
Citation preview

Convened December 2004 by Great Lakes Institute for Environmental Research,University of Windsor, The Greater Detroit American Heritage River Initiativeof Metropolitan Affairs Coalition, The Detroit River Canadian Cleanup, TheDetroit River International Wildlife Refuge, The Detroit Water and SewerageDepartment, and other organizations.
A B I N A T I O N A L C O N F E R E N C E O N
T H E D E T R O I T R I V E R E C O S Y S T E M
MONITORING FOR SOUND MANAGEMENTSTATE OF THE STRAIT
o f t h e

1
Cover photos: photos left and center (upper and lower): Recreational fishing in the Huron-Erie Corridor (lower center photo by Kurt Byers, Michigan Sea Grant Extension, courtesy of United States Environmental Protection Agency, Great Lakes National Program Office; other photos courtesy of OMNR); upper right: Scientist sampling water, benthic invertebrates and sediment in Lake Erie (photo courtesy of Environment Canada and University of Windsor); lower right: Longear sunfish (Lepomis megalotis) (photo courtesy of Nicolas Lapointe)

2
STATE OF THE STRAIT
MONITORING FOR SOUND MANAGEMENT
2004 Conference Proceedings
Edited by:
Rachael Eedy, University of WindsorJohn Hartig, U.S. Fish and Wildlife Service
Charlie Bristol, Bristol Technical Services, Inc.Melanie Coulter, Detroit River Canadian Cleanup
Tracy Mabee, University of WindsorJan Ciborowski, University of Windsor
Based on a binational conference convened by The Great Lakes Institute for Environmental Research, University of Windsor, Greater
Detroit American Heritage River Initiative of Metropolitan Affairs Coalition Detroit River Canadian Cleanup, Detroit River International Wildlife Refuge, Detroit Water
and Sewerage Department, and other organizations.
Suggested citation: Eedy, R., J. Hartig, C. Bristol, M. Coulter, T. Mabee and J. Ciborowski eds. (2005). State of the Strait: Monitoring for Sound Management. Great Lakes
Institute for Environmental Research, Occasional Publication No. 4, University of Windsor, Windsor, Ontario.
3
TABLE OF CONTENTS
Executive Summary 5
Map of Huron-Erie Corridor 7
Acknowledgements 8
1. Introduction 9
2. State of the Detroit River and Western Lake Erie 11
3. Keynote Address 13
4. Session Summaries
4.1. Traditional Monitoring 16
4.2. Biomonitoring 19
4.3. Volunteer Monitoring 21
5. Key Findings and Concluding Remarks 24
6. Session Abstracts 28
Map of Project Locations 28
Traditional Monitoring
6.1. Salim et al., “Utilization of Water Quality Monitoring Data to 29Support the City of Detroit’s Long Term Combined Sewer Overflow Control Plan”
6.2. Drca, “City of Windsor Pollution Control Services Monitoring Plan 34for Pollution Control and Prevention”
6.3. Hughes et al., “Rouge River Water Quality: A Decade of Progress” 38
6.4. Drouillard, “Monitoring in Support of Modeling” 44
Biomonitoring
6.5. Johnson et al., “Fish and Fisheries of the Detroit River” 50
6.6. Cypher, “An Overview of Hawk Migration Studies by Southeastern 52Michigan Raptor Research at the Detroit River Mouth”
6.7. Robison, “Aerial Canvasback Survey of Lake St. Clair, Detroit River 57and Western Lake Erie”

4
6.8. Laing and Badzinski, “Trends in Bald Eagle Population Size 60and Productivity Along the Detroit River and on the North Shore of Lake Erie”
Volunteer Monitoring
6.9. Rupert, “Citizens in Action: Christmas Bird Counts and Project 64FeederWatch”
6.10. Petrella, “Rouge River Watershed Volunteer Frog and Toad Survey” 68
6.11. Szczechowski and Nasarzewski, “Stream Team: Ten Years of 72Downriver Watershed Monitoring”
6.12. Crewe and Timmermans, “The Marsh Monitoring Program: 78Monitoring Ecological Integrity of Wetlands in Great Lakes Areas of Concern”
Posters
6.13. Chu et al., “‘New’ Contaminants in Snapping Turtles 84(Chelydra serpentina) from Areas of Concern in the Detroit River System”
6.14. Fernie et al., “PBDEs, PCBs, and DDE in Snapping Turtle Eggs from 88Canadian Areas of Concern on the Lower Great Lakes”
6.15. Manny et al. a. “The Huron-Erie Corridor Initiative” 92
6.16. Manny et al. b. “Creation of Lake Sturgeon Spawning Habitat in 96the Detroit River”
6.17. Lapointe et al., “Fish-Habitat Associations in Shallow Canadian 100Waters of the Detroit River”
6.18. McCrea et al., “Whole-Water Sampling Techniques for the 107Determination of Trace Mercury and Trace Metal Concentrations that Do Not Require In-Field Clean-Room Facilities”
6.19. Walsh and Urbani, “Making Christmas Count: DTE Energy’s 109Monroe Power Plant and its Participation in the Christmas Bird Count”
Appendix I: Conference Program 112
Appendix II: List of Conference Displays 114
Appendix III: Summary of Comments from Conference Participants 119
Appendix IV: Press Release from Stream Team and Wayne County 120 Department of the Environment
Appendix V: Conference Sponsor Statements 122
Appendix VI: Conference Registration List 129

5
EXECUTIVE SUMMARY
The State of the Strait Conference is held every two years to bring together government managers, researchers, environmental and conservation organizations, students and concerned citizens from Canada and the U.S. to assess ecosystem status and provide advice to improve research, monitoring, and management programs for the Detroit River and western Lake Erie. The theme of the 2004 conference was “Monitoring for Sound Management.”
Clearly, monitoring is essential for effective and defensible management. Management agencies will not know what actions to take to restore or protect the health of the river and lake without a fundamental understanding of their condition. Monitoring is given a much lower priority today than in the 1970s and 1980s. Hundreds of millions of dollars have been spent to upgrade sewage treatment plants and clean up contaminated sediments. Tens of thousands of dollars are spent each year to measure the quality of the Detroit River’s and western Lake Erie’s water, sediments, and biota. However, managers still don’t really understand whether the ecosystem is improving or not. Stakeholders frequently ask for indicator data to evaluate the effectiveness of programs. Indeed, a 2004 report, “Flying Blind: Water Quality Monitoring and Assessment in the Great Lakes States,” concluded that in the 30 years following the signing of the U.S. Clean Water Act there is simply no way to state with confidence whether the waters of the Great Lakes are safe for public use (Environmental Integrity Project 2004).
To be able to measure progress, future monitoring programs must evaluate ecological conditions against quantitative ecosystem targets. Evaluating progress toward restoring impaired beneficial uses should be a priority. Management actions taken on the Detroit River and western Lake Erie should be treated as experiments: monitoring documents conditions prior to intervention, guides predictions/hypotheses, and measures the outcomes and effectiveness of actions taken.
Volunteer monitoring programs offer a wealth of valuable data and information that can supplement traditional monitoring activities. Good examples of “citizen science” discussed at the conference included Christmas Bird Count programs, “Hawk Watch” programs like the Holiday Beach Festival of Hawks and the HawkFest at Lake Erie Metro Park, frog and toad surveys, and the Stream Team.
Volunteer monitoring programs are underappreciated and underutilized. Greater emphasis must be placed on ensuring that volunteer monitoring data have sufficient quality controls, that management agencies sanction these efforts and agree to use the data for management purposes, and that the data are broadly disseminated and actually used. A unique partnership announced at the conference between the Stream Team and Wayne County Department of Environment is a good example of effective use of volunteer monitoring data by government for environmental management.

6
Recommendations from the conference steering committee include:
• A single, central directory of past and present monitoring data and programs is needed to permit managers, researchers, and the public to find the key information necessary to understand the historical and current state of the Detroit River and western Lake Erie.
• All agencies and organizations must coordinate their monitoring efforts. There is a need to better coordinate monitoring for the corridor and sustain a central repository for databases supportive of ecosystem modeling, research, and management. Good examples include Data Retrieval, Exchange, Archival, and Management System (DREAMS), Monitoring Upper Great Lakes Connecting Channels Committee (MUGLCCC), and the Rouge River National Wet Weather Demonstration Project.
• The science-management linkage must be strengthened. More effort must be expended on integrating recent scientific knowledge with management for the Detroit River and western Lake Erie. This strengthened linkage can be accomplished, in part, by:
– Identifying quantitative objectives and targets to help managers evaluate and select the most appropriate rehabilitation/conservation techniques
– Increasing cooperative monitoring and research efforts to quantify problems, establish cause-and-effect relationships, and determine effectiveness relative to ecosystem health, performance, and function
– Committing resources to follow-up assessment of the effectiveness of remediation and restoration projects
• Greater emphasis must be given to ensuring timely reporting of data in a clear and understandable fashion. Monitoring data must be made more accessible. The data must be summarized and objectively interpreted in ways that are meaningful to non-experts and informative to decision-makers. These findings must be broadly communicated. Perhaps an electronic, binational indicator report should be prepared and routinely updated to improve accessibility, translation, and communication. This could be the focus of the next State of the Strait Conference.
The State of the Strait Conference continues to be an effective tool for synthesizing and communicating such knowledge, and transferring lessons learned and practical experiences from data collectors to information users.

7
MAP OF HURON-ERIE CORRIDOR

8
ACKNOWLEDGEMENTS
The State of the Strait (SOS) Steering Committee would like to thank our sponsors and collaborators for their generous support of this year’s State of the Strait Conference. The proceedings were produced with layout services contributed by CDM and printing services contributed by the Detroit Water and Sewerage Department. Brief descriptions of the mandates or activities of the SOS sponsors are provided in Appendix V.
The invaluable help provided by individuals at the University of Windsor in Web Support Services (Richard Dumala and Sherri Simpson), Office of Public Affairs and Communications (Lori Koutros), and Catering Services (Ann Devine Fantin) is gratefully acknowledged. We thank the volunteers who helped at the conference including: staff and students at the University of Windsor’s Department of Biological Sciences, Great Lakes Institute for Environmental Research, and Concurrent Education; Tom Henderson (Little River Enhancement Group); and Sandra Morrison (Great Lakes Science Center, U.S. Geological Survey).
The highly relevant information shared via presentions, posters, and displays was essential to the success of the conference. We thank everyone who attended the conference for their participation, questions and comments. Conference attendees voiced a strong commitment towards a better future for the Detroit River and surrounding areas. They also made some excellent suggestions about how to make this happen. The contributions of attendees, presenters, and conference organizers are all reflected in this report.

9
1. INTRODUCTION
The State of the Strait Conference is held every two years, bringing together government managers, researchers, environmental and conservation organizations, students, and concerned citizens from Canada and the United States. Conference participants work to understand historical ecosystem conditions and assess current ecosystem status in order to achieve a better future for the Detroit River and western Lake Erie. The goals of the Conference are to:
• Compile and synthesize knowledge from both research and monitoring programs
• Provide advice to improve research, monitoring, and management programs
• Promote ecosystem-based management to restore and maintain the physical, chemical, and biological integrity of the Detroit River-western Lake Erie ecosystem
More than 230 people attended the December 2, 2004 State of the Strait Conference at the University of Windsor (Appendix VI). Clearly, monitoring is essential for effective and defensible management. Management agencies will not know what actions to take to restore or protect the river’s and lake’s health unless there is a fundamental understanding of their condition. Monitoring is given a much lower priority today than in the 1970s and 1980s. Millions of dollars have been spent to upgrade sewage treatment plants and clean up contaminated sediments. Tens of thousands of dollars are spent each year to measure the quality of the Detroit River’s and western Lake Erie’s water, sediments, and biota, but managers still don’t really understand whether the ecosystem is improving or not. Stakeholders frequently ask for indicators of whether these projects are really making
a difference. Indeed, the 2004 report entitled "Flying Blind: Water Quality Monitoring and Assessment in the Great Lakes States" concluded that in the 30 years following the signing of the U.S. Clean Water Act there is simply no way to state with confidence whether the waters of the Great Lakes are safe for public use (Environmental Integrity Project 2004).
The 2004 State of the Strait Conference took a new approach. The theme of the conference was “Monitoring for Sound Management.” It was convened with the belief that, collectively, much more information is available on the state of the ecosystem than is commonly recognized. The goal was to highlight the diversity of monitoring data available, much of which is poorly known to the larger community. Presenters were invited from a broad range of agencies, non-government organizations, and the public. Rather than simply asking local experts to report on the amounts of chemicals present in water, sediments, and biota, the conveners organized the agenda into three categories: traditional monitoring, biomonitoring, and volunteer monitoring (Appendix I). Speakers in the first category reported on traditional monitoring programs that have been established to track conventional and toxic pollutants. Biomonitoring experts discussed novel programs that study the health of fish and diving duck populations, hawk migrations, and bald eagle populations. In the third category, volunteer monitoring, program coordinators described the wealth of valuable data and information collected
In the 30 years following the signing of the Clean Water Act there is simply no way to state with confidence whether the waters of the Great Lakes are safe for public use.

10
by citizen scientists to assess and track the health of birds, frogs, and the biota of streams through volunteer monitoring programs such as the Christmas Bird Count, Marsh Monitoring Program, frog and toad surveys, and Stream Team. Slides from many of these presentations have been posted on the conference website, http://www.uwindsor.ca/softs.
In addition, all State of the Strait Conference attendees were invited to identify sampling locations of local monitoring projects on a computer (or virtual) map to help build an archive and monitoring repository for the Detroit River corridor.
This report presents a summary of all information presented at the 2004 State of the Strait Conference. It includes
extended abstracts of all presentations and scientific posters (Section 6) and brief descriptions of displays (Appendix II). The key findings and recommendations (Section 5) were developed by the State of the Strait Conference Steering Committee.
Participants and displays at the 2004 SOS conference.

11
2. THE STATE OF THE DETROIT RIVER AND WESTERN LAKE ERIE
The conference began with a brief overview of the state of the Detroit River and western Lake Erie. In general, municipal phosphorus loadings and the loadings of many other chemicals declined dramatically during the 1970s and 1980s. Western Lake Erie, in turn, exhibited a reversal in cultural eutrophication through the 1980s and early 1990s. However, there has been little change since then, and accurate loading estimates of nutrients cannot be calculated because of cuts in monitoring (Panek et al. 2003). Wastewater treatment in the Detroit River-western Lake Erie basin has improved dramatically during the last 30 years, but most recently, the priority has been to address combined sewer overflows and urban stormwater runoff to meet water quality standards that permit body contact recreation.
Zebra mussels (Dreissena polymorpha) were introduced into the Detroit River and Lake Erie in the late 1980s (Leach 1993) and quickly spread throughout the systems. Today, we still don’t fully understand their effect on the food web, especially the interactions amongst nutrient loadings, zebra mussels, and blue green algal blooms (i.e., Microcystis).
Mercury loadings declined substantially following elimination of mercury cell technology to produce chlorine and caustic soda in the basin. Between the “mercury crisis” of 1970 and the mid-1980s, there was a 70% decline in mercury in fish (Read et al. 2003). However, since the mid-1980s, mercury concentrations in fish have remained fairly constant. The concentration of PCB found in herring gull eggs declined by approximately 90% between the late 1970s and mid-1990s. However, there has been no significant change since then (Weseloh 2003).
The Detroit River has lost 96–97% of its coastal wetland habitats to development. The watershed continues to experience incremental habitat loss. However, some progress is being made in preserving critical habitats (e.g., Humbug Marsh, Peche Island, Mud Island, Calf Island, Stoney Island). In addition, 20 soft engineering projects have been implemented to rehabilitate habitat (Detroit River International Wildlife Refuge 2004).
As a result of 30 years of pollution control efforts, there are several promising signs of improvement within the biological community. For example, lake sturgeon reproduction has recently been documented in the Detroit River, and sturgeon spawning habitat has been constructed at three Detroit River locations (U.S. Geological Survey Great Lakes Science Center 2004). Previously, sturgeon reproduction had not been observed in the Detroit River for several decades. In addition, bald eagles are now successfully reproducing at four locations along the shores of the Detroit River. For many years, bald eagles had not successfully reproduced in this region because of organochlorine contamination.
Both research and monitoring have documented substantial improvements in the Detroit River and western Lake Erie over the past 30 years. However, our collective ability to track changes in trends and understand how this ecosystem functions has decreased.
Pollution control efforts have led to signs of improvement in biological communities.

12
Cuts in monitoring and research programs have increased the uncertainty associated with management actions and slowed progress. In response to the reductions in monitoring and research, the State of the Strait Conference Steering Committee chose “Monitoring for Sound Management” as the theme for the 2004 conference.

13
3. KEYNOTE ADDRESS
MONITORING FOR SOUND MANAGEMENT
Monitoring environmental quality along the Detroit River watercourse and vicinity is essential to determine status and trends in water and habitat quality. In addition, monitoring is just as important for assessing the ecological health of fish and wildlife and the smaller biota in the food web that supports them.
Purpose
The importance of monitoring is recognized in Annex 11 (Surveillance and Monitoring) of the Great Lakes Water Quality Agreement. In a plan developed in 1975, the U.S. and Canada agreed to a joint, coordinated monitoring program called the Great Lakes International Surveillance Plan. The initiative was revised in 1980 and again in 1986, but despite the extensive planning process, budget constraints have meant that very little of the Plan has actually been implemented. Yet the purposes for monitoring outlined in the plan are still relevant today for the Detroit River and elsewhere in the Great Lakes. The elements of the Plan as stated in Annex 11 are:
• Compliance – To assess the degree to which jurisdictional pollution control programs are being met
• Achievement of goals and objectives – To determine whether there is a need for more stringent pollution control requirements and other programs to restore the chemical, physical, and biological integrity of the Great Lakes Basin Ecosystem
• Evaluation of water quality trends – To assess the effectiveness of remedial and preventative measures, assess enforcement and management strategies, and identify the need for further research and technology development
• Annex 2 programs – To provide monitoring support for Remedial Action Plans for the Areas of Concern (including the Detroit River) and Lakewide Management Plans
Challenges
In spite of widespread recognition of its importance, monitoring remains a perplexing issue. There seems to be a large quantity of data collected annually, but there are often questions asked about the quality and availability of the data. Moreover, questions sometimes arise as to whether the right kinds of data are being collected to report to policy-
Dr. John E. Gannon is a Senior Scientist in the Great Lakes Regional Office of the International Joint Commission and serves as Secretary to the Great Lakes Water Quality Board. He has a wide range of experience in academic, research, and government sectors, and was a key leader in development of the Great Lakes International Surveillance Plan during the 1980s. His keynote address shared insights on monitoring for sound management that set the stage for the technical presentations and practical discussions that followed.

14
makers and the public. The data are meant to indicate whether expensive pollution abatement programs and remedial measures are producing the anticipated ecosystem improvements. However, more and more, citizens are asking:
• Are the fish safe to eat?
• Is it safe to swim in the water?
• Is the water safe to drink?
To further add to the monitoring dilemma, agencies that have monitoring responsibilities struggle to balance the costs of sufficient monitoring against other competing priorities. Some scientists are reluctant to participate in monitoring activities because they get less professional recognition for their involvement in routine monitoring than if they participate in new research and development projects. Existing monitoring programs are often criticized for being “data-rich and information-poor” because disproportionately more time is spent planning and collecting data than evaluating and reporting on those data.
Status of Monitoring in the Detroit River
Although Detroit River monitoring programs currently are not sufficiently coordinated or comprehensive, the good news is that observations of status and trends for certain environmental and natural resource conditions are available and have been reported at previous State of the Strait and other binational Detroit River conferences, in the recently published book, Honoring Our Detroit River: Caring for Our Home (Hartig 2003), and at biennial State of the Great Lakes Ecosystem (SOLEC) conferences.
The status and trends information reported most often represent measurements taken as part of traditional water chemistry monitoring programs (e.g., concentrations of phosphorus, heavy metals, and organochlorine contaminants). In addition, it is encouraging that information from biomonitoring programs is being reported with increasing frequency. Biomonitoring includes assessing the diversity and condition of fish and invertebrates (e.g., insects and worms) in river water and bottom sediments; frogs and toads in wetlands; and hawks, eagles, colonial birds, and waterfowl that use the Detroit River watercourse for nesting and as a migratory stop-over for resting and feeding.
Most encouragingly, there is a rapidly growing “citizen science” movement in the Detroit River vicinity and elsewhere in the Great Lakes, whereby student and adult volunteers participate in environmental and natural resource monitoring activities through schools, regional watershed councils, and other organizations. Citizens are now contributing meaningful and important monitoring data on water quality, biota, and habitat that complements and supplements jurisdictional monitoring programs on both the U.S. and Canadian sides of the Detroit River. Moreover, participation in such volunteer monitoring programs allows citizens to learn about environmental science, gain a greater appreciation of their regional environment and natural resources, and take an active role in environmental stewardship and the state of their own environment.
More and more, citizens are asking:
• Are the fish safe to eat?
• Is it safe to swim in the water?
• Is the water safe to drink?

15
Opportunities
There is a window of opportunity right now to improve monitoring of the Detroit River watercourse! The International Joint Commission issued its 12th Biennial Report on Great Lakes Water Quality in September 2004 that triggers review by the U.S. and Canadian governments of the operation and effectiveness of the Great Lakes Water Quality Agreement in 2005–2006. This is an opportunity to review Annex 11 and reach consensus on a revised Great Lakes International Surveillance Plan or its successor that would be coordinated bilaterally, comprehensively, and cost-effectively for the Detroit River and elsewhere in the Great Lakes.
Furthermore, both the U.S. and the Canadian governments have recently called for renewed program efforts to be undertaken on the Great Lakes. In the U.S., an Executive Order was signed in May 2004 creating a Great Lakes Interagency Task Force to improve coordination of programs to protect the environment and economy of the Great Lakes and surrounding communities (http://www.whitehouse.gov/news/releases/2004/05/20040518-3.html). In Canada, the Throne Speech by the Canadian Governor General in October 2004 called for renewal of the Canadian Great Lakes Program in order to build environmentally sustainable communities, and work with the International Joint Commission to protect and preserve the internationally shared Great Lakes and St. Lawrence River ecosystems (http://pm.gc.ca/eng/sft-ddt.asp).
Canadian and U.S. citizens in the Detroit River region can greatly assist by holding their governments accountable to their promises. The public also can take an active role in their communities by participating in volunteer monitoring programs and assuring that resource managers and policymakers are using jurisdictional and volunteer monitoring data in making sound decisions to improve the environmental quality of the Detroit River ecosystem.
The views expressed in this address are those of the author and not necessarily those of the International Joint Commission.

16
4. SESSION SUMMARIES
4.1. Traditional Monitoring
Cities and counties that utilize the Detroit River as a discharge location have monitoring requirements as part of their discharge permits. This is true for wastewater treatment plant (WWTP) facilities, for combined sewer overflow (CSO) facilities, and for stormwater discharges. The State of the Strait session on traditional monitoring profiled four studies covering several aspects of the monitoring required as part of regulatory reporting and scientific analyses, such as modeling.
The Detroit Water and Sewerage Department (DWSD) was required to develop a long term CSO control plan in 1996 that would result in the elimination or adequate treatment of CSO discharges (Salim et al., Section 6.1). Under a demonstrative approach, the DWSD has established four CSO pilot facilities—three on the Detroit River and one on the Rouge River. The DWSD study area extends from Windmill Pointe in Grosse Pointe Park, chosen to represent conditions upstream of the influence of DWSD CSO discharges, to the confluence with the Rouge River.
The DWSD CSO monitoring objectives focused on four issues: 1) the presence and extent of dissolved oxygen (DO) levels; 2) the extent of aesthetic and other use impairments; 3) the ecological impacts of untreated and treated CSO discharges; and 4) the extent of CSO discharge plumes.
Dissolved oxygen depression was evaluated with four continuous water quality monitors installed along the Detroit River shoreline from 2000 to 2004. Results show that the DO levels drop after a CSO discharge, but not below the water quality standard of 7.0 mg/L as set by the State.
The aesthetic and other use impairments survey results showed that the Detroit River was found to be clear and colorless, and generally had no
odor during the surveys performed during dry weather or following major rain events. However, bacteria concentrations higher than total body contact standards were found during some of the surveys within two days after major rain events.
Potential ecological impacts of Detroit CSO discharges were evaluated through benthic macroinvertebrate surveys that included the collection of samples at eight locations along the Detroit River shoreline and seven locations further offshore. A direct impact from CSO discharges was not consistently observed at the near shore stations. However, there was an observable decrease in the number and quality of organisms from the head of the Detroit River (Windmill Pointe) to the near shore stations in the urban area downtown.
The extent of the DWSD CSO discharge plume was evaluated during both wet weather and dry weather through fluorescent dye tracers. The plume tracking surveys indicated that the CSO discharges remained within 152 m (500 feet) of the shoreline and impacted
Monitoring the Detroit River.

17
20% or less of the total Detroit River channel. This is significant since there is a City of Detroit water intake on the opposite shoreline about 1,067 m (3,500 feet) downstream of a major CSO outfall.
Across the river, the City of Windsor does extensive monitoring in support of their two WWTPs that discharge into the Detroit River (Drca, Section 6.2). The City has been monitoring conventional pollutants and heavy metal concentrations discharged from the treatment facilities since 1970. The presentation described the monitoring being conducted in the City’s eight programs:
1. Pollution control plant constituent monitoring
2. Industrial waste control
3. Watershed monitoring
4. License clearance program
5. Emergency response
6. Laboratory analysis
7. Flow monitoring
8. Municipal landfill monitoring
Wayne County Department of Environment presented a discussion of the water quality of the Rouge River, a major tributary to the Detroit River (Hughes et al., Section 6.3). The Rouge Project was started in 1992 and includes continuous monitoring of DO, temperature, stream flow and rainfall. Data have been collected at 15-minute intervals at stations throughout the watershed. The presentation covered trends from ten years of recorded data. The number of samples ranged from 23,402 to more than 146,800, allowing strong trend analyses.
Trend analyses demonstrated that DO concentrations are improving during both wet and dry weather conditions. Eight of the nine long term (ten years) locations show a statistically significant improving trend for mean DO, with the average annual improvement ranging from 0.09 to 0.53 mg/L per year. The water quality at seven of the nine locations met state standards more than 95% of the time.
The E. coli trend analysis showed improvement downstream of most watershed management projects. The analysis also identified locations where E. coli is still a problem during wet weather conditions. This will assist in planning future watershed management activities.
Considerable volumes of data have been collected to demonstrate efficient wastewater and CSO treatment and the impacts of watershed management activities. However, comprehensive ecosystem status and health cannot be determined with monitoring data especially given current budget constraints. Therefore, computer models become necessary tools to help analyze the interactions between water quality parameters or between the media (water–air–sediments). The data required to properly calibrate and verify a computer model are extensive.

18
A management model for the Detroit River was developed and partially calibrated during 1999 to 2002 (Drouillard, Section 6.4). Management models have the potential to identify scientifically defensible linkages among key systems or processes. However, the data requirements of such models are extensive and require the coordinated refinement of existing sampling strategies of existing monitoring programs.
The Detroit River Modeling and Management Framework (DRMMF) was developed to include hydraulic, sediment, and food web bioaccumulation models that evaluate linkages between water quality, sediment quality and sport fish consumption. Future coordination of monitoring programs to satisfy DRMMF data needs will be required to ensure that:
• Managers, monitoring agencies, and modelers are made fully aware of the types of data being collected
• Modelers have an opportunity to influence sampling designs to optimize model requirements and minimize duplication of efforts
• Reviews of existing monitoring data are conducted in a timely manner to identify data gaps
• Data are collected with appropriate quality assurance/quality control
In summary, traditional monitoring programs have been around for decades. Although they are used primarily to demonstrate treatment efficiencies, the data are valuable as inputs into models and can potentially help us assess overall ecosystem health. A coordinated effort is required to inform all interested parties of the monitoring programs currently in operation. The 2004 State of the Strait Conference was just an initial step in the information process.
Traditional monitoring is both required (regulations) and necessary (analyses). Unfortunately, both regulations and analyses are very site specific. Therefore, few of the
many U.S. and Canadian communities that collect data to meet their regulatory requirements make these data available to others via some type of clearinghouse. Similarly, the data collected from studies conducted throughout the Detroit River watersheds are often unavailable.
Many organizations within the Detroit River watershed would be interested in the variety of monitoring information being collected. One or more of the many organizations should step forward and accept the role of
region wide data management and dissemination. This would provide a single source of information on water quality monitoring for everyone.
One or more organizations should step forward and accept the responsibility of region wide data management and dissemination.
A coordinated effort will be required to inform all parties of current monitoring programs.

19
4.2. Biomonitoring
Biological monitoring, or biomonitoring, is the use of biological information to assess the status of the environment as it may be affected by anthropogenic activity. Biomonitoring is a proven assessment tool that is receiving increased use in monitoring programs of all types.
The Biomonitoring Session of the State of the Strait Conference profiled four biological monitoring programs with relatively long-term data sets. Fishery assessments have occurred in the Detroit River since 1956 (Johnson et al. 2004, Section 6.5). Both the Ontario Ministry of Natural Resources and Michigan Department of Natural Resources have used electrofishing surveys, trap netting and seining surveys, and creel surveys to perform fish community assessments. Community assessments have relied heavily on electrofishing surveys (1989, 2003, 2004), with more limited trap netting and seining surveys occurring in the lower Detroit River in the early 1980s (Grosse Ile, Grassy Island, Belle Isle) and mid-1990s (Humbug Marsh). Across all surveys, 50 species of fish, including four species of special concern, have been captured. Emerald and spottail shiners were numerically abundant in all surveys (each species representing >11% of the total catch each year), while in recent years yellow perch (22% in 2003) replaced alewife
(39% in 1989) as the single most numerically abundant species across surveys. Angler creel programs have been run by Ontario Ministry of Natural Resources (1959–1960; 1974–1080; 1992; 2002) and Michigan Department of Natural Resources (1983–1985; 2000–2004) at varying seasonal and spatial intensity. Overall angler effort was highest during the 1980s (~150,000 rod hours per year), but declined to about 70,000 hours per year after 1990. Walleye are by far the most sought-after species by anglers in the Detroit River (78–93% of targeted effort between 2000 and 2003). In 2003, catch rates (i.e., catch per unit effort) for walleye in the Detroit River (0.85 fish per hour) were higher than those reported for western Lake Erie (0.55 fish per hour), the St. Clair River (0.41 fish per hour), or Lake St. Clair (0.32 fish per hour).
Priority must be given to standardizing methods employed across years and between jurisdictions to ensure that resource managers have sound information to support decision-making. Due to the importance of the fishery of the Detroit River and western Lake Erie, the intensity of fishing effort, and the economic value of both sport and commercial fishing, greater priority should be given to fishery monitoring in the corridor.
Further, agencies should consider making monitoring explicit in their budget process.
Hawk migration monitoring by Southeastern Michigan Raptor Research and Holiday Beach Migration Observatory provides insight into environmental health on a continental scale. Under the direction of Southeastern Michigan Raptor Research, hawk watch monitoring has been underway since 1983 (Cypher, Section 6.6).
The count season of Southeastern Michigan Raptor Research begins on September 1 and concludes on November 30 each year. A professional counter, along with volunteers, staffs the count site every day during daylight hours. All data are entered into the Hawk Migration Association of North America’s Raptors Online database at www.hawkcount.
Detroit River fish habitat associations survey (Photo courtesy of Nicolas Lapointe).

20
org. In addition, the data are posted on the website of Southeastern Michigan Raptor Research at www.smrr.net.
Since 1983, more than three million birds representing 23 species have been recorded. This 12-year database shows significant increases in peregrine falcons, osprey, bald eagles, and turkey vultures. In addition, the database shows a general upward trend in red-shouldered hawks, although recruitment is very poor for this species. More research needs to be performed to identify why recruitment of this species has been poor. Other needed improvements include expansion of banding programs, more funding for paid staff, and expanded public outreach.
Aerial canvasback surveys have been performed on Lake St. Clair, the Detroit River, and western Lake Erie since 1974 (Robison, Section 6.7). Michigan Department of Natural Resources has worked with U.S. Fish and Wildlife Service and the Canadian Wildlife Service to estimate numbers of canvasbacks on major staging areas prior to arrival of most birds on the wintering grounds.
Canvasback surveys are conducted using one observer (plus a pilot) from a fixed-wing aircraft, flying 160–200 km/h at 45–60 m altitude. Observers record all canvasbacks roosting, feeding, or flushing from water bodies. Surveys are usually conducted between November 3 and 10. Based on these and other surveys, the Upper Mississippi River (mostly pools 7–9), Lake St. Clair, Detroit River, and Long Point, Ontario remain the major staging areas for canvasbacks in early November. For the second consecutive year, most of the canvasbacks on Lake St. Clair were seen on the Canadian side. Both the Michigan side of Lake St. Clair and Long Point, Ontario had near record or record low counts of canvasbacks. The May Breeding Population Survey indicated 558,000 canvasbacks in 2003, 15% above the 2002 estimate and one percent below the long-term (1955–2002) average. Canvasback surveys provide critical life-cycle information from staging and wintering areas, and must be continued to support continental management of canvasback populations.
The bald eagle is an endangered species and a key indicator of aquatic ecosystem health. Bald eagle monitoring is performed by Bird Studies Canada, in cooperation with U.S. Fish and Wildlife Service and Ontario Ministry of Natural Resources. Long-term monitoring has shown that bald eagles were almost extirpated by the 1980s (Laing and Badzinski, Section 6.8). Both the number of nests and nesting successes have increased dramatically during the last two decades, particularly on the Canadian side. While this reproductive success is encouraging, there still remains concern for the viability and long-term stability of the population in this region.
Bird Studies Canada is now partnering with the Ontario Ministry of Natural Resources and Canadian Wildlife Service on a new program called Destination Eagle to determine where juvenile eagles are becoming exposed to certain heavy metals. Satellite telemetry is being used to track eagle movements in support of better management. Such bald eagle monitoring must be continued to track this endangered species and to support both wildlife and contaminant programs. Canadian and U.S. efforts could be better coordinated through collaboration on bald eagle indicator reporting and outreach activities.
This Biomonitoring Session provided excellent examples of long-term monitoring programs that could help further comprehensive, ecosystem-based management. The

21
data from these programs should be made more accessible. Findings from these programs should be communicated more widely, including translation and interpretation for policy-makers. Priority must be given to ensuring the continuity and consistency of these programs. The efforts of nonprofit organizations (e.g., Southeastern Michigan Raptor Research) to build the capacity for long-term monitoring should be encouraged. For
example, Steinman and Ogdahl (2004) have documented the value and benefit of the Muskegon Research Fund—a creative mechanism to secure funding for monitoring to raise community awareness and accelerate necessary cleanup. However, governments must undertake some programs, and long-term support for monitoring should be explicitly identified as a need in the governmental budget process.
4.3. Volunteer Monitoring
Volunteer monitoring, or “citizen science,” allows members of the public to become involved with efforts to improve the natural environment around them. It can range from counting birds, to taking and analysing water quality samples, to identifying amphibians by their calls. It provides a variety of benefits to those who take part by allowing people to participate in assessing the success of restoration efforts, and helps focus energy and desire on improving the environment. It can also provide valuable experience for young people and allow retired individuals to continue to put their professional skills to work. The most effective use of volunteer monitoring also provides benefits to environmental and natural resource managers. Frequently, cutbacks limit the amount of professional monitoring that can be undertaken by governments. However, if steps are taken to ensure quality control, volunteer monitoring can aid in assessing the effectiveness of restoration efforts. In some programs, quality control may be difficult to verify, but because so many individuals take part, the data are valuable and reliable.
The volunteer monitoring programs highlighted at the 2004 State of the Strait Conference covered the spectrum of volunteer monitoring opportunities associated with the Detroit River. The Christmas Bird Count and Project Feederwatch programs were outlined by a representative of Parks Canada. The Christmas Bird Count is the oldest volunteer monitoring effort in the world. It takes place on both sides of the Detroit River and throughout North America. The Friends of the Rouge presented details of their volunteer frog and toad survey, which for several years has used volunteers to gather amphibian population data from local sites. The Stream Team spoke about their history of working with high school students to teach science with real-world applications, while raising student awareness of environmental issues. Finally, Bird Studies Canada discussed their Marsh Monitoring Program, which recruits and trains volunteers to gather bird and amphibian population data in order to monitor the ecological integrity of Great Lakes wetlands, including those in the Detroit River. In addition, all conference registrants were provided with an outline of volunteer monitoring opportunities in the Detroit River watershed. This was intended to inform members of the public about the many opportunities to put their enthusiasm for the Detroit River into action, while providing professionals with information that they can make available to their colleagues or contacts.
The Christmas Bird Count began more than one hundred years ago. Each year, approximately 50,000 volunteers in North America and abroad count more than 63
Findings from these biomonitoring programs should be communicated more widely, including translation for policy-makers.

22
million birds during a 24-hour period. The project is coordinated by the Audubon Society, and implemented locally by organizations such as Point Pelee National Park
and the Ojibway Nature Centre. Another major bird count effort is Project Feederwatch, which is much younger than the Christmas Bird Count, but still includes approximately 15,000 participants who count and identify the birds that visit feeders at their homes, nature centres, schools, and institutions. The volunteers’ data are collected by Cornell University, Bird Studies Canada, the National Audubon Society, and the Canadian Nature Federation, who use this information to detect long-term trends in bird population health (Rupert, Section 6.9).
As the name implies, the focus of the Friends of the Rouge (FOTR) is the Rouge River, a tributary of the Detroit River. Both the Detroit and Rouge Rivers have been designated “Areas of Concern” (AOC) by the International Joint Commission, and this provides the Detroit River with the dubious distinction of being the only AOC with another AOC as its tributary. The FOTR has coordinated watershed-based amphibian monitoring programs since 1998. Volunteers are provided with training, and then they monitor local wetland areas for frogs and toads by sound. These efforts have allowed FOTR to collect species diversity data, which can then be provided to local environmental management officials. This effort also creates an interested and educated populace that can encourage their government representatives to take steps to protect and restore this watershed (Petrella, Section 6.10).
For ten years the Stream Team has brought together more than 50 school and community organizations to undertake environmental monitoring and ecological restoration in the Detroit River’s downriver watershed. Their efforts have included extensive scientific testing (the results of which have been accepted as scientifically sound) and have been successful in bringing several serious environmental concerns to
the attention of management officials. The Stream Team recently worked out an agreement with the Michigan Department of Environmental Quality to use Stream Team-collected data on an ongoing basis as part of the State’s downriver management strategy. The Stream Team has also harnessed their volunteer force to implement biological control of purple loosestrife, stream bank stabilization, tree plantings, and litter clean-ups (Szczechowski and Nasarzewski, Section 6.11).
The focus of the Marsh Monitoring program is to conduct surveys of wetlands in Areas of Concern within the Great Lakes region, including Detroit River wetlands. Volunteers receive extensive training, and then monitor the annual abundance of marsh-dependent bird and amphibian species in designated areas. This Bird Studies Canada-coordinated program has been in place since 1995. It supports government efforts to assess ecological integrity in the Great Lakes basin and detect any trends early. The program also seeks to compare AOC with non-AOC marshes and investigate species-habitat associations. The results are used and distributed by government agencies, primarily Environment Canada and the U.S. Environmental Protection Agency, as part of AOC Remedial Action Plan implementation efforts (Crewe and Timmermans, Section 6.12).
The volunteer monitoring programs presented at the conference are only
Volunteer monitoring, or “citizen science,” allows members of the public to become involved with efforts to improve the natural environment around them.
Monroe Christmas Bird Count poster at the 2004 SOS conference (Photo courtesy of A. J. Kirkpatrick).

23
a few of many “citizen science” opportunities available to members of the public who are interested in improving the health of the Detroit River and its watershed. However, several actions are required in order to more fully and effectively utilize this resource. First, government and agency representatives must begin to consider how they can make fuller use of public monitoring efforts. For example, lay people can easily learn methods of benthic sampling that can lead to a more comprehensive understanding of the health of the Detroit River’s benthic community. Secondly, organizations that undertake volunteer monitoring must ensure that their results are as accurate and as scientifically defensible as possible. In some cases, this may mean retaining an expert
to design the sampling program and to develop quality control measures. In other cases, it may mean that government agencies and volunteer monitoring coordinators should work more closely together to ensure that each are meeting the needs of the other. Finally, information about volunteer monitoring opportunities must be made more readily available to the public. This began at the conference, where a list of volunteer opportunities was distributed. However, this list is incomplete, and there are no plans to maintain it on an ongoing basis. There should be a central location, or perhaps one location on each side of the border, where members of the public who are interested in Detroit River volunteer opportunities can access information. This information should be shared among all organizations working on the Detroit River so that volunteers can be steered to a centralized location
with complete, accurate volunteer information. With a little effort, the public’s energy and desire to contribute can be harnessed to the greatest extent possible to support the effort to restore the Detroit River and its watershed to their natural states.
Stream Team monitoring benthic invertebrates (Szczechowski and Nasarzewski, Section 6.11).

24
5. KEY FINDINGS AND CONCLUDING REMARKS
Monitoring gives decision-makers the necessary understanding of environmental conditions and processes needed for management. Monitoring data are absolutely essential for implementing the scientifically defensible management being called for by all agencies and stakeholder groups. The success of the Great Lakes phosphorus control program in the 1970s and 1980s was in part due to a comprehensive, binational, monitoring program.
Routine reporting of the data from monitoring and research programs results in better management. Experience has shown that monitoring and research can help:
• Focus management efforts
• Set priorities
• Catalyze management actions
• Save money
Government, businesses, and citizen groups are calling for relevant, accurate, and timely monitoring data to inform their
decision-making. State of the Strait Conference participants noted that today monitoring is given a much lower priority than in the 1970s and 1980s. Monitoring must be given a higher priority if we wish to effectively manage the Detroit River and western Lake
Erie. Indeed, the U.S. Government Accountability Office (2004) reported that current monitoring does not provide the comprehensive information needed to assess overall conditions in the Great Lakes Basin because the required coordinated joint U.S.-Canadian monitoring program has not been fully developed.
Increasingly, stakeholders are asking for current information on indicators of ecosystem health, performance, and function. They are asking about the ecological significance of remedial and preventive management actions. Stakeholders are asking:
• We have protected “so many” acres of coastal wetlands, but what does that mean?
• We have reduced mercury loadings, but how much further do we have to go to eliminate health advisories on fish and ensure safe human consumption of fish?
More and more stakeholders are asking whether ecosystem health, performance, and function are improving. For example, key questions being asked include:
• Has fish or wildlife community health improved?
• Have we identified measurable targets for achievement of adequate ecosystem health, performance, and function? How much further do we have to go?
Government, businesses, and citizen groups are calling for monitoring data to inform their decision-making.

25
To be able to measure progress, future monitoring programs must evaluate ecological conditions against quantitative ecosystem targets. Evaluating progress toward restoring impaired beneficial uses should be a priority.
Management actions taken on the Detroit River and western Lake Erie should be treated like experiments in which:
• Monitoring documents describe conditions prior to intervention
• Predictions and hypotheses are made
• Outcomes and effectiveness of the actions are measured
Volunteer monitoring programs offer a wealth of valuable data and information that can supplement traditional monitoring activities. Good examples of “citizen science” discussed at the conference included:
• Christmas bird count programs (e.g., those in Point Pelee National Park of Canada; Ojibway Nature Centre; Rockwood, Michigan; Monroe, Michigan; Upper Detroit River, Michigan; and others listed at www.audubon.org/bird/cbc/index.htm)
• Hawk watch programs like the Holiday Beach Festival of Hawks (www.hbmo.org) and the HawkFest at Lake Erie Metro Park (www.smrr.org)
• Frog and toad surveys like those undertaken by Friends of the Rouge (www.therouge.org) and the Stream Team
Volunteer monitoring programs are under-appreciated and under-utilized. Greater emphasis must be placed on ensuring that volunteer monitoring data have sufficient quality controls, that management agencies sanction these efforts and agree to use the data for management purposes, and that the data are actually used and broadly disseminated. The partnership announced at the conference between the Stream Team and Wayne County Department of Environment is a good example of effective use of volunteer monitoring data. We congratulate the Stream Team and Wayne County Department of Environment for their leadership and example.
Conference recommendations
• A single central directory of past and present monitoring data and programs is needed to permit managers, researchers, and the public to find the key information necessary to understand the historical and current state of the Detroit River and western Lake Erie.
• All agencies and organizations must coordinate their monitoring efforts. There is a need to better coordinate monitoring for the corridor and sustain a central repository for databases supportive of ecosystem modeling, research, and management. Good examples include: Data Retrieval, Exchange, Archival, and
Greater emphasis must be placed on ensuring that volunteer monitoring data have sufficient quality controls, that management agencies sanction these efforts and agree to use the data for management purposes, and that the data are actually used and broadly disseminated.
High school students representing volunteer programs at the 2004 SOS conference(Photo courtesy of A.J. Kirkpatrick)

26
Management System (DREAMS), Monitoring Upper Great Lakes Connecting Channels Committee (MUGLCCC), and the Rouge River National Wet Weather Demonstration Project. The virtual map project that began at the SOS conference can become a valuable tool to direct stakeholders to data sets that can give answers to important research and management questions. Indeed, the U.S. Government
Accountability Office (2004), has recommended that adequate controls for an inventory of monitoring be developed to ensure that monitoring data are accurate, current, and complete to facilitate “user” efforts to coordinate monitoring activities. The Hamilton Harbour Remedial Action Plan Office (2004) has developed a useful “Monitoring Catalogue” to identify existing monitoring activities and gaps for key decision-makers.
• A higher priority must be given to strengthening the science- management linkage. More effort must be expended on integrating
recent scientific knowledge with management for the Detroit River and western Lake Erie. Frequently, there appears to be little connection between rehabilitation/conservation techniques and management objectives and the scientific method. This linkage can be strengthened by:
– Identifying quantitative objectives and targets to help managers evaluate and select the most appropriate rehabilitation and conservation techniques
– Increasing cooperative monitoring and research efforts to quantify problems, establish cause-and-effect relationships, and determine effectiveness relative to ecosystem health, performance, and function
– Committing resources to follow-up assessment of the effectiveness of remediation/restoration projects
• Greater emphasis must be placed on ensuring timely reporting of data in a clear and understandable fashion. Monitoring data must be made more accessible. The data must be summarized and objectively interpreted in ways that are meaningful to non-experts and informative to decision-makers. These findings must be broadly communicated. Perhaps an electronic, binational indicator report should be prepared and routinely updated to improve accessibility, translation, and communication. This could be the focus of the next State of the Strait Conference.
The State of the Strait Conference continues to be an effective tool for synthesizing and communicating such knowledge, and transferring lessons learned and practical experiences from data collectors to information users.
Monitoring data must be made more accessible. The data must be summarized and objectively interpreted in ways that are meaningful to non-experts and informative to decision-makers.

27
References
Detroit River International Wildlife Refuge. (2004). Soft Engineering Demonstration Projects along the Detroit River, <http://midwest.fws.gov/detroitriver/ahr/softeng.htm>.
Environmental Integrity Project. (2004). Flying Blind: Water Quality Monitoring and Assessment in the Great Lakes States, <www.environmentalintegrity.org/pubs/Report_-__Flying_Blind.pdf>.
Hamilton Harbour Remedial Action Plan Office. (2004). Monitoring Catalogue, Canada Centre for Inland Waters, Burlington, Ontario.
International Joint Commission. (2004). Twelfth Biennial Report on Great Lakes Water Quality, International Joint Commission, Windsor, Ontario.
Leach, J.H. (1993). “Impacts of Zebra Mussel (Dreissena) on Water Quality and Fish Spawning Reefs in Western Lake Erie.” Zebra Mussels: Biology, Impact, and Control, T.F. Nelepa and D.W. Schloesser, eds., Lewis Publishers, Ann Arbor, Michigan, 381-397.
Panek, J., D.M. Dolan and J.H. Hartig. (2003). “Detroit’s Role in Reversing Cultural Eutrophication of Lake Erie.” Honoring Our Detroit River: Caring for Our Home, J.H, Hartig, ed., Cranbrook Institute for Science, Bloomfield Hills, Michigan, 79-90.
Read, J., D. Haffner, and P. Murray. (2003). “Mercury and PCB Contamination of the Detroit River.” Honoring Our Detroit River: Caring for Our Home, J.H. Hartig, ed., Cranbrook Institute for Science, Bloomfield Hills, Michigan, 51-106.
Steinman, A. D. and M. Ogdahl. (2004). “An Innovative Funding Mechanism for the Muskegan Lake AOC.” Journal of Great Lakes Research, 30(2), 341-343.
U.S. Geological Survey–Great Lakes Science Center. (2004). “Restoration of Lake Sturgeon in the Detroit River,” <http://www.glsc.usgs.gov/_files/research/SturgeonDetroitRiverRestorationPoster.pdf>.
U.S. Government Accounting Office. (2004). Organizational Leadership and Restoration Goals Need to Be Better Defined for Monitoring Restoration Process. GAO-04-1024, Washington, D.C.
Weseloh, D.V.C. (2003). “Spatial and Temporal Trends of PCBs in Herring Gull Eggs from Western Lake Erie-Detroit River-Southern Lake Huron Corridor, 1974-2001.” Evaluating Ecosystem Results of PCB Control Measures within the Detroit River-western Lake Erie Basin, T.M. Heidtke, J. Hartig and B. Yu, eds., Environmental Protection Agency (EPA-905-R-03-001), Chicago, Illinois, 99-103.

28
6. SESSION ABSTRACTS
MAP OF PROJECT LOCATIONS
General locations of monitoring projects described in the following abstracts are shown in the map above. (Locations from poster abstracts not shown.)

29
6.1. UTILIZATION OF WATER QUALITY MONITORING DATA TO SUPPORT THE CITY OF DETROIT’S LONG TERM COMBINED SEWER OVERFLOW CONTROL PLAN
Imad Salim, Wade Trim Associates, Detroit, MichiganMirza Rabbaig, Detroit Water and Sewerage Department, Detroit, MichiganTony Igwe, Wade Trim Associates, Pittsburgh, PennsylvaniaJulie Aichler, CDM, Detroit, Michigan
Introduction
The City of Detroit was required to develop a Combined Sewer Overflow (CSO) control plan to eliminate or adequately treat CSO discharges. This was done in response to the National Pollution Discharge Elimination System (NPDES) Permit issued to the Detroit Water and Sewerage Department (DWSD) by the Michigan Department of Environmental Quality (MDEQ). DWSD developed a Long Term CSO Control Plan in July 1996, which recommended using water quality monitoring data from both the Rouge and Detroit Rivers to support a demonstrative approach in developing their final Long Term CSO Control Plan. The demonstrative approach uses both receiving water quality data and treatment performance data from pilot CSO control facilities to predict the level of control required to meet water quality objectives. Therefore, four CSO pilot facilities and a water quality monitoring program of the Detroit and Rouge Rivers were recommended. Information from these four pilot facilities, three existing DWSD demonstration CSO basins (located at the upper portion of the Rouge River), and other CSO control facilities in southeast Michigan will be used to develop the final CSO control plan due in December 2008.
Figure 1. Water Quality Monitoring Study Area.

30
Figure 1 illustrates the extent of the study area, locations of the CSO control pilot facilities within the study area, and the remaining uncontrolled outfalls. The Detroit River study area extends from Windmill Pointe in Grosse Pointe Park and was chosen to represent conditions in the Detroit River upstream of potential influence of DWSD CSOs to the confluence with the Rouge River. The Rouge River study area extends from Dix Avenue to the confluence with the Detroit River. The entire study area includes four pilot CSO facilities, 36 uncontrolled CSO outfalls along the Detroit River, six uncontrolled CSO outfalls along the Rouge River, and water intakes for the cities of Detroit and Windsor.
This extended abstract focuses on the Detroit River data only. It explains the objectives of the water quality monitoring program, the level of effort involved, the parameters being monitored, and the sampling methodology/approach.
Objectives
Review of the existing water quality data for the 1996 Long Term CSO Control Plan identified high levels of bacteria and floatable materials as potential CSO impacts on the Detroit River. Dissolved Oxygen (DO) and potential oxygen demand from CSOs were key concerns of the MDEQ. Therefore, the DWSD monitoring objectives are to determine:
1. The presence and extent of DO levels that are below the cold water fisheries standard of 7 mg/L that can be attributed to upstream CSOs
2. The extent of aesthetic and other use impairments (recreational water contact, water supply, etc.) directly resulting from CSOs
3. The ecological impacts of untreated and treated CSO discharges on aquatic communities, especially benthic macroinvertebrates
4. The extent of the CSO discharge plumes
Methods and Results
The following is a summary of the monitoring and evaluation performed to address the Detroit River water quality monitoring objectives.
1. Dissolved Oxygen Depression
Four continuous water quality monitors were installed along the shoreline of the Detroit River from 2000–2004. At each monitor location (Figure 1), the depth, DO, pH, temperature, specific conductivity, and turbidity were continuously measured and recorded during the warmest months, when DO saturation is the lowest and there is greatest potential for DO levels to fall below the water quality standard.
The DO data collected by the continuous in-situ monitoring show that there can be temporary, localized DO impacts from CSOs, but they do not reduce DO to below the applicable water quality standard of 7 mg/L. Based on the travel time expected between the continuous monitoring stations (USACOE 1974), DO reductions are attributed to the low DO concentration in the CSOs themselves, not the DO demand of the discharges. In the example shown in Figure 2, the minimum DO levels at downstream

31
stations were observed to increase further from the CSO discharge. This did not indicate the exertion of significant oxygen demand from the CSOs.
2. Aesthetic and Other Use Impairments
Rule 50 of Michigan Water Quality Standards “restricts the presence of unnatural physical properties including turbidity, color, oil films, floating solids, foams, settleable solids, suspended solids, and deposits to the extent that they are or may become injurious to any designated use.” Shoreline surveys were performed in 1999 and 2000 to evaluate the appearance of the water body and any debris that may have been deposited along the shore, and to collect bacteria samples. Detroit River water was found to be clear and colorless, and generally had no odor during dry weather or following major rain events. The majority of locations had no debris or only natural debris. Foam and oil films were observed at a few locations during the several dry and wet weather expeditions, but sources could not be identified. Bacteria concentrations higher than the total body contact standards were found during some of the surveys conducted within two days after major rain events.
3. Ecological Impacts on Benthic Macroinvertebrates
The procedure for the benthic macroinvertebrate surveys included placement of multi-plate artificial substrate macroinvertebrate samplers at eight locations along the Detroit River shoreline and seven additional locations further offshore. This method was used because it was effective for sampling both areas of soft sediment and hard substrate. Divers deployed and retrieved the artificial substrate samplers. The continued inclusion of monitoring sites both near shore and offshore provides benthic data within areas influenced by CSO discharges and further offshore, outside the expected area of influence. Surveys have been performed in this manner from 2000 to the present.
No direct impact from uncontrolled CSO discharge on benthic macroinvertebrates was consistently observed at the near shore stations. However, there was an observable decrease in the number and quality of organisms from the head of the Detroit River (Windmill Pointe station) to the near shore stations in the urban area downstream. These surveys will continue after the pilot facilities are in operation to evaluate the ecological impacts, if any, of the treated CSO effluent.
Figure 2. Continuous DO data (June 2002) at four monitoring stations.

32
4. Extent of CSO Plume
CSO plume tracking provides off-shore information on river water quality during CSO discharges, and defines the extent of the CSO plume area. Wet weather or CSO plume tracking surveys were refined after a fluorescent dye-tracer study during dry weather. The CSO plumes were delineated by collecting data on eight key water quality parameters while the sonde was towed by a boat in and out of the visible plume. The sonde depth was kept constant at approximately 90 cm (3 ft) so that changes in the measured parameters could be observed. Precise position information was collected every second using a Global Positioning System (GPS) unit. The data collected were used to define the outer edge of the CSO plumes. The surveys also included collection of E. coli bacteria samples.
The plume tracking surveys and dye tracer study indicated that discharges originating at the largest CSO location remained within 150 m (500 ft) of the shoreline and impacted 20 percent or less of the total Detroit River channel width and approximate volume (Figure 3). This is a significant finding since there is a City of Detroit water intake located on the opposite shoreline about 1,070 m (3,500 ft) downstream of the monitored outfall. Vertical profile data was also collected in the dye plume study and during CSO plume tracking, and indicated that the plume was well mixed in the water column.
Investigations of total residual chlorine (TRC) levels downstream of the screening and disinfection facilities are planned following the startup of each facility.
Figure 3. CSO Estimated Plume Edge from Multiple Survey Data.

33
Conclusions
• The CSO plume affected up to 150 m (500 ft) of channel extending from the shoreline; 20 percent of Detroit River width.
• Dissolved oxygen levels in the Detroit River did not fall below the minimum water quality standard of 7 mg/L.
• Bacteria levels exceeded standards within the CSO plume.
• The Detroit River water was found to be clear and colorless and generally had no odor during the aesthetics surveys. Foam and oil films were observed at few locations during surveys, but sources could not be identified.
• No direct impact from uncontrolled CSO discharge on benthic community was consistently observed. However, there was an observable decrease in the number and quality of organisms from the head of the Detroit River to the urban area downstream.
• Water quality monitoring is planned to continue through 2006 to evaluate the impact of treated discharge from pilot CSO control facilities on the Detroit River. Information from the water quality monitoring will support the development of the City of Detroit final Long Term CSO Plan due in December 2008.
References
Aichler, Julie et al. (2004). “Receiving Water Quality Monitoring in Support of Long-Term CSO Control Plan.” Water Environment Federation Technical Exhibition and Conference 2004.
Detroit Water and Sewerage Department. (2001). Long Term CSO Control Plan Update for the Detroit and Rouge Rivers.
Detroit Water and Sewerage Department. (1996). Long Term CSO Control Plan for the Detroit and Rouge Rivers.
Michigan Department of Environmental Quality. (1994). Michigan Water Quality Standards, R 323.1062, R 323.1064.
Upper Great Lakes Connecting Channel Study Committee. (1988). Final Report of the Upper Great Lakes Connecting Channel Study.
U.S. Army Corps of Engineers-Detroit District. (1974). Detroit River Aerial Drogue Survey – Surface Velocities and Directions.

34
6.2. CITY OF WINDSOR POLLUTION CONTROL SERVICES MONITORING PLAN FOR POLLUTION CONTROL AND PREVENTION
Paul Drca, Environmental Support Services, City of Windsor, Windsor, Ontario
Pollution Control Branch Mission
The overall mission of the Pollution Control Branch is to enhance public health and welfare through the efficient, cost-effective conveyance of stormwater and wastewater, to treat wastewater, and to work with industry to protect the environment while sustaining competitiveness. This is accomplished by an organization dedicated to professionalism that anticipates and responds to the changing needs of the community.
Environmental Support Services Division Goals
The goals of the Environmental Support Services division in carrying out the Branch Mission are to:
• Maintain acceptable control of conventional and priority pollutants by ensuring compliance with federal and provincial pollution control legislation through continued monitoring of City pollution control plants (Figure 1 and Figure 2), industries, storms sewers, and sewage systems
• Achieve further reductions in the amounts of heavy metals and Canadian Environmental Protection Act (CEPA) toxic and Canada Ontario Agreement (COA) compounds being discharged from the City wastewater treatment plants and sewer outfalls to the lowest practicable level
• Demonstrate significant progress towards the virtual elimination of persistent toxic organic substances in the local environment by working with local industries in pollution prevention to sustain a healthy environment and maintain competitiveness as stated in Windsor’s Strategic Plan
• Maintain and monitor municipal collection systems and wastewater treatment plants in order to protect the infrastructure through strategic monitoring of industries and watersheds
• Monitor wastewater treatment plants in order to provide a safe environment for employees
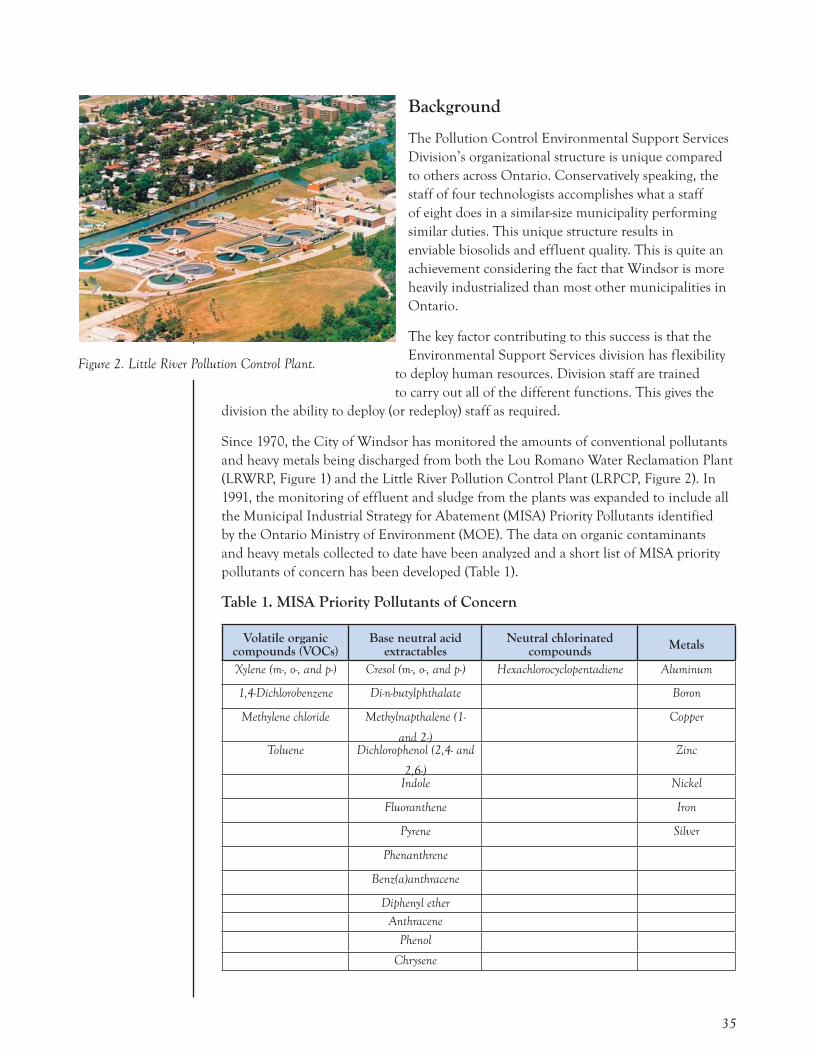
Figure 1. Lou Romano Water Reclamation Plant.
35
Background
The Pollution Control Environmental Support Services Division’s organizational structure is unique compared to others across Ontario. Conservatively speaking, the staff of four technologists accomplishes what a staff of eight does in a similar-size municipality performing similar duties. This unique structure results in enviable biosolids and effluent quality. This is quite an achievement considering the fact that Windsor is more heavily industrialized than most other municipalities in Ontario.
The key factor contributing to this success is that the Environmental Support Services division has flexibility
to deploy human resources. Division staff are trained to carry out all of the different functions. This gives the
division the ability to deploy (or redeploy) staff as required.
Since 1970, the City of Windsor has monitored the amounts of conventional pollutants and heavy metals being discharged from both the Lou Romano Water Reclamation Plant (LRWRP, Figure 1) and the Little River Pollution Control Plant (LRPCP, Figure 2). In 1991, the monitoring of effluent and sludge from the plants was expanded to include all the Municipal Industrial Strategy for Abatement (MISA) Priority Pollutants identified by the Ontario Ministry of Environment (MOE). The data on organic contaminants and heavy metals collected to date have been analyzed and a short list of MISA priority pollutants of concern has been developed (Table 1).
Table 1. MISA Priority Pollutants of Concern
Volatile organic compounds (VOCs)
Base neutral acid extractables
Neutral chlorinated compounds Metals
Xylene (m-, o-, and p-) Cresol (m-, o-, and p-) Hexachlorocyclopentadiene Aluminum
1,4-Dichlorobenzene Di-n-butylphthalate Boron
Methylene chloride Methylnapthalene (1-
and 2-)
Copper
Toluene Dichlorophenol (2,4- and
2,6-)
Zinc
Indole Nickel
Fluoranthene Iron
Pyrene Silver
Phenanthrene
Benz(a)anthracene
Diphenyl etherAnthracene
Phenol
Chrysene
Figure 2. Little River Pollution Control Plant.

36
Canadian Environmental Protection Act (CEPA) Toxic List
A list of 68 substances were targeted for elimination from the environment by the CEPA. Of particular interest to Pollution Control Services are: lead, mercury, benzene, chlorinated wastewater effluent, hexachlorobenzene, inorganic fluorides, inorganic nickel, tetrachloroethylene, trichloroethylene, ammonia dissolved in water, nonophenyl and ethoxylates, and inorganic chloramines.
In 1994–95, the Pollution Control Environmental Support Services division completed a survey of industrial and commercial establishments connected to the City sewer system. The industries surveyed consisted primarily of those whose operations did not involve the use of large amounts of process water. Industries with process water are monitored routinely.
The LRWRP receives hauled liquid wastes (septic tanks, holding tanks, and landfill leachate) by tanker truck from locations throughout Windsor and Essex County. These hauled wastes are a potential source of toxic organics and heavy metals in the plant effluent and sludge. While septic and holding tank wastes are accepted, there are tanks that must first be tested because they may contain industrial waste. An improved inspection/sampling program has been set up to ensure better control of these hauled wastes to reduce the opportunity for illegal disposal. The LRPCP is now also accepting landfill leachate, requiring monitoring and analysis.
As part of the Business Licence program administered by the City Clerk’s Department, the Pollution Control Environmental Support Services division routinely inspects service stations, restaurants, and laundries. The purpose of these inspections is to ensure that the businesses have proper sewer connections, waste disposal practices, and maintenance of oil/grease interceptors. If a business does not comply it will not get a Business Licence. These inspections afford the opportunity for Pollution Control staff to educate business owners with respect to the proper disposal of their wastes and related environmental concerns.
Although pollution prevention has come to the forefront in recent years, the Environmental Support Services division has always encouraged many of the concepts of pollution prevention. The philosophy of pollution prevention is incorporated in all the Environmental Support Services division programs. Through various programs, the Environmental Support Services division contacts over 500 companies each year, and provides information and education to those contacted. For expert advice, industry is referred to the Great Lakes Pollution Prevention Centre in Sarnia and the MOE.
Best Management Practises (BMP) or Environmental Code of Management Practice (CMP) can further reduce the amounts of pollutants reaching the sewers. The MOE has developed BMP/CMP manuals for some industrial sectors. The BMP/CMP plans address material storage, material handling, plant site run-off, in-plant transfer, and unloading areas. The Environmental Support Services division disseminates information to the appropriate industries.
Additional Programs
The Environmental Support Services division achieves its goals using the programs discussed above and the following additional programs:

37
1. Pollution Control Plant monitoring, inspection, and optimization (influent, effluent, dewatering and biosolids)
2. Industrial waste control and monitoring (including overstrength surcharge program)
3. Watershed monitoring program (Detroit River, Little River, and Grand Marais Drain/Turkey Creek)
4. Licence clearance program
5. Emergency response (spills and odour complaints)
6. Laboratory analysis
7. Flow monitoring (sanitary sewer sercharge rebates, industrial waste control and PCP monitoring)
8. Municipal landfill monitoring (This activity has recently been consolidated for all closed landfills in Pollution Control Services.)
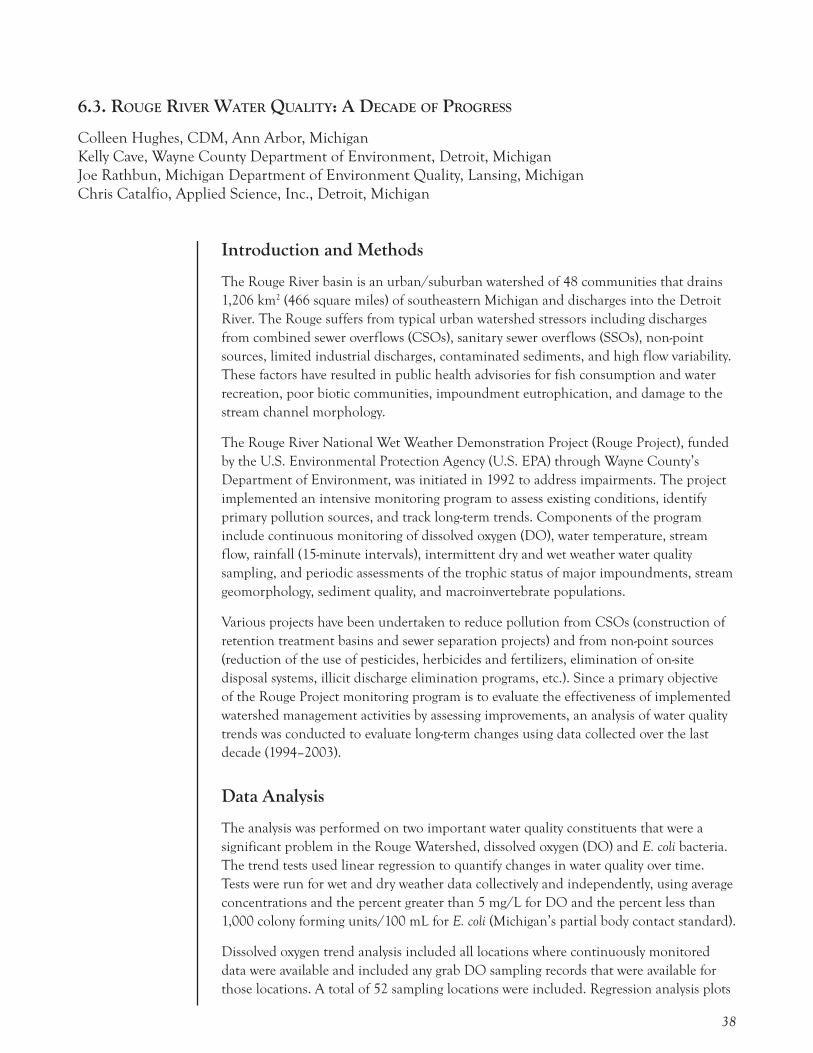
38
6.3. ROUGE RIVER WATER QUALITY: A DECADE OF PROGRESS
Colleen Hughes, CDM, Ann Arbor, MichiganKelly Cave, Wayne County Department of Environment, Detroit, MichiganJoe Rathbun, Michigan Department of Environment Quality, Lansing, MichiganChris Catalfio, Applied Science, Inc., Detroit, Michigan
Introduction and Methods
The Rouge River basin is an urban/suburban watershed of 48 communities that drains 1,206 km2 (466 square miles) of southeastern Michigan and discharges into the Detroit River. The Rouge suffers from typical urban watershed stressors including discharges from combined sewer overflows (CSOs), sanitary sewer overflows (SSOs), non-point sources, limited industrial discharges, contaminated sediments, and high flow variability. These factors have resulted in public health advisories for fish consumption and water recreation, poor biotic communities, impoundment eutrophication, and damage to the stream channel morphology.
The Rouge River National Wet Weather Demonstration Project (Rouge Project), funded by the U.S. Environmental Protection Agency (U.S. EPA) through Wayne County’s Department of Environment, was initiated in 1992 to address impairments. The project implemented an intensive monitoring program to assess existing conditions, identify primary pollution sources, and track long-term trends. Components of the program include continuous monitoring of dissolved oxygen (DO), water temperature, stream flow, rainfall (15-minute intervals), intermittent dry and wet weather water quality sampling, and periodic assessments of the trophic status of major impoundments, stream geomorphology, sediment quality, and macroinvertebrate populations.
Various projects have been undertaken to reduce pollution from CSOs (construction of retention treatment basins and sewer separation projects) and from non-point sources (reduction of the use of pesticides, herbicides and fertilizers, elimination of on-site disposal systems, illicit discharge elimination programs, etc.). Since a primary objective of the Rouge Project monitoring program is to evaluate the effectiveness of implemented watershed management activities by assessing improvements, an analysis of water quality trends was conducted to evaluate long-term changes using data collected over the last decade (1994–2003).
Data Analysis
The analysis was performed on two important water quality constituents that were a significant problem in the Rouge Watershed, dissolved oxygen (DO) and E. coli bacteria. The trend tests used linear regression to quantify changes in water quality over time. Tests were run for wet and dry weather data collectively and independently, using average concentrations and the percent greater than 5 mg/L for DO and the percent less than 1,000 colony forming units/100 mL for E. coli (Michigan’s partial body contact standard).
Dissolved oxygen trend analysis included all locations where continuously monitored data were available and included any grab DO sampling records that were available for those locations. A total of 52 sampling locations were included. Regression analysis plots

39
and trend tests were used to detect changes in DO and E. coli levels over time.
A trend is defined as an increasing or decreasing change over time. Trend tests calculate an average trend statistic, indicating the magnitude of the change, and a probability statistic (P), indicating the certainty of the trend. For assessment purposes, trend analysis results were ranked as increasing, potentially increasing, none (no statistically significant trend), potentially decreasing, and decreasing based on the following criteria:
• Increasing = increasing trend with P ≤ 0.05
• Potentially increasing = increasing trend with P>0.05 and P≤0.20
• No statistically significant trend = P>0.20
• Potentially decreasing = decreasing trend with P>0.05 and P≤0.20
• Decreasing = decreasing trend with P≤ 0.05
Improvement in water quality is indicated by increasing trends in average DO, percent DO greater than or equal to 5 mg/L, E. coli less than or equal to 1,000 cfu/100ml, and decreasing trends in average E. coli.
Several factors must be considered when interpreting the results of this study. Since not all locations were sampled all years during both dry and wet conditions, many locations have inadequate data for detecting statistically valid trends over the time period when watershed management activities were implemented. It should also be noted that the magnitude of the trend statistic is relative to the baseline condition for each site. For example, a site that had good water quality to begin with is unlikely to show much of an improving trend as water quality approaches pristine conditions. Similarly, it is important to recognize that the average trend statistic is representative of the period of available data and not necessarily a prediction that water quality will continue to change at the same rate in the future.
Results
Dissolved Oxygen
Trend analysis results clearly demonstrate that DO concentrations are improving in the Rouge River Watershed during both wet and dry weather conditions (Figure 1). Eight of nine locations show a statistically significant improving trend for the mean DO with the average annual improvement ranging from 0.09 to 0.53 mg/L per year. The ninth location (Rotunda Drive) is the furthest downstream DO monitoring location in the watershed and is influenced by many still uncontrolled CSO outfalls. This location has been monitored for the past three years and reports no statistically significant trend.

40
Figure 2 compares the percent of the time the state water quality standard of 5 mg/L was met for DO at the beginning of the project and more recently. There was a dramatic improvement, with seven of the eight locations meeting the State standard over 95% of the time in 2003. Daily average DO trend results show similar improvement with all locations showing an improvement or no trend as summarized in Figure 3. Locations with no statistically significant trend are not shown.
E. coli
E. coli trend analysis results generally showed improvement directly downstream of most watershed management activities, particularly downstream of now controlled CSO outfalls during wet weather (Figure 4). Substantial improvement is occurring at some locations; many locations are showing little to no change; and some locations may be getting worse. Figures 5 and 6 summarize the geometric mean results spatially and in relation to the CSO control activities performed within the watershed for dry and wet weather conditions, respectively. More improvement is clearly being observed during wet weather conditions, suggesting that CSO control projects have resulted in substantial water quality improvements. Most of the potentially degrading conditions during dry weather appear to be in either the headwaters where residential and commercial development are generally expanding or in areas where CSO outfalls are still uncontrolled. Although conditions are improving, most locations are still not meeting state water quality standards for E. coli total or partial body contact recreation.
Figure 1. Daily Average Dissolved Oxygen at Military Road (L05) 1994–2003.
Figure 2. Achieving the state dissolved oxygen water quality standard: Comparison of dissolved oxygen levels in 1994-1996 with levels in 2003.

41
Summary and Conclusions
In an effort to evaluate the effectiveness of watershed management activities implemented in the Rouge River Watershed, water quality trends were evaluated using DO and E. coli data collected from 1994 through 2003. Results show that DO conditions have improved markedly throughout the watershed over the past decade including the percent of time the state standard of 5 mg/L is attained. In 2003, seven of the eight continuously monitored locations met the state standard more than 95 percent of the time. E. coli conditions generally showed improvement directly downstream of most watershed management activities, particularly downstream of now controlled CSO outfalls during wet weather; however, most locations do not meet state standards for body contact. Overall, these results clearly demonstrate that the implemented watershed management activities have been successful, but that continued diligence in addressing remaining water quality pollution sources is necessary, particularly for bacteria.
Figure 3. Daily Average Dissolved Oxygen Trends.

42
Figure 4. E. coli — Dry and Wet Weather Samples 1994–2002.
Figure 5. E. coli Bacteria — Dry Weather.

43
Figure 6. E. coli Bacteria – Wet Weather.

44
6.4. MONITORING IN SUPPORT OF MODELING
Ken G. Drouillard, Great Lakes Institute for Environmental Research, University of Windsor, Windsor, Ontario
Introduction
Management areas such as the Detroit River Area of Concern (AOC) are host to numerous ongoing environmental monitoring programs. Locating, accessing, compiling, integrating, and interpreting diverse, multiagency-generated datasets can be an immense task, with many pitfalls. Use of a modeling framework can help to meet these challenges and prioritize actions for remediation. Calibrated management models provide the framework to interpret data collected from different studies and at different times or spatial scales. Such models need extensive data both for calibration and for setting starting points. However, a properly calibrated model can be used to evaluate many different management scenarios, which can help guide important decisions. The model can also tell us if the current sampling strategy is adequate to detect ecosystem recovery once remediation has been started. Therefore, we should be sure that monitoring programs are compatible with a model’s design.
The Detroit River Modeling and Management Framework (DRMMF) was developed and partially calibrated during 1999–2002 by the Great Lakes Institute for Environmental Research (GLIER), under the guidance of the Detroit River Canadian Cleanup and with funds and in-kind support from agencies including: Environment Canada, Ministry of the Environment (MOE), the City of Windsor, Essex Region Conservation Authority (ERCA), Citizens Environmental Alliance (CEA), U.S. Environmental Protection Agency, U.S. Army Corps of Engineers (USACOE), and National Oceanic and Atmospheric Administration (NOAA). The DRMMF consists of a series of sub-models (linked water hydraulic and sediment transport models; food web bioaccumulation model) and an on-line electronic database – Data Retrieval, Archival and Management System (DREAMS). Uses of the DRMMF include 1) predicting dispersion and pollutant concentrations in water; 2) establishing time-integrated loadings of critical contaminants from the Detroit River to Lake Erie; 3) predicting areas of sediment deposition and erosion; and 4) predicting bioaccumulation and toxic effects of critical pollutants such as PCBs and mercury in fishes.
These applications have provided insights into management priorities necessary to achieve RAP goals. Among the DRMMF conclusions were:
1) Elevated PCB concentrations in sport fish exceeding “No Consumption” advisory triggers are a result of contaminated sediments, primarily in the lower U.S. portion of the Detroit River.
2) Sport-fish consumption advisories, based on the most stringent criteria of 50 ug/kg total PCB, will continue to persist in the Detroit River even in the absence of contaminated sediments due to background PCB concentrations in water from Lake St. Clair.
3) The large reservoir of contaminated sediments in the U.S. reaches of the lower Detroit River is subject to resuspension during periodic scouring of the river bottom during

45
storms. This occurs approximately every 20 years.
Thus, the model suggests that sediment contamination patterns in the river do not simply reflect legacy loadings from historical emissions, but rather continue to be replenished from locally active sources and by mobilization/redistribution of contaminated particles throughout the basin.
Clearly, the next steps in applying the DRMMF model should be to compile measured loadings data, predicting chemical mass balance and the spatial distribution of water and sediment contamination, and to validate model predictions by conducting carefully planned surveys of water, sediment, and biota contamination. Figure 1 summarizes the needs for model input and validation and identifies associated information gaps. The following sections summarize the major on-going monitoring programs, their adequacy in satisfying DRMMF model input needs for each sub-model, and suggested improvements that would allow better integration into the management framework.
Water Quality Sub-Model
The water quality sub-model predicts flow using a hydraulic model (USACOE-CH3D model) adapted to the Detroit River using bathymetry data collected by NOAA in 2000, and base flow and storm event frequency data derived from analysis of water level gauge information (NOAA, Department of Fisheries and Oceans). Optimization of the hydraulic model parameters resulted in a predictions that usually were within 10% of measured flow rates (DRMMF 2003).
We still know too little about chemical loadings from upstream sources, tributaries, and outfalls to be able to predict pollutant dispersion and spatial gradients in the water. Programs that can monitor upstream loadings of toxins such as PCBs, mercury, and dioxins include: Environment Canada’s Corridor Monitoring Program (2000–2004), City of Windsor’s Biomonitoring Program (1998–2004), and COA (Canada-Ontario Agreement) Biomonitoring Program (2002–2003). Each program regularly provides fixed-station, water quality data at the Detroit River headwaters. This data can be used to validate overall changes in water concentrations, but it is too coarse to test for cross-channel variation in water quality. To support DRMMF needs for an upstream loadings estimate, we require synoptic sampling across an upstream transect that considers near shore areas and centre-channel locations selected on the basis of flow distribution.
In-stream contaminant loading estimates could be supplied by federal and state/provincial tributary sampling programs, and by industrial Permit Compliance Monitoring Programs. Recent reviews of existing monitoring databases conducted by the Lake Erie LaMP (Lakewide Management Plan) Sources and Loadings Committee concluded that the effluent and tributary monitoring data available for many trace contaminants, including PCBs, are not of suitable quality to compute loads (Painter 2003). At a minimum, DRMMF input needs and mass balance calculations could be accomplished by establishing synoptic tributary sampling and tracking temporal loading changes that occur as a result of storm events. Additional data sets supplied by City of Windsor’s municipal effluent monitoring program and Detroit Water and Sewerage Department’s effluent monitoring should be incorporated to account for loadings from these closely monitored sources. Critical validation data sets should include additional transect sampling of water quality along mid-stream and downstream reaches of the Detroit River
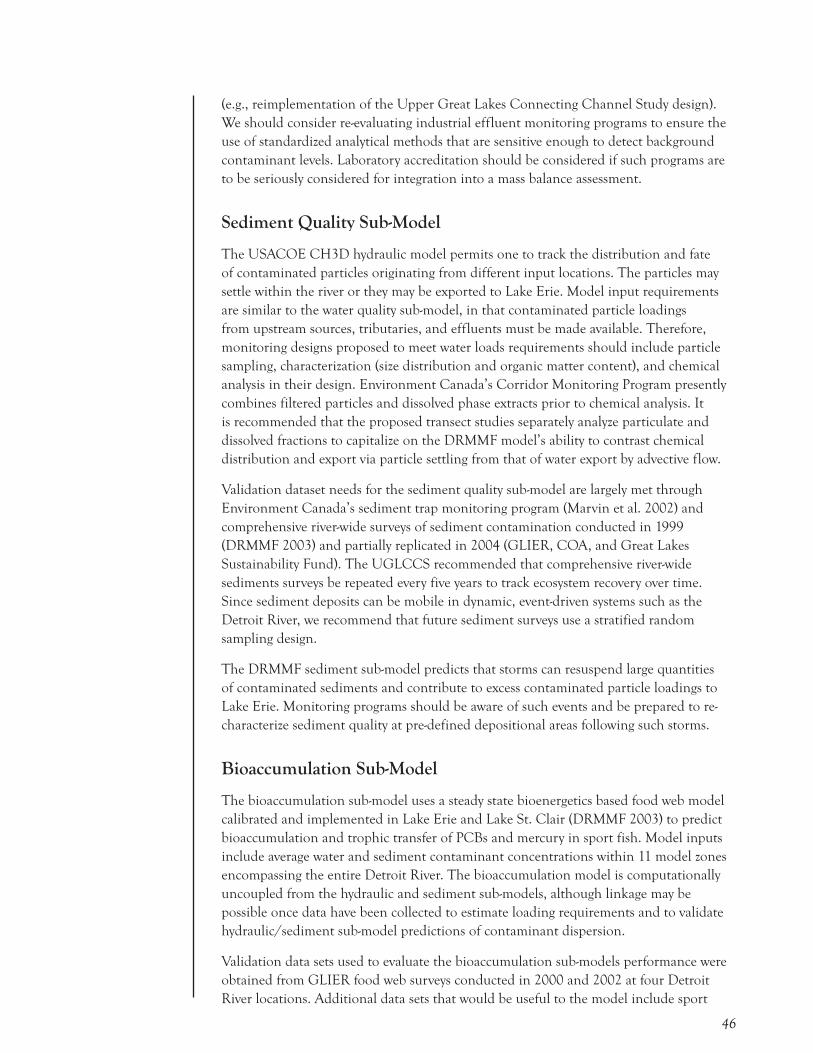
46
(e.g., reimplementation of the Upper Great Lakes Connecting Channel Study design). We should consider re-evaluating industrial effluent monitoring programs to ensure the use of standardized analytical methods that are sensitive enough to detect background contaminant levels. Laboratory accreditation should be considered if such programs are to be seriously considered for integration into a mass balance assessment.
Sediment Quality Sub-Model
The USACOE CH3D hydraulic model permits one to track the distribution and fate of contaminated particles originating from different input locations. The particles may settle within the river or they may be exported to Lake Erie. Model input requirements are similar to the water quality sub-model, in that contaminated particle loadings from upstream sources, tributaries, and effluents must be made available. Therefore, monitoring designs proposed to meet water loads requirements should include particle sampling, characterization (size distribution and organic matter content), and chemical analysis in their design. Environment Canada’s Corridor Monitoring Program presently combines filtered particles and dissolved phase extracts prior to chemical analysis. It is recommended that the proposed transect studies separately analyze particulate and dissolved fractions to capitalize on the DRMMF model’s ability to contrast chemical distribution and export via particle settling from that of water export by advective flow.
Validation dataset needs for the sediment quality sub-model are largely met through Environment Canada’s sediment trap monitoring program (Marvin et al. 2002) and comprehensive river-wide surveys of sediment contamination conducted in 1999 (DRMMF 2003) and partially replicated in 2004 (GLIER, COA, and Great Lakes Sustainability Fund). The UGLCCS recommended that comprehensive river-wide sediments surveys be repeated every five years to track ecosystem recovery over time. Since sediment deposits can be mobile in dynamic, event-driven systems such as the Detroit River, we recommend that future sediment surveys use a stratified random sampling design.
The DRMMF sediment sub-model predicts that storms can resuspend large quantities of contaminated sediments and contribute to excess contaminated particle loadings to Lake Erie. Monitoring programs should be aware of such events and be prepared to re-characterize sediment quality at pre-defined depositional areas following such storms.
Bioaccumulation Sub-Model
The bioaccumulation sub-model uses a steady state bioenergetics based food web model calibrated and implemented in Lake Erie and Lake St. Clair (DRMMF 2003) to predict bioaccumulation and trophic transfer of PCBs and mercury in sport fish. Model inputs include average water and sediment contaminant concentrations within 11 model zones encompassing the entire Detroit River. The bioaccumulation model is computationally uncoupled from the hydraulic and sediment sub-models, although linkage may be possible once data have been collected to estimate loading requirements and to validate hydraulic/sediment sub-model predictions of contaminant dispersion.
Validation data sets used to evaluate the bioaccumulation sub-models performance were obtained from GLIER food web surveys conducted in 2000 and 2002 at four Detroit River locations. Additional data sets that would be useful to the model include sport

47
fishing monitoring programs of the MOE and the Michigan Department of Natural Resources, and the MOE young-of-the-year spottail shiner monitoring program. Overall, the bioaccumulation sub-model adequately predicted PCB concentrations in most species analyzed. More than 90% of measured data were within a factor of ten. Bias in model predictions was most notable for large organisms (> 100 g) perhaps due to failure of the model to accurately account for fish movements. Given long-range movements of some consumed species such as walleye (Sander vitreus), expansion of the model to a Huron-Erie corridor scale may be necessary. Such an approach would also be supported by long-term fish biomonitoring programs in western Lake Erie and Lake St. Clair as conducted by DFO and U.S. Geological Survey.
Conclusion
Remedial action plans are charged with implementing efficient strategies to restore beneficial uses. A major challenge to this process is finding the cause-effect linkages between chemical loadings, environmental concentrations, and biological effects. It is unlikely that such linkages or effective management targets can be established by simply compiling data from existing monitoring programs and conducting statistical or weight-of-evidence assessment approaches. Management models, such as the DRMMF, have the potential to establish scientifically defensible linkages among key system or ecological processes. Coordination of monitoring programs to satisfy DRMMF needs and to permit integrated assessment of the Detroit River RAP will require that: 1) managers, monitoring agencies, and modelers are made fully aware of the types of data being collected; 2) where possible, modelers have a chance to influence sampling designs; 3) existing monitoring data be compiled, made readily available, and evaluated in a timely manner to identify/address data gaps; and 4) data are collected with appropriate QA/QC (quality assurance/quality control) and are cross compatible between studies.
References
Dolan, D. (2003). “Appendix 4: Trends in annual point source PCB loads to the Detroit River, 1986-1998.” Evaluating Ecosystem Results of PCB Control Measures Within the Detroit River-Western Lake Erie Basin, T.M. Heidtke, J. Hartig and B. Yu, eds., U.S. Environmental Protection Agency, EPA-905-R-03-001, Chicago, Illinois.
Great Lakes Institute for Environmental Research. (2003). Detroit River Modeling and Management Framework Interpretive Report, Occasional Publication No. 5, University of Windsor, Windsor, Ontario.
Marvin, C., M. Alaee, S. Painter, M. Charlton, P. Kauss, T. Kolic, K. MacPherson, D. Takeuchi and E. Reiner. (2002). “Persistent Organic Pollutants in Detroit River Suspended Sediments: Polychlorinated Dibenzo-p-dioxins, and Dibenzofurans, Dioxin-like Polychlorinated Biphenyls and Polychlorinated Naphthalenes.” Chemosphere, 49, 111-120.
Painter, S. (2003). “Appendix 3: Lake Erie Lakewide Management Plan Perspective on PCB Sources and Loadings.” Evaluating Ecosystem Results of PCB Control Measures Within the Detroit River-Western Lake Erie Basin, T.M. Heidtke, J. Hartig and B. Yu, eds., U.S. Environmental Protection Agency, EPA-905-R-03-001, Chicago, Illinois.

48
Figure 1. DRMMF water quality sub-model components and data requirements.

49
Figure 2. DRMMF sediment quality sub-model components and data requirements.
Figure 3. DRMMF bioaccumulation sub-model components and data requirements.
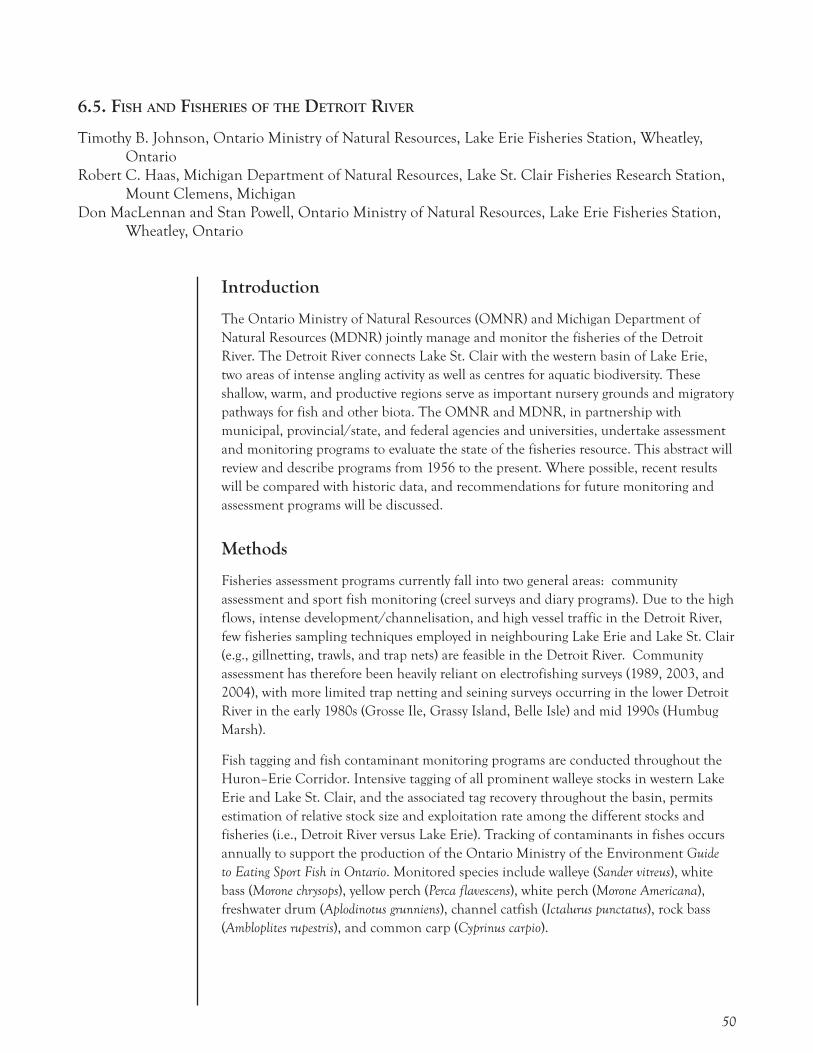
50
6.5. FISH AND FISHERIES OF THE DETROIT RIVER
Timothy B. Johnson, Ontario Ministry of Natural Resources, Lake Erie Fisheries Station, Wheatley, Ontario Robert C. Haas, Michigan Department of Natural Resources, Lake St. Clair Fisheries Research Station, Mount Clemens, MichiganDon MacLennan and Stan Powell, Ontario Ministry of Natural Resources, Lake Erie Fisheries Station, Wheatley, Ontario
Introduction
The Ontario Ministry of Natural Resources (OMNR) and Michigan Department of Natural Resources (MDNR) jointly manage and monitor the fisheries of the Detroit River. The Detroit River connects Lake St. Clair with the western basin of Lake Erie, two areas of intense angling activity as well as centres for aquatic biodiversity. These shallow, warm, and productive regions serve as important nursery grounds and migratory pathways for fish and other biota. The OMNR and MDNR, in partnership with municipal, provincial/state, and federal agencies and universities, undertake assessment and monitoring programs to evaluate the state of the fisheries resource. This abstract will review and describe programs from 1956 to the present. Where possible, recent results will be compared with historic data, and recommendations for future monitoring and assessment programs will be discussed.
Methods
Fisheries assessment programs currently fall into two general areas: community assessment and sport fish monitoring (creel surveys and diary programs). Due to the high flows, intense development/channelisation, and high vessel traffic in the Detroit River, few fisheries sampling techniques employed in neighbouring Lake Erie and Lake St. Clair (e.g., gillnetting, trawls, and trap nets) are feasible in the Detroit River. Community assessment has therefore been heavily reliant on electrofishing surveys (1989, 2003, and 2004), with more limited trap netting and seining surveys occurring in the lower Detroit River in the early 1980s (Grosse Ile, Grassy Island, Belle Isle) and mid 1990s (Humbug Marsh).
Fish tagging and fish contaminant monitoring programs are conducted throughout the Huron–Erie Corridor. Intensive tagging of all prominent walleye stocks in western Lake Erie and Lake St. Clair, and the associated tag recovery throughout the basin, permits estimation of relative stock size and exploitation rate among the different stocks and fisheries (i.e., Detroit River versus Lake Erie). Tracking of contaminants in fishes occurs annually to support the production of the Ontario Ministry of the Environment Guide to Eating Sport Fish in Ontario. Monitored species include walleye (Sander vitreus), white bass (Morone chrysops), yellow perch (Perca flavescens), white perch (Morone Americana), freshwater drum (Aplodinotus grunniens), channel catfish (Ictalurus punctatus), rock bass (Ambloplites rupestris), and common carp (Cyprinus carpio).

51
Results
Across all surveys, 52 species of fish, including four species of special concern (based on Ontario species-at risk criteria) have been captured in Detroit River fisheries assessment programs. Emerald shiners (Notropis atherinoides) and spottail shiners (Notropis hudsonis) were numerically abundant in all surveys (each species representing >11% of the total catch in each year), while yellow perch (22% in 2003) replaced alewife (Alosa pseodoha rengus) (39% in 1989) as the single most numerically abundant species across surveys. Angler creel programs have been run by OMNR (1956–1960, 1974–1980, 1992 and 2002) and MDNR (1983–1985 and 2000–2004) at varying seasonal and spatial intensity. Thirty-four percent of Michigan’s Great Lakes sport fishing effort occurs in the Huron-Erie Corridor, although these waters comprise less than one percent of the area of Michigan’s Great Lakes jurisdiction. MDNR creel surveys of the Detroit River boat fishery suggests angler effort was similar in 1983–1984 and 2002–2003 (~660,000 angler hours) although catch-per-unit-effort (CPUE) declined markedly (1.30 fish/hr versus 0.42 fish/hr). Walleye are by far the most sought after species (78–93% of targeted effort between 2000 and 2003), followed by white bass and yellow perch.
Participants in the OMNR Sport Diary Program in 2003 reported the highest walleye CPUEs in the Detroit River (0.85 fish/hr) compared to western Lake Erie (0.55 fish/hr), the St. Clair River (0.41 fish/hr) or Lake St. Clair (0.32 fish/hr). Walleye CPUE is highest in July and August, and lower in the spring and fall. Walleye < 30 cm remain free of consumption advisories, while larger walleye and most sizes of other species monitored for contaminants bear varying degrees of recommended restriction. Recommended consumption limits in the Detroit River are comparable to those for neighbouring fisheries in the St. Clair River, Lake St. Clair, and the western basin of Lake Erie.
Conclusions and Recommendations
Despite the unique challenges of sampling fishes in the Detroit River and competing demands for fish stock and fisheries assessment in adjacent waters of Lake Erie and Lake St. Clair, the combined OMNR/MDNR programs provide a reasonable picture of the state of this valuable natural resource. Gaps in program coverage—years without assessment and/or limited geographic coverage—are undesirable characteristics of Detroit River programs, but these gaps are present in most regional fisheries monitoring programs. Continued strategic planning to ensure that standardised methods are employed across years and between jurisdictions will ensure that resource managers have baseline information to support decision making.

52
6.6. AN OVERVIEW OF HAWK MIGRATION STUDIES BY SOUTHEASTERN MICHIGAN RAPTOR RESEARCH AT THE DETROIT RIVER MOUTH
Paul Cypher, Southeastern Michigan Raptor Research, Brownstown, Michigan
Introduction
Analyzing trends from population samples of migrant birds of prey can provide researchers with insight into the overall health of the environment. The geography of the eastern Great Lakes combined with the migratory preferences of North American birds of prey provide hawk watches at the Detroit River mouth (specifically Southeastern Michigan Raptor Research and Holiday Beach Migration Observatory) a remarkable opportunity to monitor the overall health of the environment on a continental scale. This paper addresses only Southeastern Michigan Raptor Research (SMRR).
Thermals (rising columns of warm air) are utilized by many raptor species during migration. Thermals do not form over water, causing many southbound migrants to circumnavigate the Great Lakes. Birds moving south through Ontario find their progress blocked by Lake Erie and Lake Ontario. They are forced to cross the Detroit River to continue their migration (Cypher 2004). Recognizing this, a series of hawk watches were established at the river mouth. SMRR (originally the Lake Erie Metropark Hawkwatch) started in 1983 under the management of Tim Smart. During the first few seasons, a solid understanding of the impact of wind and bird flight lines was gained.
Unfortunately, qualified volunteer counters were limited, resulting in days without coverage and thus limited data. However, by 1992 coverage by qualified volunteer personnel was consistent for the majority of the season. In 1998, SMRR obtained 501(c)3 non-profit status and hired its first full-time counter using funds from a Michigan Department of Natural Resources Non-game Wildlife Fund Grant in 2000. Funding continued from 2001 to the present with support from DTE Energy.
Methods
The count season established by SMRR begins on September 1 and concludes November 30. Weather conditions, specifically wind speed and direction, determine which count site is used. During days with non-north winds, the Boat Launch of Lake Erie Metropark (LEMP) is used (Figure 1). The majority of the season’s hours (>75%) are logged here. A secondary count site, the Headquarters of Pointe Mouillee State Game Area, is used when winds contain a strong north component (Figure 1). Under extreme circumstances, both count sites are staffed simultaneously. A professional counter, with one or more volunteers, staffs the count site every day, from approximately 7 AM to 5 PM EST (adjusted to length of daylight). Each hour, all migrants are identified to species (with ages in some cases), counted, and recorded along with weather data and flight details. All data is entered into the Hawk Migration Association of North America’s (HMANA) Raptors Online database at http://www.hawkcount.org. This database is used by over 100 hawk watches in the United States, Mexico, and Canada, allowing researchers to download count information (copyrighted by respective count sites/organizations) as an Excel spreadsheet. In addition, data is posted on the SMRR website (http://www/smrr.

53
net) in journal format for the public.
Results
From 1983 to 2003, over 3 million birds representing 23 species have been recorded during over 8,000 hours of observation. However, the opening years of the count were not fully staffed, nor were count protocols consistent. Thus, data interpretation begins with the 1992 season. The 12-year average (1992-2003) of the 16 species regularly recorded is shown in Table 1 (Cypher 2004). Recognizing that long-term trends become more accurate over time, care needs to be taken when interpreting the data from “only” 12 seasons. Nevertheless, several species show significant trends.
Peregrine falcons, osprey, and bald eagles increased significantly during the 12-year count period (Figure 2; SMRR). Hawk watches throughout the Central Continental Flyway have noted this increase as well (Berardi 2004). While osprey and bald eagles spend considerable time in the study area, only individuals that appear to be migrating are counted. (Count protocols prevent the inclusion of transient and nesting birds.) Hawk watches throughout the Central Continental Flyway have noted an increase in osprey and bald eagles as well (Berardi 2004).
There has been a significant increase in turkey vulture numbers (Figure 3; SMRR). Most hawk watches (all but one) throughout the Central Continental Flyway recorded increases as well (Berardi 2004). There has also been an upward trend in red-shouldered hawk numbers (Figure 4; SMRR). While the trend is encouraging, the percentage of immature birds for 2001, 2002, and 2003 was 20%, 11%, and 21% respectively. Recruitment for this species is very poor.
Figure 1. Count site locations for SMRR and Holiday Beach Migration Observatory (HBMO).

54
Table 1. SMRR Season Averages (1992 - 2003).
Species Average number
Turkey Vulture (Cathartes aura) 32,160
Bald Eagle (Haliaeetus leucocephalus) 170
Sharp-shinned Hawk (Accipiter striatus) 9,449
Northern Goshawk (Accipiter gentilis) 34
Broad-winged Hawk (Buteo platypterus) 183,895
Red-tailed Hawk (Buteo jamaicensis) 7,414
Golden Eagle (Aquila chrysaetos) 111
Merlin (Falco columbarius) 50
Osprey (Pandion haliaetus) 140
Northern Harrier (Circus cyaneus) 802
Cooper’s Hawk (Accipiter cooperii) 619
Red-shouldered Hawk (Buteo lineatus) 792
Swainson’s Hawk (Buteo swainsoni) 8
Rough-legged Hawk (Buteo lagopus) 71
American Kestrel (Falco spaverius) 1,739
Peregrine Falcon (Falco peregrinus) 51
Figure 2. Changes in numbers of osprey, bald eagles and peregrine falcons observed by SMRR (1992-2003).

55
Figure 4. Changes in numbers of red-shouldered hawks observed by SMRR (1992-2003).
Figure 3. Changes in numbers of turkey vultures observed by SMRR (1992-2003).

56
Conclusions and Recommendations
Unfortunately, hawk migration studies can’t identify factors that increase or decrease a given raptor population. However, once trends are established, further studies can be developed to pinpoint possible problems. Thus, a continuation of counting, combined with an expansion of banding programs, would yield valuable information. Planned improvements to the existing program include more funding for paid staff (counters and banders) and more public outreach. In addition, despite the limited size of the database, preliminary research efforts in eastern Canada might explain some trends that have already been noted, such as the red-shouldered hawk adult/immature ratios.
References
Berardi, V. (2004). “Fall 2003 Central Continental Flyway Report.” HMANA Hawk Migration Studies, 23(1).
Cypher, P. (2004). Southeastern Michigan Raptor Research, <http://www.smrr.net>.
Hawk Migration Association of North America Raptors Online Project, <http://www.hawkcount.org> (2004).

57
6.7. AERIAL CANVASBACK SURVEY OF LAKE ST. CLAIR, DETROIT RIVER AND WESTERN LAKE ERIE
Joseph D. Robison, Michigan Department of Natural Resources, Wildlife Division, Pte. Mouillee State Game Area, Rockwood, Michigan
Introduction
The coordinated canvasback survey began in 1974 to provide a systematic survey of canvasbacks on major staging areas prior to arrival of most birds on the wintering grounds. The canvasback (Aythya valisinera, Figure 1) is endemic to North America (Johnsgard 1992), and most are typically found staging in the Mississippi Flyway during November (Bellrose 1980). The survey has been completed during 28 years (no survey in 1980) and provides information that can be compared to breeding population estimates and January counts to help ascertain canvasback status. Since canvasbacks feed on wild celery and other lake-bottom materials, the canvasback population status reflects water quality and ecosystem health.
Methods
State agencies, the U.S. Fish and Wildlife Service, and the Canadian Wildlife Service have cooperated to survey major canvasback migration and wintering areas every year since the sites were selected in 1974. Several traditional canvasback migration staging areas were selected in Michigan and other Mississippi Flyway locations for inclusion in the coordinated canvasback survey. Important areas in Michigan included Lake St. Clair, the Detroit River, and Lake Erie.
Surveys in Michigan were conducted using one observer (plus the pilot) from a fixed-wing aircraft, flying 160–200 km/hr (100–125 mph) at 45–60 m (150–200 ft) altitude. Observers recorded all canvasbacks roosting, feeding, or flushing from water bodies. In
Michigan and other Mississippi Flyway locations, air or ground surveys were conducted on or around November 5 during most years. Due to inclement weather and scheduling conflicts, survey dates for all areas across the Mississippi Flyway ranged from October 24 to December 11 over the 25-year survey period (J. Lawrence, Minnesota Dept. of Natural Resources).
Several states have not participated in the November canvasback survey during recent years, but major migration staging areas continue to be monitored.
Results and Conclusions
The Upper Mississippi River, Lake St. Clair, the Detroit River in Michigan and Long Point, Ontario remain the major staging areas for canvasbacks in early November. Figure 2 shows the abundance of canvasbacks observed on the Detroit River during the November survey. The Upper Mississippi River count of 209,290 birds during the 2003 coordinated survey was the second highest count on record. In 2003, for the second consecutive year, most of the canvasbacks on Lake St. Clair were once again seen on the Canadian side.
Figure 1. Canvasback.

58
Both the Michigan side of Lake St. Clair and Long Point, Ontario had near record or record-low counts of canvasbacks.
The May Breeding Population Survey indicated 558,000 canvasback in 2003, 15% above the 2002 estimate and 1% below the long-term (1955-02) average (Figure 3).
The November canvasback survey should be continued to monitor populations. This survey identifies staging and wintering areas that are of significant importance to canvasbacks.
Figure 2. Abundance of canvasbacks on the Michigan side of the Detroit River observed during the November canvasback survey from 1972–2004.
Figure 3. Spring Breeding Population Survey estimates for canvasbacks, 1955–2004.

59
References
Bellrose, F.C. (1980). Ducks, Geese and Swans of North America, 3rd Ed., Stackpole, Harrisburg, Pennsylvania.
Johnsgard, P.A. (1992). Ducks in the Wild: Conserving Waterfowl and Their Habitats, Prentice Hall, New York, New York.
Soulliere, G.J., T.E. Maplesand E.N. Kafcas. (2000). Twenty-five Years of Canvasback Inventory in Michigan, 1974–1999, Michigan Department of Natural Resources, Wildlife Division Report #3332.

60
6.8. TRENDS IN BALD EAGLE POPULATION SIZE AND PRODUCTIVITY ALONG THE DETROIT RIVER AND ON THE NORTH SHORE OF LAKE ERIE
Dawn K. Laing and Debbie S. Badzinski, Birds Studies Canada, Port Rowan, Ontario
Introduction
The bald eagle (Haliaeetus leucocephlaus) is classified as endangered in Ontario and has been identified as an indicator of aquatic ecosystem health by the Lake Erie and Lake Ontario Lakewide Management Plans and the State of the Lakes Ecosystem Conference (Environment Canada and the U.S. Environmental Protection Agency 2003). Bird Studies Canada (BSC), in partnership with the Ontario Ministry of Natural Resources (OMNR) and Canadian Wildlife Service (CWS), coordinates a research and monitoring program in southern Ontario aimed at monitoring the health of the southern Ontario bald eagle population. This program started in the 1970s and now includes nest monitoring, monitoring of contaminant levels in eaglets, and a new program studying eagle movements. Within Michigan, it has been the cooperative effort of the U.S. Fish and Wildlife Service, Michigan Department of Natural Resources (MDNR), Michigan Department of Environmental Quality (MDEQ), Clemson University and Michigan State University to record and monitor bald eagle activity within the states. Results from both U.S. and Canadian programs are used by a management team to assess bald eagle population levels and productivity.
Nest Monitoring
Methods
In Canada, BSC annually tracks the fate and productivity of every bald eagle nest on the north shores of Lake Erie, Lake Ontario and Lake Huron using a network of volunteer nest monitors and landowners. While most nests are monitored from the ground, special aerial surveys are conducted in Essex County to monitor nests that are difficult to view from the ground. In Michigan, most nest monitoring is done by trained biologists with some volunteer assistance.
Results
Data collected by BSC bald eagle monitors show that both the number of nests and nest success has increased dramatically over the last two decades in southern Ontario (Figure 1). Every year, two or three new bald eagle territories are reported, resulting in a slowly increasing population. Nesting productivity (defined as the mean number of chicks fledged per nest) has stabilized in recent years to approximately 1.4–1.6 young/nest (Figures 2 and 3), which is comparable to that of bald eagle populations in other areas.
In 2004, there were 38 noted bald eagle territories in southern Ontario, 81% containing active nests. In 2004, there were four bald eagle nests on the Canadian side of the Detroit River and an additional two nests within the western basin of Lake Erie (i.e. Essex County). Two of these nests have been active since the early 1980s, and two have been active since the early 1990s. Michigan has an estimated total of over 400 breeding areas, but lacks breeding activities along the Detroit River shoreline. The United States side of

61
the Detroit River has recorded low productivity within the Detroit River region and has only recorded two bald eagle nests along the river. The nests have only been in use since 1999 and have only yielded a single young since establishment (Dave Best, U.S. Fish and Wildlife Service, Michigan).
Conclusions and Recommendations
While the re-colonization of the Detroit River by bald eagles is a positive sign, these birds are vulnerable to high levels of disturbance, contamination, and ongoing habitat loss. With a scarcity of large mature trees to replace nesting trees that have fallen during windstorms or weather events, bald eagles may be unable to find suitable alternate nest trees and therefore be forced to leave a previously occupied territory. Dave Best of the U.S. Fish and Wildlife Service has taken part in past efforts to augment nesting habitat through the use of nesting platforms in areas that did not have suitable long-lived nesting trees. Bird Studies Canada has worked to establish nesting platforms in southern Ontario, and monitoring suggests that the most effective platforms are those built in pre-existing trees, which is consistent with reports from Michigan (Dave Best).
Monitoring of Contaminant Levels
Methods and Results
In addition to regular nest monitoring, every five years all nests within southern Ontario are accessed to band and blood sample the eaglets. Blood and feather samples are taken to monitor levels of contaminants (both organochlorines and heavy metals) in the tissues of bald eagles hatched along the north shore of Lake Erie. Analyses of contaminant data by CWS have revealed that levels of organochlorines (DDE and PCBs) have declined dramatically over the last 20 years. In the early 1980s, levels of PCBs and DDT were so high that bald eagles suffered from reproductive impairment due to egg shell thinning and life-threatening deformities such as crossed bills. Reproductive impairment was so severe that in 1980 the Lake Erie bald eagle population experienced complete reproductive failure. United States bald eagles nesting along the shores of the Detroit River have not rebounded from such a population crash possibly due, in part, to a lack of habitat characteristically preferred by nesting pairs.
Discussion
While the increase of the bald eagle population and the concurrent decline of organochlorines suggest that the population is recovering in many parts of the lower Great Lakes, recovery has been modest in the Lake Ontario basin. There are ongoing concerns about the viability and long-term stability of the southern Ontario bald eagle population. Observations of nest turnover rates collected by volunteer nest monitors suggest that bald eagles in southern Ontario have shortened life spans. In addition, over the last few years, several bald eagles found dead in Ontario had elevated levels of both mercury and lead in their bodies. Long-term exposure to such contaminants can limit an eagle’s reproductive capabilities, alter their behaviour, impair their foraging abilities, increase their susceptibility to disease, and even result in death. Determining whether heavy metal exposure is responsible for decreased longevity is one of the long-term objectives of this project.

62
Figure 1. The number of successful bald eagle nests and active territories in southern Ontario (bars), and the total number of eaglets produced (dots) from 1980–2004. A nest was classified as successful if at least one young survived to fledging.
Figure 2. Productivity (mean number of chicks fledged per active nest) of bald eagles in southern Ontario between 1980 and 2004.

63
Tracking Eagle Movements
In 2004 BSC, in partnership with OMNR and CWS, launched a new program called Destination Eagle to investigate juvenile eagle heavy metal exposure. This program uses satellite telemetry to follow the movements of juvenile eagles for a five-year period. Location data will be used to identify areas where juvenile birds are spending the majority of their time, and perhaps becoming exposed to harmful contaminants. Three bald eagles were equipped with satellite telemetry units in June 2004. One eaglet died near its natal area, and the other two are moving throughout the Great Lakes basin. There are efforts to expand the program in 2005 to track more bald eagles from the Lake Erie watershed. This project will not only reveal important information on the movements of juvenile eagles and eagle habitat preferences but also increase public awareness of the importance of aquatic ecosystem health.
References
Environment Canada and the U.S. Environmental Protection Agency. (2003). State of the Lakes 2003, Environment Canada and the U.S. Environmental Protection Agency, En40-11/35-2003E.
Figure 3. Number of eaglets produced per year per nest in Essex County, Ontario, from 1980–2004.

64
6.9. CHRISTMAS BIRD COUNTS AND PROJECT FEEDERWATCH: CITIZENS IN ACTION
Sarah Rupert, Point Pelee National Park of Canada, Leamington, Ontario
Introduction
The Christmas Bird Count (CBC) is the longest running volunteer-based bird-counting program in the world. The National Audubon Society, partnering with Bird Studies Canada, administers the CBC program. More than 50,000 people participate in counts across North America, parts of Central and South America, and throughout the Caribbean and Pacific Islands. Last year, more than 63 million birds were counted.
The CBC began more than a century ago, and was a key part of the modern conservation movement. A traditional Christmas activity at that time was the “side hunt.” Teams competed to see who could shoot the most birds and small mammals in one day. Scientist and writer Frank Chapman was greatly opposed to this activity and proposed instead to identify, count, and record all the birds that could be found. He was joined by 26 other conservationists scattered across 25 localities, and the CBC was born.
As the popularity of birdwatching has increased, so has the number of counts and participants. Volunteers drive this program—it could not be done without their assistance. A major swell in the number of Christmas counts and participants was noted in 1970, building to great numbers by the year 2000 (Figures 1 and 2). Last year, the CBC program saw a record high of 1,996 counts in North America, due in part to the number of counts in Canada.
In Ontario, more than 100 counts are conducted each year. Point Pelee National Park’s count is one of the longest running in the region. Point Pelee’s count began in 1920, running sporadically until 1949, when it became entrenched in the operations of the park and became an annual event. To date, this count has recorded 175 different species of birds and almost one million individuals.
Project FeederWatch is a relatively new program in comparison to the CBC. It was started in 1976 by the Long Point Bird Observatory and was called the Ontario Feeder Bird Survey. In ten years, the program had garnered such valuable information that those involved realized a continent-wide program was needed to accurately monitor large-scale movements of birds. This program is now run as a cooperative research project of the
Figure 1. Number of CBCs from 1900-2000 in North America.

65
Cornell Laboratory of Ornithology, Bird Studies Canada, the National Audubon Society (U.S.) and the Canadian Nature Federation.
In its first year as a continent-wide program, the number of participants jumped to 4,000. It now is around 15,000 and includes participants observing feeders at institutions, nature centres, schools, and private homes.
Objectives and Methods
Christmas Bird Count
The primary objective of the CBC is “to monitor the status and distribution of early-winter bird populations across the Western Hemisphere” (National Audubon Society 2004). The Point Pelee CBC monitors numbers, diversity, and trends within the winter bird population in the park to evaluate the effects of restoration efforts.
The CBC is conducted in the same way each year. The CBC covers a 24-km radius circle with the centre located just north of the northern park boundary (Figure 3). It includes areas both inside and outside of the park, as well as a portion of Lake Erie on either side of the peninsula.
The area is further divided into nine subsections that are the same from year to year. The CBC is conducted on the first Monday of the count period (December 14–January 5) and lasts 24 hours. Groups are assigned to count all of the individuals of all species within their designated area. To avoid double counting, group leaders clearly define what areas are being counted by which sub-groups.
If routes are retraced during the course of the day, only new species are counted on the way back. Consistency is also achieved through placing group leaders in the same areas each year and pairing less experienced observers with more experienced observers. Any rare or unusual species are documented by the observers in as much detail as
Figure 3. Point Pelee Christmas Bird Count area.
Figure 2. Number of Participants from 1900-2000 in North America.

66
possible and then forwarded to the Regional Editor for consideration. All count results are submitted through the Web, reviewed by the Regional Editor, and maintained as a publicly accessible database for future use.
In addition to bird data, weather conditions, ice conditions, snow depth, effort (measured in hours spent and kilometres traversed), food crops available for birds, and other interesting or relevant information are recorded.
Project FeederWatch
The purpose of Project FeederWatch is to “track broad-scale movements of winter bird populations and long-term trends in winter bird populations and distribution” (Cornell Laboratory of Ornithology 2004). Project FeederWatch takes place over the entire winter season, so it provides information about bird movements and other changes that cannot be detected from the one day Christmas Bird Counts. Project FeederWatch is conducted annually from November to April to consider birds during all parts of the winter season. Anyone with an interest in birds can participate. Feeder watchers establish their count site at the beginning of the season and limit all of their counts to that area. A written description of the site is submitted for analysis. Two-week count periods are set through the entire season, and observers count the birds at their feeders on two consecutive days during each of these two-week periods. All species and the maximum number of individuals seen at once are recorded. The amount of time spent watching the feeders can vary, and zero bird days are also recorded. Weather conditions are recorded as well as the health of certain species. Observations of bird health have been particularly useful in tracking the spread of disease amongst finch species. Participants have the option of submitting their results by mail or the web and these results are used by ornithologists to determine trends.
Point Pelee National Park has been officially involved with Project FeederWatch for close to a decade. Not only have the program produced valuable information, but it has also become an important part of winter interpretive programs.
Summary of Results
The CBC data gathered at Point Pelee National Park and across the continent has provided important information regarding winter bird populations. It has allowed the tracking of the range expansion of species like the house finch (Carpodacus mexicanus) as well as the decline in numbers of other species like the habitat-sensitive red-shouldered hawk (Buteo lineatus). Data collected during CBCs have been used as part of the ongoing Parks Canada monitoring program in the Greater Park Ecosystem, which includes all of Essex County and western portions of Chatham-Kent. Christmas Bird Count data were also instrumental in the designation of the Detroit River as an Important Bird Area.
Conclusions and Recommendations
In addition to providing valuable scientific information, CBC and Project FeederWatch actively involve regular citizens in the process of data collection. Involving and engaging people in these activities can lead to greater stewardship and provide an opportunity for people to learn about the environmental challenges we face in this area. While public participation in the CBC is high in Essex County, participation in Project FeederWatch

67
in this area is still low. In the future, we hope to recruit more local volunteers for Project FeederWatch and increase awareness of this program.
References
Cornell Laboratory of Ornithology. (2004). BirdSource, <http://www.birds.cornell.edu/pfw>.
Cornell Laboratory of Ornithology. (2004). Project Feederwatch, <http://birds.cornell.edu/pfw/Overview/Whatispfw.htm>.
National Audubon Society. (2004). Christmas Bird Count, <http://www.audubon.org/bird/cbc>.
Rupert, S. (2004). Regional Summary – Ontario. Bird Studies Canada and the National Audubon Society.

68
6.10. ROUGE RIVER WATERSHED VOLUNTEER FROG AND TOAD SURVEY
Sally Petrella, Friends of the Rouge, Dearborn, Michigan
Introduction
Friends of the Rouge (FOTR), a watershed-based organization in metropolitan Detroit, has been coordinating a watershed-based volunteer frog and toad survey since 1998. The survey goals are to collect data on the health of local wetlands while giving residents a first-hand experience of local wildlife and wetlands. Wetlands are critical to the health of a watershed, filtering and storing storm water, and providing habitat for wildlife. Since amphibians depend on upland and wetland habitat, changes in populations can be used as an indicator of ecosystem health. An additional goal of the survey is to identify critical
wetlands that should be protected.
The survey is conducted within the Rouge River Watershed (Figure 1), a highly urbanized and suburbanized system that drains 1,207 km2 (466 square miles) and discharges into the Detroit River at Zug Island (Rouge River National Wet Weather Demonstration Project 1998). Begun five years after the Michigan Volunteer Frog and Toad Survey, the Rouge River Survey was designed to augment the statewide survey by focusing on one area intensively. Survey blocks of 0.65 km2 (one quarter mile square) enable volunteers to uncover small, fragmented populations of amphibians left in this highly urban and suburbanized watershed. It is probably the only watershed-based survey in the country.
Methods
The Rouge River Watershed Frog and Toad Survey is a volunteer listening survey. Volunteers attend a two-hour training session that includes a slideshow on local frogs and toads and instructions on how to conduct the survey. A compact disc or tape of the breeding calls and a participants’ guide are provided, and volunteers are expected to learn the calls on their own following the workshop. Volunteer teams sign up to survey one or more quarter-section blocks within the Rouge River Watershed.
Volunteer teams survey independently twice or more each month on damp evenings from March through July. Observations are made by listening for three minutes at representative wetlands within the survey block. Volunteers record what species they hear on a monthly data sheet along with time, temperature, wind speed, and precipitation. Data sheets are submitted to FOTR, where they are compiled. The species distributions are mapped and a report including maps is provided to all volunteers and local community contacts.
Since 2003, maps and reports have also been provided to planning commissions and local elected officials with a cover letter urging them to work to protect and increase frog and toad habitat in their part of the watershed.
Figure1. Rouge River Watershed location.

69
Results
In 1998, only one subwatershed (Middle 1) was surveyed and only four species were included because organizers were unsure of interest (see Figure 2 for subwatershed locations). In 1999, an additional subwatershed (Lower 1) was added and all nine species were included in the survey. In 2000, the survey included any part of the watershed with suitable habitat that volunteers were willing to survey. Due to the volunteer nature of the survey, approximately 10% of the watershed is surveyed every year, and survey blocks vary from year to year.
An average of 208 survey blocks are covered by volunteers each year. Each volunteer averages 7.5 observations/visits per year. From 1998–2003, approximately 9,400 observations were made.
Every year, the distribution of species is mapped and some rough comparisons are made (Table 1). In the first two years
of the survey, spring peepers and western chorus frogs were heard in the highest number of blocks. In 2000 and subsequent years, when the survey included the entire watershed, the American toad was the most commonly heard species. This is a rough comparison because blocks vary so much from year to year.
Table 1
Common name Scientific name 2003 2002 2001 2000 1999* 1998** 00–03 average
Wood Frog Rana sylvatica 23 20 17 14 30 55 19
Western Chorus Frog
Pseudacris triseriata 48 52 49 50 64 80 50
Spring Peeper Pseudacris crucifer 45 50 47 48 67 83 48
American Toad Bufo americanus 62 71 58 49 50 54 60
Northern Leopard Frog
Rana pipiens 18 8 9 5 5 10
Gray Treefrog Hyla versicolor 40 35 37 47 40 40
Green Frog Rana clamitans 53 39 38 15 30 36
Bullfrog Rana catesbeiana 13 5 7 0 2 6
*Only Middle 1 and Lower 1 subwatersheds surveyed**Only Middle 1 subwatershed surveyed
Figure 2. Rouge River subwatershed locations.

70
In 1998, the relationship of the diversity of frog and toad species (Figure 3) to percent impervious surfaces (paved surfaces) was examined. Blocks with two to three species were about 17% impervious, and blocks with four species were 13% impervious. Research by Schueler and Holland (2000) shows a declining diversity in headwaters streams once imperviousness surpasses 11%.
Discussion and Conclusions
The purpose of the Rouge River Watershed Frog and Toad Survey is to educate local residents and to collect baseline information on amphibian distribution. The survey is accomplishing both goals. A specific mechanism for applying the results to management decisions has yet to be created. The management of wetlands is controlled by state, local and private agencies as well as individuals. The FOTR is working to distribute the data to some of these agencies by providing results to planning commissions and elected officials, and by offering the data to the state through the new Wildlife Conservation Strategy Program. The FOTR has also begun training volunteers in wetland delineation and wetland law so that they can become educated advocates for critical wetlands, in a new program called Watchfrogs. It is our hope that educated citizens armed with frog and toad population data can help to influence management decisions.
Figure 3. Species diversity among surveyed blocks in 1998–2003. Darker shading represents higher numbers of species.

71
AcknowledgmentA grant from the Rouge River National Wet Weather Demonstration Project partially supports the Rouge River Watershed Frog and Toad Survey.
References
Rouge River National Wet Weather Demonstration Project. (1998). Demo Info: The Watershed. Wayne County Department of the Environment, Wayne, Michigan.
Schueler, T. and H. Holland. (2000). The Practice of Watershed Protection. Center for Watershed Protection, Ellicott City, Michigan.

72
6.11. STREAM TEAM: TEN YEARS OF DOWNRIVER WATERSHED MONITORING
Bruce Szczechowski and John Nasarzewski, Southgate Anderson High School, Southgate, Michigan
The Stream Team is a collaborative effort of over 50 school and community organizations committed to environmental monitoring and ecological restoration in the downriver watershed, which extends from Ecorse Creek in the north to the Huron River in the south (Figure 1). Formed in 1993 as an offshoot of the grassroots organization Downriver Citizens for a Safe Environment, the Stream Team has been involved in numerous monitoring and community service projects including heavy metal testing, fecal coliform counts, biological control of purple loosestrife, stream bank stabilization, aquatic invertebrate sampling, planting thousands of trees, and removing over 600 cubic meters of garbage from local waterways (Figure 2A-C). Community service projects have been biannual events since the inception of the Stream Team, and environmental monitoring was recently incorporated into the environmental science curriculum of several participating schools. Since many Stream Team monitoring studies were performed for their educational value, usually without the collaboration of regulatory agencies, long-term monitoring trends were not the emphasis; rather, instruction in scientific methodology and investigations, along with cultivation of a sense of ownership and stewardship of the local watershed, were the primary goals.
However, over the last decade, many notable studies have been performed by students involved with the Stream Team, including the monitoring work done in Ecorse Creek and other sections of the downriver watershed. Students performed the first comprehensive analysis of Ecorse Creek in over 30 years and completed studies examining the possible effects of airport discharges and combined sewer overflows on this stream.
Comprehensive Study of Ecorse Creek in 1996
This study was a cooperative effort of the Stream Team and the Michigan Department of Environmental Quality (MDEQ) in the spring of 1996 that helped to characterize
the status of Ecorse Creek. Stream Team members collected sediment samples from 15 sites along the north, south, and main branches of the creek for MDEQ analysis. Pore water samples were analyzed from three of the same sites by students using Hach spectrophotometers and testing protocols. Heavy metal concentrations were measured in both sediments and pore water. In the fall of 1996, invertebrates were sampled at
Figure 1. Map showing downriver watershed (shaded area) where the Stream Teams have worked since 1993. In this map, the downriver watershed is divided into subwatersheds.

73
several sites along the south branch of Ecorse Creek to further characterize the ecological health of this Detroit River tributary. Geographical coordinates of sampling sites were determined using detailed local maps.
The results showed an overall trend of severe heavy metal contamination in both sediment and pore water at sites near the Wayne County Metropolitan Airport, followed by decreasing contamination at two midstream sites. There was increasingly severe contamination near historical industrial dumping grounds at Council Point Park (Lincoln Park, MI) and the confluence of Ecorse Creek with the Detroit River (bordering the cities of Ecorse and Wyandotte, MI) (Figure 3). Student lab tests for zinc, lead and copper produced results similar to the general trends observed in the MDEQ sediment analyses. Both total numbers of organisms and total numbers of invertebrate species in Ecorse Creek declined with increases in heavy metal contamination (Figure 4). However, other factors, such as dissolved oxygen, may play important roles in these trends as well. A ten-year follow-up study is currently being discussed with MDEQ.
Airport Discharge
In 1995, sediment samples were taken from the Ecorse Creek South Branch on either side of the Wayne County Metropolitan Airport. Samples collected by the Stream Team were analyzed by the Michigan Department of Natural Resources Surface Water Quality Division. Test results revealed heavy metal concentrations to be significantly greater downstream than upstream. Subsequent invertebrate sampling in November 1996 revealed greater abundance (112 total organisms) and diversity of organisms (ten species) in waters free of airport discharges (i.e., upstream of airport) than waters receiving airport discharges (65 organisms and six species, respectively; see Figure 5).
In late November and early December 1997, aquatic invertebrates were sampled from the headwaters of the Ecorse Creek South Branch as well as two other locations further downstream. Again, significantly greater numbers of organisms and higher biodiversity were found at the westernmost sampling station (upstream of airport) compared to the two downstream sites (115, 55, and 22 total organisms; and eight, six, and five species, respectively), which followed trends documented in fall 1996. Unfortunately, perhaps the most pristine segment of this waterway, the headwaters west of the airport, has since been backfilled to make way for airport/industrial expansion.
Figure 2A. Stream Team water sampling and testing.
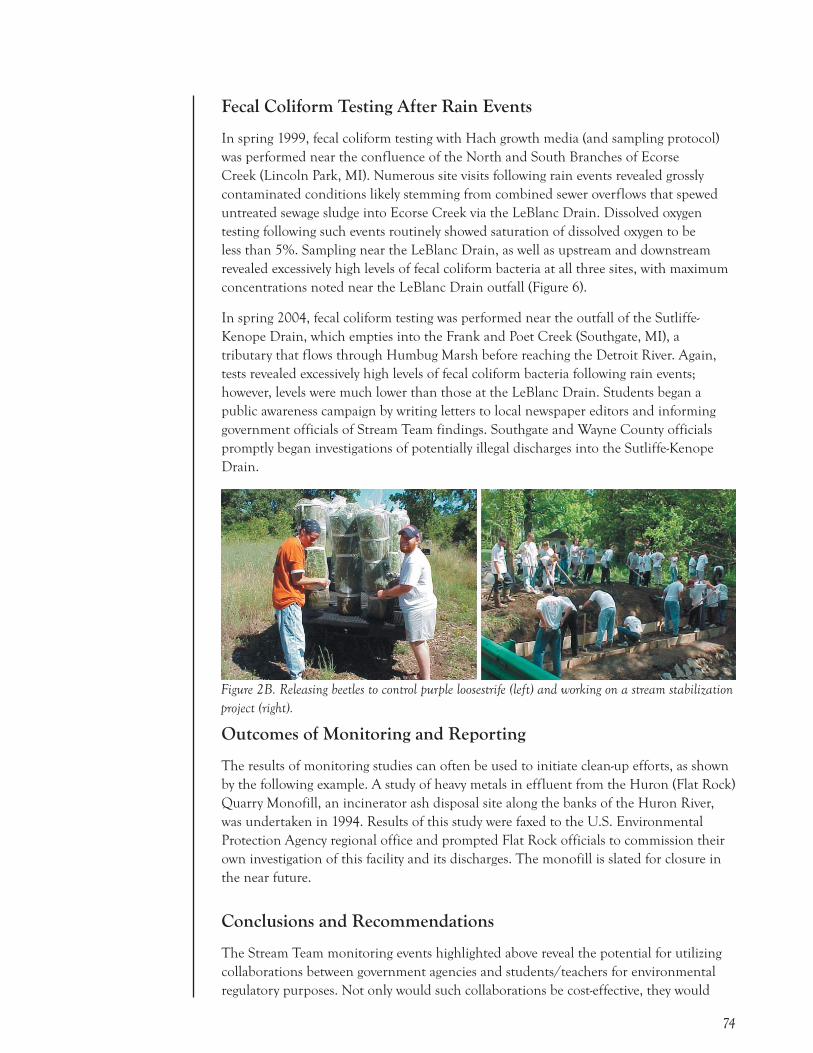
74
Fecal Coliform Testing After Rain Events
In spring 1999, fecal coliform testing with Hach growth media (and sampling protocol) was performed near the confluence of the North and South Branches of Ecorse Creek (Lincoln Park, MI). Numerous site visits following rain events revealed grossly contaminated conditions likely stemming from combined sewer overflows that spewed untreated sewage sludge into Ecorse Creek via the LeBlanc Drain. Dissolved oxygen testing following such events routinely showed saturation of dissolved oxygen to be less than 5%. Sampling near the LeBlanc Drain, as well as upstream and downstream revealed excessively high levels of fecal coliform bacteria at all three sites, with maximum concentrations noted near the LeBlanc Drain outfall (Figure 6).
In spring 2004, fecal coliform testing was performed near the outfall of the Sutliffe-Kenope Drain, which empties into the Frank and Poet Creek (Southgate, MI), a tributary that flows through Humbug Marsh before reaching the Detroit River. Again, tests revealed excessively high levels of fecal coliform bacteria following rain events; however, levels were much lower than those at the LeBlanc Drain. Students began a public awareness campaign by writing letters to local newspaper editors and informing government officials of Stream Team findings. Southgate and Wayne County officials promptly began investigations of potentially illegal discharges into the Sutliffe-Kenope Drain.
Outcomes of Monitoring and Reporting
The results of monitoring studies can often be used to initiate clean-up efforts, as shown by the following example. A study of heavy metals in effluent from the Huron (Flat Rock) Quarry Monofill, an incinerator ash disposal site along the banks of the Huron River, was undertaken in 1994. Results of this study were faxed to the U.S. Environmental Protection Agency regional office and prompted Flat Rock officials to commission their own investigation of this facility and its discharges. The monofill is slated for closure in the near future.
Conclusions and Recommendations
The Stream Team monitoring events highlighted above reveal the potential for utilizing collaborations between government agencies and students/teachers for environmental regulatory purposes. Not only would such collaborations be cost-effective, they would
Figure 2B. Releasing beetles to control purple loosestrife (left) and working on a stream stabilization project (right).

75
also promote stewardship of local watersheds, foster active vigilance in protecting water resources, and open communication lines between professionals and students. Additionally, by helping to restore ecosystem health through “real world” educational projects and community service, students can impact public awareness of environmental issues in their local communities.
Wayne County’s Department of the Environment and the downriver Stream Team are looking forward to furthering environmental stewardship through an ongoing joint effort that was initiated this past October with the first downriver watershed “Bug Hunt.” This cooperation will ensure uniformity of testing procedures and reporting of results. Student testing will no longer be about acquiring data that may or may not be of use to regulatory agencies; rather, students will see their results become part of an important long-term effort to monitor and improve our water quality.
Acknowledgements Ms. Millie Scarbough, Ecorse High School
Mr. Art Ostaszewski, Michigan Department of Environmental Quality
Mr. Robert Sweet, Michigan Department of Natural Resources Surface Water Quality Division
Mr. Tom Hughes and Ms. Susan Mesler, Riverview Community School District
Mr. David Peden, Mr. Mike Kell and Mr. Jason Martin, Southgate Community School District
Mr. Rod Wakeham, Trenton High School
Mr. Noel Mullet and Mr. Matt Best, Wayne County Department of Environment
Sr. Josepha, Our Lady of Mt. Carmel High School, Wyandotte
Mr. Mike White, Wilson Middle School, Wyandotte
Figure 2C. Benthic invertebrate monitoring with the Wayne County Department of the

76

77

78
6.12. THE MARSH MONITORING PROGRAM: MONITORING ECOLOGICAL INTEGRITY OF WETLANDS IN GREAT LAKES AREAS OF CONCERN
Tara L. Crewe and Steven T.A. Timmermans, Bird Studies Canada, Port Rowan, Ontario
Introduction
In 1987, the Great Lakes Water Quality Agreement (GLWQA) committed the governments of Canada and the United States to develop and implement remedial action plans (RAPs) in 43 Areas of Concern (AOCs) as shown in Figure 1. These RAPs address pollution and other problems associated with 14 Beneficial Use Impairments (BUIs) in or near shore and open lake waters. The BUIs relate to the health of wildlife and their human consumers, nutrient and other pollution inputs, and economic and aesthetic impacts (Great Lakes Water Quality Board 1997).
In response to the GLWQA, and to apparent marsh bird and amphibian population declines, the Marsh Monitoring Program (MMP) was established as a binational Great Lakes basin-wide effort to monitor marsh bird and calling amphibian populations (Green 1997). To this end a partnership was formed by Bird Studies Canada, the U.S. Environmental Protection Agency, Environment Canada, Great Lakes United, the Great Lakes Protection Fund, and hundreds of citizen scientists. Although the main goal of the MMP is to monitor populations of birds and amphibians throughout the Great Lakes basin, it also seeks to compare bird and amphibian species composition, abundance, and diversity between AOC and non-AOC marshes; to assess AOC status with respect to wildlife values; and to determine species-habitat associations. Through public participation, the MMP also helps increase understanding and stewardship of wetlands.
Figure 1. Areas of Concern within the Great Lakes basin.

79
Methods
To survey marsh habitats, MMP volunteers follow a standardized protocol and are guided by detailed written and aural training materials. Surveys are conducted at up to eight semi-circular monitoring stations positioned along routes. At each station, a three-minute nocturnal calling amphibian survey is conducted three times during the breeding season, and a ten-minute evening marsh bird survey is conducted twice during the height of their breeding season. Taped broadcasts are used to elicit response calls from several secretive marsh bird species. MMP participants also provide assessments of wetland habitat at each survey station. On average, 240 MMP routes were surveyed each year since 1995. In the Detroit River AOC, volunteers have monitored one amphibian route, three marsh bird routes and two routes surveyed for both amphibians and marsh birds (Figure 2). Each station location was geo-referenced to the position of the route using a Global Positioning System (GPS).
In order to assess AOC marshes, the following four measures of species diversity were calculated and compared with non-AOC marshes: diversity of all marsh nesting birds, diversity of all amphibian species, diversity of marsh bird indicator species only, and diversity of amphibian indicator species only (see Timmermans et al. 2003 for indicator species list). A ranking system was developed (Timmermans et al. 2003) to score wetlands on these diversity measures relative to non-AOC wetlands. Results in this report focus on the Detroit River AOC.
Figure 2. Locations of MMP routes in the Detroit River Area of Concern.
80
Results
Throughout the Detroit River AOC, seven amphibian species were recorded, including four of the five indicator species (Table 1). All amphibian species were recorded at low levels except at Holiday Beach, where they were recorded at moderate to high levels. Total amphibian species diversity and amphibian indicator species diversity scored within the average of those at Great Lakes Basin non-AOC routes (Table 2).
For marsh nesting birds, 16 species were recorded in the Detroit River AOC, but only five of the 12 indicator species were among those recorded (Table 1). Overall, marsh bird indicator species and marsh nesting bird diversity in the Detroit River AOC scored below the average of those at Great Lakes basin non-AOC routes (Table 2). The Detroit River AOC had an overall score of two, indicating impairment in its ability to support marsh-dependent species (Table 2).

81

82

83
Conclusions and Future Work
Despite the dedication of many volunteers to monitor AOC wetlands, monitoring coverage in many AOCs has been poor and in decline. Given the limited number of routes and years surveyed, reliable species trends over time could not be determined. Bird Studies Canada and the Great Lakes Commission are currently working with the U.S. EPA and others to improve approaches for monitoring wetland habitats in AOCs and reporting on ecological integrity in response to remedial activities in degraded environments.
The specific goals of this partnership are to improve the coverage and coordination of long-term wetland monitoring in U.S. and binational AOCs; to develop improved means of reporting on the status of five Beneficial Use Impairments (BUIs) (i.e., degradation of wildlife populations, loss of fish and wildlife habitat, degradation of benthos, eutrophication or undesirable algae, and degradation of aesthetics); and to strengthen ties between RAPs and monitoring initiatives in the Great Lakes basin. This work will involve intensive recruitment of volunteers and additional sampling of benthos and water quality at the AOCs under investigation. Ultimately, the program will help develop effective restoration strategies and measure their success in terms of marsh bird and amphibian related BUIs, thereby contributing to the recovery specific AOCs.
References
Great Lakes Water Quality Board. (1997). “Position Statement on the Future of Great Lakes Remedial Action Plans: September 1996.” J. Great Lakes Res., 212-236.
Green, D.M., ed. (1997). Amphibians in Decline: Canadian Studies of a Global Problem, Society for the Study of Amphibians and Reptiles.
Long Point Bird Observatory. Marsh Monitoring Program Volume 1: 1995-1996, Great Lakes Protection Fund.
Timmermans, S.T.A., G.E. Craigie and K.E. Jones. (2003). Marsh Monitoring Program: Areas of Concern Summary Reports: 1995-2002, Great Lakes Sustainability Fund and Canadian Wildlife Service, Port Rowan, Ontario.

84
6.13. NEW CONTAMINANTS IN SNAPPING TURTLES (CHELYDRA SERPENTINA) FROM AREAS OF CONCERN IN THE DETROIT RIVER SYSTEM: HYDROXYLATED FORMS OF POLYCHLORINATED BIPHENYLS AND POLYBROMINATED DIPHENYL ETHER FLAME RETARDANTS
Shaogang Chu and Robert J. Letcher, Great Lakes Institute for Environmental Research, University of Windsor, Windsor, OntarioKim J. Fernie and Shane R. de Solla, Canadian Wildlife Service, Canada Centre for Inland Waters, Burlington, OntarioGöran Marsh, Department of Environmental Chemistry, Stockholm University, Stockholm, Sweden
Introduction
The occurrence of persistent organic pollutants in wildlife in the Great Lakes is an important concern. Polybrominated diphenyl ether (PBDE) flame retardants continue to increase in terms of environmental occurrence and persistence in the tissues of wildlife and humans (Law et al. 2003). Temporal studies over the last ten or more years have shown biomagification and exponentially increasing levels of PBDEs in wildlife such as fish and herring gull eggs from the Great Lakes basin (Luross et al. 2002). Polychlorinated biphenyl (PCB) and PBDE metabolic products, hydroxylated-PCBs (HO-PCBs), and to a lesser extent HO-PBDEs, are also being found with increasing frequency in the blood of aquatic and marine wildlife (Soechitram et al. 2004).
The Detroit River is part of a channel connecting Lake Huron and Lake Erie via Lake St. Clair, and its sediments and vertebrate biota are highly contaminated with PCBs and PBDEs (Russell et al. 1999, Rice et al. 2002). For example, PBDEs and PCBs have been reported in muscle and some organics, and HO-PBDEs and HO-PCBs in blood, of benthic- and pelagic-feeding fish from the Detroit River (Russell et al. 1999, Rice et al. 2002, Li. et al. 2003, Valters et al. 2004). HO-PCBs and HO-PBDEs have been shown to form metabolically in fish (Hakk and Letcher 2003). However, uptake via the gills or food may also be a sourcem, since an anthropogenic analogue (the HO-trichlorinated diphenyl ether triclosan®) has been reported in Detroit River fish and surface waters (Li. et al. 2003, Hua et al. 2004, Valters et al. 2004). Both HO-PCB and HO-PBDE persist in blood due to competitive binding with thyroid hormone transport proteins, and have demonstrated other endocrine-related activities (Hakk and Letcher 2003). To our knowledge, there are no published reports on HO-PCBs or HO-PBDEs in reptiles, such as the snapping turtle (Chelydra serpentina), from any aquatic or marine environment, including the Detroit River system.
The present study is part of a larger, Environment Canada-based initiative to assess the health of wildlife in selected Areas of Concern (AOC) on the Canadian side of the Great Lakes and to document improvements over time. Additional background information about this initiative is provided in the accompanying abstract by Fernie et al., which describes contaminant concentrations in snapping turtle eggs. The snapping turtle has been chosen as a biomonitoring species to determine the concentrations of historical and emerging contaminants in tissues, and to correlate these contaminants with the reproductive and physiological health of this species. Snapping turtle contaminant burdens provide a good indication of contaminant levels in the local environment because these turtles are non-migratory. They are highly susceptible to environmental

85
changes brought about by human activity due to their behavior and reproductive and feeding habits. In this study, the emerging halogenated phenolic contaminants (HPCs, HO-PCBs, HO-PBDEs and others) were identified in the plasma of snapping turtles from two contaminated AOCs, the Detroit River and Wheatley Harbour, and compared to a less contaminated reference site, Tiny Marsh in southern Ontario (Georgian Bay).
Methods
Adult male snapping turtles (approximately 5 to 15 kg in weight) were collected in the areas indicated in Figure 1 from May to July 2002. The method for contaminant determination in plasma has been previously described (Li. et al. 2003, Valters et al. 2004, Sandala et al. 2004). Briefly, plasma samples (about one gram) were spiked with internal standards for contaminant quantification and also as a measure of recovery efficiency. Plasma was liquid-liquid extracted and separated in two fractions with basic and acid aqueous solution: 1) a HPC fraction containing HO-PCBs and HO-PBDEs (subsequently methylated to MeO-analogues), and 2) a neutral fraction containing PCBs and PBDEs.
PCBs were determined by gas chromatography coupled with an electron capture detector (GC-ECD), and all other analytes by gas chromatography coupled with mass spectrometer detector (GC/MS) with electron capture negative impact ionization source (ECNI). Analysis of PCBs (41 congeners), PBDEs (eight congeners, Br
3 to Br
7), MeO-PCBs (14
congeners, Cl5 to Cl
8), and MeO-PBDEs (17 congeners, Br
3 to Br
6) was accomplished
using the GC-ECD and GC-MS (ECNI) parameters described by Li et al. (2003), Valters et al. (2004) and Sandala et al. (2004) with some modifications. Mass chromatograms of the MeO-PCB- and MeO-PBDE-containing fractions were compared with authentic standard mixtures.
Figure 1. Maps showing snapping turtle sampling locations (black squares).

86
Results
HO-PCB congeners greater than ten were quantified in most plasma samples, but 4-HO-CB187 was generally the dominant congener (Table 1). HO-PBDE congeners detected were predominantly comprised of 4’-HO-BDE49 and 4-HO-BDE42. The PBDE and PCB concentrations were similar to the concentrations of their hydroxylated metabolic byproducts; ∑HO-PBDE concentrations were similar to 4’PBDEs as were ∑HO-PCBs to PCBs at all sampling sites (Table 1). Turtles from the Detroit River and Wheatley Harbour AOCs were significantly more contaminated in terms of HO-PCB and HO-PBDE concentrations than those from the Tiny Marsh reference site (Table 1; see Figure 1 for site locations). Relative to other organohalogen classes, HO-PCBs are very important circulating contaminants in the blood of snapping turtles from southern Ontario.
Conclusions and Recommendations
Snapping turtles from AOCs in southwestern Ontario, where halogenated pollutants contamination is relatively higher than that in non-AOC areas, appear to be at greater risk from halogenated phenolic compound (HPC) exposure, particularly to HO-PCBs.
Increasing levels of PBDEs in Great Lakes aquatic biota such as fish (Luross et al. 2002, Li et al. 2003, Valters et al. 2004) and potential toxicities (e.g., endocrine) of exposure to circulating levels of HO-PCBs and HO-PBDEs are suggested, especially in the Detroit River watershed, and are thus a potential health concern to the snapping turtle and perhaps other reptilian species. Preliminary results indicate that these HO-PCBs and HO-PBDEs found in the plasma of these adult snapping turtles are associated with changes in the functioning of multiple organs.

87
References
Hakk, H. and R.J. Letcher. (2003). “Metabolism in the Toxicokinetics and Fate of Brominated Flame Retardants: a Review.” Environ. Int., 801-828.
Hua, W, E.R. Bennett and R.J. Letcher. 2004. “Triclosan in Waste and Surface Waters from the Upper Detroit River by Liquid Chromatography-electrospray-tandem Quadrupole Mass Spectrometry.” Environ. Int. (in press).
Law, R.J., M. Alaee, C.R. Allchin, J.P. Boon, M. Lebeuf, P. Lepom and G. A. Stern. (2003). “Levels and Trends of Polybrominated Diphenylethers and Other Brominated Flame Retardants in Wildlife, Environ. Int., 29: 757-770.
Li, H. X., K.G. Drouillard, E.R. Bennett, G.D. Haffner and R.J. Letcher. (2003). “Plasma Associated Halogenated Phenolic Contaminants in Benthic and Pelagic Fish Species from the Detroit River.” Environ. Sci. Technol., 37: 832-839.
Luross, J.M., M. Alaee, M. Cannon, D.M. Whittle, D.B. Sergeant, K.R. Solomon and D.C.G. Muir. (2002). “Spatial Distribution of Polybrominated Diphenyl Ethers and Polybrominated Biphenyls in Lake Trout from the Laurentian Great Lakes.” Chemosphere, 46: 665-672.
Rice, C.P., S.M. Chernyak, L. Begnoche, R. Quintal, J.Hickey. (2002). “Comparisons of PBDE Composition and Concentration in Fish Collected from the Detroit River, MI and Des Plaines River, IL.” Chemosphere, 49:731-737.
Russell, R.W., F.A.P.C. Gobas, and G.D. Haffner. (1999). “Role of Chemical and Ecological Factors in Trophic Transfer of Organic Chemicals in Aquatic Food Webs.” Environ. Toxicol. Chem., 18: 1250-1257.
Sandala, G.M., C. Sonne-Hansen, R. Dietz, D.C.G. Muir, K. Valters, E.R. Bennett, E.W. Born, R.J. Letcher. (2004). "Hydroxylated and Methyl Sulfone PCB Metabolites in Adipose and Whole Blood of Polar Bear (Ursus maritimus) from East Greenland." Sci. Total Environ., 331: 125-141.
Soechitram, S.D., M. Athnansiadou, L. Hovander, A. Bergman and P.J.J. Sauer. (2004). “Fetal Exposure to PCBs and Their Hydroxylated Metabolites in a Dutch Cohort.” Environ. Health Perspt., 11: 1208-1212.
Valters, K., H. X. Li, M. Alaee, I. D'Sa, G. Marsh, Å. Bergman R. J. Letcher. (2005). “Polybrominated Diphenyl Ethers (PBDEs) and Hydroxylated and Methoxylated Brominated and Chlorinated Analogues in the Plasma of Fish from the Detroit River.” Environ. Sci. Technol. (in press).

88
6.14. PBDES, PCBS, AND DDE IN SNAPPING TURTLE EGGS FROM CANADIAN AREAS OF CONCERN ON THE LOWER GREAT LAKES
Kim J. Fernie and Shane R. de Solla, Canadian Wildlife Service, Environment Canada, Burlington, OntarioShaogang Chu, Ken G. Drouillard and Robert J. Letcher, Great Lakes Institute for Environmental Research, University of Windsor, Windsor, Ontario
Introduction
The International Joint Commission designated 43 Areas of Concern (AOCs) within the Great Lakes basin based upon the impairment of beneficial uses. For many AOCs, including the Detroit River AOC, one impairment was restrictions on fish and wildlife consumption due to polychlorinated biphenyl (PCB) contamination. Delisting AOCs is dependent upon remediation of the causes of the problems. Although polybrominated diphenyl ether (PBDE) flame retardants have not yet been implicated in impairing ecosystems within the AOC framework, they are increasing at almost exponential rates in biota in the Great Lakes basin.
Environment Canada initiated the Wildlife and Fish Health Effects program in 2001 to assess and monitor contaminant levels in sediment and water. The program also monitors as contaminant burdens and selected health parameters in fish, herring gulls, mink, and snapping turtles within Canadian AOCs in the Great Lakes basin. The initial assessments are being conducted in Canadian AOCs on the lower Great Lakes.
This study reports the pattern of PBDE and PCB contamination in the eggs of snapping turtles. The contaminant burden was compared to sport fish consumption guidelines (OME 2001) and environmental quality guidelines (CCME 1998). Snapping turtles are non-migratory and have small home ranges, and thus their contaminant burdens reflect their local environment (de Solla and Fernie 2004). Consequently, contaminant burdens in turtle eggs were used to assess differences in contaminant sources among the sites surveyed. We present the contaminant loads in turtle eggs from two sites within the Detroit River AOC, Turkey Creek and Canard River, as well as sites from various AOCs throughout Lake Ontario and Lake Erie, and from two inland reference sites.
Methods
Snapping turtle eggs were collected annually from each site in southern Ontario for contaminant analysis in 2001-2003. The Detroit River AOC was sampled in 2001 (at Turkey Creek and Canard River) and 2002 (Turkey Creek). A total of 112 clutches were analyzed from all sites (4–17 per site) for PCBs, while 52 clutches were analyzed for PBDEs. Five eggs were selected from each clutch, and the egg contents for each clutch were pooled. PCBs and PBDEs were analyzed using capillary gas chromatography coupled with a mass selective (GC/MSD), or electron capture detector (GC/ECD). Sum PCBs and PBDEs were reported as the total of 36 and 9 congeners (different chemical configurations of each compound), respectively.
Contaminants were expressed on a wet-weight basis for comparisons. Patterns of PCBs

89
were examined using ANOVA and factor analysis on untransformed contaminant concentrations. Thirty-three congeners were included and expressed as a proportion of the sum PCBs.
Results and Discussion
PCB concentrations in turtle eggs varied considerably among AOCs and inland reference sites (Figure 1). Although the concentrations at all AOCs (0.103–1.763 μg/g ww) were significantly higher than those at the reference sites (0.004–0.04 μg/g ww), sum PCBs were particularly high at Niagara River (Lyons Creek), Detroit River (Turkey Creek), and Hamilton Harbour (Grindstone Creek; see Figure 1). Turkey Creek had significantly higher mean concentrations of PCBs than Canard River (1.11 μg/g ww versus 0.28 μg/g ww, respectively). Although the contaminant burdens in snapping turtle eggs at all sites contained PCB congeners characteristic of both Aroclors 1254 and 1260 (commercial PCB mixtures), the Hamilton Harbour and Detroit River AOCs were particularly associated with Aroclor 1260, and both the Niagara River AOC (Lyons Creek) and St. Lawrence River AOC (Snye Marsh, Akwesasne) were associated with Aroclor 1254 (Figure 2).
Mean sum PBDEs differed among sites, and varied from a mean of 6.1 (Algonquin Park) to 107.0 ng/g ww (Toronto AOC; Figure 3). Generally, levels were lowest at Algonquin Park, where airborne deposition is assumed to be the main contaminant source. Consistent with reports that urban areas contain the highest PBDE concentrations, turtle eggs from the Hamilton Harbour and Toronto AOCs were the most contaminated among all sites (Figure 3). Mean concentrations of PBDEs at Turkey Creek (Detroit River AOC) were relatively low (13.7 ng/g ww) compared to most other AOCs.
Figure 1. Mean sum PCBs (ug/g ww) at selected Canadian AOCs and reference sites in southern Ontario, 2001–2003. Concentrations were highest near known industrial sources: Hamilton Harbour, Niagara River, and Detroit River.

90
Sum PCBs in the turtle eggs exceeded the partial Ontario Ministry of Natural Resources (OMNR) restriction guidelines for the consumption of fish (0.5 μg/g ww) at five AOCs: Hamilton Harbour, Toronto, Niagara River, Detroit River, and Wheatley Harbour. Additionally, turtle eggs from most AOCs, including both Canard River and Turkey Creek, exceeded the Canadian Environmental Quality Guidelines of PCB Toxic Equivalents (TEQs; 0.79 ng/kg for mammals).
Summary and Conclusions
Generally, concentrations of PCBs (0.004–1.763 ug/g ww) were ten times higher than PBDEs (0.006–0.107 ug/g ww) in snapping turtle eggs in the selected Canadian AOCs. Additional work is being completed to determine if these chemical concentrations are associated with observed health effects. Concentrations of these chemicals in the plasma of adult male snapping turtles are reported in the accompanying poster abstract by Chu et al.
The results of this study indicate that snapping turtle eggs are sensitive enough to differentiate not only relative exposure, but also the different sources of Aroclor mixtures in the Canadian AOCs on the lower Great Lakes. In addition, snapping turtle eggs reflect local sources of contamination since these turtles are non-migratory. The chemical concentrations found in their eggs also reflect the contaminant burdens of adult turtles. Although Russell et al. (1999) found that the ratio of contaminants between eggs and muscle in snapping turtles deviated from the equilibrium partitioning model, there was good agreement in relative concentrations between maternal and egg burdens (Pagano et al. 1999). Understanding the dynamics of contaminant accumulation in turtles would be enhanced by comparing turtle contaminant burdens with those of prey and sediment.
References
Canadian Council of Ministers of the Environment. (1998). Protocol for the Derivation of Canadian Tissue Residue Guidelines for the Protection of Wildlife that Consume Aquatic Biota. Canadian Council of Ministers of the Environment, Winnepeg.
de Solla, S.R. and K.J. Fernie. (2004). “Characterization of Contaminants in Snapping Turtles (Chelydra serpentina) from Canadian Lake Erie Areas of Concern: St. Clair, Detroit River, and Wheatley Harbour.” Environ. Pollut., 132:101-112.
Ontario Ministry of the Environment. (2001). Guide to Eating Ontario Sport Fish, 2001-2002. 21st Ed., Queen’s Printer for Ontario.
Pagano, J.J., P.A. Rosenbaum, R.N. Roberts, G.M. Sumner and L.V. Williamson. (1999). “Assessment of Maternal Contaminant Burden by Analysis of Snapping Turtle Eggs.” J. Great Lakes Res., 25:950-961.
Russell, R.W., F.A.P.C Gobas and G.D., Haffner. (1999). “Maternal Transfer and In Ovo Exposure of Organochlorines in Oviparous Organisms: A Model and Field Verification.” Environ. Sci. Technol., 33:416-420.

91
Figure 2. Factor scores from the first two factors of PCB congeners in snapping turtles eggs from selected sites, 2001-2003. Factor 1 is positively correlated with Aroclor 1254 and negatively correlated with Aroclor 1260. Factor 2 is positively correlated with Aroclor 1260. Hamilton Harbour and Detroit River AOCs are associated with Aroclor 1260, while St. Lawrence (Snye Marsh) and Niagara River (Lyons Creek) AOCs are associated with Aroclor 1254.
Figure 3. Mean sum PBDEs (ng/g ww) at AOCs and reference sites in southern Ontario, 2001-2003. Concentrations were highest at two large urban centres, Hamilton and Toronto. Levels were relatively low at Turkey Creek, Detroit River.

92
6.15. THE U.S. GEOLOGICAL SURVEY HURON-ERIE CORRIDOR INITIATIVE
Bruce A. Manny, Leon M. Carl, Sandra Morrison, S. Jerrine Nichols, Edward F. Roseman, S.C. Riley, U.S. Geological Survey Great Lakes Science Center
Introduction
In 2004, the Huron-Erie Corridor (HEC) Initiative was proposed by the U.S. Geological Survey’s Great Lakes Science Center to address high-priority research needed to understand and remediate the impacts of habitat loss and degradation as well as invasive species on fishery resources in the HEC. The HEC includes the waters of southern Lake Huron, the St. Clair River, Lake St. Clair, the Detroit River, and western Lake Erie. Waste disposal, navigation, water withdrawal, and shoreline development have decreased the ecological resilience of this ecosystem and altered or degraded habitats for fish and wildlife. The purpose of the HEC Initiative is to create relevant new science to allow natural resource managers to better manage fish and wildlife and their habitats in the HEC. The Initiative is a binational, collaborative partnership of over 20 organizations, including government, industry, tribal and university participants. Resource managers, scientists, and other stakeholders are using a consensus-building, multidisciplinary approach to identify research themes and priorities, develop funding strategies, and increase public involvement in the Initiative.
The HEC is an important ecological, economic, and recreational resource that is subject to conflicting needs of multiple user groups. For example, over five million people live within an hour’s drive of the HEC. It is a source of drinking and process water for numerous cities and industries, and receiving waters for their waste discharges. International trade routes through the HEC move more than $80 billion in goods per year. There are over a million registered boats in Michigan, and about half of them use the HEC for fishing and other recreational activities. The Detroit River International Wildlife Refuge, Ottawa National Wildlife Refuge, and tribal lands are located within the HEC. Sixteen species of threatened or endangered fish reside in the HEC, and it is used by millions of migratory waterfowl. Five Areas of Concern (AOCs) identified by the International Joint Commission are found in the HEC. These AOCs possess 14 Beneficial Water Use Impairments, including loss of fish and wildlife habitat (Hartig et al. 1997, Manny 2003b).
To address the many challenges to the HEC, a multidisciplinary steering committee has been formed comprised of scientists, managers, and other stakeholders with a strong interest in the aquatic ecosystems of the HEC. At the organizational meeting held in February 2005, resource managers identified the scientific information needed to better manage natural resources, and goals of the Initiative were created.
Goals and Objectives of the HEC Initiative
A primary goal of the Initiative is to identify historic reference conditions and provide research to support restoration of habitat and ecosystem function. One key objective is to use historic data to quantify and model fish populations in the context of:
93
• The diversity and quantity of habitats present in the HEC prior to development, and the abundance and diversity of fish populations maintained by various habitat types
• Hydrologic flow and water depths that characterize productive habitats for valued fish species
• The juxtaposition of spawning, nursery, feeding, and home-range habitats for valued fish species in the HEC ecosystem
Initial research questions include the following considerations. How did the pre-development HEC ecosystem function, and what functional elements are still operative in the ecosystem? For example, what is the feasibility of restoring spawning habitat for valued native fishes? Can we inventory functional fish spawning, egg incubation, and nursery habitat? Can we identify, quantify, and model the connective mechanisms between life history and stage-specific habitats? Can we model the effects of water levels and flows on habitat suitability for fish? Can degraded habitats be restored? Can strategies for fish habitat restoration be developed? Lastly, how shall we assess the cumulative effects of each habitat restoration project?
Initially, scientists will compile historic data to model the pre-development ecosystem, determine reference conditions of habitats, hydrology, and fish community composition, and model ecosystem functions. Data gaps will then be modeled. The USGS will assemble its scientific data for the Corridor in digital form as information layers in a Geographic Information System. Those data can then be modeled to determine how the pre-development river system may have behaved hydrologically, sustained fish habitat, and produced large numbers of valued fish. Based on this historic assessment, it may be possible to determine which habitat types are limiting the abundance of high-value fishes in the Corridor today and where those habitats can be recreated economically. Scientific insights gained from such models could be used to manipulate the currently degraded ecosystem and restore as much ecological resiliency, biological productivity, and desirable natural resources as possible for the use and enjoyment of the public. It is likely that the restored and created habitats will be colonized by undesirable non-native species, so scientists and engineers will need to consider this factor. They will require detailed knowledge of the spawning and nursery requirements of both native and non-native fishes to enhance the productivity of native fishes while reducing that of non-native fishes. Likewise, resource managers will be challenged to manage for desirable species and against non-native species.
Proposed Research
Native fish populations in the HEC have been greatly affected by habitat alterations. Millions of tons of limestone bedrock, cobble and gravel were removed from the St. Clair and Detroit Rivers to build the cities of Detroit and Windsor and create navigation channels (Larson 1981, Figure 1). These gravel and rock substrates provided spawning and nursery habitat for lake whitefish (Coregonus clupeaformis), walleye (Sander vitreus), lake sturgeon (Acipenser fulvescens), and many other native fishes. The Livingston Channel project of the early 1900s was particularly damaging. A 19-km channel was created in the limestone bedrock sill at the mouth of the Detroit River with a minimum width and depth of 91 m and 6.7 m, respectively (Larson 1981). Although dredging had taken place

94
in that area for more than 30 years, this project greatly altered the river’s hydrology and destroyed the lake whitefish spawning grounds in the river (U.S. Bureau of Fisheries 1917, Manny et al. 1988).
The altered hydrology of the Detroit River resulting from the Livingston Channel project may be affecting fish recruitment. River discharge affects the connectivity of spawning, incubation, and nursery areas for most fishes in the lower HEC. Prior to the construction of shipping channels in the lower Detroit River, river water was discharged in a diffuse manner from the river mouth into the western basin of Lake Erie (Figure 2). Water dispersed across a wide area of the basin, including much nearshore habitat along the Michigan shoreline to the west of the river mouth as well as coastal areas to the east along the Ontario shoreline. Now the Livingston Channel in the lower Detroit River focuses discharged river water out and away from productive coastal areas into deeper, less productive offshore waters of the western basin. Characteristics of this new hydrologic pattern also include lower residence time in the river, increased discharge velocity, and possible thermal differences. We hypothesize that this alteration in river hydrology represents a major disconnect between river spawning and incubation areas and productive nursery habitats for fish in western Lake Erie.
Ongoing Research
Since 1998, the Great Lakes Science Center (GLSC), in collaboration with its partners, has conducted research to gather information needed for the successful restoration of a remnant population of native lake sturgeon in the HEC, including stock-size assessment and habitat evaluation (Hill and Manny 1999, McClain and Manny 2000, Alpena FRO 2003, MDNR 2002), spawning success and early life history (Nichols et al. 2003), extent and composition of known-active and historic-reputed spawning grounds (Manny and Kennedy 2002; Manny 2003a), sturgeon movements (Boase 2003, Caswell et al. 2004), and body burden of contaminants in lake sturgeon (Begnoche et al. 2003). The GLSC and partners are working to restore lake sturgeon populations by creating lake sturgeon spawning habitat in the Detroit River near Belle Isle to replace habitat lost to dredging. This habitat was constructed in June 2004 as part of the Belle Isle/Detroit River Sturgeon Habitat Restoration, Monitoring, and Education Project. It will be closely monitored to assess the success of the project (cf. Manny et al., Section 6.16).

95
Figure 1B. Removal of historic limestone bedrock fish spawning habitat in the lower Detroit River during the 1907 Livingston Channel project (Source: Library of Congress).
Figure 1A. Historic limestone bedrock fish spawning habitat in the lower Detroit River in the Livingston Channel prior to blasting and dredging in 1907 (Source: Library of Congress).

96
References
Alpena Fisheries Resource Office. (2003). 2001 Activities of the Central Great Lakes Binational Lake Sturgeon Group. Alpena Fishery Resources Office, U.S. Fish and Wildlife Service, Alpena, Michigan.
Begnoche, L., R. Quintel, S. Chernyak, and J. Hickey. (2003). “Survey of Chlorinated and Brominated Organic Contaminants in Great Lakes Sturgeon.” U.S. Geological Survey Great Lakes Science Center, Ann Arbor, Michigan.
Boase, J. (2003). “Integrating Sonic Tracking and GIS to Determine Habitat Selection and Benthic Prey Distribution of Adult Lake Sturgeon in Lake St. Clair.” Univ. of Michigan.
Caswell, N., D. Peterson, B. Manny, and G. Kennedy. (2004). “Spawning by Lake Sturgeon (Acipenser fulvescens) in the Detroit River.” J. Appl. Ichthyol., 20:1-6.
Hartig, J.H., M.A. Zarull, T.B. Reynoldson, G. Midol, V.A. Harris, R.G. Randall, and V.C. Cairns. (1997). “Quantifying Targets for Rehabilitating Degraded Areas of the Great Lakes.” Environmental Management, 21(5):713-723.
Hill, T.D., and B. A. Manny. (1999). Evaluation of Lake Sturgeon in the Detroit River, as Reported by Anglers. Alpena Fishery Resources Office, U.S. Fish and Wildlife Service, Alpena, Michigan.
Larson, J. (1981). A History of the Detroit District U.S. Army Corps of Engineers. U.S. Army Corps of Engineers, Detroit, Michigan.
Manny, B. 2003a. “Sturgeon Spawning Habitat in the Lake Huron-Lake Erie Waterway.” 2001 Activities of the Central Great Lakes Binational Lake Sturgeon Group. Alpena Fishery Resources Office, U.S. Fish and Wildlife Service, Alpena, Michigan.
Manny, B.A., 2003b. “Setting Priorities for Conserving and Rehabilitating Detroit River Habitats.” Honoring our Detroit River Caring for our Home. J.H. Hartig, ed. Cranbrook Institute of Science, Bloomfield Hills, Michigan, 121-139.
Manny, B and G. Kennedy. (2002). “Known Lake Sturgeon (Acipenser fulvescens) Spawning Habitat in the Channel between Lakes Huron and Erie in the Laurentian
Figure 2. Historic (diffuse) and present (direct) river discharge patterns of the Detroit River.
97
Great Lakes.” J. Appl. Ichthyol., 18:486-490.
Manny, B.A., T.A. Edsall, and E. Jaworski. (1988). The Detroit River, Michigan: An Ecological Profile. U.S. Fish and Wildlife Service, 85(7.17).
Manny, B.A., S.J. Nichols, and D.W. Schloesser. (1991). “Heavy Metals in Aquatic Macrophytes Drifting in a Large River.” Hydrobiologia, 219: 333-344.
McClain, J., and B. Manny. (2000). Evaluation of Lake Sturgeon Habitat in the Detroit River. U.S. Environmental Protection Agency.
Michigan Dept. of Natural Resources. (2002). Status of Fisheries in Michigan Waters of Lake Erie and Lake St. Clair. Mt. Clemens Fisheries Research Station, Harrison Township, Michigan.
Nichols, S.J., G. Kennedy, E. Crawford, J. Allen, J. French III, G. Black, M. Blouin, J. Hickey, S. Chernyak, R. Haas, and M. Thomas. (2003). Assessment of Lake Sturgeon (Acipenser fulvescens) Spawning Efforts in the Lower St. Clair River. J. Great Lakes Res., 29(3): 383-391.
U.S. Bureau of Fisheries. (1917). Report of the U.S. Commissioner of Fisheries for Fiscal Year Ended June 30, 1916. Bureau of Fisheries Doc. 836, Washington, D.C.

98
6.16. CREATION OF LAKE STURGEON SPAWNING HABITAT IN THE DETROIT RIVER
Bruce Manny, Great Lakes Science Center, U.S. Geological Survey, Ann Arbor, Michigan Jennifer Read, Michigan Sea Grant College Program, Ann Arbor, MichiganDouglas Denison, SmithGroup JJR, Ann Arbor, MichiganRobert Reider, DTE Energy, Detroit, MichiganGregory Kennedy, Great Lakes Science Center, U.S. Geological Survey, Ann Arbor, MichiganNathan Caswell, Carterville Fishery Resources Office, U.S. Fish and Wildlife Service, Marion, Illinois, James Boase, Alpena Fisheries Resource Office, U.S. Fish and Wildlife Service, Alpena, MichiganJerry McClain, Alpena Fisheries Resource Office, U.S. Fish and Wildlife Service, Alpena, Michigan
Overfishing, reduced access to spawning sites (due to dam construction), and destruction of habitat have decreased lake sturgeon (Acipenser fulvescens, Figure 1) in the Great Lakes to less than 1% of their former abundance; in Michigan, they are threatened with extinction (Hay-Chmeilewski and Whelan 1997). In the Detroit River, four years of set line fishing captured only 86 lake sturgeon (Caswell 2003a, b). Underwater video surveys in 1998 and 1999 showed that, due to gravel removal and silt deposition, only two of nine historic spawning sites in this river had substrate with enough interstitial space for incubation of sturgeon eggs and that no sturgeon used those sites (McClain and Manny 2000). In 2001, lake sturgeon spawned on a man-made bed of coal cinders near Zug Island in the Detroit River (Manny and Kennedy 2002; Caswell et al. 2004). This is the only place in the Detroit River where egg deposition by lake sturgeon has been
documented.
Figure 1. Gravid lake sturgeon caught in the Detroit River in 2000, held by Nathan Caswell, U.S. Fish and Wildlife Service.
Figure 2. Location of lake sturgeon spawning habitat constructed near Belle Isle in the upper Detroit River in 2004.

99
In 2002, the effluent of a large combined sewer overflow (CSO) into the Detroit River (Conner’s Creek; peak flow of 375 m3/s), located approximately 16 km upstream of Zug Island, was chlorinated for the first time (Fujita et al. 2000). Its effluent plume is located close to the Michigan shore (Arginoff, personal communication, August 20, 2002) and frequent discharges of this CSO may expose the spawning ground at Zug Island to residual chlorine during the sturgeon spawning season. Since fish eggs and sac-fry are susceptible to pollutants, we suspect that few, if any, lake sturgeon offspring have survived at Zug Island since 2001. Therefore, restoration of lake sturgeon in the Detroit River is limited by the lack of suitable spawning habitat.
In 2002, funds were awarded to Michigan Sea Grant by the Great Lakes Coastal Restoration Grant Program of NOAA (National Oceanic and Atmospheric Administration) and the Great Lakes Fishery Trust to increase sturgeon spawning habitat in the Detroit River. Habitat requirements for successful spawning by lake sturgeon in the Huron-Erie Corridor include beds of broken rock or coarse gravel that possess adequate interstitial void space to protect sturgeon eggs from dislodgment and predation; water depth > 5 m to prevent colonization of spawning substrates by aquatic plants; water velocity > 0.5 m/s; and water temperatures of 9–16º C (Manny and Kennedy 2002). Except for suitable spawning substrate, these requirements were met at an area near the head of Belle Isle.
This area was assessed in April–May of 2003 and 2004 by the U.S. Fish and Wildlife Service and the U.S. Geological Survey (USGS) using gill nets, set lines, and egg mats placed on the river bottom. No fish were caught (Great Lakes Science Center unpublished data), and only 136 walleye eggs that drifted from an area upstream were collected (Manny et al., in review). In June 2004, we constructed three sturgeon spawning beds, consisting of broken limestone, 41–61 cm in diameter; metamorphic cobble and gravel, 20–30 cm in diameter; and coal cinders, 2–8 cm in diameter. Each bed was 372 m2 in area, 0.6 m thick, and located at 7–8 m of water depth in high water velocity (0.6–1.0 m/s). Beds were located near the head of Belle Isle outside the shipping channel (Figure 2) where clean water that has descended in the shipping channel from Lake Huron deflects and accelerates off Belle Isle into the Fleming Channel. Due to the mid-channel location, the constructed spawning beds are isolated from shore-based pollution discharges.
In 2005 and 2006, set lines and gill nets will be deployed in the study area to catch lake sturgeon using the constructed spawning beds. Transmitters will be implanted in captured lake sturgeon to track their movements using ultrasonic telemetry and determine which population(s) of lake sturgeon were enhanced by the constructed spawning beds. Egg mats will be deployed on the constructed beds to collect fish eggs. Fish eggs will be removed and transported in chilled river water to the Great Lakes Science Center for hatching. Identification of fish larvae hatched from such eggs will document all fish species that deposited eggs on the constructed beds. After eggs are no longer found at the beds, USGS divers will assess the hatch of sturgeon eggs spawned on the constructed beds by disturbing the spawning substrates and collecting in drift nets any sturgeon larvae displaced, following methods of Nichols et al. (2002).
Acknowledgment
Financial support for this research was provided, in part, by Grant No. 02CR-1.19 from

100
the (NOAA) Coastal Restoration Grant Program and Grant No. 200.232 from the Great Lakes Fishery Trust to the Michigan Sea Grant College Program at the University of Michigan for the Belle Isle/Detroit River Sturgeon Habitat Restoration, Monitoring, and Education Project.
References
Caswell, N.M. (2003a). “Population Characteristics, Spawning Sites, and Movements of Lake Sturgeon (Acipenser fulvescens) in the Detroit River.” Central Michigan University, Mt. Pleasant, Michigan.
Caswell, N.M. (2003b). “Implantation of Ultrasonic Transmitters and Movements of Adult Lake Sturgeon in the Detroit River. 2001 Activities of the Central Great lakes Binational Lake Sturgeon Group. Alpena Fishery Resources Office, U.S. Fish and Wildlife Service, Alpena, Michigan.
Caswell, N.M., D.L. Peterson, B.A. Manny, and G.W. Kennedy. (2004). “Spawning by Lake Sturgeon (Acipenser fulvescens) in the Detroit River.” J. Appl. Ichthyol., 20:1-6.
Fujita, G., M. Rabbaig, G. Stoll, C. Courter, V. Korategere, and C. Hocking. (2000). “The Development of Disinfection Design Criteria for a 13,262 Cubic Feet Per Second Combined Sewer Overflow Treatment Facility.” Proceedings of the WEFTEC 2000 Conference, Water Environment Federation.
Hay-Chmielewski, E.M. and G.E. Whelan. (1997). Lake Sturgeon Rehabilitation Strategy, Michigan Department of Natural Resources, Ann Arbor, Michigan.
Manny, B.A. and G.W. Kennedy. (2002). “Known Lake Sturgeon (Acipenser fulvescens) Spawning Habitat in the Channel between Lakes Huron and Erie in the Laurentian Great Lakes.” J. Appl. Ichthyol., 18:486-490.
Manny, B.A., G.W. Kennedy, J.D. Allen, and J.R.P. French, III. “First Evidence of Egg Deposition by Walleye, Sander vitreus, in the Detroit River.”
McClain, J. and B.A. Manny. (2000). “Evaluation of Lake Sturgeon Habitat in the Detroit River.” Alpena Fisheries Resources Office, U.S. Fish and Wildlife Service, Alpena, Michigan.
Nichols, S., G. Kennedy, E. Crawford, J. Allen, J. French III, G. Black, M. Blouin, J. Hickey, S. Chernyak, R. Haas, and M. Thomas. (2002). “Assessment of Lake Sturgeon (Acipenser fulvescens) Spawning Efforts in the Lower St. Clair River, Michigan.” J. Great Lakes Research, 29(3):383-391.
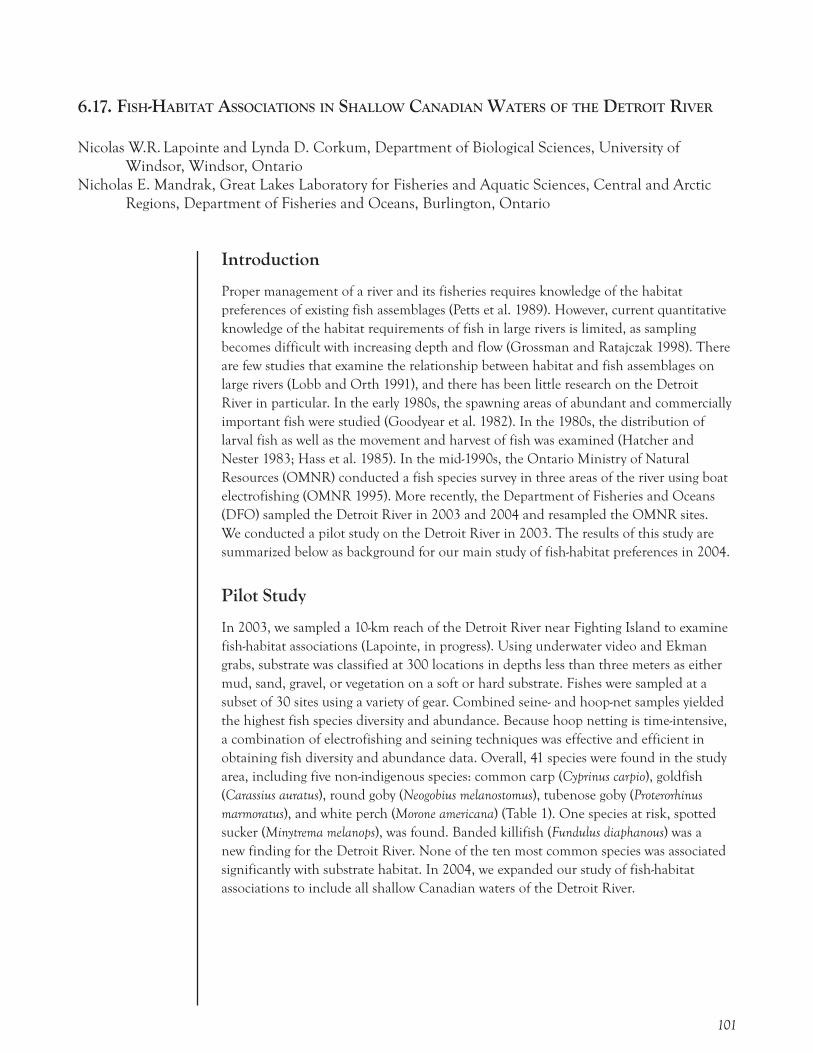
101
6.17. FISH-HABITAT ASSOCIATIONS IN SHALLOW CANADIAN WATERS OF THE DETROIT RIVER
Nicolas W.R. Lapointe and Lynda D. Corkum, Department of Biological Sciences, University of Windsor, Windsor, Ontario Nicholas E. Mandrak, Great Lakes Laboratory for Fisheries and Aquatic Sciences, Central and Arctic Regions, Department of Fisheries and Oceans, Burlington, Ontario
Introduction
Proper management of a river and its fisheries requires knowledge of the habitat preferences of existing fish assemblages (Petts et al. 1989). However, current quantitative knowledge of the habitat requirements of fish in large rivers is limited, as sampling becomes difficult with increasing depth and flow (Grossman and Ratajczak 1998). There are few studies that examine the relationship between habitat and fish assemblages on large rivers (Lobb and Orth 1991), and there has been little research on the Detroit River in particular. In the early 1980s, the spawning areas of abundant and commercially important fish were studied (Goodyear et al. 1982). In the 1980s, the distribution of larval fish as well as the movement and harvest of fish was examined (Hatcher and Nester 1983; Hass et al. 1985). In the mid-1990s, the Ontario Ministry of Natural Resources (OMNR) conducted a fish species survey in three areas of the river using boat electrofishing (OMNR 1995). More recently, the Department of Fisheries and Oceans (DFO) sampled the Detroit River in 2003 and 2004 and resampled the OMNR sites. We conducted a pilot study on the Detroit River in 2003. The results of this study are summarized below as background for our main study of fish-habitat preferences in 2004.
Pilot Study
In 2003, we sampled a 10-km reach of the Detroit River near Fighting Island to examine fish-habitat associations (Lapointe, in progress). Using underwater video and Ekman grabs, substrate was classified at 300 locations in depths less than three meters as either mud, sand, gravel, or vegetation on a soft or hard substrate. Fishes were sampled at a subset of 30 sites using a variety of gear. Combined seine- and hoop-net samples yielded the highest fish species diversity and abundance. Because hoop netting is time-intensive, a combination of electrofishing and seining techniques was effective and efficient in obtaining fish diversity and abundance data. Overall, 41 species were found in the study area, including five non-indigenous species: common carp (Cyprinus carpio), goldfish (Carassius auratus), round goby (Neogobius melanostomus), tubenose goby (Proterorhinus marmoratus), and white perch (Morone americana) (Table 1). One species at risk, spotted sucker (Minytrema melanops), was found. Banded killifish (Fundulus diaphanous) was a new finding for the Detroit River. None of the ten most common species was associated significantly with substrate habitat. In 2004, we expanded our study of fish-habitat associations to include all shallow Canadian waters of the Detroit River.

102
Table 1. Fish species found in middle Detroit River 2003 (Lapointe, unpublished data)
Scientifi c Name Common NameTotal Abundance (Out of ~2500 Fishes) Status1,2,3
Notropis hudsonius Spottail Shiner 722 IPimephales notatus Bluntnose Minnow 441 IPerca fl avescens Yellow Perch 402 ILepomis fry Sunfi sh Fry 103 IAmbloplites rupestris Rock Bass 102 IMicropterus salmoides Largemouth Bass 92 ILabidesthes sicculus Brook Silverside 84 ILepomis macrochirus Bluegill 78 ILepomis gibbosus Pumpkinseed 68 INotropis volucellus Mimic Shiner 62 IDorosoma cepedianum Gizzard Shad 59 INotropis atherinoides Emerald Shiner 51 IMorone americana White Perch 47 NIMicropterus dolomieu Smallmouth Bass 42 ICatostomus commersonii White Sucker 33 ICyprinus carpio Common Carp 23 NICyprinella spiloptera Spotfi n Shiner 18 INotemigonus crysoleucas Golden Shiner 18 ILepisosteus osseus Longnose Gar 16 ILuxilus chrysocephalus Striped Shiner 10 INeogobius melanostomus Round Goby 10 NIAmia calva Bowfi n 8 IMorone chrysops White Bass 8 IPercina caprodes Logperch 8 IEsox masquinongy Muskellunge 6 ICarassius auratus Goldfi sh 6 NIPomoxis nigromaculatus Black Crappie 5 IEtheostoma nigrum Johnny Darter 5 IAmeiurus melas Black Bullhead 3 IEsox lucius Northern Pike 3 IHypentelium nigricans Northern Hogsucker 3 IIctalurus punctatus Channel Catfi sh 3 IFundulus diaphanus Banded Killifi sh 2 NRProterorhinus marmoratus Tubenose Goby 2 NISander vitreus Walleye 2 INocomis biguttatus Hornyhead Chub 2 IMoxostoma anisurum Silver Redhorse 1 IAmeiurus natalis Yellow Bullhead 1 IAmeiurus nebulosus Brown Bullhead 1 IAplodinotus grunniens Freshwater Drum 1 IMinytrema melanops Spotted Sucker 1 SARPercopsis omiscomaycus Trout-Perch 1 I
1 I = Indigenous2 NI = Non-indigenous3 SAR = Species at risk

103
Objectives
Habitat preference must be studied at multiple spatial scales, as habitat choice by fishes depends on both small and large scale processes (Lamouroux et al. 1999). Assessing the impacts of human development of waterways on fishes requires quantitative assessments of habitat preferences (Bain 1995). To correct for anthropogenic modifications and invasions, native species habitat should be enhanced and invasive species habitat should be reduced (Gido and Prost 1999).
Our objectives in 2004 were to evaluate the microhabitat and macrohabitat preferences of fishes throughout the Canadian waters of the Detroit River. Our results will be
Figure 1. Inshore and offshore (> 15 m from shore) fish sampling sites in shallow Canadian waters of the Detroit River by river segment. (Lapointe, unpublished data).

104
published in the primary literature, and will be potentially useful for conservation or restoration projects in the Detroit River. We hypothesized that spatially distinct river segments influenced by different tributaries would have different fish assemblages (Figure 1). We predicted that inshore areas would show higher fish diversity and abundance than offshore areas of similar depths (Figure 1). On the microhabitat scale, we hypothesized that a suite of abiotic factors (flow, substrate, macrophytes, temperature, etc.) could be used to predict fish distributions. We also predicted that natural shorelines would have higher fish diversity and abundance than modified shorelines (retaining walls, bank armouring, lawns, etc.). Finally, we expected changes in fish distribution with season due to macrophyte growth and shifts in relative abundance of fishes with the appearance of juveniles.
Methods
In 2004, fishes were sampled at 60 randomly selected sites, 30 inshore (located along a shoreline) and 30 offshore (>15 m from shore) (Figure 1). These represented three (upstream, middle, and downstream) segments of the Detroit River and were sampled in May, July, and September. Where possible, sites from 2003 were included in the study. Coordinates were recorded using a GPS unit at each site. Shoreline features and riparian zone land use were recorded for inshore sites, and microhabitat features were measured at all sites. Fishes were sampled using seine nets and boat electrofishing. Captured fishes were counted and identified by species. The length of up to 30 fish of each species was measured at each site.
Results
Currently, data are being prepared for analysis. However, initial results suggest different assemblages are associated with microhabitat features, season, and distance from shore (i.e. inshore versus offshore sites). Associations with river segment and riparian features do not appear to be as strong. Spring seining data showed higher abundance and species diversity at inshore versus offshore sites, and lower species diversity and abundance in the upstream segment compared to downstream areas. Overall, 45 species were found in 2004, including three additional non-indigenous species not found in 2003: alewife (Alosa pseudoharengus), rainbow smelt (Osmerus mordax), and threespine stickleback (Gasterosteus aculeatus) (Table 2). Two species at risk, spotted sucker (Minytrema melanops) and pugnose minnow (Opsopoeodus emiliae), were found. Longear sunfish (Lepomis megalotis) was recorded as a new finding for the Detroit River.

105
Table 2. Fish species list, Detroit River 2004 (Lapointe, unpublished data)
Scientifi c Name Common NameTotal Abundance (Out of ~ 40,000 Fishes) Status1,2,3
Notropis atherinoides Emerald Shiner 25083 IDorosoma cepedianum Gizzard Shad 2654 INotropis hudsonius Spottail Shiner 2365 IPerca fl avescens Yellow Perch 1963 INotropis volucellus Mimic Shiner 1562 IPimephales notatus Bluntnose Minnow 1020 INeogobius melanostomus Round Goby 917 NIMorone chrysops White Bass 466 ILepomis macrochirus Bluegill 442 IMicropterus salmoides Largemouth Bass 423 IMorone americana White Perch 398 NIAmbloplites rupestris Rock Bass 365 ILuxilus chrysocephalus Striped Shiner 324 ICyprinella spiloptera Spotfi n Shiner 281 ILabidesthes sicculus Brook Silverside 273 ILepomis gibbosus Pumpkinseed 263 IOsmerus mordax Rainbow Smelt 134 NIAlosa pseudoharengus Alewife 130 NINocomis biguttatus Hornyhead Chub 98 INotemigonus crysoleucas Golden Shiner 89 IMicropterus dolomieu Smallmouth Bass 87 ILepomis megalotis Longear Sunfi sh 72 IPercina caprodes Logperch 69 ICyprinus carpio Common Carp 38 NILepomis fry Lepomis fry 35 IEtheostoma nigrum Johnny Darter 30 IFundulus diaphanus Banded Killifi sh 23 IMorone fry Morone Fry 22 IProterorhinus marmoratus Tubenose Goby 22 NIPercopsis omiscomaycus Trout-Perch 20 IPomoxis nigromaculatus Black Crappie 15 ILepomis hybrid Sunfi sh Hybrid 13 ICatostomus commersonii White Sucker 12 IAplodinotus grunniens Freshwater Drum 10 ICarassius auratus Goldfi sh 6 NIEsox lucius Northern Pike 5 IMoxostoma sp. Redhorse sp. 5 IPimephales promelas Fathead Minnow 5 IGasterosteus aculeatus Threespine Stickleback 4 NIAmeiurus melas Black Bullhead 3 IMinytrema melanops Spotted Sucker 3 SARMoxostoma anisurum Silver Redhorse 3 IOpsopoeodus emiliae Pugnose Minnow 3 SAREsox masquinongy Muskellunge 2 IMoxostoma erythrurum Golden Redhorse 2 IAmia calva Bowfi n 1 I

106
Lepisosteus osseus Longnose gar 1 IMoxostoma macrolepidotum Shorthead Redhorse 1 ISander vitreus Walleye 1 I
1 I = Indigenous2 NI = Non-indigenous3 SAR = Species at risk
Recommendations
Habitat preferences of fishes in Canadian waters of the Detroit River will likely match those of fishes in American waters. However, before the results of this study can be applied to American waters, it must first be determined that habitats available in American and Canadian waters match. Any habitats unique to American waters would have to be studied separately before fish species preferences could be determined.
Habitat availability (and therefore fish species distributions) may change from year to year, along with relative abundance of fish species. It would therefore be beneficial to monitor a sub-sample of representative sites to study how changes in environmental conditions, flow, and water levels affect fish species distributions.
Despite these limitations, the results of this study will aid in determining which habitats are most important in preserving species diversity and abundant populations. Knowledge of the habitat preferences of individual species will provide opportunities for species-specific management, such as the reduction of invasive species.
References
Bain, M.B. (1995). “Habitat at the Local Scale: Multivariate Patterns for Stream Fishes,” B.Fr. Peche Piscic. 337/338/339:165-177.
Gido, K.B. and D.L. Prost. (1999). Habitat Use and Association of Native and Nonnative Fishes in the San Juan River, New Mexico and Utah.» COPEIA, 2:321-332.
Goodyear, C.S, T.A. Edsall, D.M. Ormsby Dempsey, G.D. Moss, and P.E. Polanski. (1982). Atlas of the Spawning and Nursery Areas of Great Lakes Fishes Volume 8: Detroit River, U.S. Fish and Wildlife Service, Washington, D.C.
Grossman, G.D. and R.E. Ratajczak. (1998). «Long-Term Patterns of Microhabitat Use by Fish in a Southern Appalachian Stream from 1983 to 1992: Effects of Hydrologic Period, Season and Fish Length.» Ecol. Freshw. Fish., 7:108-131.
Hass, R.C., W.C. Bryant, K.D. Smith, and A.J. Nuhfer. (1985). Movement and Harvest of Fish in Lake St. Clair, St. Clair River, and Detroit River, Michigan Department Natural Resource.
Hatcher, C.O. and R.T. Nester. (1983). Distribution and Abundance of Fish Larvae in the St. Clair and Detroit River, U.S. Fish and Wildlife Service Great Lakes Fisheries Lab, Ann Arbor, Michigan
107
Lamouroux, N., H. Capra, M. Pouilly, and Y. Souchon. (1999). «Fish Habitat Preferences in Large Streams of Southern France,» Freshwater Biol., 42:673-687.
Lapointe, N.W.R. «Fish-Habitat associations in Shallow Canadian Waters of the Detroit River.» University of Windsor, Windsor, Ontario.
Lobb, M.D. and D.J. Orth. (1991). «Habitat Use by an Assemblage of Fish in a Large Warmwater Stream.» T. Am. Fish. Soc., 120:65-78.
Petts, G.E., J.G. Imhof, B.A. Manny, J.F.B. Maher, and S.B. Weisberg. (1989). «Management of Fish Populations in Large Rivers: A Review of Tools and Approaches.»
Canadian Special Publication of Fisheries and Aquatic Sciences, 106:578-588.
Ontario Ministry of Natural Resources. (1995). Survey of Candidate Sites on the St. Clair and Detroit Rivers for Potential Habitat Rehabilitation/Enhancement, <http://www.epa.gov/glnpo/ecopage/omnr_habitat/omnr_habitat.pdf>.

108
6.18. WHOLE-WATER SAMPLING TECHNIQUES FOR THE DETERMINATION OF TRACE MERCURY AND TRACE METAL CONCENTRATIONS THAT DO NOT REQUIRE IN-FIELD CLEAN-ROOM FACILITIES
Robert McCrea, Niels Madsen, Robert Reid, Greg Lawson, Gino Sardella, Mary Lou Archer, Environment Canada, Canada Centre for Inland Waters, Burlington, Ontario
Introduction
Several water-sampling systems, known as ISOMET (isolation sampler for trace metals), have been designed by Environment Canada for the collection of reliable whole-water trace metal samples. The strategy was to develop simple and effective isolation and containment methodologies for the complete monitoring cycle: from the preparation stage, through field sampling, to analyses in the laboratory. The ISOMET samplers were developed specifically for mercury and trace metal monitoring such that they would be suitable for ultra-low level and contaminated-site sampling. These samplers are simple to use and do not require clean facilities in the field, even for sampling Great Lakes surface waters with the lowest environmental concentrations.
Applications and Methods
The ISOMET samplers weigh less than five kg. They can be operated manually in small boats, by wading, and under ice with the ISOMET-ML (manual operation), or remotely suspended from an all-plastic winch system for sampling off vessels and bridges with the ISOMET-EL (electronic operation). Rigid PFA (perfluoroalkoxy) 180 mL containers that can withstand eight atmospheres of pressure are used for both trace metal and mercury sampling. For trace metal sampling, the containers are first prepared in a clean-air workstation and then stored double-nested in clean, rigid isolation containers. In the field, the Teflon containers are then mounted onto the ISOMET sampler, opened and closed underwater, and then immediately returned to their isolation container. Exposure in the field is therefore limited to the water being sampled. In the lab, samples are acidified in a clean workstation, and later digested within their original “closed” sample containers while stored within isolation containers.
Performance Assessment and Results
In a comparison study conducted in Lake Ontario (2002), ISOMET-EL derived samples were compared with results obtained from samples collected with a GO-FLO sampler (General Oceanics Inc.) that was used in conjunction with a clean room on board the CSS Limnos Research Vessel. Essentially, identical mean whole-water mercury concentrations were obtained from samples collected with the GO-FLO and ISOMET-EL samplers; Flett Research and Frontier GeoScience Laboratories performed the analyses. The mean concentration for each of these sample sets, taken at a Lake Ontario master station, was 0.37 ng/L. Whole-water mercury concentrations from ten open-water sites sampled throughout Lake Ontario in 2002 showed little variability (0.38 ± 0.03 ng/L). A similar comparison for a wide range of trace metals also indicated good agreement between the GO-FLO and ISOMET samplers. Combined, these results indicate that

109
representative ultra-trace samples can be collected effectively without clean facilities in the field.
A performance assessment of the ISOMET-EL and ISOMET-ML was conducted from the CSS Shark, in the western basin of Lake Ontario with a set of seven replicates collected with each sampler. In terms of cadmium, the same mean concentration (0.016 ug/L) was found with both samplers, and the standard deviation of these means was also identical (0.001 ug/L) and equivalent to the analytical detection limit. The percent coefficient of variance, for both the ISOMET-EL and ISOMET-ML samplers, was small for other trace metal concentrations (Cr 3% and 4%; Cu 1% and 4%; Ni 4% and 5%). Of all the metals investigated, zinc is one of the most common due to its wide use in personal care products, such as shampoos and hand creams, as well as in metal structures and components. Although it is not a toxic metal at ambient environmental concentrations, this parameter can serve as a sentinel for the effectiveness for water quality sampling protocols. Results of the replicate sampling revealed virtually the same mean zinc concentration (EL: 0.34 and ML 0.35 ug/L), and the variance was less than the detection limit (0.05 ug/L). These results show that trace metals can be measured with good precision by both the ISOMET-EL and ISOMET-ML samplers and confirm that samples can be collected without contamination using these methods.
In 2003, whole-water samples were collected in the open waters of Lake Superior (n=7), Lake Huron (n=5), and Lake Ontario (n=7) with the ISOMET sampler. The mean cadmium concentrations were 0.009, 0.007, and 0.015 ug/L, respectively. In all cases, the standard deviation was 0.001 ug/L. Similarly, chromium exhibited little variation in the open-waters of the Great Lakes, with percent coefficients of variance of 9%, 4%, and 5%, respectively.
Conclusions
Little training is required to operate the ISOMET samplers, and they can be used to support a wide range of sampling activities. The ISOMET sampling system has a very modest start-up cost in comparison with traditional clean techniques that utilize clean-air workstations in the field. The ISOMET samplers routinely yield valid samples, and false-positive non-compliant data are effectively mitigated. As a result, the need for follow-up sampling is reduced. In addition, a more accurate representation of the “real” spatial distribution and temporal variance of mercury and trace metal concentrations is discernible. The ISOMET sampling system is being widely used by Environment Canada and the Ontario Ministry of the Environment for sampling in the Great Lakes and Detroit River as well as by government agencies in British Columbia and the Yukon. In addition, lay collectors can now conduct compliance monitoring for the most stringent of water quality guidelines for highly toxic metals virtually anywhere.
110
6.19. MAKING CHRISTMAS COUNT
A Poster about DTE Energy’s Monroe Power Plant and Its Participation in the Christmas Bird CountTimothy Walsh and Roberta Urbani, DTE Energy, Detroit, Michigan
Introduction
The National Audubon Society Christmas Bird Count was established in 1900 and has become an annual global event attracting more than 50,000 observers in nearly 2,000 separate events. The primary objective of the Christmas Bird Count (CBC) is to monitor the status and distribution of bird populations across the Western Hemisphere. The CBC takes place between mid-December and early January. During the specified weeks, birding organizations around the world conduct similar day-long (24-hour) counts. The count period is referred to as “early winter,” because many birds at this time are still in the late stages of their southward migration.
History
In the late 1890s, sportsmen engaged in a holiday tradition of competitive team hunts known as the Christmas “Side Hunt.” The winning team was the one that brought in the biggest pile of dead birds and other animals. The spirit of conservation was just being born, and many observers and scientists were concerned about declining bird populations. Beginning on Christmas Day 1900, ornithologist Frank Chapman, an early officer in the Audubon Society, proposed a new holiday tradition that would count birds instead of hunting them. This count was originally called the “Christmas Bird Census” and later became known as the Christmas Bird Count. The first CBC involved 27 dedicated birders taking part in 25 different events in New England and as far away as Toronto, Ontario, and Pacific Grove, California.
The Monroe Power Plant Christmas Bird Count
The Monroe Power Plant has been participating in the Christmas Bird Count since 1978. The count is sponsored by the National Audubon Society and coordinated locally by the Erie Shores Birding Association and employees from Detroit Edison’s Monroe Power Plant. The Monroe Power Plant is located near the intersection of the Atlantic and Mississippi flyways of the North American flyway system, which makes it an excellent location for observing migrating birds. The Monroe regional count focuses on a 11.3 km (seven-mile) radius around the point where Woodchuck Creek meets Lake Erie on the plant’s property.
Past counts at the Monroe Power Plant have identified a colony (more than one nest) of bald eagles in the area (Table 1). Also, rare birds such as the Arctic gull and ivory gull have been observed during the count. On average, more than three dozen different species of birds have been counted at the Monroe Power Plant. Complete bird count data for 1998 to 2002 CBCs is given in Table 1. The plant is also home to many other species of animals and plants and has been certified as a wildlife site by the Wildlife Habitat Council since 1999.

111
Value of the Christmas Bird Count
The Christmas Bird Count (CBC) is “citizen science” in action. The results of the counts are compiled into the longest-running database in ornithology, representing over a century of continuous data. This information can be used to reveal trends in early-winter bird populations across the Western Hemisphere. By combining the CBC data with other surveys such as the Breeding Bird Survey, scientists can begin to see a clearer picture of how the continent’s bird populations have moved and changed over the past hundred years. The information is also vital for conservation efforts. For example, local trends in bird populations can indicate habitat fragmentation or signal an immediate environmental threat, such as groundwater contamination or poisoning from improper use of pesticides.
The Monroe Power Plant and other CBCs will continue to provide important data to contribute to our understanding of our natural environment and early-winter bird populations. For more information, please visit the DTE Energy and National Audubon websites at www.dteenergy.com and www.audobom.org/birg/cbc.
Table 1. Monroe Power Plant Christmas Bird Count Observations (1998 to 2002).
Year of observation:Species Scientifi c name 1998 1999 2000 2001 2002Double-crested Cormorant Phalacrocorax auritus 29 30 35 32 84Great Blue Heron Ardea herodias fannini 1 131 100 36 48Tundra Swan Cygnus columbianus 26Canada Goose Branta canadensis
occidentalis2 13 50 199
American Black Duck Anas rubripes 2 10 16Mallard Anas platyrynchos 22 14 4 12Common Goldeneye Bucephala clangula 25 27Buffl ehead Bucephala albeola 2Hooded Merganser Lophodytes cucullatus 6Common Merganser Mergus merganser 100 150 40Red-breasted Merganser Mergus serrator 55 100 5200 236Northern Harrier Circus cyaneus 1Red-tailed Hawk Buteo jamaicensis 2 7 3 3American Kestrel Falco sparverius 2 1 1Peregrin Falcon Falco peregrinus 1 1 2Bald Eagle Haliaeetus leucocephalus 13 3 25Ring-necked Pheasant Phasianus colchicus 2American Coot Fulica americana 4Bonaparte’s Gull Larus philadelphia 6 25Ring-billed Gull Larus delawarensis 228 75 160Herring Gull Larus argentatus 703 1200 875 139 1950Greater Black-backed Gull Larus marinus 30 50 51 58 3Rock Dove Columba livia 43 100 103 74 387Mourning Dove Zenaida macroura 1 1 4Belted Kingfi sher Ceyrle alcyon 1 3 1 1

112
Downy Woodpecker Picoides pubescens 3 2 3 5Blue Jay Cyanocitta cristata 1 4Black-capped Chickadee Poecile atricapillus 5 5Red-breasted Nuthatch Sitta canadensis 1Golden-Crowned Kinglet Regulus satrapa 2American Robin Zenaida macroura 1 2European Starling Sturnus vulgaris 8 5 40 37 96Northern Cardinal Cardinalis cardinalis 3 2 14 11 15American Tree Sparrow Spizella arborea 42 2 7 59 10Song Sparrow Melospiza melodia 3 18Dark-eyed Junco Junco hyemalis 4 5 30Red-winged Blackbird Agelaius phoeniceus 2Common Grackle Quiscalus quiscula 2American Goldfi nch Carduelis tristis 7 2House Sparrow Passer domesticus 6Scaup sp. Aythya sp. 15
Total Number of Birds 1177 1854 6686 551 3376Total Number of Species 15 19 25 24 30

113
APPENDIX I: CONFERENCE PROGRAM
8:00 REGISTRATION, POSTER AND DISPLAY SET-UP
9:00 Welcoming remarks
Dr. Ross Paul, University of Windsor Mr. Rocco Delvecchio, Canadian Consulate General
9:15 Keynote address: Monitoring for Sound Management
John Gannon, International Joint Commission
9:45 Introductory remarks: Monitoring the Detroit River
Robert McCrea, Environment Canada
10:05 BREAK
SESSION I. TRADITIONAL MONITORING
Moderator: Charlie Bristol, Bristol Technical Services, Inc.
10:30 Utilization of Water Quality Monitoring Data to Support the City of Detroit’s Long Term Combined Sewer Overflow Control Plan
Imad Salim, Wade Trim, Mirza Rabbaig, Detroit Water and Sewerage Dept., Tony Igwe, Wade Trim, and Julie Aichler, CDM
10:50 City of Windsor Pollution Control Services Monitoring Plan for Pollution Control and Prevention
Paul Drca, City of Windsor
11:10 Rouge River Water Quality: A Decade of Progress
Colleen Hughes, CDM, Kelly Cave, Wayne County Dept. of Environment, Joe Rathbun, Michigan Department of Environmental Quality, and Chris Catalfio, Applied Science, Inc.
11:30 Monitoring in Support of Modeling
Ken Drouillard, Great Lakes Institute of Environmental Research, University of Windsor
12:00 LUNCH, POSTER AND DISPLAY SESSION

114
SESSION II. BIOMONITORING
Moderator: John Hartig, U.S. Fish and Wildlife Service
1:00 Fish and Fisheries of the Detroit River
Timothy B. Johnson, Don MacLennan, and Stan Powell, Ontario Ministry of Natural Resources, Robert C. Haas, Michigan Department of Natural Resources
1:20 Hawk Migration Studies by Southeastern Michigan Raptor Research at the Detroit River Mouth
Paul Cypher, Southeastern Michigan Raptor Research
1:40 Aerial Canvasback Survey of Lake St. Clair, Detroit River and Western Lake Erie
Joseph Robison, Michigan Department of Natural Resources
2:00 Trends in Bald Eagle Population Size and Productivity along the Detroit River and on the North Shore of Lake Erie
Dawn K. Laing and Debbie S. Badzinski, Bird Studies Canada
2:30 BREAK, POSTER AND DISPLAY SESSION
SESSION III. VOLUNTEER MONITORING
Moderator: Melanie Coulter, Detroit River Canadian Cleanup
3:00 Citizens in Action: Christmas Bird Counts and Project FeederWatch
Sarah Rupert, Point Pelee National Park of Canada
3:20 Rouge River Volunteer Frog and Toad Survey
Sally Petrella, Friends of the Rouge
3:40 Stream Team: Ten Years of Downriver Watershed Monitoring
Bruce Szczechowski and John Nasarzewski, Stream Team, Southgate Anderson High School
4:00 The Marsh Monitoring Program: Monitoring theEcological Integrity of Wetlands in Great Lakes Areas of Concern
Tara L. Crewe, Bird Studies Canada
4:30 Closing remarks
John Hartig, U.S. Fish and Wildlife Service
Jan Ciborowski, University of Windsor
5:00-6:00 RECEPTION
115
APPENDIX II: LIST OF CONFERENCE DISPLAYS
Bird Studies Canada
The Bird Studies Canada display provided a quick and easy introduction to Bird Studies Canada and its mandates. It showcased two programs (Marsh Monitoring Program and Destination Eagle) being presented at the SOS conference. Both presenters were on site to discuss and promote programs as well as to aid in answering questions. http://www.bsc-eoc.org
Canada-Ontario Agreement Respecting the Great Lakes Basin Ecosystem
Ontario Ministry of Natural Resources (MNR)
Two displays were presented. One detailed MNR’s work with partners to protect and restore the Great Lakes. The second illustrated MNR projects to protect and restore Lake Erie by protecting biodiversity, restoring fish and wildlife, and enhancing knowledge.
For information related to both displays, see: http://www.ene.gov.on.ca/envision/water/greatlakes/index.htm.
Citizens’ Initiatives for the Detroit River
Citizens Environment Alliance of Southwestern Ontario
The Detroit River remains one of the most heavily polluted waterways in the Great Lakes basin. The Citizens Environment Alliance of Southwestern Ontario insists that all levels of government and industry work with the public towards the principles of the Great Lakes Water Quality Agreement. http://www.citizensenvironmentalliance.org
Detroit River Canadian Cleanup (DRCC)
The DRCC is the Canadian organization responsible for implementing theDetroit River Remedial Action Plan (RAP). As part of the overall RAP effort, theDRCC aims to provide information to the public about the Detroit River Areaof Concern and the activities being undertaken to improve it. http://www.detroitriver.ca
Detroit River Common Tern Project
Stream Team
This project was a cooperative effort led by the Stream Team, who presented information about common tern habitat restoration at the Wayne County Grosse Ile Free Bridge, as well as population and contaminant data from the past two years in the Detroit River. The project has received support from Friends of the Detroit River, Grosse Ile Nature

116
Conservancy, DTE Green Team, and the Great Lakes Institute of Environmental Research.
DTE Energy and the Detroit River International Wildlife Refuge
DTE Energy
DTE Energy’s four facilities located within the Detroit River International Wildlife Refuge were featured in this display: the River Rouge, Trenton Channel, Fermi 2 and Monroe Power Plants. The display had large photos of wildlife and plants found at each (peregrine falcon, monarch butterfly, American lotus and red fox) plus information about the facility (size, electrical generation capacity) and its history as a Wildlife Habitat Council-certified site. http://www.energy.com
Detroit Water and Sewerage Department
Information was provided on water quality issues, water conservation, and the work of the Detroit Water and Sewerage Department. http://www.dwsd.org
Fighting Island Site
BASF Corporation
This display detailed the restoration of Fighting Island with the help of the community.
Friends of the Detroit River
The Friends of the Detroit River is a nonprofit 501c(3) organization that is actively involved in environmental issues along the Detroit River. Its display showed many past projects, such as the Saving of Humbug Marsh, along with the new Detroit Riverkeeper program, and many other issues on which work is being done. http://www.detroitriver.org
Friends of the Rouge Programs
Friends of the Rouge is a nonprofit organization dedicated to restoration and stewardship of the Rouge River Watershed that drains the west side of Detroit and its north and west suburbs. Programs include two volunteer monitoring programs (frog and toad survey and benthic macroinvertebrate survey), a school-based water quality monitoring program, an annual cleanup, storm-drain stenciling, and a riparian corridor management educational program. http://www.therouge.org
Stream Team
The Stream Team is a collaborative effort of over 50 school and community organizations committed to environmental monitoring and ecological restoration in Michigan’s downriver watershed. Formed in 1993 as an offshoot of the grassroots organization Downriver Citizens for a Safe Environment (DCSE), the Stream Team has been involved in numerous monitoring and community service projects, including heavy metals testing,

117
fecal coliform counts, biological control of purple loosestrife, stream bank stabilization, aquatic invertebrate sampling, tree planting and removal of garbage from local waterways. See Szczechowski and Nasarzewski, Section 6.11 for more information.
Gibraltar Bay Reconstruction Project
NativescapeLLC
and The Grosse Ile Nature and Land Conservancy
About 97 percent of the natural coastal wetland habitats along the Detroit River have been lost due to development and hard engineering to stabilize shorelines. The Grosse Ile Nature and Land Conservancy retained Nativescape to create a natural, emergent 1187-foot shoreline along Gibraltar Bay at the south end of the island of Grosse Ile in the mouth of the Detroit River. The shoreline reconstruction used state-of-the-art soft engineering techniques and native plants to reduce erosion, stabilize shoreline, enhance wildlife habitat and improve aesthetics and water quality cost-effectively. http://www.nativescape.net and http://www.ginlc.org. Another site about the project is http://www.tellusnews.com/ahr/art/pdf/GrosseIleNewsRelease.pdf
Golder Associates
For more than 40 years, Golder Associates has been helping clients discover, produce, transport, manage, control and treat water. By combining technical expertise with an understanding of client and stakeholder needs, they help to find and implement sustainable solutions. And with a global network of scientists and engineers, Golder engages technologies and new ideas from many diverse environments and cultures. http://www.golder.com
International Joint Commission and the Great Lakes Water Quality Agreement
The International Joint Commission’s Great Lakes Regional Office in Windsor, Ontario, provides administrative support for the binational boards and their sub-organizations that were created to assist the Canadian and U.S. governments in implementing the Great Lakes Water Quality Agreement. The Office also conducts a public information service for the Commission and its boards. http://www.ijc.org
Michigan Sea Grant
Michigan Sea Grant, a joint program of the University of Michigan and Michigan State University, promotes greater knowledge of the Great Lakes through education, research and outreach. Michigan Sea Grant is part of the larger National Sea Grant College Program, a network of 30 university-based programs in coastal states across the United States.
Sea Grant is an active partner in the improvement and enhancement of the Detroit River and a sponsor of the State of the Strait events. Its conference display focused on Sea Grant’s overall Great Lakes research program and involvement in Detroit River issues including fisheries health and sustainability, aquatic invasive species, habitat

118
improvement, soft shoreline engineering, brownfield redevelopment, and Great Lakes education. http://www.miseagrant.umich.edu
Ontario Public Interest Research Group (OPIRG) Windsor Environmental Group
OPIRG Windsor is committed to environmental protection and restoration through public participation. http://opirg.uwindsor.ca
RPO DataView
Wayne County Department of the Environment
An easy-to-use data exploration, dissemination and analysis tool. http://www.rougeriver.com
Southeast Michigan Peregrine Falcons
Judith M. Yerkey, Detroit Peregrine Coordinator (retired)
This display featured Judy Yerkey’s accumulated 17 years of research monitoring the peregrine falcons of southeast Michigan. As a Michigan Department of Natural Resources grantee, Yerkey observed and recorded the activities of numerous peregrine falcons at sites including downtown and midtown Detroit, River Rouge, and Monroe. The display featured an abundance of photos, and her meticulous records illustrated her ground-breaking research combined with her engaging, accessible presentation style. http://www.geocities.com/macomb audubon and click on the Peregrine Page.
Surface Water Quality Monitoring and Clean Water – Green Spaces
Essex Region Conservation Authority (ERCA)
In 2002, ERCA released its first Surface Water Quality Report Card, and 33 of 35 regional testing sites were deemed to have “poor” or “very poor” water quality. In an effort to accelerate the pace towards creating a sustainable region, ERCA developed the Clean Water – Green Spaces initiative. This focuses on achieving 12% natural areas coverage and surface water quality that meets provincial standards within a generation. http://www.erca.org
Wade Trim Detroit River Projects
Wade Trim
Projects featured include Riverside Park Waterfront Promenade Improvements, Downriver Linked Greenways Initiative, Belle Isle Restoration Study, Detroit Long Term Combined Sewer Overflow Control Plan, Detroit River Master Plan for a Linked Greenway Corridor, Conner Creek Dredging, and Detroit East Riverwalk. http://www.wadetrim.com
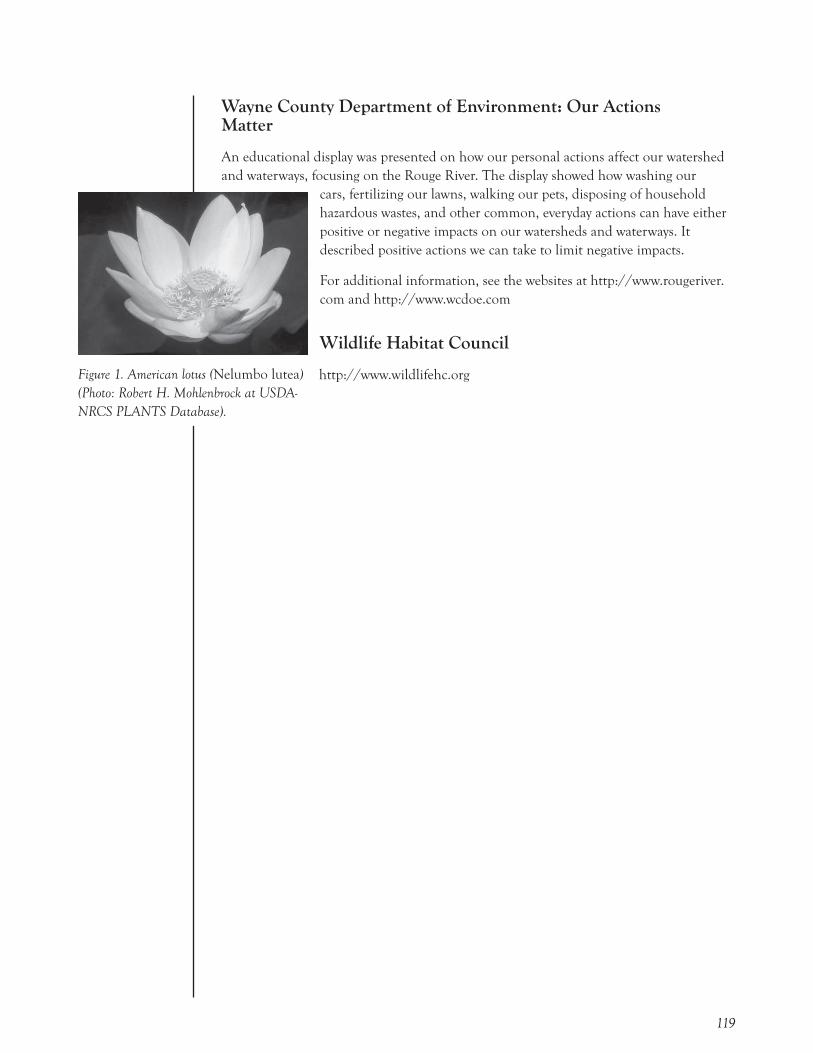
119
Wayne County Department of Environment: Our Actions Matter
An educational display was presented on how our personal actions affect our watershed and waterways, focusing on the Rouge River. The display showed how washing our
cars, fertilizing our lawns, walking our pets, disposing of household hazardous wastes, and other common, everyday actions can have either positive or negative impacts on our watersheds and waterways. It described positive actions we can take to limit negative impacts.
For additional information, see the websites at http://www.rougeriver.com and http://www.wcdoe.com
Wildlife Habitat Council
http://www.wildlifehc.org Figure 1. American lotus (Nelumbo lutea)(Photo: Robert H. Mohlenbrock at USDA-NRCS PLANTS Database).

120
APPENDIX III: SUMMARY OF COMMENTS FROM CONFERENCE PARTICIPANTS
At the conference, a short time period was given after each presentation for participants to ask questions and make comments. Participants were encouraged to write additional questions and comments on forms collected at the end of the day. The following compilation summarizes some of the most commonly addressed topics based on question periods and comment forms.
Conference participants asked some key questions about how to make better use of monitoring data, including:
• How can government further interagency cooperation in sharing data and setting common goals?
• Is there funding available for managing and communicating monitoring data?
• How can we promote the use of volunteer monitoring data by managers?
• What are the economic benefits of improved environmental health?
The conference was an excellent opportunity to increase awareness of regional monitoring programs. Participants told us about important programs that were not included in the conference presentations. For example, work by the Windsor Utilities Commission and its partners monitors the occurrence of pharmaceuticals in Detroit River source water and improves treatment methods for removal. Another example is the monitoring and stewardship by the Lotus Garden Club’s rare American lotus beds in Monroe, Michigan. In addition, several audience members arranged to volunteer their time for monitoring programs featured at the conference. Ideas were discussed for future work to increase awareness of regional monitoring programs. For example, groups that do monitoring, especially volunteer-based organizations, could team up to share information with the public by providing links to related organizations on their websites.
Many participants emphasized that monitoring must lead to action. Once we have identified concerns, these concerns must be addressed. Steps should be taken to reduce pollution, protect wildlife, control exotic species, and remediate degraded areas. For example, many audience members were very concerned about combined sewer overflows into the Detroit River and the presence of pollutants such as PCBs and pharmaceuticals, particularly at water treatment plant intakes. The health and population levels of wildlife were another key concern, as shown by the many questions to presenters who talked about wildlife such as bald eagles, canvasbacks and sport fish (e.g., salmon and walleye). Although exotic species were not a focus of the conference, participants reminded us that there is an urgent need to work to prevent future invasions and control exotic species already established in the Great Lakes. Greater effort should be made to improve the condition of the Detroit River, lower Rouge River, Turkey Creek and the Detroit River’s Grassy Island. Finally, one participant suggested compiling a “progress report” on remediation efforts.

121
APPENDIX IV: PRESS RELEASE FROM STREAM TEAM AND WAYNE COUNTY DEPARTMENT OF THE ENVIRONMENT
For immediate release Contact: John NasarzewskiNovember 24, 2004 734-246-4611 ext 256
The Stream Team and the Wayne County Department of Environment (WCDOE) are teaming up to restore and protect the water resources in the Wayne County downriver area. The collaboration is proposed to involve three major efforts: stream monitoring, riparian corridor management/creek restoration projects and watershed management public awareness education. The intent of the collaboration is to assist local communities, public school districts and the County with compliance under the State of Michigan’s General Storm Water Permit (MIG619000) while educating students using the local natural environment and current issues as the classroom.
Stream Team teachers, with assistance and support from Watershed Management Division of the WCDOE, will work with high school students empowering them to identify, evaluate and solve real world problems using real world techniques and technology. Stream monitoring will involve both ecosystem health monitoring and investigative “hot spot” monitoring initiatives. Riparian corridor management will involve the planning, design and implementation of stream bank restoration and protection projects and river clean up days. Watershed management public awareness education is proposed to involve Annual State of the Creeks workshops hosted by Stream Team schools as well as multi-disciplinary involvement in the creation of various public outreach and education displays, tools, and materials.
“Wayne County is pleased to collaborate with the Stream Team to build the County’s capacity to monitor watersheds in a scientifically defensible fashion. Further, the County’s participation ensures that the data from Stream Team monitoring will be used to guide watershed management decisions under the State of Michigan’s General Storm Water Permit. This represents a major step forward in making sure that volunteer monitoring is accepted, trusted, and used by management agencies.”
Kurt Heise, Director Wayne County Department of Environment
122
The first major implementation of this collaboration was launched on October 22, 2004 with implementation of the First Annual Volunteer Stream Bug Hunt. On this day, Wayne County staff supported Stream Team teachers and students from seven local schools who sampled at six different locations for macro invertebrates insects (“bugs”) in the Ecorse Creek, Frank and Poet, Blakely and Huron River watersheds. Schools participating in this Bug Hunt included: Ecorse High School, Southgate Anderson High School, Creative Montessori Middle School, Riverview High School, Monguagon Middle School, Trenton High School and Woodhaven Middle School. In total, 115 people were involved in this fall monitoring event. Bug Hunt scores for the sites ranged from Poor to Fair and the different number of taxa (type of bug) ranged from five to 17. Three of the sites rated Fair and two rated Poor. The Silver Creek in the Lower Huron Watershed (site HR-1) had the distinction of having the highest number of taxa (17). The Frank and Poet Drain (site CD-5) within the Combined Downriver watershed had the highest score (31.9) as sampled by Trenton High School and Woodhaven Middle School students. The lowest score (12.3) was recorded by Creative Montessori Middle School students on the Frank and Poet Drain (site CD-1). Although it is too early to make any real conclusions from the monitoring results (it requires a minimum of three years of data to establish a true baseline) much was learned by all participants. Some of the most water quality sensitive bugs found include gilled snails, narrow winged damselfly nymphs, small squaregill mayfly, and water scorpions.
The next major effort will be conducting the first State of the Creeks workshop to be hosted by a Stream Team school. Current plans are to hold the workshop in February of 2005. Through this event, efforts thus far and plans for the future can be shared with students, their parents and the general public for comment and further participation. At the event, plans for implementation of streambank restoration projects to be conducted in the spring will be announced and opportunities to learn the techniques and participation in hands-on restoration projects will also be announced.
The Stream Team is a part of Downriver Citizens for a Safe Environment, which was founded in 1989 by residents in five downriver communities to address chemical exposure to area residents. As the organization grew, members decided to undertake an outreach program to help become more proactive in the community. Two members, Mr. Bruce Szczechowski and Mr. John Nasarzewski, were approached to pilot a project in their schools to help educate and restore a small section of degraded streambed. It was such a resounding success that this pilot project took on a life of its own and has flourished ever since.

123
APPENDIX V: CONFERENCE SPONSOR STATEMENTS
The SOS Conference was convened and these proceedings have been produced with the assistance of the following sponsors. We thank these groups for their ongoing support and commitment to understanding, protecting and restoring the Detroit River ecosystem.
CDM
CDM is a global, full-service consulting, engineering, construction, and operations firm helping public and private clients improve the environment and infrastructure. Since 1947, CDM has been providing innovative solutions developed through strong client relationships of mutual trust and respect and a commitment to quality and integrity. From a three-person firm in Cambridge to today’s staff of more than 3,600 worldwide, CDM has grown and diversified with our clients’ needs in mind. Our mission is to reach one goal–the client’s–by providing the right total solutions.
Consulate General of Canada
The mandate of the Office of the Consulate General of Canada is to portray, promote, and protect Canadian interests and serve Canadians at home and abroad.
City of Windsor
The City of Windsor, with the involvement of its citizens, will deliver effective and responsive municipal services, and will mobilize innovative community partnerships.
Detroit River Canadian Cleanup
In keeping with the object and intent of the Canada-U.S. Great Lakes Water Quality Agreement (GLWQA), the purpose of the Detroit River Canadian Cleanup is to clean up, enhance, and sustain the ecosystem of the Detroit River and its watershed. As such, the key goal of the effort is to have the Detroit River permanently delisted from the international list of Areas of Concern under the GLWQA.

124
Detroit Water and Sewerage Department
The mission of the Detroit Water and Sewerage Department is to exceed our customers’ expectations through the innovative treatment and transmission of water and wastewater and the provision of services that promote healthy communities and economic growth.
DTE Energy
DTE Energy is a Detroit-based diversified energy company involved in the development and management of energy-related businesses and services nationwide. Its largest operating units are Detroit Edison, an electric utility serving 2.1 million customers in southeastern Michigan, and MichCon, a natural gas utility serving 1.2 million customers in Michigan. Information about DTE Energy is available at www.dteenergy.com.
Environment Canada–Ontario Region
Environment Canada delivers national programs tailored to respond to regional and local issues; implement “Great Lakes 2000” and the Canada-Ontario Agreement Respecting Great Lakes; and represent Environment Canada corporately in binational, national, regional, and local partnerships.
Essex Region Conservation Authority
The goal of the Essex Region Conservation Authority is to provide locally based leadership in creating a life-enriching environment for the residents of the Essex Region.
125
Friends of the Detroit River
The Friends of the Detroit River envisions an ever-improving quality of life for people, plants and animals in southeast Michigan and southwest Ontario through the development of a balance of grassroots advocacy and staffed programs to form an environmental group that watches and protects the Detroit River. Its goals include the creation of a highly visible resource center focusing on Detroit River issues, programs, research, policies, and partnerships.
The mission of Friends of the Detroit River, Inc. is to enhance the environmental, educational, economic, cultural, and recreational opportunities associated with the Detroit River watershed through citizen involvement and community action.
Golder Associates
Golder Associates’ mission is to engineer the earth’s development and preserve its integrity.
Greater Detroit American Heritage River Initiative
The Detroit River is one of 14 American Heritage Rivers designated by Presidential Executive Order in 1998. Since this designation, the Greater Detroit American Heritage River Initiative of the Metropolitan Affairs Coalition has worked cooperatively through public-private partnerships to promote economic development, expand recreational opportunities, celebrate the river’s rich history, and rehabilitate and protect vital natural resources. In its five year history, the Greater Detroit American Heritage River Initiative has leveraged over $43 million in public and private funding for river-related projects.

126
U.S. Geological Survey Great Lakes Science Center
The mission of the U.S. Geological Survey Great Lakes Science Center is to advance scientific knowledge and provide scientific information for restoring, enhancing, managing, and protecting the living resources and their habitats in the Great Lakes basin ecosystem.
The U.S. Geological Survey serves the nation by providing reliable scientific information to describe and understand the Earth; minimize loss of life and property from natural disasters; manage water, biological, energy, and mineral resources; and enhance and protect our quality of life.
International Joint Commission
The International Joint Commission prevents and resolves disputes between the United States of America and Canada under the 1909 Boundary Waters Treaty and pursues the common good of both countries as an independent and objective advisor to the two governments.
In particular, the Commission rules upon applications for approval of projects affecting boundary or transboundary waters and may regulate the operation of these projects; it assists the two countries in the protection of the transboundary environment, including the implementation of the Great Lakes Water Quality Agreement, and the improvement of transboundary air quality; and it alerts the governments to emerging issues along the boundary that may give rise to bilateral disputes.
Metropolitan Affairs Coalition
The Metropolitan Affairs Coalition is a regional public/private partnership dedicated to enhancing the quality of life and the economy of southeast Michigan. Its members are leaders in business, labor, and government who work cooperatively for a better future for those who live, work, and do business in the metropolitan Detroit area.

127
Michigan Sea Grant
Michigan Sea Grant supports research, outreach, and education to enhance the sustainable use of Great Lakes resources to benefit the economy, the environment, and quality of life.
Michigan Sea Grant brings together diverse stakeholders to develop a shared vision and work toward science-based solutions to Michigan’s coastal challenges. The program integrates Great Lakes research, outreach, and education to help our stakeholders respond to issues, such as coastal land-use planning, aquatic habitat protection and enhancement, fisheries management, and invasive species prevention and control. More information about the Michigan Sea Grant is available at www.miseagrant.umich.edu.
Ministry of the Environment
The Ministry of the Environment works to protect, restore and enhance the natural environment through tough legislation and enforcement, innovative programs and initiatives, strong partnerships, and public engagement. The Ministry works to provide all Ontarians with safe and clean air, land, and water.
Ontario Ministry of Natural Resources
The Ministry is committed to protecting and managing the province’s natural resources, or its “natural capital,” and making the interest from that capital available for individuals, communities, and economies that depend on it. In doing so, the Ministry contributes to the environmental, social and economic well-being of the people of Ontario, meeting not only today’s needs, but also ensuring these resources are available for future generations.
Town of LaSalle
The Town of LaSalle is situated on the banks of the Detroit River on what is known as the “Nautical Mile” in the County of Essex. With a current population of over 27, 000, LaSalle is one of the fastest growing communities in Southwestern Ontario.

128
University of Windsor
The University of Windsor is Canada’s most personal comprehensive university. It combines a strong and focused emphasis on the learning experience of every student with a very broad range of graduate, undergraduate, and professional programmes. Uniquely accountable in specifying learning outcomes for each academic programme, the University has an exciting commitment to research in a richly diverse community. A special focus on automotive, environmental, and social justice interdisciplinary research reflects the priorities of the surrounding region.
U. S. Fish and Wildlife Service
The mission of the U.S. Fish and Wildlife Service is to work with others to conserve, protect, and enhance fish, wildlife, plants, and their habitats for the continuing benefit of the American people. Under the direction of the U.S. Fish and Wildlife Service, the National Wildlife Refuge System has become the world’s premier network of wildlife habitats, covering over 96 million acres of public lands. The Detroit River International Wildlife Refuge is the only international wildlife refuge in North America.
Wade Trim
Wade Trim provides engineering, surveying, planning, and construction services for water resources, transportation, and municipal government projects. With over 400 professional and support staff in 11 offices in Michigan, Ohio, Pennsylvania, and Florida, Wade Trim is consistently ranked in the top 200 design firms nationwide by Engineering News-Record. Our vision statement, “Building Relationships on a Foundation of Excellence,” reflects our commitment to maintaining strong client relationships and meeting client needs.

129
Wayne County Department of Environment
The central mission of the Wayne County Department of Environment is to create, foster and maintain a clean and safe, land, water and air environment for citizens of Wayne County by providing services for cost-effective drainage systems, waste water management, solid waste management, and air quality advocacy.
Windsor Port Authority
The mission of the Windsor Port Authority is to manage, develop, and promote the Port of Windsor for the benefit of its stakeholders, and to ensure the general security of the Port while remaining sensitive to the need for a high degree of safety and environmental responsibility.
The vision of the Windsor Port Authority is to create a premier international Great Lakes port that will facilitate and maximize economic development and growth.
Windsor Utilities Commission, Water Division
The Windsor Utilities Commission Water Division is comprised of Treatment, Distribution and Engineering Groups managing the highest quality potable water system possible for the City of Windsor and distributing it cost efficiently throughout the community. Among the leading-edge utilities in North America, it was the first to offer ozone as a treatment process.

130
APPENDIX VI: CONFERENCE REGISTRATION LIST
The following individuals registered to attend the 2004 State of the Strait conference.
Steve Alexander, General Chemical Canada, Ltd.Steven Alman, Wayne County Parks DivisionDavid Anthony, Wade TrimLarry Arreguin, State of Michigan Governor’s OfficeJillian Authier, University of Windsor Debbie Badzinski, Bird Studies CanadaCharles Bake, Canadian Auto WorkersJason Barnucz, Fisheries and Oceans CanadaTracie Beasley, Clinton River Watershed CouncilMary Lynn Becker, Canadian Consulate GeneralNadine Benoit, Ontario Ministry of the EnvironmentPeter Benz, Friends of the Detroit River, Green Corridor, Wayne County Dept. of Environment Yakuta Bhagat, University of WindsorCaroline Biribauer, Wildlife Habitat CouncilMichael Blair, Wayne County Community College DistrictMary Bohling, DTE EnergyConnie Boris, Detroit River Remedial Action Plan GroupJeffrey Boutain, University of Michigan - DearbornMark Breederland, Michigan Sea GrantTed Briggs, Ontario Ministry of the EnvironmentLeesa Bringas, Citizens Environment AllianceCharlie Bristol, Bristol Technical Services, Inc.Glen Brown, Macomb County Health DepartmentMark Buckner, Citizens Environment Alliance/Detroit River Canadian Cleanup Outreach CommitteeJames N. Bull, Detroit Audubon SocietyRobert Burns, Detroit RiverkeeperJessica BurrKeith Butler, Detroit Water and Sewerage Department Sheila Cameron, University of WindsorSuzan Campbell Becky Carey, Trenton High SchoolLuca Cargnelli, Environment CanadaRichard Caron, University of WindsorChris Catalfio, Wayne County Dept. of Environment, Applied Science, Inc.Kelly Cave, Wayne County Department of EnvironmentMatthew Child, Essex Region Conservation AuthorityShaogang Chu, University of WindsorJan Ciborowski, University of Windsor Eric Condela John Cooper, Ontario Ministry of Natural ResourcesBruce Coristine, Golder Associates Lynda Corkum, University of WindsorRick Coronado, Citizens Environment Alliance

131
Derek Coronado, Citizens Environment AllianceGeorge Costaris, Canadian Consulate GeneralMelanie Coulter, Detroit River Canadian CleanupJohn Covert, Friends of the Detroit RiverJulie Craves, Rouge River Bird Observatory, University of Michigan-DearbornGary Crawford, SEAS LLCDavid Cree, Windsor Port AuthorityTara Crewe, Bird Studies CanadaPaul Cypher, Southeastern Michigan Raptor ResearchChristine Daly, University of WindsorJoe Davis Cheryl Dawdy, Neighbourhood Funding Resources Ken DeBeaussaert, Michigan Office of the Great LakesFrederick DeLisle, BASF CorporationRocco Delvecchio, Canadian Consulate GeneralChristina DiDonato, University of WindsorShanna Draheim, Michigan Department of Environmental QualityPaul Drca, Corporation of the City of Windsor - Environmental ServicesKen Drouillard, Great Lakes Institute for Environmental ResearchRich Drouin, Ontario Ministry of Natural ResourcesJim Drummond, Golder Associates Camilla Duarte, Golder Associates Rachael Eedy, University of WindsorRon Elliott, Windsor Essex County Environment CommitteeMarilyn EvesRonald Fadoir, Oakland Planning DepartmentJeff Farrah, University of Michigan-DearbornMatthew Fleming, University of WindsorKen Fleszar, Trenton High SchoolCarolyn Foley, University of WindsorJosh Foucher, Stream Team, Southgate Anderson High SchoolKyle Frankhouse, Trenton High SchoolJohn E. Gannon, International Joint CommissionSandra George, Environment CanadaLeila Gharib, Riverview High School YIKES (Environmental Club)Lora Gharib, Riverview High School YIKESNeil Gold, University of WindsorDon Griffin, Friends of the Detroit RiverHarold Hagan, Great Lakes Institute for Environment ResearchCouncillor Alan Halberstadt, City of WindsorRuth Hart Patricia Hartig, Attorney at LawJohn Hartig, U.S. Fish and Wildlife ServiceMatt Hatty, Trenton High SchoolPage Havasy Peter Hayfield, Canadian Auto WorkersTom Henderson, Little River Enhancement Group (Windsor)David Howell, Friends of the Detroit RiverMike Hudson, Detroit Water and Sewerage DepartmentColleen Hughes, CDMTom Hughes, Riverview High School YIKESPaul Jackson, Detroit Water and Sewerage Department

132
Saad Jasim, Windsor Utilities Commission Water Quality & ProductionDavid Jobin, Stream Team, Southgate Anderson High SchoolElla Johnson, Detroit Water and Sewerage DepartmentTim Johnson, Ontario Ministry of Natural ResourcesBruce Jones, Grosse Ile Nature and Land ConservancySarah Kacso, St. Anne High SchoolDanielle Kahn, City of Ecorse Planning DepartmentJackie Kalisz, Riverview High School YIKESRachel Katonak, East Michigan Environmental Action CouncilTashia Kelly, Detroit Water and Sewerage DepartmentDoug Kelly, Trenton High SchoolGrace Kim, University of WindsorTodd King, CDMMelissa Kinghorn, University of WindsorMichael Klepinger, Michigan Sea GrantMilan Knezovich, Friends of the Detroit RiverGreg Konopka, Riverview High School YIKESRussell Kreis, U.S. Environmental Protection Agency Sonia Kumar, Riverview High SchoolDawn Kelly Laing, Bird Studies CanadaRob LanganJack Lanigan, The Jack Lanigan CorporationNick Lapointe, University of WindsorVictoria LaVoy Chris Lehr, Nativescape, Inc. Ron Lepine, AMEC Earth & Environmental ConsultantsRay Lindberg, Friends of Lypps Beach MarshSimon Llewellyn, Environment CanadaBrian Locke, Ontario Ministry of Natural Resources Paula Lombardi, Willms & Shier Environmental Lawyers LLPJane Mackey, Downriver Community Liaison for Congressman John Conyers, Detroit River RAPScudder Mackey Jack Macrae, City of Windsor, Little River Pollution Control PlantKathleen Maharas, Riverview High School YIKESNicole Mahler, Centre for Environmental Health of OntarioLeonard MannusaMaria Margaritis, Citizens Environment AllianceBill Marshall, Windsor Port AuthorityLisa MartireDouglas Martz, Macomb County Waterquality Board and St. Clair ChannelkeeperBlair J. McGowan, Friends of the Detroit RiverBarbara McCallahan, SE MI Regional Manager for U.S. Senator Debbie StabenowRobert McCrea, Environment CanadaSusan McDaniel, University of WindsorLaura McLellan, Trenton High SchoolJoseph (JT) McPartlin, Riverview High School YIKESDavid Merkey, National Oceanic and Atmospheric Administration/Great Lakes Lab Rick Micka, Lotus Garden Club (Federated Garden Clubs of Michigan & America)Jim Miller, Hubbell, Roth & Clark, Inc.Stephanie Millsap, U.S. Fish and Wildlife ServiceNick Minello

133
Justine Moller, St. Anne High School Jim Moran, Neighbourhood Funding Resources Mike Morencie, Ontario Ministry of Natural Resources Sandra Morrison, Great Lakes Science Center, U.S. Geological SurveyBarry Muller, Fermi 2 Nuclear Power PlantNoel Mullett, Wayne County Department of EnvironmentPat Murray, Great Lakes Institute for the EnvironmentBarry Murray, Michigan Sea GrantRachel Nall, Riverview High School YIKESJohn Nasarzewski, Stream Team, Southgate Anderson High SchoolMike Nelson, Essex Region Conservation AuthorityDaniel Nickols, Trenton High SchoolMarcie NoutaiMarion Overholt, Canadian Detroit RiverkeeperIan Parrish, Ontario Ministry of the EnvironmentRoss Paul, University of WindsorDouglas Pearsall, The Nature ConservancySally Petrella, Friends of the RougeDonna Petry, Wayne County Conservation DistrictTom Pickering, Southgate Anderson High SchoolJosephine Powell, Wayne County Department of EnvironmentÉlizabeth Powles, University of WindsorAlicia Puim, University Of WindsorDrew Ramsden, St. Anne High SchoolMike Rauth, St. Anne High School Robert Reider, Detroit Edison CompanyJames Ridgway, P.E., Environmental Consulting & Technology, Inc.Joseph Robison, Michigan Department of Natural ResourcesSteve Rood, CDMCyndi Ross, Friends of the RougeSarah Rupert, Parks Canada - Point Pelee National ParkJohn RussellGem Sabolboro, Riverview High School YIKESImad Salim, Wade TrimGeri Salinitri, Faculty of EducationLauren Sall, Trenton High SchoolLynda Sanchez, Michigan Department of Environmental QualityJacqueline Savino, Great Lakes Science Center, U.S. Geological SurveyMillie ScarboughGregory Scheffler Pat Schincariol, Windsor-Essex County Environment CommitteeHeather SchuylerLinda Schweitzer, Oakland UniversityRobert Smiley, Wyandotte Yacht Club Jon SmithEdmund Sperkowski, Friends of the Detroit RiverMichael Sproul, Friends of the Detroit RiverJim Stone, Riverfront East AllianceBruce Szczechowski, Stream Team, Southgate Anderson High SchoolLaura Tachauer, University of WindsorGord Taylor, Citizens Environment AllianceKeith Taylor, University of Windsor

134
Stephanie Tedesco, University of WindsorMark ThibeaultPete Thomas, Canadian Auto WorkersStewart Thornley, Ontario Ministry of the EnvironmentSteve Timmermans, Bird Studies CanadaThomas Tole, Detroit Water and Sewerage DepartmentTaulent Totaj, Southgate Anderson High SchoolKrista Tovey, Sandwich Community Health Centre, Inc.Lisa Tulen, University of WindsorDean Tuomari, Wayne County Department of EnvironmentRoberta Urbani, DTE EnergyMarcia Valiante, University of WindsorRita Vasquez Sara Vasquez Jennifer Vincent, Environment CanadaRodney Wakeham Tim Walsh, Detroit Edison CompanyBree Westdorp, Michigan Department of Environmental QualityDaniel Westfall, Ontario Public Interest Research Group, University of WindsorKit Woods, City of Windsor Public Works - Environmental Services
CONFERENCE STEERING COMMITTEELeesa Bringas, Citizens Environment AllianceCharlie Bristol, Bristol Technical Services, Inc. Leon Carl, Great Lakes Science Center, U.S. Geological SurveyJan Ciborowski, University of WindsorLynda Corkum, University of WindsorDerek Coronado, Citizens Environment AllianceMelanie Coulter, Detroit River Canadian CleanupKen Drouillard, University of WindsorRachael Eedy, University of WindsorJohn Gannon, International Joint CommissionAlice Grgicak-Mannion, University of WindsorJohn Hartig, U.S. Fish and Wildlife ServiceElla Johnson, Detroit Water and Sewerage DepartmentRob Letcher, University of WindsorLesley Lovett-Doust, University of WindsorBarry Murray, Michigan Sea GrantJohn Nasarzewski, Stream Team, Southgate Anderson High SchoolJosephine Powell, Wayne County Department of EnvironmentGeri Salinitri, University of WindsorBruce Szczechowski, Stream Team, Southgate Anderson High SchoolRoberta Urbani, DTE Energy

o f t h e
MONITORING FOR SOUND MANAGEMENTSTATE OF THE STRAIT