Embed Size (px)
Citation preview
West Midlands Combined Authority
State of the Region 2020Full ReportPrepared by the
West Midlands Regional Economic Development Institute
Partnership (WMREDI)
July 2020
1
About WMREDI
WMCA along with other regional partners have given support to a recently funded research institute in the
region. WM-REDI will be a catalyst for a step-change in regional collaboration. Alongside funding from
UKRI’s Research England and the matching funds from the University of Birmingham, we have secured
matched funding from the leading regional stakeholders involved in planning and delivering growth policies.
This will be a shared collaborative approach to research and evidence in the region, as such all partners
can utilise the structure to deliver research and data activities.
Key partners are:
• West Midlands Combined Authority (WMCA)
• GBS Chamber of Commerce
• Business and Professional Services consortium (BPS)
• West Midlands Growth Company (WMGC)
• Greater Birmingham and Solihull Local Enterprise Partnership (GBS LEP)
• The Black Country Consortium Ltd.
• The Coventry and Warwickshire Local Enterprise Partnership (C&WLEP)
• Aston University
• Birmingham City University (BCU)
• Other partners include Birmingham City Council and the other local authorities in the West Midlands
metropolitan area, the Midlands Engine and the University of Warwick.
With special Thanks to the Black Country Consortium Economic Intelligence Unit for their significant
contribution to this work
Copyright
Ideas, solutions, suggestions, hints and procedures from this document are the intellectual property of WMCA and WMREDI partners and
protected by copyright. They may not be reproduced, transmitted to third parties or used in any form for commercial purposes without the
express permission of the WMREDI partnership.
2
Foreword
Welcome to State of the Region 2020 – the fourth annual review of performance across the West Midlands,
In this edition we had already begun the process of moving to a wider analysis focussing on alignment to
monitoring the Sustainable Development Goals (SDGs). This report is written on behalf of the West
Midlands Combined Authority and all its partners, it should be seen as a stocktake of where the region
stands, it’s a snapshot on where we are doing well and where we need to work together to improve the
region. But this year it is produced in extraordinary circumstances it’s a call to action for everyone invested
in the West Midlands. It is important to note this report was written in June 2020 and that some of the data
included changes on a weekly basis. Latest data will be found in the weekly monitors as circumstances
unfold.
It endeavours to be an honest reflection of the current regional condition, highlighting the challenges we
face. However, we are not attempting to suggest what the solutions are; this lies within strategies and
action plans the WMCA and partners own and deliver. It highlights how we are driving our evidence base
for the future and continuing to build our understanding of the performance of the region. There are
challenges to understanding this performance and how we change places for the better, not least
understanding the causation and causality between action, output and outcomes. This document provides
a balanced approach to regional monitoring and a useful tool understand the progress we are making
through our combined action.
The statistics used in the performance monitoring section of the report predominantly cover
periods prior to the current Coronavirus pandemic due the lagging nature of annual reporting.
The data used is accurate as at end of June 2020.
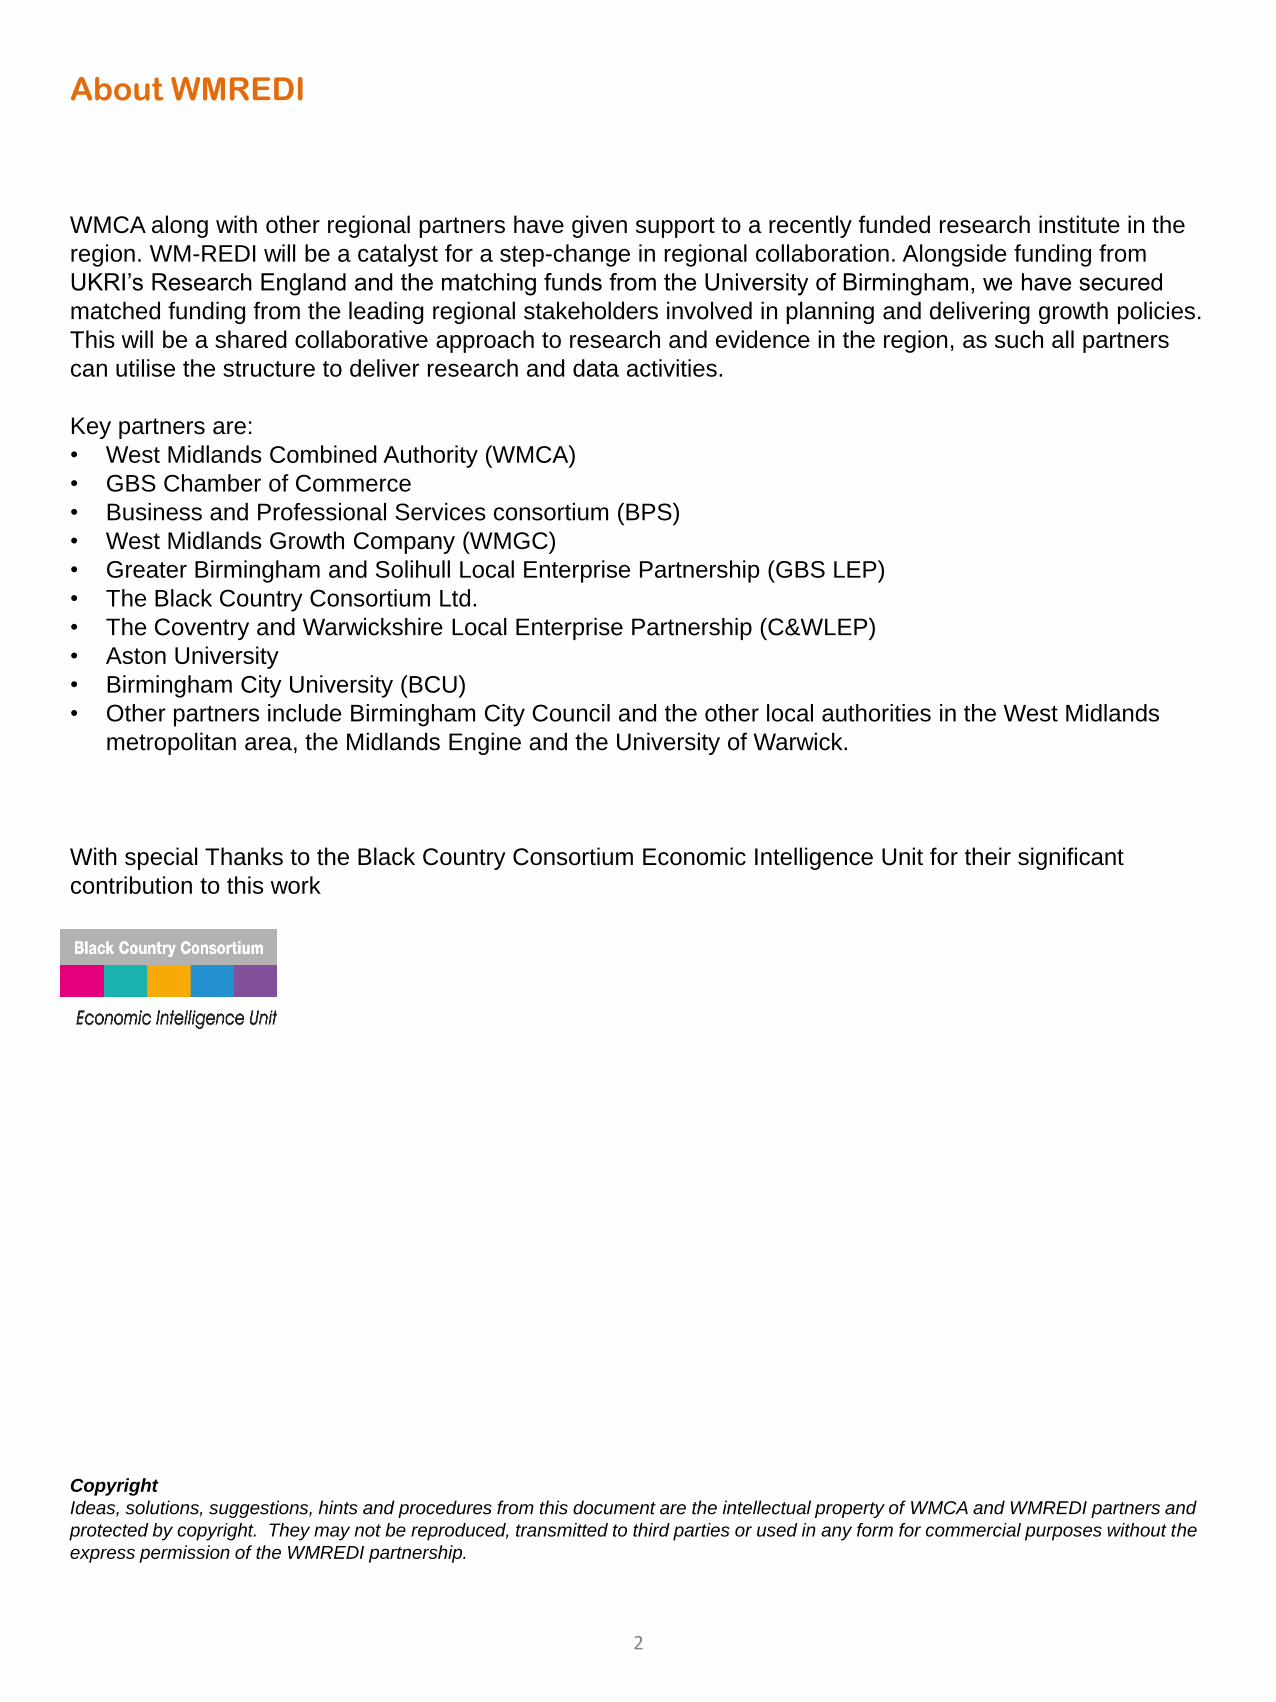
Unless otherwise stated the data relates to the West Midlands Combined Authority region covered
by the 3 LEP geography.
3
Contents
Foreword 3
Executive Summary 5
Strengths, Weaknesses, Opportunities and Threats 6
Challenges facing policy 8
Combined Authority Area – Summary Data 9
If the West Midlands was 100 People 10
If the West midlands was 100 businesses 11
Key Past trends Performance indicators 12
Impact of Covid-19 14
Key Issues 15
Short Term Indicators 16
Impact on our Health 18
Impact on our Economy 22
Impact on our People 23
Impact on our Business 28
Impact on our Environment and Infrastructure 33
Impact on our Leisure, Culture and Tourism 34
Impact on our Places 40
Risks to Place Assets 46
Risks from Brexit 48
Impact on Local Government 49
Future Scenarios and Trends Post Pandemic 52
Past Performance 62
Economic Geography 63
Outcomes by Sustainable development Goals 65
1. Poverty 66
2. Zero Hunger 67
3. Good Health ad Well Being 68
4. Quality Education 69
5. Gender Equality 72
6. Clean Water and Sanitation 73
7. Affordable and Clean Energy 74
8. Decent Work and Economic Growth 75
9. Industry, Innovation and Infrastructure 104
10.Reduced Inequalities 109
11.Sustainable Cities and Communities 113
12.Responsible Consumption and Production 115
13.Climate Action 116
14.Life Below Water 117
15.Life on Land 116
16.Peace, Justice and Strong Institutions 119
17.Partnership for the Goals 120
Regional Outcome Indictors 121
Supporting Documents and References 131
4
Executive Summary
The West Midlands is one of the largest conurbations outside London, its central location puts it at the
heart of the UK’s transport networks and international connections. The region was one of the most
prosperous areas of the UK until the 1970/80s, and in the last 5 years it has been experiencing a
resurgence of that power on the back of the growth in the business and professional services sector;
technology driven manufacturing and city centre construction growth; thriving city centre based
international business and professional services sector which was driving high levels of business
tourism; a manufacturing base becoming more productive and an automotive sector responding to the
challenge of a carbon neutral future; high exports, foreign direct investment and strong international
links, and the biggest higher education cluster outside London. The region broke through the £100bn
GVA barrier and had been bucking the national trend on a host of economic indicators, such as
enterprise and employment growth. All this was powered by a young workforce, increasing its skills
and moving to the region. However, underlying this growth there were significant issues with
inequality, poverty, youth unemployment, low skills, poor health and school performance.
The economic impact of the Covid-19 pandemic has been severe. First quarter UK GDP fell 20%
compared to last year, manufacturing PMI hit an all-time low and 496,000 people across the 3 LEP
area are on furlough in June 2020, the equivalent of all jobs in Birmingham. Despite the general stasis
felt by the economy through furlough and lockdown, the overall claimant count has nearly doubled
overall and for young people.
Sectors where we have previously seen growth and expansion are now hardest hit, such as
construction and the expanding higher education sector which makes our 3 cities, Birmingham,
Coventry and Wolverhampton vulnerable. Our largest employment and GVA sector (professional,
businesses and financial services) is still resilient and the sectors hardest hit through furlough (retail,
hospitality and tourism) could bounce back providing consumer demand returns.
Economic forecasts consistently show the West Midlands to be one of the UK regions hit hardest by
the economic crisis. This is because of our industrial and demographic mix, with some local
economies among the most vulnerable in the UK in terms of their sectoral composition and health
vulnerability. Those same models also show relatively strong regional growth in 2021, but this
depends on assumptions about future market demand and international trade agreements. The stakes
are high everywhere, but particularly so in the West Midlands.
However, our economic performance over the last 10 years since the last recession should give us
confidence that with the appropriate support from Government, we can return to growth rapidly.
.
5
Executive Summary - SWOT
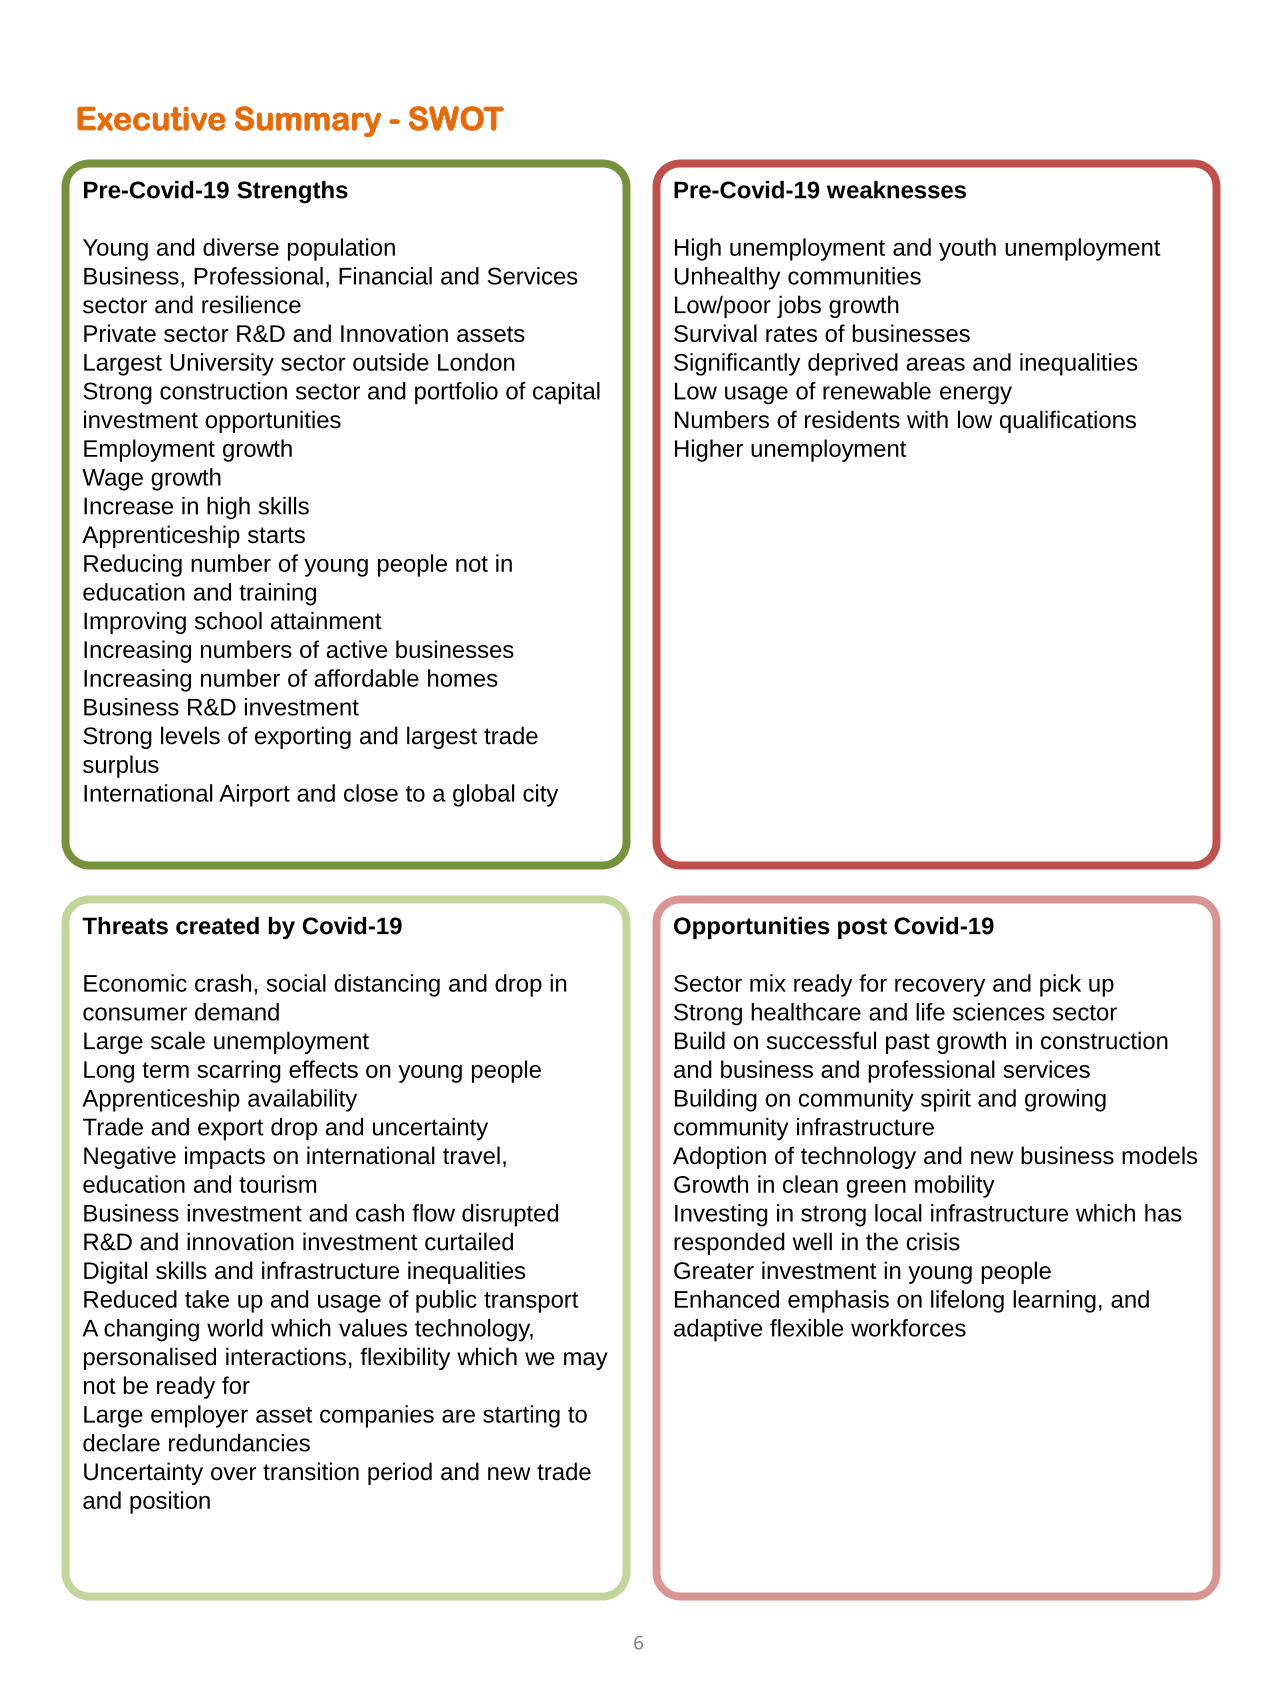
Pre-Covid-19 Strengths
Young and diverse population
Business, Professional, Financial and Services
sector and resilience
Private sector R&D and Innovation assets
Largest University sector outside London
Strong construction sector and portfolio of capital
investment opportunities
Employment growth
Wage growth
Increase in high skills
Apprenticeship starts
Reducing number of young people not in
education and training
Improving school attainment
Increasing numbers of active businesses
Increasing number of affordable homes
Business R&D investment
Strong levels of exporting and largest trade
surplus
International Airport and close to a global city
Pre-Covid-19 weaknesses
High unemployment and youth unemployment
Unhealthy communities
Low/poor jobs growth
Survival rates of businesses
Significantly deprived areas and inequalities
Low usage of renewable energy
Numbers of residents with low qualifications
Higher unemployment
Threats created by Covid-19
Economic crash, social distancing and drop in
consumer demand
Large scale unemployment
Long term scarring effects on young people
Apprenticeship availability
Trade and export drop and uncertainty
Negative impacts on international travel,
education and tourism
Business investment and cash flow disrupted
R&D and innovation investment curtailed
Digital skills and infrastructure inequalities
Reduced take up and usage of public transport
A changing world which values technology,
personalised interactions, flexibility which we may
not be ready for
Large employer asset companies are starting to
declare redundancies
Uncertainty over transition period and new trade
and position
Opportunities post Covid-19
Sector mix ready for recovery and pick up
Strong healthcare and life sciences sector
Build on successful past growth in construction
and business and professional services
Building on community spirit and growing
community infrastructure
Adoption of technology and new business models
Growth in clean green mobility
Investing in strong local infrastructure which has
responded well in the crisis
Greater investment in young people
Enhanced emphasis on lifelong learning, and
adaptive flexible workforces
6
Executive Summary – Specific Asset SWOT
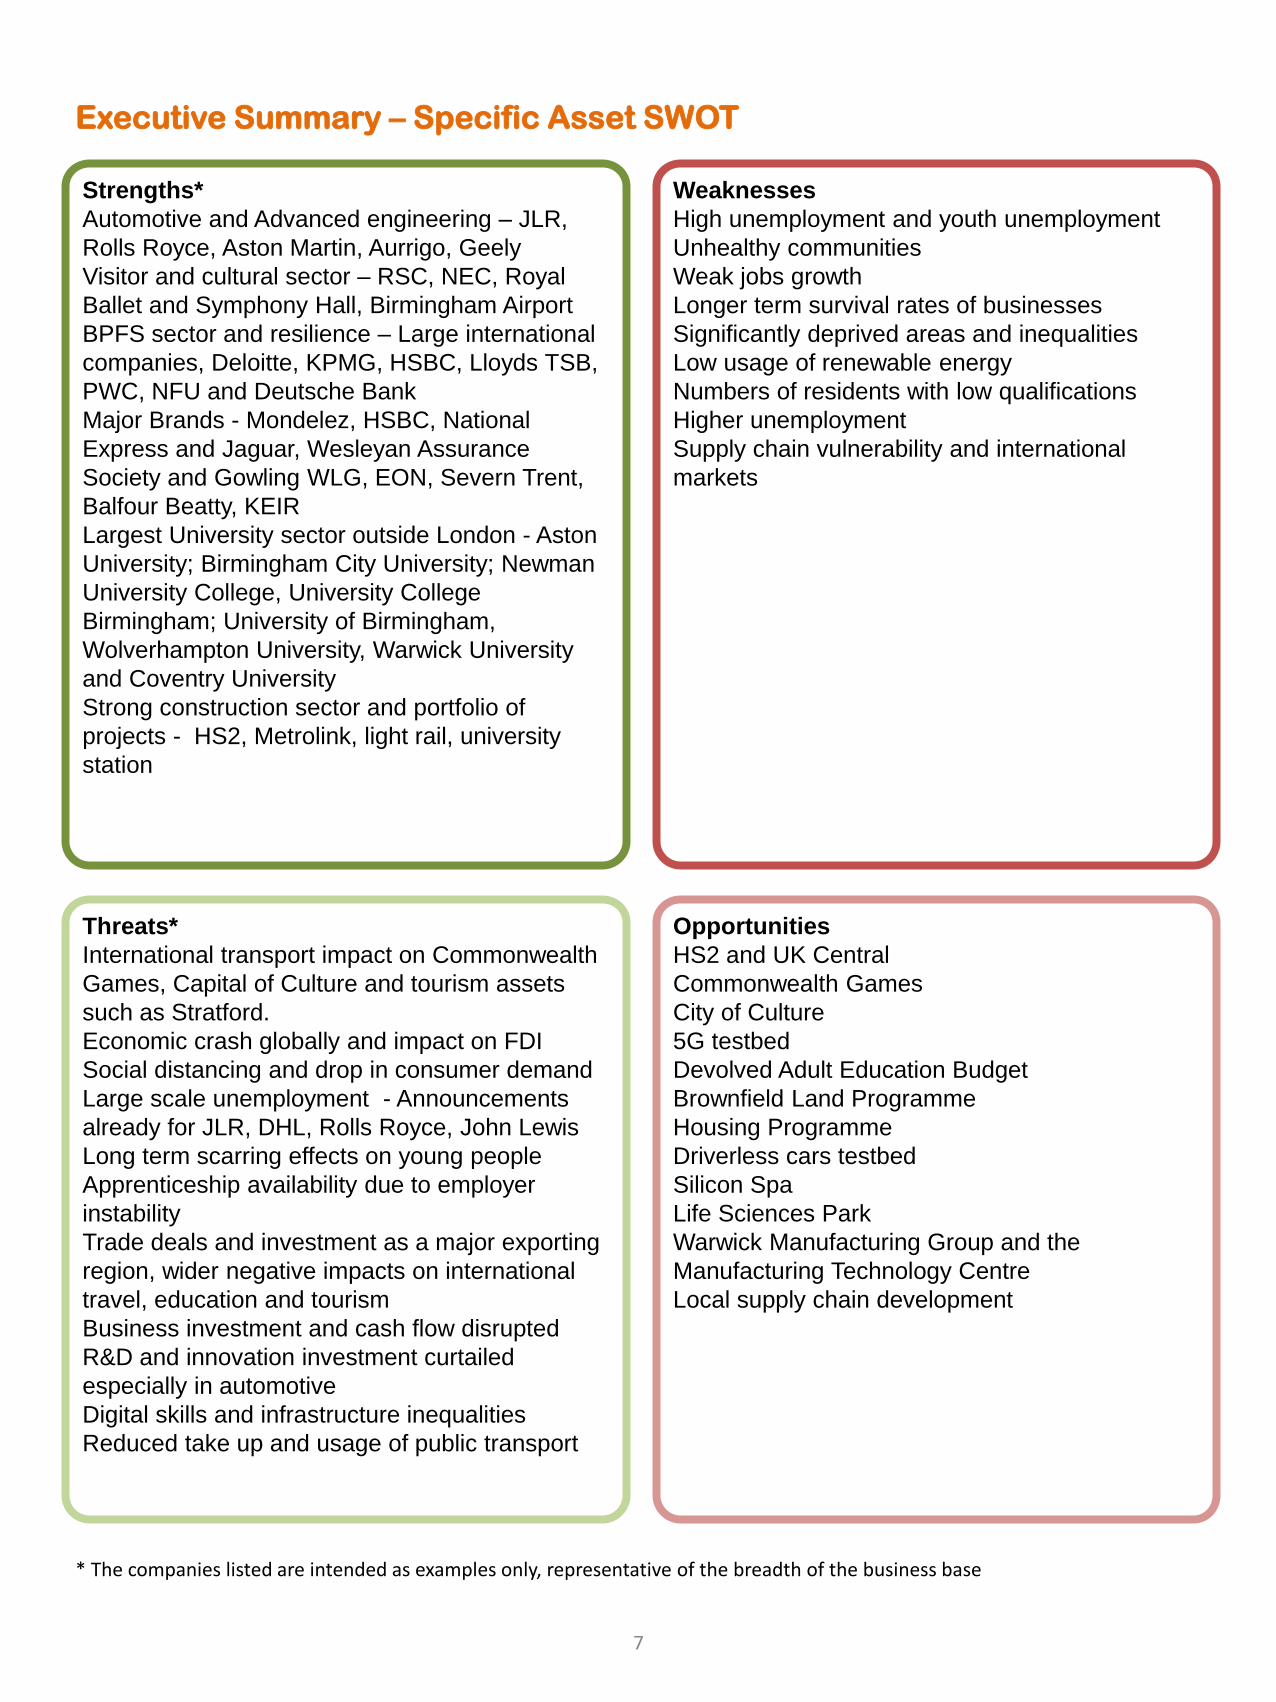
Strengths*
Automotive and Advanced engineering – JLR,
Rolls Royce, Aston Martin, Aurrigo, Geely
Visitor and cultural sector – RSC, NEC, Royal
Ballet and Symphony Hall, Birmingham Airport
BPFS sector and resilience – Large international
companies, Deloitte, KPMG, HSBC, Lloyds TSB,
PWC, NFU and Deutsche Bank
Major Brands - Mondelez, HSBC, National
Express and Jaguar, Wesleyan Assurance
Society and Gowling WLG, EON, Severn Trent,
Balfour Beatty, KEIR
Largest University sector outside London - Aston
University; Birmingham City University; Newman
University College, University College
Birmingham; University of Birmingham,
Wolverhampton University, Warwick University
and Coventry University
Strong construction sector and portfolio of
projects - HS2, Metrolink, light rail, university
station
Weaknesses
High unemployment and youth unemployment
Unhealthy communities
Weak jobs growth
Longer term survival rates of businesses
Significantly deprived areas and inequalities
Low usage of renewable energy
Numbers of residents with low qualifications
Higher unemployment
Supply chain vulnerability and international
markets
Threats*
International transport impact on Commonwealth
Games, Capital of Culture and tourism assets
such as Stratford.
Economic crash globally and impact on FDI
Social distancing and drop in consumer demand
Large scale unemployment - Announcements
already for JLR, DHL, Rolls Royce, John Lewis
Long term scarring effects on young people
Apprenticeship availability due to employer
instability
Trade deals and investment as a major exporting
region, wider negative impacts on international
travel, education and tourism
Business investment and cash flow disrupted
R&D and innovation investment curtailed
especially in automotive
Digital skills and infrastructure inequalities
Reduced take up and usage of public transport
Opportunities
HS2 and UK Central
Commonwealth Games
City of Culture
5G testbed
Devolved Adult Education Budget
Brownfield Land Programme
Housing Programme
Driverless cars testbed
Silicon Spa
Life Sciences Park
Warwick Manufacturing Group and the
Manufacturing Technology Centre
Local supply chain development
* The companies listed are intended as examples only, representative of the breadth of the business base
7
Challenges Facing Policy
The evidence base on the impact of covid-19 highlights a number of policy challenges, which have
acerbated underlying weaknesses in the regional ecosystem and also threaten our strengths:
Good health & wellbeing – The West Midlands already had poor health outcomes, the pandemic has
highlighted this and improving the health of the population continues to be an issue. Driving
improvement in physical activity and maximising the sectoral strengths the region such as the health
sector, data driven healthcare and life sciences could improve the position.
Reduced Inequalities – The pandemic has highlighted how unequal society is, from the impacts on
health and jobs at risk, through to the polarisation of communities. The pandemic has highlighted the
role of key workers in underpinning society and the importance of roles in the foundational economy to
vibrant, successful places. It has exposed how important it is to have access to digital infrastructure
and the breadth of skills to utilise it. It has exposed need for good digital and safe physical connectivity
to enable people to access jobs of the future.
Sustainable Cities & Communities – investing in community infrastructure is important for the future,
as we have seen a return to hyper local living and investment in local businesses this creates an
opportunity to build on changes the pandemic has brought to support SMEs and local high streets. The
importance of open, green space to wellbeing, community support and reducing unnecessary travel
are demand changes which could improve places in the long term. We have seen a change in the role
of the home, and being able to access good broadband infrastructure and outside space could change
the demands homeowners have and could change the face of city centres.
Decent work & economic growth – The pandemic has accelerated the need for investment in
employability to protect workers affected by Covid-19 and to prepare for Brexit. The region already has
underlying issues with people unable to access good employment because of their lack of
qualifications. The rapid adoption of technology could leave many behind who do not have the
advanced skills needed. The acceleration of youth unemployment and collapse of the industries they
work in such as visitor economy, retail and culture, is of major concern everywhere, but in a region with
internationally significant assets, these are also hit by the reduced global travel. The resilience of the
education infrastructure under social distancing and the changing nature of future employment is an
ongoing challenge to preparing people for the future. The impact of the pandemic makes addressing
these issues even more important going forward and to equip them with the skills needs of the future.
Industry, Innovation & infrastructure – As can be seen in our sectoral assessments we have many
assets and strengths in the region, but they are at risk. Forecasts demonstrate our assets can help us
recover quicker, so it is vital we make the most of and protect our assets. There is a need to ensure
people get the most out of our key companies, HS2, the Commonwealth Games and the City of
Culture, and position ourselves as a global region. There is a potential risk to our higher education
infrastructure as a driver of innovation and high level skills and business R&D investment, where we
are a leader, is a key risk going forward.
Affordable & Clean energy – the drive towards green, clean energy has accelerated with the impacts
of Covid-19, as people experience the drop in pollution from reduced movement and the demand for
different forms of safe transport rises. Along with the growth in technology and the drive for secure,
safe energy this leads to a need for increased transport capacity, green growth and electrification. The
West Midlands has major innovation assets in energy and electric vehicle manufacturing providing jobs
in one of our biggest sectors, which is also most at risk of collapse post Covid-19. The need to future
proof homes and businesses in terms of energy use was a key issue before the pandemic and
continues to be, this is especially important as there may be greater use of homes in the future as
workplaces, but opens up demand and opportunities for large scale retrofit programmes.
8
The West Midlands Combined Authority Area – summary data
The region has large differences between its towns and cities, with Birmingham dominating most statistics,
as would be expected as the largest Local Authority. But there is a great variation in performance within the
region (from last year’s State of the Region):
• There are 4m residents in the WMCA area. The Black Country has the highest population at 1.19m,
followed by Birmingham at 1.1m and Coventry at 366k
• There were 32k apprenticeship starts across the WMCA region an increase of 8.7% double the
national rate of 4.7%
• The number of people with highest qualifications at NVQ4 has increased by 4.4% to 860k compared
to a UK increase of 2.9%. Meaning a third of the working age population is educated to degree level.
The region needs another 173k to reach the national average.
• The number with no qualifications however have increased by 6,800 and increase of 2.4% compared
to a UK decrease of -1.3%.
• The employment rate was 72.4% compared to 75.6% for the UK as a whole, a net increase of 25,500
more people in employment. The employment rate is highest in Warwick at 86%, Stratford-on-Avon at
85% and lowest in Birmingham at 65%
• The unemployment rate as 5.5% compared to 4% for the UK a net increase of 4,200
• The WMCA region has 1.8m employees and business, professional and financial services accounts for
the highest percentage of jobs at just under 22% and the sector is increasing.
• Birmingham has 500k jobs followed by 450k in the Black Country, 162k in Coventry, with the lowest
number of jobs in Tamworth 29k and Wyre Forest at 32k.
• Bromsgrove has the highest earnings at £34.4k only slightly above Solihull at £34.1k, lowest earnings
are in Sandwell as £24.8k and Wolverhampton at £25.4k. However the gross domestic household
income has far less disparity, with Coventry and Warwickshire at £21.6k, Birmingham and Solihull
£17.9k and Black Country £15.6k
• Overall deprivation is high with 34.5% of local areas in the most deprived in the country. Birmingham
has 41% of its neighbourhoods in the 10% most deprived, followed by Walsall at 26% and
Wolverhampton at 21%.
• Birmingham GVA is £29bn, and the next highest was the Black Country at £21.2bn, Solihull at £9.8m,
and Coventry at £9.5m. The lowest is in Wyre Forest at £1.4bn followed by Tamworth at £1.5bn.
However GVA per employee is more balanced with narrower gaps demonstrating the greater numbers
of “lower value” roles such as Birmingham at £56k, but the highest is Solihull at £80k, and Warwick at
£73K to the lowest of £41k in Walsall.
• There were 170,475 active enterprises, and increase of 1.7%, where the UK experienced a decrease
of 0.3%. Birmingham has 46.6k businesses, followed by the Black Country at 38.3k, Coventry 11.6k
and Bromsgrove 11.5k, this order is replicated in the number of business starts. 18,805 enterprise births
in 2013 in the WMCA (3 LEP), 42.1% (7,910) were still active in 2018. This is slightly below the UK
survival rate of 42.4%
• Solihull has the best school readiness levels at 72.6% through to Sandwell at 66.8%. The average
Progress 8 score in the West Midlands 7 Met. area has increased from -0.14 in 2018 to -0.08 in 2019.
Birmingham was rated as ‘Above Average’; both Solihull and Wolverhampton as ‘Average’; while
Coventry, Dudley, Sandwell and Walsall were deemed ‘Below Average’. Solihull has the best school
readiness levels at 72.6% through to Sandwell at 66.8%
• In the West Midlands region, the value of exports has decreased from £32.6bn in the year of 2019 Q1
to £30.6bn in the year 2020 Q1
• There are 1,735,709 dwellings in the WMCA (3 LEP) area in 2019, an increase of 16,615 dwellings
since 2018
9
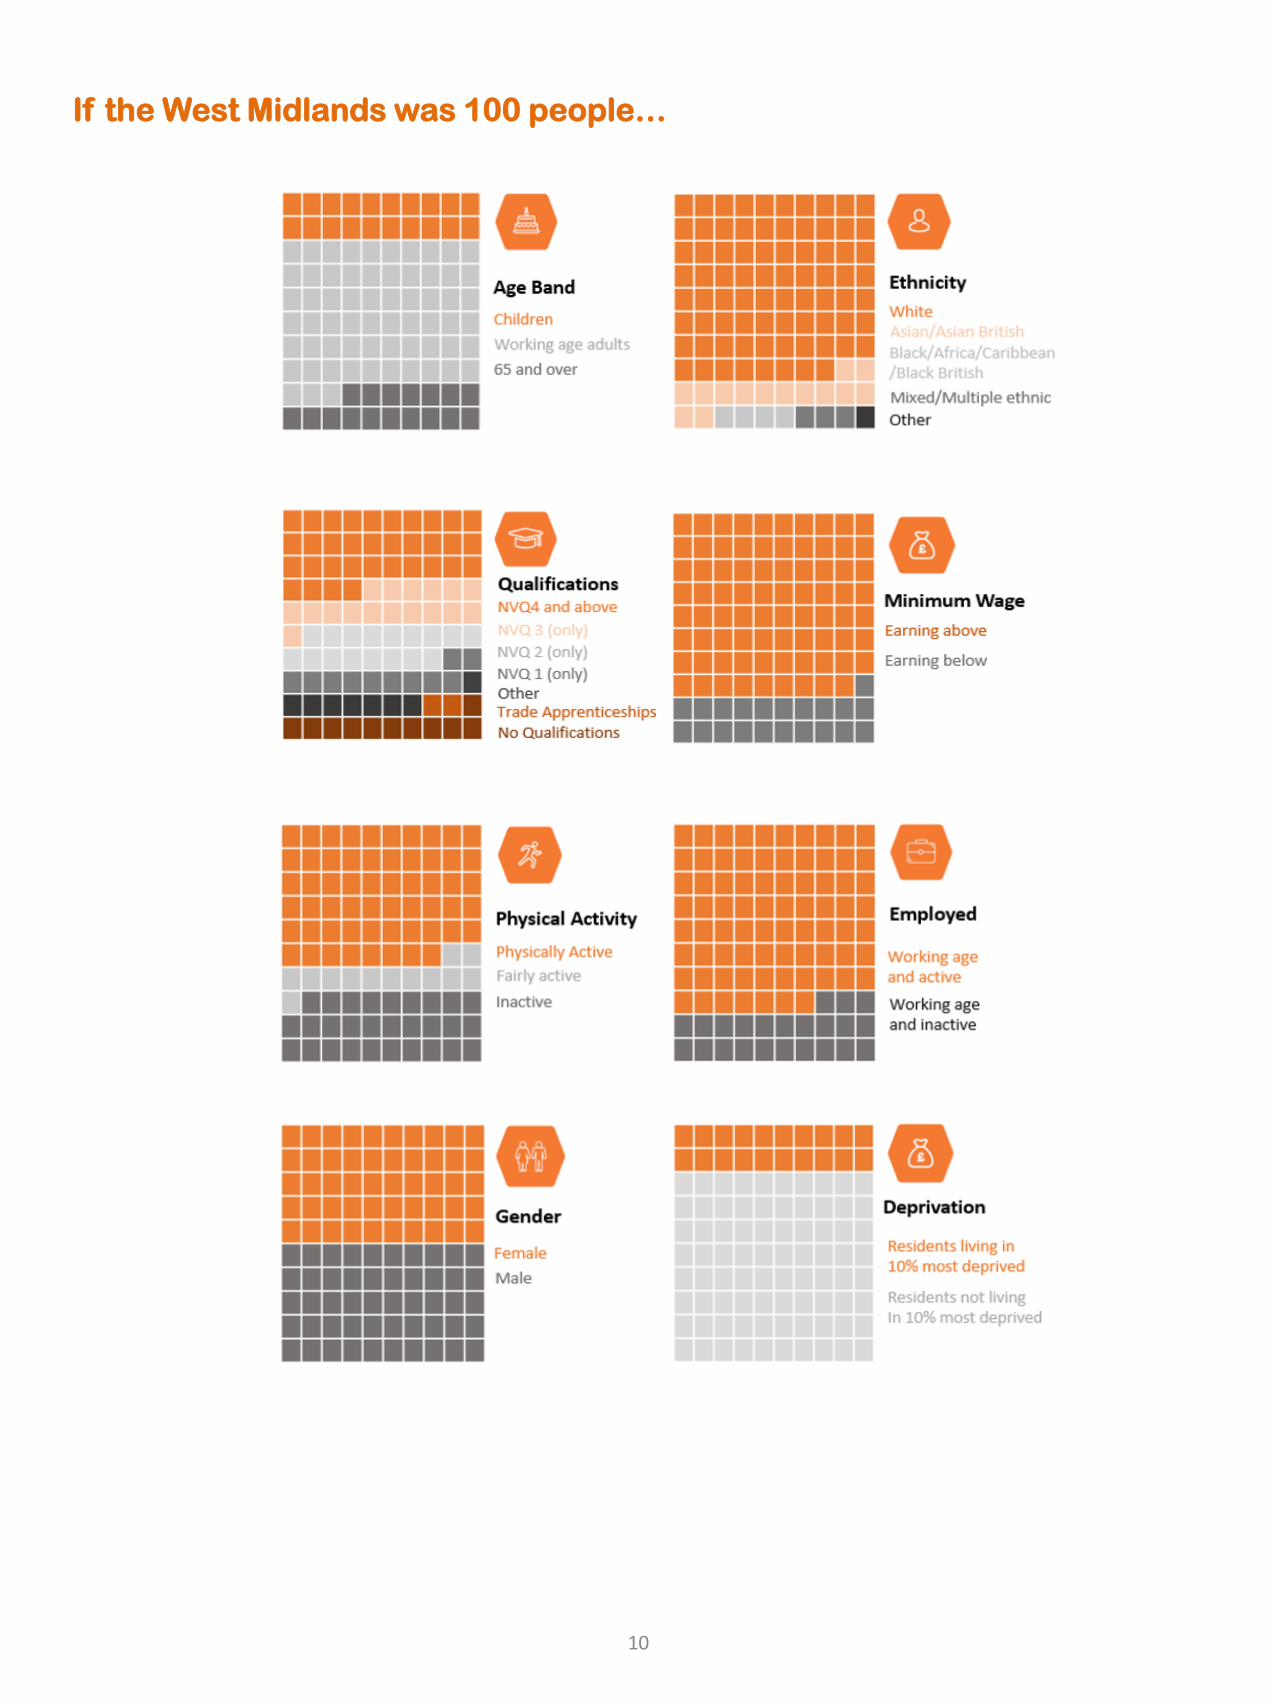
If the West Midlands was 100 people…
10
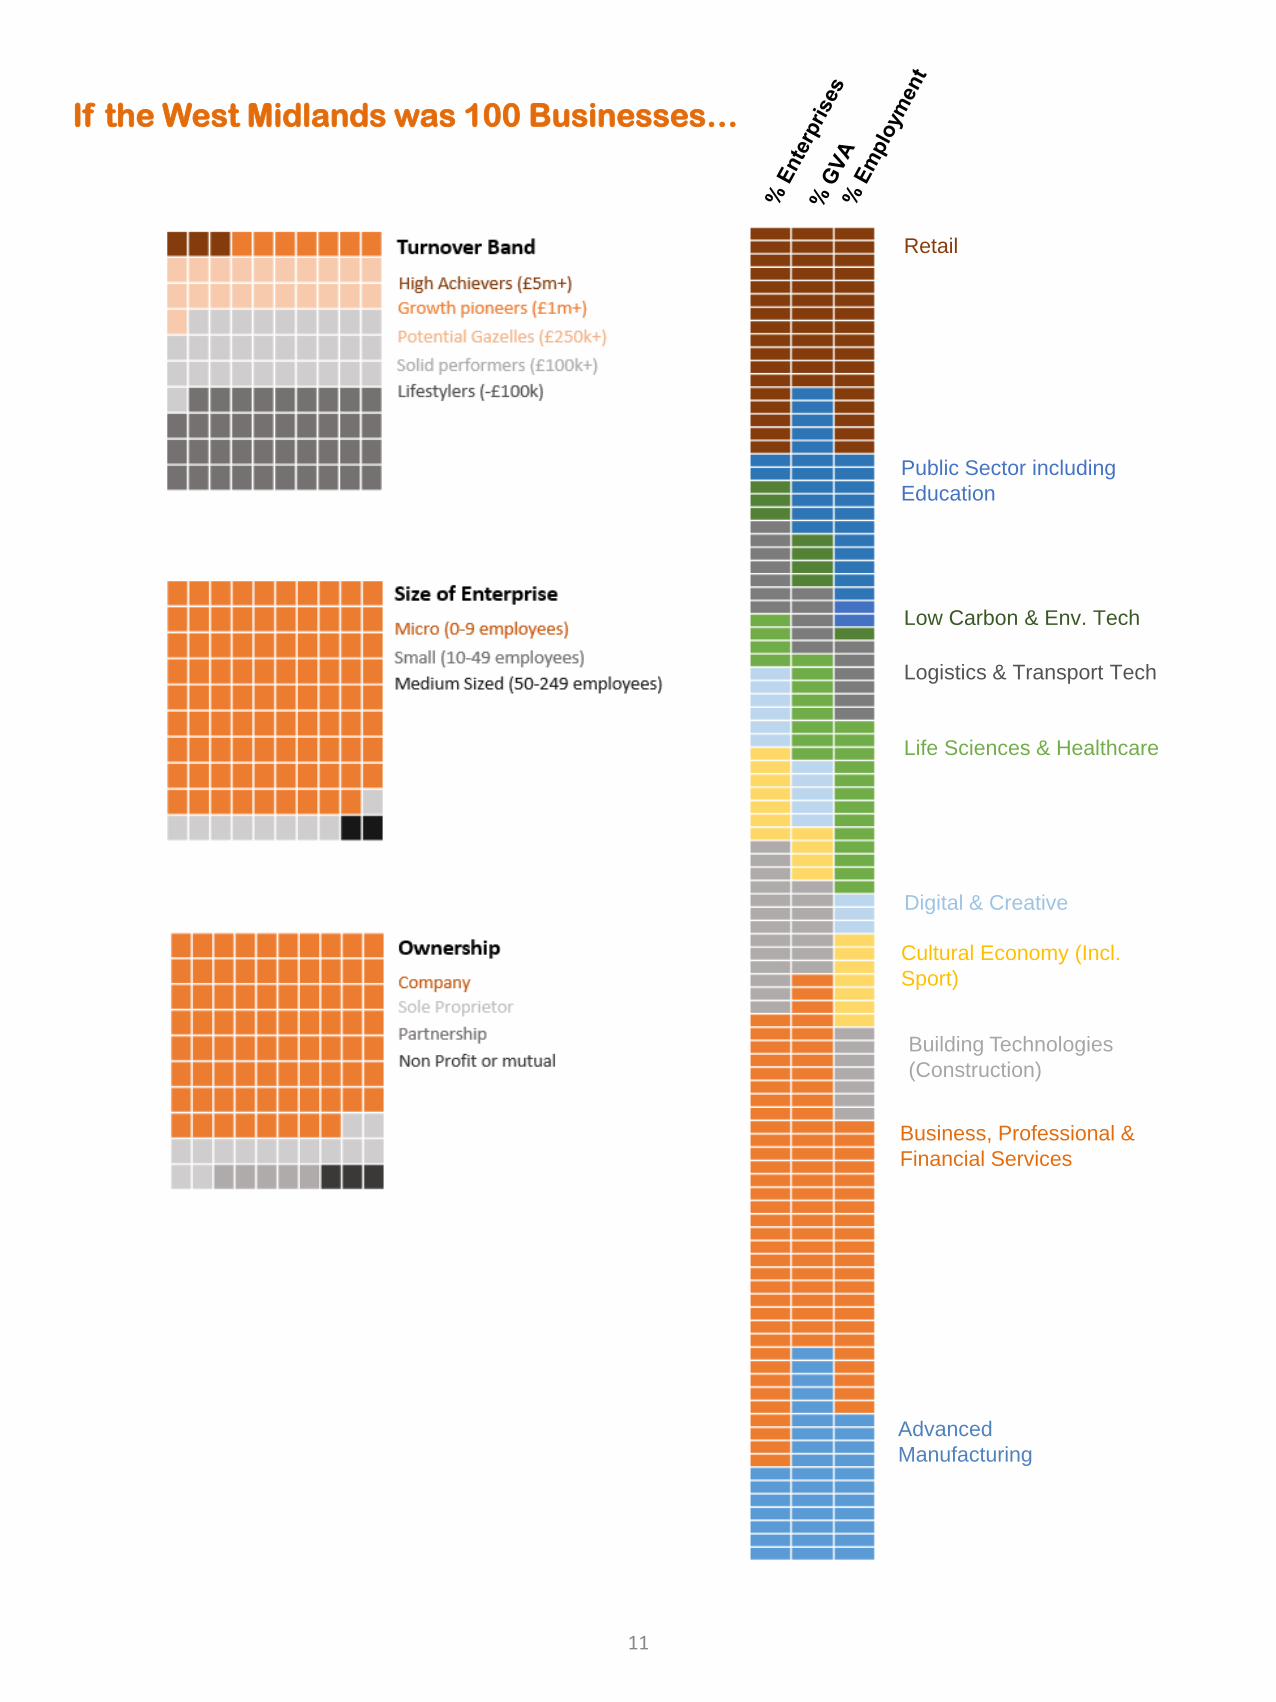
If the West Midlands was 100 Businesses…
Advanced
Manufacturing
Business, Professional &
Financial Services
Building Technologies
(Construction)
Cultural Economy (Incl.
Sport)
Digital & Creative
Life Sciences & Healthcare
Logistics & Transport Tech
Low Carbon & Env. Tech
Public Sector including
Education
Retail
11
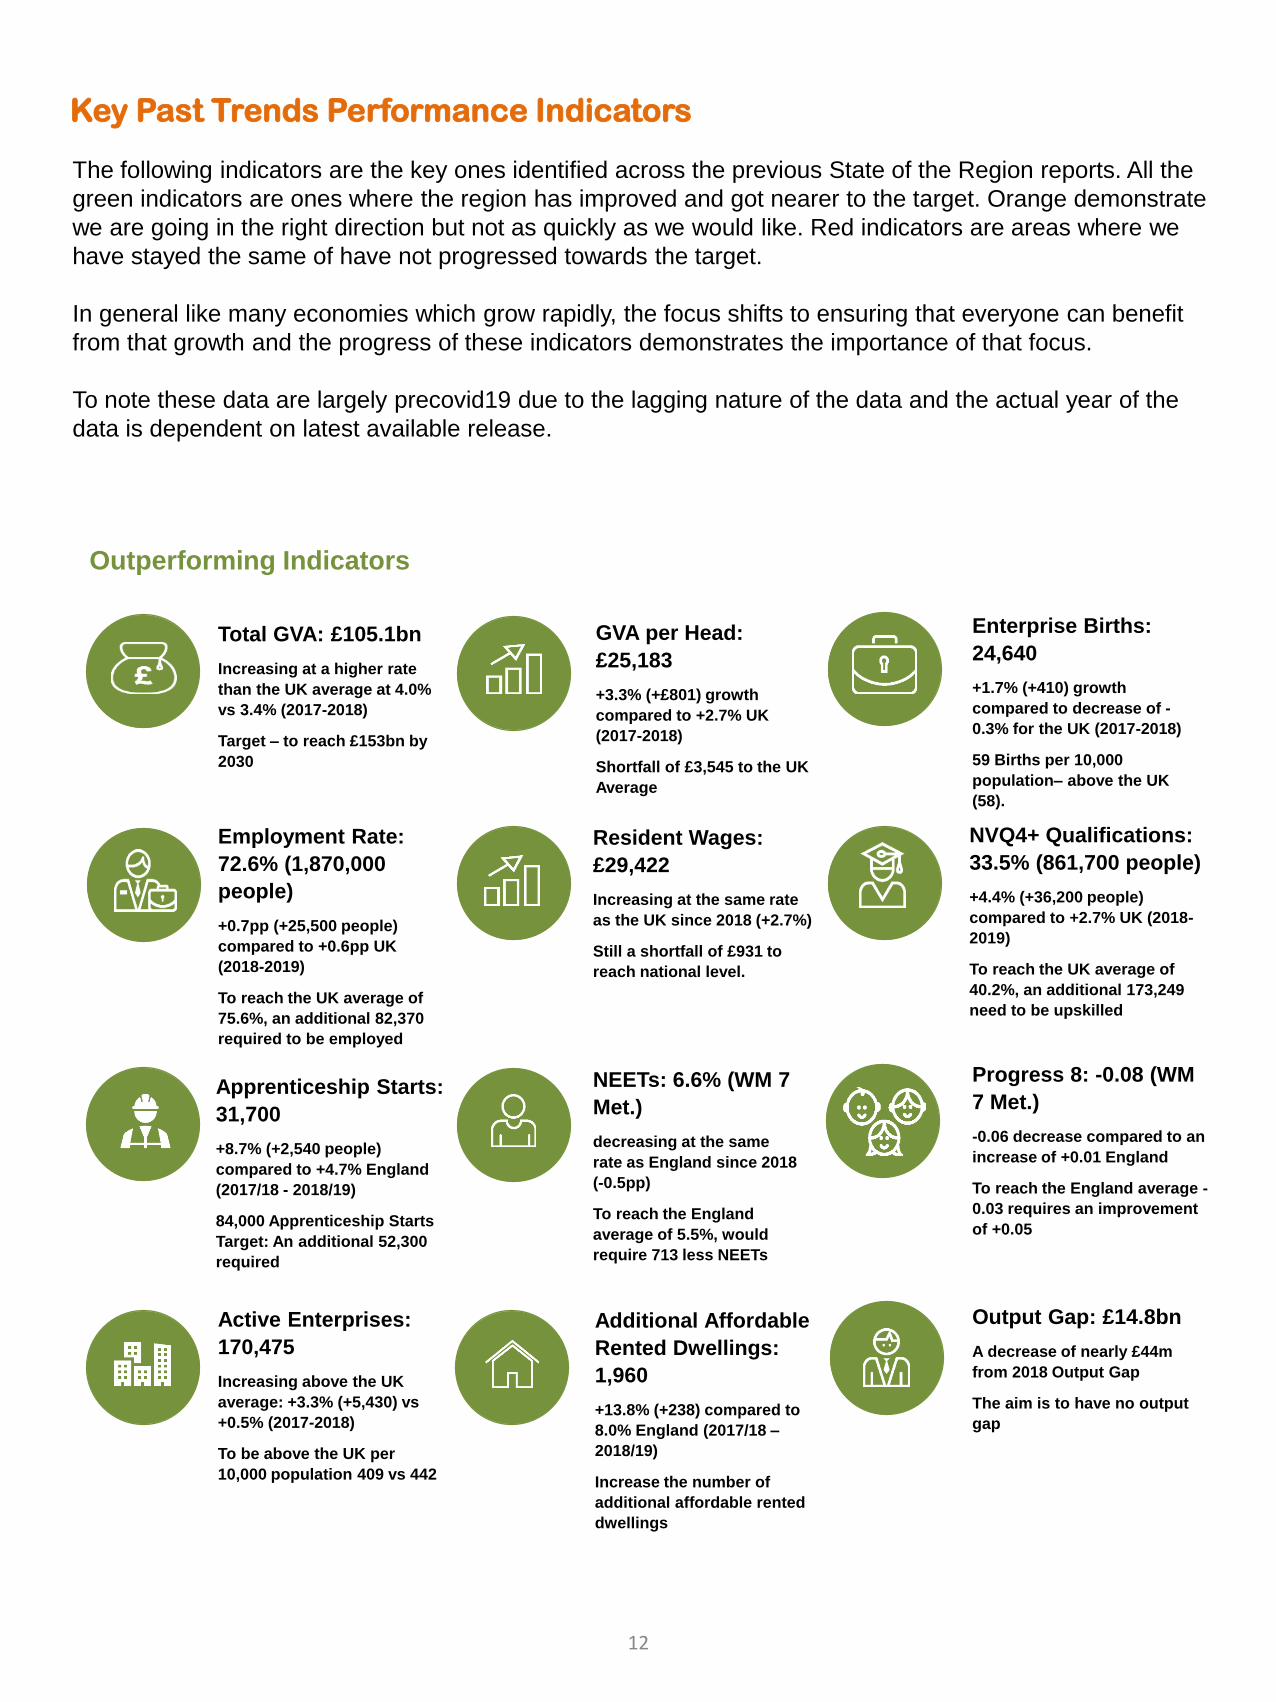
Key Past Trends Performance Indicators
The following indicators are the key ones identified across the previous State of the Region reports. All the
green indicators are ones where the region has improved and got nearer to the target. Orange demonstrate
we are going in the right direction but not as quickly as we would like. Red indicators are areas where we
have stayed the same of have not progressed towards the target.
In general like many economies which grow rapidly, the focus shifts to ensuring that everyone can benefit
from that growth and the progress of these indicators demonstrates the importance of that focus.
To note these data are largely precovid19 due to the lagging nature of the data and the actual year of the
data is dependent on latest available release.
Outperforming Indicators
Total GVA: £105.1bn
Increasing at a higher rate
than the UK average at 4.0%
vs 3.4% (2017-2018)
Target – to reach £153bn by
2030
GVA per Head:
£25,183
+3.3% (+£801) growth
compared to +2.7% UK
(2017-2018)
Shortfall of £3,545 to the UK
Average
Enterprise Births:
24,640
+1.7% (+410) growth
compared to decrease of -
0.3% for the UK (2017-2018)
59 Births per 10,000
population– above the UK
(58).
Employment Rate:
72.6% (1,870,000
people)
+0.7pp (+25,500 people)
compared to +0.6pp UK
(2018-2019)
To reach the UK average of
75.6%, an additional 82,370
required to be employed
Resident Wages:
£29,422
Increasing at the same rate
as the UK since 2018 (+2.7%)
Still a shortfall of £931 to
reach national level.
NVQ4+ Qualifications:
33.5% (861,700 people)
+4.4% (+36,200 people)
compared to +2.7% UK (2018-
2019)
To reach the UK average of
40.2%, an additional 173,249
need to be upskilled
Apprenticeship Starts:
31,700
+8.7% (+2,540 people)
compared to +4.7% England
(2017/18 - 2018/19)
84,000 Apprenticeship Starts
Target: An additional 52,300
required
NEETs: 6.6% (WM 7
Met.)
decreasing at the same
rate as England since 2018
(-0.5pp)
To reach the England
average of 5.5%, would
require 713 less NEETs
Progress 8: -0.08 (WM
7 Met.)
-0.06 decrease compared to an
increase of +0.01 England
To reach the England average -
0.03 requires an improvement
of +0.05
Active Enterprises:
170,475
Increasing above the UK
average: +3.3% (+5,430) vs
+0.5% (2017-2018)
To be above the UK per
10,000 population 409 vs 442
Additional Affordable
Rented Dwellings:
1,960
+13.8% (+238) compared to
8.0% England (2017/18 –
2018/19)
Increase the number of
additional affordable rented
dwellings
Output Gap: £14.8bn
A decrease of nearly £44m
from 2018 Output Gap
The aim is to have no output
gap
12
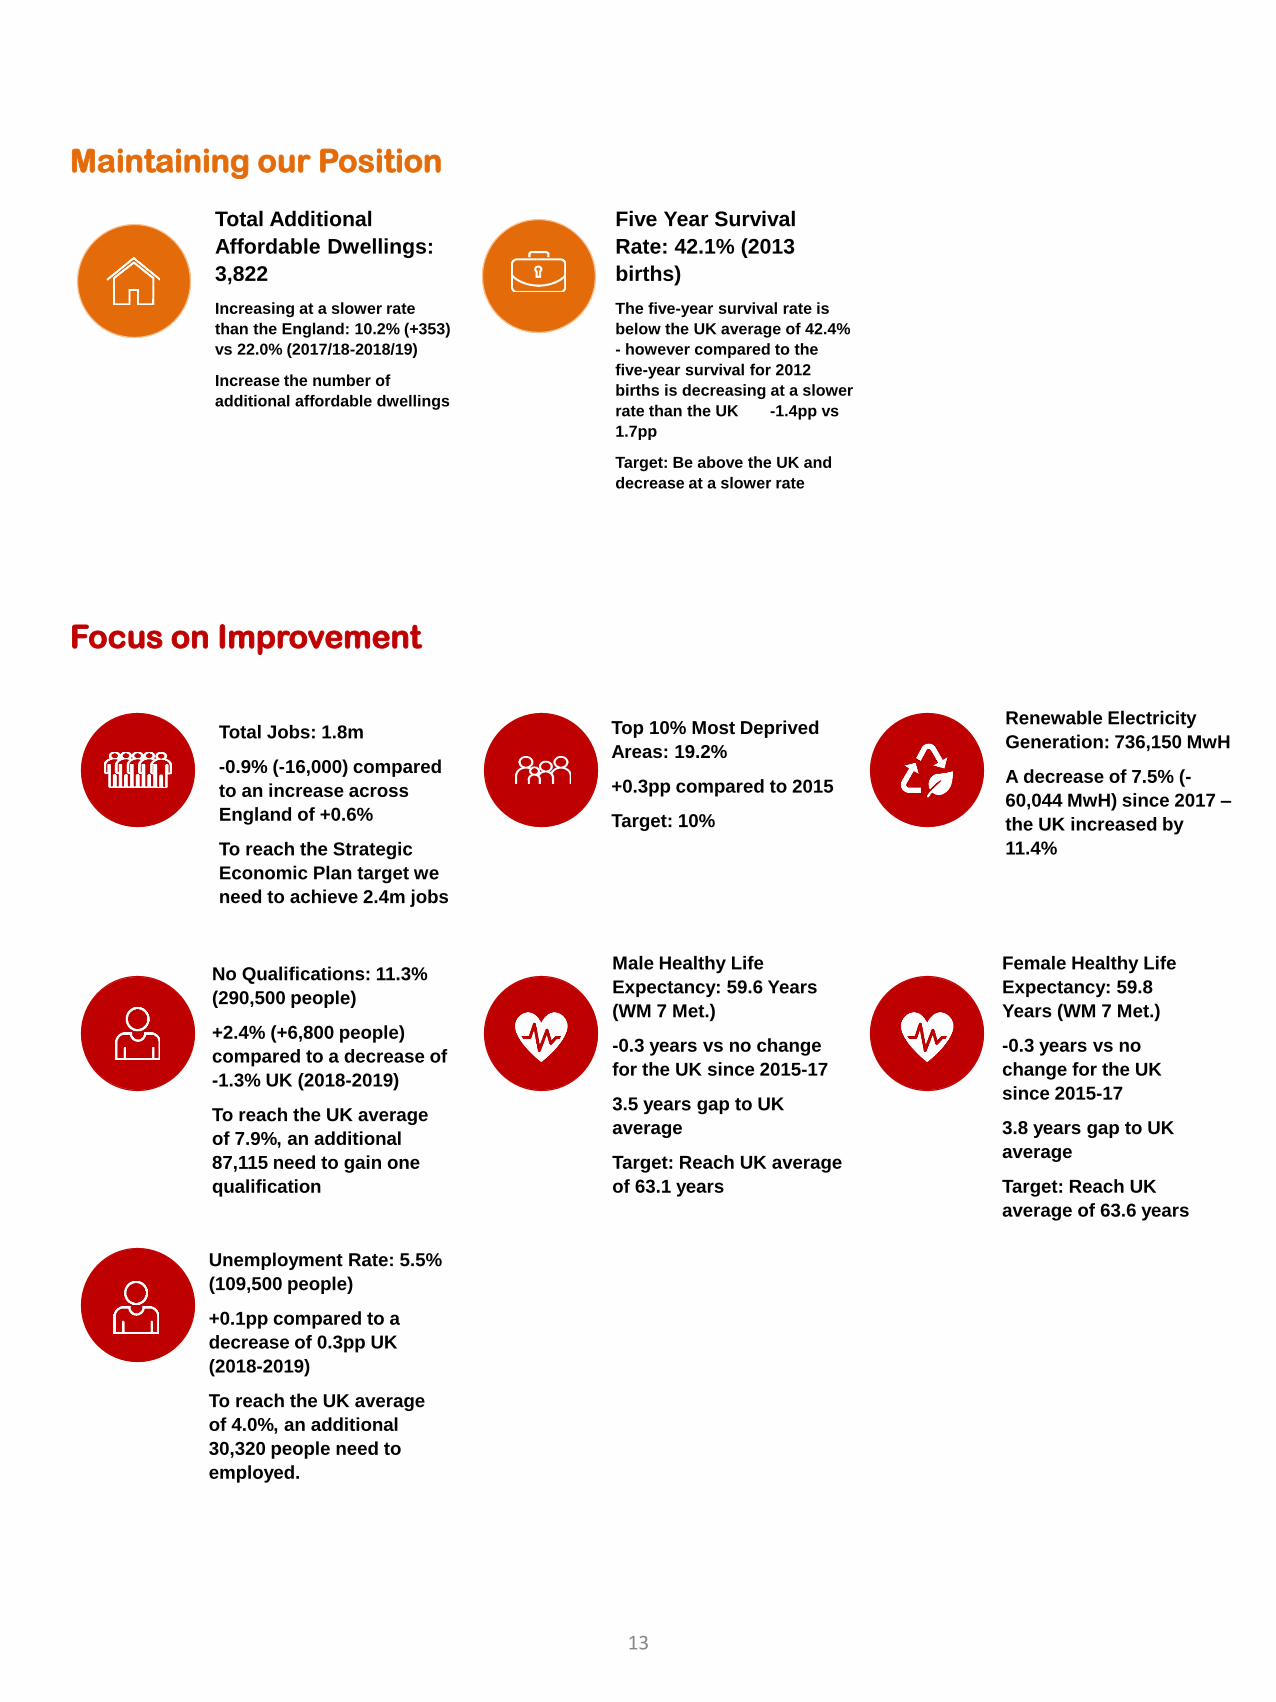
Focus on Improvement
Maintaining our Position
Total Additional
Affordable Dwellings:
3,822
Increasing at a slower rate
than the England: 10.2% (+353)
vs 22.0% (2017/18-2018/19)
Increase the number of
additional affordable dwellings
Five Year Survival
Rate: 42.1% (2013
births)
The five-year survival rate is
below the UK average of 42.4%
- however compared to the
five-year survival for 2012
births is decreasing at a slower
rate than the UK -1.4pp vs
1.7pp
Target: Be above the UK and
decrease at a slower rate
Total Jobs: 1.8m
-0.9% (-16,000) compared
to an increase across
England of +0.6%
To reach the Strategic
Economic Plan target we
need to achieve 2.4m jobs
Top 10% Most Deprived
Areas: 19.2%
+0.3pp compared to 2015
Target: 10%
Renewable Electricity
Generation: 736,150 MwH
A decrease of 7.5% (-
60,044 MwH) since 2017 –
the UK increased by
11.4%
No Qualifications: 11.3%
(290,500 people)
+2.4% (+6,800 people)
compared to a decrease of
-1.3% UK (2018-2019)
To reach the UK average
of 7.9%, an additional
87,115 need to gain one
qualification
Male Healthy Life
Expectancy: 59.6 Years
(WM 7 Met.)
-0.3 years vs no change
for the UK since 2015-17
3.5 years gap to UK
average
Target: Reach UK average
of 63.1 years
Female Healthy Life
Expectancy: 59.8
Years (WM 7 Met.)
-0.3 years vs no
change for the UK
since 2015-17
3.8 years gap to UK
average
Target: Reach UK
average of 63.6 years
Unemployment Rate: 5.5%
(109,500 people)
+0.1pp compared to a
decrease of 0.3pp UK
(2018-2019)
To reach the UK average
of 4.0%, an additional
30,320 people need to
employed.
13
Impact of Covid-19
The following section explores the impact of the pandemic on the region and its
economy. This is a summary of what we know as at end of June 2020. The
impacts and effects are still emerging and recovery depends on the return of
consumer demand, global recovery and the likelihood of further waves of the
virus.
14
Impact of Covid-19 – Key Issues
Since the start of the pandemic the West Midlands performance has changed dramatically, as is the case
everywhere throughout the UK and elsewhere. Key issues are:
• Forecasters are now coming to a general consensus that the UK is looking at a sharp fall and slower
recovery over at least 2 years, with some sectors taking longer to recover. This relies on a post
Brexit trade deal, no further lockdowns, a credible vaccine and return of consumer spending. The
prolonged international lock down, lack of travel, and social distancing may change attitudes to what
consumers value and need in the longer term, the effects of which we have yet to see emerge.
• The West Midlands may face the largest economic decline of all regions at 9.2% (fall in GDP),
however it may see the largest growth in 2021 at 8.1%. This is based on having the largest number of
temporary closures and an expectation of most reopening. This however is far from certain and will be
affected by social distancing measures and the implications of a second wave and continued
lockdowns. Businesses regionally feel there is limited expectation of a consumer bounce-back due to
social distancing. Businesses have utilised spare cash and resources and are reluctant to take on debt.
• The youth claimant count had risen to 41,225 by May 2020, 8.3% of the young population, nearly
doubling youth unemployment. It now sits 5th amongst combined authority areas but the rate of
increase was much higher than elsewhere. As a region with high numbers of young people, we have a
population facing multiple impacts from the pandemic. Closure of sectors which employ them, education
system changing rapidly to cope with social distancing and the loss of final term in schools weakens the
transition points between school, further and higher education and employment.
• Overall claimants stand at 208k, which is 6.3% of the working age population a rise from 115,000 and
3.5% in February, however overall increase in claims has been slower than other areas. This is despite
the extensive furloughing which stands at 496k people in the WMCA area, which equates to 26.9%
of jobs and is seen by business as the most successful of interventions. Businesses are flagging that
although this is an excellent policy approach, it may just be moving the redundancy problem down the
road if consumer spend and business activity doesn’t return and they aren't supported to adapt
• Headline analysis suggests that the public sector (including higher education) and the visitor
economy sector will be the sectors most impacted from the Covid-19, followed by construction,
manufacturing and retail. Analysis suggests that the life science and healthcare may be the only sector
that will be relatively unscathed, but notably it is also one of main sectors that has took the brunt of the
human impact from Covid-19.
• Apprenticeships: the CA has the highest level of available vacancies compared to other regions,
1,643, which is a positive for the region. However this has declined recently, and recent business
surveys show a decline in training and apprenticeship opportunities
• The WMCA area had the highest death rates at the start of all CAs but dropped down the rankings in
later months. Overall however the 3 LEP geography has had the most deaths at over 4000. The
pandemic hits cities harder. Pandemics hit denser, poorer, urban populations more, as social distancing
is harder and over crowding more common
• Purchasing Managers Index (PMI) show business activity has dropped from 51.2 (over 50 signals
growth, under 50 signals contraction) to 10.9, the lowest levels ever and back to 27.9. To be expected in
these extraordinary conditions. However the PMI future business activity is holding up rising from 55.9
to 62.1 (down from 72.3% signalling businesses are positive about the future once lockdown ends
15
Impact of Covid-19 – Short Term Indicators
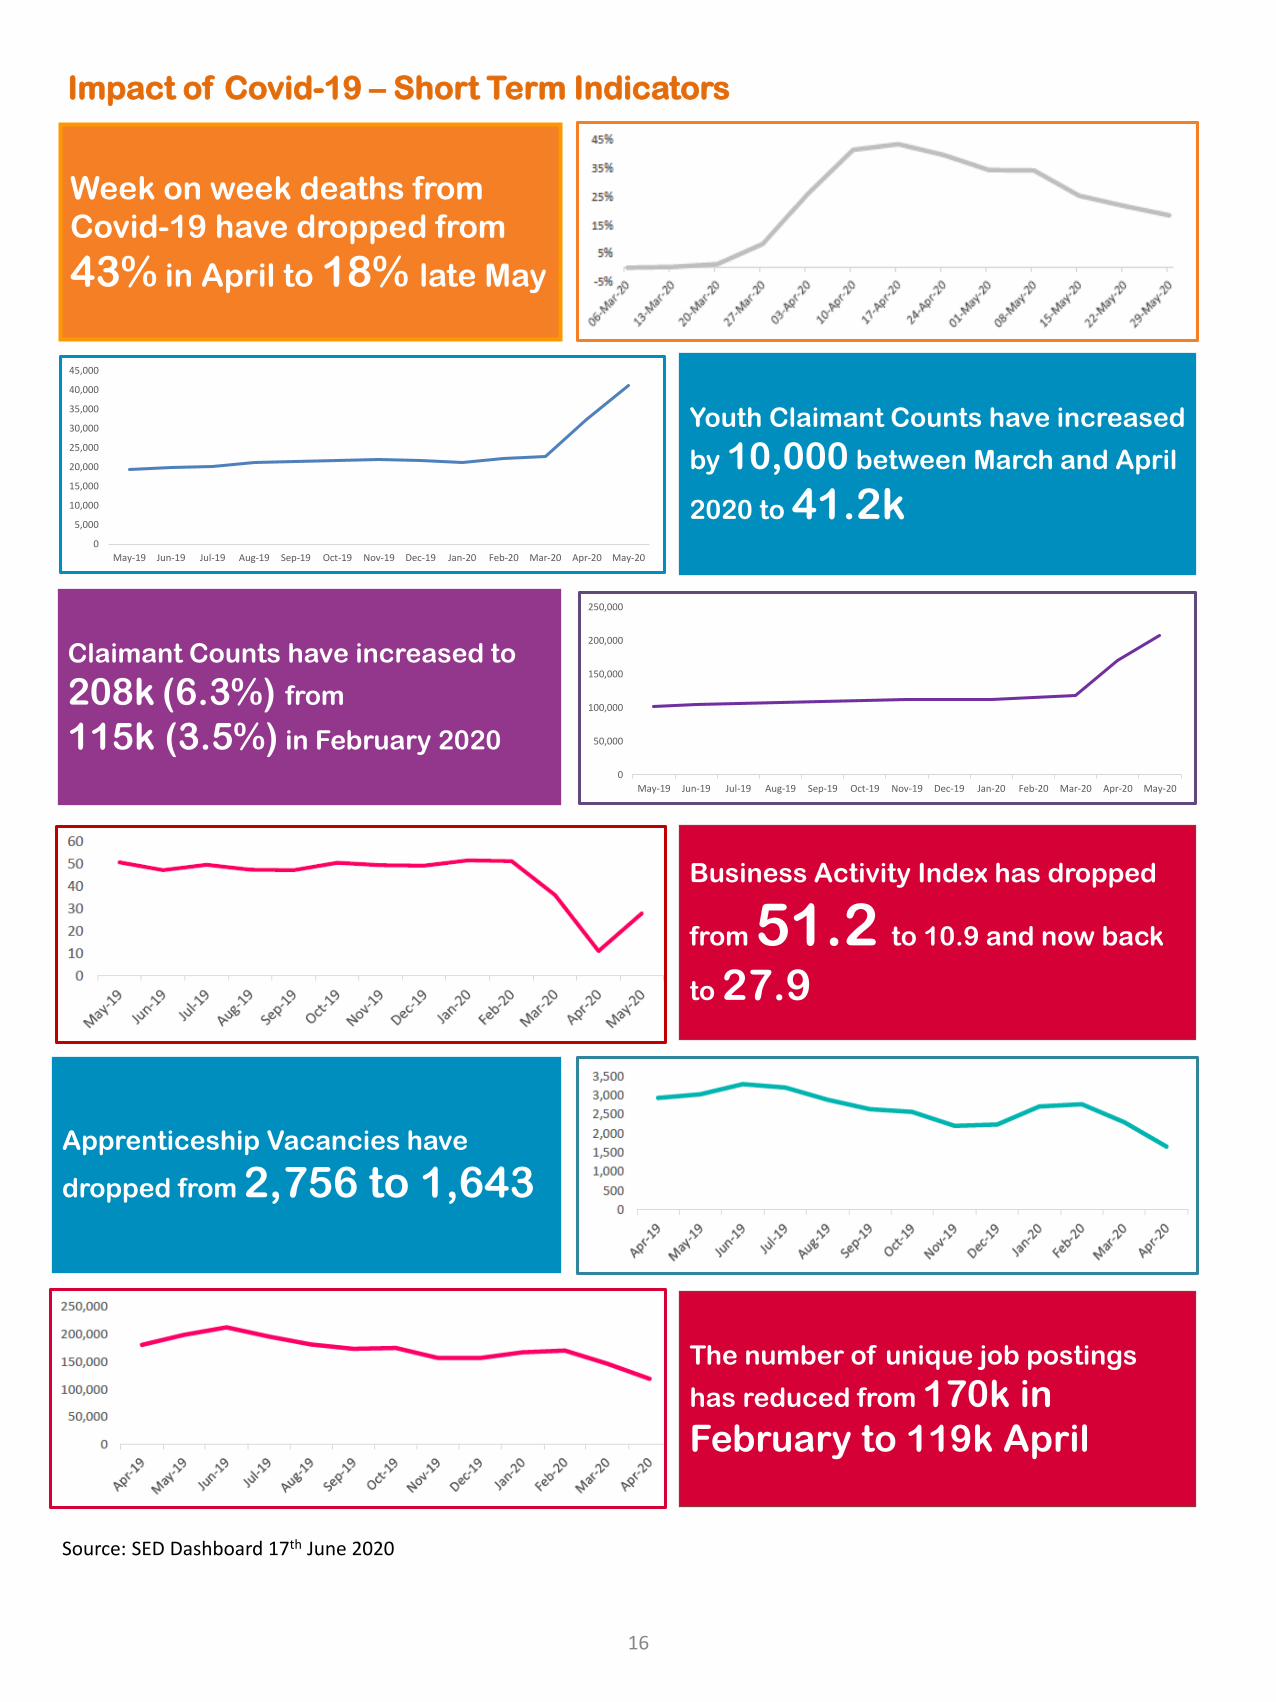
Week on week deaths from
Covid-19 have dropped from
43% in April to 18% late May
0
5,000
10,000
15,000
20,000
25,000
30,000
35,000
40,000
45,000
May-19 Jun-19 Jul-19 Aug-19 Sep-19 Oct-19 Nov-19 Dec-19 Jan-20 Feb-20 Mar-20 Apr-20 May-20
Youth Claimant Counts have increased
by 10,000 between March and April
2020 to 41.2k
Claimant Counts have increased to
208k (6.3%) from
115k (3.5%) in February 2020 0
50,000
100,000
150,000
200,000
250,000
May-19 Jun-19 Jul-19 Aug-19 Sep-19 Oct-19 Nov-19 Dec-19 Jan-20 Feb-20 Mar-20 Apr-20 May-20
Business Activity Index has dropped
from 51.2 to 10.9 and now back
to 27.9
Apprenticeship Vacancies have
dropped from 2,756 to 1,643
The number of unique job postings
has reduced from 170k in
February to 119k April
Source: SED Dashboard 17th June 2020
16
Impact of Covid-19 - Overview
Reviewing the extensive monitoring we have carried out over the last three months there is cause for
concern, but the focus now should be on recovery and protecting our assets. Businesses are ready for
change and are already innovating, we have to ensure that local skills and employment policies ensure
people, especially the young, women and Black and minority ethnics groups who have been hit hardest by
the impacts can fit into this change. We may also need to prepare for economic restructuring which
significantly changes the job structure in the region. We also need to support and promote a return to good
spending and the financial resilience in businesses and households.
There are signs that businesses are adjusting their employment but remaining productive, if this pattern
grows or remains in the long term it could point towards higher levels of structural unemployment but
improved productivity (similar to other European countries). Since 2009 the UK has maintained / grown
employment levels and protected the skilled workforce but the trend outlined above may signal the end of
that pattern. Rather the emerging pattern may be more aligned to the structural changes in the 1980s. This
would lead to high levels of unemployment once furlough ends.
Covid-19 could exacerbate our weaknesses and undermine our strengths. This means we need to protect
our assets, such as the diversity of our population, entrepreneurial business base, our improving skills
base, strong levels of exporting and international networks, high business investment and the growing
employment base and wage growth.
There is a need to ensure our strong sectors survive and flagship companies that support supply chains
can adapt, such as business and professional services, construction, automotive and university sector. All
sectors currently under threat, and with a high volume of jobs to maintain and grow levels of quality jobs.
Sectors which are expected to bounce back, such as retail, hospitality, tourism and culture and provide
large numbers of jobs and are based on large numbers of SMES need to be supported to open back up
and adapt to the changes. There is a need to build recovery on a resilient infrastructure, which encourages
diversifying and supporting local growth, employment and supply chains and moving to a greener future. At
the same time we need to develop new ways of working internationally in a tech-based future.
Reviewing the 1918 pandemic for wider economic, social and longer term impacts, some key issues can be
seen emerging now, most notably higher death rates in the poor, disadvantaged communities. Variability at
the time was attributed to inequalities of wealth and social status, bad diet, crowded living which created an
environment where the poor, immigrants and ethnic minorities were more susceptible to infection. As a
result cities were hit harder and it took 2 years to recover, with generally 3 peaks, the second more severe
due to early lifting of lock down measures in some countries. These unequal impacts are being replicated
today.
17
Impact of Covid-19 – Impact on our Health
Beyond the economic impact: COVID-19 and health inequalities
The conditions in which we are born, grow, live, work and age have important implications for our physical
and mental health, as individuals and across wider society. The West Midlands Combined Authority
(WMCA) sets out a vision for building a healthier, happier, better connected and more prosperous West
Midlands, recognising the inextricable link between health and wealth. COVID-19 has the potential to
create and widen health inequalities, both through the direct impacts of the virus, and the indirect impacts
of the control measures imposed. While underlying health conditions increase the risk of serious
consequences from infection, the economic and social response to COVID-19 has the potential to
exacerbate inequalities in physical and mental health.
Many of the frontline key workers who are most at risk of contracting the virus are in low paid, insecure
employment. Where someone’s home is not a place of safety, or when they do not have ready access to
essentials such as food and medicine, being more isolated may place them at greater risk of harm. Social
distancing and isolation can have a detrimental impact on mental health and wellbeing, including through
harmful health behaviours and reducing access to services and support.
Crucially, the pandemic has highlighted existing socioeconomic inequalities that have underpinned poorer
outcomes in already disadvantaged groups. A recent review by Public Health England (PHE) confirmed that
the that the impact of COVID-19 has replicated existing health inequalities and, in some cases, has
increased them.
Nationally, the largest disparity found was by age. Among people already diagnosed with COVID19, people
who were 80 or older were seventy times more likely to die than those under 40. Risk of dying among those
diagnosed with COVID-19 was also higher in males than females; those living in the more deprived areas
than those living in the least deprived; and those in Black, Asian and Minority Ethnic (BAME) groups than in
White ethnic groups.
It is important to note that these analyses did not take into account underlying health conditions or
differences in occupational groups. However, a further review focusing specifically on BAME groups found
that BAME individuals are more likely to work in occupations with a higher risk of COVID-19 exposure. In
addition, the risks associated with COVID-19 transmission, morbidity, and mortality can be exacerbated by
the housing challenges faced by some members of BAME groups.
Consultation with stakeholders also highlighted historic negative experiences of healthcare or at work may
mean that individuals in BAME groups are less likely to seek care when needed or as NHS staff less likely
to speak up when they have concerns about PPE or testing.
Socioeconomic inequalities have consistently been highlighted as key. BAME groups tend to have poorer
socioeconomic circumstances which lead to poorer health outcomes; ONS data and PHE analysis
confirmed the strong association between economic disadvantage and COVID-19 diagnoses, incidence
and severe disease. Economic disadvantage is also strongly associated with the prevalence of smoking,
obesity, diabetes, hypertension and their cardio-metabolic complications, which all increase the risk of
disease severity.
While unpacking the relative contributions made by different social and economic factors is challenging as
they often intersect and do not all act independently, it is clear that action is needed across the whole
system to improve the wider determinants of health and actively reduce inequalities. This in line with the
inclusive growth principles promoted by the WMCA, and reinforces the importance of building an inclusive
economy where all citizens can benefit.
18
What is happening in the West Midlands?
Aggregated data for the WMCA show that on average, local authority areas ranking higher for
socioeconomic deprivation also have higher rates of COVID-19 related deaths. This demonstrates that
there is a broad correlation between area deprivation and COVID-19 related deaths.
This should be interpreted with caution, as overall levels of deprivation within an area can mask more
complex relationships and inequalities. However, we also know that the areas with higher levels of
deprivation and higher rates of COVID-19 related deaths are also those where life expectancy and healthy
life expectancy are generally lower, and where persisting health and socioeconomic inequalities are
greater.
Those within the Black ethnic group may be most affected by exposure to infection as it has the largest
population proportion of healthcare workers. The Pakistani ethnic group may be most affected due to an
increased risk of infection through exposure to general public as having the largest population proportion of
transport and storage workers. This group also be most affected by exposure to loss of income as having
the largest population proportion of wholesale and retail trade workers along with the ‘other Asian ethnic
group ’ population also affected by exposure to loss of income as having the largest population proportion
of accommodation and food services workers.
19
Impact of Covid-19 – Impact on our Health
Impact of Covid-19 – Impact on our Health
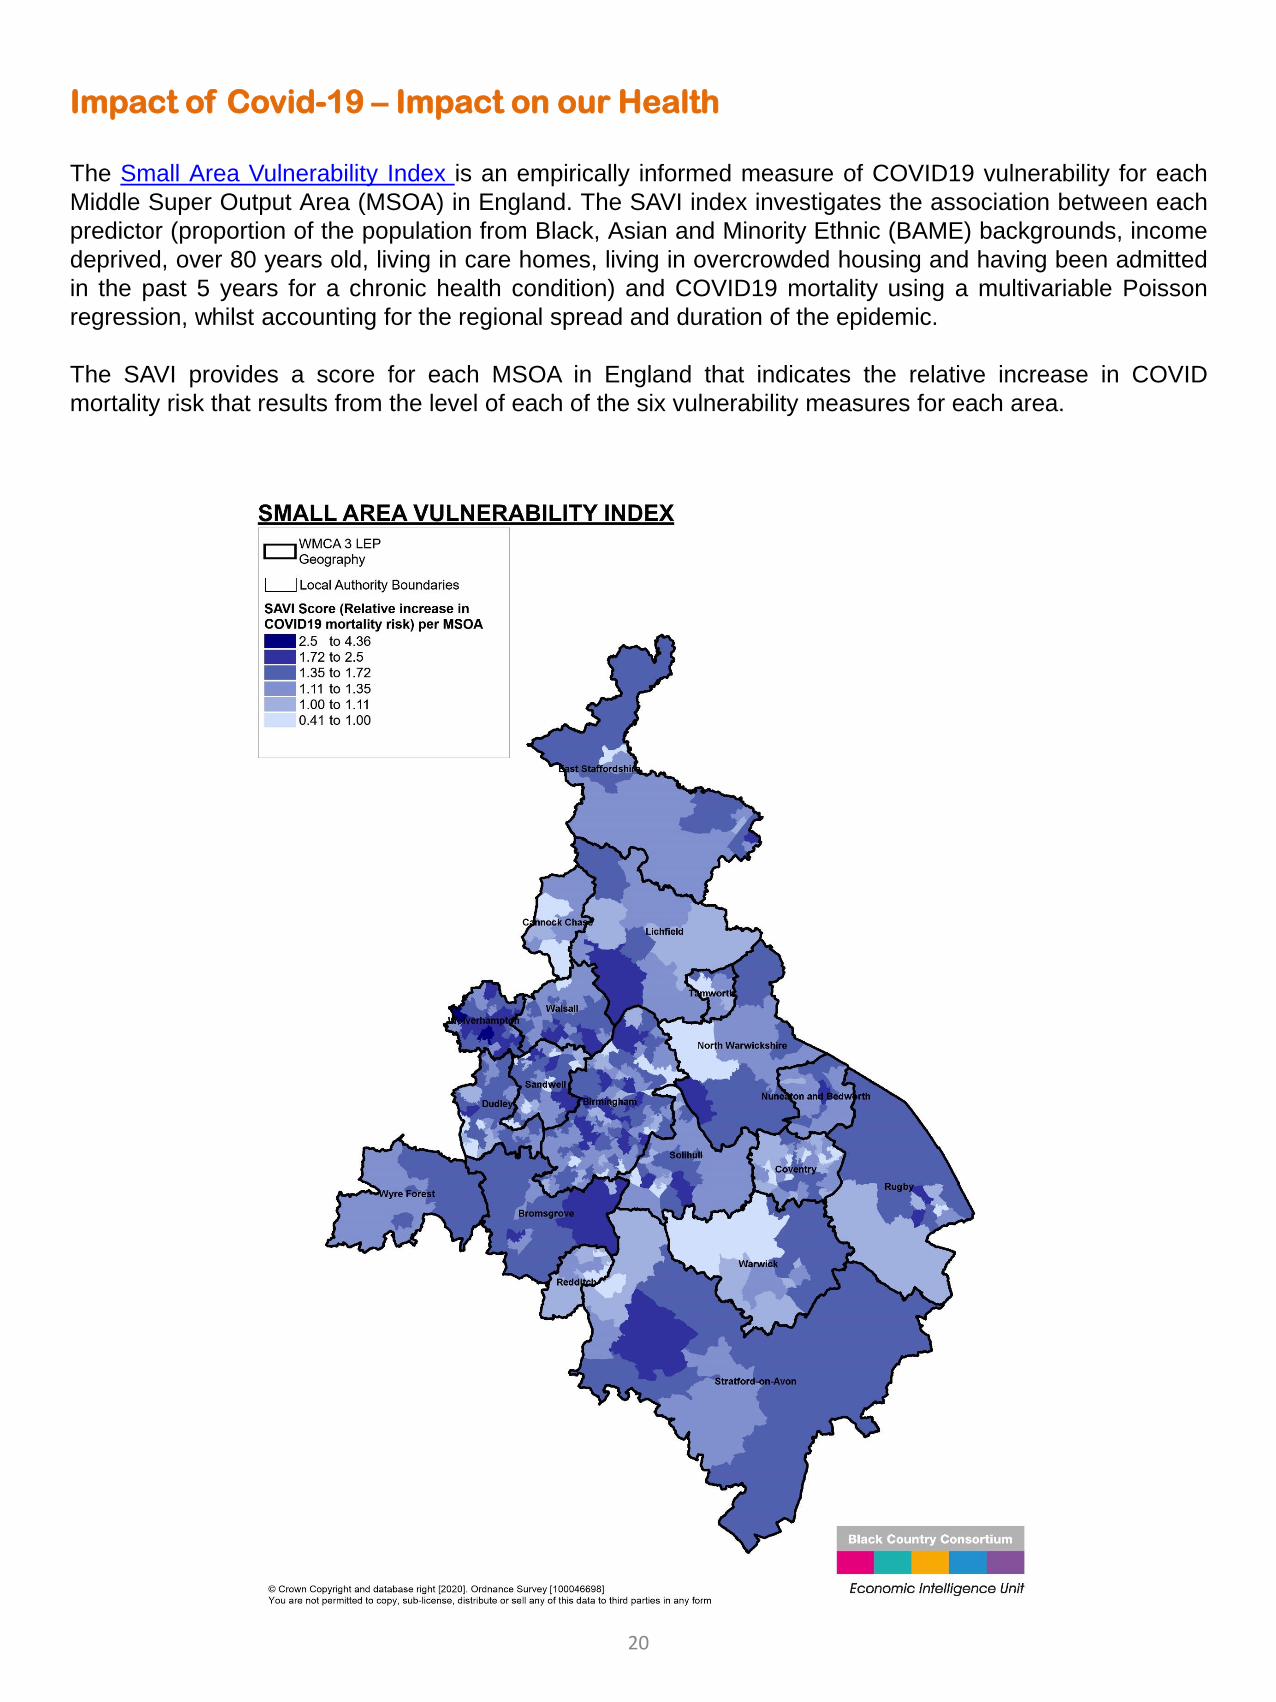
The Small Area Vulnerability Index is an empirically informed measure of COVID19 vulnerability for each
Middle Super Output Area (MSOA) in England. The SAVI index investigates the association between each
predictor (proportion of the population from Black, Asian and Minority Ethnic (BAME) backgrounds, income
deprived, over 80 years old, living in care homes, living in overcrowded housing and having been admitted
in the past 5 years for a chronic health condition) and COVID19 mortality using a multivariable Poisson
regression, whilst accounting for the regional spread and duration of the epidemic.
The SAVI provides a score for each MSOA in England that indicates the relative increase in COVID
mortality risk that results from the level of each of the six vulnerability measures for each area.
20
Impact of Covid-19 – Impact on our Health
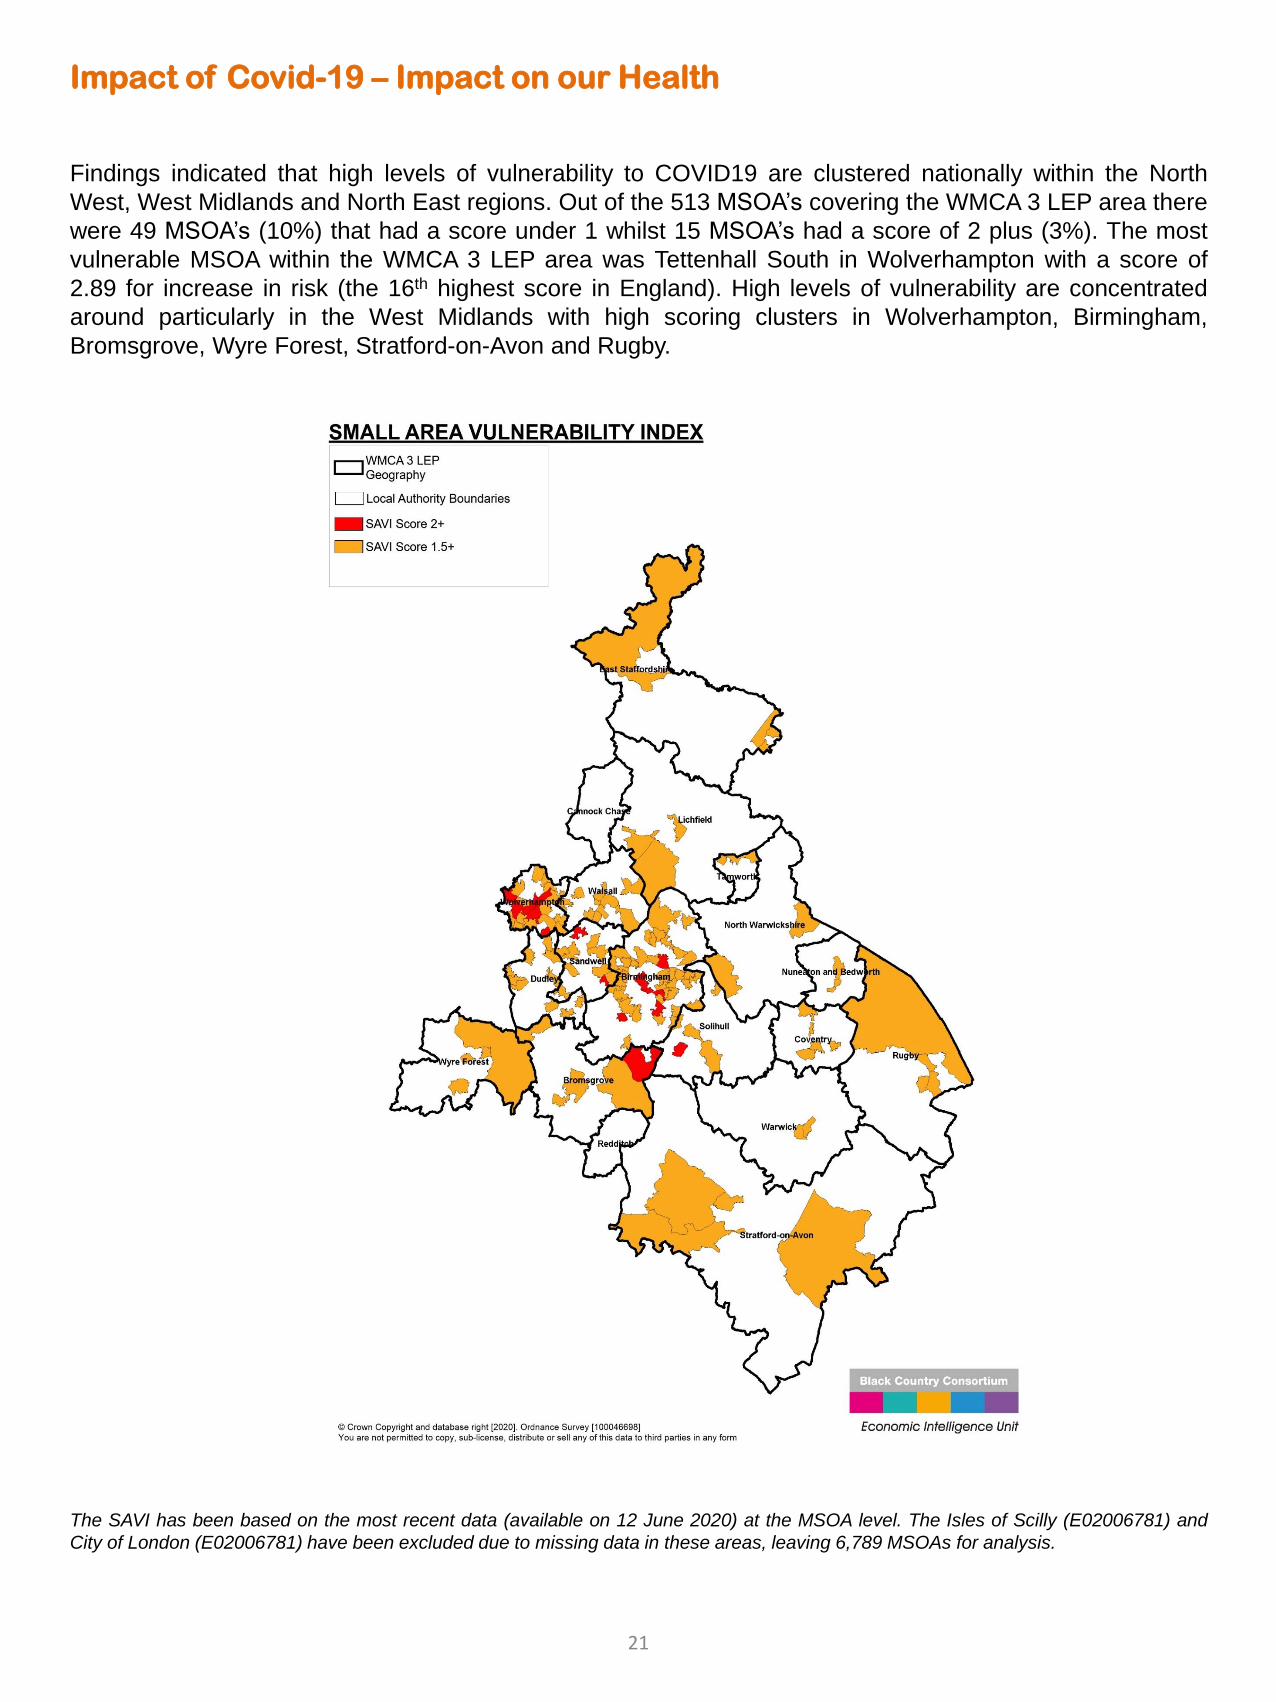
Findings indicated that high levels of vulnerability to COVID19 are clustered nationally within the North
West, West Midlands and North East regions. Out of the 513 MSOA’s covering the WMCA 3 LEP area there
were 49 MSOA’s (10%) that had a score under 1 whilst 15 MSOA’s had a score of 2 plus (3%). The most
vulnerable MSOA within the WMCA 3 LEP area was Tettenhall South in Wolverhampton with a score of
2.89 for increase in risk (the 16th highest score in England). High levels of vulnerability are concentrated
around particularly in the West Midlands with high scoring clusters in Wolverhampton, Birmingham,
Bromsgrove, Wyre Forest, Stratford-on-Avon and Rugby.
The SAVI has been based on the most recent data (available on 12 June 2020) at the MSOA level. The Isles of Scilly (E02006781) and
City of London (E02006781) have been excluded due to missing data in these areas, leaving 6,789 MSOAs for analysis.
21
Impact of Covid-19 on our economy
Forecasters are now coming to a general consensus they the UK is looking at a sharp fall and slower
recovery over at least 2 years, with some sectors longer. There is limited expectation of a consumer
bounce back, as people have utilised spare cash and resources and are reluctant to take on debt. The
prolonged international lock down may change attitudes to what consumers value and need in the longer
term, the effects of which we have yet to see emerge.
It is expected that we will have the worst recession in history, with March 2020 seeing the biggest GDP fall
since records began and IMF predicting a drop in GDP close to 6% and likely to take 2 years to recover.
The OECD released its latest predictions and warns that the UK is likely to be hardest hit with a slump of
11.5%, 14% if there is a second wave. This is largely because of the reliance of the UK on the services
sector and the warning that the furlough scheme may not offset effects on employment. Local intelligence
would reflect this concern that furlough may just be deferring redundancy and company failure later in the
year. ICAEW forecasts prepared by Oxford Economics say GDP dropped 2% in Q1 the largest drop since
2009 and is forecast to shrink by 8.3% rebounding by 7.8% next year. The West Midlands may face the
largest decline of all regions at 9.2%, however it may see the largest growth in 2021 at 8.1%. This is based
on having the largest number of temporary closures and an expectation of most reopening. This however is
far from certain and will be affected by social distancing measures, a trade deal and the implications of a
second wave with continued lockdowns.
More forecasts, reports and research are now being published, many of which say Birmingham will be one
of the hardest hit places. Oxford Economics predict it will be the worst hit city in the EU. This is because of
the dependency on automotive and education (Higher Education Institutions), a younger than average
population and high levels of health issues.
The Purchasing Managers Index (PMI), which tracks on a monthly basis business sentiment and thoughts
about growth, has had a volatile ride in the last few months. PMI dropped to an all-time low in the region at
10.9 (growth would be above 50 and recession under 50). It is showing welcome signs of the economy
picking back up for the West Midlands to 27.9 from its unprecedented low of 10.9 and the export climate
index rose to 35.9 from the record low of 24.5 in April.
The pandemic makes it more likely that the UK will exit the EU without a trade deal, work by City-REDI
estimated a risk (of no deal) to WMCA GDP of 12.2% and the whole NUTS1 region of 14.3% making it
more exposed than the UK average. It is expected that any type of Brexit will exacerbate the negative
impact of CV19. We are also nearing the closure of the EU programmes, 80% of which support recovery
type activities and there has been no detail on replacement or shared prosperity funds.
Nationally a gradual lifting of lockdown is underway with non-essential retailers able to open from 15th June
(contingent on the Covid-19 situation). From August employers will have to pay a quarter of the wages of
furloughed staff. There are also reports that some large companies are seeking government bailouts.
UK likely to be the hardest hit region. WM face the largest decline of all regions at
9.2% with the largest growth at 8.1%. But risks are on the downside and on how
well businesses recover and return to normal
PMI Business Activity Index in the region dropped to an all-time low of 10.9 and
export climate dropped to a record low of 24.5
22
Impact of Covid-19 on our People
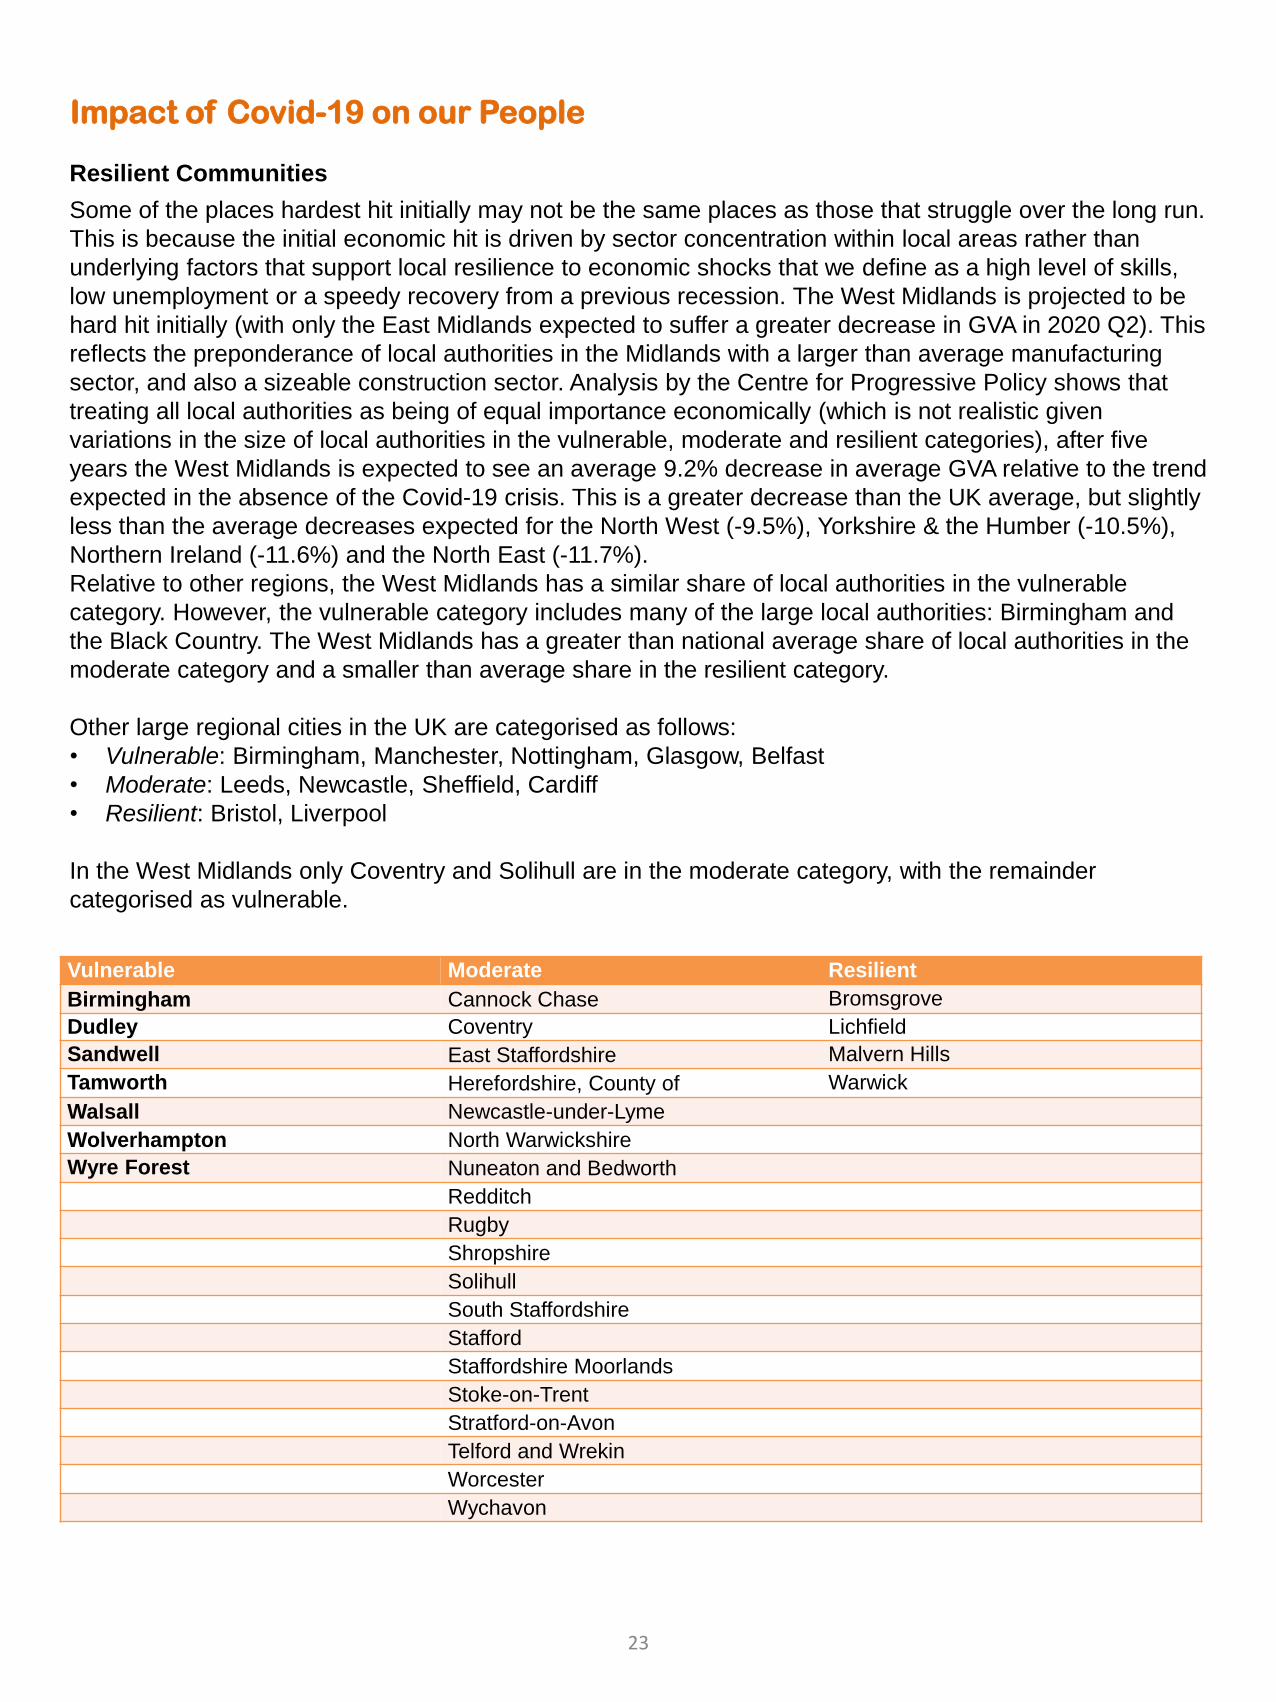
Resilient Communities
Some of the places hardest hit initially may not be the same places as those that struggle over the long run.
This is because the initial economic hit is driven by sector concentration within local areas rather than
underlying factors that support local resilience to economic shocks that we define as a high level of skills,
low unemployment or a speedy recovery from a previous recession. The West Midlands is projected to be
hard hit initially (with only the East Midlands expected to suffer a greater decrease in GVA in 2020 Q2). This
reflects the preponderance of local authorities in the Midlands with a larger than average manufacturing
sector, and also a sizeable construction sector. Analysis by the Centre for Progressive Policy shows that
treating all local authorities as being of equal importance economically (which is not realistic given
variations in the size of local authorities in the vulnerable, moderate and resilient categories), after five
years the West Midlands is expected to see an average 9.2% decrease in average GVA relative to the trend
expected in the absence of the Covid-19 crisis. This is a greater decrease than the UK average, but slightly
less than the average decreases expected for the North West (-9.5%), Yorkshire & the Humber (-10.5%),
Northern Ireland (-11.6%) and the North East (-11.7%).
Relative to other regions, the West Midlands has a similar share of local authorities in the vulnerable
category. However, the vulnerable category includes many of the large local authorities: Birmingham and
the Black Country. The West Midlands has a greater than national average share of local authorities in the
moderate category and a smaller than average share in the resilient category.
Other large regional cities in the UK are categorised as follows:
• Vulnerable: Birmingham, Manchester, Nottingham, Glasgow, Belfast
• Moderate: Leeds, Newcastle, Sheffield, Cardiff
• Resilient: Bristol, Liverpool
In the West Midlands only Coventry and Solihull are in the moderate category, with the remainder
categorised as vulnerable.
Vulnerable Moderate Resilient
Birmingham Cannock Chase Bromsgrove
Dudley Coventry Lichfield
Sandwell East Staffordshire Malvern Hills
Tamworth Herefordshire, County of Warwick
Walsall Newcastle-under-Lyme
Wolverhampton North Warwickshire
Wyre Forest Nuneaton and Bedworth
Redditch
Rugby
Shropshire
Solihull
South Staffordshire
Stafford
Staffordshire Moorlands
Stoke-on-Trent
Stratford-on-Avon
Telford and Wrekin
Worcester
Wychavon
23
Impact of Covid-19 on our People
Jobs and Employment
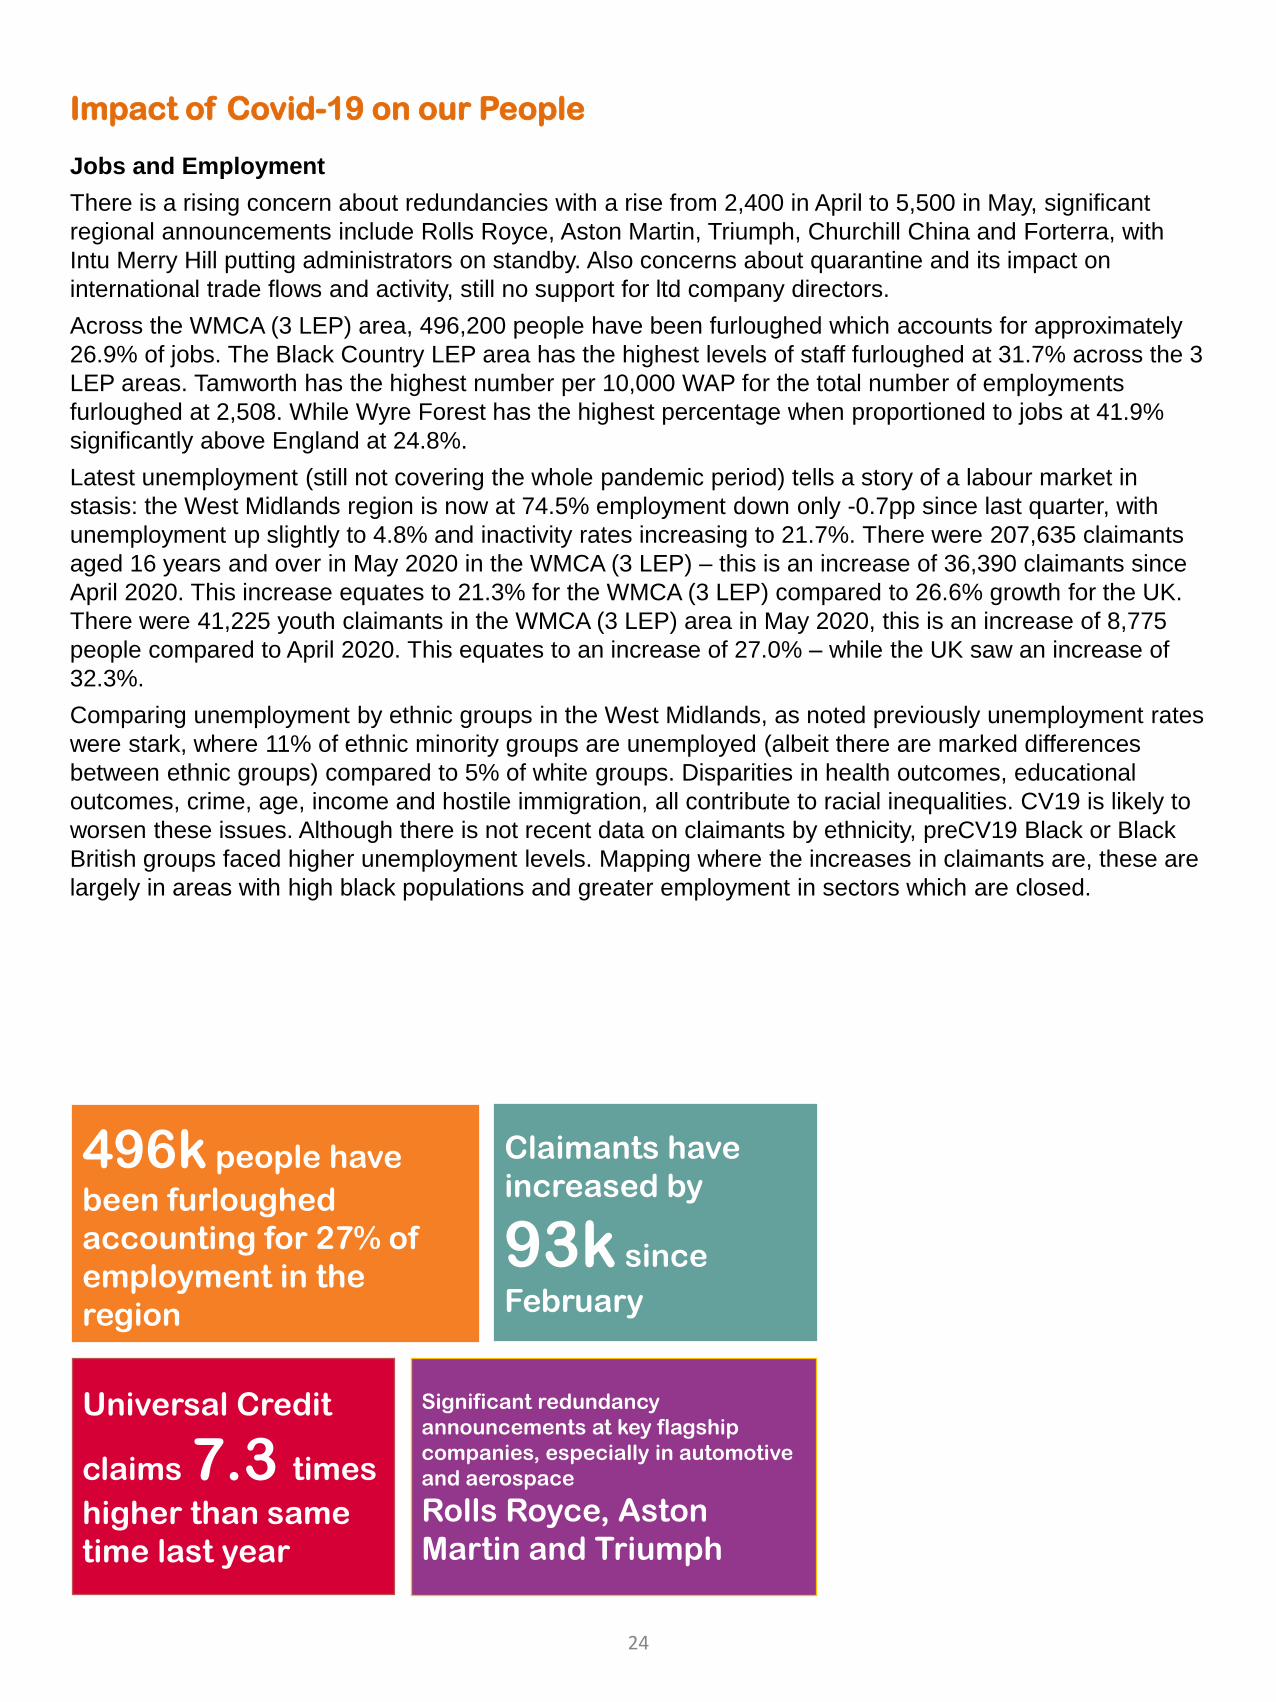
There is a rising concern about redundancies with a rise from 2,400 in April to 5,500 in May, significant
regional announcements include Rolls Royce, Aston Martin, Triumph, Churchill China and Forterra, with
Intu Merry Hill putting administrators on standby. Also concerns about quarantine and its impact on
international trade flows and activity, still no support for ltd company directors.
Across the WMCA (3 LEP) area, 496,200 people have been furloughed which accounts for approximately
26.9% of jobs. The Black Country LEP area has the highest levels of staff furloughed at 31.7% across the 3
LEP areas. Tamworth has the highest number per 10,000 WAP for the total number of employments
furloughed at 2,508. While Wyre Forest has the highest percentage when proportioned to jobs at 41.9%
significantly above England at 24.8%.
Latest unemployment (still not covering the whole pandemic period) tells a story of a labour market in
stasis: the West Midlands region is now at 74.5% employment down only -0.7pp since last quarter, with
unemployment up slightly to 4.8% and inactivity rates increasing to 21.7%. There were 207,635 claimants
aged 16 years and over in May 2020 in the WMCA (3 LEP) – this is an increase of 36,390 claimants since
April 2020. This increase equates to 21.3% for the WMCA (3 LEP) compared to 26.6% growth for the UK.
There were 41,225 youth claimants in the WMCA (3 LEP) area in May 2020, this is an increase of 8,775
people compared to April 2020. This equates to an increase of 27.0% – while the UK saw an increase of
32.3%.
Comparing unemployment by ethnic groups in the West Midlands, as noted previously unemployment rates
were stark, where 11% of ethnic minority groups are unemployed (albeit there are marked differences
between ethnic groups) compared to 5% of white groups. Disparities in health outcomes, educational
outcomes, crime, age, income and hostile immigration, all contribute to racial inequalities. CV19 is likely to
worsen these issues. Although there is not recent data on claimants by ethnicity, preCV19 Black or Black
British groups faced higher unemployment levels. Mapping where the increases in claimants are, these are
largely in areas with high black populations and greater employment in sectors which are closed.
496k people have
been furloughed
accounting for 27% of
employment in the
region
Significant redundancy
announcements at key flagship
companies, especially in automotive
and aerospace
Rolls Royce, Aston
Martin and Triumph
Universal Credit
claims 7.3 times
higher than same
time last year
Claimants have
increased by
93k since
February
24
Impact of Covid-19 on our People
Jobs and Employment
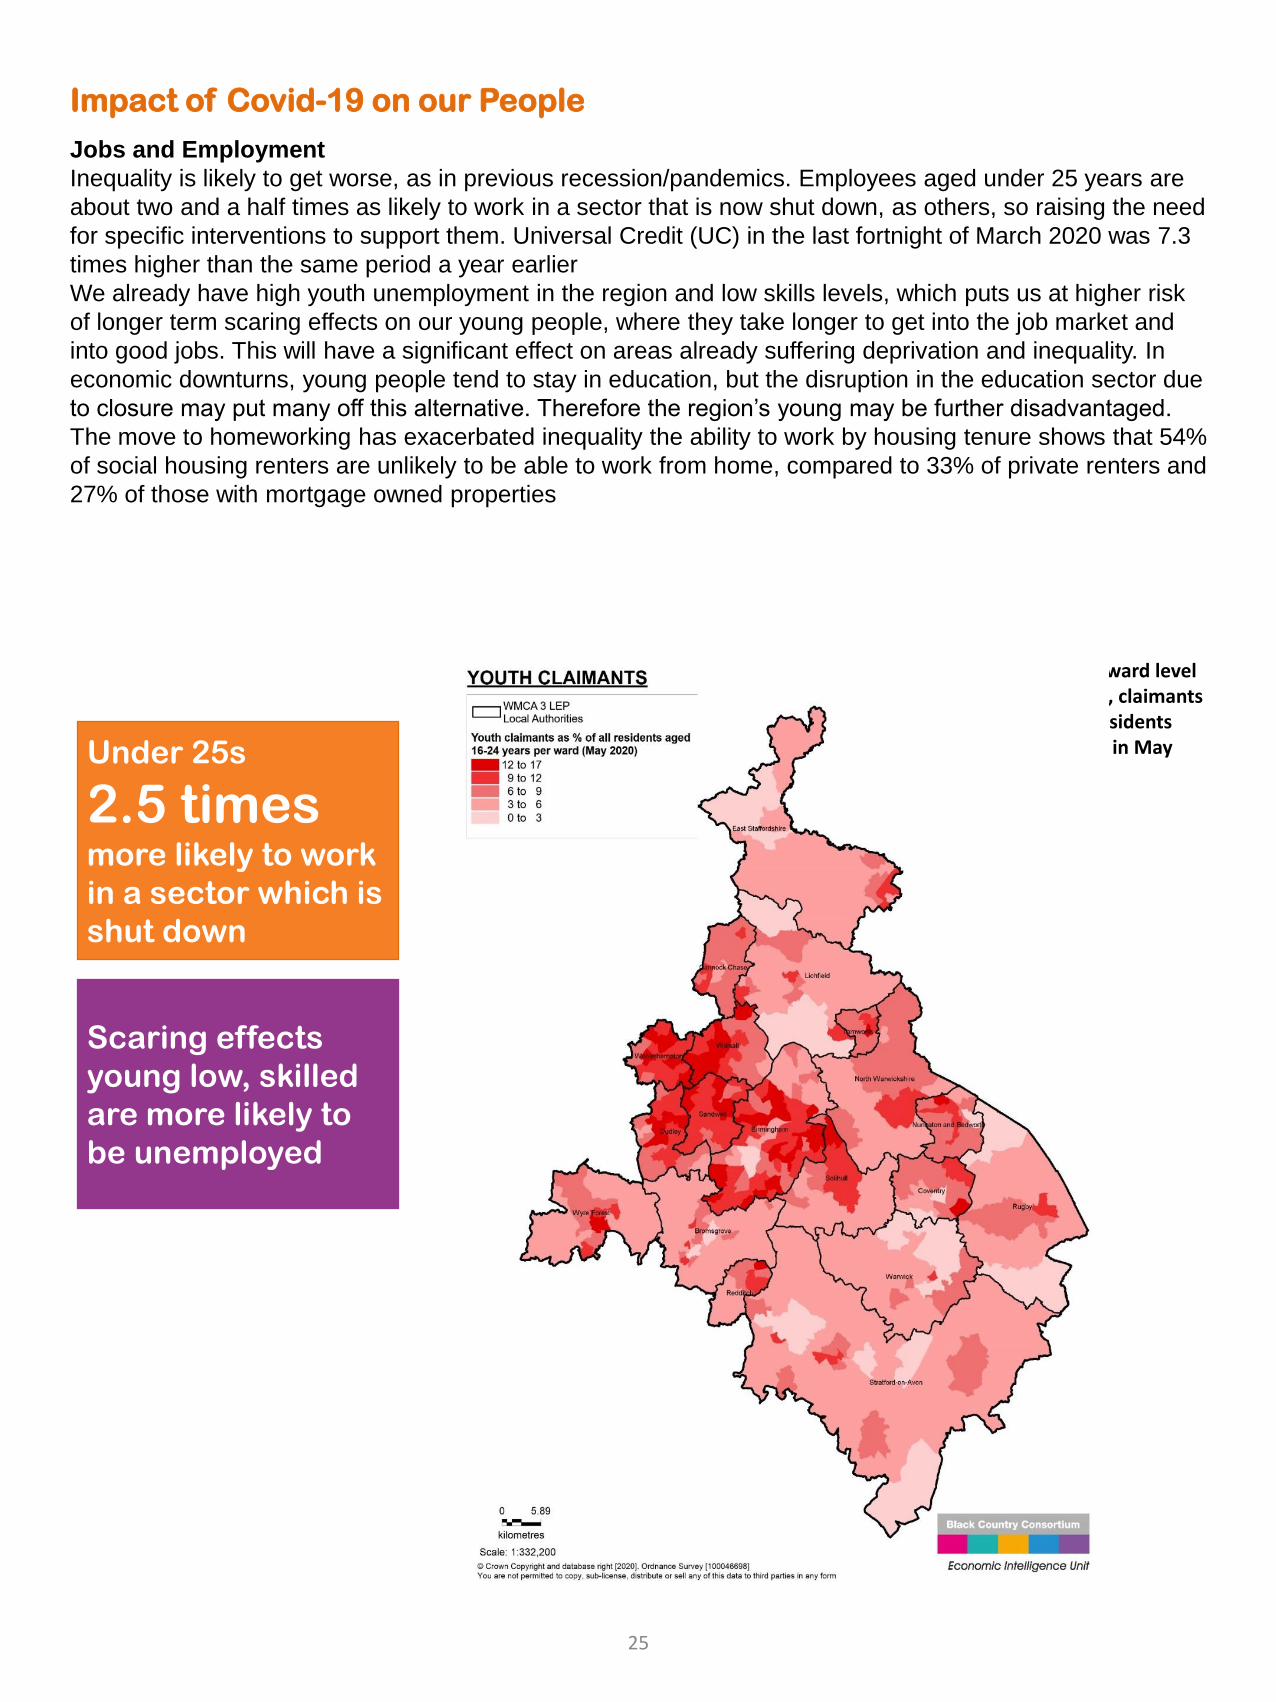
Inequality is likely to get worse, as in previous recession/pandemics. Employees aged under 25 years are
about two and a half times as likely to work in a sector that is now shut down, as others, so raising the need
for specific interventions to support them. Universal Credit (UC) in the last fortnight of March 2020 was 7.3
times higher than the same period a year earlier
We already have high youth unemployment in the region and low skills levels, which puts us at higher risk
of longer term scaring effects on our young people, where they take longer to get into the job market and
into good jobs. This will have a significant effect on areas already suffering deprivation and inequality. In
economic downturns, young people tend to stay in education, but the disruption in the education sector due
to closure may put many off this alternative. Therefore the region’s young may be further disadvantaged.
The move to homeworking has exacerbated inequality the ability to work by housing tenure shows that 54%
of social housing renters are unlikely to be able to work from home, compared to 33% of private renters and
27% of those with mortgage owned properties
Under 25s
2.5 timesmore likely to work
in a sector which is
shut down
Scaring effects
young low, skilled
are more likely to
be unemployed
The map shows at a ward level in the WMCA (3 LEP), claimants as a percentage of residents aged 16-24 years old in May 2020
25
Impact of Covid-19 on our People
Voluntary sector and support
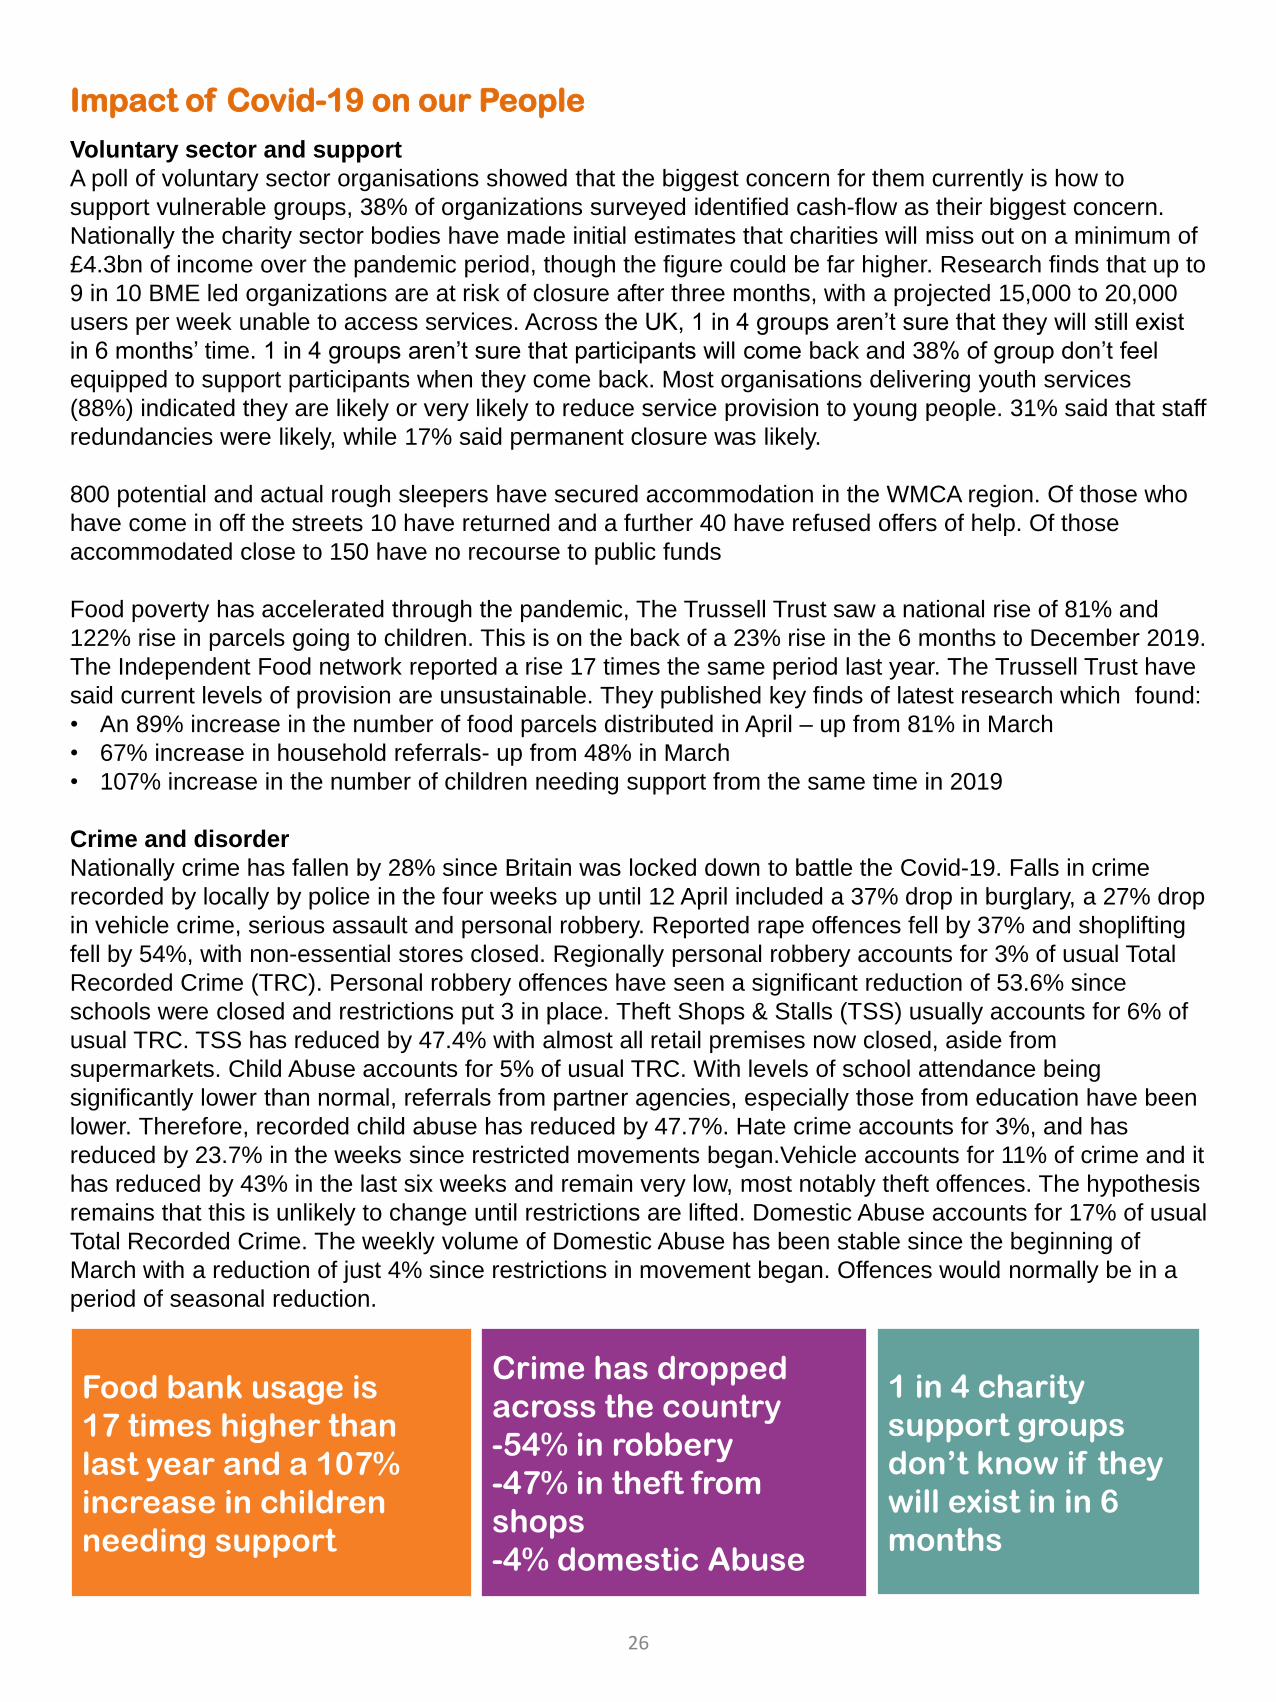
A poll of voluntary sector organisations showed that the biggest concern for them currently is how to
support vulnerable groups, 38% of organizations surveyed identified cash-flow as their biggest concern.
Nationally the charity sector bodies have made initial estimates that charities will miss out on a minimum of
£4.3bn of income over the pandemic period, though the figure could be far higher. Research finds that up to
9 in 10 BME led organizations are at risk of closure after three months, with a projected 15,000 to 20,000
users per week unable to access services. Across the UK, 1 in 4 groups aren’t sure that they will still exist
in 6 months’ time. 1 in 4 groups aren’t sure that participants will come back and 38% of group don’t feel
equipped to support participants when they come back. Most organisations delivering youth services
(88%) indicated they are likely or very likely to reduce service provision to young people. 31% said that staff
redundancies were likely, while 17% said permanent closure was likely.
800 potential and actual rough sleepers have secured accommodation in the WMCA region. Of those who
have come in off the streets 10 have returned and a further 40 have refused offers of help. Of those
accommodated close to 150 have no recourse to public funds
Food poverty has accelerated through the pandemic, The Trussell Trust saw a national rise of 81% and
122% rise in parcels going to children. This is on the back of a 23% rise in the 6 months to December 2019.
The Independent Food network reported a rise 17 times the same period last year. The Trussell Trust have
said current levels of provision are unsustainable. They published key finds of latest research which found:
• An 89% increase in the number of food parcels distributed in April – up from 81% in March
• 67% increase in household referrals- up from 48% in March
• 107% increase in the number of children needing support from the same time in 2019
Crime and disorder
Nationally crime has fallen by 28% since Britain was locked down to battle the Covid-19. Falls in crime
recorded by locally by police in the four weeks up until 12 April included a 37% drop in burglary, a 27% drop
in vehicle crime, serious assault and personal robbery. Reported rape offences fell by 37% and shoplifting
fell by 54%, with non-essential stores closed. Regionally personal robbery accounts for 3% of usual Total
Recorded Crime (TRC). Personal robbery offences have seen a significant reduction of 53.6% since
schools were closed and restrictions put 3 in place. Theft Shops & Stalls (TSS) usually accounts for 6% of
usual TRC. TSS has reduced by 47.4% with almost all retail premises now closed, aside from
supermarkets. Child Abuse accounts for 5% of usual TRC. With levels of school attendance being
significantly lower than normal, referrals from partner agencies, especially those from education have been
lower. Therefore, recorded child abuse has reduced by 47.7%. Hate crime accounts for 3%, and has
reduced by 23.7% in the weeks since restricted movements began.Vehicle accounts for 11% of crime and it
has reduced by 43% in the last six weeks and remain very low, most notably theft offences. The hypothesis
remains that this is unlikely to change until restrictions are lifted. Domestic Abuse accounts for 17% of usual
Total Recorded Crime. The weekly volume of Domestic Abuse has been stable since the beginning of
March with a reduction of just 4% since restrictions in movement began. Offences would normally be in a
period of seasonal reduction.
Food bank usage is
17 times higher than
last year and a 107%
increase in children
needing support
Crime has dropped
across the country
-54% in robbery
-47% in theft from
shops
-4% domestic Abuse
1 in 4 charity
support groups
don’t know if they
will exist in in 6
months
26
Impact of Covid-19 on our People
Skills and Education
With some schools reopening for some students from June, it is appropriate to reflect on the large literature
indicating that school closures lead to slower progress or a reduction in learning outcomes for students.
Despite moves to digital learning there remain concerns about disparities in access, with economically
disadvantaged students most affected. There are also concerns about the development of skills that are
more difficult to replicate online – including social and emotional skills that are prized by employers. Policy
suggestions for overcoming educational disadvantage include extending vocational courses for young
people by an additional year; greater flexibility in apprenticeships; extending maintenance loans and
greater support for adult reskilling. Young people – especially those with no prior work experience – set to
finish further education courses soon are likely to face particular challenges entering employment, with
prospects set to be particularly limited for those taking courses in hospitality & catering, and in sports,
leisure & recreation.
The university sector continues to be of high concern in the region due to the significant number of jobs and
direct and indirect effects, this sector is also underpinning some of the dramatic drops in forecast
performance. The instability of the university sector will also effect the future innovation capacity in the
region and the support given to businesses to increase resilience as a result. All universities are impacted
but the Universities of Birmingham, Coventry and Warwick are especially exposed to a contraction in
international students, with important implications for local economies, given the importance of student
spending.
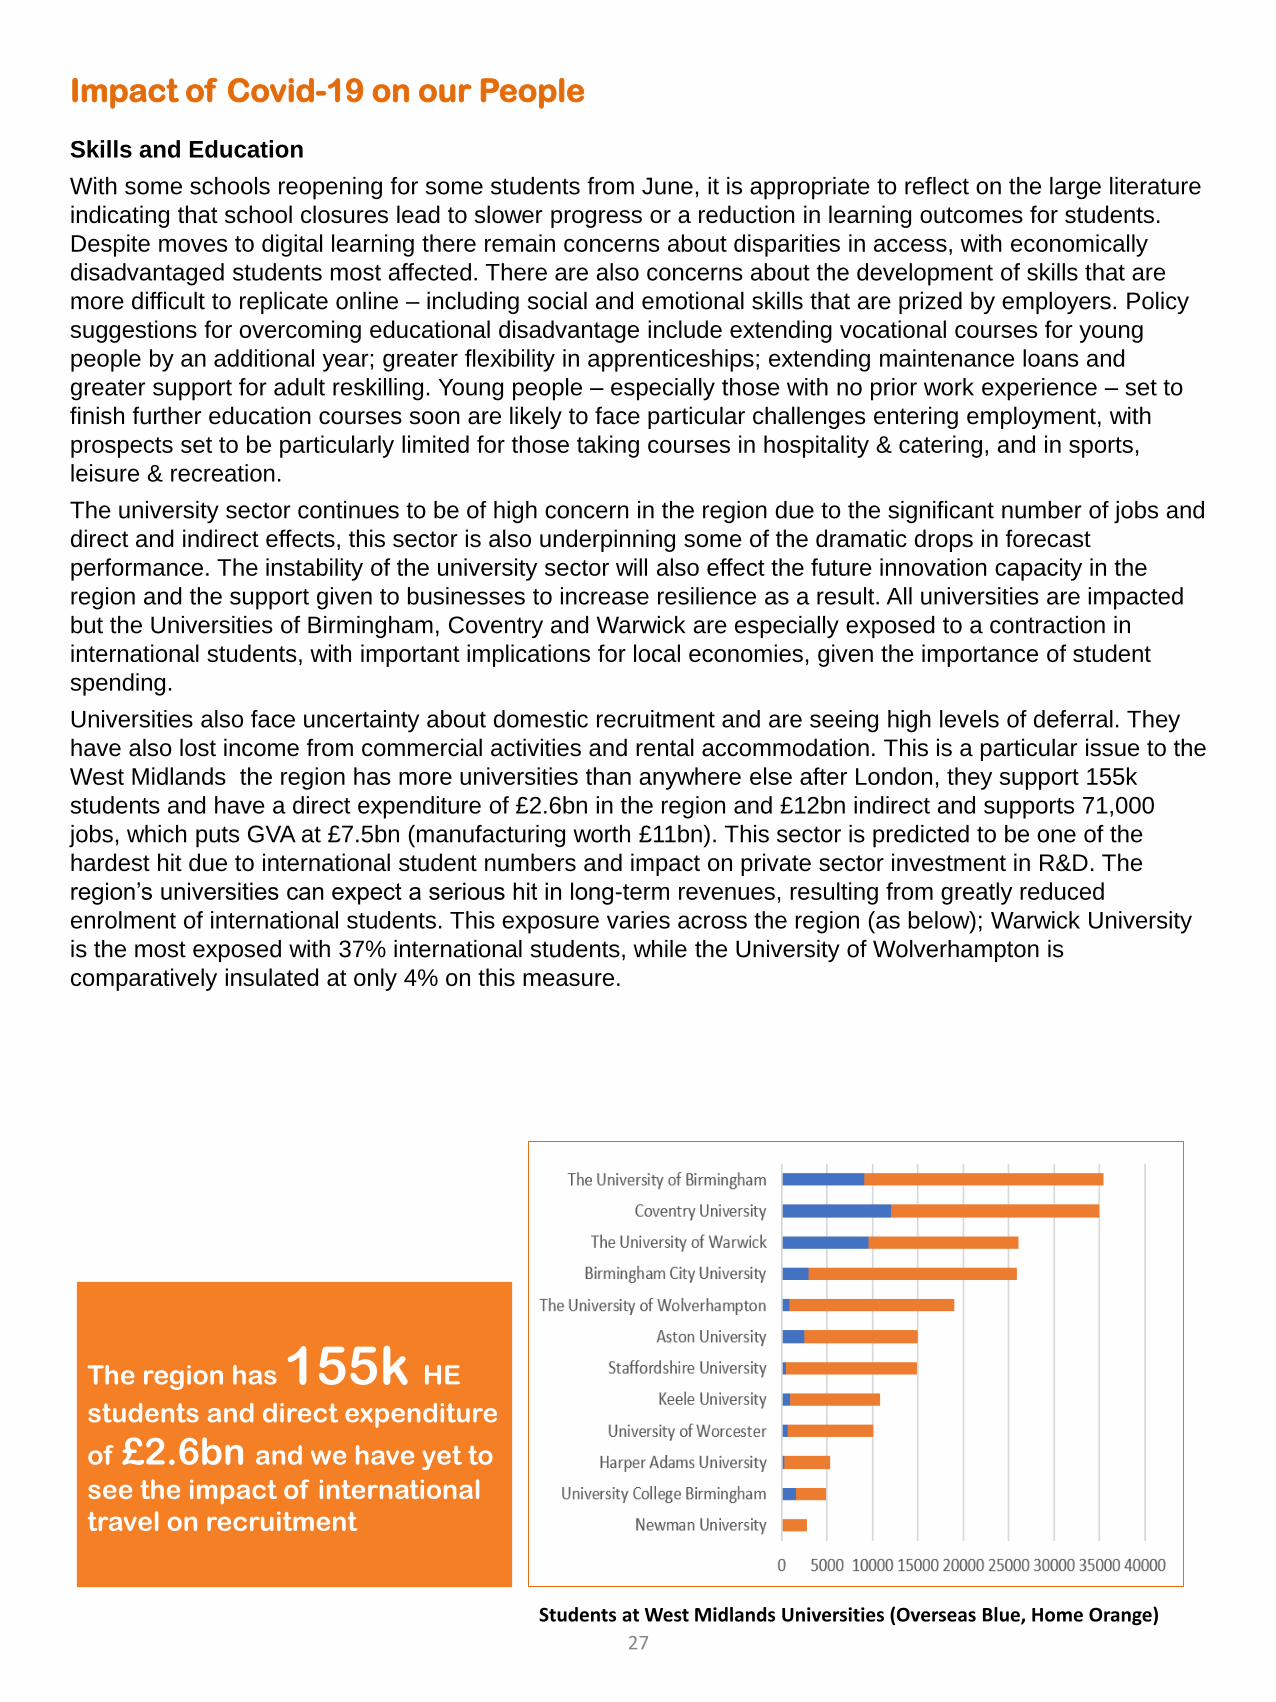
Universities also face uncertainty about domestic recruitment and are seeing high levels of deferral. They
have also lost income from commercial activities and rental accommodation. This is a particular issue to the
West Midlands the region has more universities than anywhere else after London, they support 155k
students and have a direct expenditure of £2.6bn in the region and £12bn indirect and supports 71,000
jobs, which puts GVA at £7.5bn (manufacturing worth £11bn). This sector is predicted to be one of the
hardest hit due to international student numbers and impact on private sector investment in R&D. The
region’s universities can expect a serious hit in long-term revenues, resulting from greatly reduced
enrolment of international students. This exposure varies across the region (as below); Warwick University
is the most exposed with 37% international students, while the University of Wolverhampton is
comparatively insulated at only 4% on this measure.
The region has 155k HE
students and direct expenditure
of £2.6bn and we have yet to
see the impact of international
travel on recruitment
Students at West Midlands Universities (Overseas Blue, Home Orange)
27
Impact of Covid-19 on our Businesses
Across various business surveys the main messages are: cash reserves are being used and are rapidly
depleting; workforces have stayed relatively stable but there has been a significant amount of furloughing;
the threat of redundancies remains, low hours are reducing, there is drop in contract staff and significant
homeworking (50% of workers).
Local businesses are facing the most significant economic shock of recent decades with domestic demand,
export demand, investment in training & capex and cash flow positions falling to record lows. While
businesses are continuing to, on balance, experience the negative impact of COVID-19 and related
lockdown measures, it is likely that businesses felt the sharpest negative impact of Coronavirus related
measures in the early weeks of lockdown (end of March to mid-April).
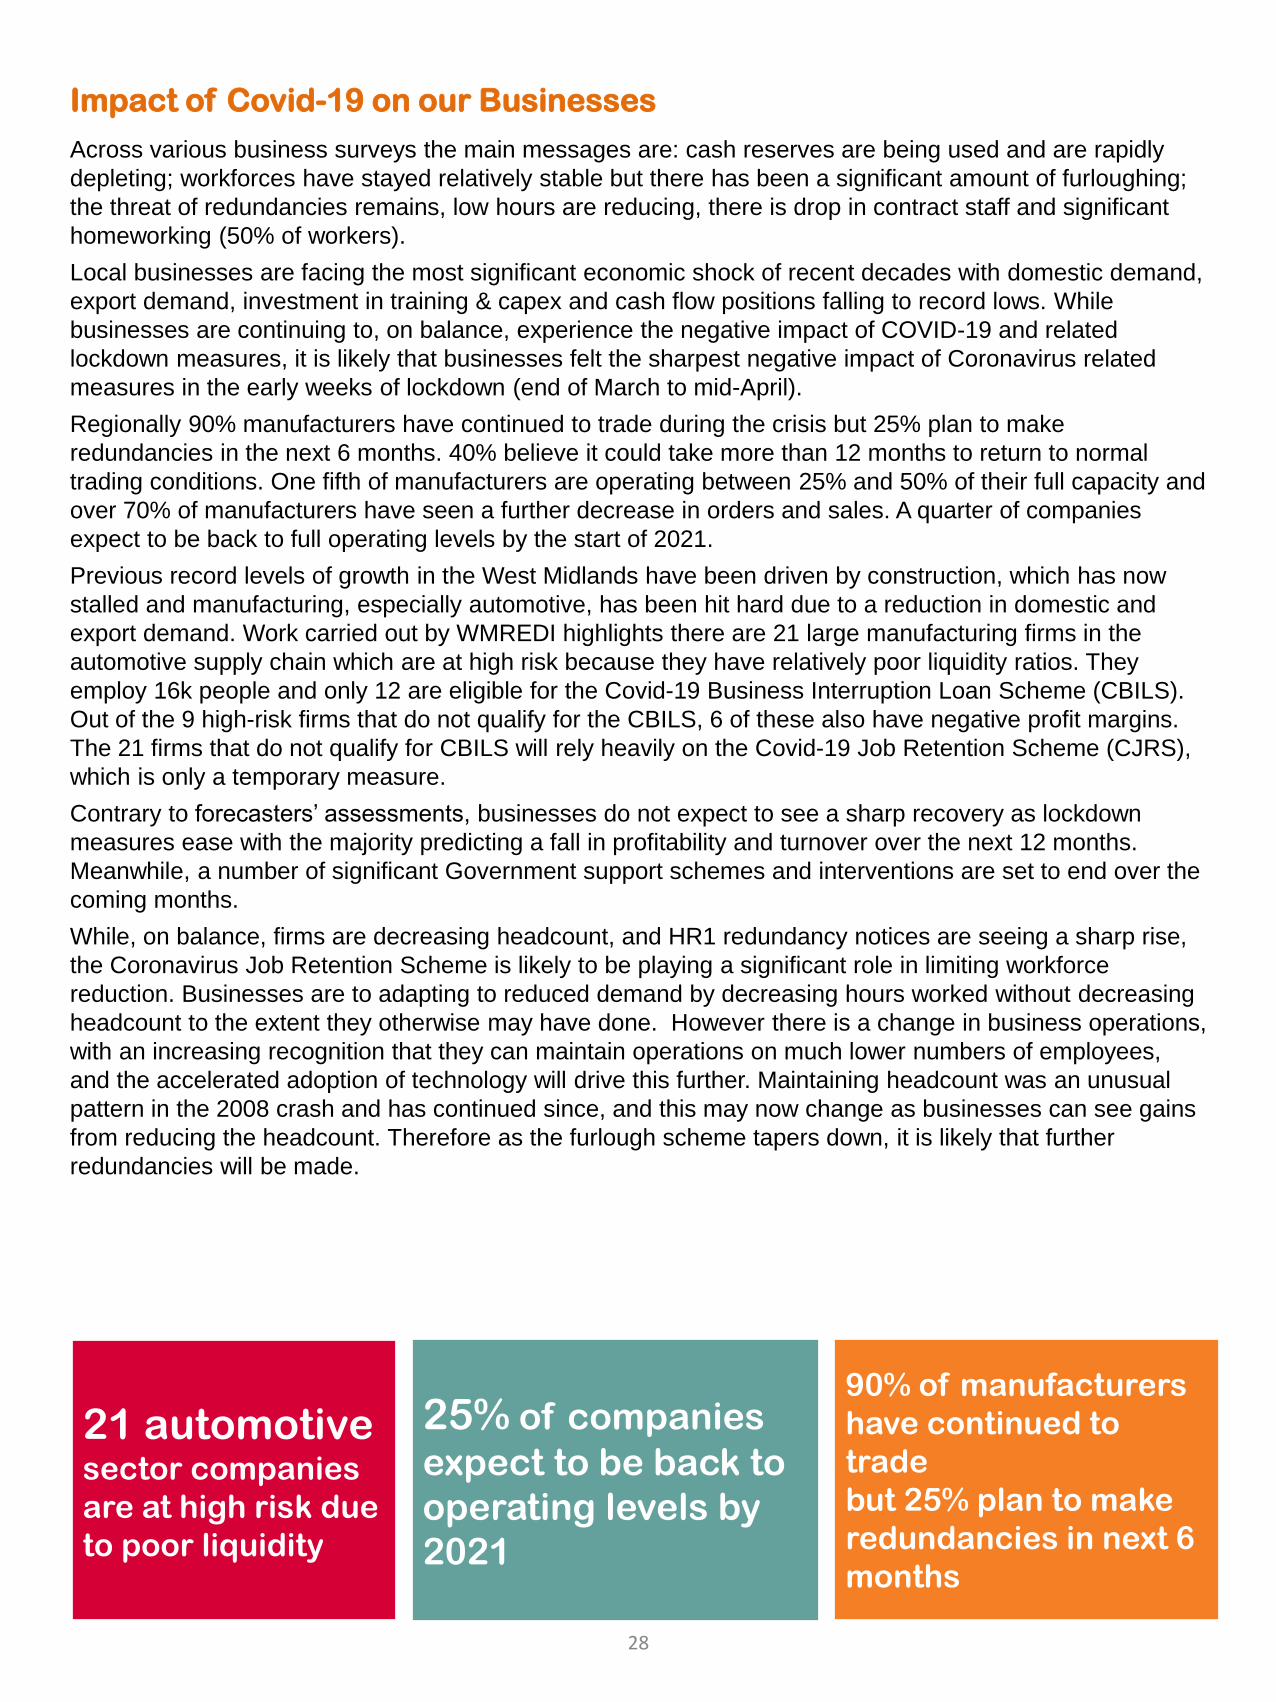
Regionally 90% manufacturers have continued to trade during the crisis but 25% plan to make
redundancies in the next 6 months. 40% believe it could take more than 12 months to return to normal
trading conditions. One fifth of manufacturers are operating between 25% and 50% of their full capacity and
over 70% of manufacturers have seen a further decrease in orders and sales. A quarter of companies
expect to be back to full operating levels by the start of 2021.
Previous record levels of growth in the West Midlands have been driven by construction, which has now
stalled and manufacturing, especially automotive, has been hit hard due to a reduction in domestic and
export demand. Work carried out by WMREDI highlights there are 21 large manufacturing firms in the
automotive supply chain which are at high risk because they have relatively poor liquidity ratios. They
employ 16k people and only 12 are eligible for the Covid-19 Business Interruption Loan Scheme (CBILS).
Out of the 9 high-risk firms that do not qualify for the CBILS, 6 of these also have negative profit margins.
The 21 firms that do not qualify for CBILS will rely heavily on the Covid-19 Job Retention Scheme (CJRS),
which is only a temporary measure.
Contrary to forecasters’ assessments, businesses do not expect to see a sharp recovery as lockdown
measures ease with the majority predicting a fall in profitability and turnover over the next 12 months.
Meanwhile, a number of significant Government support schemes and interventions are set to end over the
coming months.
While, on balance, firms are decreasing headcount, and HR1 redundancy notices are seeing a sharp rise,
the Coronavirus Job Retention Scheme is likely to be playing a significant role in limiting workforce
reduction. Businesses are to adapting to reduced demand by decreasing hours worked without decreasing
headcount to the extent they otherwise may have done. However there is a change in business operations,
with an increasing recognition that they can maintain operations on much lower numbers of employees,
and the accelerated adoption of technology will drive this further. Maintaining headcount was an unusual
pattern in the 2008 crash and has continued since, and this may now change as businesses can see gains
from reducing the headcount. Therefore as the furlough scheme tapers down, it is likely that further
redundancies will be made.
21 automotive sector companies
are at high risk due
to poor liquidity
25% of companies
expect to be back to
operating levels by
2021
90% of manufacturers
have continued to
trade
but 25% plan to make
redundancies in next 6
months
28
Impact of Covid-19 on our Businesses
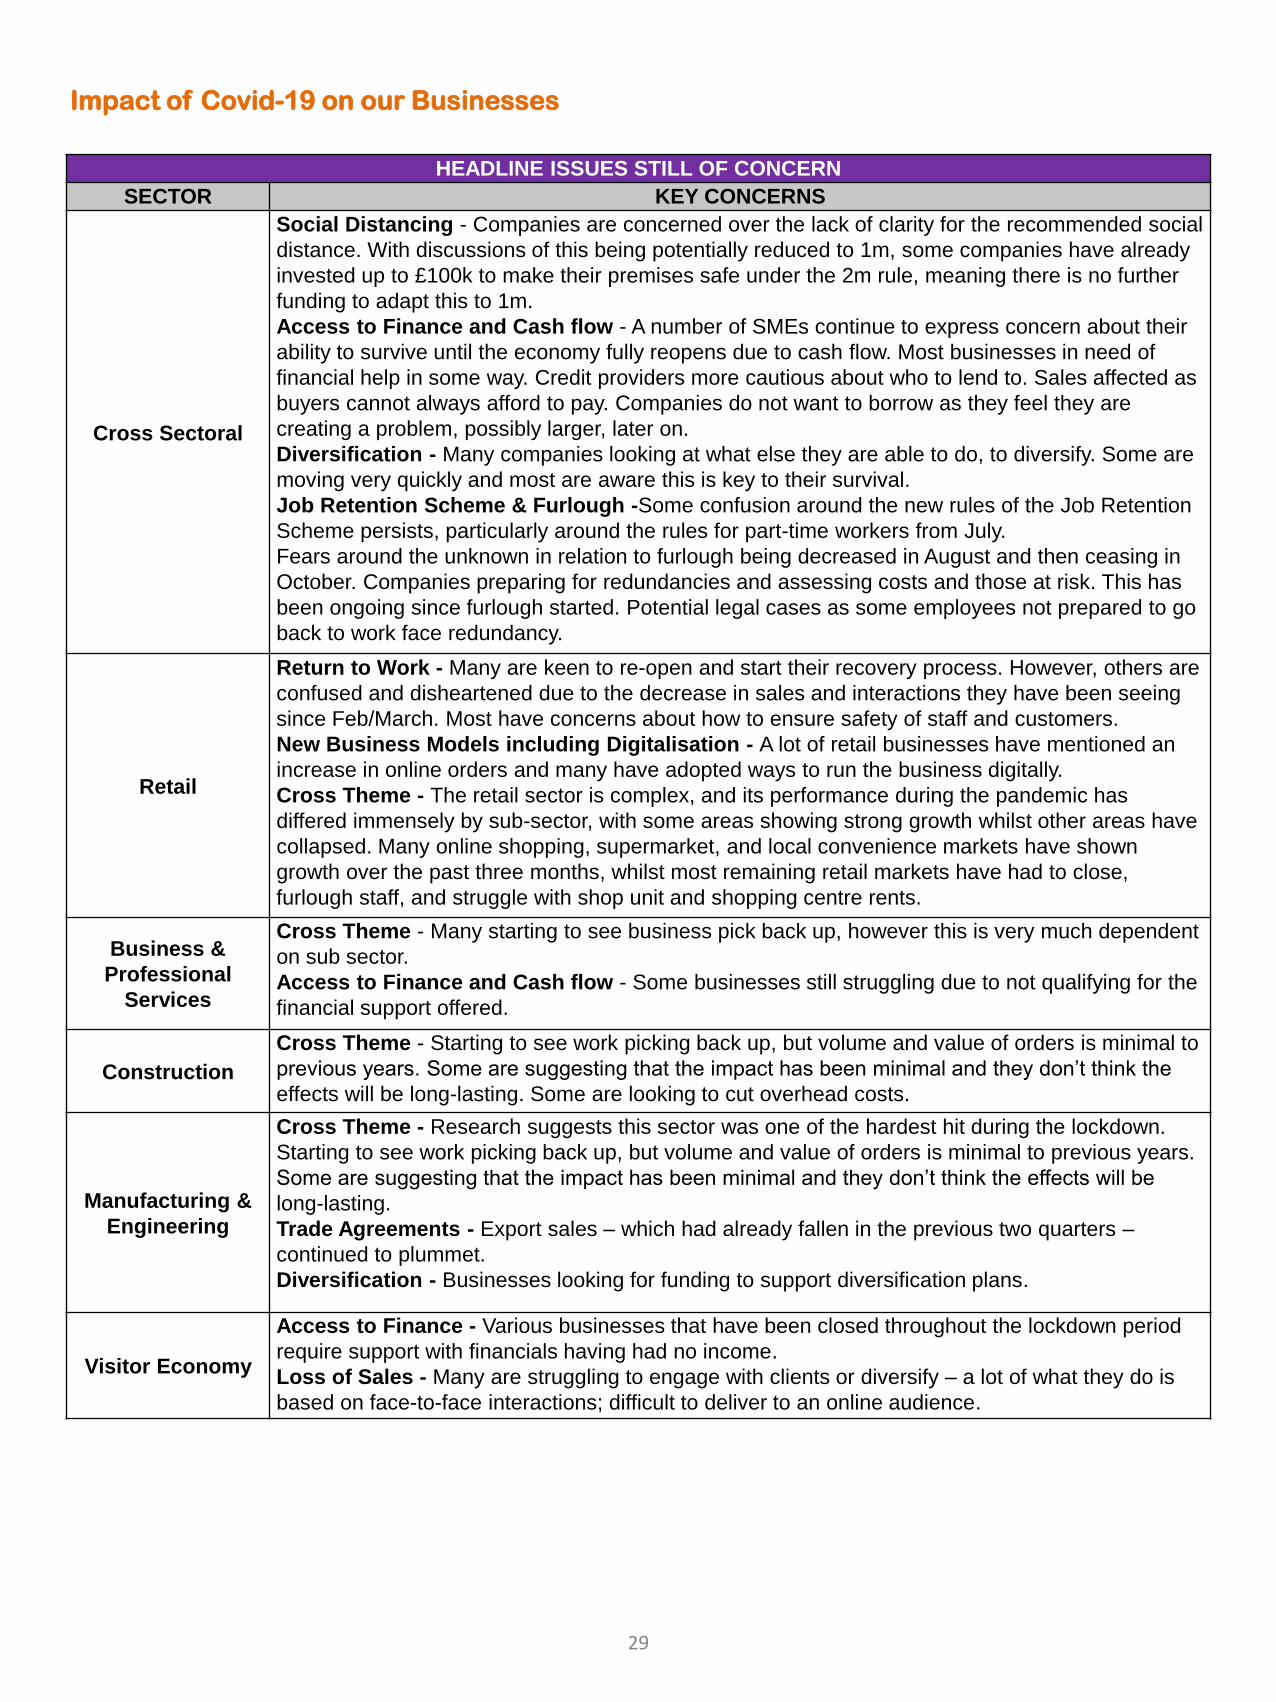
HEADLINE ISSUES STILL OF CONCERN
SECTOR KEY CONCERNS
Cross Sectoral
Social Distancing - Companies are concerned over the lack of clarity for the recommended social
distance. With discussions of this being potentially reduced to 1m, some companies have already
invested up to £100k to make their premises safe under the 2m rule, meaning there is no further
funding to adapt this to 1m.
Access to Finance and Cash flow - A number of SMEs continue to express concern about their
ability to survive until the economy fully reopens due to cash flow. Most businesses in need of
financial help in some way. Credit providers more cautious about who to lend to. Sales affected as
buyers cannot always afford to pay. Companies do not want to borrow as they feel they are
creating a problem, possibly larger, later on.
Diversification - Many companies looking at what else they are able to do, to diversify. Some are
moving very quickly and most are aware this is key to their survival.
Job Retention Scheme & Furlough -Some confusion around the new rules of the Job Retention
Scheme persists, particularly around the rules for part-time workers from July.
Fears around the unknown in relation to furlough being decreased in August and then ceasing in
October. Companies preparing for redundancies and assessing costs and those at risk. This has
been ongoing since furlough started. Potential legal cases as some employees not prepared to go
back to work face redundancy.
Retail
Return to Work - Many are keen to re-open and start their recovery process. However, others are
confused and disheartened due to the decrease in sales and interactions they have been seeing
since Feb/March. Most have concerns about how to ensure safety of staff and customers.
New Business Models including Digitalisation - A lot of retail businesses have mentioned an
increase in online orders and many have adopted ways to run the business digitally.
Cross Theme - The retail sector is complex, and its performance during the pandemic has
differed immensely by sub-sector, with some areas showing strong growth whilst other areas have
collapsed. Many online shopping, supermarket, and local convenience markets have shown
growth over the past three months, whilst most remaining retail markets have had to close,
furlough staff, and struggle with shop unit and shopping centre rents.
Business &
Professional
Services
Cross Theme - Many starting to see business pick back up, however this is very much dependent
on sub sector.
Access to Finance and Cash flow - Some businesses still struggling due to not qualifying for the
financial support offered.
Construction
Cross Theme - Starting to see work picking back up, but volume and value of orders is minimal to
previous years. Some are suggesting that the impact has been minimal and they don’t think the
effects will be long-lasting. Some are looking to cut overhead costs.
Manufacturing &
Engineering
Cross Theme - Research suggests this sector was one of the hardest hit during the lockdown.
Starting to see work picking back up, but volume and value of orders is minimal to previous years.
Some are suggesting that the impact has been minimal and they don’t think the effects will be
long-lasting.
Trade Agreements - Export sales – which had already fallen in the previous two quarters –
continued to plummet.
Diversification - Businesses looking for funding to support diversification plans.
Visitor Economy
Access to Finance - Various businesses that have been closed throughout the lockdown period
require support with financials having had no income.
Loss of Sales - Many are struggling to engage with clients or diversify – a lot of what they do is
based on face-to-face interactions; difficult to deliver to an online audience.
29
Impact of Covid-19 on our Businesses
The closure of the hospitality, retail, tourism and cultural sectors has also taken a heavy toll, especially in
rural and peripheral areas dependent on this as a large part of their economy. Latest WMGC data highlights
80% of businesses are now closed in the tourism sector. All have seen a drop in revenue of more than 50%
and 60% are experiencing cash flow problems. Most businesses are worried that without additional support,
they may not survive lockdown. Some 10% say they are contemplating permanent closure in the next few
weeks and another 40% say they may be facing failure by the end of the summer. An audience survey by
Indigo highlights only 17% of audience responses are booking for events, half of which are for events from
November onwards and 35% are in Sept/October.
A significant proportion of firms report having applied for, or planning to apply for, finance through the
Coronavirus Business Interruption Loan Scheme or Bounce Back Loan Scheme and 1 in 4 firms report
pressure to increase prices arising from finance costs, indicating high levels of debt accruing within the
business community. Going forward the burden of debt is significant; nationally it is forecast to be around
£100bn. Payments are now being pushed back across the board, including public sector payments, which is
creating a huge credit risk in supply chains. Businesses are understandably reluctant to take on debt they
may not be able to pay back, and bank lending processes are still an issue due to the length of time taken
and the decision making processes. The new bounce back loans seem to have a higher interest. The
furlough scheme is working well and making a difference to businesses and whether they can withstand the
current crisis.
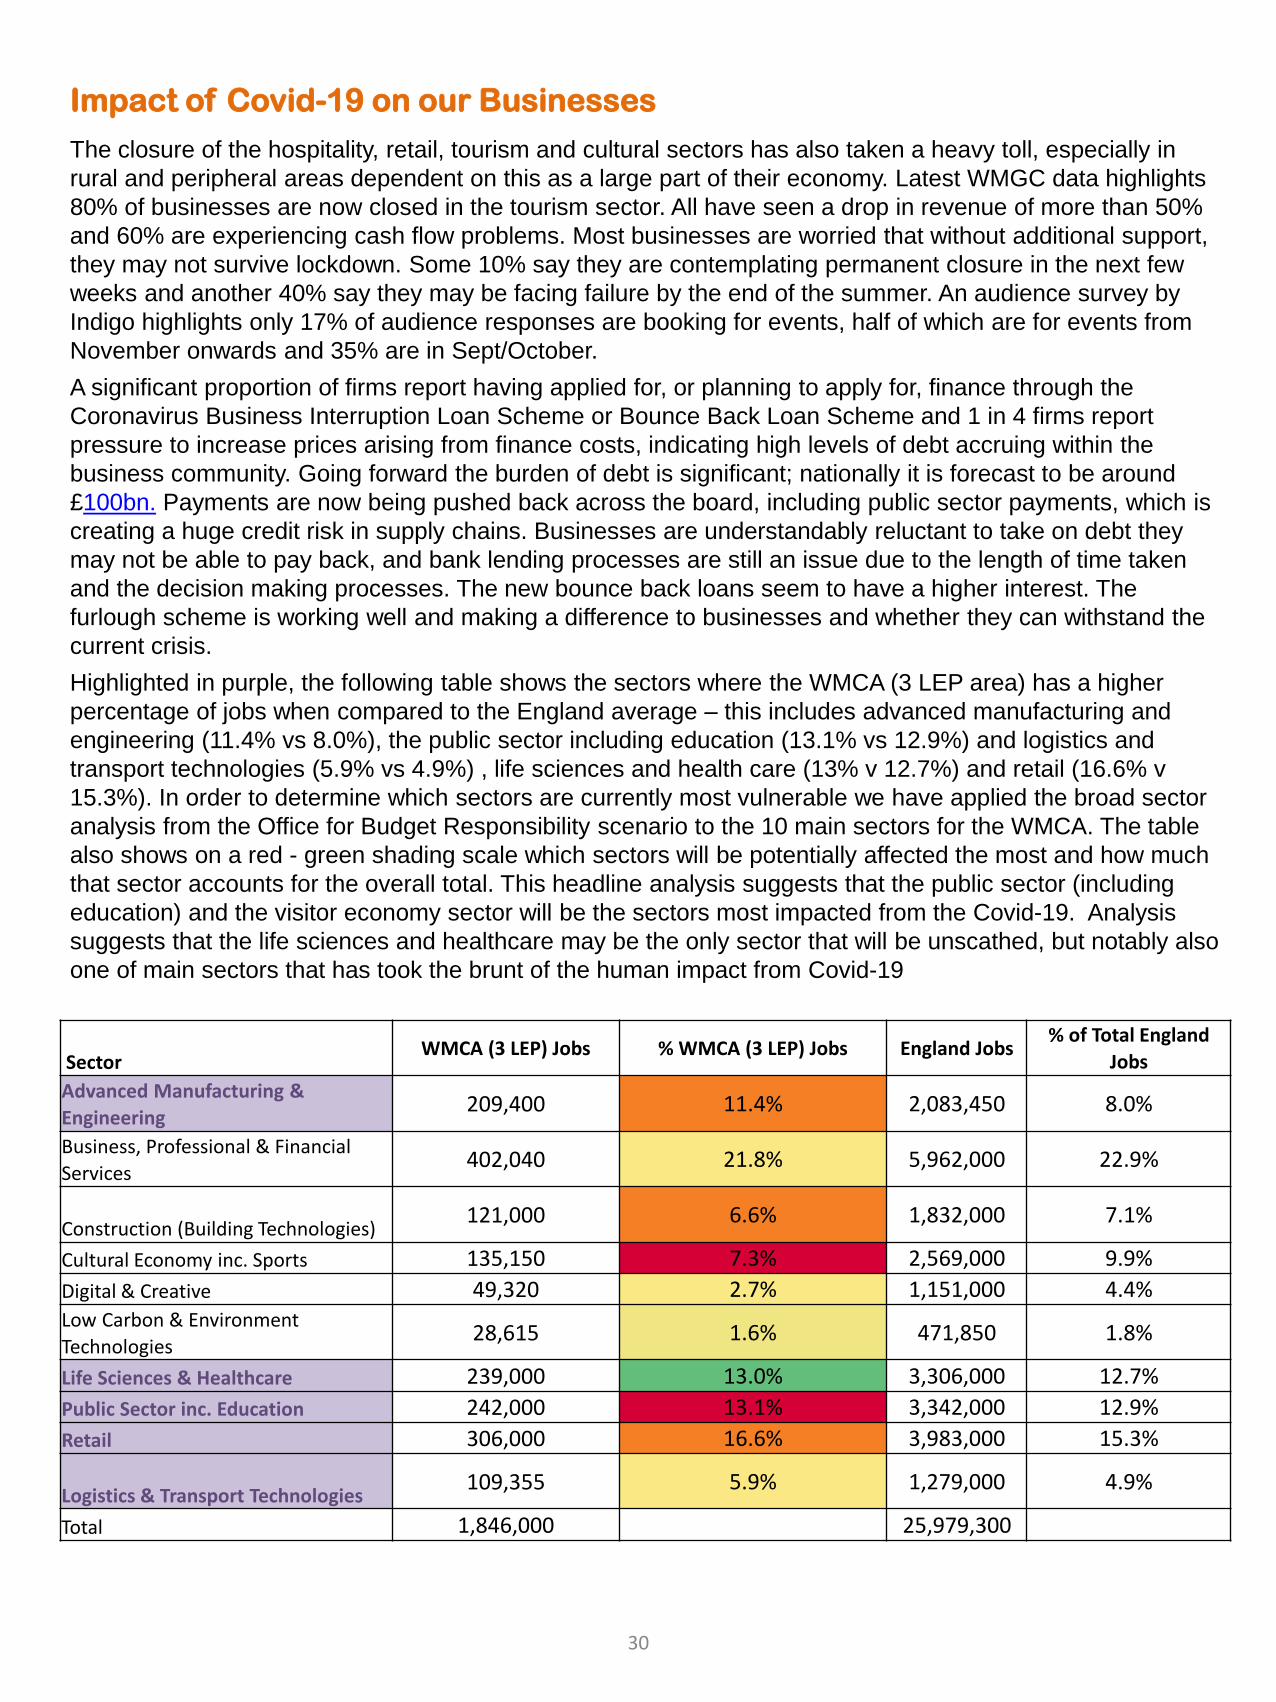
Highlighted in purple, the following table shows the sectors where the WMCA (3 LEP area) has a higher
percentage of jobs when compared to the England average – this includes advanced manufacturing and
engineering (11.4% vs 8.0%), the public sector including education (13.1% vs 12.9%) and logistics and
transport technologies (5.9% vs 4.9%) , life sciences and health care (13% v 12.7%) and retail (16.6% v
15.3%). In order to determine which sectors are currently most vulnerable we have applied the broad sector
analysis from the Office for Budget Responsibility scenario to the 10 main sectors for the WMCA. The table
also shows on a red - green shading scale which sectors will be potentially affected the most and how much
that sector accounts for the overall total. This headline analysis suggests that the public sector (including
education) and the visitor economy sector will be the sectors most impacted from the Covid-19. Analysis
suggests that the life sciences and healthcare may be the only sector that will be unscathed, but notably also
one of main sectors that has took the brunt of the human impact from Covid-19
Sector WMCA (3 LEP) Jobs % WMCA (3 LEP) Jobs England Jobs
% of Total England
Jobs
Advanced Manufacturing &
Engineering209,400 11.4% 2,083,450 8.0%
Business, Professional & Financial
Services402,040 21.8% 5,962,000 22.9%
Construction (Building Technologies)121,000 6.6% 1,832,000 7.1%
Cultural Economy inc. Sports 135,150 7.3% 2,569,000 9.9%
Digital & Creative 49,320 2.7% 1,151,000 4.4%Low Carbon & Environment
Technologies28,615 1.6% 471,850 1.8%
Life Sciences & Healthcare 239,000 13.0% 3,306,000 12.7%
Public Sector inc. Education 242,000 13.1% 3,342,000 12.9%
Retail 306,000 16.6% 3,983,000 15.3%
Logistics & Transport Technologies109,355 5.9% 1,279,000 4.9%
Total 1,846,000 25,979,300
30
Impact of Covid-19 on our Businesses
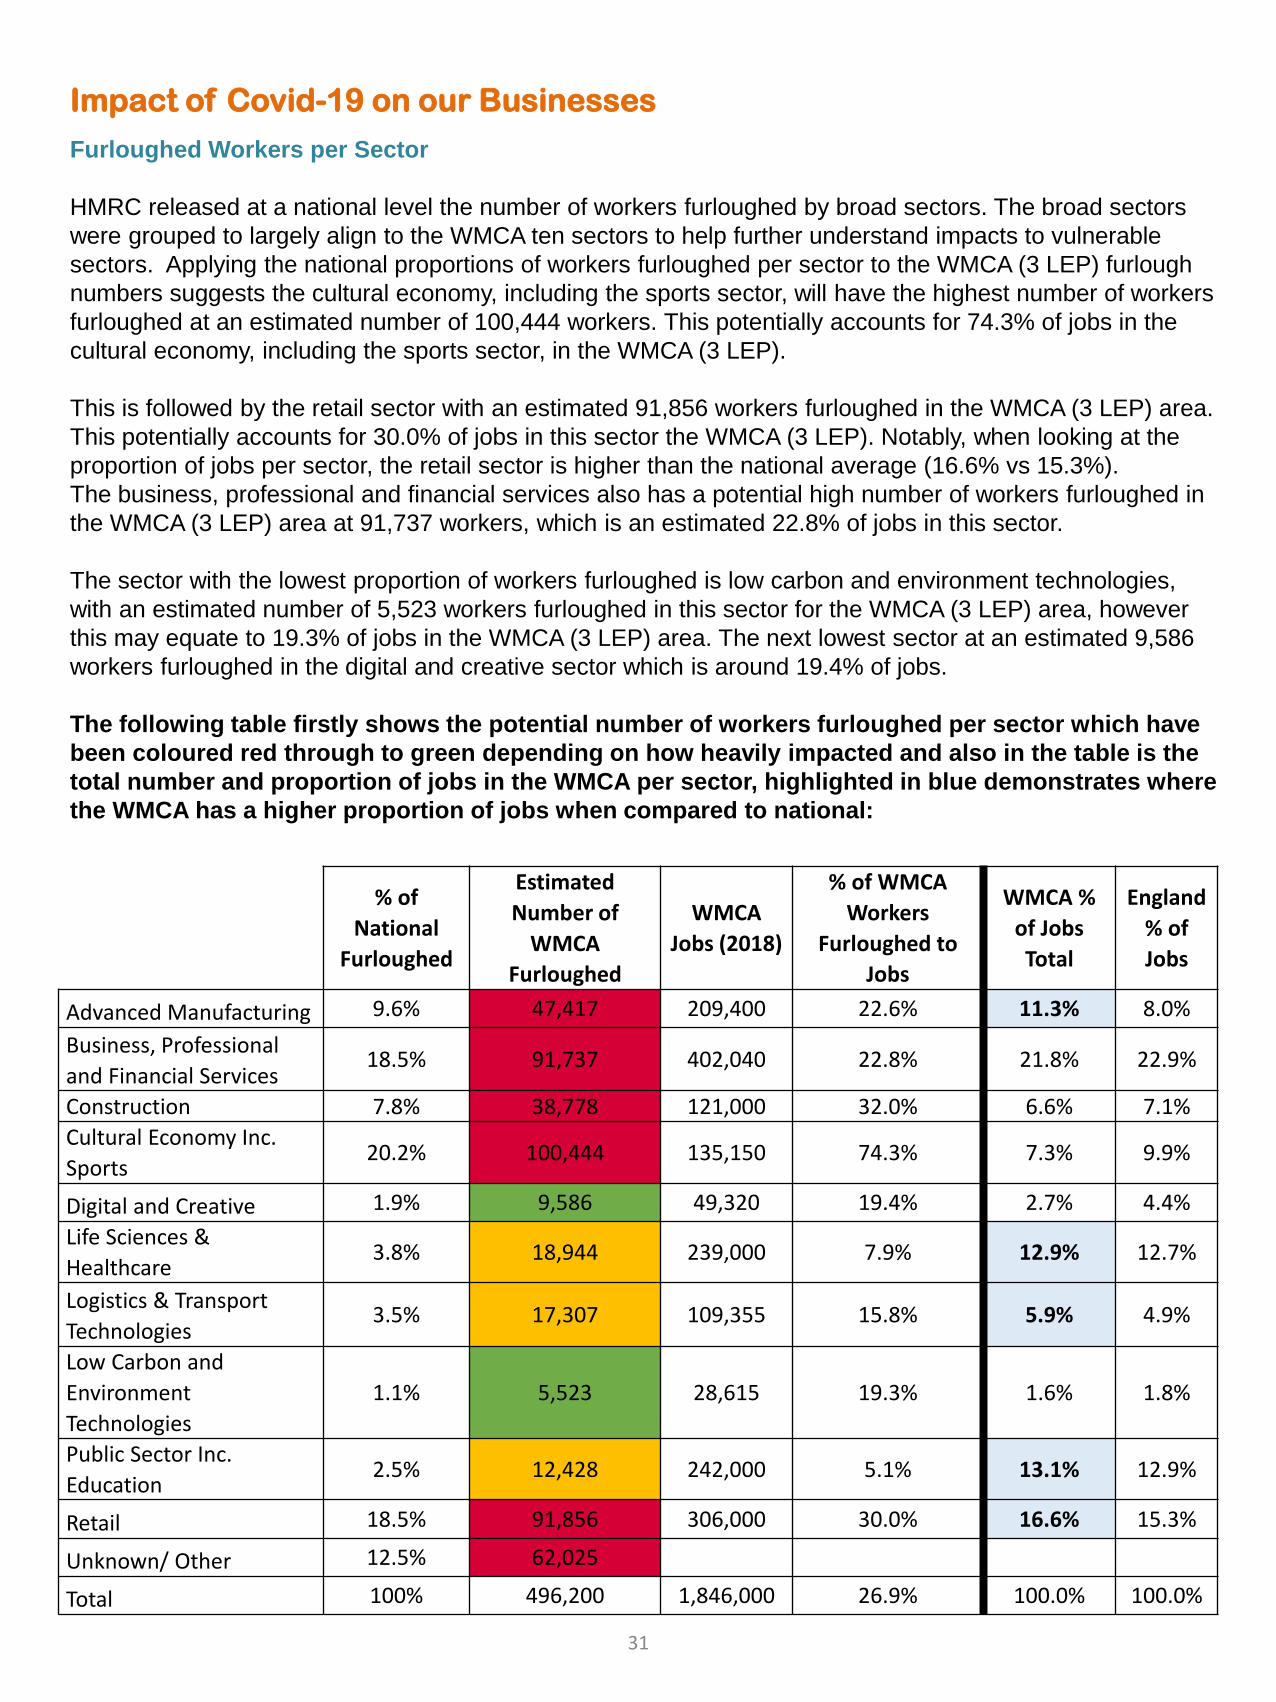
Furloughed Workers per Sector
HMRC released at a national level the number of workers furloughed by broad sectors. The broad sectors
were grouped to largely align to the WMCA ten sectors to help further understand impacts to vulnerable
sectors. Applying the national proportions of workers furloughed per sector to the WMCA (3 LEP) furlough
numbers suggests the cultural economy, including the sports sector, will have the highest number of workers
furloughed at an estimated number of 100,444 workers. This potentially accounts for 74.3% of jobs in the
cultural economy, including the sports sector, in the WMCA (3 LEP).
This is followed by the retail sector with an estimated 91,856 workers furloughed in the WMCA (3 LEP) area.
This potentially accounts for 30.0% of jobs in this sector the WMCA (3 LEP). Notably, when looking at the
proportion of jobs per sector, the retail sector is higher than the national average (16.6% vs 15.3%).
The business, professional and financial services also has a potential high number of workers furloughed in
the WMCA (3 LEP) area at 91,737 workers, which is an estimated 22.8% of jobs in this sector.
The sector with the lowest proportion of workers furloughed is low carbon and environment technologies,
with an estimated number of 5,523 workers furloughed in this sector for the WMCA (3 LEP) area, however
this may equate to 19.3% of jobs in the WMCA (3 LEP) area. The next lowest sector at an estimated 9,586
workers furloughed in the digital and creative sector which is around 19.4% of jobs.
The following table firstly shows the potential number of workers furloughed per sector which have
been coloured red through to green depending on how heavily impacted and also in the table is the
total number and proportion of jobs in the WMCA per sector, highlighted in blue demonstrates where
the WMCA has a higher proportion of jobs when compared to national:
% of
National
Furloughed
Estimated
Number of
WMCA
Furloughed
WMCA
Jobs (2018)
% of WMCA
Workers
Furloughed to
Jobs
WMCA %
of Jobs
Total
England
% of
Jobs
Advanced Manufacturing 9.6% 47,417 209,400 22.6% 11.3% 8.0%
Business, Professional
and Financial Services18.5% 91,737 402,040 22.8% 21.8% 22.9%
Construction 7.8% 38,778 121,000 32.0% 6.6% 7.1%
Cultural Economy Inc.
Sports20.2% 100,444 135,150 74.3% 7.3% 9.9%
Digital and Creative 1.9% 9,586 49,320 19.4% 2.7% 4.4%
Life Sciences &
Healthcare3.8% 18,944 239,000 7.9% 12.9% 12.7%
Logistics & Transport
Technologies3.5% 17,307 109,355 15.8% 5.9% 4.9%
Low Carbon and
Environment
Technologies
1.1% 5,523 28,615 19.3% 1.6% 1.8%
Public Sector Inc.
Education2.5% 12,428 242,000 5.1% 13.1% 12.9%
Retail 18.5% 91,856 306,000 30.0% 16.6% 15.3%
Unknown/ Other 12.5% 62,025
Total 100% 496,200 1,846,000 26.9% 100.0% 100.0%
31
Impact of Covid-19 on our Businesses
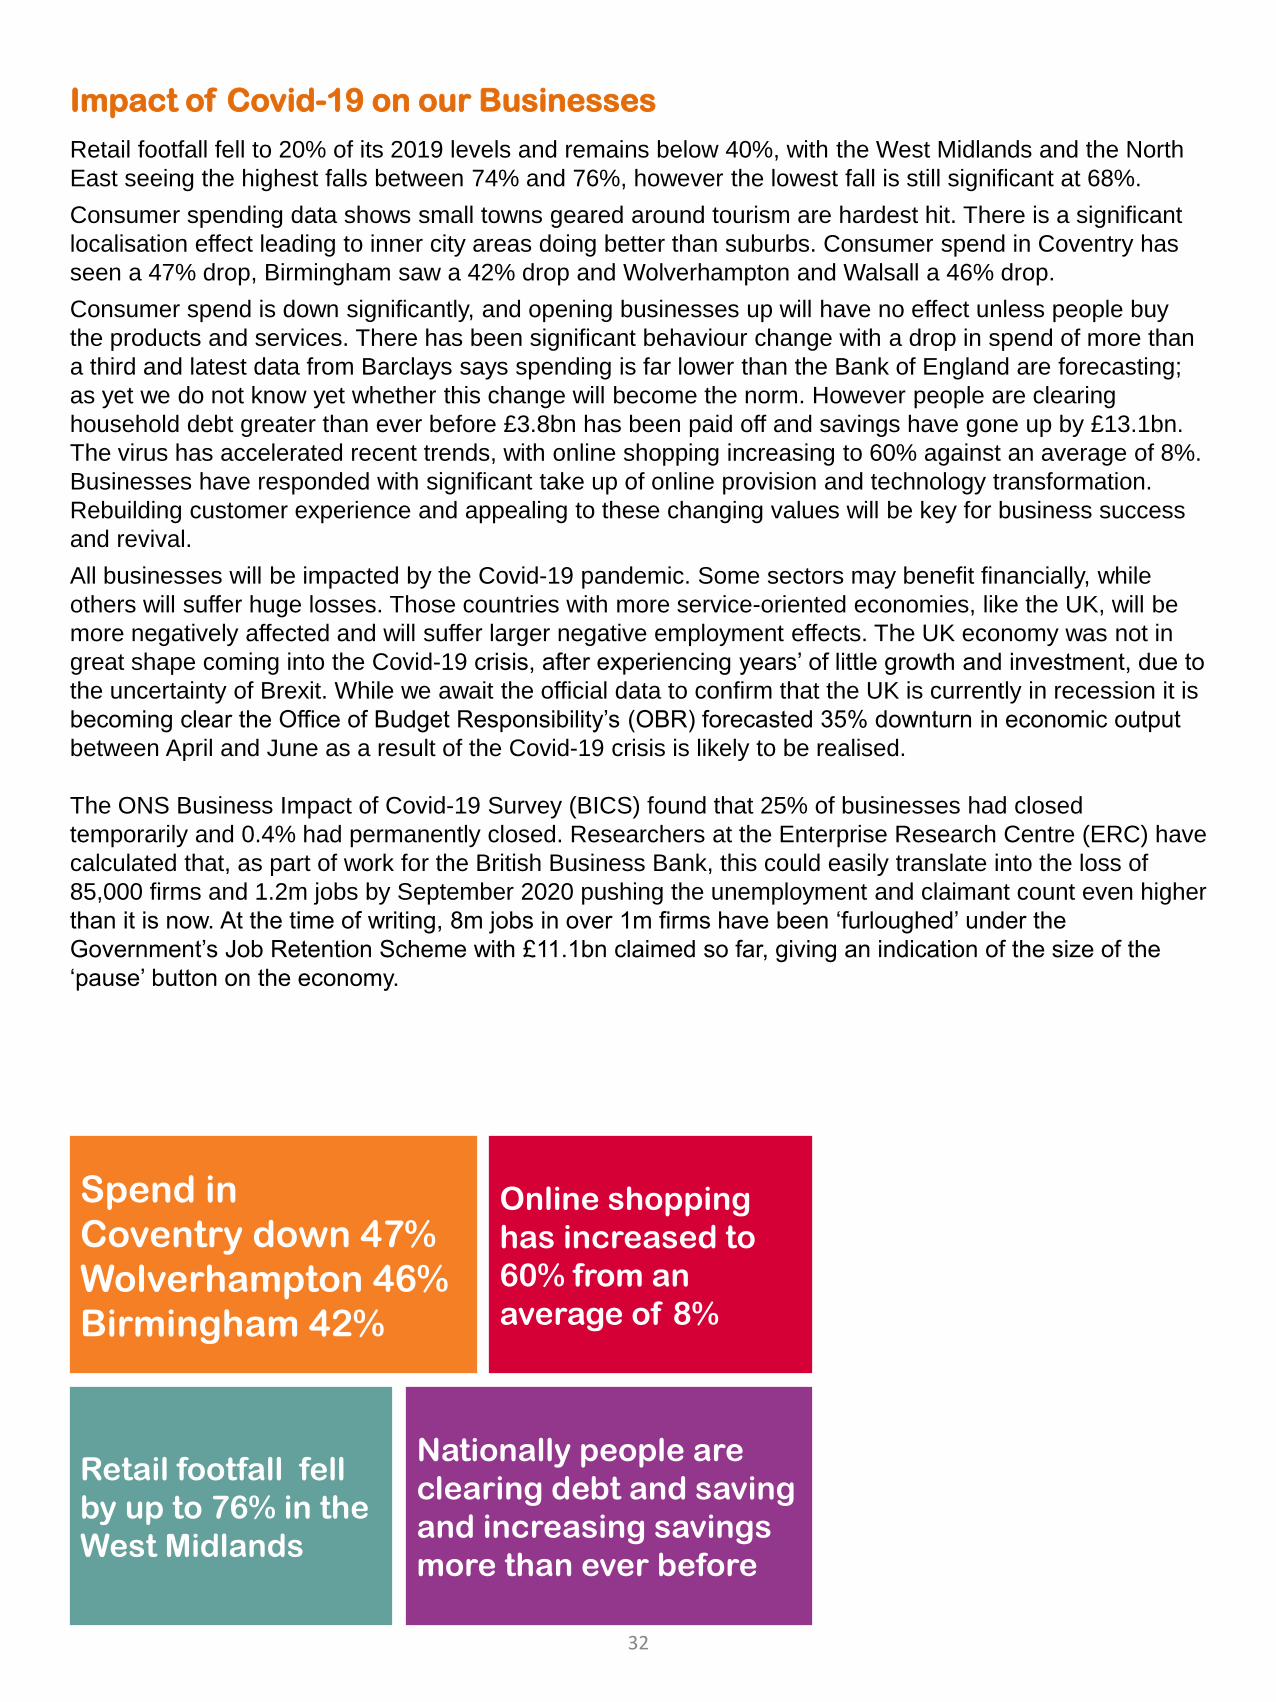
Retail footfall fell to 20% of its 2019 levels and remains below 40%, with the West Midlands and the North
East seeing the highest falls between 74% and 76%, however the lowest fall is still significant at 68%.
Consumer spending data shows small towns geared around tourism are hardest hit. There is a significant
localisation effect leading to inner city areas doing better than suburbs. Consumer spend in Coventry has
seen a 47% drop, Birmingham saw a 42% drop and Wolverhampton and Walsall a 46% drop.
Consumer spend is down significantly, and opening businesses up will have no effect unless people buy
the products and services. There has been significant behaviour change with a drop in spend of more than
a third and latest data from Barclays says spending is far lower than the Bank of England are forecasting;
as yet we do not know yet whether this change will become the norm. However people are clearing
household debt greater than ever before £3.8bn has been paid off and savings have gone up by £13.1bn.
The virus has accelerated recent trends, with online shopping increasing to 60% against an average of 8%.
Businesses have responded with significant take up of online provision and technology transformation.
Rebuilding customer experience and appealing to these changing values will be key for business success
and revival.
All businesses will be impacted by the Covid-19 pandemic. Some sectors may benefit financially, while
others will suffer huge losses. Those countries with more service-oriented economies, like the UK, will be
more negatively affected and will suffer larger negative employment effects. The UK economy was not in
great shape coming into the Covid-19 crisis, after experiencing years’ of little growth and investment, due to
the uncertainty of Brexit. While we await the official data to confirm that the UK is currently in recession it is
becoming clear the Office of Budget Responsibility’s (OBR) forecasted 35% downturn in economic output
between April and June as a result of the Covid-19 crisis is likely to be realised.
The ONS Business Impact of Covid-19 Survey (BICS) found that 25% of businesses had closed
temporarily and 0.4% had permanently closed. Researchers at the Enterprise Research Centre (ERC) have
calculated that, as part of work for the British Business Bank, this could easily translate into the loss of
85,000 firms and 1.2m jobs by September 2020 pushing the unemployment and claimant count even higher
than it is now. At the time of writing, 8m jobs in over 1m firms have been ‘furloughed’ under the
Government’s Job Retention Scheme with £11.1bn claimed so far, giving an indication of the size of the
‘pause’ button on the economy.
Spend in
Coventry down 47%
Wolverhampton 46%
Birmingham 42%
Nationally people are
clearing debt and saving
and increasing savings
more than ever before
Online shopping
has increased to
60% from an
average of 8%
Retail footfall fell
by up to 76% in the
West Midlands
32
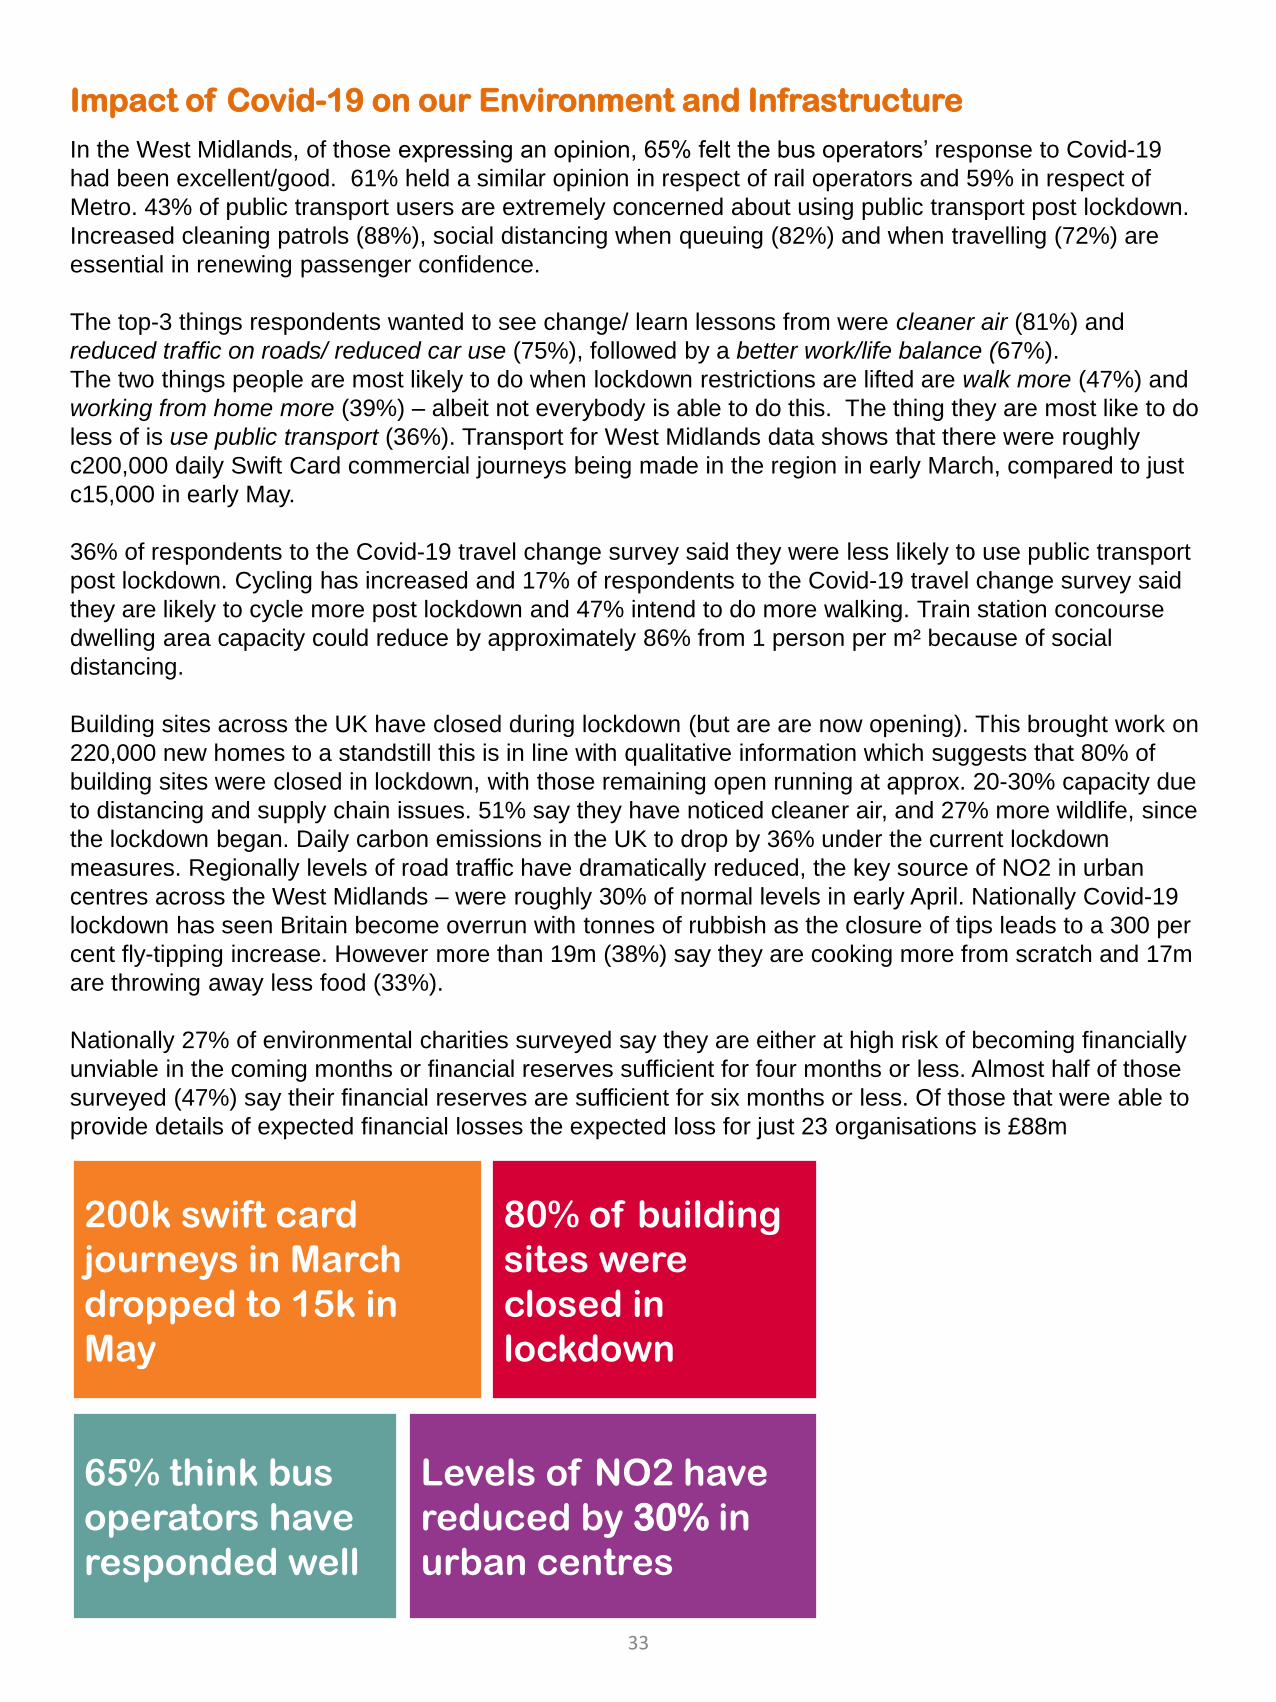
Impact of Covid-19 on our Environment and Infrastructure
In the West Midlands, of those expressing an opinion, 65% felt the bus operators’ response to Covid-19
had been excellent/good. 61% held a similar opinion in respect of rail operators and 59% in respect of
Metro. 43% of public transport users are extremely concerned about using public transport post lockdown.
Increased cleaning patrols (88%), social distancing when queuing (82%) and when travelling (72%) are
essential in renewing passenger confidence.
The top-3 things respondents wanted to see change/ learn lessons from were cleaner air (81%) and
reduced traffic on roads/ reduced car use (75%), followed by a better work/life balance (67%).
The two things people are most likely to do when lockdown restrictions are lifted are walk more (47%) and
working from home more (39%) – albeit not everybody is able to do this. The thing they are most like to do
less of is use public transport (36%). Transport for West Midlands data shows that there were roughly
c200,000 daily Swift Card commercial journeys being made in the region in early March, compared to just
c15,000 in early May.
36% of respondents to the Covid-19 travel change survey said they were less likely to use public transport
post lockdown. Cycling has increased and 17% of respondents to the Covid-19 travel change survey said
they are likely to cycle more post lockdown and 47% intend to do more walking. Train station concourse
dwelling area capacity could reduce by approximately 86% from 1 person per m² because of social
distancing.
Building sites across the UK have closed during lockdown (but are are now opening). This brought work on
220,000 new homes to a standstill this is in line with qualitative information which suggests that 80% of
building sites were closed in lockdown, with those remaining open running at approx. 20-30% capacity due
to distancing and supply chain issues. 51% say they have noticed cleaner air, and 27% more wildlife, since
the lockdown began. Daily carbon emissions in the UK to drop by 36% under the current lockdown
measures. Regionally levels of road traffic have dramatically reduced, the key source of NO2 in urban
centres across the West Midlands – were roughly 30% of normal levels in early April. Nationally Covid-19
lockdown has seen Britain become overrun with tonnes of rubbish as the closure of tips leads to a 300 per
cent fly-tipping increase. However more than 19m (38%) say they are cooking more from scratch and 17m
are throwing away less food (33%).
Nationally 27% of environmental charities surveyed say they are either at high risk of becoming financially
unviable in the coming months or financial reserves sufficient for four months or less. Almost half of those
surveyed (47%) say their financial reserves are sufficient for six months or less. Of those that were able to
provide details of expected financial losses the expected loss for just 23 organisations is £88m
200k swift card
journeys in March
dropped to 15k in
May
Levels of NO2 have
reduced by 30% in
urban centres
80% of building
sites were
closed in
lockdown
65% think bus
operators have
responded well
33
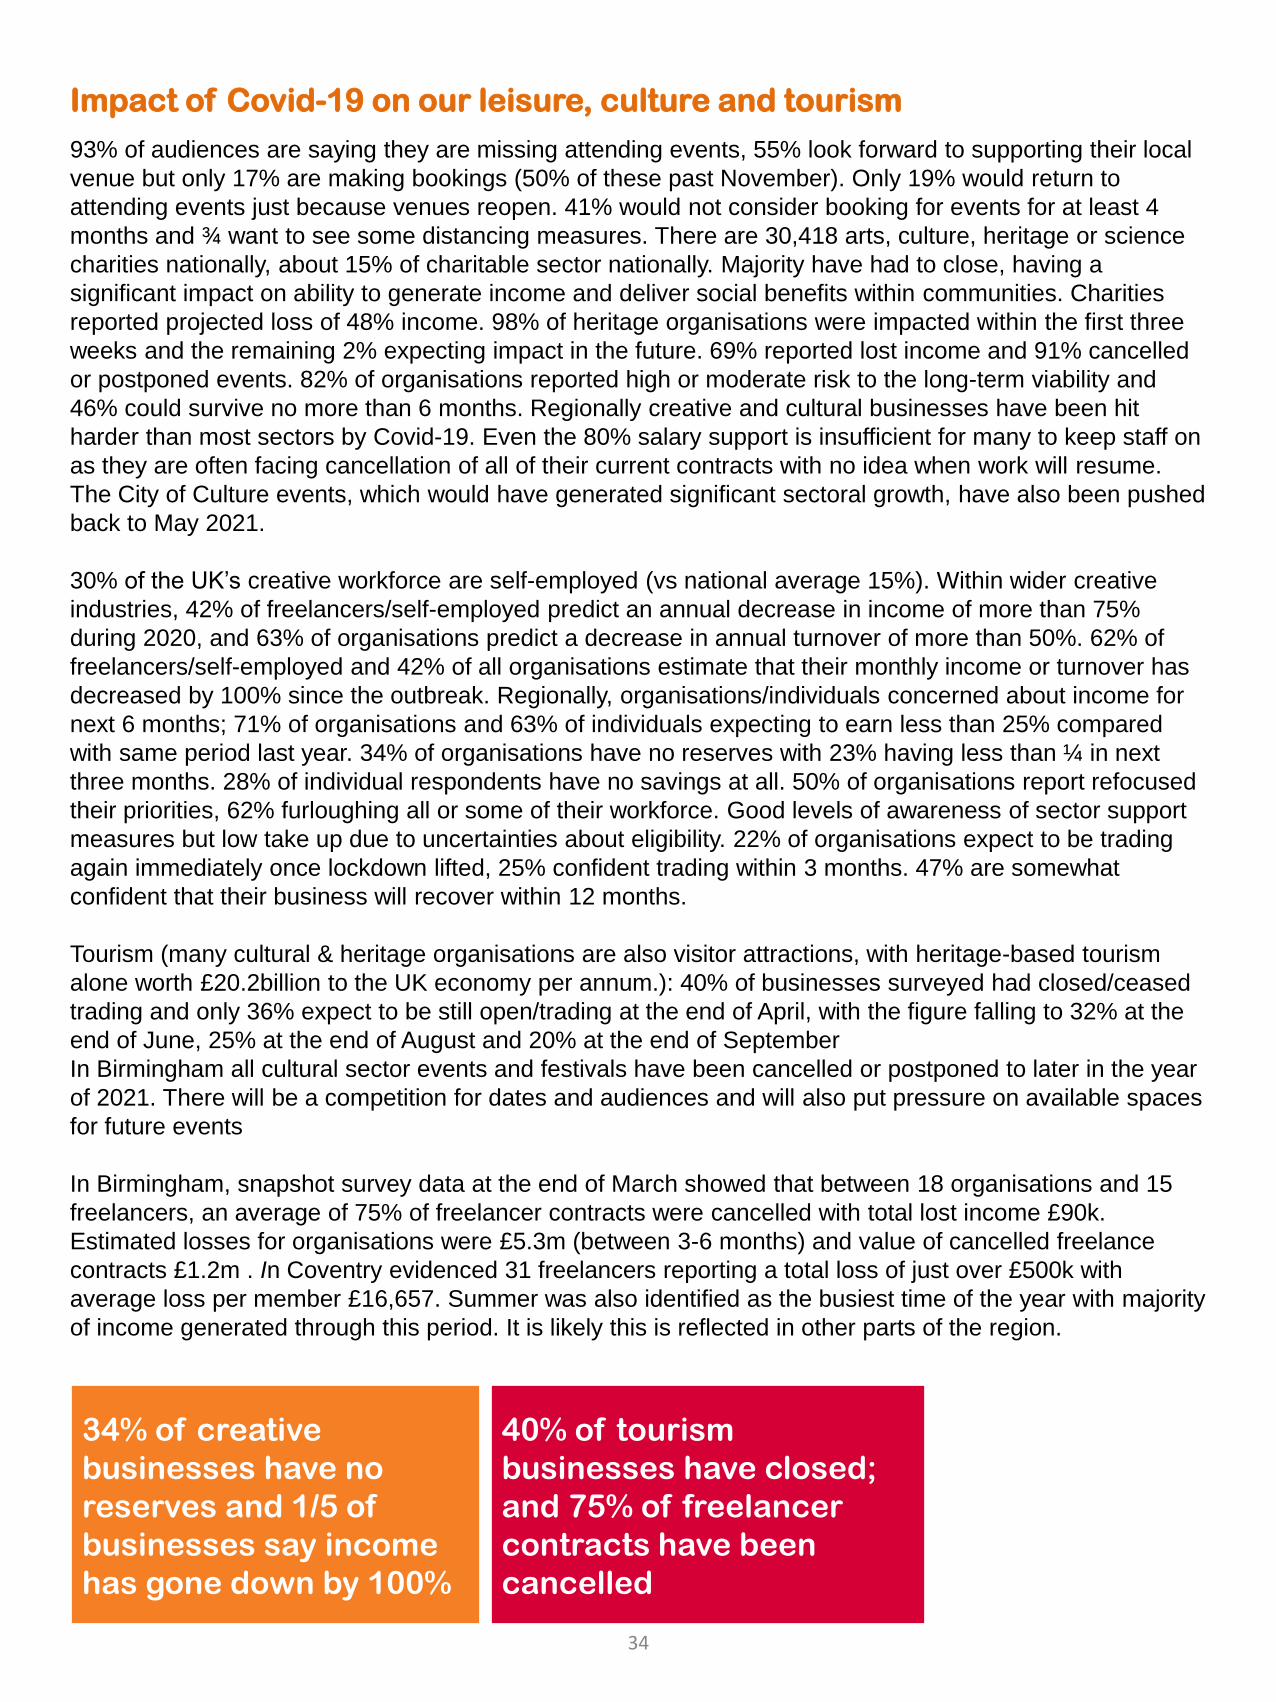
Impact of Covid-19 on our leisure, culture and tourism
93% of audiences are saying they are missing attending events, 55% look forward to supporting their local
venue but only 17% are making bookings (50% of these past November). Only 19% would return to
attending events just because venues reopen. 41% would not consider booking for events for at least 4
months and ¾ want to see some distancing measures. There are 30,418 arts, culture, heritage or science
charities nationally, about 15% of charitable sector nationally. Majority have had to close, having a
significant impact on ability to generate income and deliver social benefits within communities. Charities
reported projected loss of 48% income. 98% of heritage organisations were impacted within the first three
weeks and the remaining 2% expecting impact in the future. 69% reported lost income and 91% cancelled
or postponed events. 82% of organisations reported high or moderate risk to the long-term viability and
46% could survive no more than 6 months. Regionally creative and cultural businesses have been hit
harder than most sectors by Covid-19. Even the 80% salary support is insufficient for many to keep staff on
as they are often facing cancellation of all of their current contracts with no idea when work will resume.
The City of Culture events, which would have generated significant sectoral growth, have also been pushed
back to May 2021.
30% of the UK’s creative workforce are self-employed (vs national average 15%). Within wider creative
industries, 42% of freelancers/self-employed predict an annual decrease in income of more than 75%
during 2020, and 63% of organisations predict a decrease in annual turnover of more than 50%. 62% of
freelancers/self-employed and 42% of all organisations estimate that their monthly income or turnover has
decreased by 100% since the outbreak. Regionally, organisations/individuals concerned about income for
next 6 months; 71% of organisations and 63% of individuals expecting to earn less than 25% compared
with same period last year. 34% of organisations have no reserves with 23% having less than ¼ in next
three months. 28% of individual respondents have no savings at all. 50% of organisations report refocused
their priorities, 62% furloughing all or some of their workforce. Good levels of awareness of sector support
measures but low take up due to uncertainties about eligibility. 22% of organisations expect to be trading
again immediately once lockdown lifted, 25% confident trading within 3 months. 47% are somewhat
confident that their business will recover within 12 months.
Tourism (many cultural & heritage organisations are also visitor attractions, with heritage-based tourism
alone worth £20.2billion to the UK economy per annum.): 40% of businesses surveyed had closed/ceased
trading and only 36% expect to be still open/trading at the end of April, with the figure falling to 32% at the
end of June, 25% at the end of August and 20% at the end of September
In Birmingham all cultural sector events and festivals have been cancelled or postponed to later in the year
of 2021. There will be a competition for dates and audiences and will also put pressure on available spaces
for future events
In Birmingham, snapshot survey data at the end of March showed that between 18 organisations and 15
freelancers, an average of 75% of freelancer contracts were cancelled with total lost income £90k.
Estimated losses for organisations were £5.3m (between 3-6 months) and value of cancelled freelance
contracts £1.2m . In Coventry evidenced 31 freelancers reporting a total loss of just over £500k with
average loss per member £16,657. Summer was also identified as the busiest time of the year with majority
of income generated through this period. It is likely this is reflected in other parts of the region.
34% of creative
businesses have no
reserves and 1/5 of
businesses say income
has gone down by 100%
40% of tourism
businesses have closed;
and 75% of freelancer
contracts have been
cancelled
34
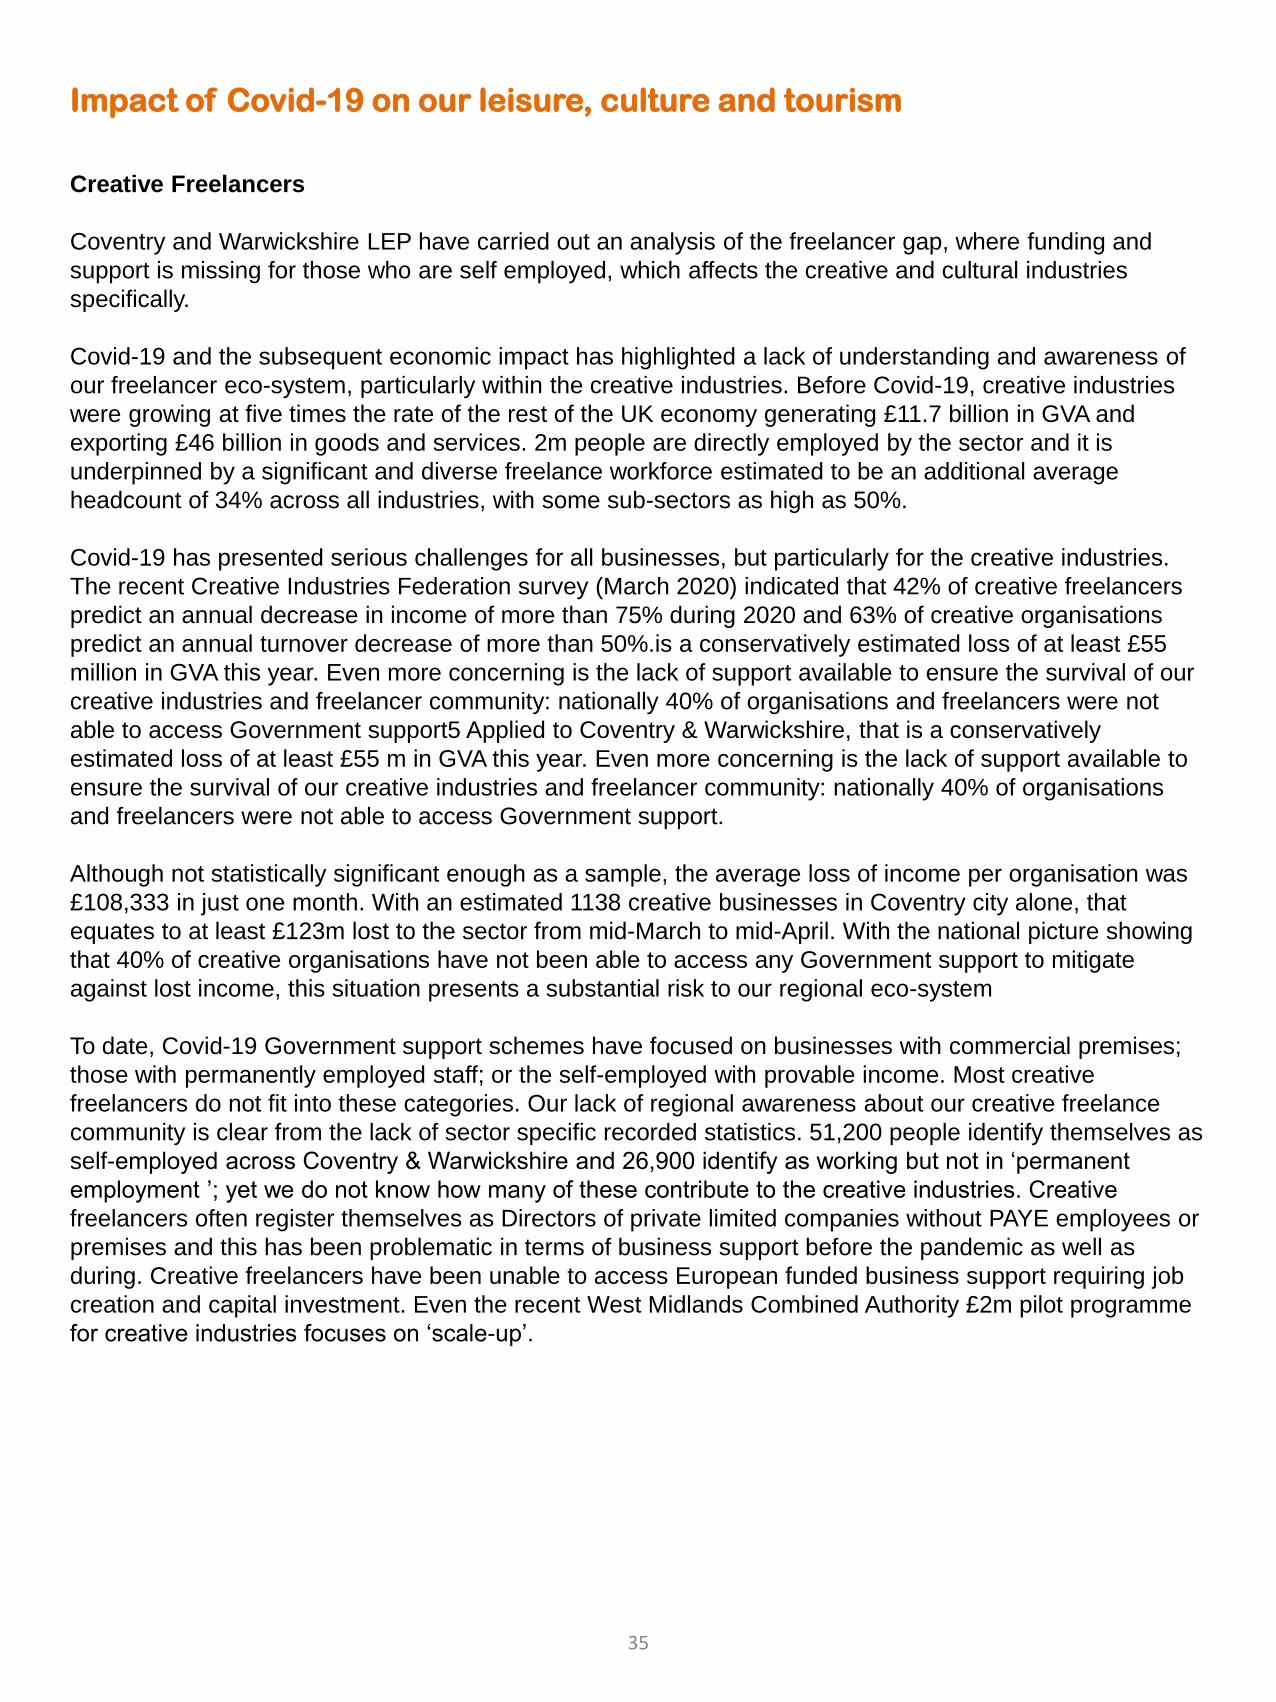
Impact of Covid-19 on our leisure, culture and tourism
Creative Freelancers
Coventry and Warwickshire LEP have carried out an analysis of the freelancer gap, where funding and
support is missing for those who are self employed, which affects the creative and cultural industries
specifically.
Covid-19 and the subsequent economic impact has highlighted a lack of understanding and awareness of
our freelancer eco-system, particularly within the creative industries. Before Covid-19, creative industries
were growing at five times the rate of the rest of the UK economy generating £11.7 billion in GVA and
exporting £46 billion in goods and services. 2m people are directly employed by the sector and it is
underpinned by a significant and diverse freelance workforce estimated to be an additional average
headcount of 34% across all industries, with some sub-sectors as high as 50%.
Covid-19 has presented serious challenges for all businesses, but particularly for the creative industries.
The recent Creative Industries Federation survey (March 2020) indicated that 42% of creative freelancers
predict an annual decrease in income of more than 75% during 2020 and 63% of creative organisations
predict an annual turnover decrease of more than 50%.is a conservatively estimated loss of at least £55
million in GVA this year. Even more concerning is the lack of support available to ensure the survival of our
creative industries and freelancer community: nationally 40% of organisations and freelancers were not
able to access Government support5 Applied to Coventry & Warwickshire, that is a conservatively
estimated loss of at least £55 m in GVA this year. Even more concerning is the lack of support available to
ensure the survival of our creative industries and freelancer community: nationally 40% of organisations
and freelancers were not able to access Government support.
Although not statistically significant enough as a sample, the average loss of income per organisation was
£108,333 in just one month. With an estimated 1138 creative businesses in Coventry city alone, that
equates to at least £123m lost to the sector from mid-March to mid-April. With the national picture showing
that 40% of creative organisations have not been able to access any Government support to mitigate
against lost income, this situation presents a substantial risk to our regional eco-system
To date, Covid-19 Government support schemes have focused on businesses with commercial premises;
those with permanently employed staff; or the self-employed with provable income. Most creative
freelancers do not fit into these categories. Our lack of regional awareness about our creative freelance
community is clear from the lack of sector specific recorded statistics. 51,200 people identify themselves as
self-employed across Coventry & Warwickshire and 26,900 identify as working but not in ‘permanent
employment ’; yet we do not know how many of these contribute to the creative industries. Creative
freelancers often register themselves as Directors of private limited companies without PAYE employees or
premises and this has been problematic in terms of business support before the pandemic as well as
during. Creative freelancers have been unable to access European funded business support requiring job
creation and capital investment. Even the recent West Midlands Combined Authority £2m pilot programme
for creative industries focuses on ‘scale-up’.
35
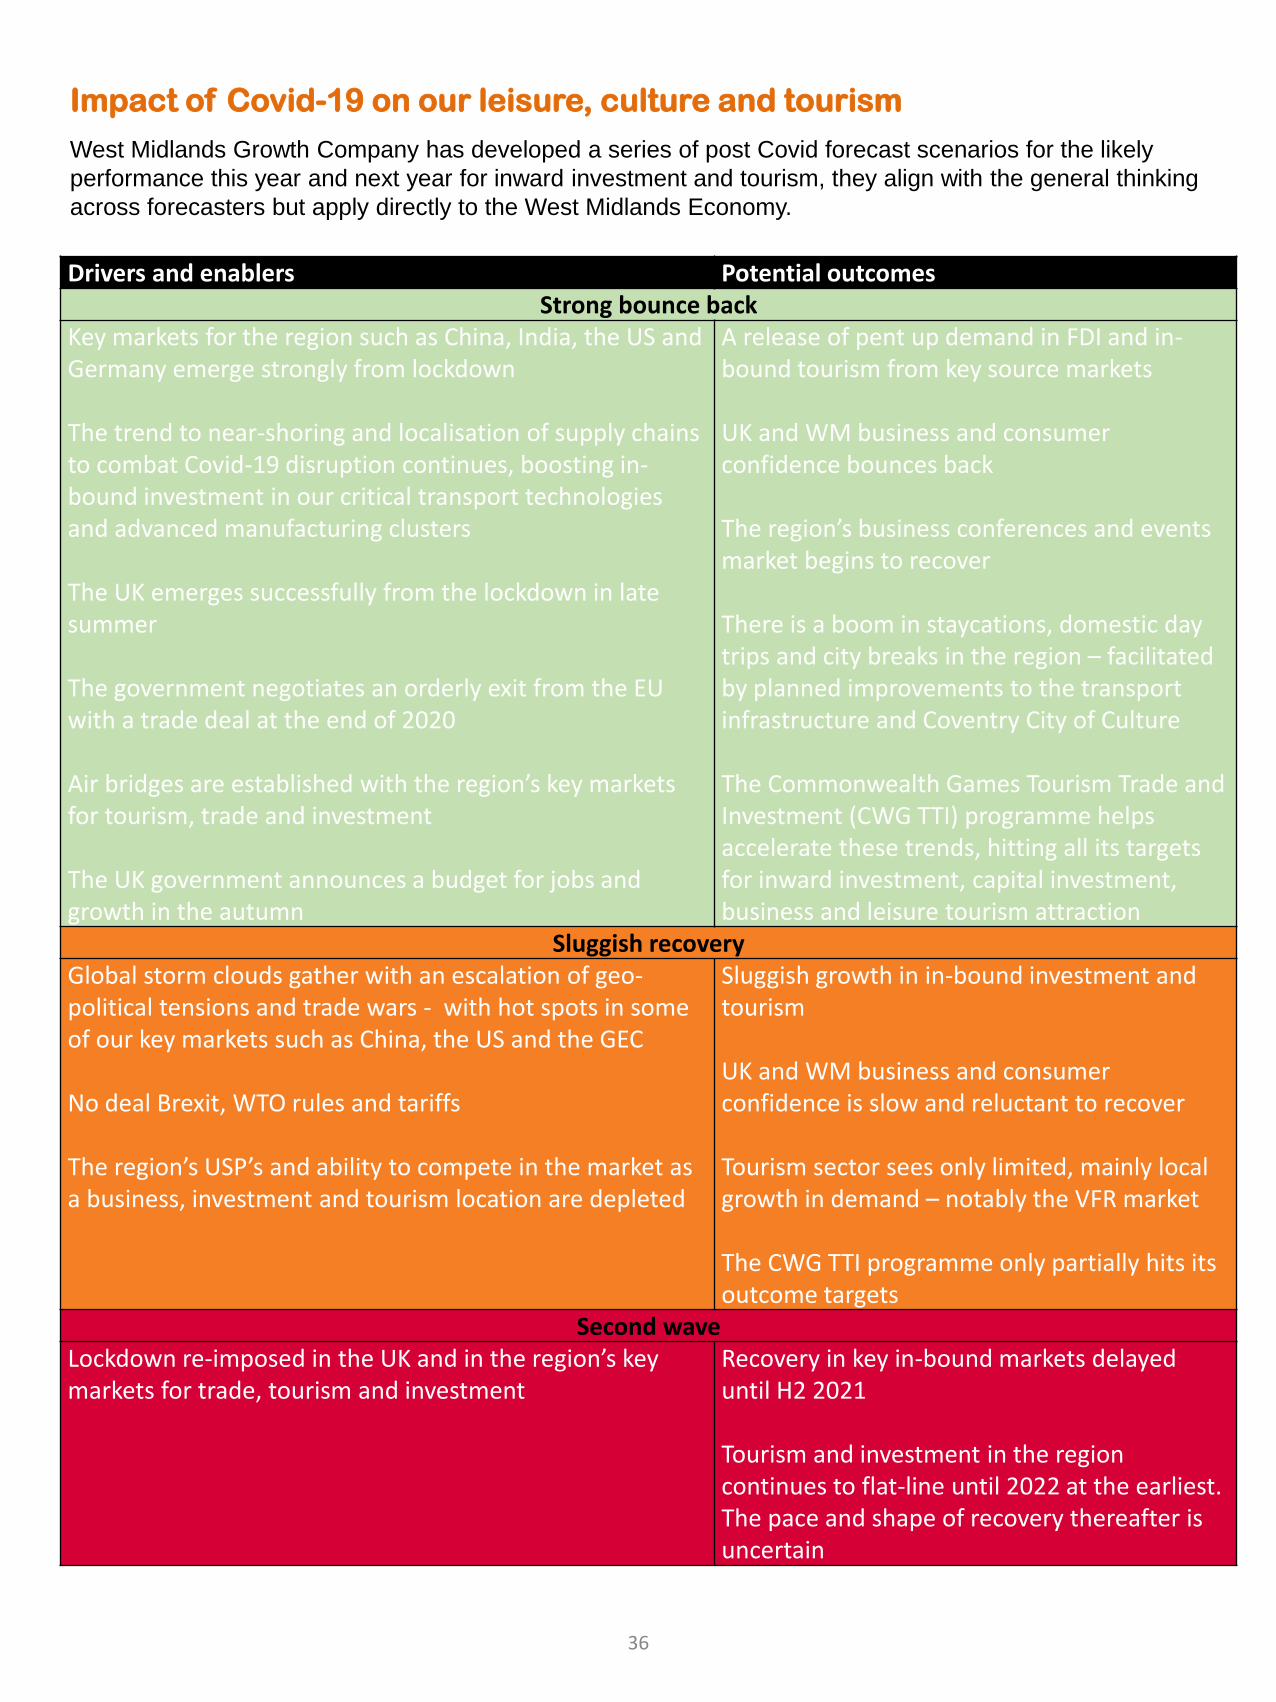
Impact of Covid-19 on our leisure, culture and tourism
West Midlands Growth Company has developed a series of post Covid forecast scenarios for the likely
performance this year and next year for inward investment and tourism, they align with the general thinking
across forecasters but apply directly to the West Midlands Economy.
Drivers and enablers Potential outcomesStrong bounce back
Key markets for the region such as China, India, the US and Germany emerge strongly from lockdown
The trend to near-shoring and localisation of supply chains to combat Covid-19 disruption continues, boosting in-bound investment in our critical transport technologies and advanced manufacturing clusters
The UK emerges successfully from the lockdown in late summer
The government negotiates an orderly exit from the EU with a trade deal at the end of 2020
Air bridges are established with the region’s key markets for tourism, trade and investment
The UK government announces a budget for jobs and growth in the autumn
A release of pent up demand in FDI and in-bound tourism from key source markets
UK and WM business and consumer confidence bounces back
The region’s business conferences and events market begins to recover
There is a boom in staycations, domestic day trips and city breaks in the region – facilitated by planned improvements to the transport infrastructure and Coventry City of Culture
The Commonwealth Games Tourism Trade and Investment (CWG TTI) programme helps accelerate these trends, hitting all its targets for inward investment, capital investment, business and leisure tourism attraction
Sluggish recoveryGlobal storm clouds gather with an escalation of geo-political tensions and trade wars - with hot spots in some of our key markets such as China, the US and the GEC
No deal Brexit, WTO rules and tariffs
The region’s USP’s and ability to compete in the market as a business, investment and tourism location are depleted
Sluggish growth in in-bound investment and tourism
UK and WM business and consumer confidence is slow and reluctant to recover
Tourism sector sees only limited, mainly local growth in demand – notably the VFR market
The CWG TTI programme only partially hits its outcome targets
Second waveLockdown re-imposed in the UK and in the region’s key markets for trade, tourism and investment
Recovery in key in-bound markets delayed until H2 2021
Tourism and investment in the region continues to flat-line until 2022 at the earliest. The pace and shape of recovery thereafter is uncertain
36
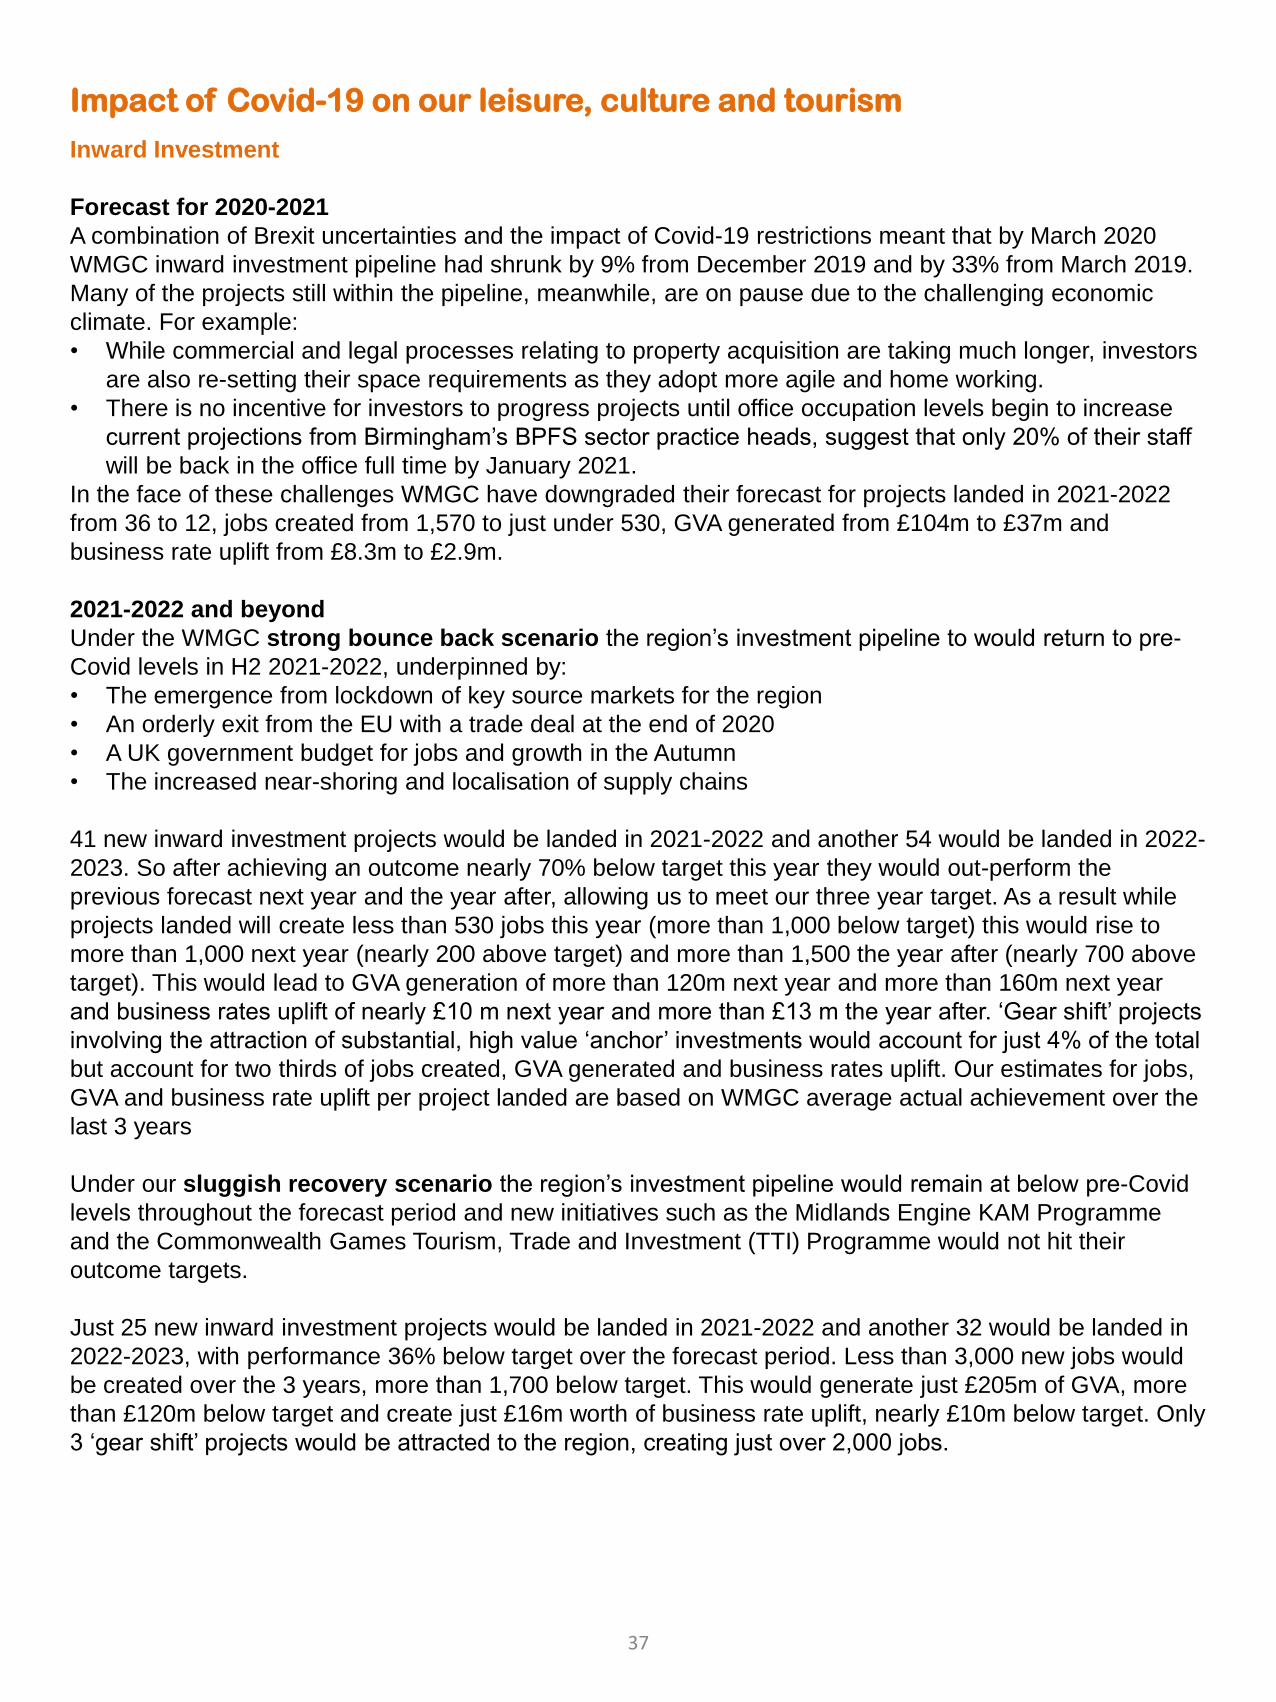
Impact of Covid-19 on our leisure, culture and tourism
Inward Investment
Forecast for 2020-2021
A combination of Brexit uncertainties and the impact of Covid-19 restrictions meant that by March 2020
WMGC inward investment pipeline had shrunk by 9% from December 2019 and by 33% from March 2019.
Many of the projects still within the pipeline, meanwhile, are on pause due to the challenging economic
climate. For example:
• While commercial and legal processes relating to property acquisition are taking much longer, investors
are also re-setting their space requirements as they adopt more agile and home working.
• There is no incentive for investors to progress projects until office occupation levels begin to increase
current projections from Birmingham’s BPFS sector practice heads, suggest that only 20% of their staff
will be back in the office full time by January 2021.
In the face of these challenges WMGC have downgraded their forecast for projects landed in 2021-2022
from 36 to 12, jobs created from 1,570 to just under 530, GVA generated from £104m to £37m and
business rate uplift from £8.3m to £2.9m.
2021-2022 and beyond
Under the WMGC strong bounce back scenario the region’s investment pipeline to would return to pre-
Covid levels in H2 2021-2022, underpinned by:
• The emergence from lockdown of key source markets for the region
• An orderly exit from the EU with a trade deal at the end of 2020
• A UK government budget for jobs and growth in the Autumn
• The increased near-shoring and localisation of supply chains
41 new inward investment projects would be landed in 2021-2022 and another 54 would be landed in 2022-
2023. So after achieving an outcome nearly 70% below target this year they would out-perform the
previous forecast next year and the year after, allowing us to meet our three year target. As a result while
projects landed will create less than 530 jobs this year (more than 1,000 below target) this would rise to
more than 1,000 next year (nearly 200 above target) and more than 1,500 the year after (nearly 700 above
target). This would lead to GVA generation of more than 120m next year and more than 160m next year
and business rates uplift of nearly £10 m next year and more than £13 m the year after. ‘Gear shift’ projects
involving the attraction of substantial, high value ‘anchor’ investments would account for just 4% of the total
but account for two thirds of jobs created, GVA generated and business rates uplift. Our estimates for jobs,
GVA and business rate uplift per project landed are based on WMGC average actual achievement over the
last 3 years
Under our sluggish recovery scenario the region’s investment pipeline would remain at below pre-Covid
levels throughout the forecast period and new initiatives such as the Midlands Engine KAM Programme
and the Commonwealth Games Tourism, Trade and Investment (TTI) Programme would not hit their
outcome targets.
Just 25 new inward investment projects would be landed in 2021-2022 and another 32 would be landed in
2022-2023, with performance 36% below target over the forecast period. Less than 3,000 new jobs would
be created over the 3 years, more than 1,700 below target. This would generate just £205m of GVA, more
than £120m below target and create just £16m worth of business rate uplift, nearly £10m below target. Only
3 ‘gear shift’ projects would be attracted to the region, creating just over 2,000 jobs.
37
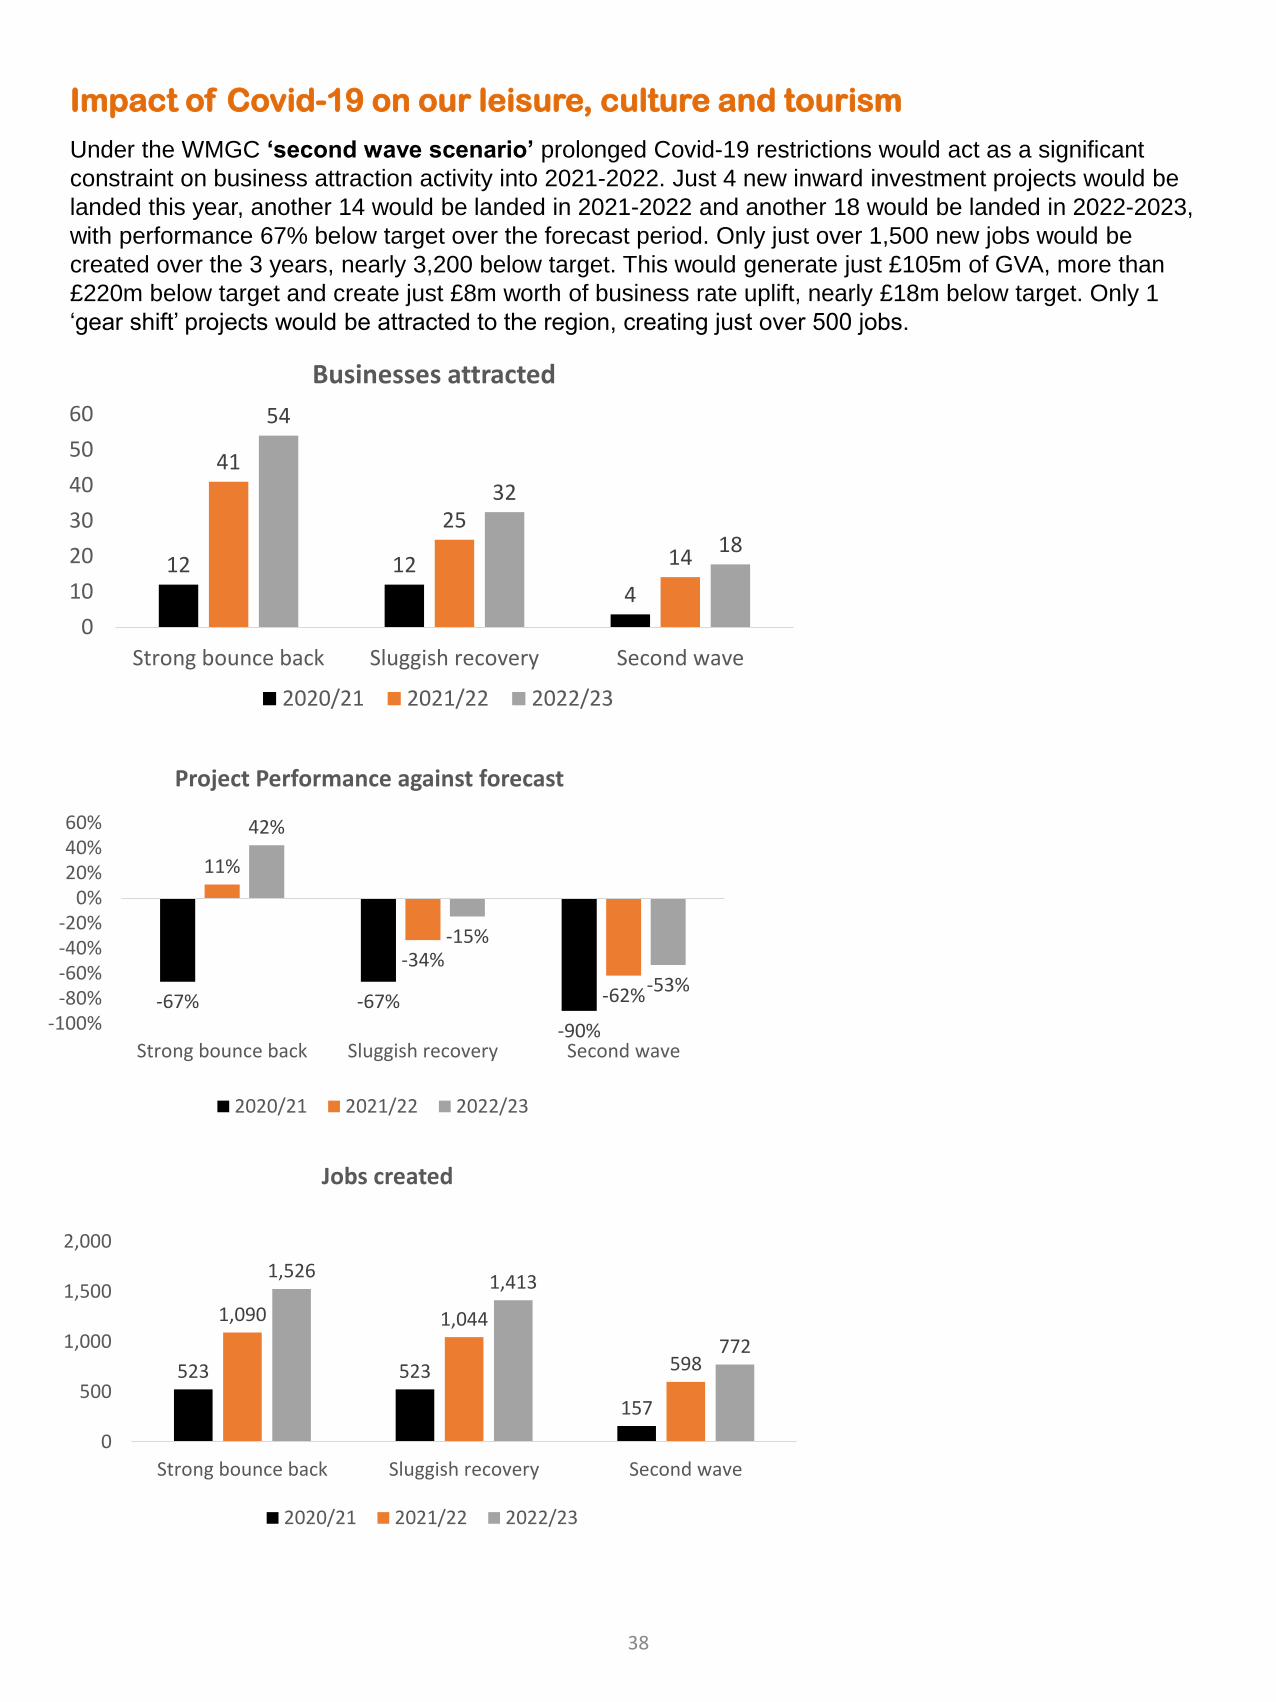
Impact of Covid-19 on our leisure, culture and tourism
Under the WMGC ‘second wave scenario’ prolonged Covid-19 restrictions would act as a significant
constraint on business attraction activity into 2021-2022. Just 4 new inward investment projects would be
landed this year, another 14 would be landed in 2021-2022 and another 18 would be landed in 2022-2023,
with performance 67% below target over the forecast period. Only just over 1,500 new jobs would be
created over the 3 years, nearly 3,200 below target. This would generate just £105m of GVA, more than
£220m below target and create just £8m worth of business rate uplift, nearly £18m below target. Only 1
‘gear shift’ projects would be attracted to the region, creating just over 500 jobs.
12 124
41
25
14
54
32
18
0
10
20
30
40
50
60
Strong bounce back Sluggish recovery Second wave
Businesses attracted
2020/21 2021/22 2022/23
-67% -67%
-90%
11%
-34%
-62%
42%
-15%
-53%
-100%-80%-60%-40%-20%
0%20%40%60%
Strong bounce back Sluggish recovery Second wave
Project Performance against forecast
2020/21 2021/22 2022/23
523 523
157
1,090 1,044
598
1,5261,413
772
0
500
1,000
1,500
2,000
Strong bounce back Sluggish recovery Second wave
Jobs created
2020/21 2021/22 2022/23
38
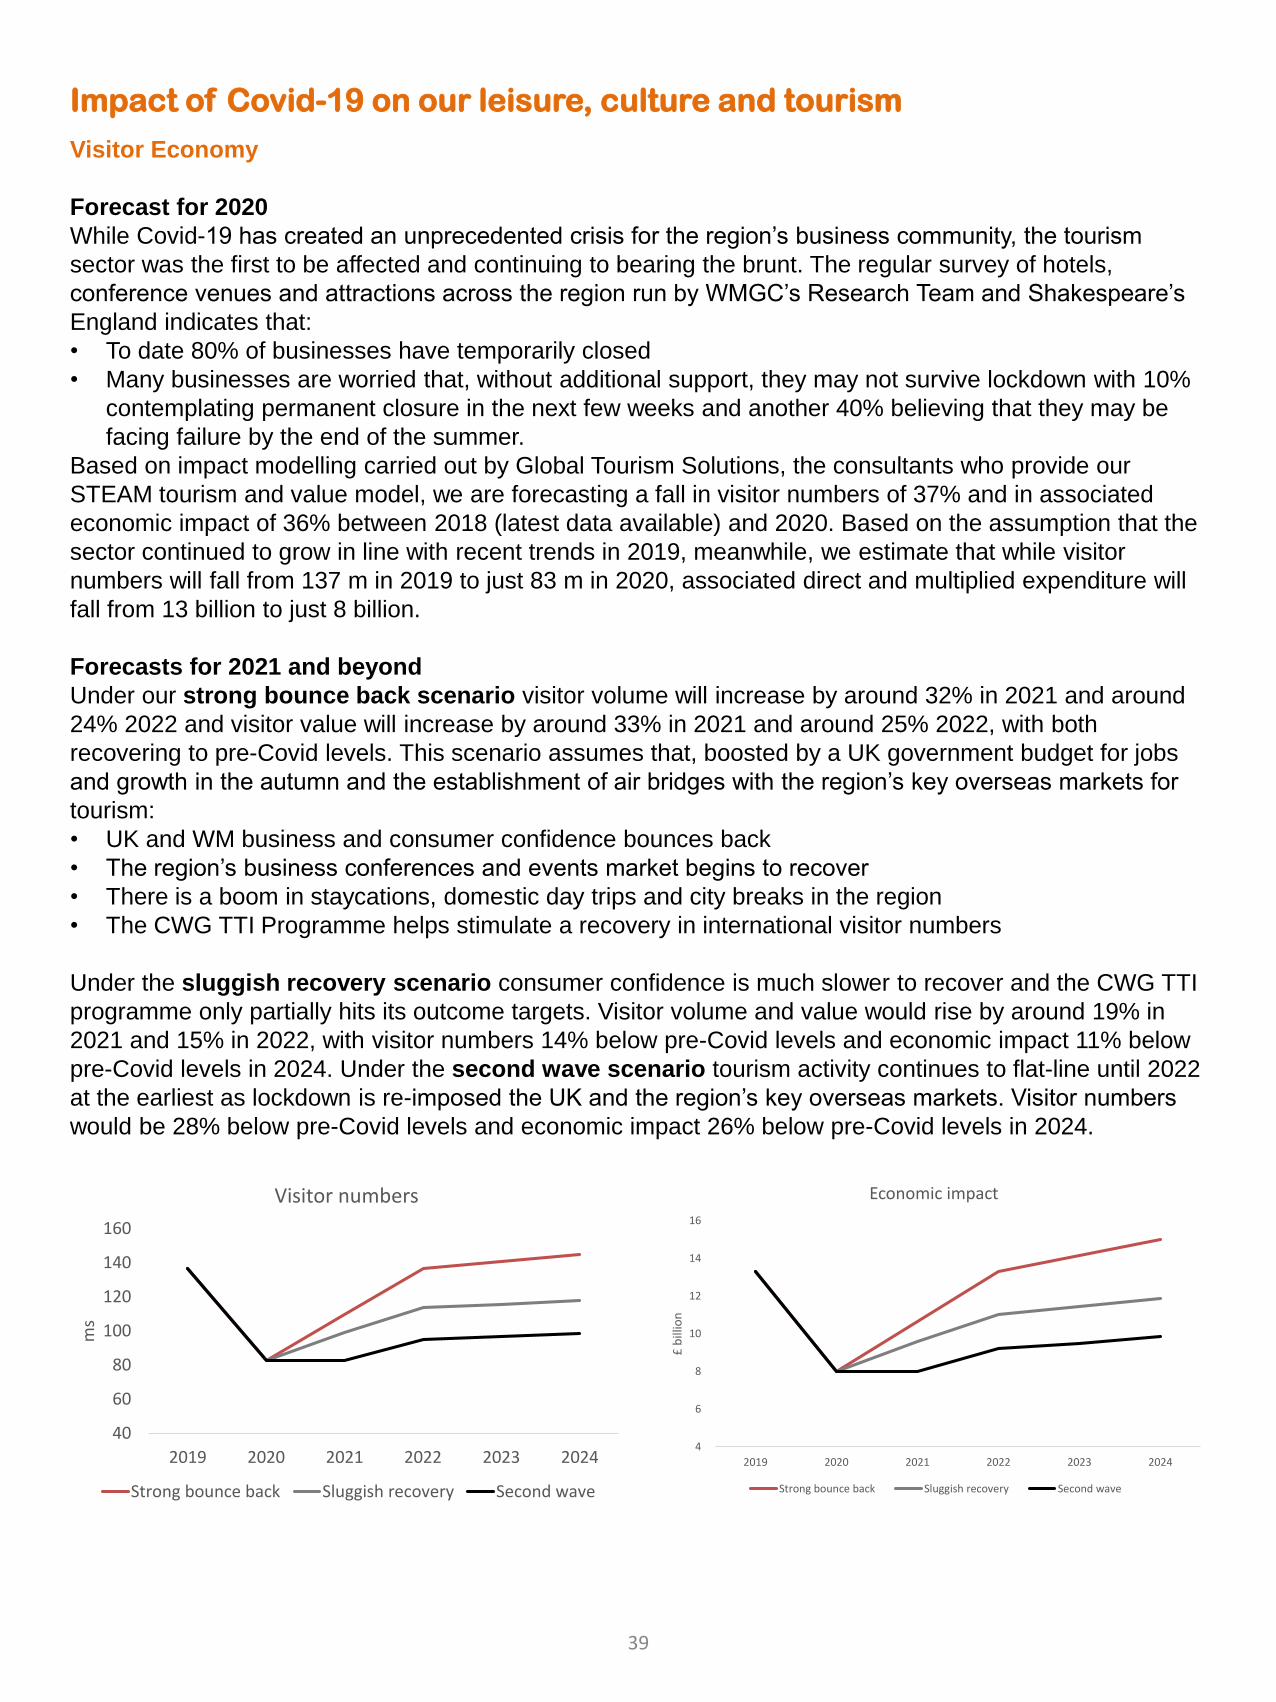
Impact of Covid-19 on our leisure, culture and tourism
Visitor Economy
Forecast for 2020
While Covid-19 has created an unprecedented crisis for the region’s business community, the tourism
sector was the first to be affected and continuing to bearing the brunt. The regular survey of hotels,
conference venues and attractions across the region run by WMGC’s Research Team and Shakespeare’s
England indicates that:
• To date 80% of businesses have temporarily closed
• Many businesses are worried that, without additional support, they may not survive lockdown with 10%
contemplating permanent closure in the next few weeks and another 40% believing that they may be
facing failure by the end of the summer.
Based on impact modelling carried out by Global Tourism Solutions, the consultants who provide our
STEAM tourism and value model, we are forecasting a fall in visitor numbers of 37% and in associated
economic impact of 36% between 2018 (latest data available) and 2020. Based on the assumption that the
sector continued to grow in line with recent trends in 2019, meanwhile, we estimate that while visitor
numbers will fall from 137 m in 2019 to just 83 m in 2020, associated direct and multiplied expenditure will
fall from 13 billion to just 8 billion.
Forecasts for 2021 and beyond
Under our strong bounce back scenario visitor volume will increase by around 32% in 2021 and around
24% 2022 and visitor value will increase by around 33% in 2021 and around 25% 2022, with both
recovering to pre-Covid levels. This scenario assumes that, boosted by a UK government budget for jobs
and growth in the autumn and the establishment of air bridges with the region’s key overseas markets for
tourism:
• UK and WM business and consumer confidence bounces back
• The region’s business conferences and events market begins to recover
• There is a boom in staycations, domestic day trips and city breaks in the region
• The CWG TTI Programme helps stimulate a recovery in international visitor numbers
Under the sluggish recovery scenario consumer confidence is much slower to recover and the CWG TTI
programme only partially hits its outcome targets. Visitor volume and value would rise by around 19% in
2021 and 15% in 2022, with visitor numbers 14% below pre-Covid levels and economic impact 11% below
pre-Covid levels in 2024. Under the second wave scenario tourism activity continues to flat-line until 2022
at the earliest as lockdown is re-imposed the UK and the region’s key overseas markets. Visitor numbers
would be 28% below pre-Covid levels and economic impact 26% below pre-Covid levels in 2024.
40
60
80
100
120
140
160
2019 2020 2021 2022 2023 2024
ms
Visitor numbers
Strong bounce back Sluggish recovery Second wave
4
6
8
10
12
14
16
2019 2020 2021 2022 2023 2024
£ b
illio
n
Economic impact
Strong bounce back Sluggish recovery Second wave
39
Impact of Covid-19 on our Places Birmingham and Solihull
As part of the Midlands Engine Economic Observatory work WMREDI and the Black Country Consortium
Economic Intelligence Unit developed Local Economic Partnership level profiles. We have reviewed and
updated these profiles and assessed the risks in light of Covid-19.
Ideas
The Greater Birmingham & Solihull LEP has internationally recognised research strengths particularly,
in advanced material characterisation and use; energy; low carbon technologies; innovative
healthcare; and digital technologies.
Researching and producing innovative products and educating the workforce of the future is strongly
supported by the presence of five universities in the area: Aston University; Birmingham City
University; Newman University College, University College Birmingham; University of Birmingham.
The crucial role that universities play in relation to local economic development is emphasised by the
high value of research funding awarded to universities and businesses in the LEP in recent years.
Between 2014 and 2018 53,590,192€ was secured from Horizon 2020, the European Union’s
Research and Innovation programme. Research councils and the UKRI provided a further
£997,002,402 between 2012 and 2021.
Key assets include the large number of business parks and related initiatives in the area:
• Innovation Birmingham Campus,
• Birmingham Research Park located adjacent to the University of Birmingham campus,
• Longbridge Technology Park and Innovation Centre in Birmingham,
• Institute of Translational Medicine at University Hospitals Birmingham,
• Birmingham’s Smart City Commission,
• West Midlands 5G Testbed,
• Kingfisher Business Park in Redditch
• Fradley Park industrial estate in Lichfield.
• The STEAMhouse centre for innovation run by Birmingham City University which supports
entrepreneurs, sole traders, companies and citizens to build their businesses, develop products
and services and develop new ideas.
• The Enterprise Research Centre at Aston University
• The construction of a new Life Sciences Park by the University of Birmingham
The area has particular strengths in terms of the proportion of firms undertaking marketing innovation
(ranked 6th of 39 LEP areas and 1st among West Midlands LEP areas) and design investment for
innovation (ranked 9th in England and 2nd in the West Midlands).
People
Average earnings within the LEP area are the second highest within the West Midlands - an important
factor in attracting higher skilled workers to the area. The area also performs strongly compared to
Coventry and Warwickshire and the Black Country in attracting students to remain in the area for study
and employment, and in attracting graduates to return to work in the area after they have studied
elsewhere.
Employers in the Greater Birmingham and Solihull take on the highest total number of apprentices
compared to in Coventry and Warwickshire and the Black Country. In 2018/2019 there were fewer
apprenticeship starts per head than in Coventry and Warwickshire and the same number per head as
in the Black Country. This is important in terms of enabling companies to have the skills needed to be
competitive and develop new products.
Greater Birmingham and Solihull’s has an extremely diverse population offering an array of
international connections, a blend of different cultures and a large proportion of under 25s.
The HS2 Skills Strategy presents opportunities for Greater Birmingham to benefit from the construction
of the Advanced Transport and Infrastructure National College.
40
Impact of Covid-19 on our Places Birmingham and Solihull
Infrastructure
Greater Birmingham and Solihull is a key regional and national transport Hub. Various motorways, 4
major stations, the Midlands Metro and Birmingham International Airport serve the area. The arrival of
high-speed rail will improve connectivity across the functional economic area.
One of the West Midlands 5G test bed Hubs is located in Birmingham offering opportunities to
develop and test new digital technologies. Nonetheless, continued investment in new housing and
new employment sites together with major new infrastructure schemes and expansion of broadband
coverage will be important to support growth in the area.
Residential and commercial developments have multiplied over recent years. Total dwelling stock
increased by 6% between 2007 and 2018. The House Price to Income Ratio in 2019 was 7.37
compared to 7.70 in Coventry and Warwickshire and 5.96 in the Black Country.
The area is set to benefit considerably from the arrival of HS2. HS2 will cut the journey time from
Birmingham to London to 49 minutes and create opportunities to develop ecosystems in the area and
increase the quality of jobs available. Burton Town Centre is also set to benefit from the redesign of
Station Street.
Business Environment
With the largest business stock amongst the three West Midlands LEPs, Greater Birmingham and
Solihull is an important centre of business. It is home to a number of nationally and internationally
significant companies. Reflecting the manufacturing heritage of the area as well as role as a hub for
the professional and business services sector for the wider region, these include Mondelez, HSBC,
National Express and Jaguar, Wesleyan Assurance Society and Gowling WLG.
At £58,555 in 2019, GVA per employee is higher than in the Black Country but lower than in Coventry
and Warwickshire.
The largest sectors in the area in 2018 in terms of the number of jobs were health (13.1%), business
administration and support services (10.7%) Manufacturing (9.7%), Education (9.5%) and Retail
(9.1%).
Place
Greater Birmingham and Solihull is the West Midlands LEP area with the highest number of visitor
trips and highest value of visitor spending. The number of trips made increased by 6% in 2017
compared to 2016 to 3.5 m but then fell to 3.3 m in 2018.
The pace of growth and dynamism in the area is demonstrated by how Greater Birmingham and
Solihull was one of the three LEP areas with the most improved UKCI score 2010-2019 in the UK
Competitiveness Index (based on a measure integrating both the development and sustainability of
businesses and the economic welfare of individuals). In 2019, it had the second highest UKCI score of
West Midlands LEP areas after Coventry and Warwickshire.
Although the second most urban LEP in the West Midlands after the Black Country, Greater
Birmingham and Solihull has numerous environmental assets including Sutton Park, one of the largest
urban parks in Europe.
According to the Index of Access to Health Assets and Hazards, Greater Birmingham and Solihull LEP
area together with the Black Country have greater access to health services than the Coventry and
Warwickshire area (Gov.uk, 2015).
41
Impact of Covid-19 on our Places – The Black Country
Ideas
The Black Country currently performs modestly on innovation indicators compared to other Midlands
Engine LEPs in terms of business innovation funding secured and the value of research funding received.
However, analysis by the Smart Specialisation Hub suggests it performs above average for Higher
Education Spending on R&D (Smart Specialisation Hub, 2018).
Over 2 m euros worth of Horizon 2020 projects was secured between 2014 and 2018. The University of
Wolverhampton provides a focal point for Black Country research, innovation and the development of
ideas. The university contributes world-leading research, strong business links and state-of-the-art
facilities, including:
• A large and diverse Science Park including a Technology Centre, a Creative Industries centre and the
new Science and Prototyping Centre
• The Statistical Cybermetrics Research Group, one of the UK’s leading centres for research on software
methods to exploit web-based sources for social sciences research.
• The Research Institute in Healthcare Science, providing a platform for the development and promotion
of healthcare science research activities.
• Brownfield Research and Innovation Centre (BRIC), developing cost effective and sustainable solutions
to brownfield developments
The Black Country has a cluster of innovative firms delivering cutting-edge solutions to everyday problems,
utilising technology to drive progress. Dudley-based Westfield Technology Group is one of the UK’s leading
autonomous vehicle providers. The Westfield POD, developed in partnership with Heathrow, is the UK’s
first fully autonomous vehicle for first mile – last mile transportation.
The Black Country performs very well in terms of the proportion of firms introducing new methods of work
organisation. Roper and Bonner (2019) rank it 1st of 39 LEP areas for this indicator. It also performs
strongly in relation to the proportion of firms collaborating for innovation.
Future opportunities to build on technological developments exist. This includes the current redevelopment
of the former Springfield brewery in Wolverhampton into Europe’s largest specialist construction and built
environment campus. The site is set to be home to a School of Architecture and Built Environment, a
National Institute for Brownfield Land and a National Centre for Construction Excellence, providing an
environment for innovation to flourish in construction. A Very Light Rail (VLR) Innovation Centre and Test
Track is being developed in Dudley. This will help Dudley to revolutionise VLR technology.
People - A long-standing skills challenge exists in the Black Country, with too many people having no
qualifications and not enough holding higher qualifications. This leads to sustained weaker employment and
lower earnings. However, recent data has shown that the percentage of Black Country residents with
NVQ4+ qualifications is increasing. The percentage of those with no formal qualifications fell by over 30%
between 2007 and 2019 but increased by 6.4% in 2018-2019. Whilst employment and earnings in the Black
Country have remained below the national and regional average, the gap has closed recently. In line with
national trends, the number of apprentices has decreased. Key skills assets include:
• Black Country Colleges, who have been instrumental in providing businesses with people that have the
right skills. In 2019, the creation of an Institute of Technology was approved by government. The new
IoT will focus its provision on advanced manufacturing, modern construction methodologies and medical
engineering, all of which are critical transformational sectors for the regional economy.
• The University of Wolverhampton, including the West Midlands Construction UTC and a range of diverse
services that underpin higher skills development in the Black Country.
• Black Country Skills Factory, brokering industry-led skills support in key sectors.
• The Elite Centre for Manufacturing Skills, a new flagship £12.4m employer-led training facility designed
to improve productivity and growth in advanced manufacturing.
• The Black Country Careers Hubs.
• A new £2m Digital Engineering Skills Centre at Walsall College.
42
Impact of Covid-19 on our Places – The Black Country
Infrastructure
The number of homes in the Black Country has increased substantially since 2007 and the house
price to income ratio is now the lowest among the West Midlands LEP areas. The percentage of
premises with Superfast Broadband and Ultrafast Broadband is higher than in Greater Birmingham
and Solihull and Coventry and Warwickshire. The area has a key set of programmes and assets
across the full range of infrastructure themes that underpin local strategy. Specifically, these include:
• Land, e.g. Brownfield Research and Innovation Centre, Dudley Brownfield Land programme
• Transport, e.g. Wednesbury to Brierley Hill Metro extension, Wolverhampton Interchange
• Housing, e.g. Black Country Garden City, Goscote Lane corridor
• Energy, e.g. Working within Energy Capital partnership in developing Energy Innovation Zones
• Environment, e.g. Black Country Blue Network, Natural Capital Roundtable
• Digital, e.g. Black Country Broadband project, 5G developments.
Various infrastructure investments and developments planned regionally provide opportunities to
support economic growth. For example, the Midland Metro expansion from Wednesbury to Brierley
Hill will improve regional connectedness for residents and businesses. Plans for new rail stations at
Willenhall and Darlaston could similarly boost connectivity.
Business Environment
The Black Country business base features a mix of firms in the high-productivity “frontier” and low
productivity “long tail.” Evidence indicates business stock performance in recent years has been
strong with more businesses existing than ever before in the Black Country and business births
growth being faster than the national average. The Black Country performs comparatively well against
Coventry and Warwickshire and Greater Birmingham and Solihull for start-ups generating £1m+
turnover within three years. At £47,098 in 2019, GVA per employee is lower though than in Greater
Birmingham and Solihull and Coventry and Warwickshire.
Sectors have been and continue to be a large part of strategy development in the Black Country.
Through the West Midlands Local Industrial Strategy, Black Country LEP is leading on the
development of four sector action plans for the region: aerospace, rail, metals & materials and
construction.
Place
The Black Country is home to distinctive ‘places’ and assets. It includes the city of Wolverhampton –
and the industrial supply chains and social and geological heritage of Dudley, Sandwell and Walsall.
Within these, a strategic growth network of centres and corridors have been identified by the LEP as
providing a spatial focus to local ambitions. Covering 356 square kilometres and located in the heart
of England, the Black Country has excellent national transport links, in particular to the M6, M5 and
M54 motorways.
A unique mix of urban centres and geological heritage exists:
• Strategic urban centres have an important role to play in making the Black Country a good place in
which to live, work, visit and invest. Each has a distinctive offer – e.g. the cultural and creative
economy in Wolverhampton and the visitor attractions around Dudley Castle Hill.
• The emerging Black Country Geopark celebrates the area’s geological heritage and provides a
boost to the tourism sector.
43
Impact of Covid-19 on our Places – Coventry and Warwickshire
Ideas
The LEP area has internationally recognised strengths in research and development, especially,
advanced engineering, energy, advanced manufacturing, low carbon-technologies, advanced
propulsion and digital innovation.
Research and innovation is strongly supported by the presence of two universities, Coventry University
and the University of Warwick. Coventry is also home to Arden University, a private, for-profit teaching
university which offers a variety of undergraduate and post-graduate programmes through blended
and online distance learning.
A large number of world-class state-of-the-art research and development and innovation assets are
located within the area. These include:
• Coventry University Technology Park,
• the University of Warwick’s multi-site Science Park,
• the Advanced Propulsion Centre at the University of Warwick,
• the Advanced Manufacturing Training Centre in Coventry,
• Horiba MIRA in Nuneaton,
• the National Automotive Innovation Centre at the University of Warwick,
• the National Transport Design Centre at Coventry University,
• Warwick Manufacturing Group,
• the Quinton Rail Technology Centre,
• the UK Battery Industrialisation Centre being constructed in Coventry to support battery
manufacturing development.
Coventry and Warwickshire stands out for the high level of business spend on R&D. £3,107 is spent
on R&D per full-time equivalent in the area. This is over six times the level of business spending on
R&D in Greater Birmingham and Solihull, and over thirty times the level of spending in in the Black
Country. Over recent years, the area has also benefitted from the value of research funding particularly
from the European Union. Between 2014 and 2018 the area secured 56,158,404€ from Horizon 2020,
the European Union’s research and innovation programme. UKRI then provided a further
£864,635,745 between 2012 and 2021.
People
Coventry and Warwickshire has a very well educated workforce with a higher proportion of the working
age population being educated to NVQ Level 4 educated or above than elsewhere in the West
Midlands. Coventry and Warwickshire also has the highest employment rate at 77.5% in 2019. This is
important in terms of enabling companies to have the skills needed to be competitive and to develop
new products. Unemployment is also lower than in the two other WMCA LEP areas at 3.5% in 2019.
The area also has the highest average earnings of the three WMCA LEP areas.
A number of innovative training providers operate in the area including Warwick Trident College (a
facility purpose-built with industry providing a workplace-style learning environment, to train
apprentices in manufacturing, mechanical, electrical, electronic, automotive and product creation
sectors) and Digital Schoolhouse. Together with Nintendo UK, Digital Schoolhouse uses play-based
learning to engage the next generation of pupils and teachers with the Computing curriculum.
44
Impact of Covid-19 on our Places – Coventry and Warwickshire
Infrastructure
Coventry and Warwickshire is a key transport hub within the Midlands. Coventry is 20 minutes from
Birmingham International Airport and is served by a range of transport infrastructure including rail and
multiple motorways. It is within 4 hours travel time of 98% of the UK’s population supporting the area’s
key role as a home for distribution facilities. The area is well-located to benefit from the additional
capacity and faster journey times provided by HS2 as well as the associated re-development of
Birmingham International Rail Station and the re-generation of the adjacent areas including UK Central,
Europe’s largest single investable development site. The area is also leading the way in connected
autonomous vehicle technologies. Aurrigo, in Coventry is working with Westfield Technology Group
based in Dudley, to build a global reputation in the design, manufacture, testing and deployment of
innovative autonomous vehicles. UK Autodrive selected Coventry as one of two cities to pilot driverless
technology. Additionally, the Coventry area is part of the 5G testbed with Birmingham and
Wolverhampton. Initial proposals include using 5G technology the West Midlands Combined Authority
collaborating with Jaguar Land Rover to test driverless cars. The area is developing alternative forms of
rail travel including hydrogen-powered trains and an innovative and affordable Very Light Rail (VLR)
system in Coventry. Alongside the redevelopment of Coventry Rail Station to provide an integrated
multi-modal passenger transport hub, the VLR is an R&D-led manufacturing initiative designed to
deliver significant economic benefits. Rail travel was also supported in 2019 by Warwickshire County
Council when they announced plans to investigate building a new station between Coventry and
Kenilworth stations to better serve the University of Warwick.
Business Environment
Among the West Midlands LEP areas, GVA per employee is highest in Coventry and Warwickshire at
£63,143 in 2018. The area has particular strengths in the Professional, Scientific and Technical,
Education, Information and Communication, Business administration and Support Services sector,
Mining, Quarrying and Utilities, and Transport and Storage sectors. The proportion of firms born before
2013 earning between £1m and £3m in 2017 is higher than in the Black Country but lower than in
Greater Birmingham and Solihull. The area is home to a large digital and gaming sector. Approximately,
2,500 digital businesses exist in the Coventry and Warwickshire area, including the gaming cluster
around Leamington Spa known as ‘Silicon Spa’, representing approximately 15% of the national digital
games development workforce. According to research by Roper and Bonner (2019), the Coventry and
Warwickshire LEP area is good at innovative sales, marketing and co-operation, but is strongest in
terms of design investment for innovation. The area is ranked 2nd of 39 LEP areas for this indicator.
Place
Coventry and Warwickshire benefits from a competitive business environment as evidenced by the area
having the highest Competitive Index score among the West Midlands LEPs in 2019. However, visitor
spending and the number of visitor stays whilst higher than in the Black Country are low when
compared to the value and number of visits in Greater Birmingham and Solihull. There is an opportunity
to boost national and international tourism when Coventry is the UK City of Culture in 2021. The area
features the city of Coventry, a number of historic and distinctive market towns including Leamington
Spa, Nuneaton, Rugby, Stratford-upon-Avon and Warwick, in addition to cultural, heritage and leisure
assets, large rural areas and attractive green spaces.
In terms of dwelling stock, it has the third lowest level of stock in the West Midlands suggesting that
unless the housing stock is expanded, the area may not have sufficient housing stock to support
continued population growth. It is encouraging that in 2017-2018 Coventry and Warwickshire had the
second highest number of dwellings completed in the West Midlands, indicating some progress may be
being made in addressing the shortage of dwellings.
45
Impact of Covid-19 on our Places – Covid-19 Risks to Place Assets
Tourism Assets
The OECD has stressed how the pandemic and measures to contain its spread are having a heavy
impact on the tourism economy. Its analysis shows that depending on how long the crisis lasts, the
potential shock could cause a 60-80% decline in the international tourism economy worldwide in
2020. Whilst Coventry and Warwickshire is less reliant on tourism than other parts of the national
economy overall, certain areas are likely to be heavily hit in the short-term. This includes Stratford-
upon-Avon which, according to estimates by Centre for Cities, is likely to suffer one of the largest
declines in GVA in the West Midlands. If the crisis continues, the projected benefit from Coventry
being UK City of Culture could also be threatened, although the start date has been pushed back to
May 2021. The rise of virtual meetings during the pandemic raises questions over whether
Birmingham will continue to see growth in its business tourism sector.
International Travel
If Coronavirus has a medium to long-term impact on air travel, being close to Birmingham International
Airport would be less beneficial for the region than previously (i.e. the benefits of productivity would be
less). Forecast growth in passenger numbers over the next decade may be impacted. Whilst the
extent of the medium-long-term impact is as yet unclear, we know that traffic at the airport has fallen
considerably since March, declining by 90% in April. The Chief Executive of the airport stated at the
end of June that they expect a passenger scenario for this financial year of 90 percent less than in
2019/20. We have already seen this start to negatively impact on jobs in the region, with the airport
announcing plans to cut up to 250 jobs representing 27% of its workforce due to unsustainable income
losses.
Young People
A concern across the West Midlands, but especially in Greater Birmingham and Solihull and the Black
Country, where skills levels are lower and unemployment rates higher, is that recent progress in
increasing skills and employment levels will be slowed or reversed as a result of the pandemic.
Unless effective countervailing measures are introduced at a national level, it is likely that lockdown is
reducing opportunities for young people to gain work experience and participate in work based
learning. Although the number of apprenticeship starts across the West Midlands is increasing,
numbers remain low, and the Covid-19 crisis is creating worries that there will be less appetite for
recruiting apprentices in firms going forward. A survey by Association of Employment and Learning
Providers found 60% of employers nationally have stopped recruiting apprentices. It is encouraging
that the government has announced an "opportunity guarantee" to ensure every young person had
the chance of an apprenticeship or placement. However, it as yet unclear if the placements will be
paid and if a guaranteed interview will be available at the end of the placement. Evidence emphasises
the importance of supporting out-of-work people, particularly young people and those over 50 to
rapidly find work if they are to avoid long-term unemployment.
Life Sciences
Assets in the West Midlands likely to be strengthened rather than weakened by the Covid crisis
include those linked to life sciences. Birmingham with its Life Sciences Park due to open in 2022 and
associated well developed medical technology complex (including various hospitals, University of
Birmingham Medical School, Birmingham Health Partners and the Institute of Translational Medicine)
appears particularly well placed to be at forefront of developing this sector.
46
Impact of Covid-19 on our Places – Covid-19 Risks to Place Assets
Universities
The Coronavirus crisis is also having an impact on universities in the region. City-REDI research into
the impact of student spending, paints a worrying picture for the West Midlands. It finds important
variations across the UK by region in the benefits generated by student spending with the West
Midlands hardest hit. The West Midlands (NUTS2) is the region that generates the largest multiplier
for the UK economy with student spending generating over 4 billion pounds of output, 2 to 3 billion
GVA and supporting between 44 and 55 thousand jobs. These figures suggest that student spending
generates up to 4.2% of GVA in the West Midlands. Student expenditure directly supports to 4.2% of
employment in the West Midlands compared to up to 2% nationally. This means that for each 3 to 5
students not starting in September 2020, a job is at risk. Universities also underpin the innovation
assets across the three LEP areas, and the West Midlands is a leader in the business R&D which with
reduced investment capacity in the private sector may be hit hard. Especially in the automotive,
aerospace and manufacturing sectors
Transport
The drop in patronage of transport assets could reduced the available income for further investment,
and the costs of running a much reduced infrastructure under social distancing and lockdown
measures could make private and public sector delivery unsustainable. A drop in passenger numbers
in the regional airport as highlighted earlier also threatens the integrated infrastructure which has
made the West Midlands the heart of the transport network. Future proofing already in place in the
region such as autonomous vehicles and electric vehicles could see demand accelerated because of
the need for personal and safe transport options.
Digital and Technology
Coventry and Warwickshire is home to one of the country’s largest digital gaming sectors and this
sector has seen significant growth and demand under lockdown. Accelerated digitisation and
application of technology has accelerated with increased homeworking and adoption by businesses of
online sales. This presents an opportunity for the region to build and expand the skills and expertise.
Key companies
Many of the regions key companies are under significant pressures, with redundancies being
announced and more expected. The companies most at risk are those that rely on face to face
business, non food consumer demand and international supply chains. This puts many of our region’s
assets at sever risk, such as automotive, tourism and hospitality, retail, passenger transport,
manufacturing and culture. Loss of major companies also reduces the investment they make in their
supply chain, R&D, skills and supply chains.
47
Impact of Risks from Brexit
Since the UK officially left the European Union on 31 January 2020 much has changed. Brexit has gone out
of the political focus as both the UK and European governments have been preoccupied with responding to
the Covid-19 pandemic. The negotiations have slowed, or even stalled in some regards, as governments
and also civil service functions have been rapidly diverted to addressing the overwhelming health and
safety imperatives. These lockdown responses have led to enormous disruptions in global value chains,
dramatic capital shocks, and severe cutbacks in the flows of people and, consequently, knowledge and
ideas. Jonathan Portes, one of the authors of The Brexit Negotiations: a Stocktake, said: "Covid-19
pandemic and Brexit are major shocks for the UK economy. The interaction of the two is complex and
unpredictable, with the potential to amplify some impacts while moderating others.“ "On balance, the
pandemic probably does make the economic risks of exiting transition on January 2021 without a trade deal
larger, but considerable uncertainties remain," Portes said. As such, the UK and EU negotiators must
decide whether or not to extend the period of negotiation due to the interruptions caused by the pandemic,
and if so, how this might be achieved, given that the transition period runs out at the end of 2020.
Over the last few months the UK-EU negotiations have been taking place via electronic media (Ebner,
2020), and in particular via a Webex videoconference system produced by Cisco. Apart from technical
issues, the major difficulty here is that electronic video-conferencing and webinar systems cannot act as
perfect substitutes for face-to-face contact, especially in highly complex and sensitive negotiations. This
suggests that the ability of both sides to come to a mutually acceptable resolution is diminished by the lack
of personal interactions over recent months (The Independent). This has probably meant significant lost
time. Moreover, during the immediate recovery period, the EU governments are all preoccupied with
negotiating the €750 billion recovery package, so the immediacy and importance of Brexit has probably
been significantly reduced in most EU capitals. At the same time, as the CBI Daily Covid-19 Webinar
“Update on UK-EU negotiations” held on the 10 June concluded, in the case of the UK, that the dominance
and disconnection of politics from business and economics suggests that the post-covid recovery priorities
of job creation are unlikely to play any real part in extending the transition period, or altering the UK’s
negotiating position (IANS). The Cabinet Office minister said it is “prudent and wise” to prepare for trade
negotiations to fail and for the UK to default to World Trade Organisation (WTO) terms for business with the
EU from January (HuffPost UK). The result is that the prospect that Britain departs the bloc with a ‘no-deal’
Brexit is more likely than ever, or something very close to this.
Our research at WMREDI suggests that these types of outcomes will almost certainly lead to greater
interregional and intra-regional inequalities within the UK and will fundamentally work against the 'levelling
up’ agenda (Billing et al., 2019). The effects of a “no-deal” Brexit will be very damaging for the UK regions
and the West Midlands economy in particular as our research has already illustrated Our results show that
2.64% of EU GDP is at risk because of Brexit negative trade-related consequences. In the UK, the Brexit
trade-related consequences account for 12.2% of its GDP. Our results suggest that adverse effects are
likely to be more severe in the regions which have the least ability to respond to adverse shocks. Our
results show that 12.2% of West Midlands GDP is at risk because of Brexit negative trade-related
consequences. If we consider the wider West Midlands region we see that the exposure of Shropshire and
Staffordshire is 13.9% of local GDP and the exposure of Herefordshire, Worcestershire and Warwickshire is
14.3% of local GDP. In other words, the West Midlands as a whole is more exposed than the UK average
(Ortega-Argiles et al., 2018, 2018, 2018c). What is already clear is that any type of Brexit will exacerbate
the negative economic effects caused already by Covid-19 in UK firms, regions and sectors.
48
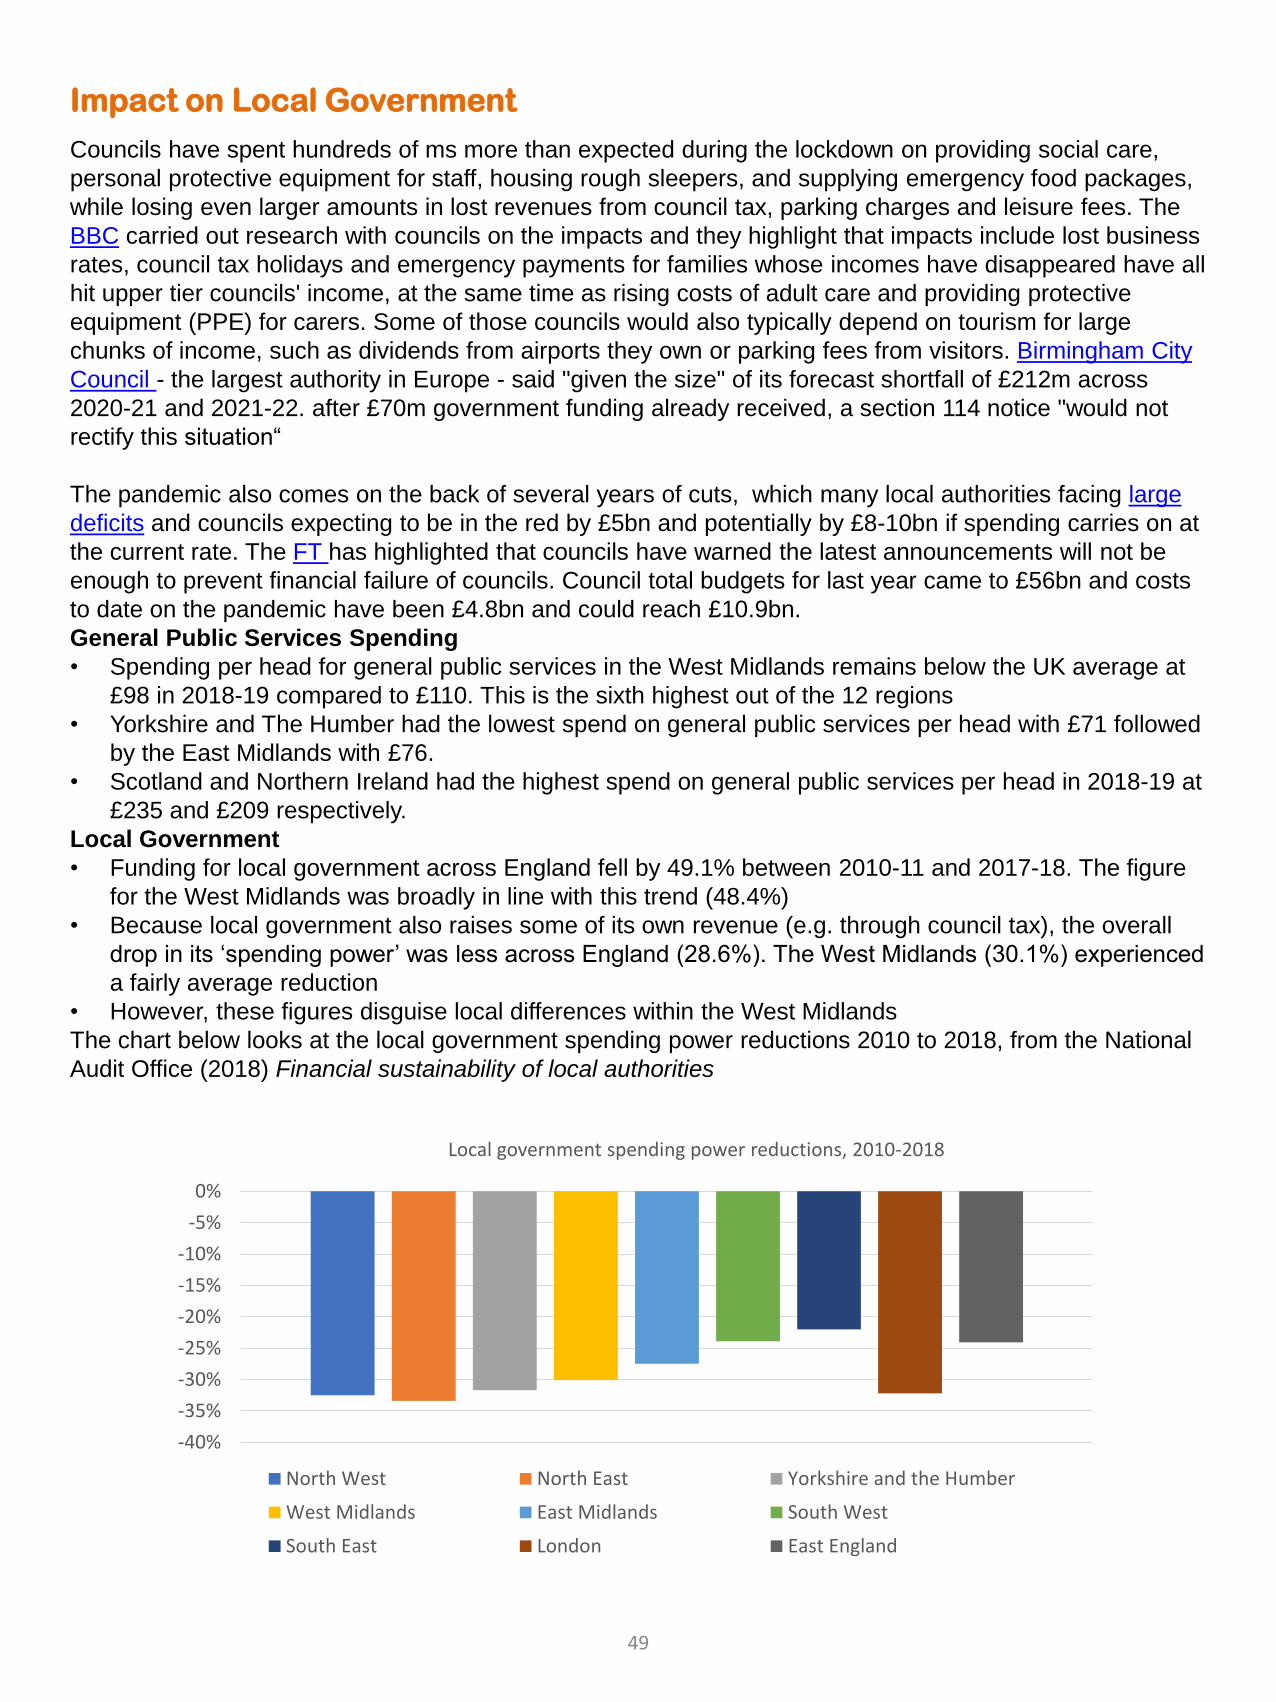
Impact on Local Government
Councils have spent hundreds of ms more than expected during the lockdown on providing social care,
personal protective equipment for staff, housing rough sleepers, and supplying emergency food packages,
while losing even larger amounts in lost revenues from council tax, parking charges and leisure fees. The
BBC carried out research with councils on the impacts and they highlight that impacts include lost business
rates, council tax holidays and emergency payments for families whose incomes have disappeared have all
hit upper tier councils' income, at the same time as rising costs of adult care and providing protective
equipment (PPE) for carers. Some of those councils would also typically depend on tourism for large
chunks of income, such as dividends from airports they own or parking fees from visitors. Birmingham City
Council - the largest authority in Europe - said "given the size" of its forecast shortfall of £212m across
2020-21 and 2021-22. after £70m government funding already received, a section 114 notice "would not
rectify this situation“
The pandemic also comes on the back of several years of cuts, which many local authorities facing large
deficits and councils expecting to be in the red by £5bn and potentially by £8-10bn if spending carries on at
the current rate. The FT has highlighted that councils have warned the latest announcements will not be
enough to prevent financial failure of councils. Council total budgets for last year came to £56bn and costs
to date on the pandemic have been £4.8bn and could reach £10.9bn.
General Public Services Spending
• Spending per head for general public services in the West Midlands remains below the UK average at
£98 in 2018-19 compared to £110. This is the sixth highest out of the 12 regions
• Yorkshire and The Humber had the lowest spend on general public services per head with £71 followed
by the East Midlands with £76.
• Scotland and Northern Ireland had the highest spend on general public services per head in 2018-19 at
£235 and £209 respectively.
Local Government
• Funding for local government across England fell by 49.1% between 2010-11 and 2017-18. The figure
for the West Midlands was broadly in line with this trend (48.4%)
• Because local government also raises some of its own revenue (e.g. through council tax), the overall
drop in its ‘spending power’ was less across England (28.6%). The West Midlands (30.1%) experienced
a fairly average reduction
• However, these figures disguise local differences within the West Midlands
The chart below looks at the local government spending power reductions 2010 to 2018, from the National
Audit Office (2018) Financial sustainability of local authorities
-40%
-35%
-30%
-25%
-20%
-15%
-10%
-5%
0%
Local government spending power reductions, 2010-2018
North West North East Yorkshire and the Humber
West Midlands East Midlands South West
South East London East England
49
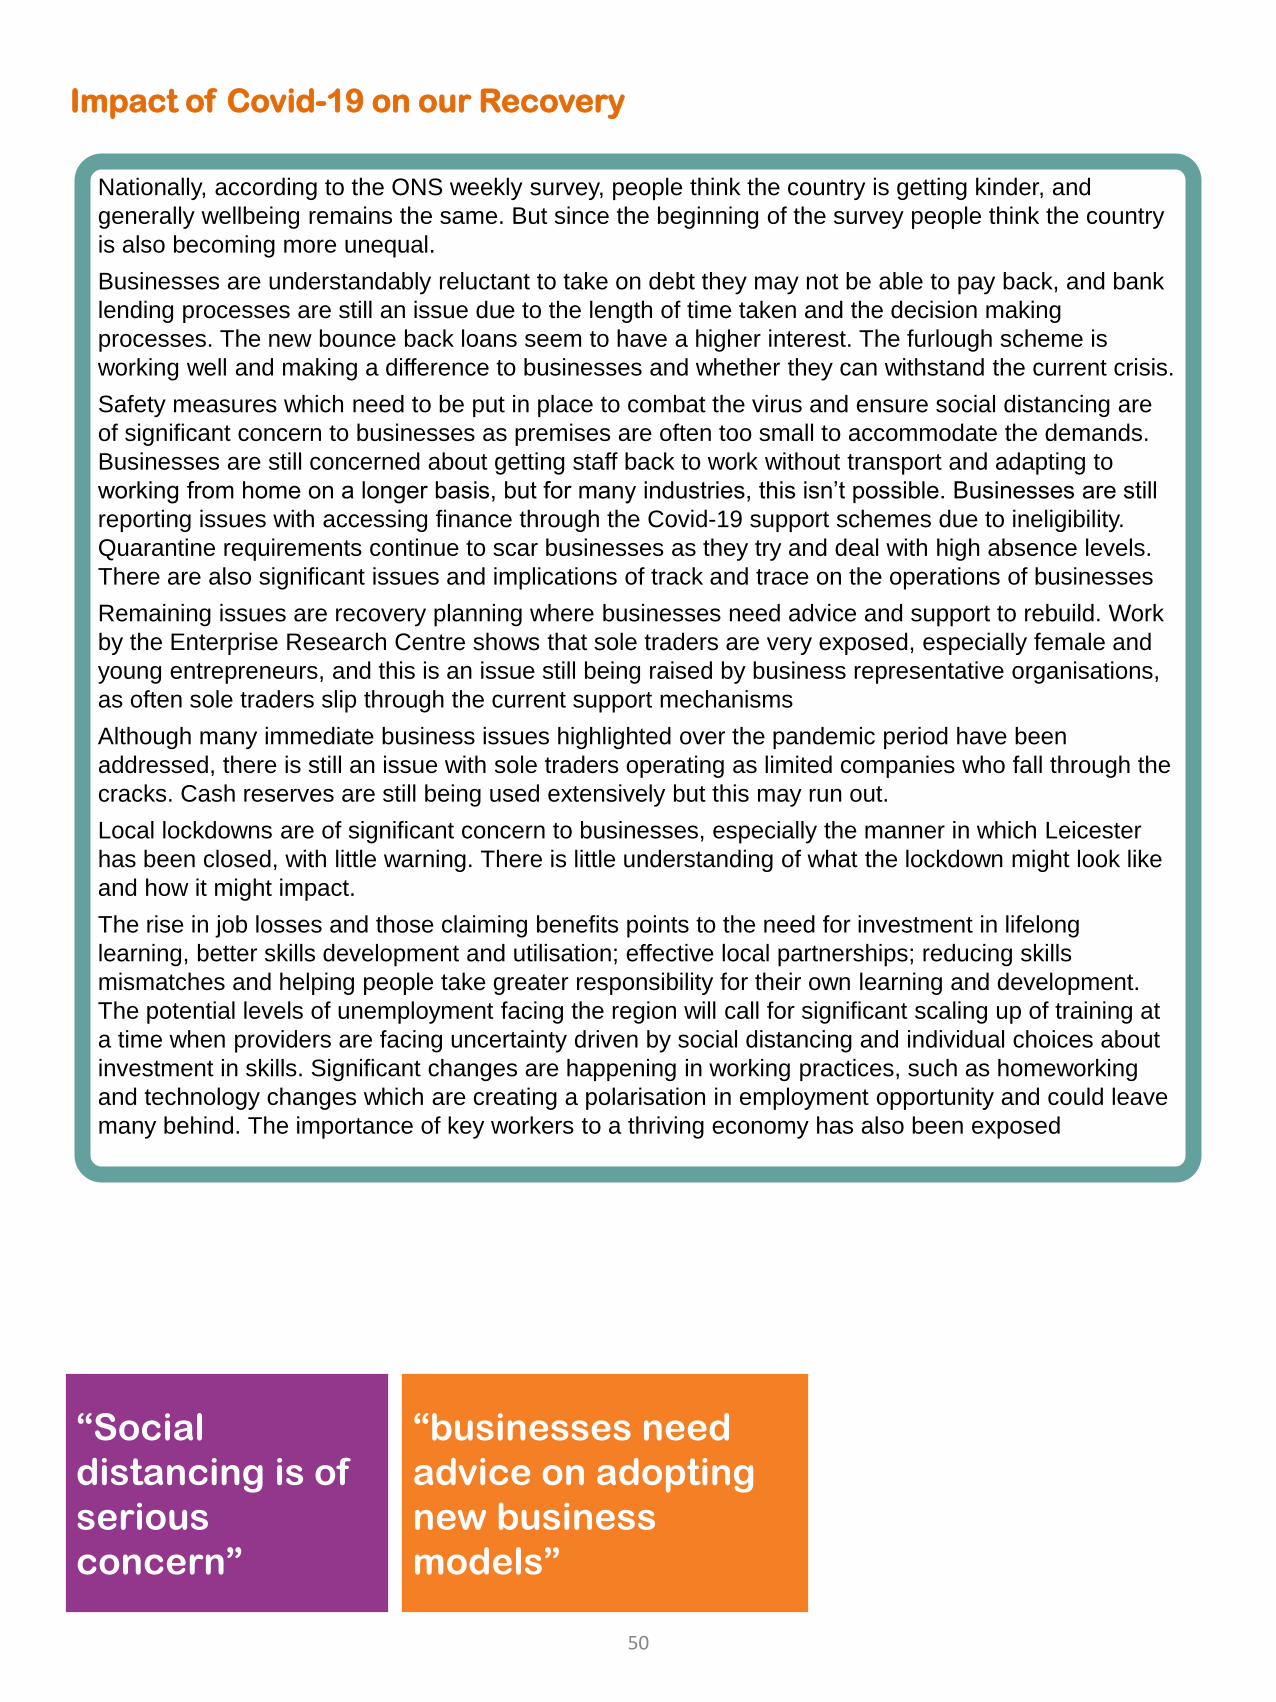
Impact of Covid-19 on our Recovery
“businesses need
advice on adopting
new business
models”
“Social
distancing is of
serious
concern”
Nationally, according to the ONS weekly survey, people think the country is getting kinder, and
generally wellbeing remains the same. But since the beginning of the survey people think the country
is also becoming more unequal.
Businesses are understandably reluctant to take on debt they may not be able to pay back, and bank
lending processes are still an issue due to the length of time taken and the decision making
processes. The new bounce back loans seem to have a higher interest. The furlough scheme is
working well and making a difference to businesses and whether they can withstand the current crisis.
Safety measures which need to be put in place to combat the virus and ensure social distancing are
of significant concern to businesses as premises are often too small to accommodate the demands.
Businesses are still concerned about getting staff back to work without transport and adapting to
working from home on a longer basis, but for many industries, this isn’t possible. Businesses are still
reporting issues with accessing finance through the Covid-19 support schemes due to ineligibility.
Quarantine requirements continue to scar businesses as they try and deal with high absence levels.
There are also significant issues and implications of track and trace on the operations of businesses
Remaining issues are recovery planning where businesses need advice and support to rebuild. Work
by the Enterprise Research Centre shows that sole traders are very exposed, especially female and
young entrepreneurs, and this is an issue still being raised by business representative organisations,
as often sole traders slip through the current support mechanisms
Although many immediate business issues highlighted over the pandemic period have been
addressed, there is still an issue with sole traders operating as limited companies who fall through the
cracks. Cash reserves are still being used extensively but this may run out.
Local lockdowns are of significant concern to businesses, especially the manner in which Leicester
has been closed, with little warning. There is little understanding of what the lockdown might look like
and how it might impact.
The rise in job losses and those claiming benefits points to the need for investment in lifelong
learning, better skills development and utilisation; effective local partnerships; reducing skills
mismatches and helping people take greater responsibility for their own learning and development.
The potential levels of unemployment facing the region will call for significant scaling up of training at
a time when providers are facing uncertainty driven by social distancing and individual choices about
investment in skills. Significant changes are happening in working practices, such as homeworking
and technology changes which are creating a polarisation in employment opportunity and could leave
many behind. The importance of key workers to a thriving economy has also been exposed
50
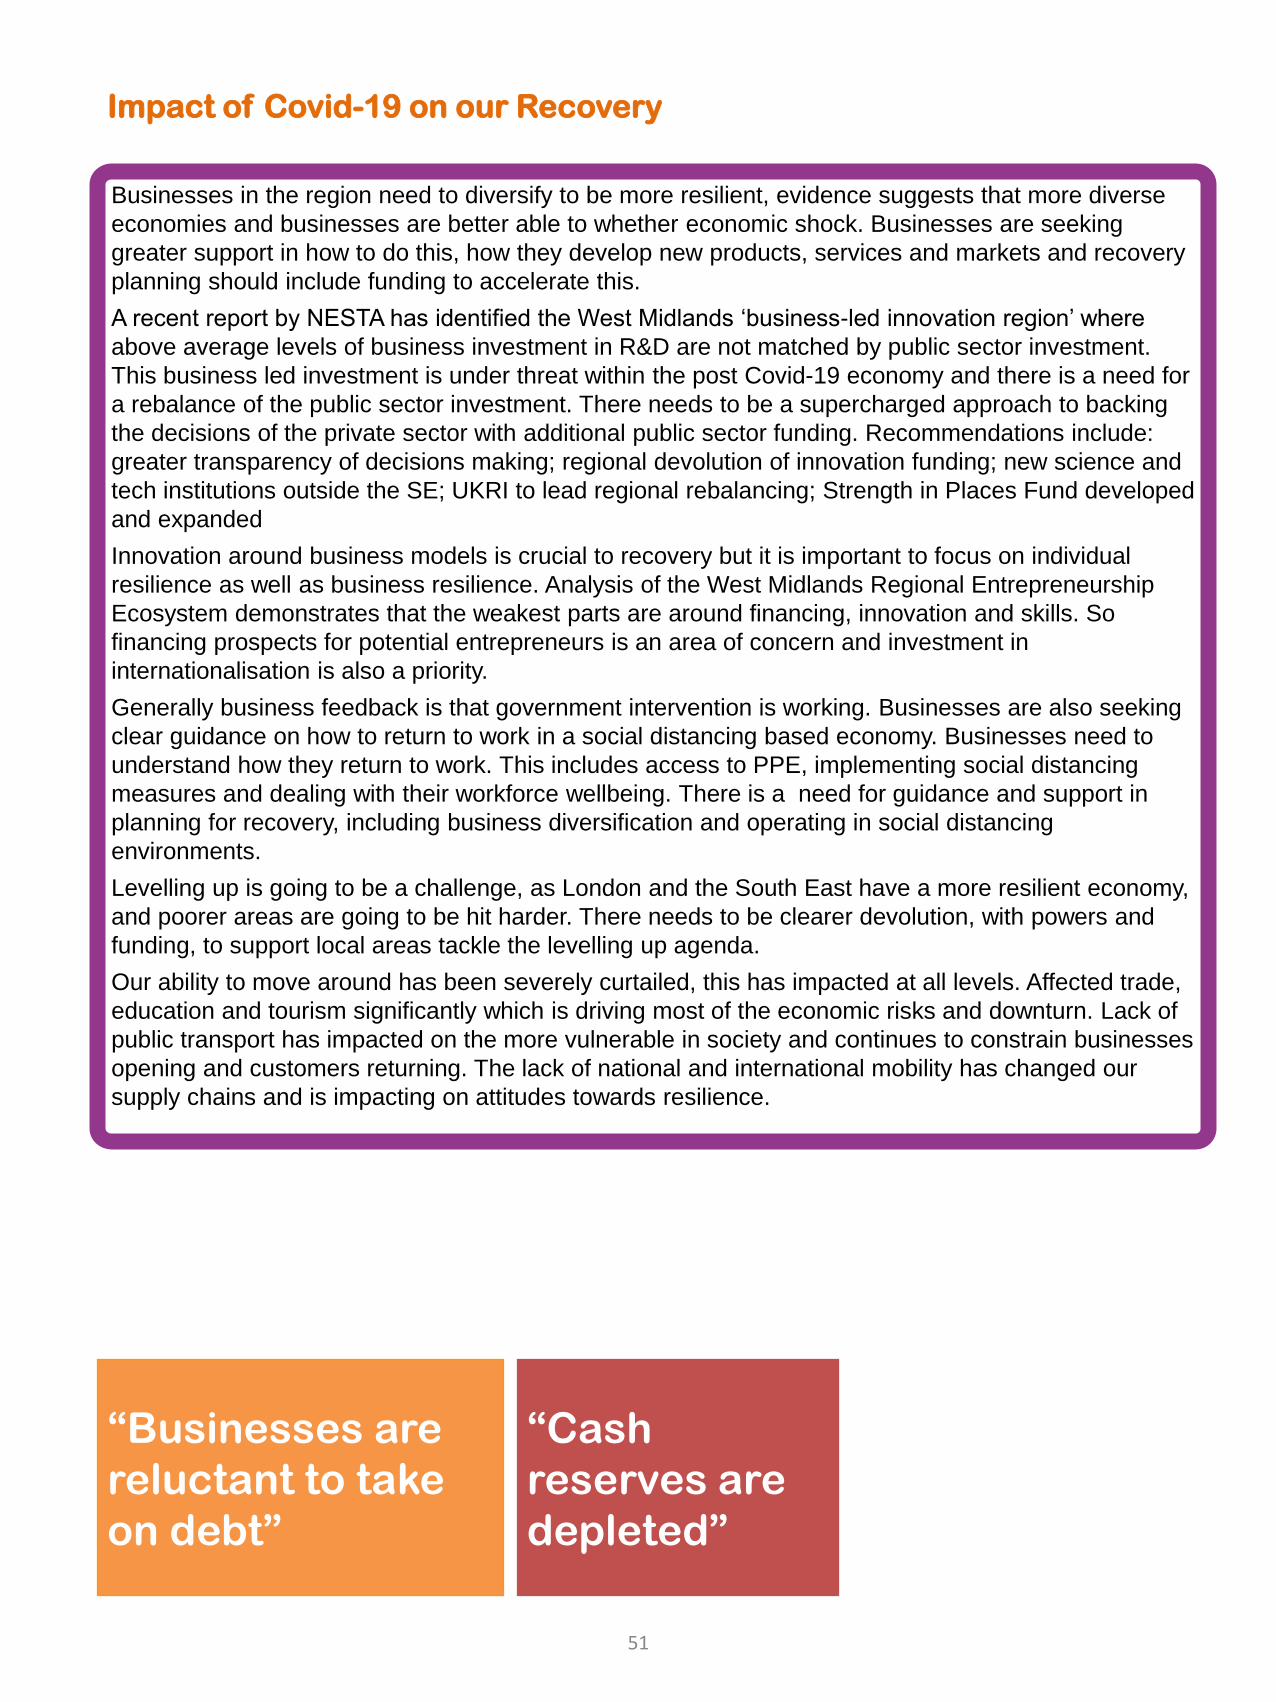
Impact of Covid-19 on our Recovery
Businesses in the region need to diversify to be more resilient, evidence suggests that more diverse
economies and businesses are better able to whether economic shock. Businesses are seeking
greater support in how to do this, how they develop new products, services and markets and recovery
planning should include funding to accelerate this.
A recent report by NESTA has identified the West Midlands ‘business-led innovation region’ where
above average levels of business investment in R&D are not matched by public sector investment.
This business led investment is under threat within the post Covid-19 economy and there is a need for
a rebalance of the public sector investment. There needs to be a supercharged approach to backing
the decisions of the private sector with additional public sector funding. Recommendations include:
greater transparency of decisions making; regional devolution of innovation funding; new science and
tech institutions outside the SE; UKRI to lead regional rebalancing; Strength in Places Fund developed
and expanded
Innovation around business models is crucial to recovery but it is important to focus on individual
resilience as well as business resilience. Analysis of the West Midlands Regional Entrepreneurship
Ecosystem demonstrates that the weakest parts are around financing, innovation and skills. So
financing prospects for potential entrepreneurs is an area of concern and investment in
internationalisation is also a priority.
Generally business feedback is that government intervention is working. Businesses are also seeking
clear guidance on how to return to work in a social distancing based economy. Businesses need to
understand how they return to work. This includes access to PPE, implementing social distancing
measures and dealing with their workforce wellbeing. There is a need for guidance and support in
planning for recovery, including business diversification and operating in social distancing
environments.
Levelling up is going to be a challenge, as London and the South East have a more resilient economy,
and poorer areas are going to be hit harder. There needs to be clearer devolution, with powers and
funding, to support local areas tackle the levelling up agenda.
Our ability to move around has been severely curtailed, this has impacted at all levels. Affected trade,
education and tourism significantly which is driving most of the economic risks and downturn. Lack of
public transport has impacted on the more vulnerable in society and continues to constrain businesses
opening and customers returning. The lack of national and international mobility has changed our
supply chains and is impacting on attitudes towards resilience.
“Businesses are
reluctant to take
on debt”
“Cash
reserves are
depleted”
51
Future scenarios and trends post
pandemic
The following section explores the impact of the pandemic on future
global trends. It highlights some of the future scenarios which may accelerate
due to the impact of the virus. This section is a summary of thinking to date
and potential long-term changes the region may face.
52
Impact of Covid-19 potential future scenarios
As part of developing the State of the Region 2020 we have been reviewing the emerging thinking on
global trends and what that means for the West Midlands. A crisis on the scale of Covid-19 will inevitably
change the world as we know it in the longer term as well as the unprecedented impacts we have seen
already and the previous West Midlands Monitors have covered. It is important to reflect that often crises
accelerate the changes which were already evident and in reality we move to the ‘next normal’. However it
is important to be aware of the idea that while in the main ‘our tomorrows will be like our yesterdays’ we
tend to disregard the events in the tails of a distribution curve as they often contribute most to changes in
outcomes. This review will look at those potential events, changes which latest thinking suggests will
accelerate and which will permanently shift, and the likely impacts of those changes.
Adaptive, reactive cities and places
Social distancing and the shift to homeworking has created a seismic shift in the way people work and
interact. Cities have become the epicentre of outbreaks and proximity has become a friction. Cities
provide opportunity for good and bad interaction and pandemics are an example of bad, urbanisation
and density making them vulnerable to disease. Lockdown has emptied out cities and urban
environments and may lead to greater decentralisation as people seek green space and better home
environments. However big tech and personal based service hubs have increased their share of
employment and growth as intense agglomeration remains important to these businesses. The
emptying out of cities could take the form of accelerating the wealth divide with those able to afford it
moving further out and utilising working from home more, leaving the young and poorer communities
concentrated in the urban inner city. This will affect the infrastructure demand in cities and the disparity
between where money is earned and where it is spent. Globally, however, during the last recession
cities grew, gaining migrants and millennials unable to find jobs elsewhere. This time round the future
of cities relies more on the decisions on Gen-Z, as with every generation they are more educated and
more diverse and already have strong urban roots. They are a generation committed to environmental
protection, supporting local businesses and shared assets, less inclined to see home ownership as a
necessity and accepting that they will have less than the generations before them. The Covid-19
experience may accelerate a lot of these traits in wider society. The pandemic may accelerate the
decline of the high street, where the number of shops could more than halve in the next two years, but
this is a trend that was already in play. Highstreets which have thrived are the ones which have picked
up on and maximised some of the other trends below, including, personalised, ethical and local
businesses and embracing online sales to diversify markets. The impact on universities and
international travel and pulling students into cities will dramatically change in the next 12 months, in the
longer term this may change the pattern of student movement for the longer term, which will impact on
student areas in cities. This could change the face of some cities for a long time and technology could
maintain this change as online and virtual studying reduces the need to move. One of the impacts of
the virus has been for people to feel more community spirit and kindness, this again could increase the
demand for urban villages and communities being developed in many cities. But it remains to be seen
whether, and to what extent, the solidarity, community spirit and co-operation evident in lockdown
survives or dissipates as it is lifted; we can look for early signs from countries ahead of the UK on the
Covid-19 curve. Urban centre are the economic structures which drive high contact, low-wage jobs
which can’t be carried out remotely. Labour markets over recent years have polarised and the act of the
virus could accelerate this. This suggests that cities will experience uneven and unequal impacts.
53
Impact of Covid-19 potential future scenarios
Clean, safe environments which underpin mobility as individual bubbles
Commuting is one of the main ways people come into contact with one another and social distancing will
continue to hamper the use of public transport systems, this is a challenge both for environmental
reasons and enabling lower paid workers to move easily for jobs. The need for social environments like
transport to be clean and safe and predictable will determine whether they are used and determine
whether people choose cars, bikes and walking and abandon public transport. Although in the longer run
itis likely people will revert to less hygienic habits the demand for remaining safe will remain but the
demand will be for environments that will enable safety effortlessly. For a region with significant industry
in the automotive sector an interesting trend identified is people finding comfort in car ownership,
especially when other modes of transport have ground to a halt. In China attitudes to cars have shifted
significantly with usage doubling after the outbreak, along with ride sharing and taxis, and significant
intentions to buy a car. A similar shift is playing out in the US. But car buying is moving online along with
all other shopping and there is a growing expectation to have cars delivered. The market is also
accelerating in China for aftersales and vehicle repairs as lockdown lifts. Alongside this however is a
challenge to the dominance to the car but from the growth in cycling and walking. With temporary cycle
lanes in place in many cities, but the challenge for this major change is huge, needing a significant long
term change in behaviour. But a more localised homeworking economy could help people to switch and
the idea of a 15 minute city has become less of an ideal and more a tangible outcome. At a micro level
how the social psychology of space will alter – irrespective of social distancing - remains an open
question.
54
Impact of Covid-19 potential future scenarios
Automation by default
This trend has been spreading over the last decade, but is likely to surge, with the impact of social
distancing on businesses accelerating the trend. Human capital is becoming relatively more expensive
and in a world of reduced contact that cost becomes greater. The jobs more affected are likely to be in
roles such as food service and cashiers, which will impact on the most vulnerable, young people, BAME
and those with lower qualifications. Advancements in AI and deep learning can be used to tackle
problems we find difficult and the need to understand and monitor outbreaks may drive greater
advancement in monitoring and automated tracking. But advancement in AI tends to create a few new
jobs that require sophisticated skills and many jobs that require personal contact skills, while it reduces
mid-skill jobs. This could continue the trend of hollowing out the labour market.
Digital diversification and proliferation
Big tech have been winners in the Covid-19 period, with Amazon, Google, Microsoft, Apple, Netflix all
making gains from people being in lockdown. Accelerated online shopping and home entertainment has
given platforms an increased share of consumer demand. This is creating a greater inequality within the
digital business community with large digital also able to invest and innovate due to the revenue they will
have generated. Home working has driven an explosion in digital usage remote working tools, video
calling and live streaming of content which is spilling out into the private lives of a wide range of ages like
never before. There has been, and will be, an acceleration of the digital experience economy, immersive
content and technologies will move from the side-line to the mainstream, and from just social media and
esports to travel and gatherings. Contactless free interaction and advancement in robotics is enabling a
new breed of automated commerce and increasing power and adoption of AI. The pandemic has also
highlighted the issues with the digital divide, most starkly in the education sector as the scale of children
without home internet and laptops has been exposed. This digital disparity has also prevented many
accessing the services needed such as online shopping and homeworking. The pandemic has impacted
on every element of the payments industry, contactless payments accelerated and are the new norm as
people fear touching cash. Older and poorer vulnerable families have therefore been left dealing with
socially distanced shopping and these households face a larger digital barrier than two months ago as
the digitally enabled have adapted better to the new world. There is also the important question of how
to address inequalities in the ongoing development of digital skills as they become ever more important,
with older people, those outside employment and from more disadvantaged backgrounds often most at
risk of being set adrift of ongoing developments. The move to homeworking seems likely to exacerbate
wealth based inequality and access to jobs. Where broadband and the means to utilise it was a luxury,
but now it is exposed as a necessity and an essential utility. Those without access are ever more
excluded.
55
Impact of Covid-19 potential future scenarios
Ethical, online and local consumer spend
Trends already in place such as the decline of the high street and ‘retail apocalypse’ have been
accelerated in the last 3 months, and has driven a need for organisations and businesses to innovate or
exit, the current disruption accelerates this need to be creative and embrace new models. Over the
period we have seen some brands damaged by the way they dealt with the crisis and this could have
lasting damage on their customer base brand purpose is becoming more important, brand curation and
navigating the complex world will become more important for business survival, customers, regulators,
employees and the public will hold businesses to account, and brands that have over claimed and under
delivered in the pandemic could see this lasting long after the virus has gone. This shift in ethical buying
because of how we view business behaviour in this period could shape the way people invest, buy and
consumer product for a long time to come. This doesn’t mean a rush back to face to face; it means being
authentic and human, as businesses, service deliverers and government. What matters is tone, content
and purpose that stands up to scrutiny. Trends such as moving from products to experiences, e-
commerce, buying local, buying socially aware and the sharing economy are trends businesses have
been reacting to. Millennials and Gen Z have been trained to see the world as showroom through their
phones and social media is a market place which connects locally and globally, hollowing out the real
shop floor unless they adapt. The virus has impacted on the customer mind-set, the concept of being a
‘better you’ has grown with people setting ambitious personal targets. Self-improvement and skill
building has become entertainment. The merging of entertainment, community and commerce will likely
boom. Social distancing could drive a demand for outdoor local markets, accelerating the trend for
locally produced goods and outdoor dining in urban spaces. The summer of 2020 in Europe will show us
what might be achieved here, and what local actors can do to assist enhanced use of outdoor spaces for
commerce and entertainment. Businesses diversifying their markets in the past have already created
hybrid experience based outlets, but the major shift from dine-in to delivery, this is likely to remain as it
increases incomes streams in the future, especially as dine-in may still mean reduced customers. But
eating out and socialising may become more important after an extended period of isolation, but people
may demand more local and authentic offers that reduce the need to travel and fit the socially aware
buyer. The virus has affected us all but even in our reaction we have segmented into 4 different
consumer groups which might shape our behaviour for years to come. The new normal, the people
who’ve taken the situation in their stride and aren’t overly emotional about having to adjust; bittersweet,
whose lives have become more challenging, but who can see a bright side and acknowledge the
positive changes in their new routine; the struggling, who have found it hard to adjust, are anxious and
not coping well; and nothing new, where things haven’t changed that much. Business needs to cater for
all these groups going forward.
56
Impact of Covid-19 potential future scenarios
Polarisation between the knowledge worker and the service worker
Social distancing could change the and as home office space has become more accepted. This could
impact on leasing and longer term large scale leasing could no longer be the norm. The scale of shift to
homeworking is one of the big successes of the virus as innovation which may have taken years to
implement was delivered in weeks. It presents an opportunity going forward for more diverse workforces.
Gartner analysis shows that 48% of employees will be likely to work remotely at least part of the time,
compared with 30% pre-pandemic. But 74% of businesses intend to increase remote working post
pandemic. Trends in many sectors such as business and professional services for flexible working have
been catapulted forward by years and acceptance of employers and customers that people are
productive away from the office enables a variety of different work cultures to be adopted. This will
accelerate the need for digital dexterity and collaboration skills. There is also a risk that roles also
become polarised though the humanisation and dehumanisation of workers, as more knowledge based
roles become increasingly connected, team based and inclusive whilst others become task orientated
and detached from others. There may also be an increase in workforce data collection and tracking in
remote environments, which raises issues around the ethics and future use of employee data by
employers, especially in a health aware post-covid world. However the young, BAME and poor are least
likely to be able to access the jobs that make this shift and are least likely to work from home, again
accelerating the socio-economic divide between more affluent areas and poorer areas and groups.
Slowing business travel and global flows of people
The virus has shown how our increasingly global world has made us vulnerable to the spread of virus
and dense, urban global cities with high levels of international trade, tourism, migrant workforces and
business linkages all aiding transmission. An increasingly networked world, business practices and
social norms are key, more connectivity introduces more uncertainty to the system, and as in 2008 where
the underlying connectivity in debt was unknown, the health impact of prevailing people connectivity was
not recognised. Global networks however are valuable and for growth, culturally and for businesses they
drive innovation and investment, but there may be more of a move to have fail safe protocols, including
trading smaller gains to protect against catastrophic loss. There is a need to discourage concentration of
power in large corporations to ensure smaller businesses have more protection from global risks. The
changes to international flows of people, affects the Higher Education sector harder than others, but the
adoption and utilisation of technology could drive the adoption on online learning bringing it into line with
the broader move to self-improvement online. This could accelerate the access students have to
intercultural classrooms and partnering across continents, expanding modalities of student and
academic experiences. This may also create a rise in virtual internships, virtual service-learning and
entrepreneurship programmes which widen cultural experience and increase innovative capacity.
57
Impact of Covid-19 potential future scenarios
Bringing industrial capacity home
The trend has been for internationalisation and is in contrast to the concept that successful cities and
nations should constantly grow their own capabilities, products and services. These ideas looked out of
step however in the face of Covid-19 recovery. This may create the environment for a significant but
important direction change. The issues raised by the pandemic could affect just in time procurement,
lean management and public procurement practices; this shift could change the focus from efficiency to
resilience. This lean approach has created fragile systems and change in the face of Covid-19 may
mean a return to more adaptive, flexible careers and a move from businesses predicting to responding
to change. National self-sufficiency is already becoming part of the language and is in the back of recent
trends to re-shore services. The vulnerability of our supply chains has been exposed, especially around
medical supplies. Global supply chains peaked in 2011 but were weakened by protectionist policies and
the pandemic has caused a supply-shock recession and may slow the expansion of global value chains.
Reduced production will create a recession and the v shaped recovery is at risk. Sector specific growth
policies locally may help trigger growth, if applied to those which are not substitutive, such as
automotive. This approach could mean businesses continue to refocus on growing locally and
supporting local supply chain firms, resisting take overs rather than international trade and long
uncontrolled supply chains. Against this backdrop there will be a period of volatility that puts UK firms at
risk. There will be an increase in mergers and acquisitions, nationalising of companies globally and rising
complexity, with big companies becoming bigger. However the UK is a globally open economy and has
long benefitted from this openness in the past, and the trend has been to increasingly grow the trading of
services, technology and content. From an employee point of view the way employers have treated their
staff has been brought more into the spotlight and this may further accentuate a trend for candidates
with the skills businesses need to seeking out good employers that they can trust. The social capital of
business may become more important across the board.
58
Impact of Covid-19 potential future scenarios
Greater inequality: the haves and have nots
Older people have borne the brunt of the health crisis of Covid-19 and in the future this may restrict
their ability to carry out their lives as they did in the past, especially under the threat of further waves or
potential lack of social distancing. Income inequality increases with age, as does the income from other
sources such as pensions and investments, but rising costs have driven a general trend of people
retiring later. The predicted increase in unemployment may worsen the position of older works and
make finding work after redundancy harder and require them to take deeper pay cuts than the young.
So far the closure of sectors has hit the young, women and BAME communities harder, but there may
be a greater opportunity for bounce back once lockdown is lifted. More structural and long term
damage may be within manufacturing where sectors already facing long term trends may shift to
automation which will disproportionately affect men in the longer term. Conversely the shift to
homeworking may open up new opportunities for the previously excluded communities such as the
disabled, people with care responsibilities, and those living in rural or remote communities as home
working could accelerate the levelling up process as it becomes increasingly possible and recognised
that people can work from anywhere. The trend of gig economy workers may also continue as a cost
saving measure, creating precarious employment situations for many.
Low wage workers and the housing crisis
Even in good times many people still do not earn enough to live on, as interventions such as the
National Living Wage and the need for Universal Credit demonstrates. Basic costs for some people are
already a stretch and housing and energy costs have been rising significantly as a proportion of
household spend. Protection for renters introduced over the pandemic period will protect those most
vulnerable, but they do not stop personal debt rising. But the predicted rise in unemployment will push
more people into this category. Housing costs are often reduced by moving in with family or moving to
lower quality housing – but this is not always possible.
Survivability, critical skills and critical roles
Companies have had to redefine what is critical to the business to survive. This has driven a review of
roles and whether they are needed and some reassessment of skills requirements. Companies are
examining succession planning and development paths to ensure resilience. Through furloughing some
businesses have also recognised that they can manage with fewer employees. This could in the longer
term lead to real productivity increases at the expense of employment (contrary to the trend to date).
59
Impact of Covid-19 potential future scenarios
Mental Health Burnout
The social impact of the pandemic has been stark. The sense of loss, both of family, friends but also of
places has had significant effects on the psyche of the world. Unemployment and insecurity has more
than doubled the levels of suicidal thoughts compared to those employed, and they feel nothing has
helped them cope, increased unemployment will increase the levels of suicide and dislocation form
society. Isolation, home working, loss of work and social structure has generated anxiety and depression
across a wide cross section of the population may have wide reaching effects. Anxiety has risen sharply,
the main factors being loneliness, safety, affect on work and disability This large scale scaring can
impact on the workforce and society for years to come and can be seen in emerging unrest globally, as
seen after the Spanish Flu pandemic in 1918. The pandemic period has also seen a polarisation of the
use of ‘content as medicine’, where online digital content is keeping us up to date, informing us but also
providing a mood altering fix. We are using social media content to treat our stress with a dramatic
increase in the use of positive content and the treat yourself culture. This has led to an increase in
people investing time in creative activities and connection with what is important in our lives and
reengaging with traditional life skills development for affluent urbanites. We have also moved to a world
where the employer has become the social safety net, with increasing risks of burnout, expanding their
involvement in the lives of employees with mental health support, financial health support and wellbeing
activities. Whilst remote, this changes the nature of the relationship and in the future this provision could
be more of a norm. This could accelerate the development of concepts of urban villages and garden
cities.
Resilient Local Institutions
The role and power of the state has changed dramatically across the world. The value of swift decision
making and action to combat a global issue has been seen internationally. The size and scale of
intervention has never been seen before and this will have implications on expectations in the future.
Large scale intervention may be more acceptable and necessary in a future facing further disruption
from further waves or new viruses. The deadly impacts of the virus are likely to increase support for
investment in medical care, R&D and the NHS strengthening capacity to deal with pandemics in the
future. A shift from best value procurement to local and high quality standards could continue to build
local resilience, innovation and absorptive capacity. A move in local places to look at public procurement
as a local wealth building tool has already been gaining momentum before the impacts of Covid-19
have highlighted the need for places to have access to the people and businesses to keep economies
working. Therefore the importance of local anchor institutions in supporting people and businesses has
become more apparent. This could signal a demand for stronger local institutions than can deliver in
crisis, and recovery. Political dissatisfaction and centralisation as seen over recent years could be
destabilised, with greater calls in some quarters for devolved powers to respond locally to issues. The
current expansion of state powers could also provide greater resilience if it is about bottom up
accountability and emphasises new business creation, education and apprenticeships to enable
businesses to grow and adapt. The focus on businesses who have acted responsibly in the pandemic
builds on the social investment of the next generation and forces an approach from institutions which
prioritises the impact of moral hazard.
60
Impact of Covid-19 potential future scenarios
Change for the better
What will be the new positives that generations to come will remember? Not all affects will therefore be
negative, and previous crisis have borne some of the most innovative changes we take for granted. World
War I changed the world for women, with more than a m women joining the workforce to keep the economy
going and accelerated change in the law around voting. The aftermath of World War II brought the NHS
and large scale rebuilding of society. The Dotcom bubble led to creative destruction; new healthier
organisations emerged and underperforming firms closed, so accelerating the conditions for successful
companies. Past experience indicates that more people go to university after recessions – albeit in the
context of a fully open education system functioning on ‘business as usual’ lines. A lack of jobs leads
people to pursue education, which has an impact on subsequent generations; individuals are more likely to
go to university if their parents have done so. A more educated workforce tends to make an economy more
productive, profitable, versatile and resilient, and impacts positively on a society’s health, crime rate, voting
and volunteering. Other potential positives are emerging medical advancements and treatments and
international collaboration, stronger public health systems, reduced and unnecessary commuting, less
pollution, increasing recognition of the role of key workers, challenging racism and increased kindness and
community spirit.
Whether we see a new normal or a return to previous routines and habits is up for debate and most likely
the reality will lie somewhere in between. The trends above have implications for policy which include:
• Addressing digital inequality and ensuring people have the skills and technology to gain from the
advancements
• Rethinking how places work in a social distancing world, creating places which are safe, green,
clean and open
• Training and development which prepares people for a changing world which values technology,
personalised interactions, flexibility and uncertainty of employment
• Supporting opportunities for personalised, clean and safe mobility
• Building and investing in strong communities which foster collaboration and support
• Investing in local institutions, and key workers so they can respond to demand for change, invest in
new local infrastructure, keep pace with change and react when crisis happens
• Supporting businesses to adapt, innovate and prepare for accelerated change due to technology,
changing consumer habits and the growth in ethical buying
There is likely to be an increased sense of community but this will be stronger in the places where this
already existed.
The changes above are not inevitable. There is a role for public policy to invest in creating an environment
where positive change is enabled and lasts.
61
Past Performance
The following section looks at how the region was doing pre pandemic. It
assesses the long term performance against the UN Sustainable
Development Goals, to create a balanced understanding of the issues
facing the region.
Most of this data is lagged and pre pandemic but helps us understand the
general state of health the region was in before the pandemic.
These indicators relate directly to the key indicators in the executive
summary.
62
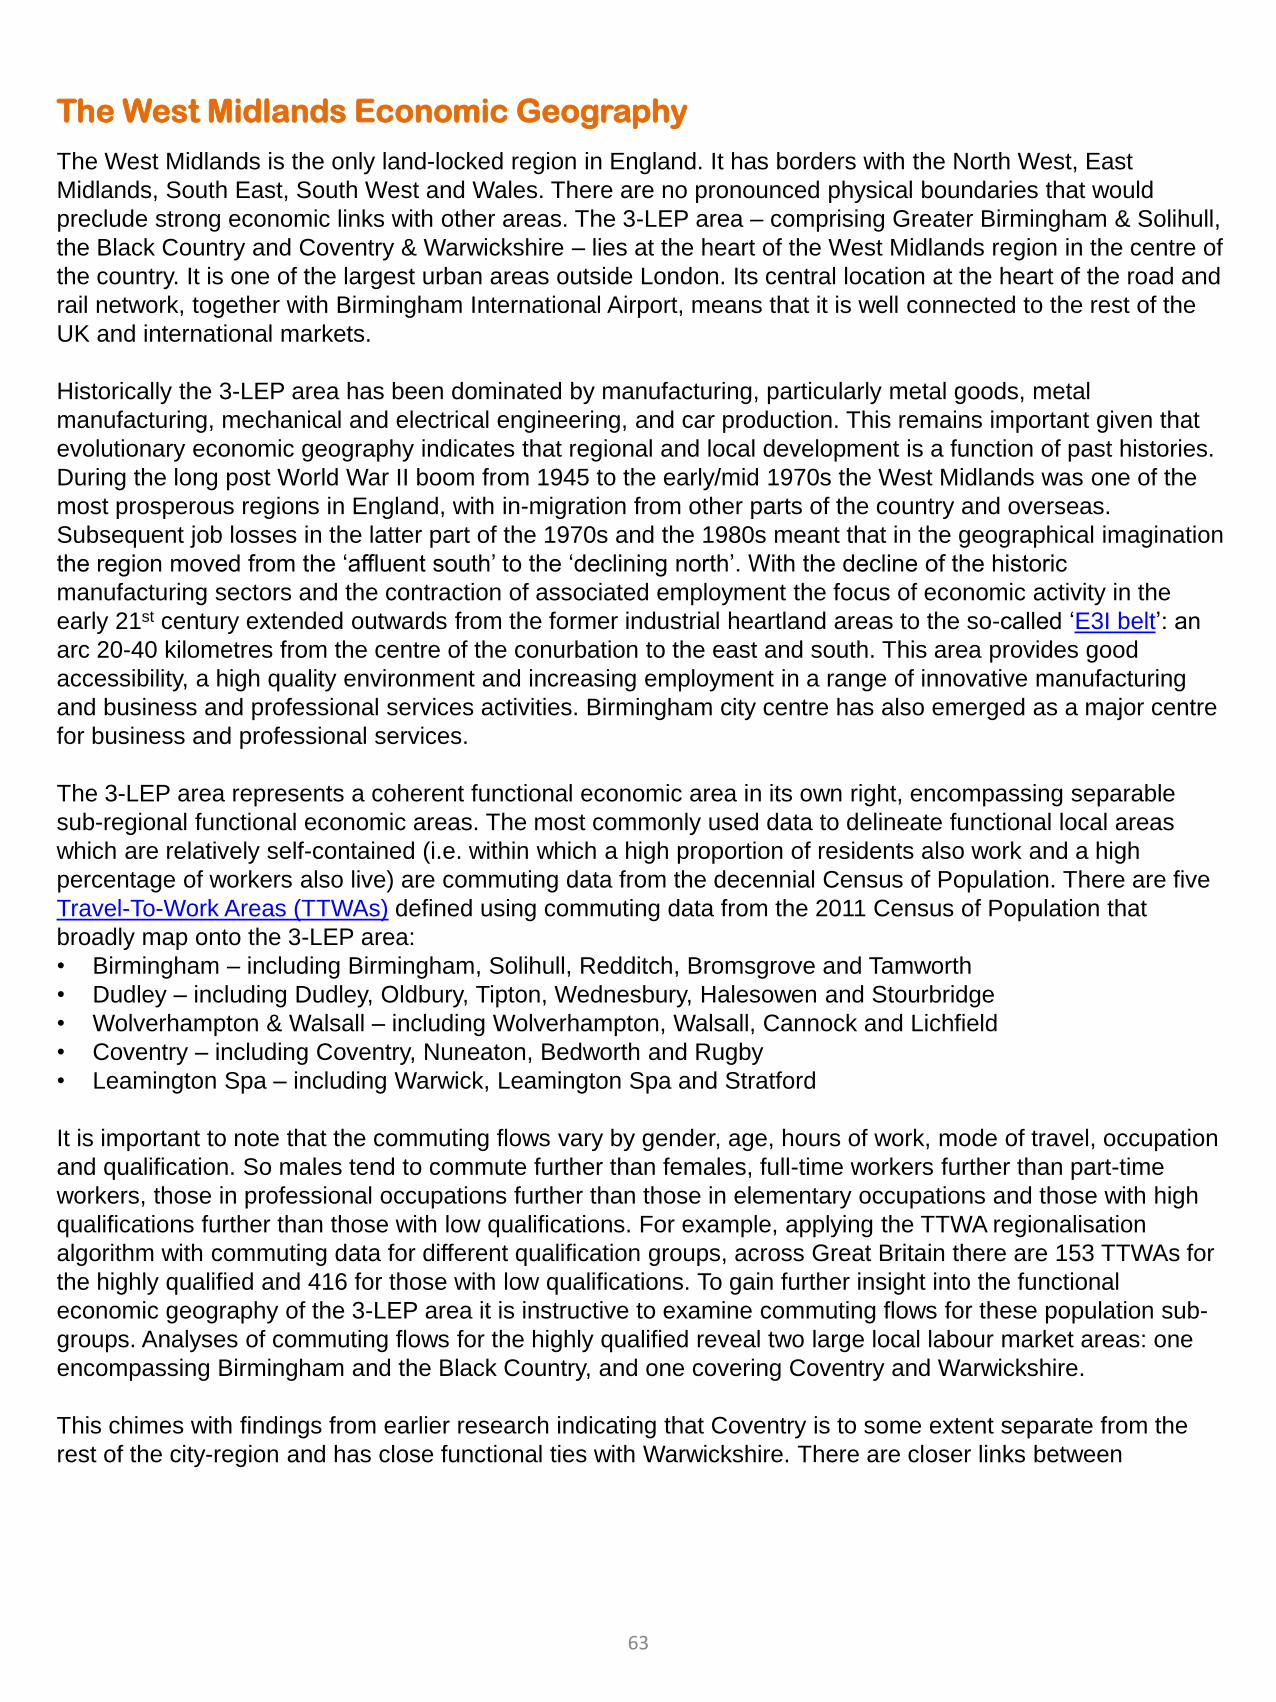
The West Midlands Economic Geography
The West Midlands is the only land-locked region in England. It has borders with the North West, East
Midlands, South East, South West and Wales. There are no pronounced physical boundaries that would
preclude strong economic links with other areas. The 3-LEP area – comprising Greater Birmingham & Solihull,
the Black Country and Coventry & Warwickshire – lies at the heart of the West Midlands region in the centre of
the country. It is one of the largest urban areas outside London. Its central location at the heart of the road and
rail network, together with Birmingham International Airport, means that it is well connected to the rest of the
UK and international markets.
Historically the 3-LEP area has been dominated by manufacturing, particularly metal goods, metal
manufacturing, mechanical and electrical engineering, and car production. This remains important given that
evolutionary economic geography indicates that regional and local development is a function of past histories.
During the long post World War II boom from 1945 to the early/mid 1970s the West Midlands was one of the
most prosperous regions in England, with in-migration from other parts of the country and overseas.
Subsequent job losses in the latter part of the 1970s and the 1980s meant that in the geographical imagination
the region moved from the ‘affluent south’ to the ‘declining north’. With the decline of the historic
manufacturing sectors and the contraction of associated employment the focus of economic activity in the
early 21st century extended outwards from the former industrial heartland areas to the so-called ‘E3I belt’: an
arc 20-40 kilometres from the centre of the conurbation to the east and south. This area provides good
accessibility, a high quality environment and increasing employment in a range of innovative manufacturing
and business and professional services activities. Birmingham city centre has also emerged as a major centre
for business and professional services.
The 3-LEP area represents a coherent functional economic area in its own right, encompassing separable
sub-regional functional economic areas. The most commonly used data to delineate functional local areas
which are relatively self-contained (i.e. within which a high proportion of residents also work and a high
percentage of workers also live) are commuting data from the decennial Census of Population. There are five
Travel-To-Work Areas (TTWAs) defined using commuting data from the 2011 Census of Population that
broadly map onto the 3-LEP area:
• Birmingham – including Birmingham, Solihull, Redditch, Bromsgrove and Tamworth
• Dudley – including Dudley, Oldbury, Tipton, Wednesbury, Halesowen and Stourbridge
• Wolverhampton & Walsall – including Wolverhampton, Walsall, Cannock and Lichfield
• Coventry – including Coventry, Nuneaton, Bedworth and Rugby
• Leamington Spa – including Warwick, Leamington Spa and Stratford
It is important to note that the commuting flows vary by gender, age, hours of work, mode of travel, occupation
and qualification. So males tend to commute further than females, full-time workers further than part-time
workers, those in professional occupations further than those in elementary occupations and those with high
qualifications further than those with low qualifications. For example, applying the TTWA regionalisation
algorithm with commuting data for different qualification groups, across Great Britain there are 153 TTWAs for
the highly qualified and 416 for those with low qualifications. To gain further insight into the functional
economic geography of the 3-LEP area it is instructive to examine commuting flows for these population sub-
groups. Analyses of commuting flows for the highly qualified reveal two large local labour market areas: one
encompassing Birmingham and the Black Country, and one covering Coventry and Warwickshire.
This chimes with findings from earlier research indicating that Coventry is to some extent separate from the
rest of the city-region and has close functional ties with Warwickshire. There are closer links between
63
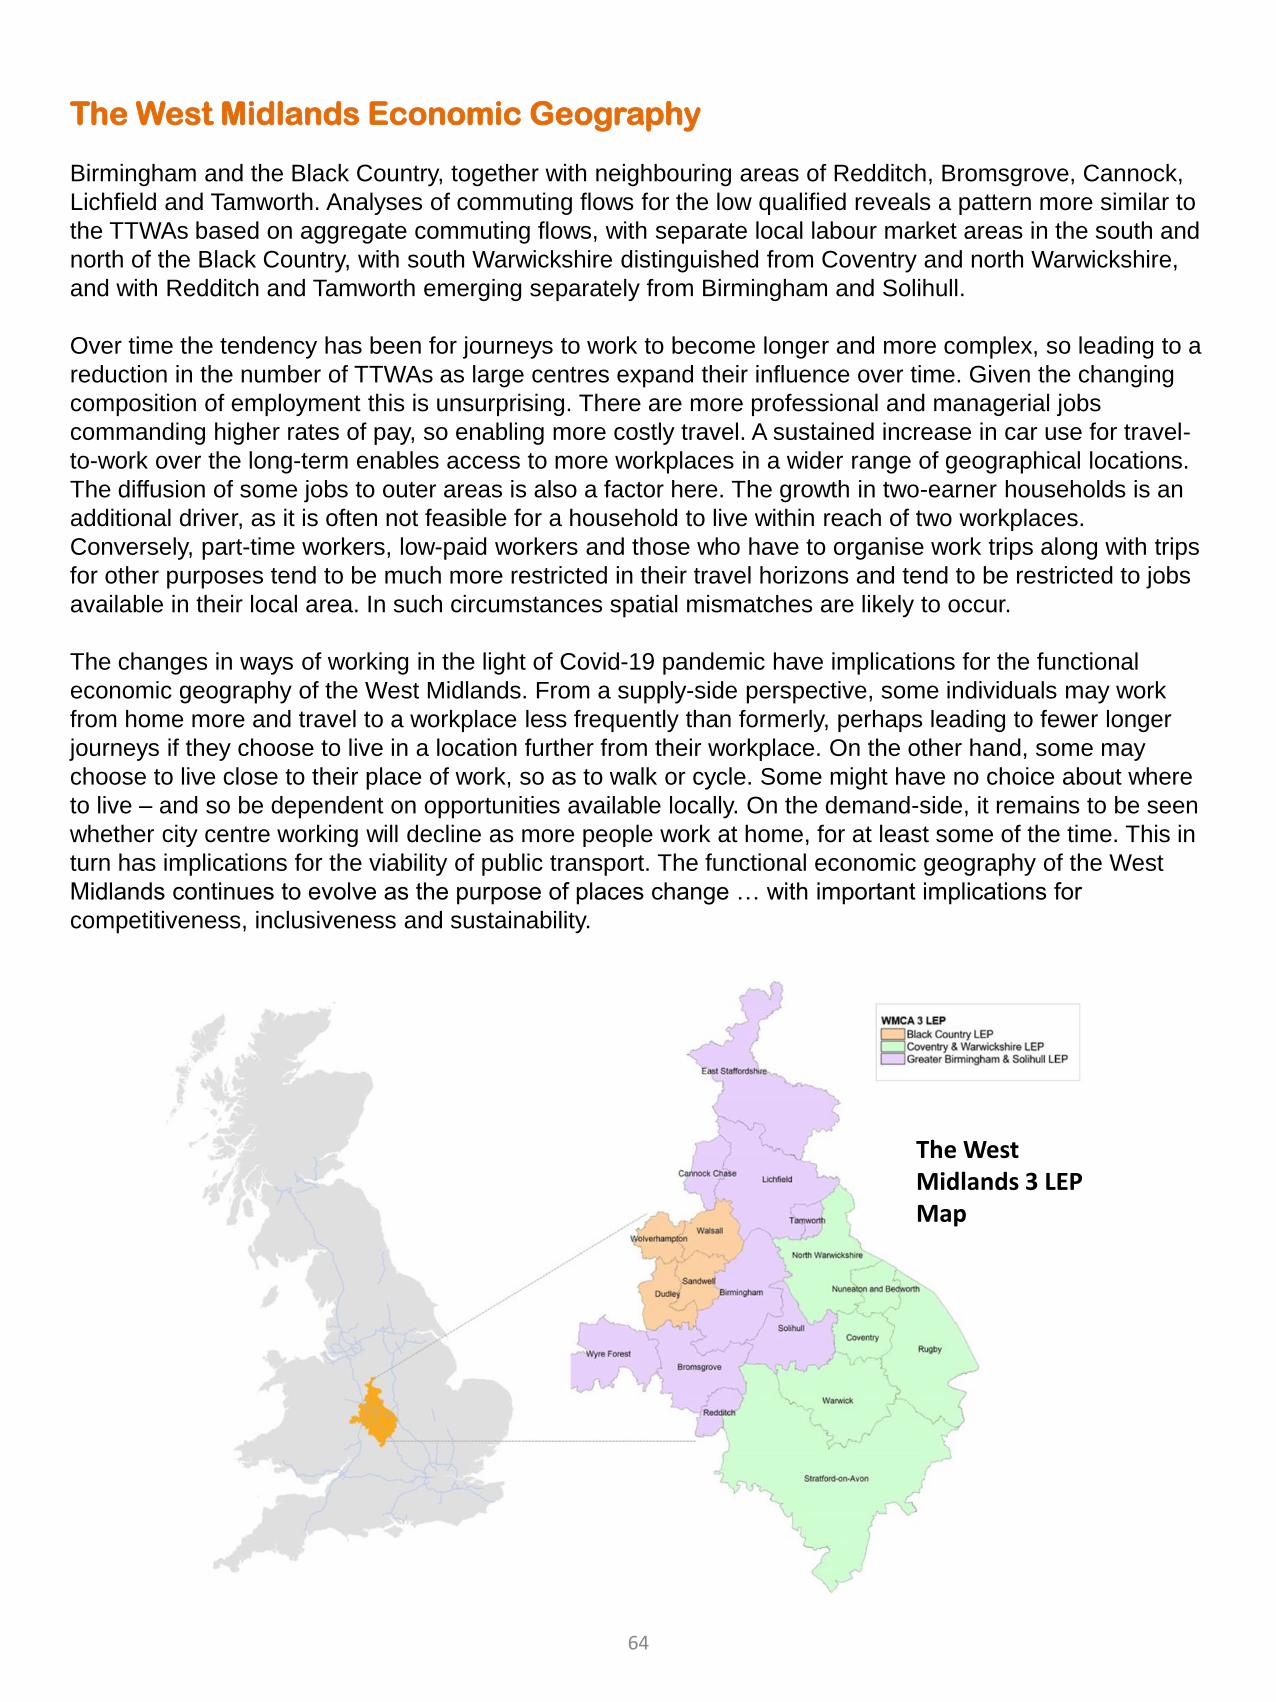
The West Midlands Economic Geography
Birmingham and the Black Country, together with neighbouring areas of Redditch, Bromsgrove, Cannock,
Lichfield and Tamworth. Analyses of commuting flows for the low qualified reveals a pattern more similar to
the TTWAs based on aggregate commuting flows, with separate local labour market areas in the south and
north of the Black Country, with south Warwickshire distinguished from Coventry and north Warwickshire,
and with Redditch and Tamworth emerging separately from Birmingham and Solihull.
Over time the tendency has been for journeys to work to become longer and more complex, so leading to a
reduction in the number of TTWAs as large centres expand their influence over time. Given the changing
composition of employment this is unsurprising. There are more professional and managerial jobs
commanding higher rates of pay, so enabling more costly travel. A sustained increase in car use for travel-
to-work over the long-term enables access to more workplaces in a wider range of geographical locations.
The diffusion of some jobs to outer areas is also a factor here. The growth in two-earner households is an
additional driver, as it is often not feasible for a household to live within reach of two workplaces.
Conversely, part-time workers, low-paid workers and those who have to organise work trips along with trips
for other purposes tend to be much more restricted in their travel horizons and tend to be restricted to jobs
available in their local area. In such circumstances spatial mismatches are likely to occur.
The changes in ways of working in the light of Covid-19 pandemic have implications for the functional
economic geography of the West Midlands. From a supply-side perspective, some individuals may work
from home more and travel to a workplace less frequently than formerly, perhaps leading to fewer longer
journeys if they choose to live in a location further from their workplace. On the other hand, some may
choose to live close to their place of work, so as to walk or cycle. Some might have no choice about where
to live – and so be dependent on opportunities available locally. On the demand-side, it remains to be seen
whether city centre working will decline as more people work at home, for at least some of the time. This in
turn has implications for the viability of public transport. The functional economic geography of the West
Midlands continues to evolve as the purpose of places change … with important implications for
competitiveness, inclusiveness and sustainability.
The West Midlands 3 LEP Map
64
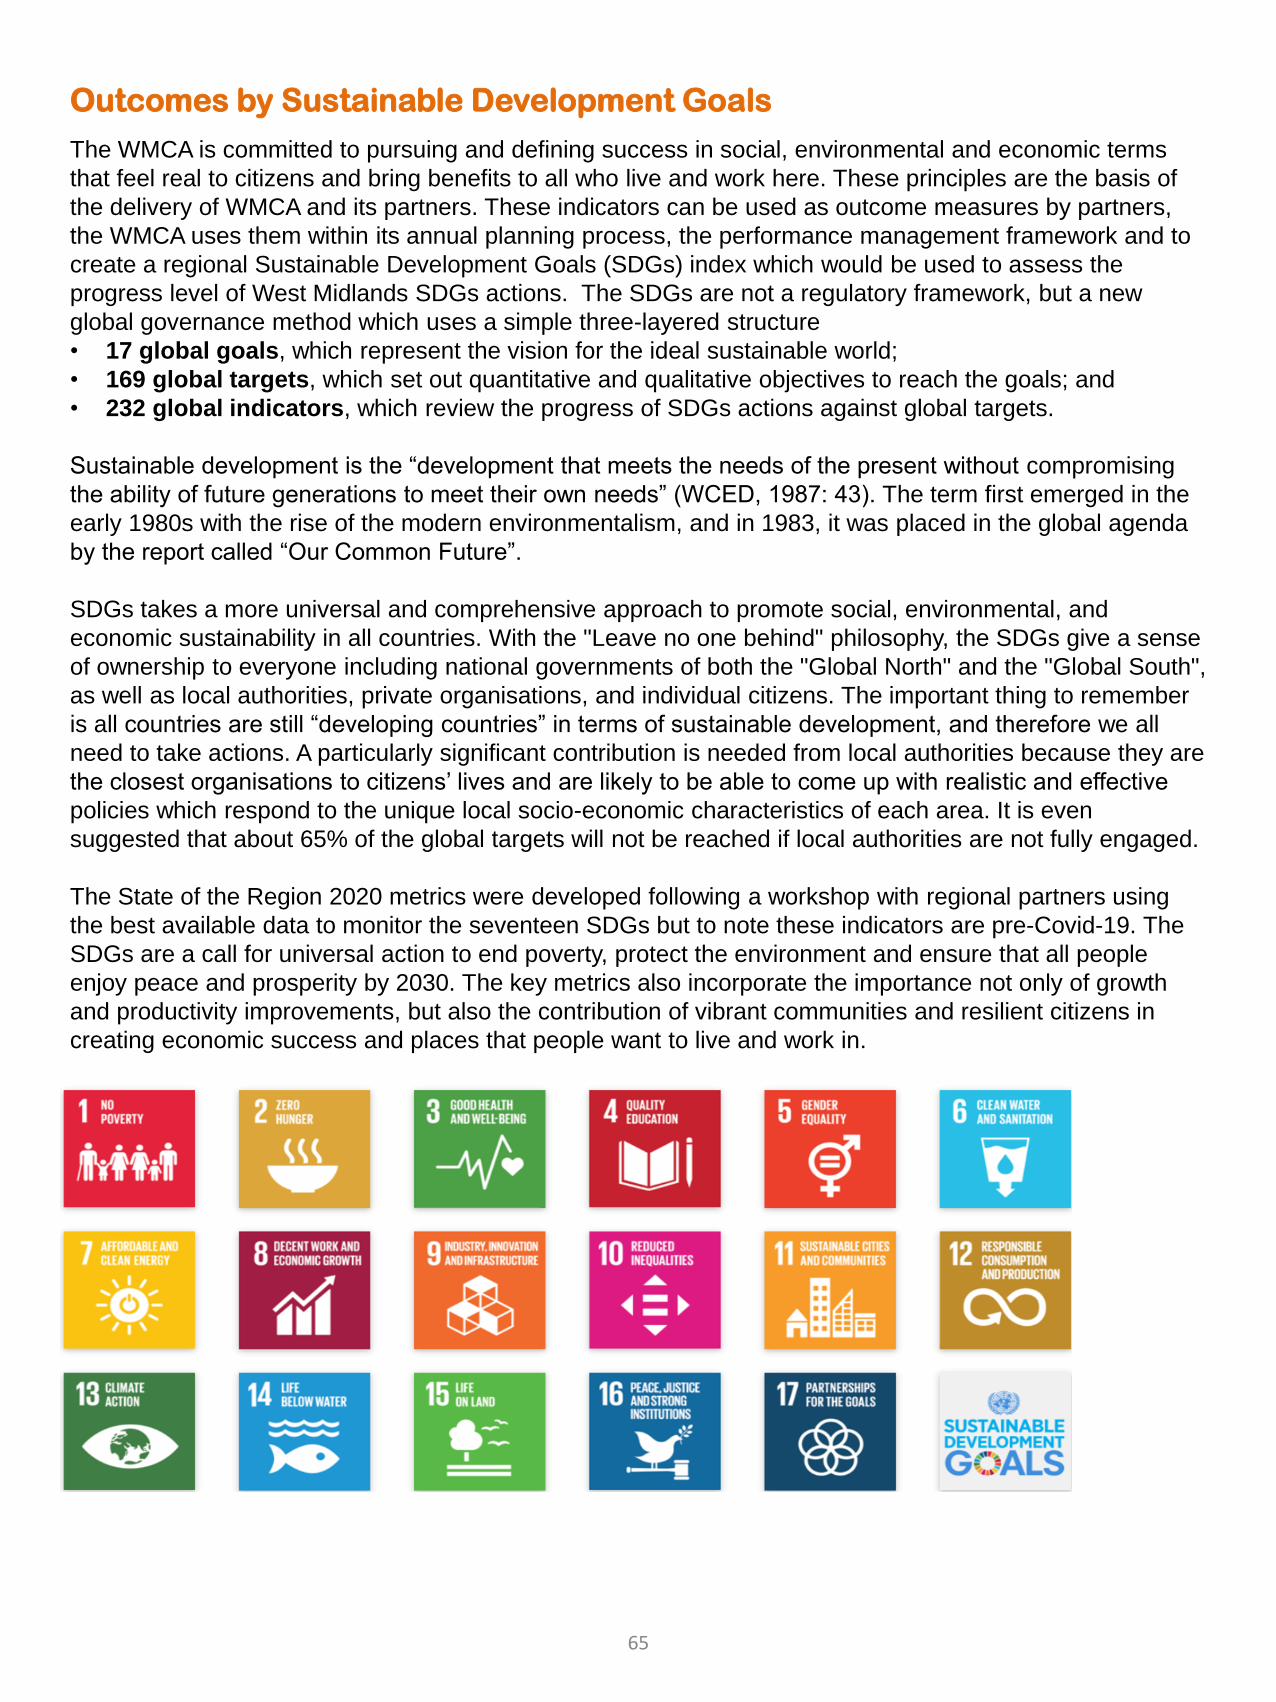
Outcomes by Sustainable Development Goals
The WMCA is committed to pursuing and defining success in social, environmental and economic terms
that feel real to citizens and bring benefits to all who live and work here. These principles are the basis of
the delivery of WMCA and its partners. These indicators can be used as outcome measures by partners,
the WMCA uses them within its annual planning process, the performance management framework and to
create a regional Sustainable Development Goals (SDGs) index which would be used to assess the
progress level of West Midlands SDGs actions. The SDGs are not a regulatory framework, but a new
global governance method which uses a simple three-layered structure
• 17 global goals, which represent the vision for the ideal sustainable world;
• 169 global targets, which set out quantitative and qualitative objectives to reach the goals; and
• 232 global indicators, which review the progress of SDGs actions against global targets.
Sustainable development is the “development that meets the needs of the present without compromising
the ability of future generations to meet their own needs” (WCED, 1987: 43). The term first emerged in the
early 1980s with the rise of the modern environmentalism, and in 1983, it was placed in the global agenda
by the report called “Our Common Future”.
SDGs takes a more universal and comprehensive approach to promote social, environmental, and
economic sustainability in all countries. With the "Leave no one behind" philosophy, the SDGs give a sense
of ownership to everyone including national governments of both the "Global North" and the "Global South",
as well as local authorities, private organisations, and individual citizens. The important thing to remember
is all countries are still “developing countries” in terms of sustainable development, and therefore we all
need to take actions. A particularly significant contribution is needed from local authorities because they are
the closest organisations to citizens’ lives and are likely to be able to come up with realistic and effective
policies which respond to the unique local socio-economic characteristics of each area. It is even
suggested that about 65% of the global targets will not be reached if local authorities are not fully engaged.
The State of the Region 2020 metrics were developed following a workshop with regional partners using
the best available data to monitor the seventeen SDGs but to note these indicators are pre-Covid-19. The
SDGs are a call for universal action to end poverty, protect the environment and ensure that all people
enjoy peace and prosperity by 2030. The key metrics also incorporate the importance not only of growth
and productivity improvements, but also the contribution of vibrant communities and resilient citizens in
creating economic success and places that people want to live and work in.
65
1. No Poverty – End poverty in all its forms everywhere
The WMCA average household income after housing costs was £24,950 in 2018, with the national average
standing at £28,296. This has increased by 8.2% (+£1,886) since 2016 which is above the national
increase of 3.4%.
In 2019, the WMCA unemployment rate was 5.5% (109,500 people) which is above the UK average of
4.0%. When compared to 2018, this has increased by 0.1 percentage points (pp) or 4,200 people which is
contrast to the UK drop of 0.3pp. To reach the UK average would require 30,320 less people to be classed
as unemployed in the WMCA.
There were 602,900 residents aged 16-64 that were classed as economically inactive in 2019, 106,700
(17.7%) of these residents stated they wanted a job which has increased by 1.0pp since 2018.
The average annual full-time earnings for WMCA residents was £29,422 in 2019, this increased at the
same rate as the UK from 2018. The WMCA average resident earnings were 97% of the UK average of
£30,353, there is a shortfall of £931.
In 2019, 79.3% of WMCA employees were earning above the national living wage foundation rates which
has increased at a slightly faster rate at 3pp compared to 2.8pp. However, earnings earning above the
national average in the WMCA is still below the UK average of 79.9%.
There were 207,635 claimants aged 16 years and over in May 2020 in the WMCA (3 LEP) –this is an
increase of 36,390 claimants since April 2020. This increase equates to 21.3% for the WMCA (3 LEP)
compared to 26.6% growth for the UK. There were 41,225 youth claimants in the WMCA (3 LEP) area in
May 2020, this is an increase of 8,775 people compared to April 2020. This equates to an increase of
27.0%–while the UK increased by 32.3%. .
Similar patterns can be seen for claimants aged 18-64 years old in the WMCA, with 169,850 claimants in
April 2020, an increase of 67.2% since March 2020. The UK has increased by 67.2% since the previous
month.
66
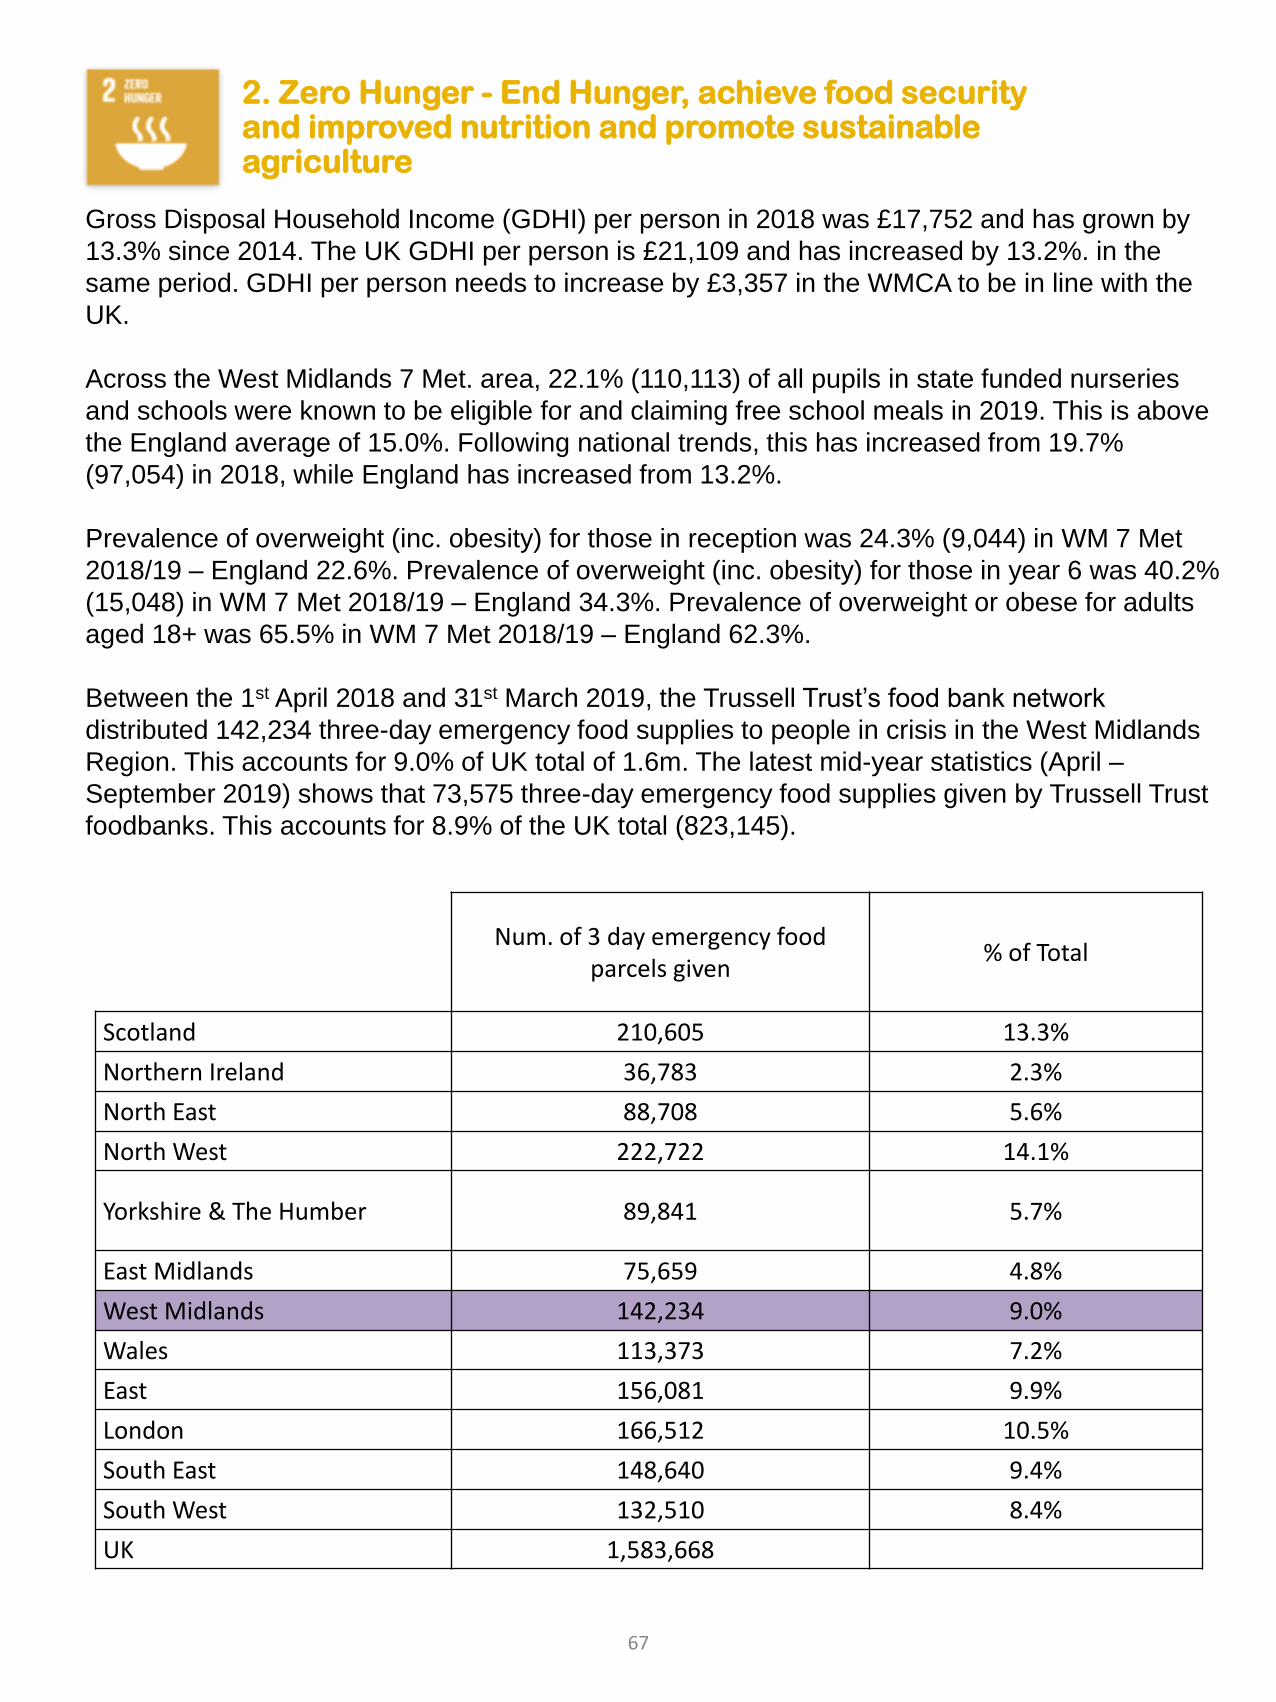
Gross Disposal Household Income (GDHI) per person in 2018 was £17,752 and has grown by
13.3% since 2014. The UK GDHI per person is £21,109 and has increased by 13.2%. in the
same period. GDHI per person needs to increase by £3,357 in the WMCA to be in line with the
UK.
Across the West Midlands 7 Met. area, 22.1% (110,113) of all pupils in state funded nurseries
and schools were known to be eligible for and claiming free school meals in 2019. This is above
the England average of 15.0%. Following national trends, this has increased from 19.7%
(97,054) in 2018, while England has increased from 13.2%.
Prevalence of overweight (inc. obesity) for those in reception was 24.3% (9,044) in WM 7 Met
2018/19 – England 22.6%. Prevalence of overweight (inc. obesity) for those in year 6 was 40.2%
(15,048) in WM 7 Met 2018/19 – England 34.3%. Prevalence of overweight or obese for adults
aged 18+ was 65.5% in WM 7 Met 2018/19 – England 62.3%.
Between the 1st April 2018 and 31st March 2019, the Trussell Trust’s food bank network
distributed 142,234 three-day emergency food supplies to people in crisis in the West Midlands
Region. This accounts for 9.0% of UK total of 1.6m. The latest mid-year statistics (April –
September 2019) shows that 73,575 three-day emergency food supplies given by Trussell Trust
foodbanks. This accounts for 8.9% of the UK total (823,145).
Num. of 3 day emergency food parcels given
% of Total
Scotland 210,605 13.3%
Northern Ireland 36,783 2.3%
North East 88,708 5.6%
North West 222,722 14.1%
Yorkshire & The Humber 89,841 5.7%
East Midlands 75,659 4.8%
West Midlands 142,234 9.0%
Wales 113,373 7.2%
East 156,081 9.9%
London 166,512 10.5%
South East 148,640 9.4%
South West 132,510 8.4%
UK 1,583,668
2. Zero Hunger - End Hunger, achieve food security and improved nutrition and promote sustainable agriculture
67
3. Good Health and Wellbeing - Ensure healthy lives and promote well-being for all at all ages
In 2018, the infant mortality rate for the WMCA was 6.7 per 1,000 live births which is above the national
average of 3.9. Each of the seven metropolitan authorities is worse than the England average, but
Birmingham shows particularly poor results with 7.4 per 1,000 live births. It is worth noting that the number
of infant deaths has decreased from 786 in 2017 down to 779 in 2018, however per 1,000 live births the
rate has increased from 6.6 per 1,000.
The healthy life expectancy is lower for males in the West Midlands 7 Met. area than the national average
at 59.6 years compared to 63.1 years in 2018, this leading to a gap of 3.5 years. Compared to 2017, the
healthy life expectancy has decreased by 0.3 years while the national average remained the same. Similar
patterns can be seen in the healthy life expectancy of females in the West Midlands 7 Met. where it is
estimated to be 59.8 years with the national average of 63.6 years leading to a gap of 3.8 years. Compared
to 2017, the healthy life expectancy for females in the West Midlands 7 Met. area decreased by 0.3 years
with the national average remaining the same.
In May 2018/19, 29.5% (978,700) of adults were inactive which increased by 0.1pp (+9,200 people) since
May 2017/18. Nationally there was an average of 24.8% of adults classed as inactive, this is a decrease of
0.4pp. To reach the national average of physical inactive adults, the WMCA requires 156,456 people to
become more active.
Exploratory analyses into Covid-19 and health inequalities Research Case Study
Background: We know that Covid-19 is likely to exasperate existing health inequalities, both through the
direct impacts of the virus, and the indirect impacts of the control measures imposed. The PHE Population
Intelligence Hub is carrying out some exploratory analyses to understand local authority area
characteristics which are disproportionately impacted by Covid-19.
Aims: The aim of the research is to identify key areas of focus in mitigating the impact of Covid-19 on
health inequalities in the region, including over the longer term. The piece will support the WMCA in the
relationship between health & wealth and places inclusive growth within its broader context of an inclusive
economy. The piece aims to explore three key overlapping areas of impact on local authorities, these are
mortality, economy and social wellbeing.
Process: The themes will be divided into three stands for exploration but are not independent of each other.
The Population Intelligence Hub is collaborating with WMCA Office for Data Analytics and Research to
produce analyses and findings for the economic impacts strand. Area characteristics which will be explored
for their association with economic outcomes include area demographics, deprivation, economic activity,
jobs across sectors, vulnerable population (including health needs and other needs) and rurality.
68
4. Quality Education - Ensure inclusive and equitable quality education and promote lifelong opportunities for all
The average Progress 8 score in the West Midlands 7 Met. area has increased from -0.14 in 2018 to -0.08
in 2019. Birmingham was rated as ‘Above Average’; both Solihull and Wolverhampton as ‘Average’; while
Coventry, Dudley, Sandwell and Walsall were deemed ‘Below Average’.
Between the 2018/19 academic year, there were 31,740 apprenticeship starts across the WMCA area,
2,540 more than in 2017/18. This equates to an increase of 8.7%. Nationally, the number of people
participating in an apprenticeship in England, increased by 4.7%. Advanced Level apprenticeships
increased by 10.3% compared to the national increase of 5.1% and Higher Apprenticeships increased by
60.7% compared to 55.7% nationally.
The West Midlands 7 Met. area in 2018, had a 10.0% persistent absentee rate at a primary school level,
which is above the national average of 8.7%. At a secondary school this figure rises to 14.3% in the West
Midlands 7 Met. area, which matches the national trend but is higher than national average of 13.9%.
There are 861,700 people qualified to NVQ Level 4 in the WMCA area. This is an increase of 4.4% on the
previous year or 36,200 people, comparable to the national growth rate of 2.9%. Despite this positive trend,
33.5% of the population are qualified to NVQ Level 4 compared to 40.2% for the UK – a shortfall of 173,249
people. The proportion of WMCA residents with no qualifications increased from 11.0% (283,700) in 2018 to
11.3% (290,500) in 2019. An increase of 6,800 people. The number of women with no qualifications
increased from 130,300 to 136,200 (+4.5%), and men increased from 153,400 to 154,400 (+0.7%). Overall,
to reach the current UK average (7.9%) requires a further upskilling of 87,115 people.
Education and Skills Research Case Study
Skills Advisory Panels aim to bring together local employers and skills providers to pool knowledge on skills
and labour market needs, and to work together to understand and address key local challenges. This
includes both immediate needs and challenges and looking at what is required to help local areas adapt to
future labour market changes and to grasp future opportunities. This will help colleges, universities and
other providers deliver the skills required by employers, now and in the future. Skills Advisory Panels aim to
strengthen the capabilities of Local Enterprise Partnerships and Mayoral Combined Authorities, or local
areas from hereafter, to carry out high quality analysis which will be used to identify their skills and
employment needs and priorities, as well as inform their skills agenda, and improve their economic
outcomes. This will assist local areas to develop action plans to address skills issues which, in turn can
give more people in the local community access to high quality skills provision that leads to good jobs. The
analysis produced will underpin the ‘People’ element of their Local Industrial Strategy.
In the West Midlands mapping and gapping of data needs by the Office for Data Analytics identified as skills
data as a key evidence and data gap in the region. WMCA with WMREDI partners are developing the SAP
Analysis and wider skills analysis, the following sections are the emerging key points from this work.
69
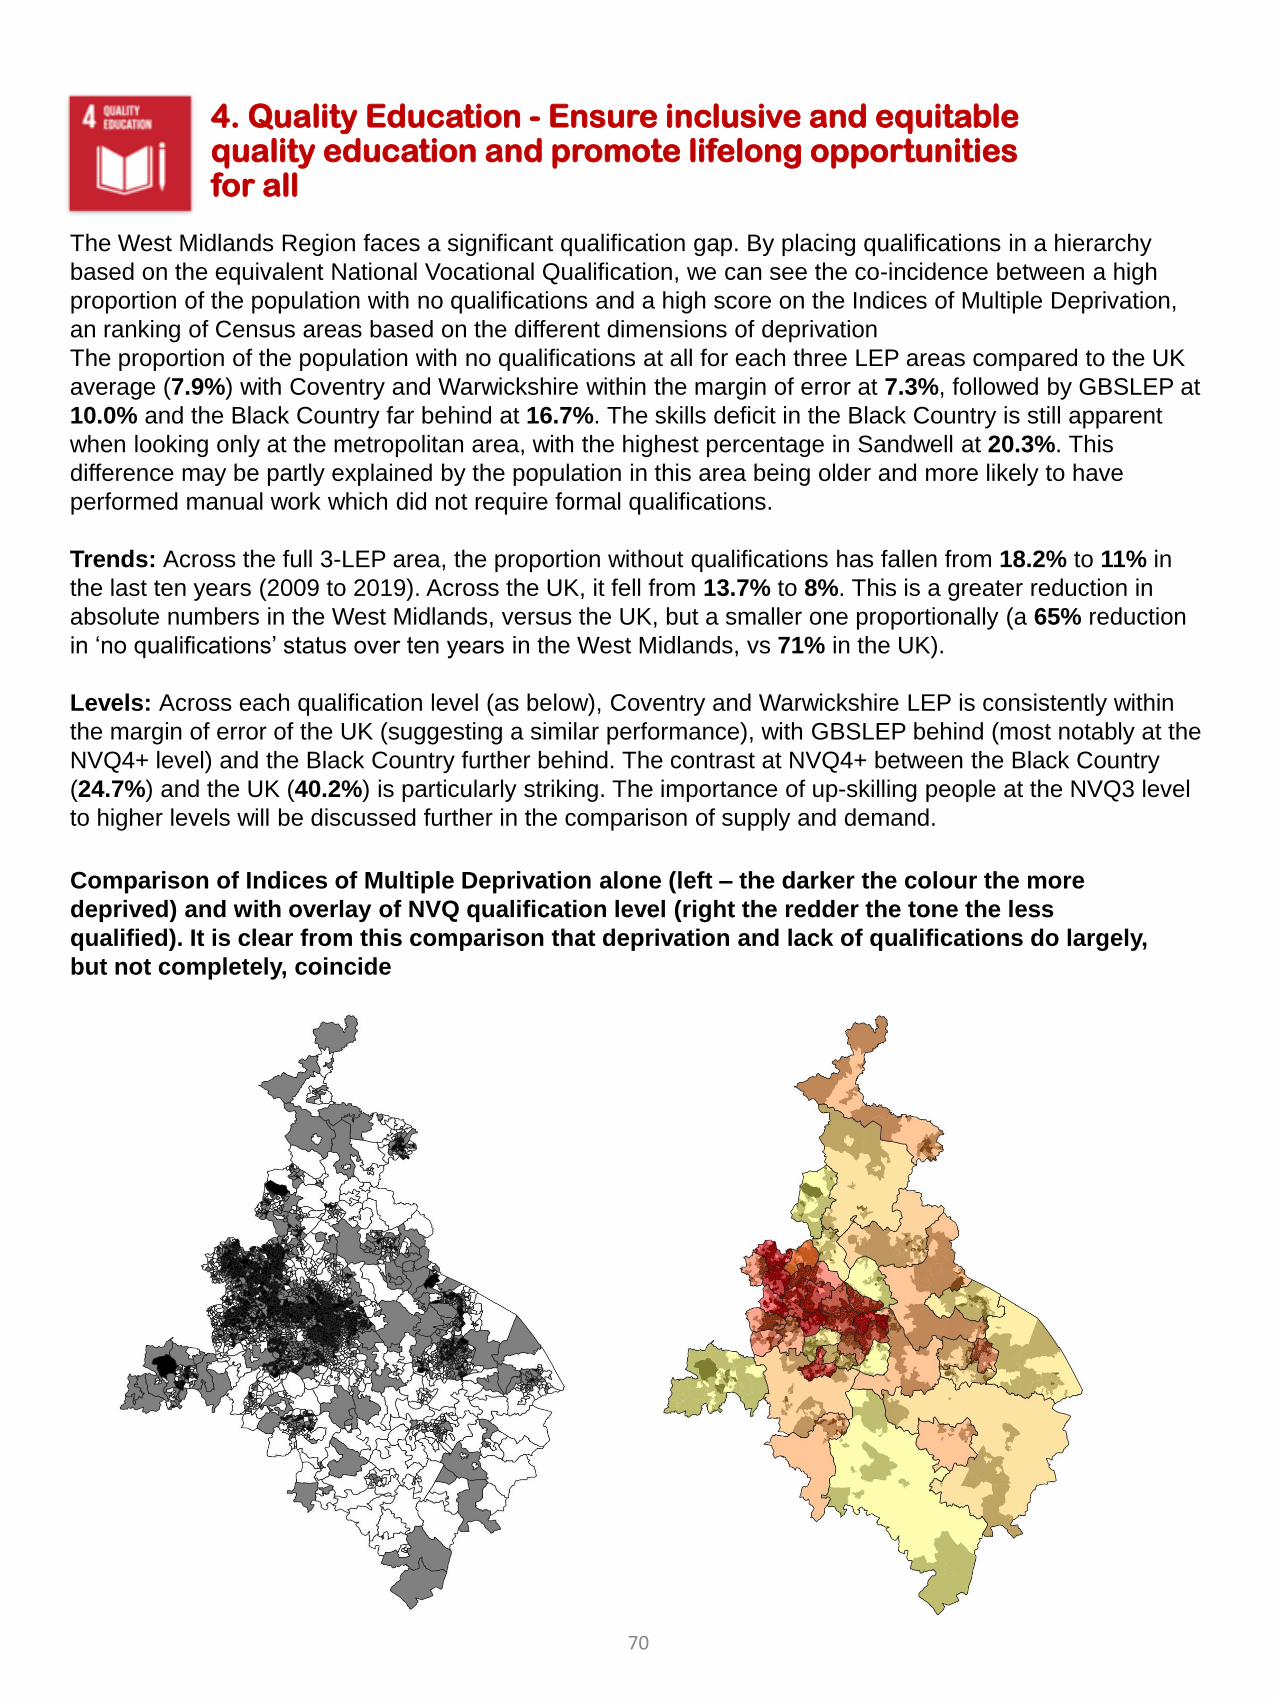
4. Quality Education - Ensure inclusive and equitable quality education and promote lifelong opportunities for all
The West Midlands Region faces a significant qualification gap. By placing qualifications in a hierarchy
based on the equivalent National Vocational Qualification, we can see the co-incidence between a high
proportion of the population with no qualifications and a high score on the Indices of Multiple Deprivation,
an ranking of Census areas based on the different dimensions of deprivation
The proportion of the population with no qualifications at all for each three LEP areas compared to the UK
average (7.9%) with Coventry and Warwickshire within the margin of error at 7.3%, followed by GBSLEP at
10.0% and the Black Country far behind at 16.7%. The skills deficit in the Black Country is still apparent
when looking only at the metropolitan area, with the highest percentage in Sandwell at 20.3%. This
difference may be partly explained by the population in this area being older and more likely to have
performed manual work which did not require formal qualifications.
Trends: Across the full 3-LEP area, the proportion without qualifications has fallen from 18.2% to 11% in
the last ten years (2009 to 2019). Across the UK, it fell from 13.7% to 8%. This is a greater reduction in
absolute numbers in the West Midlands, versus the UK, but a smaller one proportionally (a 65% reduction
in ‘no qualifications’ status over ten years in the West Midlands, vs 71% in the UK).
Levels: Across each qualification level (as below), Coventry and Warwickshire LEP is consistently within
the margin of error of the UK (suggesting a similar performance), with GBSLEP behind (most notably at the
NVQ4+ level) and the Black Country further behind. The contrast at NVQ4+ between the Black Country
(24.7%) and the UK (40.2%) is particularly striking. The importance of up-skilling people at the NVQ3 level
to higher levels will be discussed further in the comparison of supply and demand.
Comparison of Indices of Multiple Deprivation alone (left – the darker the colour the more
deprived) and with overlay of NVQ qualification level (right the redder the tone the less
qualified). It is clear from this comparison that deprivation and lack of qualifications do largely,
but not completely, coincide
70
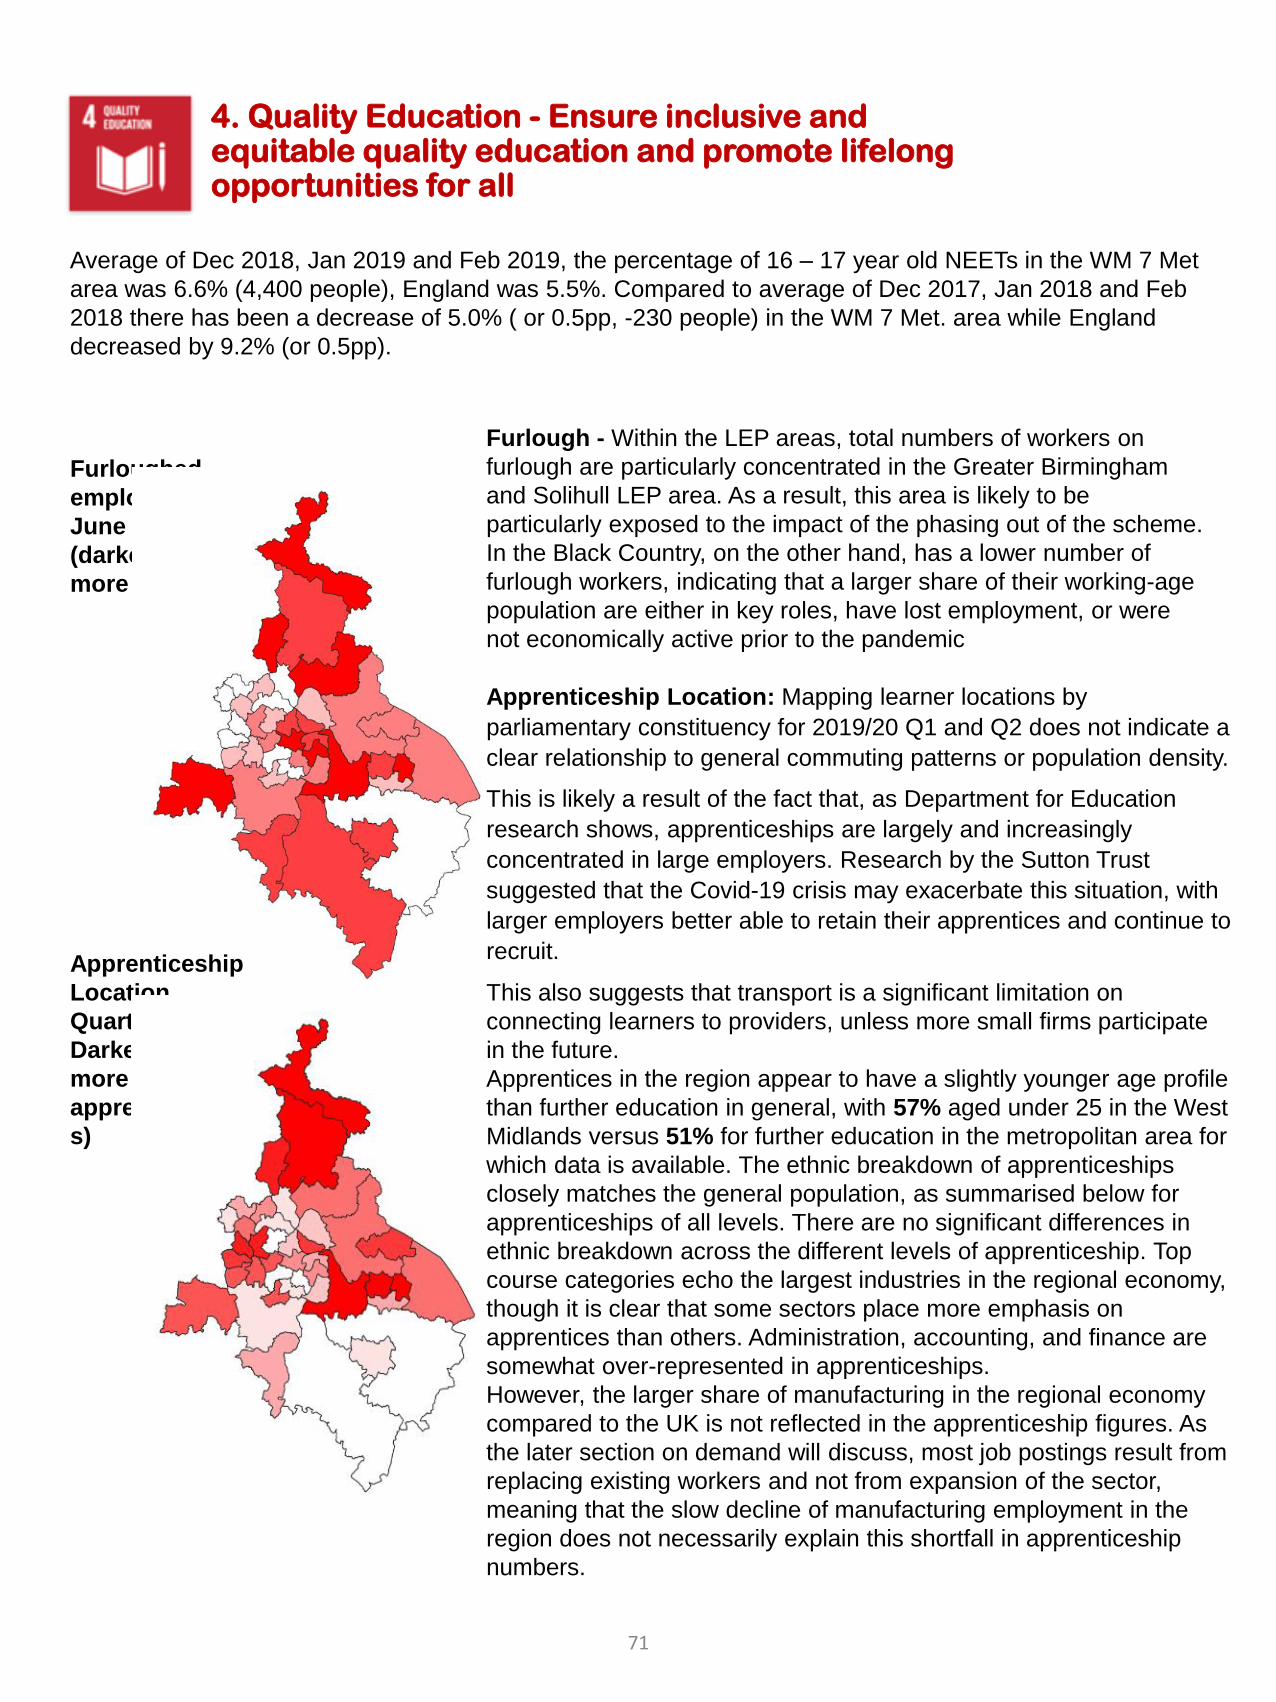
4. Quality Education - Ensure inclusive and equitable quality education and promote lifelong opportunities for all
Average of Dec 2018, Jan 2019 and Feb 2019, the percentage of 16 – 17 year old NEETs in the WM 7 Met
area was 6.6% (4,400 people), England was 5.5%. Compared to average of Dec 2017, Jan 2018 and Feb
2018 there has been a decrease of 5.0% ( or 0.5pp, -230 people) in the WM 7 Met. area while England
decreased by 9.2% (or 0.5pp).
Furloughed
employees
June 2020
(darker red
more furlough)
Apprenticeship
Location
Quarter 2 2020
Darker red
more
apprenticeship
s)
Furlough - Within the LEP areas, total numbers of workers on
furlough are particularly concentrated in the Greater Birmingham
and Solihull LEP area. As a result, this area is likely to be
particularly exposed to the impact of the phasing out of the scheme.
In the Black Country, on the other hand, has a lower number of
furlough workers, indicating that a larger share of their working-age
population are either in key roles, have lost employment, or were
not economically active prior to the pandemic
Apprenticeship Location: Mapping learner locations by
parliamentary constituency for 2019/20 Q1 and Q2 does not indicate a
clear relationship to general commuting patterns or population density.
This is likely a result of the fact that, as Department for Education
research shows, apprenticeships are largely and increasingly
concentrated in large employers. Research by the Sutton Trust
suggested that the Covid-19 crisis may exacerbate this situation, with
larger employers better able to retain their apprentices and continue to
recruit.
This also suggests that transport is a significant limitation on
connecting learners to providers, unless more small firms participate
in the future.
Apprentices in the region appear to have a slightly younger age profile
than further education in general, with 57% aged under 25 in the West
Midlands versus 51% for further education in the metropolitan area for
which data is available. The ethnic breakdown of apprenticeships
closely matches the general population, as summarised below for
apprenticeships of all levels. There are no significant differences in
ethnic breakdown across the different levels of apprenticeship. Top
course categories echo the largest industries in the regional economy,
though it is clear that some sectors place more emphasis on
apprentices than others. Administration, accounting, and finance are
somewhat over-represented in apprenticeships.
However, the larger share of manufacturing in the regional economy
compared to the UK is not reflected in the apprenticeship figures. As
the later section on demand will discuss, most job postings result from
replacing existing workers and not from expansion of the sector,
meaning that the slow decline of manufacturing employment in the
region does not necessarily explain this shortfall in apprenticeship
numbers.
71
5. Gender Equality - Achieve gender equality and empower all women and girls
There are significant pay gaps between males and females within the WMCA and as the UK as a whole.
The average full-time annual wage for a male in the WMCA stood at £32,335 in 2019, while in the full-time
annual wage for females was £24,462, leading to a gap of £7,873 within the WMCA. The UK has a gap of
£6,108 where male full-time earn on average £32,882 and females earn £26,774. When compared to
2018, the average male earnings have increased by 1.5% (+£492) which is a much slower growth rate
when compared to the 4.4% (+£1,036) increase for female earnings in the WMCA.
The overall employment rate for females in the WMCA was 66.9% (865,100) while for men this was 77.9%
(1,004,900) in 2019. However, when compared to 2018, the overall employment rate for females has
increased by 1.1pp, with the male employment rate increasing at a slower rate of 0.4pp.
When split into part-time and full-time employment rates, in the WMCA, there were 38.4% (331,800) of
females in employment working part time in 2019, this has decreased by 0.2pp since 2018, the UK average
was 39.4% which has decreased by 0.7pp. While, 9.2% (92,600) of males in the WMCA in employment
working part time, this has decreased by 0.6pp when compared to 2018. In contrast the UK experienced a
slight increase from 11.2% in 2018 to 11.2% in 2019.
In 2019, there were 61.5% (531,900) of females in employment working full time in the WMCA, this has
increased by 0.2pp since 2018, the UK average was 60.5% which has increased by 0.8pp. There were
90.4% (908,400) of males in the WMCA in employment working full time, this has decreased by 0.4pp when
compared to 2018, while the UK has remained the same at 88.6%.
Income Inequality Research Case Study
In 2019, the Office for Data Analytics carried out work looking at the gaps in data and evidence in the
region. This mapping and gapping exercise developed a number of use case opportunities, which were
prioritised one of which was better understanding of inequality. As part of addressing this we have started
looking at income inequality through an analysis of HMRC data for the West Midlands region, including
gender inequalities. Initial findings show:
• 72% of people have a total income below the regional so 7 out of 10 are below the average of £23,200
(national average £24,400)
• The West Midlands is the 5th most unequal region measured by the GINI index
• Men are wealthier than women. However at lower income there is far greater equality, disparity happens
at the higher income levels where 8 out of 10 of the richest people are men. But there is more inequality
within the income distribution of men than between genders and inequality between males contributes
more to overall inequality.
• This is largely because of wider income opportunities for men, through better pensions, financial
investments and property earnings. Also the sectors that men and women work in affect their ability to
earn at equal levels, but there is also great income inequality within sectors.
These findings point to the importance of financial security and management skills and the ability for
women to access other sources of income, entrepreneurship and opportunities to improve inequality. It also
highlights women are more likely to be in part time and insecure work.
72
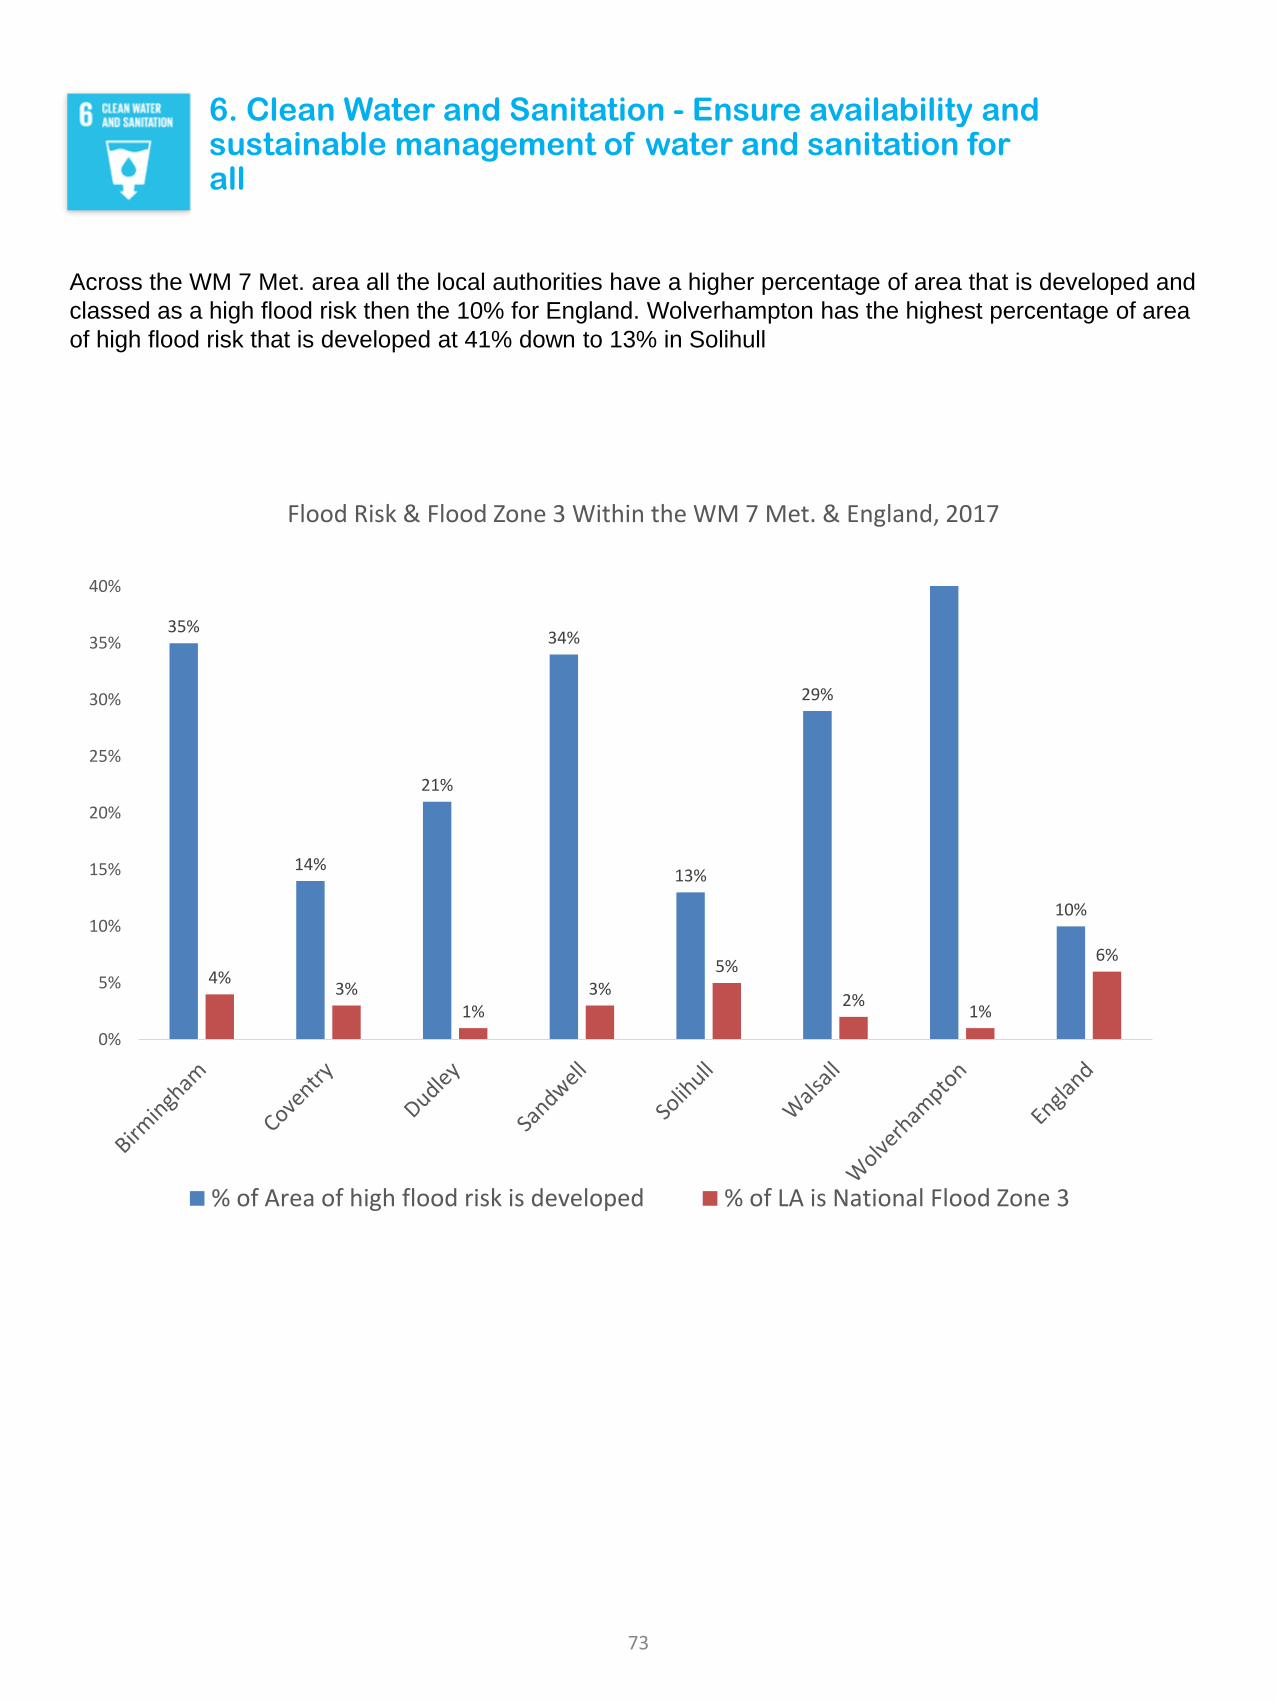
6. Clean Water and Sanitation - Ensure availability and sustainable management of water and sanitation for all
Across the WM 7 Met. area all the local authorities have a higher percentage of area that is developed and
classed as a high flood risk then the 10% for England. Wolverhampton has the highest percentage of area
of high flood risk that is developed at 41% down to 13% in Solihull
35%
14%
21%
34%
13%
29%
10%
4%3%
1%3%
5%
2%1%
6%
0%
5%
10%
15%
20%
25%
30%
35%
40%
Flood Risk & Flood Zone 3 Within the WM 7 Met. & England, 2017
% of Area of high flood risk is developed % of LA is National Flood Zone 3
73
7. Affordable and Clean Energy - Ensure access to affordable, reliable, sustainable and modern energy for all
In 2018, there was an estimated 193,915 households living in fuel poverty, this equates to 11.5% of all
households, this is above the England average of 10.3%. However, when compared to 2017 this is a
decrease from the 218,644 households living in fuel poverty in the WMCA which equated to 13.1%.
In the WMCA geography, 736,150 MwH of renewable electricity generation was produced in 2018, with
45.8% (337,304 MwH) generated from Photovoltaics. Since 2017, the amount of renewable electricity
generated has decreased in the WMCA area by 7.5% (-60,044 MwH) while the UK experienced an overall
increase by 11.4%. When taking in to account consumption to the generation of renewable electricity, this
equates to a 4.5% total renewable generation rate.
Across the WM 7 Met. 42.1% of buses have low emissions engines and 70.4% of train journeys use electric
engines.
Ultra Low Emissions Vehicles Case Study
Energy Capital have been awarded £250k through the WMCA investment programme to develop a
cohesive strategy for supporting infrastructure to allow the transition to Ultra-Low Emission Vehicles (ULEV)
across the West Midlands Region. The programme aims to draw together a comprehensive evidence base
of current and future requirements, build a picture of the work streams that Constituent Members are
already undertaking, identify any gaps or barriers and develop recommendations as to how WMCA could
further support and accelerate the transition.
So far, and in partnership with Transport for West Midlands, CENEX have been commissioned to develop
the foundational evidence base and technology roadmaps. This included all major classes of private and
public transport and potential transition routes including electrification, hydrogen, biofuels and other
sources. In particular reference to the electrification of private vehicles, it projected that over 10,000 on-
street charging bays would be required by 2040 under their medium scenario. The full report was published
in January 2020.
Concurrently, a series of working groups were arranged with all Constituent Members to ascertain work
done to date, aims and objectives of their own programmes and appetite for joint working. A board paper
was presented to the WMCA in February 2020 which proposed to continue working collaboratively as well
as explore the potential of a spine network of ultra-rapid chargers to enable EV users to confidently travel
in, out and around the West-Midlands without range anxiety.
Energy capital has been leading on this programme to ensure that the energy infrastructure which will
underpin the transition are in place and will not form a barrier to deployment. We have been advising on the
electric bus charging work stream with Transport for West Midlands on grid capacity and potential
mitigation of barriers. We have been working closely with National Grid and WPD to capture opportunities
for more effective processes in the transition and highlight individual opportunities for potential energy
hubs.
The programme aims to leverage private or government funds to ensure the West Midlands leads the
transition, supporting our vitally important automotive sector and ensuring local business and residents
have the opportunity for clean mobility options.
74
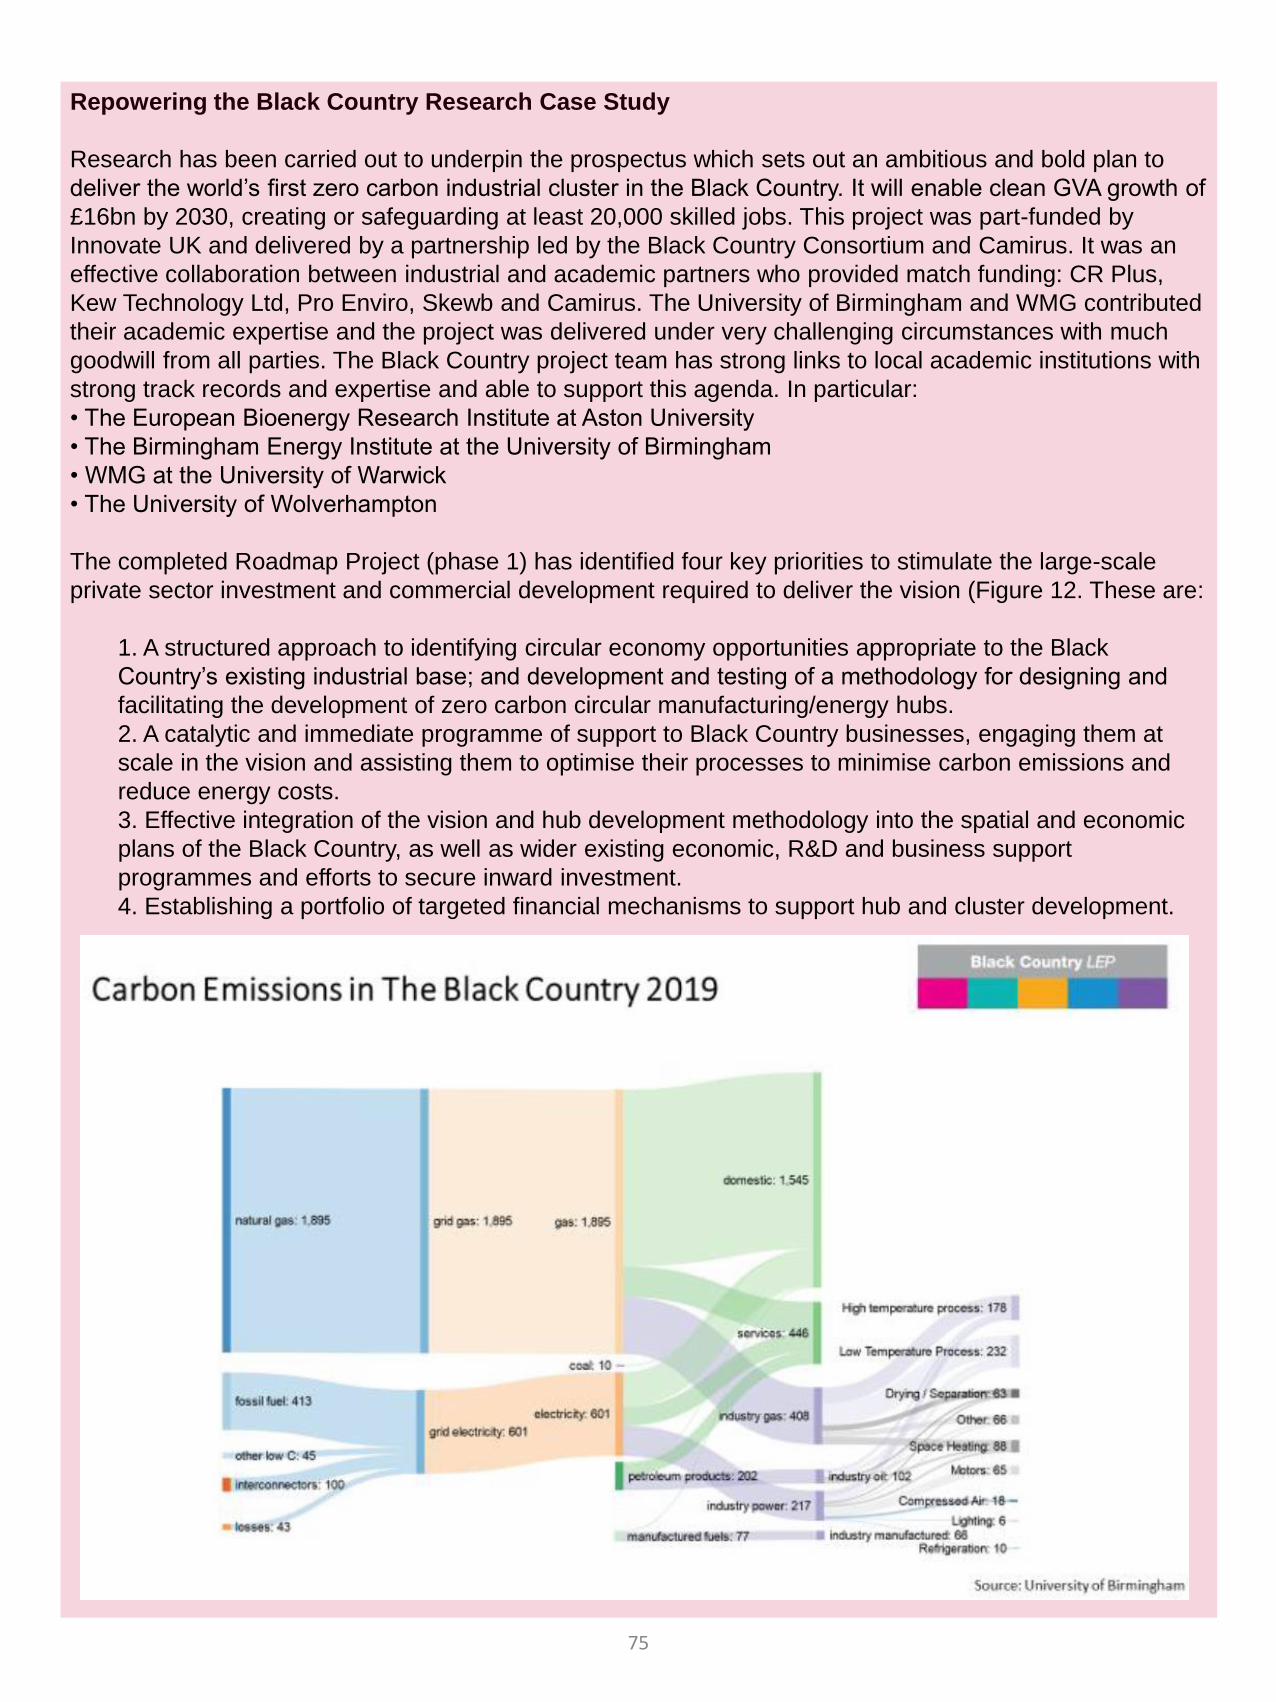
Repowering the Black Country Research Case Study
Research has been carried out to underpin the prospectus which sets out an ambitious and bold plan to
deliver the world’s first zero carbon industrial cluster in the Black Country. It will enable clean GVA growth of
£16bn by 2030, creating or safeguarding at least 20,000 skilled jobs. This project was part-funded by
Innovate UK and delivered by a partnership led by the Black Country Consortium and Camirus. It was an
effective collaboration between industrial and academic partners who provided match funding: CR Plus,
Kew Technology Ltd, Pro Enviro, Skewb and Camirus. The University of Birmingham and WMG contributed
their academic expertise and the project was delivered under very challenging circumstances with much
goodwill from all parties. The Black Country project team has strong links to local academic institutions with
strong track records and expertise and able to support this agenda. In particular:
• The European Bioenergy Research Institute at Aston University
• The Birmingham Energy Institute at the University of Birmingham
• WMG at the University of Warwick
• The University of Wolverhampton
The completed Roadmap Project (phase 1) has identified four key priorities to stimulate the large-scale
private sector investment and commercial development required to deliver the vision (Figure 12. These are:
1. A structured approach to identifying circular economy opportunities appropriate to the Black
Country’s existing industrial base; and development and testing of a methodology for designing and
facilitating the development of zero carbon circular manufacturing/energy hubs.
2. A catalytic and immediate programme of support to Black Country businesses, engaging them at
scale in the vision and assisting them to optimise their processes to minimise carbon emissions and
reduce energy costs.
3. Effective integration of the vision and hub development methodology into the spatial and economic
plans of the Black Country, as well as wider existing economic, R&D and business support
programmes and efforts to secure inward investment.
4. Establishing a portfolio of targeted financial mechanisms to support hub and cluster development.
75
8. Decent work and economic growth - Promote sustained, inclusive and sustainable economic growth, full and productive employment and decent work for all
In the WMCA total GVA continues to increase and in 2018 was £105.1bn, since 2017 this has increased at
a higher rate than the UK average (4.0% growth compared to 3.4%). The WMCA accounts for 5.5% of the
total UK GVA.
GVA per head in the WMCA was £25,183 in 2018, below the UK average of £28,729 - leading to a £14.8bn
output gap. The output gap is impacted by skills levels, employment levels and the productivity of our
business base. Notably, the output gap has decreased since the previous year by nearly £44m.
The WMCA has received 906 Foreign Direct Investment (FDI) projects from 2011/12 to 2018/19. This has
led to the creation of over 50,000 new jobs from 2011/12 to 2018/19. The number of FDI projects in the
WMCA area has more than doubled from 49 in 2011/12 to 131 in 2018/19. This far exceeds the average
growth rate for the whole of the UK which grew by 26.7% in the same period.
In 2018, the West Midlands 7 Met. area exported £16.6bn worth of goods across the world and imported
£15.3bn, leading to a trade surplus of £1.3bn. The West Midlands 7 Met. area has a trade surplus with 53
countries, the highest was with the USA at +£2.9bn where £3.8bn worth of goods exported to the USA and
£0.9bn imported from the USA – the largest trade surplus than any other NUTS 2 area.
The WM 7 Met. area had the second highest percentage of people who work satisfactory hours at 82.9%
across all city regions, this is also above the UK average of 80.3% in 2018. When using two-thirds of the
UK median pay to define the threshold of satisfactory pay, the WM 7 Met. was the third highest for
residents in quality work at 74%.
In 2018, the WMCA had a business base of 170,475 active enterprises, this has increased at a faster rate
than the UK average growth (3.3% compared to 0.5%) since 2017. Positive trends can also be seen in
enterprises births with the WMCA increasing to 24,640 (+1.7%) while the UK experienced a decreased (-
0.3%). The WMCA enterprise births per 10,000 population is above the UK average (59 per 10,000
population compared to 58 for the UK).
79.3% of employees are earning above the Living Wage Foundation wage rates, which is below the UK
average of 79.9%. However, when compared to 2018 the WMCA area has increased at a faster rate (+3pp
compared to +2.8pp for the UK).
Annual levels of jobs have decreased since last year’s State of the Region down to 1.85 m people working
in the WMCA area, with 1.16m employed in the transformational sectors and 699,100 in the enabling
sectors in 2018.
As seen in the following table, there were 5 sectors that have a higher percentage of jobs when compared
to the England average, examples include; advanced manufacturing (11.3% vs 8.0%), retail (16.6% vs
15.3%) and logistics & transport technologies (5.9% vs 4.9%). The highest number change for the WMCA
was seen in the public sector including education at 8,000 equating to a growth rate of 3.4% above the
England average growth of 0.6%.
76
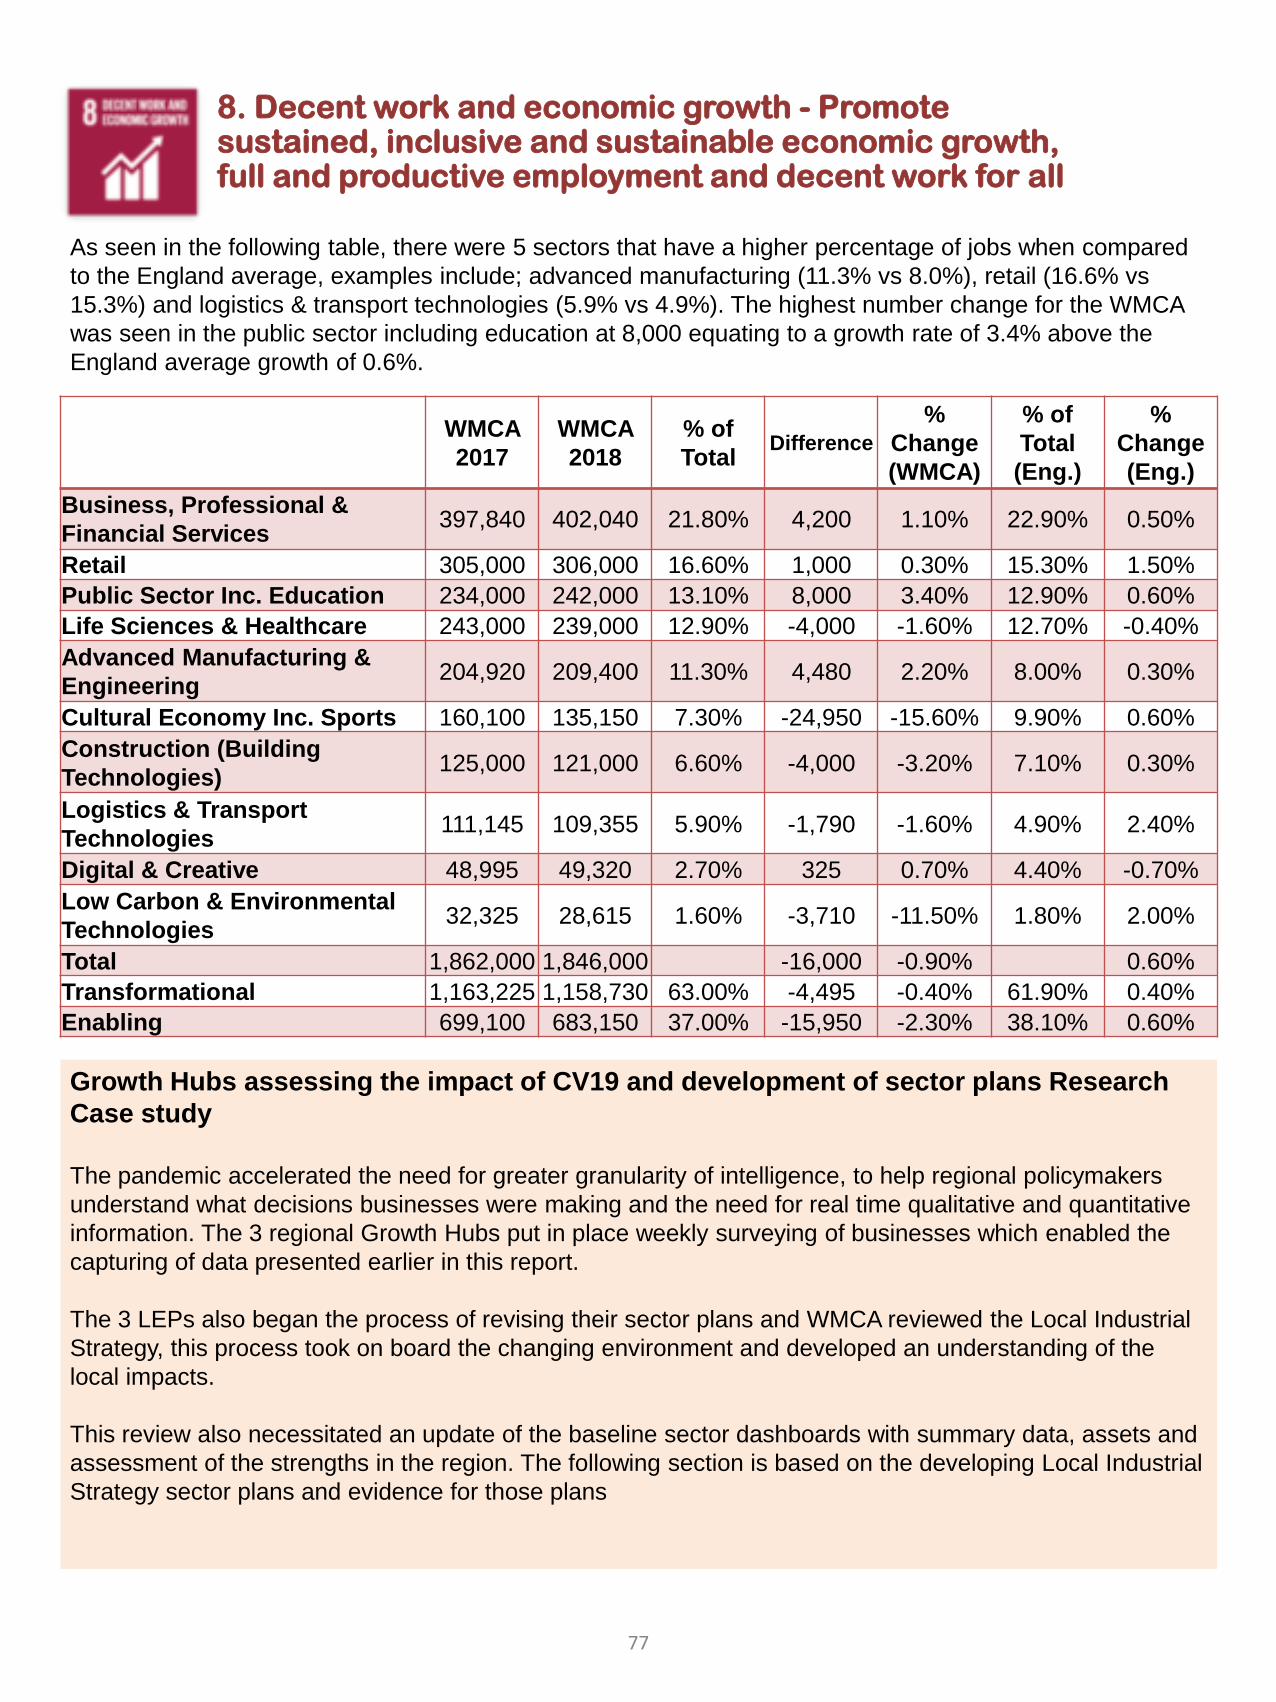
8. Decent work and economic growth - Promote sustained, inclusive and sustainable economic growth, full and productive employment and decent work for all
As seen in the following table, there were 5 sectors that have a higher percentage of jobs when compared
to the England average, examples include; advanced manufacturing (11.3% vs 8.0%), retail (16.6% vs
15.3%) and logistics & transport technologies (5.9% vs 4.9%). The highest number change for the WMCA
was seen in the public sector including education at 8,000 equating to a growth rate of 3.4% above the
England average growth of 0.6%.
Growth Hubs assessing the impact of CV19 and development of sector plans Research
Case study
The pandemic accelerated the need for greater granularity of intelligence, to help regional policymakers
understand what decisions businesses were making and the need for real time qualitative and quantitative
information. The 3 regional Growth Hubs put in place weekly surveying of businesses which enabled the
capturing of data presented earlier in this report.
The 3 LEPs also began the process of revising their sector plans and WMCA reviewed the Local Industrial
Strategy, this process took on board the changing environment and developed an understanding of the
local impacts.
This review also necessitated an update of the baseline sector dashboards with summary data, assets and
assessment of the strengths in the region. The following section is based on the developing Local Industrial
Strategy sector plans and evidence for those plans
WMCA
2017
WMCA
2018
% of
TotalDifference
%
Change
(WMCA)
% of
Total
(Eng.)
%
Change
(Eng.)
Business, Professional &
Financial Services397,840 402,040 21.80% 4,200 1.10% 22.90% 0.50%
Retail 305,000 306,000 16.60% 1,000 0.30% 15.30% 1.50%
Public Sector Inc. Education 234,000 242,000 13.10% 8,000 3.40% 12.90% 0.60%
Life Sciences & Healthcare 243,000 239,000 12.90% -4,000 -1.60% 12.70% -0.40%
Advanced Manufacturing &
Engineering204,920 209,400 11.30% 4,480 2.20% 8.00% 0.30%
Cultural Economy Inc. Sports 160,100 135,150 7.30% -24,950 -15.60% 9.90% 0.60%
Construction (Building
Technologies)125,000 121,000 6.60% -4,000 -3.20% 7.10% 0.30%
Logistics & Transport
Technologies111,145 109,355 5.90% -1,790 -1.60% 4.90% 2.40%
Digital & Creative 48,995 49,320 2.70% 325 0.70% 4.40% -0.70%
Low Carbon & Environmental
Technologies32,325 28,615 1.60% -3,710 -11.50% 1.80% 2.00%
Total 1,862,000 1,846,000 -16,000 -0.90% 0.60%
Transformational 1,163,225 1,158,730 63.00% -4,495 -0.40% 61.90% 0.40%
Enabling 699,100 683,150 37.00% -15,950 -2.30% 38.10% 0.60%
77
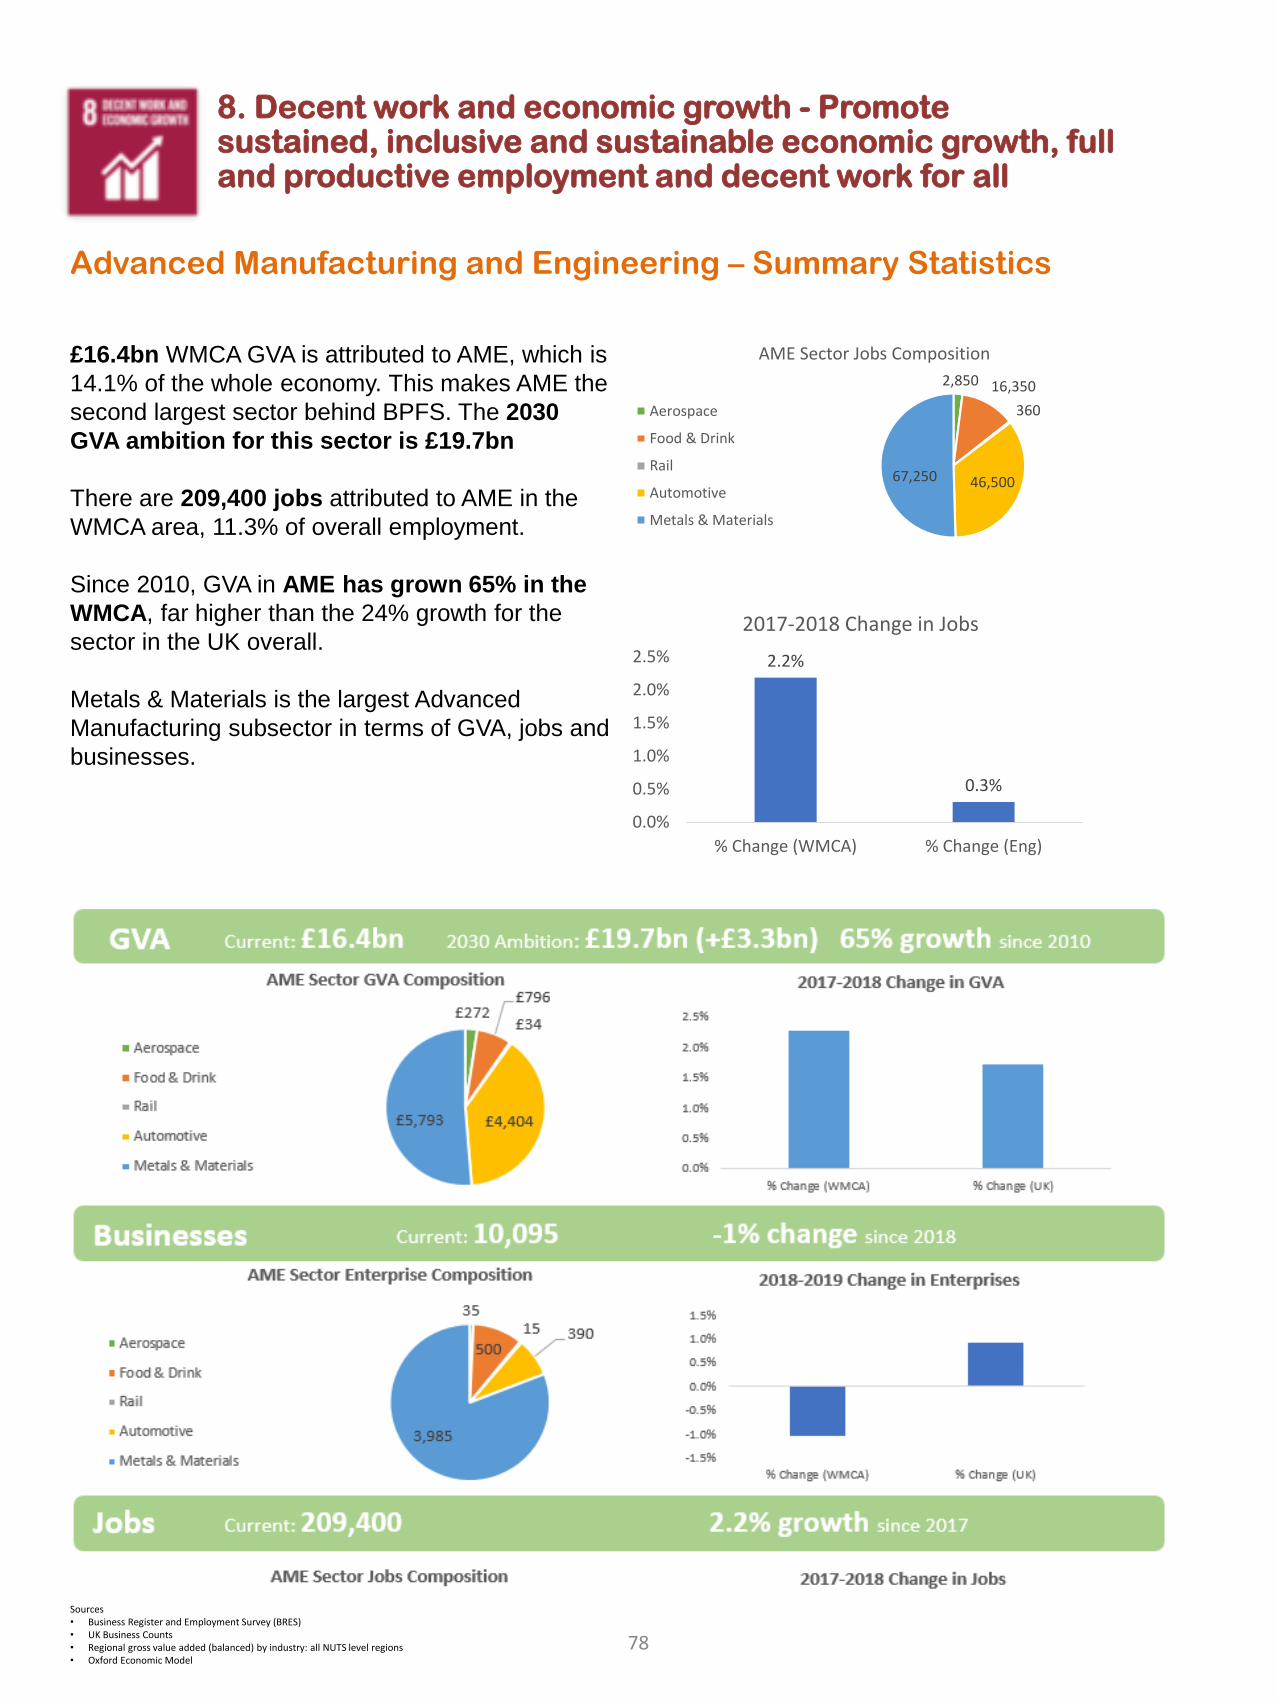
8. Decent work and economic growth - Promote sustained, inclusive and sustainable economic growth, full and productive employment and decent work for all
Advanced Manufacturing and Engineering – Summary Statistics
£16.4bn WMCA GVA is attributed to AME, which is
14.1% of the whole economy. This makes AME the
second largest sector behind BPFS. The 2030
GVA ambition for this sector is £19.7bn
There are 209,400 jobs attributed to AME in the
WMCA area, 11.3% of overall employment.
Since 2010, GVA in AME has grown 65% in the
WMCA, far higher than the 24% growth for the
sector in the UK overall.
Metals & Materials is the largest Advanced
Manufacturing subsector in terms of GVA, jobs and
businesses.
2,850 16,350
360
46,500 67,250
AME Sector Jobs Composition
Aerospace
Food & Drink
Rail
Automotive
Metals & Materials
2.2%
0.3%
0.0%
0.5%
1.0%
1.5%
2.0%
2.5%
% Change (WMCA) % Change (Eng)
2017-2018 Change in Jobs
Sources• Business Register and Employment Survey (BRES)• UK Business Counts• Regional gross value added (balanced) by industry: all NUTS level regions• Oxford Economic Model
78
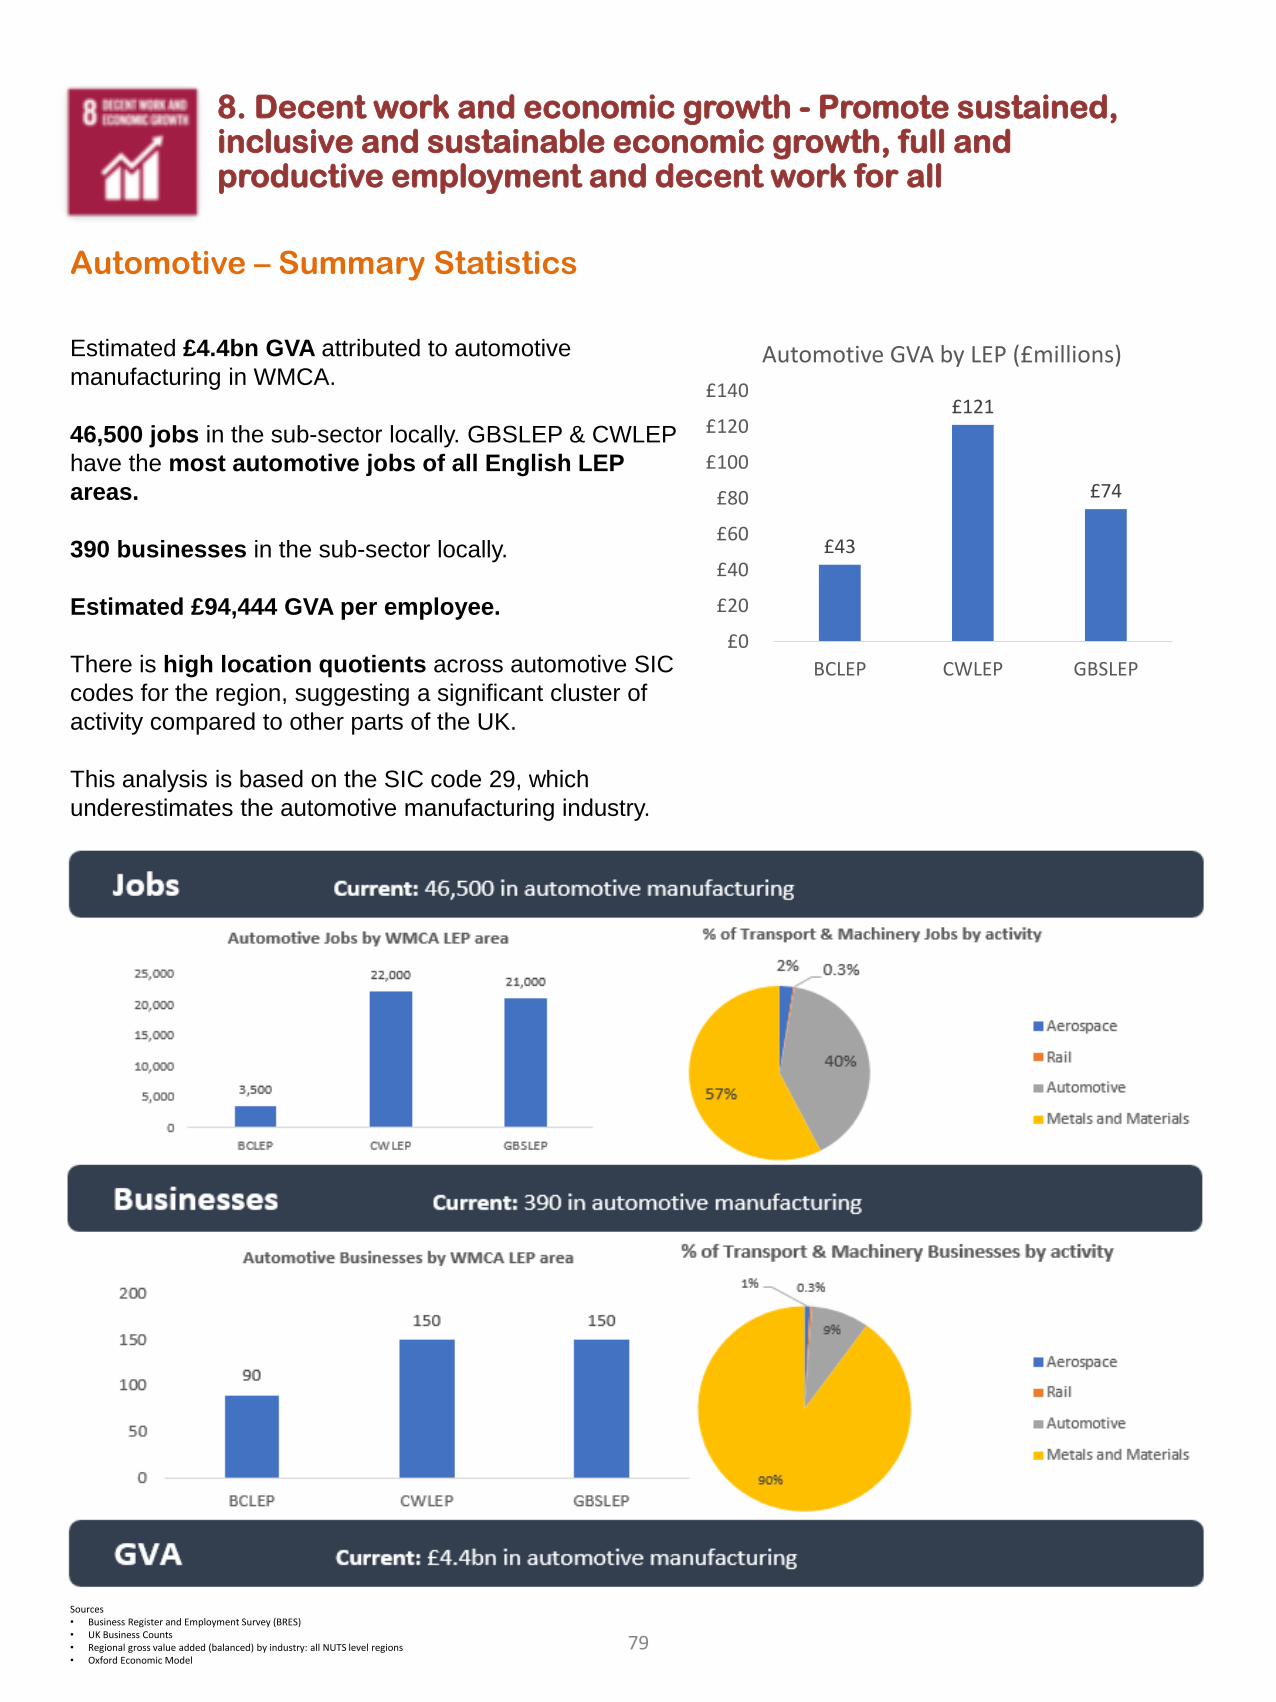
8. Decent work and economic growth - Promote sustained, inclusive and sustainable economic growth, full and productive employment and decent work for all
Automotive – Summary Statistics
Estimated £4.4bn GVA attributed to automotive
manufacturing in WMCA.
46,500 jobs in the sub-sector locally. GBSLEP & CWLEP
have the most automotive jobs of all English LEP
areas.
390 businesses in the sub-sector locally.
Estimated £94,444 GVA per employee.
There is high location quotients across automotive SIC
codes for the region, suggesting a significant cluster of
activity compared to other parts of the UK.
This analysis is based on the SIC code 29, which
underestimates the automotive manufacturing industry.
£43
£121
£74
£0
£20
£40
£60
£80
£100
£120
£140
BCLEP CWLEP GBSLEP
Automotive GVA by LEP (£millions)
Sources• Business Register and Employment Survey (BRES)• UK Business Counts• Regional gross value added (balanced) by industry: all NUTS level regions• Oxford Economic Model
79
8. Decent work and economic growth - Promote sustained, inclusive and sustainable economic growth, full and productive employment and decent work for all
Automotive Industry Profile
Our Competitive Advantage
Strong cluster presence with 20 vehicle manufacturing sites, 35 automotive and off-highway OEM brands
26 OEM Vehicle R&D Centres, 8 Automotive Centres of Excellence and 4 Low Carbon Centres of Excellence
Good access to auto supplier base
Good connectivity with well developed road and train network and international airport
The WM region has export expertise in machinery & transport goods (71% of all goods exports compared to
41% nationally)
High quality, sector focused science & research facilities and institutes
GBSLEP (22,000) & CWLEP (21,000) have the most automotive jobs of all LEP areas
The Midlands ranks as a top global destination for automotive FDI
Products , Services & Brands
JLR’s Engine Manufacturing Centre is home to the high technology, low emission Ingenium diesel engine for the
Range Rover Evoque, Discovery Sport and Jaguar XE cars
Geely LEVC’s factory for the Txe City Taxi is the first UK purpose built factory for EVs
CAB Auto, IAC, Lear, IM Kelly, Grupo Antolin produce interiors for major OEMs, including JLR, Aston Martin &
Nissan
Leading location in UK for automotive R&D.; including CAV and EV battery and energy storage
CAB Auto’s seating goes into the cars of some of the biggest automotive manufacturers, including JLR, Aston
Martin & Nissan
Rimstock PLC is a world leading producer of alloy wheels
The region produces 1/3 of all cars made in the UK
From 2014-2017, there were 82 successful WMCA FDI projects in automotive, creating 10,000 new jobs and
safeguarding a further 3,000
In 2017-18, successful FDI investments have included:
Aston Martin Lagonda 130,000sqft unit
Geely LEVC – new HQ & factory open
JLR Gaydon – Triangle and NVH
Centres of Excellence/Assets
Innovation:
Advanced Propulsion Centre, University of Warwick
National Automotive Innovation Centre (NAIC), University
of Warwick
The National Transport Design Centre, Coventry
HORIBA-MIRA Consultancy and MIRA Technology Park
Battery Prototype Centre, Warwick
Wton Science, Technology & Prototyping Centre
UK Battery Industrialisation Centre (UKBIC)
Wton Science, Technology & Prototyping Centre
Changan UK Research and Development Facility
SMMT Industry Forum
Training:
Rolls-Royce University Technology Centre, Birmingham
EEF Technology Training Centre
WMG Academy for Young Engineers
Black Country Skills Factory
Lloyds Bank Advanced Manufacturing Centre
Institute for Advanced Manufacturing
Production Processes:
Manufacturing Technology Centre (MTC)
Warwick Manufacturing Group (WMG)
80
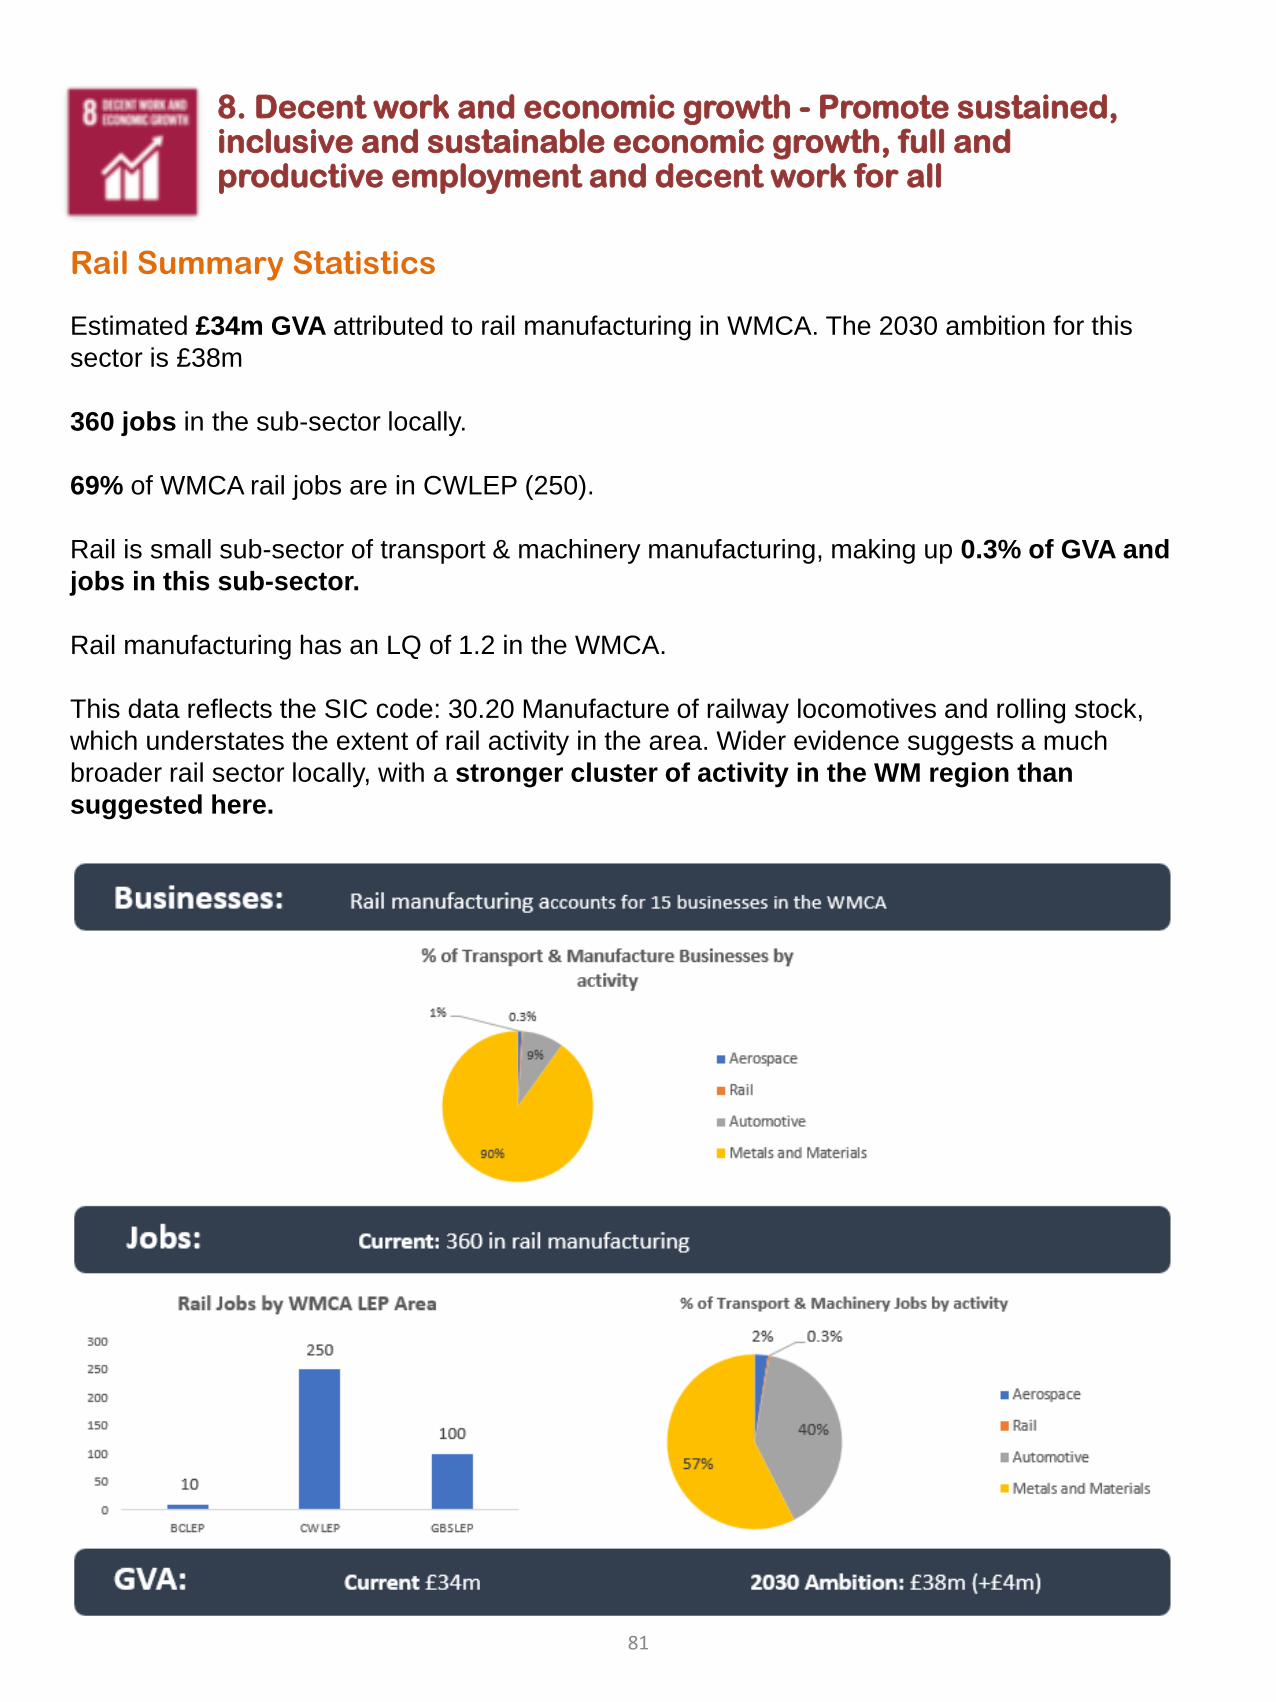
8. Decent work and economic growth - Promote sustained, inclusive and sustainable economic growth, full and productive employment and decent work for all
Rail Summary Statistics
Estimated £34m GVA attributed to rail manufacturing in WMCA. The 2030 ambition for this
sector is £38m
360 jobs in the sub-sector locally.
69% of WMCA rail jobs are in CWLEP (250).
Rail is small sub-sector of transport & machinery manufacturing, making up 0.3% of GVA and
jobs in this sub-sector.
Rail manufacturing has an LQ of 1.2 in the WMCA.
This data reflects the SIC code: 30.20 Manufacture of railway locomotives and rolling stock,
which understates the extent of rail activity in the area. Wider evidence suggests a much
broader rail sector locally, with a stronger cluster of activity in the WM region than
suggested here.
81
8. Decent work and economic growth - Promote sustained, inclusive and sustainable economic growth, full and productive employment and decent work for all
Rail Industry Profile
Our Competitive AdvantageHS2 – 2 West Midlands stations will add £3bn GVA to the local economy.OnTrackWM – rail supply chain virtual procurement tool (a part of HVM City). High quality, sector focused science & research facilities and institutes, including very light rail research; battery and energy storage R&D.Good connectivity with well developed road and train network and international airportCluster of rail construction specialists & consultancies (AECOM, TDI etc) & presence of international transport advisors (Arup, WSP, Atkins etc)The WM region has export expertise in machinery & transport goods (71% of all goods exports compared to 41% nationally).Heavy cross-over relationships with significant local automotive/aerospace/other manufacturing activity. WMCA cluster of all this manufacturing (particularly transport) activity has an agglomeration affect for the rail sector. The intertwined nature of these industries means that many firms won’t work explicitly in the rail sector. This ensures that the activity figures suggested using SIC code analysis often underestimates the size & impact of the sector locally Lightweighting and battery/energy storage expertiseRail creates high quality jobs within the region.
Products , Services & BrandsHS2 HQ - based in Birmingham, for HS2 construction and supply chain, national control centre and rolling stock centre. Wabtec AM Rail - provide signalling services for the UK market and rail consultancy through out the UK and globally.AECOM – Rail construction specialists. DK Rewinds – Specialise providing parts and repairing traction motors that power Central line trains to London.Wednesbury to Brierley Hill Metro Extension OnTrackWMMidland Metro will see the country’s first battery-operated trams on the streets in 2019Between 2014-17 there was 2 major FDI projects, creating 70 jobsHQ of Rail AllianceNational High Speed Rail College will be creating 300 engineers of the future every year. VLR Innovation Centre & Rail LineMajor HS2 contractors setting up bases in and around the region (Balfour Beatty, VINCI etc). Light rail test facilities at the QRTC (Quinton Rail Technology Centre), Long Marston
Centres of Excellence/AssetsInnovation:• Birmingham Centre for Rail Research and Education• UK Railway Research and Innovation Network (UKRRIN) led
by University of Birmingham.• WMG at the University of Warwick - very light rail; battery
and energy storage• Very Light Rail Innovation Centre & Test Track• Quinton Rail Technology Centre - the only private test track in
the UK. • The National Transport Design Centre, Coventry• MIRA Technology Park• Advanced Propulsion Centre
• Wton Science, Technology & Prototyping Centre• UKBIC (UK Battery Industrialisation Centre)
Production: • Institute For Advanced Manufacturing and Engineering• Manufacturing Technology Centre
Training:• Network Rail Training Centre, Walsall • National College for High Speed Rail, Aston• EEF Technology Training Centre• WMG Academy for Young Engineers
82
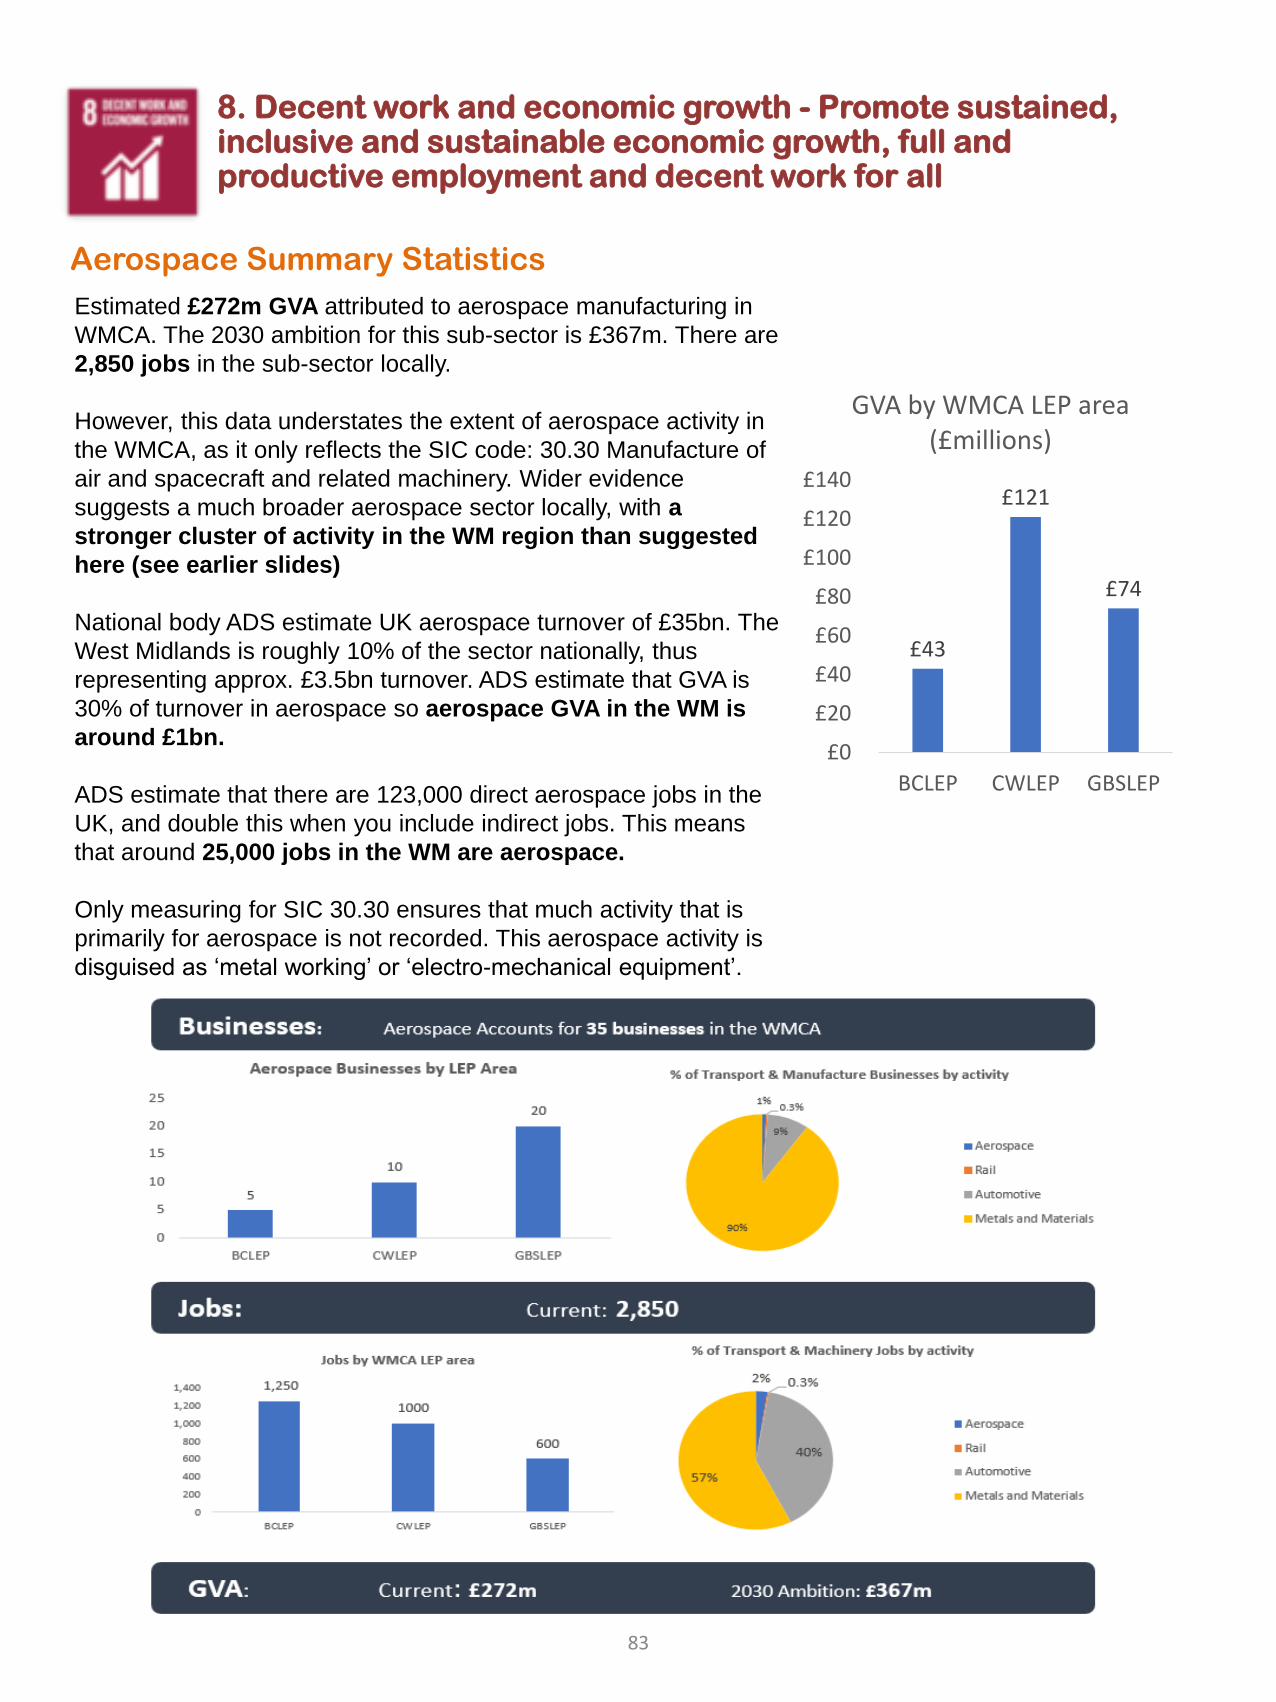
8. Decent work and economic growth - Promote sustained, inclusive and sustainable economic growth, full and productive employment and decent work for all
Aerospace Summary Statistics
Estimated £272m GVA attributed to aerospace manufacturing in
WMCA. The 2030 ambition for this sub-sector is £367m. There are
2,850 jobs in the sub-sector locally.
However, this data understates the extent of aerospace activity in
the WMCA, as it only reflects the SIC code: 30.30 Manufacture of
air and spacecraft and related machinery. Wider evidence
suggests a much broader aerospace sector locally, with a
stronger cluster of activity in the WM region than suggested
here (see earlier slides)
National body ADS estimate UK aerospace turnover of £35bn. The
West Midlands is roughly 10% of the sector nationally, thus
representing approx. £3.5bn turnover. ADS estimate that GVA is
30% of turnover in aerospace so aerospace GVA in the WM is
around £1bn.
ADS estimate that there are 123,000 direct aerospace jobs in the
UK, and double this when you include indirect jobs. This means
that around 25,000 jobs in the WM are aerospace.
Only measuring for SIC 30.30 ensures that much activity that is
primarily for aerospace is not recorded. This aerospace activity is
disguised as ‘metal working’ or ‘electro-mechanical equipment’.
£43
£121
£74
£0
£20
£40
£60
£80
£100
£120
£140
BCLEP CWLEP GBSLEP
GVA by WMCA LEP area (£millions)
83
8. Decent work and economic growth - Promote sustained, inclusive and sustainable economic growth, full and productive employment and decent work for all
Aerospace Industry Profile
Our Competitive Advantage
25% of UK aerospace sector is based in the Midlands (7% of Europe’s & 3% of the world’s)
Midlands Aerospace Alliance (over 300 members) represents the largest aerospace cluster in Europe
WM represents around 10% all UK aerospace jobs
High quality, sector focused science & research facilities and institutes, mainly used by OEMs.
Unrivalled lead in component design and manufacture
Base of aerospace companies throughout a well-integrated supply chain.
Close proximity to Rolls Royce global HQ & production centre in Derby.
Good connectivity with well developed road and train network and international airport
The WM region has export expertise in machinery & transport goods (71% of all goods exports compared to 41%
nationally)
Strong position in aerospace’s growth sectors (e.g. strengths in supplying large civil aircraft).
Products , Services & Brands
UTC Aerospace Systems – Specialise in wing and engine actuation and heat exchangers
Meggitt – focus on wheel and brake, fluid conveyance and heat exchangers.
Rolls Royce – Engine control systems and mechanical parts, defence engines repair and overhaul.
Moog – wing actuation, helicopter rotor actuation.
Timet – Titanium for aircraft engines.
Arconic – aerostructures
Local manufacturers are focused on the development of high technology systems, engines and motors,
components and control systems.
Between 2014-17 there was 5 major aerospace FDI projects, creating 191 jobs & safeguarding 97.
Coventry & Warwickshire Aerospace Forum – a grouping of advanced engineering businesses collaborating with
leading UK universities and associations
Major new factory local moves/modernisations in recent years: Moog to i54, R-R to Birmingham Business Park,
Meggitt to Ansty Park (£130m facility operational by 2019)
Centres of Excellence/Assets
Innovation:
The National Transport Design Centre, Coventry
MIRA Technology Park (inc. Southern Extension with
CWLEP investment); Advanced Propulsion Centre
Wton Science, Technology & Prototyping Centre
Rolls-Royce University Technology Centre, Birmingham
National Battery Prototype Centre, Warwick
Engineering and Computer Science Research Centre
Centre for Manufacturing and Materials Engineering,
Coventry. High Temperature Research Centre, UoB/Ansty
The Proving Factory, Coventry
Production:
Institute For Advanced Manufacturing and Engineering
Warwick Manufacturing Group
Manufacturing Technology Centre
Training:
EEF Technology Training Centre
WMG Academy for Young Engineers
Black Country Skills Factory
The Aerospace Academy, Solihull College
Centre for Advanced Aeronautical Provision
84
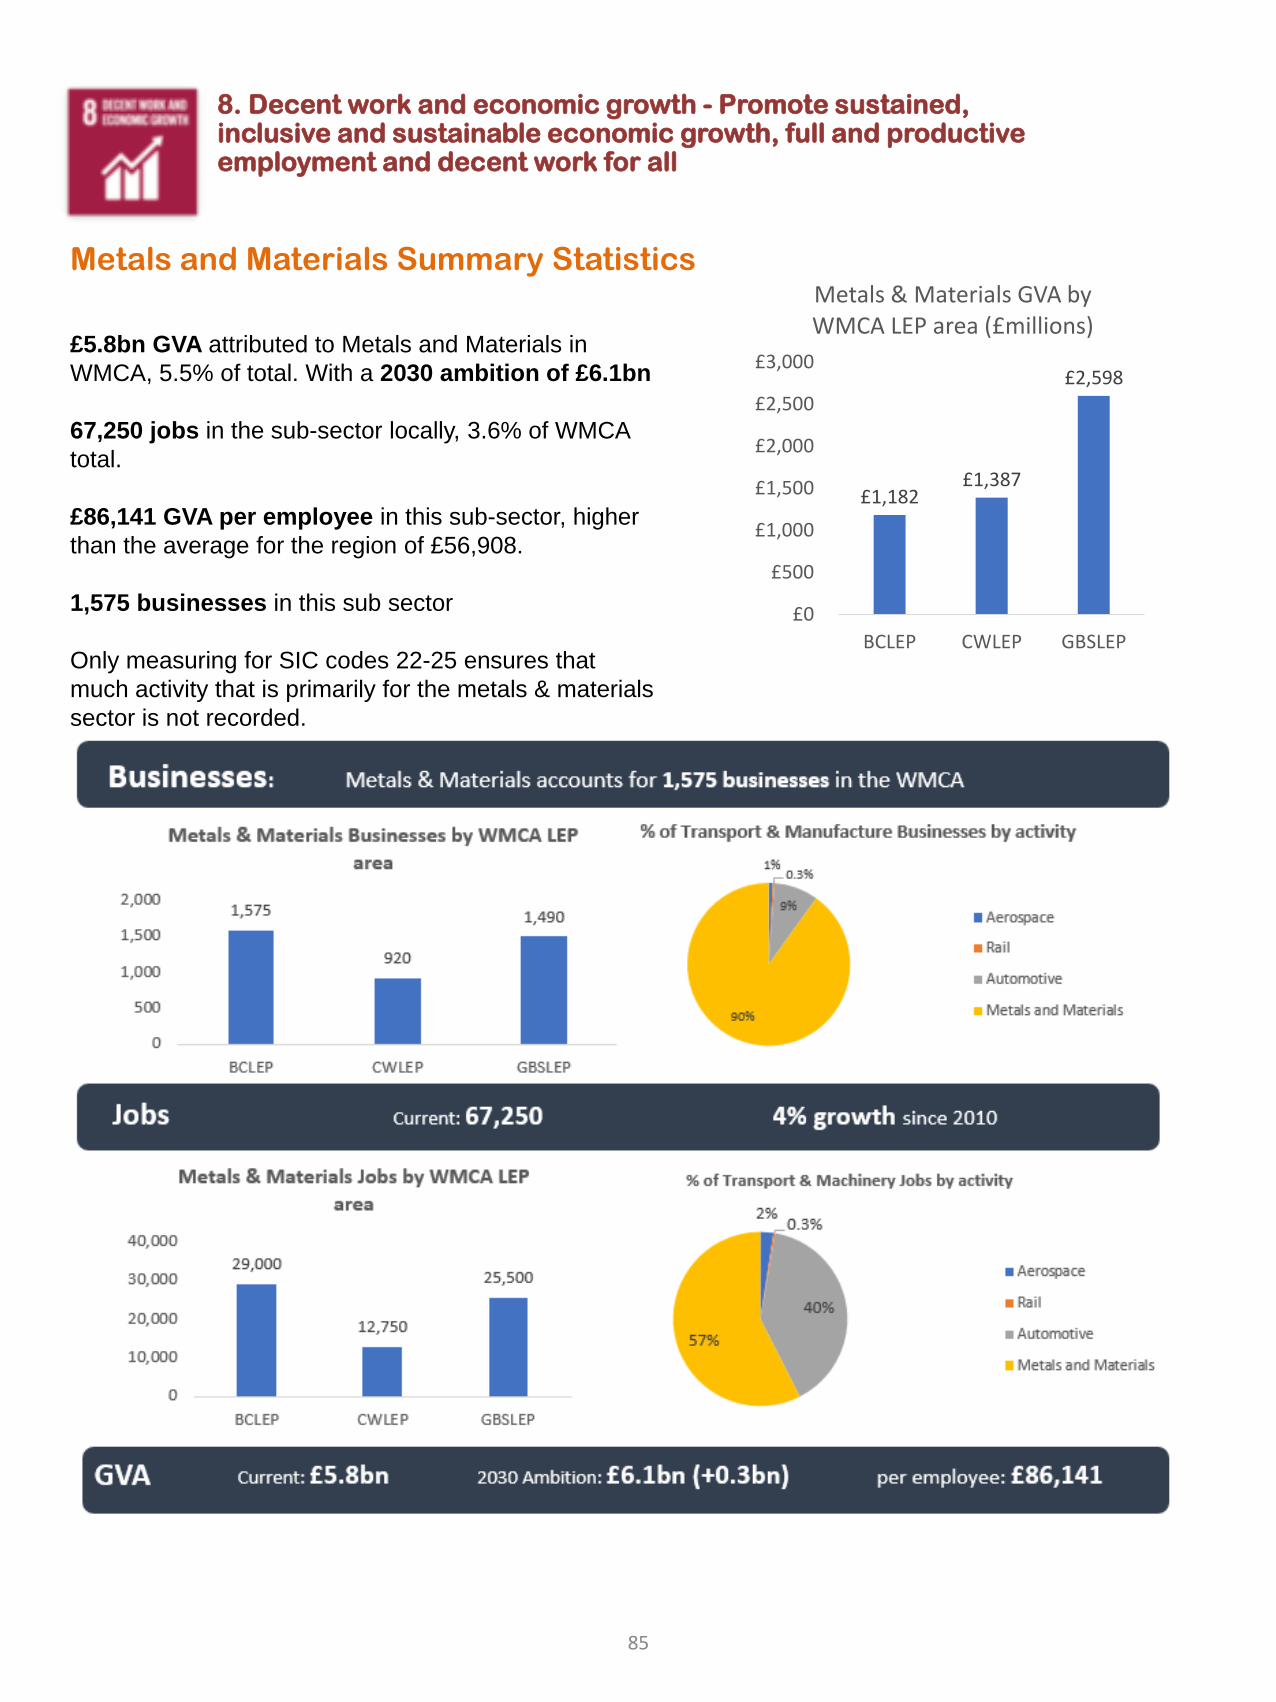
8. Decent work and economic growth - Promote sustained, inclusive and sustainable economic growth, full and productive employment and decent work for all
Metals and Materials Summary Statistics
£5.8bn GVA attributed to Metals and Materials in
WMCA, 5.5% of total. With a 2030 ambition of £6.1bn
67,250 jobs in the sub-sector locally, 3.6% of WMCA
total.
£86,141 GVA per employee in this sub-sector, higher
than the average for the region of £56,908.
1,575 businesses in this sub sector
Only measuring for SIC codes 22-25 ensures that
much activity that is primarily for the metals & materials
sector is not recorded.
£1,182 £1,387
£2,598
£0
£500
£1,000
£1,500
£2,000
£2,500
£3,000
BCLEP CWLEP GBSLEP
Metals & Materials GVA by WMCA LEP area (£millions)
85
8. Decent work and economic growth - Promote sustained, inclusive and sustainable economic growth, full and productive employment and decent work for all
Metals and Materials Industry Profile
Our Competitive AdvantageHistoric presence within metals & materials manufacturing & metals treatment, leading to a significant concentration of infrastructure like furnaces and foundries. Leading innovation from the region’s universities is helping develop materials for industrial use and future applications. The significant presence of automotive, aerospace and rail in the area ensures a strong number of metals & materials firms, feeding into these industries’ supply chains. There is widespread demand for these products locally. Good connectivity with well developed road and train network and international airportHighly concentrated industry in WMMajor infrastructure investments in the region (HS2 etc).The West Midlands has the largest concentration of materials related jobs in the UK. (WMGC)The WM region has export expertise in machinery & transport goods (71% of all goods exports compared to 41% nationally)Representation from key industry bodies locally – e.g. UK Metals Council, RAPRA
Products , Services & Brands
Assa Abloy - World’s largest lock manufacturerMitsubishi Chemical Carbon Fiber and Composites – Key suppliers in manufacturing specialist materials. Nord Composites – Major composite material business, specialising in sealant and adhesive materials.Precision Chains make the chains for the London Underground escalators.RMD Kwikform helped install the roof of the Aquatics Centre for London 2012.ZF Lemforder’s Darlaston factory supplies suspension control arms to Jaguar,
Centres of Excellence/Assets
Innovation:The National Transport Design Centre, CoventryMIRA Technology ParkAdvanced Propulsion Centre Wton Science, Technology & Prototyping CentreRolls-Royce University Technology Centre, BirminghamEngineering and Computer Science Research Centre Automotive Composites Research Centre
Production: Institute For Advanced Manufacturing and Engineering
Warwick Manufacturing GroupManufacturing Technology CentreAdvanced materials characterisation and simulation hub (AMCASH) Alternative Raw Materials with Low Impact
Training:EEF Technology Training CentreWMG Academy for Young Engineers Black Country Skills Factory
86
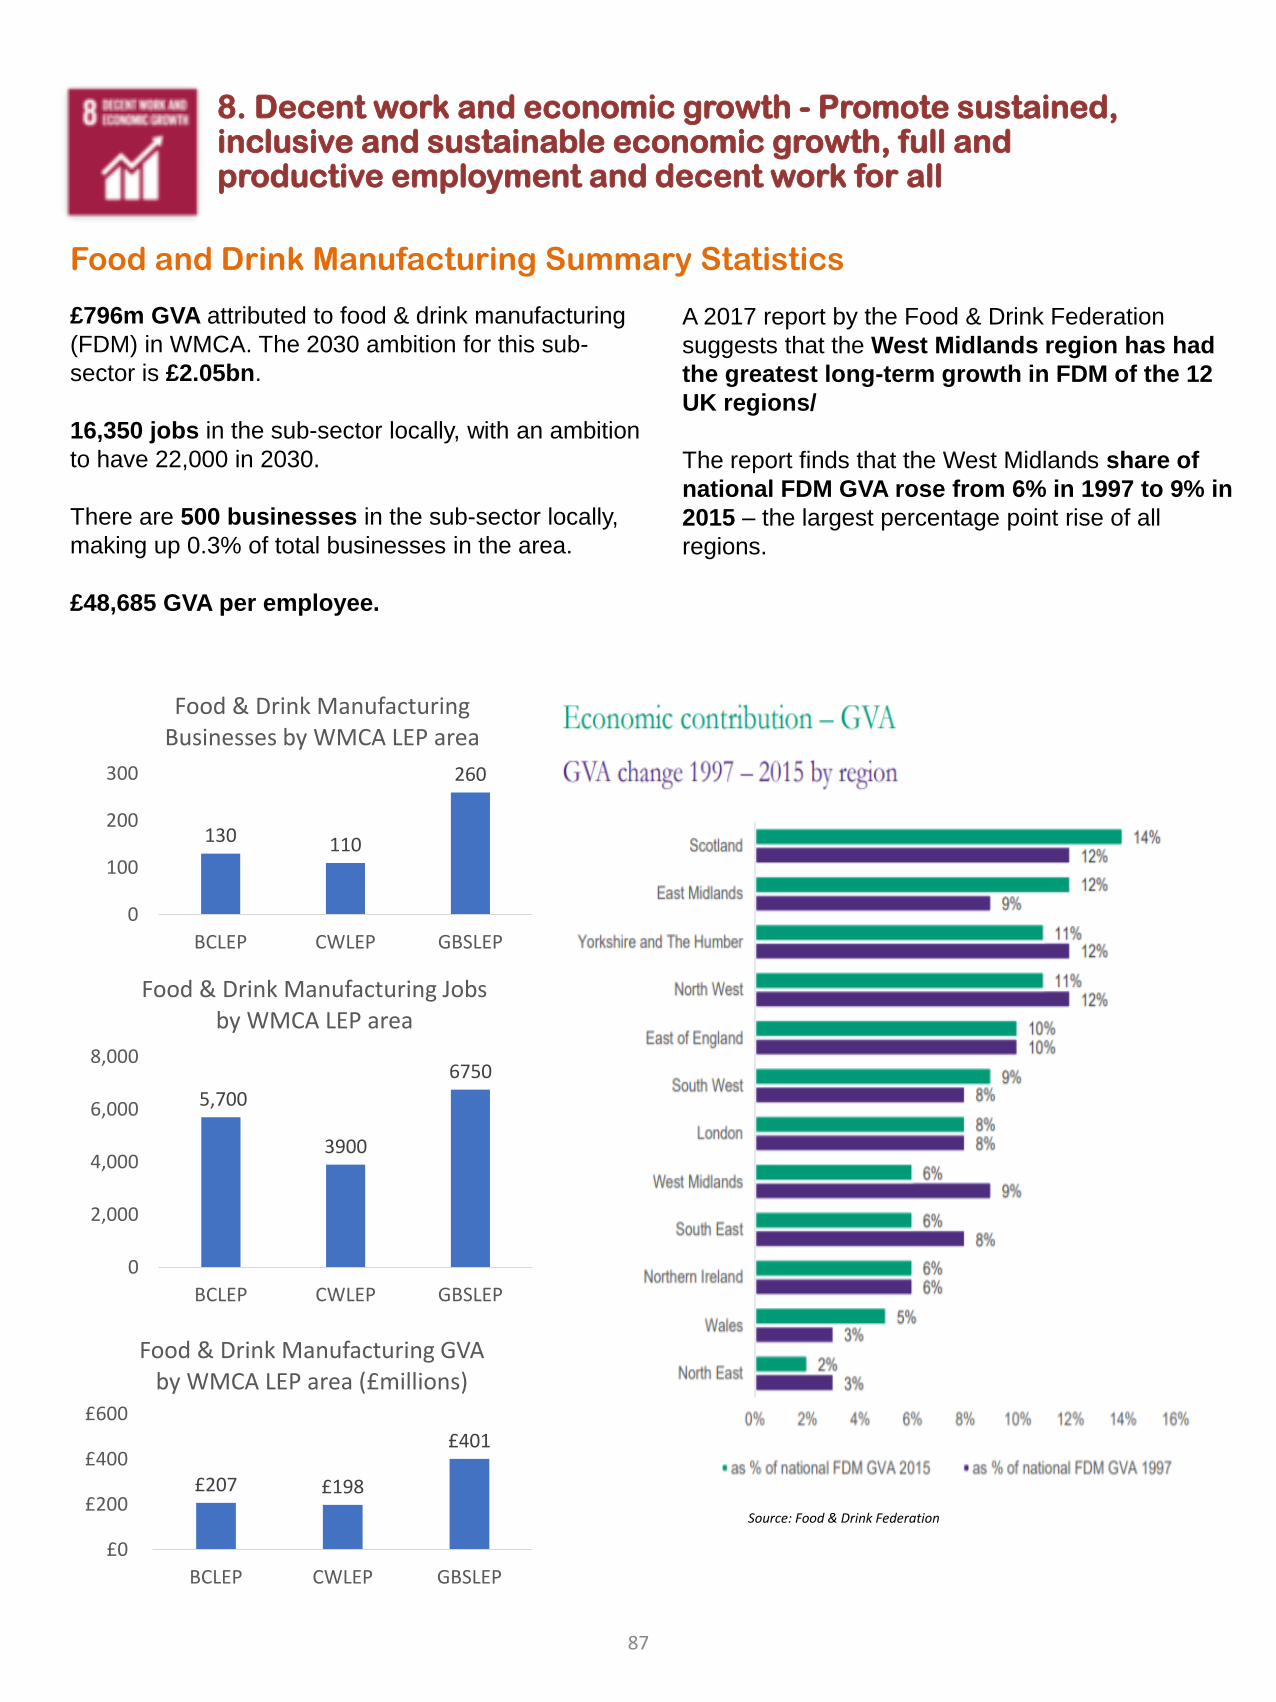
8. Decent work and economic growth - Promote sustained, inclusive and sustainable economic growth, full and productive employment and decent work for all
Food and Drink Manufacturing Summary Statistics
£796m GVA attributed to food & drink manufacturing
(FDM) in WMCA. The 2030 ambition for this sub-
sector is £2.05bn.
16,350 jobs in the sub-sector locally, with an ambition
to have 22,000 in 2030.
There are 500 businesses in the sub-sector locally,
making up 0.3% of total businesses in the area.
£48,685 GVA per employee.
A 2017 report by the Food & Drink Federation
suggests that the West Midlands region has had
the greatest long-term growth in FDM of the 12
UK regions/
The report finds that the West Midlands share of
national FDM GVA rose from 6% in 1997 to 9% in
2015 – the largest percentage point rise of all
regions.
£207 £198
£401
£0
£200
£400
£600
BCLEP CWLEP GBSLEP
Food & Drink Manufacturing GVA by WMCA LEP area (£millions)
130 110
260
0
100
200
300
BCLEP CWLEP GBSLEP
Food & Drink Manufacturing Businesses by WMCA LEP area
5,700
3900
6750
0
2,000
4,000
6,000
8,000
BCLEP CWLEP GBSLEP
Food & Drink Manufacturing Jobs by WMCA LEP area
Source: Food & Drink Federation
87
8. Decent work and economic growth - Promote sustained, inclusive and sustainable economic growth, full and productive employment and decent work for all
Food and Drink Industry Profile
Our Competitive Advantage
Access to a large domestic market, a long pedigree in production and R&D and a first-class logistical network.Supply chain centre with large cluster of logistics companies and major supermarkets distribution.Skills and experience in the food supply chain and processing. Good connectivity with well developed road and train network and international airport.Strong food and drink within local universities, notably Birmingham University’s Formulation Engineering
Department and UCB’s Food Innovation Facility.Strong tradition of photonics R&DLeader in food and drink machinery & equipmentA strong base of fast growing SMEs and micro businesses which are driving growth and job creation.
Products , Services & Brands
Birthplace of great British food and drink icons Cadbury, Typhoo Tea, Bird’s Custard & Marston's. East End Foods alone produces 30,000 lines for more than 3,500 retailers and is one of the largest importers and suppliers of ethnic foods in Europe. Mondelez International houses its global chocolate research and development centre at Bournville. Healthy levels of inward investment, with over 25 new food and drink FDI projects in the West Midlands since 2009 Burton-on-Trent is the home of brewing in the UK
Centres of Excellence/AssetsInnovation:W’ton Science, Technology & Prototyping CentreEngineering and Computer Science Research Centre Food Science research at University College BirminghamUCB’s Food Innovation FacilityProduction: Institute For Advanced Manufacturing and EngineeringWarwick Manufacturing GroupManufacturing Technology Centre
Birmingham University’s Formulation Engineering DepartmentFood and Drink Advanced Manufacturing Project, James Watt College (BMET)Food Technology Hub for Skills Excellence, University College BirminghamTraining:EEF Technology Training CentreWMG Academy for Young Engineers Black Country Skills Factory
88
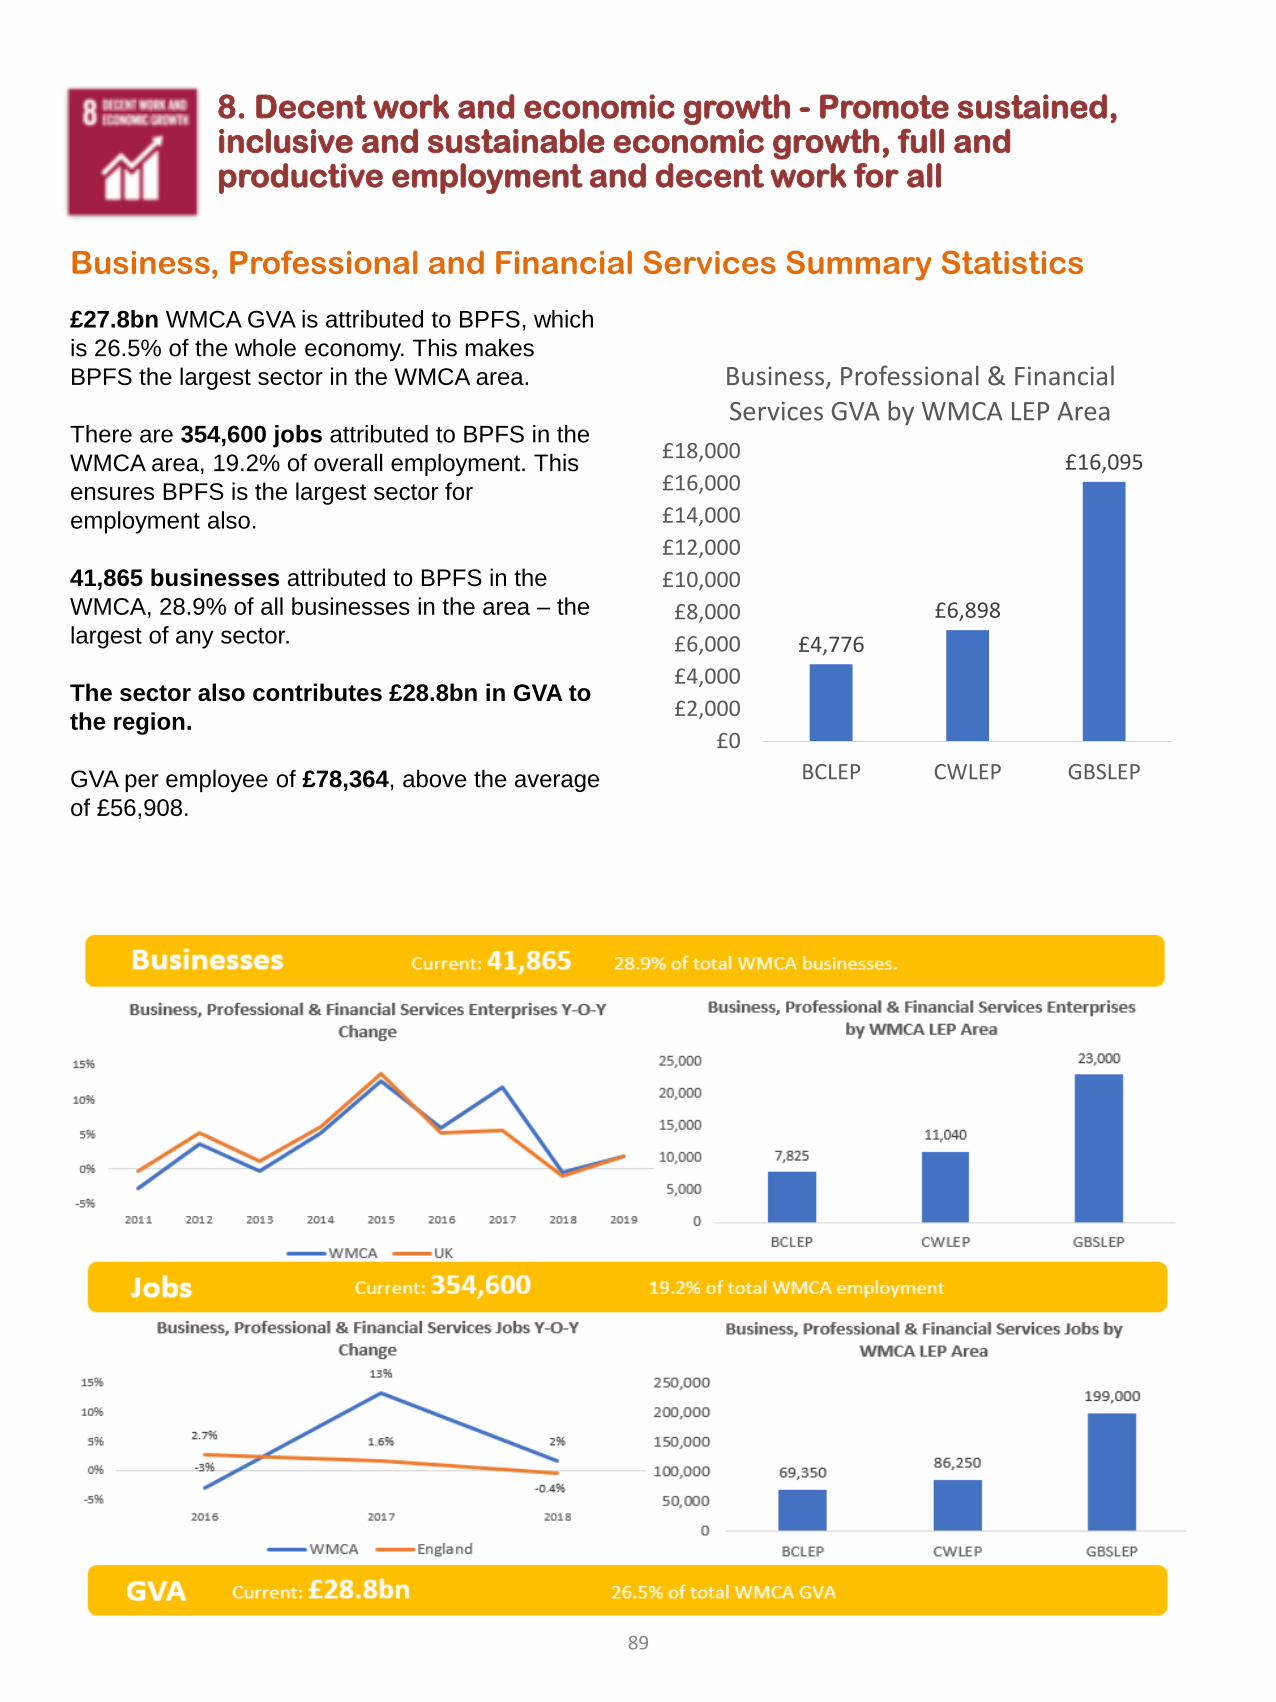
8. Decent work and economic growth - Promote sustained, inclusive and sustainable economic growth, full and productive employment and decent work for all
Business, Professional and Financial Services Summary Statistics
£27.8bn WMCA GVA is attributed to BPFS, which
is 26.5% of the whole economy. This makes
BPFS the largest sector in the WMCA area.
There are 354,600 jobs attributed to BPFS in the
WMCA area, 19.2% of overall employment. This
ensures BPFS is the largest sector for
employment also.
41,865 businesses attributed to BPFS in the
WMCA, 28.9% of all businesses in the area – the
largest of any sector.
The sector also contributes £28.8bn in GVA to
the region.
GVA per employee of £78,364, above the average
of £56,908.
£4,776
£6,898
£16,095
£0
£2,000
£4,000
£6,000
£8,000
£10,000
£12,000
£14,000
£16,000
£18,000
BCLEP CWLEP GBSLEP
Business, Professional & Financial Services GVA by WMCA LEP Area
89
8. Decent work and economic growth - Promote sustained, inclusive and sustainable economic growth, full and productive employment and decent work for all
Financial Services Industry Profile
Our Competitive AdvantageRe-location of large firms (HSBC)Birmingham is the only full-service UK offering outside London where any services can be accessedStrong talent pool & excellent links to LondonUK’s largest regional banking and professional services cluster.Readily available cutting-edge city centre office space in new developments across the region. More business students – 16,275 – than any city outside London. City-Redi deep dive found that the West Midlands has a different distribution of occupations to the national picture, with a higher skilled, higher value profile of occupations. The recent growth in building offer such as Snowhill frees up other high quality offices and there is a movement up the value chain, this opens up better office accommodation for the growing mid tier (City –Redi deep dive)
Products , Services & BrandsHome to HSBC’s new ring-fenced UK banking headquartersDeutsche BankMajor banking offices such as Lloyds Bank & BarclaysFull-service offeringServices match local specialisation and the local client base, i.e. advanced manufacturing advice and guidance, exporting etc.Islamic Finance - Britain’s first sharia compliant retail bank is headquartered in Birmingham
Centres of Excellence/AssetsBusiness SchoolsWarwick Business SchoolBirmingham Business SchoolAston Business SchoolCoventry Business SchoolWolverhampton Business SchoolCollegesProfessional Services Academy, BMetTrade RepresentativesBPS Birmingham The CityUK
LEP Programmes/Investment Invest Black CountryDY5 Enterprise ZoneBlack Country Growth Hubi9 WolverhamptonBlack Country Transformational GOLDFriargate, Coventry Black Country Innovation Fund (pipeline)Wolverhampton City Council Broadband (pipeline)
90
8. Decent work and economic growth - Promote sustained, inclusive and sustainable economic growth, full and productive employment and decent work for all
Legal and Accounting Services Industry Profile
Products , Services & Brands
PWC’s largest regional office is set to house 2,400 people
Charter Court Financial Services owns Precise Mortgages, an intermediary mortgage lender and
Charter Savings Bank, one of the UK’s leading challenger banks with over 40,000 savings accounts
and balances in excess of £2billion since its launch in March 2015.
All of the “big 4” with major operations in Birmingham
Our Competitive Advantage
Re-location of large firms (PWC investment)
Only full-service UK offering outside London
Strong talent pool & excellent links to London
UK’s largest regional legal & insurance cluster and the largest accountancy cluster outside
London.
Readily available cutting-edge city centre office space in new developments across the region.
Birmingham is in the top 3 cities (outside London) for both legal sector floorspace, number of legal
offices and number of fee earners.
Centres of Excellence/Assets
Business Schools
Warwick Business School
Birmingham Business School
Aston Business School
Colleges
Professional Services Academy, BMet
Trade Representatives
BPS Birmingham
LEP Programmes/Investment
Invest Black Country
DY5 Enterprise Zone
Black Country Growth Hub
i9 Wolverhampton
Friargate, Coventry
Black Country Transformational GOLD
Black Country Innovation Fund (pipeline)
Wolverhampton City Council Broadband (pipeline)
91
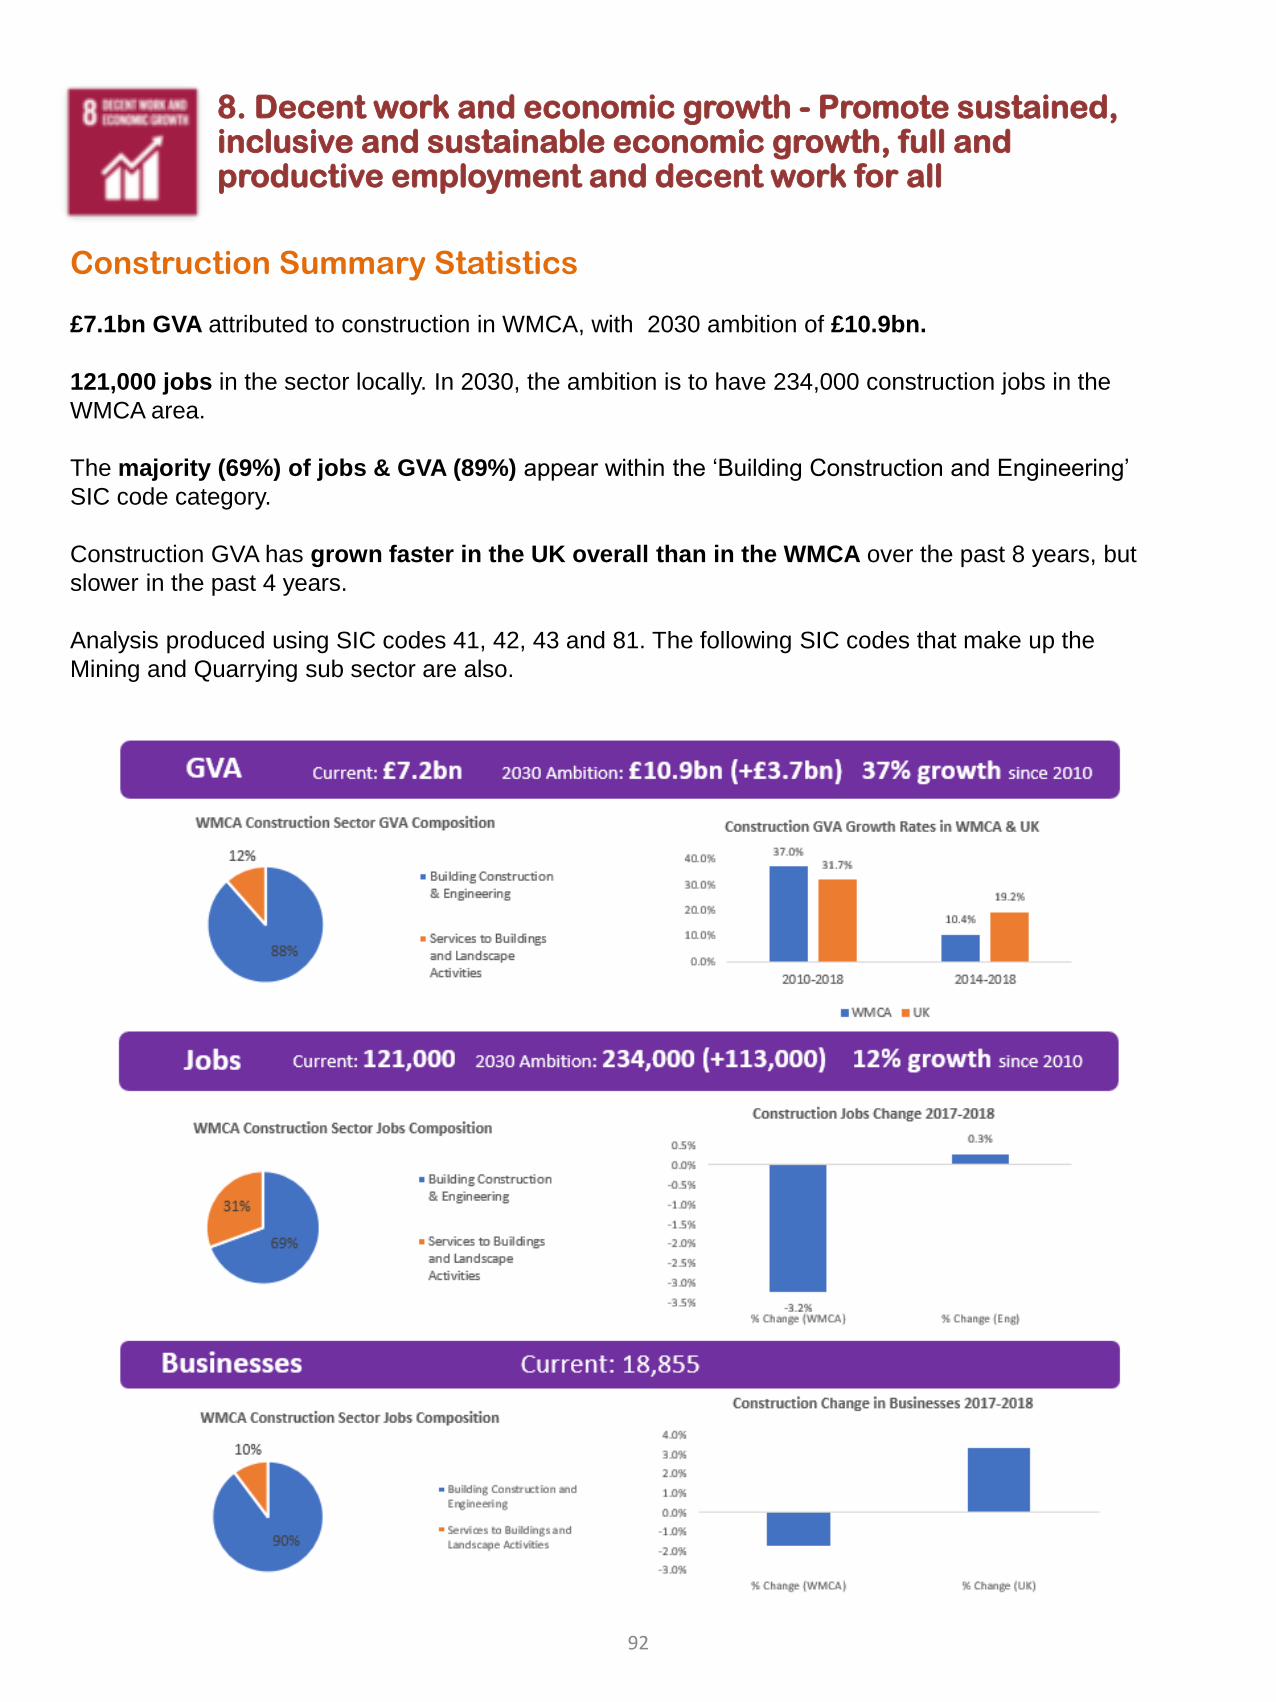
8. Decent work and economic growth - Promote sustained, inclusive and sustainable economic growth, full and productive employment and decent work for all
Construction Summary Statistics
£7.1bn GVA attributed to construction in WMCA, with 2030 ambition of £10.9bn.
121,000 jobs in the sector locally. In 2030, the ambition is to have 234,000 construction jobs in the
WMCA area.
The majority (69%) of jobs & GVA (89%) appear within the ‘Building Construction and Engineering’
SIC code category.
Construction GVA has grown faster in the UK overall than in the WMCA over the past 8 years, but
slower in the past 4 years.
Analysis produced using SIC codes 41, 42, 43 and 81. The following SIC codes that make up the
Mining and Quarrying sub sector are also.
92
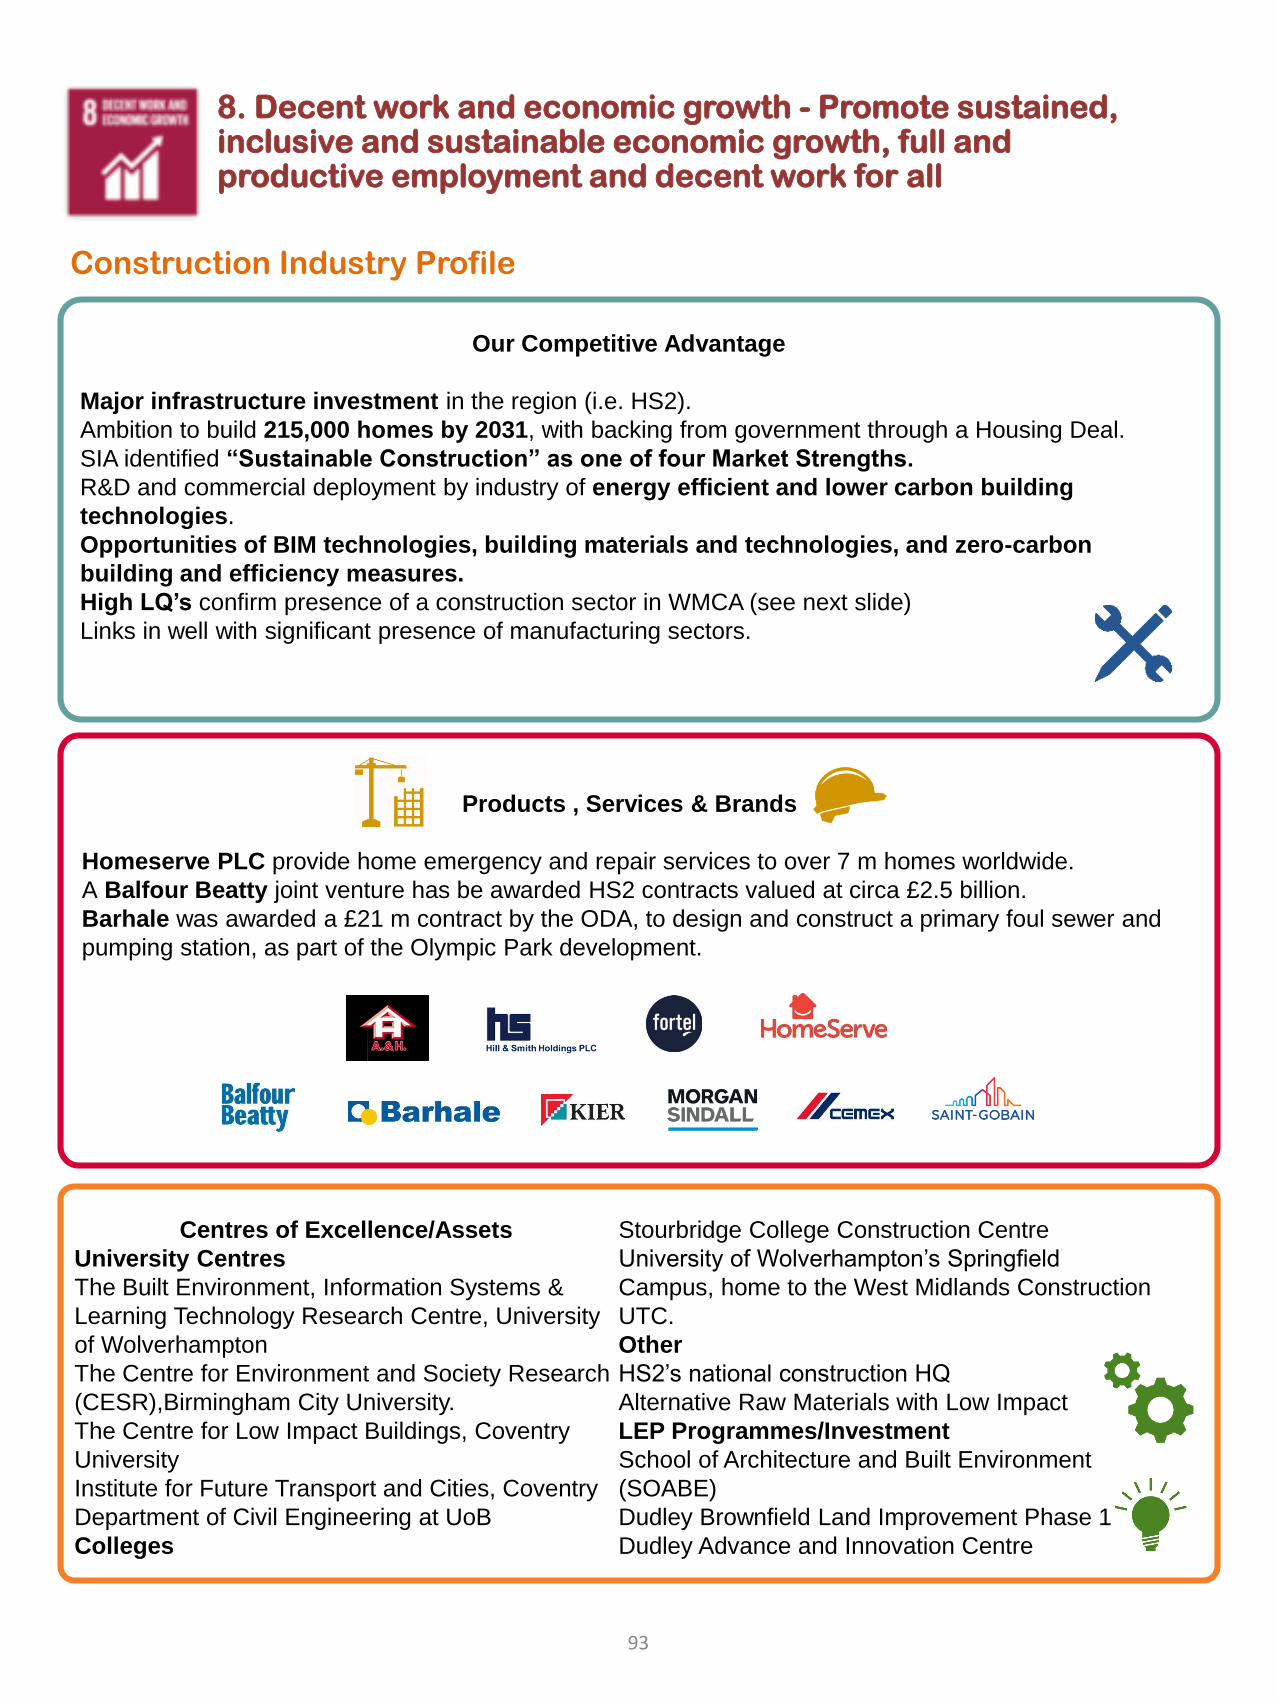
8. Decent work and economic growth - Promote sustained, inclusive and sustainable economic growth, full and productive employment and decent work for all
Construction Industry Profile
Our Competitive Advantage
Major infrastructure investment in the region (i.e. HS2).
Ambition to build 215,000 homes by 2031, with backing from government through a Housing Deal.
SIA identified “Sustainable Construction” as one of four Market Strengths.
R&D and commercial deployment by industry of energy efficient and lower carbon building
technologies.
Opportunities of BIM technologies, building materials and technologies, and zero-carbon
building and efficiency measures.
High LQ’s confirm presence of a construction sector in WMCA (see next slide)
Links in well with significant presence of manufacturing sectors.
Products , Services & Brands
Homeserve PLC provide home emergency and repair services to over 7 m homes worldwide.
A Balfour Beatty joint venture has be awarded HS2 contracts valued at circa £2.5 billion.
Barhale was awarded a £21 m contract by the ODA, to design and construct a primary foul sewer and
pumping station, as part of the Olympic Park development.
Centres of Excellence/Assets
University Centres
The Built Environment, Information Systems &
Learning Technology Research Centre, University
of Wolverhampton
The Centre for Environment and Society Research
(CESR),Birmingham City University.
The Centre for Low Impact Buildings, Coventry
University
Institute for Future Transport and Cities, Coventry
Department of Civil Engineering at UoB
Colleges
Stourbridge College Construction Centre
University of Wolverhampton’s Springfield
Campus, home to the West Midlands Construction
UTC.
Other
HS2’s national construction HQ
Alternative Raw Materials with Low Impact
LEP Programmes/Investment
School of Architecture and Built Environment
(SOABE)
Dudley Brownfield Land Improvement Phase 1
Dudley Advance and Innovation Centre
93
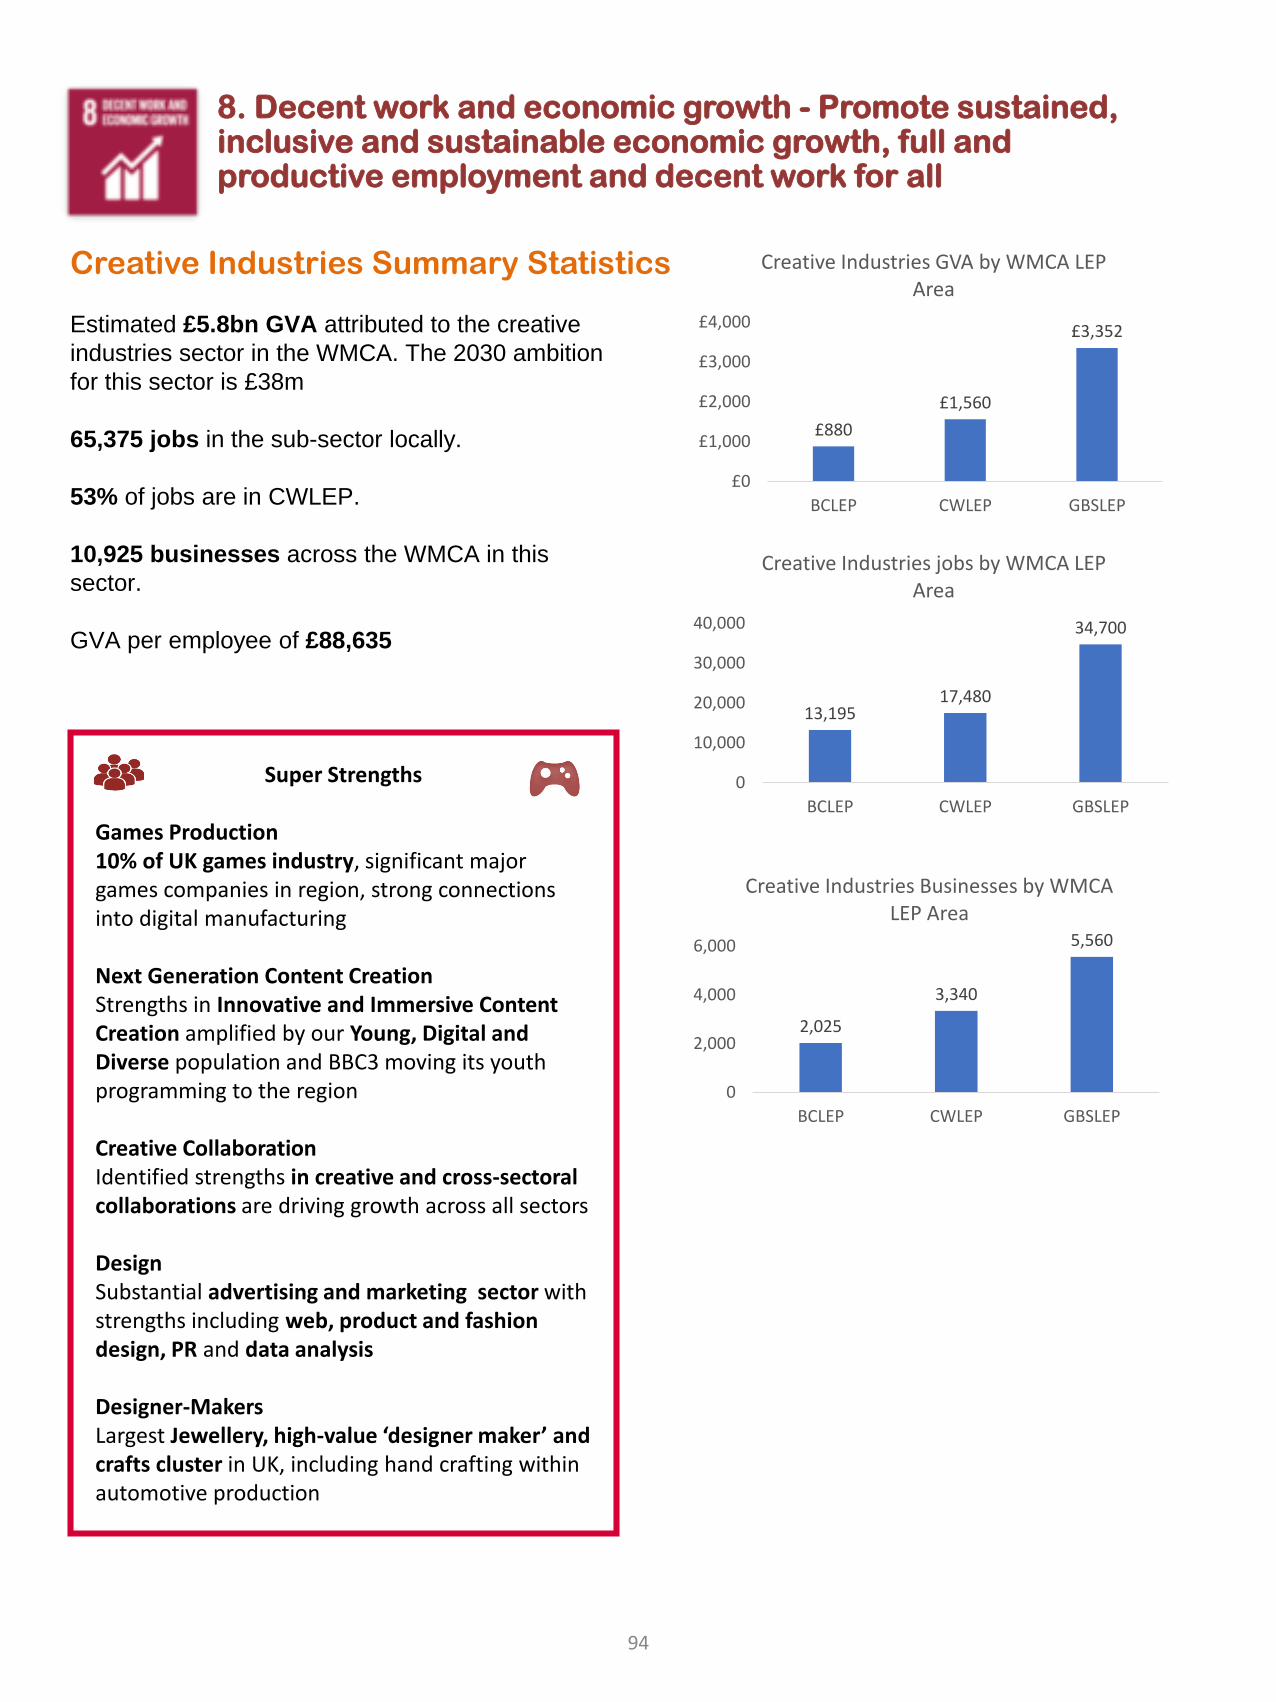
8. Decent work and economic growth - Promote sustained, inclusive and sustainable economic growth, full and productive employment and decent work for all
Creative Industries Summary Statistics
Estimated £5.8bn GVA attributed to the creative
industries sector in the WMCA. The 2030 ambition
for this sector is £38m
65,375 jobs in the sub-sector locally.
53% of jobs are in CWLEP.
10,925 businesses across the WMCA in this
sector.
GVA per employee of £88,635
£880
£1,560
£3,352
£0
£1,000
£2,000
£3,000
£4,000
BCLEP CWLEP GBSLEP
Creative Industries GVA by WMCA LEP Area
13,19517,480
34,700
0
10,000
20,000
30,000
40,000
BCLEP CWLEP GBSLEP
Creative Industries jobs by WMCA LEP Area
2,025
3,340
5,560
0
2,000
4,000
6,000
BCLEP CWLEP GBSLEP
Creative Industries Businesses by WMCA LEP Area
Super Strengths
Games Production10% of UK games industry, significant major games companies in region, strong connections into digital manufacturing
Next Generation Content CreationStrengths in Innovative and Immersive Content Creation amplified by our Young, Digital and Diverse population and BBC3 moving its youth programming to the region
Creative CollaborationIdentified strengths in creative and cross-sectoral collaborations are driving growth across all sectors
DesignSubstantial advertising and marketing sector with strengths including web, product and fashion design, PR and data analysis
Designer-MakersLargest Jewellery, high-value ‘designer maker’ and crafts cluster in UK, including hand crafting within automotive production
94
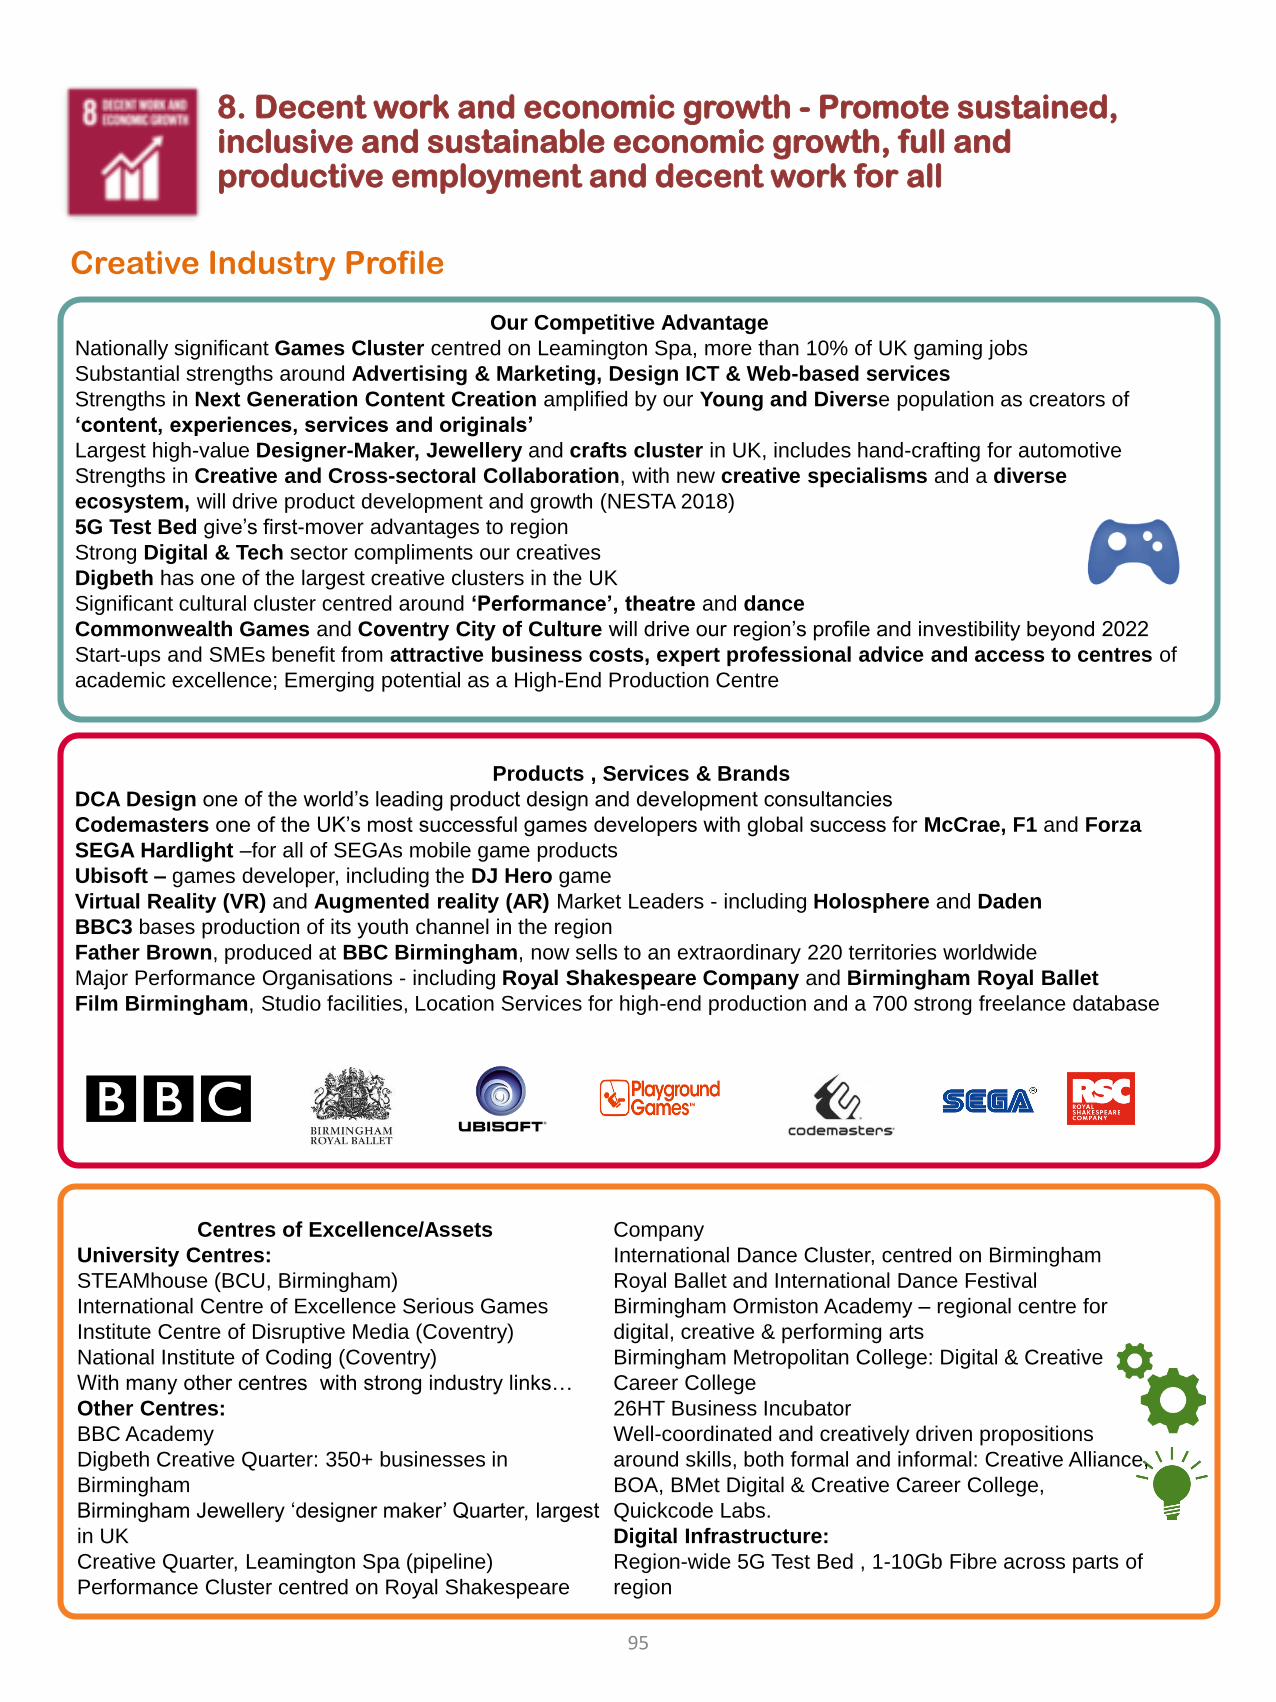
8. Decent work and economic growth - Promote sustained, inclusive and sustainable economic growth, full and productive employment and decent work for all
95
Creative Industry Profile
95
Our Competitive Advantage
Nationally significant Games Cluster centred on Leamington Spa, more than 10% of UK gaming jobs
Substantial strengths around Advertising & Marketing, Design ICT & Web-based services
Strengths in Next Generation Content Creation amplified by our Young and Diverse population as creators of
‘content, experiences, services and originals’
Largest high-value Designer-Maker, Jewellery and crafts cluster in UK, includes hand-crafting for automotive
Strengths in Creative and Cross-sectoral Collaboration, with new creative specialisms and a diverse
ecosystem, will drive product development and growth (NESTA 2018)
5G Test Bed give’s first-mover advantages to region
Strong Digital & Tech sector compliments our creatives
Digbeth has one of the largest creative clusters in the UK
Significant cultural cluster centred around ‘Performance’, theatre and dance
Commonwealth Games and Coventry City of Culture will drive our region’s profile and investibility beyond 2022
Start-ups and SMEs benefit from attractive business costs, expert professional advice and access to centres of
academic excellence; Emerging potential as a High-End Production Centre
Products , Services & Brands
DCA Design one of the world’s leading product design and development consultancies
Codemasters one of the UK’s most successful games developers with global success for McCrae, F1 and Forza
SEGA Hardlight –for all of SEGAs mobile game products
Ubisoft – games developer, including the DJ Hero game
Virtual Reality (VR) and Augmented reality (AR) Market Leaders - including Holosphere and Daden
BBC3 bases production of its youth channel in the region
Father Brown, produced at BBC Birmingham, now sells to an extraordinary 220 territories worldwide
Major Performance Organisations - including Royal Shakespeare Company and Birmingham Royal Ballet
Film Birmingham, Studio facilities, Location Services for high-end production and a 700 strong freelance database
Centres of Excellence/Assets
University Centres:
STEAMhouse (BCU, Birmingham)
International Centre of Excellence Serious Games
Institute Centre of Disruptive Media (Coventry)
National Institute of Coding (Coventry)
With many other centres with strong industry links…
Other Centres:
BBC Academy
Digbeth Creative Quarter: 350+ businesses in
Birmingham
Birmingham Jewellery ‘designer maker’ Quarter, largest
in UK
Creative Quarter, Leamington Spa (pipeline)
Performance Cluster centred on Royal Shakespeare
Company
International Dance Cluster, centred on Birmingham
Royal Ballet and International Dance Festival
Birmingham Ormiston Academy – regional centre for
digital, creative & performing arts
Birmingham Metropolitan College: Digital & Creative
Career College
26HT Business Incubator
Well-coordinated and creatively driven propositions
around skills, both formal and informal: Creative Alliance,
BOA, BMet Digital & Creative Career College,
Quickcode Labs.
Digital Infrastructure:
Region-wide 5G Test Bed , 1-10Gb Fibre across parts of
region
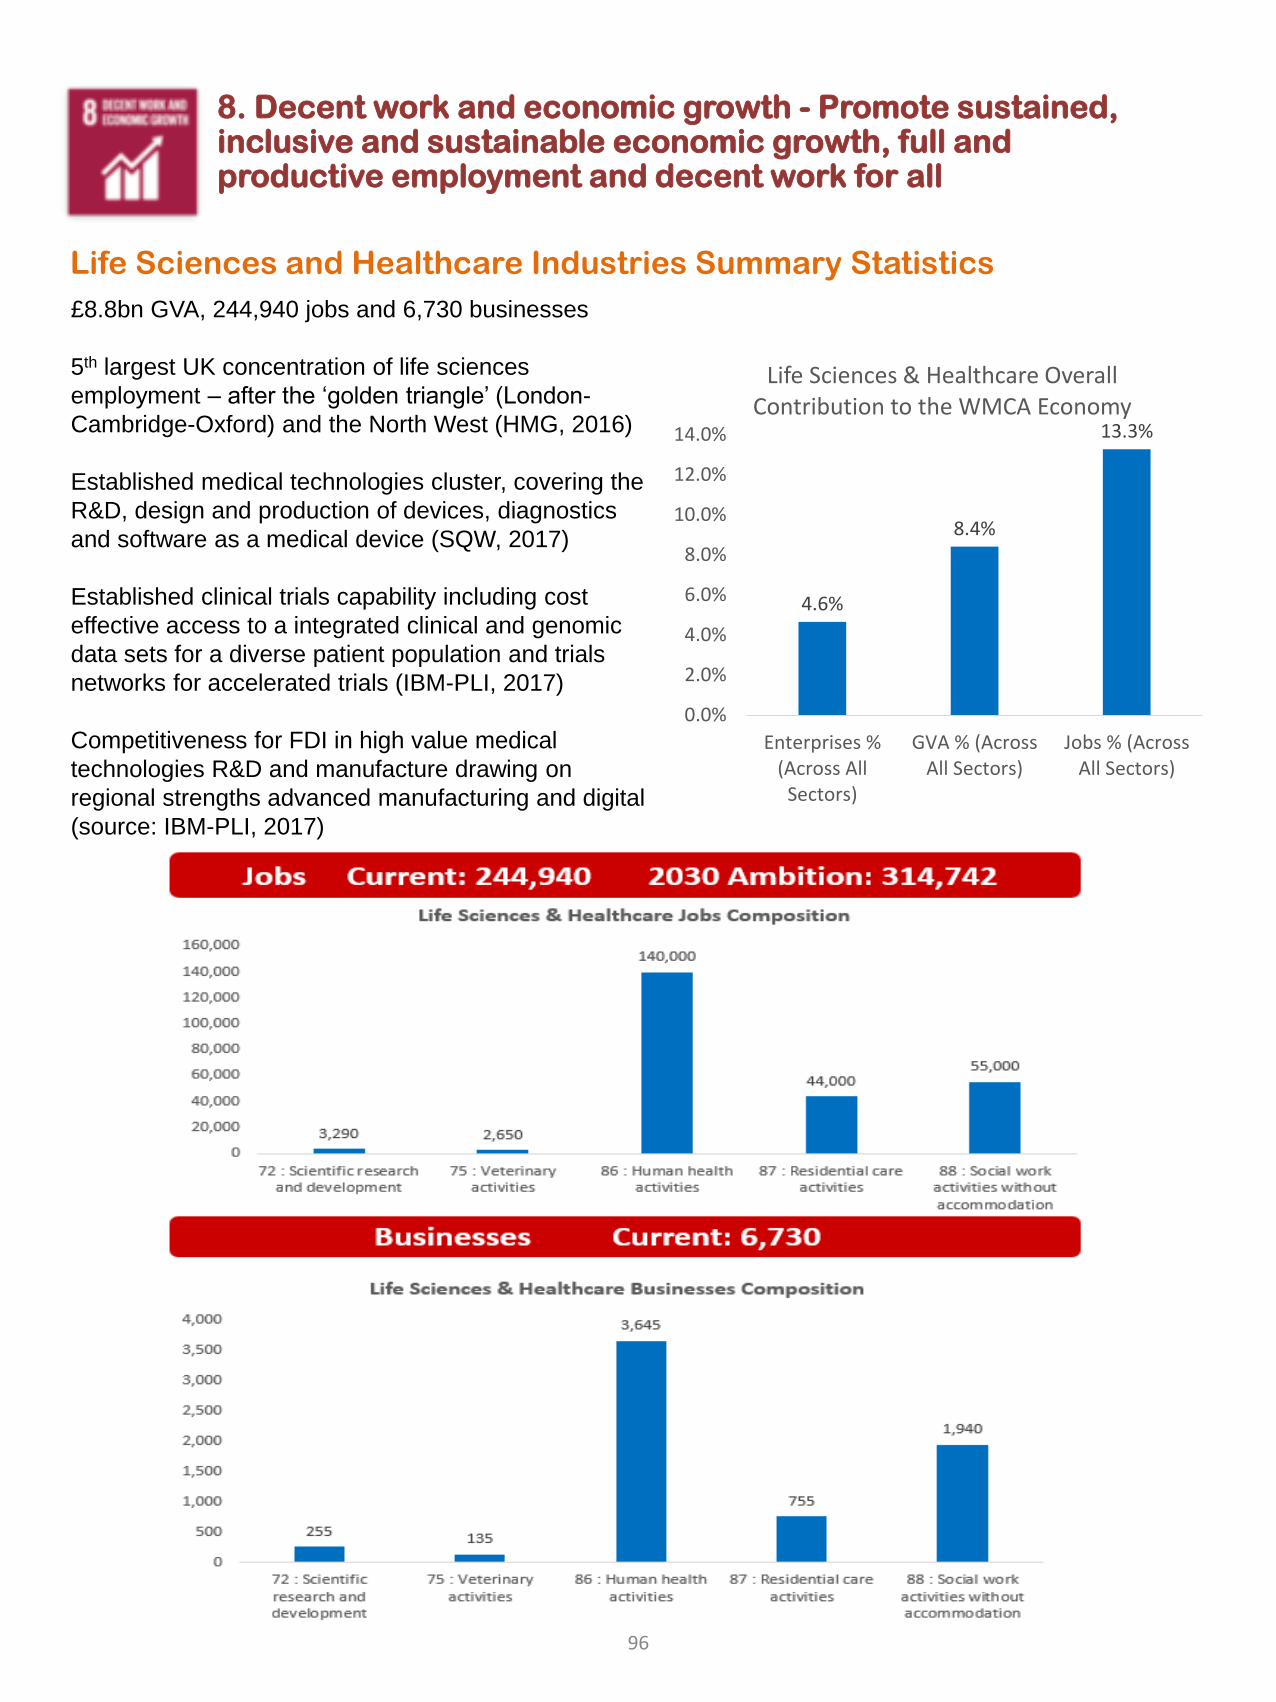
8. Decent work and economic growth - Promote sustained, inclusive and sustainable economic growth, full and productive employment and decent work for all
96
Life Sciences and Healthcare Industries Summary Statistics
£8.8bn GVA, 244,940 jobs and 6,730 businesses
5th largest UK concentration of life sciences
employment – after the ‘golden triangle’ (London-
Cambridge-Oxford) and the North West (HMG, 2016)
Established medical technologies cluster, covering the
R&D, design and production of devices, diagnostics
and software as a medical device (SQW, 2017)
Established clinical trials capability including cost
effective access to a integrated clinical and genomic
data sets for a diverse patient population and trials
networks for accelerated trials (IBM-PLI, 2017)
Competitiveness for FDI in high value medical
technologies R&D and manufacture drawing on
regional strengths advanced manufacturing and digital
(source: IBM-PLI, 2017)
4.6%
8.4%
13.3%
0.0%
2.0%
4.0%
6.0%
8.0%
10.0%
12.0%
14.0%
Enterprises %(Across All
Sectors)
GVA % (AcrossAll Sectors)
Jobs % (AcrossAll Sectors)
Life Sciences & Healthcare Overall Contribution to the WMCA Economy
8. Decent work and economic growth - Promote sustained, inclusive and sustainable economic growth, full and productive employment and decent work for all
97
Life Sciences and Healthcare Industry Profile
97
Our Competitive Advantage
Industry strengths and global competitiveness for FDI in high tech medical devices R&D and
manufacture drawing on region’s innovative and high tech manufacturing capabilities (IBM-PLI, 2017)
Clinical trials and data capabilities – largest clinical trials base in Europe outside Oxford including
Cancer Trials Unit and accelerated trials networks and access to large, integrated patient data sets for
a diverse, stable population
Strength of our clinical and academic centres of excellence including the Queen Elizabeth
hospital site which is one of the largest in Europe
Strong innovation ecosystem including translational partnerships and facilities and a network of
science parks, specialist incubations and innovation support
Strong supply of graduate talent with three medical schools in the region
Products , Services & Brands
Medical devices – e.g. stoma care (Salts Healthcare), procedure packs (Kimal), orthopaedic
Specialist diagnostics e.g. immunodiagnostics (The Binding Site), cancer diagnostics, Alzheimers
Software as a medical device/digital health e.g. Safe Patient Systems, Evolyst, CCBT Ltd
Precision medicine including expertise in genetic/genomic testing and patient stratification
Clinical trials – largest clinical trials base in Europe outside Oxford
Centres of Excellence/Assets
In addition to numerous clinical and academic centres of
excellence and translational facilities covering a wide
range of disease areas:
Medical Devices - MD-TEC Medical Devices Testing and
Evaluation Centre; NIHR Trauma Management Med Tech
Cooperative; Manufacturing Technology Centre
Digital & Data - Institute of Translational Medicine; Health
Data Research UK site (HDR-UK); Four NHS Global
Digital Exemplars; West Midlands Genomic Medicine
Centre; Digital Health West Midlands; Institute of Digital
Healthcare at University of Warwick
Clinical Trials - No. of academic centres of excellence,
e.g. Aston Brain Centre; Trials Acceleration Programme -
Centre for Clinical Haematology
Graduate/College Base
3 Medical Schools (UoB, Warwick and Aston);
Advanced Life Sciences @ Solihull College
Specialist incubation, innovation support and clusters
Life Sciences Park in Edgbaston, Birmingham; The
BioHub Birmingham; Serendip® Digital Health Incubator
@ Innovation Birmingham; Edgbaston Medical Quarter
WMAHSN Meridian Innovation & Adoption Service
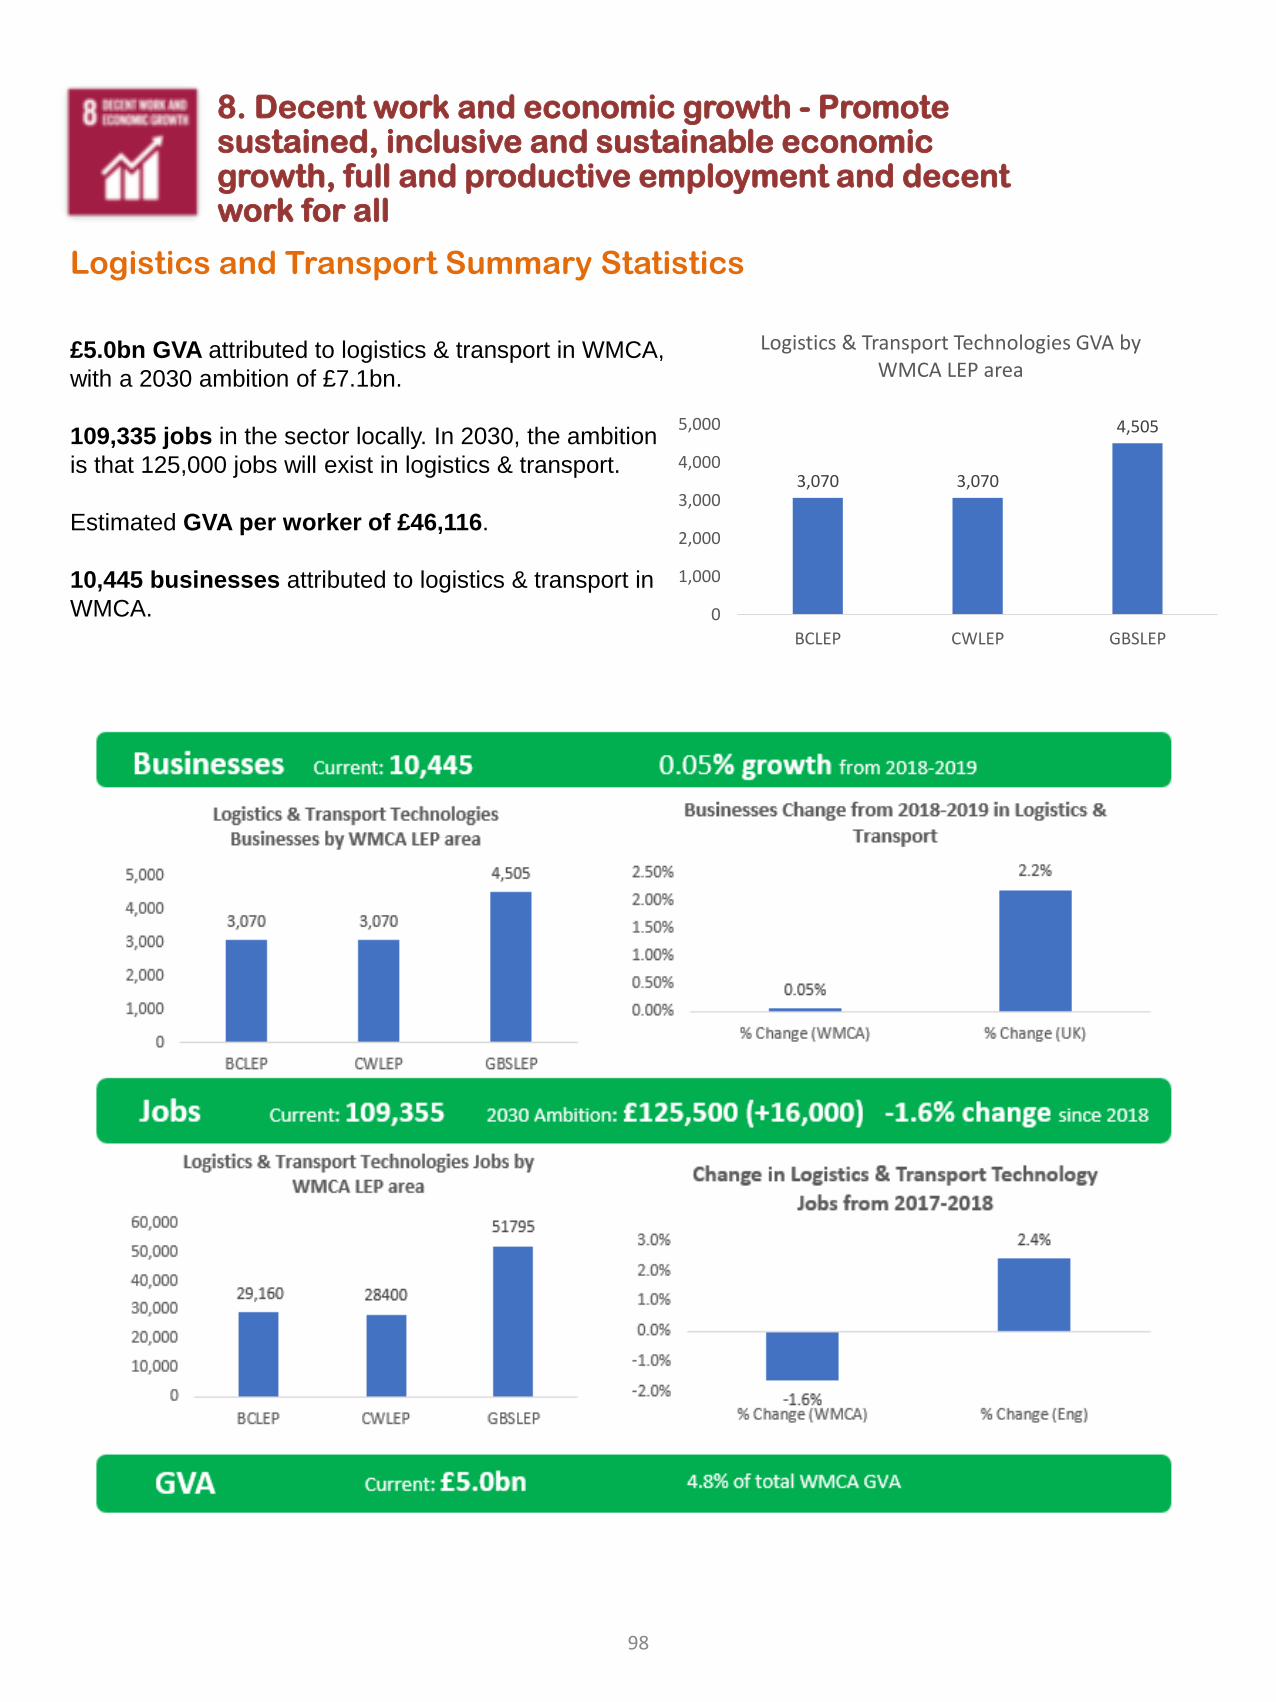
8. Decent work and economic growth - Promote sustained, inclusive and sustainable economic growth, full and productive employment and decent work for all
Logistics and Transport Summary Statistics
£5.0bn GVA attributed to logistics & transport in WMCA,
with a 2030 ambition of £7.1bn.
109,335 jobs in the sector locally. In 2030, the ambition
is that 125,000 jobs will exist in logistics & transport.
Estimated GVA per worker of £46,116.
10,445 businesses attributed to logistics & transport in
WMCA.
3,070 3,070
4,505
0
1,000
2,000
3,000
4,000
5,000
BCLEP CWLEP GBSLEP
Logistics & Transport Technologies GVA by WMCA LEP area
98
8. Decent work and economic growth - Promote sustained, inclusive and sustainable economic growth, full and productive employment and decent work for all
Logistics and Transport Industry Profile
99
Our Competitive AdvantageCentral location with good connectivity and strong logistics network, underpinned by excellent access to the motorway network.90% of the UK population is within four hours’ drive to the West Midlands. London is commutable in under 70 minutes and from just 45 minutes by 2026 due to HS2. Established transport manufacturing industries (automotive, aerospace, rail) provide useful sector cross-overs and collaboration opportunities. Key location in the development of next generation transport, as identified in the SIA (electric vehicles, CAV). These are disruptive technologies within logistics & transport. Digital cluster (particularly in Birmingham & Leamington) has the potential to apply AR/VR technologies etc to logistics. In WMCA (7MET), Transportation and storage has the third largest location quotient of all broad sectors (1.2). At 1.7, for Postal and Couriers, WMCA (7MET) has the highest location quotient of all UK NUTS2 areas, meaning the region has the largest share of employment in this sub-sector in the country.
Products , Services & BrandsBirmingham Airport is the country’s fastest growing airport, handling 13 m passengers a year flying to 150 destinations. UK HQ of DPD in Smethwick.Rotala’s registered bus services carry more than 29,000,000 passengers every year.National Express, HQ’d in Birmingham, carries out more than 882 m journeys worldwide each year with its fleet of over 29,000 vehicles.
Centres of Excellence/AssetsInnovation:The National Transport Design Centre, CoventryVery Light Rail Innovation CentreAdvanced Propulsion Centre, University of WarwickBirmingham Centre for Rail Research and EducationWton Science, Technology & Prototyping CentreRolls-Royce University Technology Centre, Birmingham
National Battery Prototype Centre, WarwickThe Digital Media Technology Lab, BCUTraining:Network Rail Training Centre, Walsall National College for High Speed Rail, AstonProduction Processes:Manufacturing Technology Centre (MTC)Warwick Manufacturing Group (WMG)
99
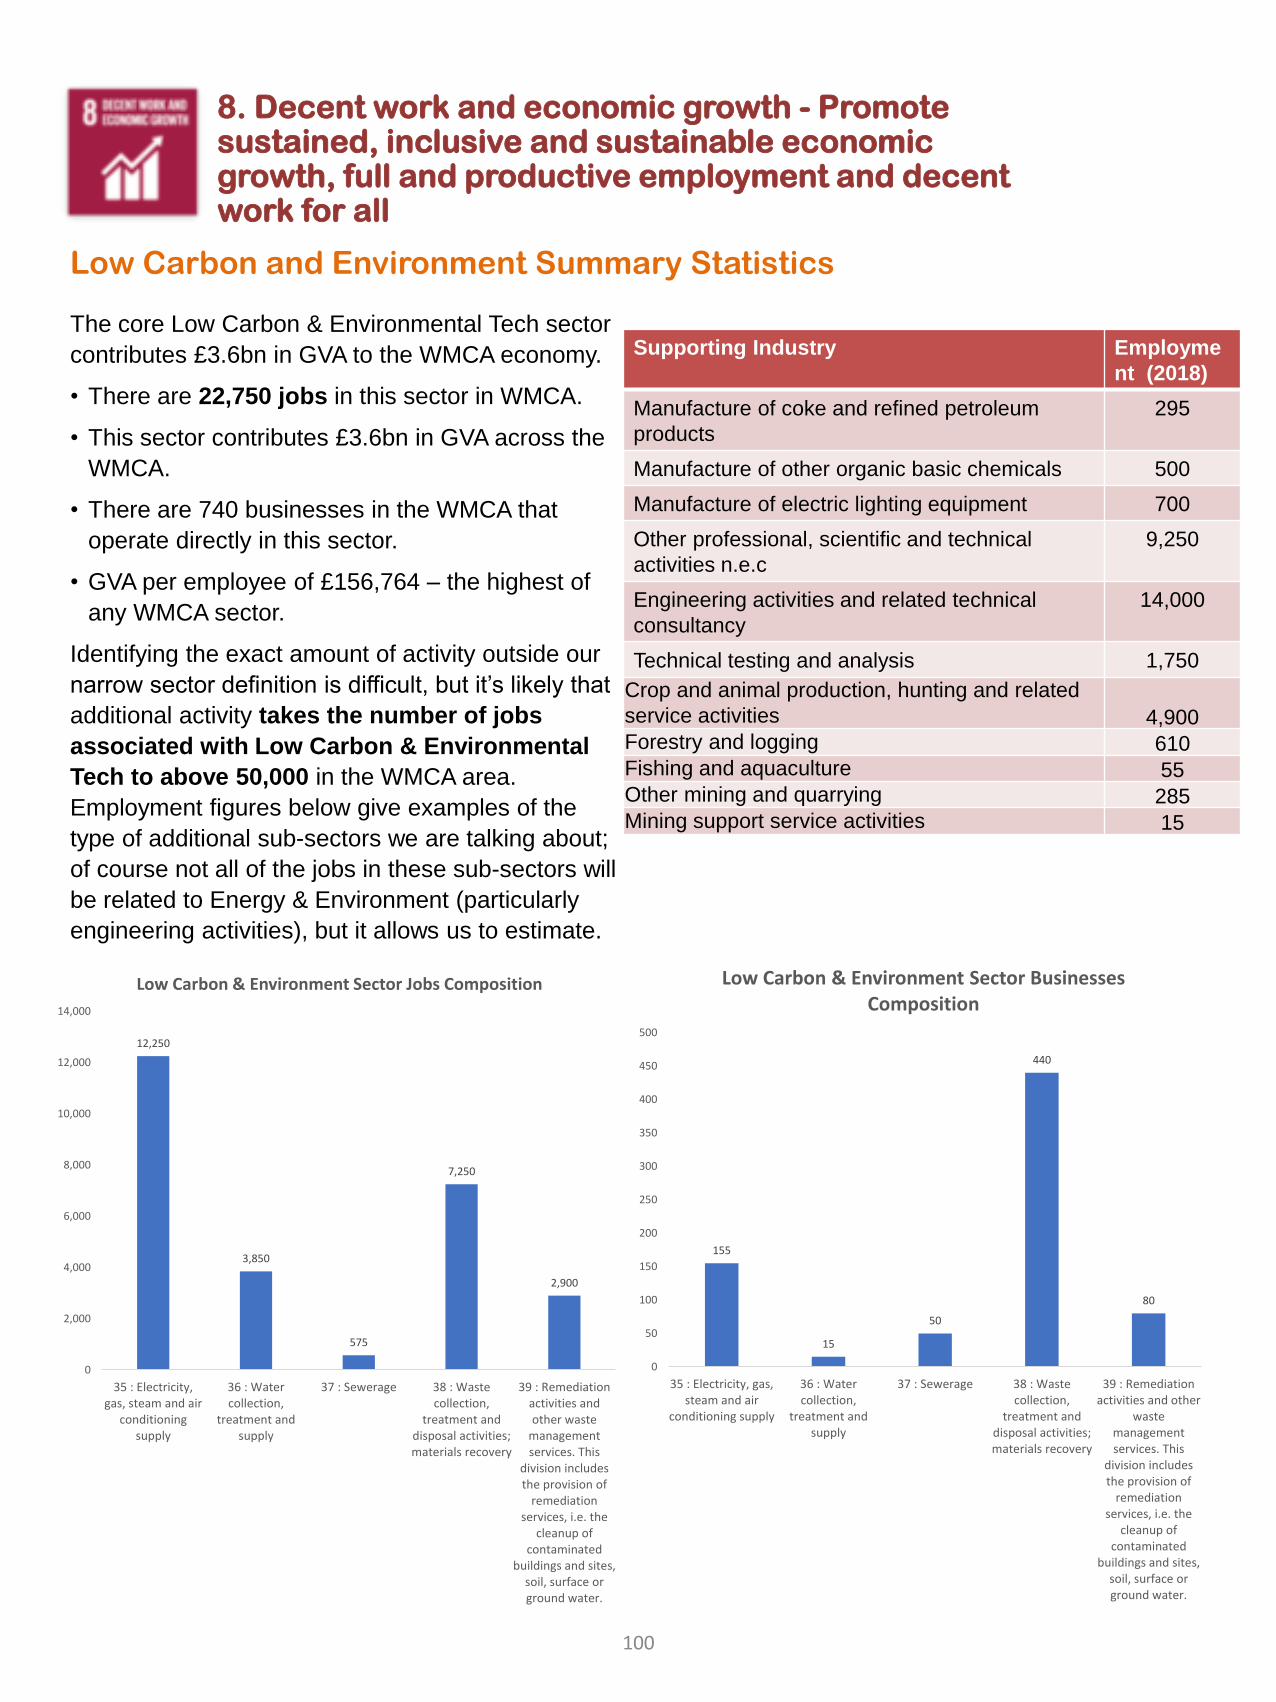
8. Decent work and economic growth - Promote sustained, inclusive and sustainable economic growth, full and productive employment and decent work for all
Low Carbon and Environment Summary Statistics
The core Low Carbon & Environmental Tech sector
contributes £3.6bn in GVA to the WMCA economy.
• There are 22,750 jobs in this sector in WMCA.
• This sector contributes £3.6bn in GVA across the
WMCA.
• There are 740 businesses in the WMCA that
operate directly in this sector.
• GVA per employee of £156,764 – the highest of
any WMCA sector.
Identifying the exact amount of activity outside our
narrow sector definition is difficult, but it’s likely that
additional activity takes the number of jobs
associated with Low Carbon & Environmental
Tech to above 50,000 in the WMCA area.
Employment figures below give examples of the
type of additional sub-sectors we are talking about;
of course not all of the jobs in these sub-sectors will
be related to Energy & Environment (particularly
engineering activities), but it allows us to estimate.
Supporting Industry Employme
nt (2018)
Manufacture of coke and refined petroleum
products
295
Manufacture of other organic basic chemicals 500
Manufacture of electric lighting equipment 700
Other professional, scientific and technical
activities n.e.c
9,250
Engineering activities and related technical
consultancy
14,000
Technical testing and analysis 1,750
Crop and animal production, hunting and related
service activities 4,900Forestry and logging 610Fishing and aquaculture 55Other mining and quarrying 285Mining support service activities 15
12,250
3,850
575
7,250
2,900
0
2,000
4,000
6,000
8,000
10,000
12,000
14,000
35 : Electricity,gas, steam and air
conditioningsupply
36 : Watercollection,
treatment andsupply
37 : Sewerage 38 : Wastecollection,
treatment anddisposal activities;materials recovery
39 : Remediationactivities andother waste
managementservices. This
division includesthe provision of
remediationservices, i.e. the
cleanup ofcontaminated
buildings and sites,soil, surface orground water.
Low Carbon & Environment Sector Jobs Composition
155
15
50
440
80
0
50
100
150
200
250
300
350
400
450
500
35 : Electricity, gas,steam and air
conditioning supply
36 : Watercollection,
treatment andsupply
37 : Sewerage 38 : Wastecollection,
treatment anddisposal activities;materials recovery
39 : Remediationactivities and other
wastemanagementservices. This
division includesthe provision of
remediationservices, i.e. the
cleanup ofcontaminated
buildings and sites,soil, surface orground water.
Low Carbon & Environment Sector Businesses Composition
100
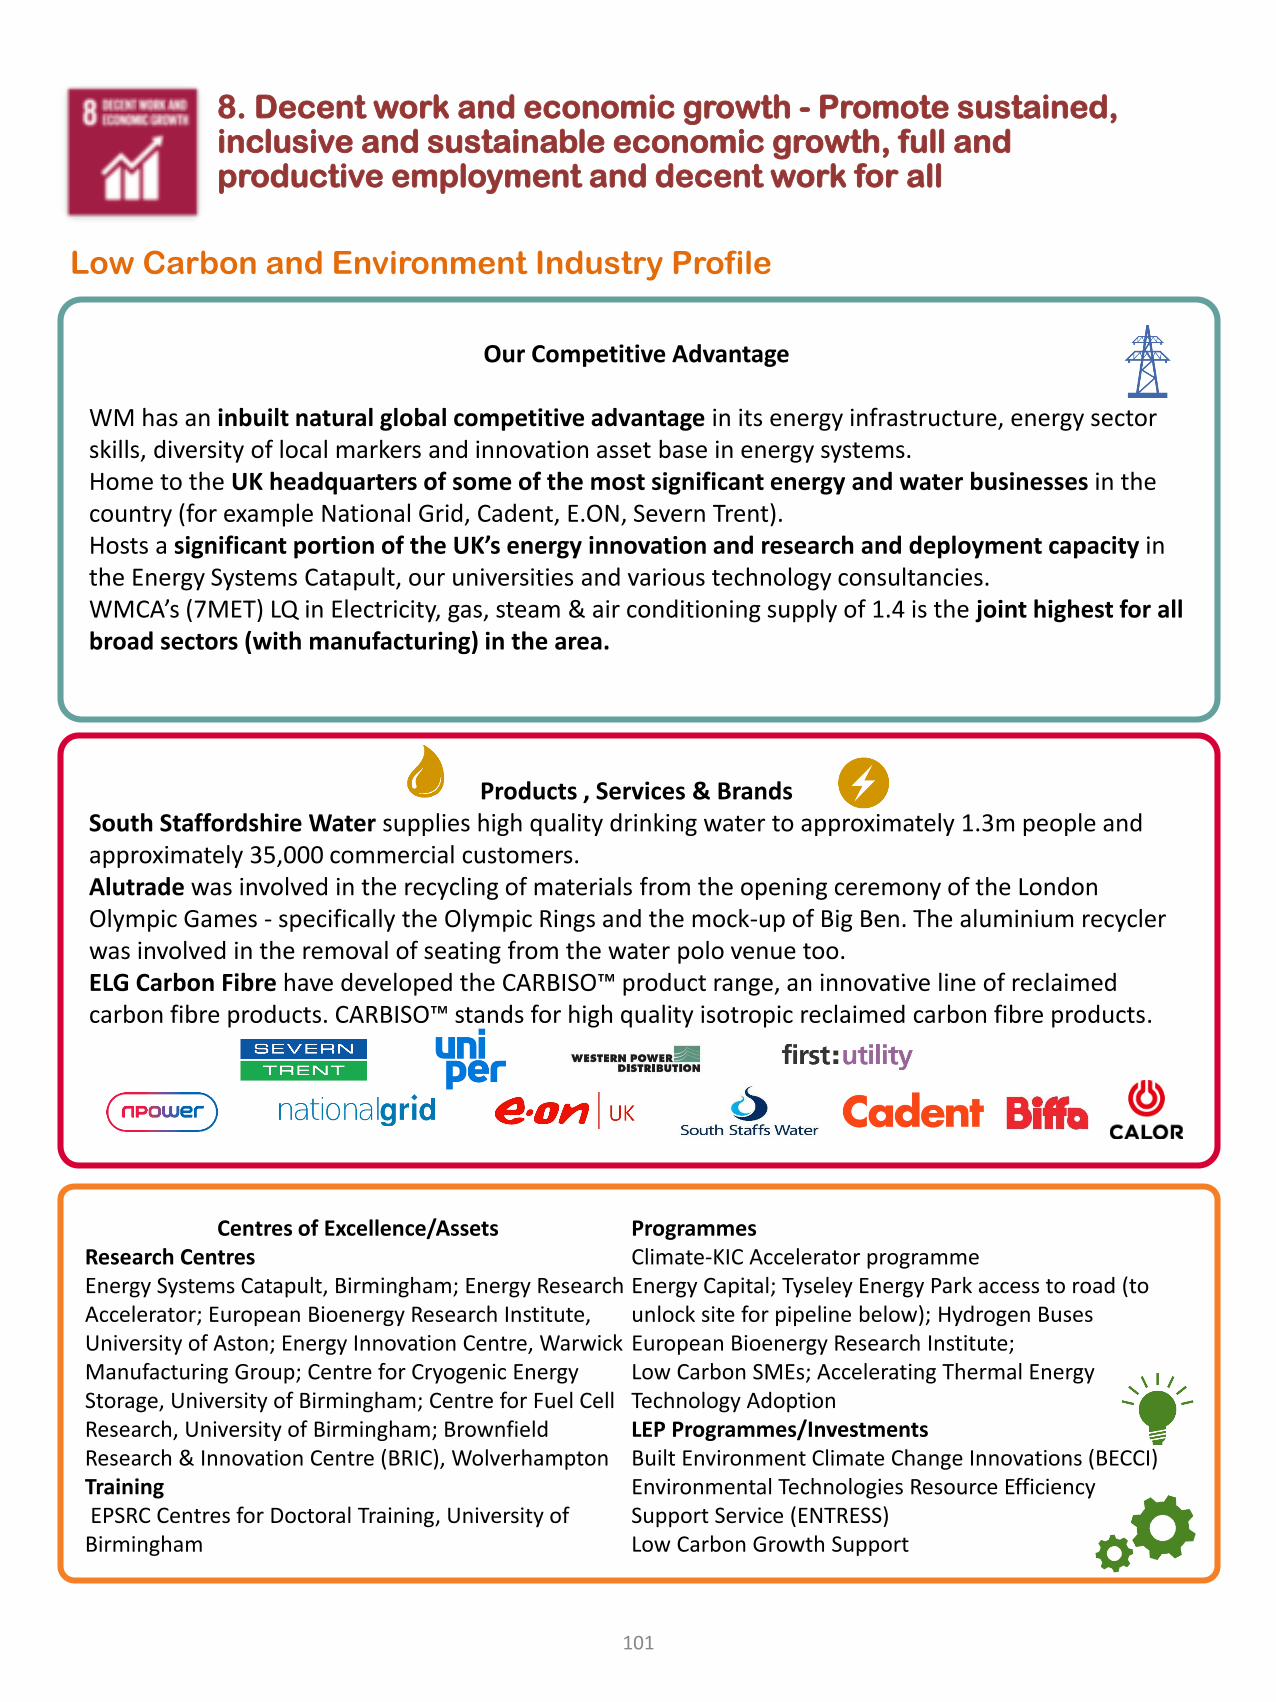
8. Decent work and economic growth - Promote sustained, inclusive and sustainable economic growth, full and productive employment and decent work for all
Low Carbon and Environment Industry Profile
Our Competitive Advantage
WM has an inbuilt natural global competitive advantage in its energy infrastructure, energy sector skills, diversity of local markers and innovation asset base in energy systems.Home to the UK headquarters of some of the most significant energy and water businesses in the country (for example National Grid, Cadent, E.ON, Severn Trent).Hosts a significant portion of the UK’s energy innovation and research and deployment capacity in the Energy Systems Catapult, our universities and various technology consultancies.WMCA’s (7MET) LQ in Electricity, gas, steam & air conditioning supply of 1.4 is the joint highest for all broad sectors (with manufacturing) in the area.
Products , Services & BrandsSouth Staffordshire Water supplies high quality drinking water to approximately 1.3m people and approximately 35,000 commercial customers.Alutrade was involved in the recycling of materials from the opening ceremony of the London Olympic Games - specifically the Olympic Rings and the mock-up of Big Ben. The aluminium recycler was involved in the removal of seating from the water polo venue too.ELG Carbon Fibre have developed the CARBISO™ product range, an innovative line of reclaimed carbon fibre products. CARBISO™ stands for high quality isotropic reclaimed carbon fibre products.
Centres of Excellence/AssetsResearch CentresEnergy Systems Catapult, Birmingham; Energy Research Accelerator; European Bioenergy Research Institute,University of Aston; Energy Innovation Centre, Warwick Manufacturing Group; Centre for Cryogenic Energy Storage, University of Birmingham; Centre for Fuel Cell Research, University of Birmingham; Brownfield Research & Innovation Centre (BRIC), WolverhamptonTrainingEPSRC Centres for Doctoral Training, University of
Birmingham
ProgrammesClimate-KIC Accelerator programmeEnergy Capital; Tyseley Energy Park access to road (to unlock site for pipeline below); Hydrogen BusesEuropean Bioenergy Research Institute; Low Carbon SMEs; Accelerating Thermal Energy Technology Adoption LEP Programmes/InvestmentsBuilt Environment Climate Change Innovations (BECCI)Environmental Technologies Resource Efficiency Support Service (ENTRESS)Low Carbon Growth Support
101
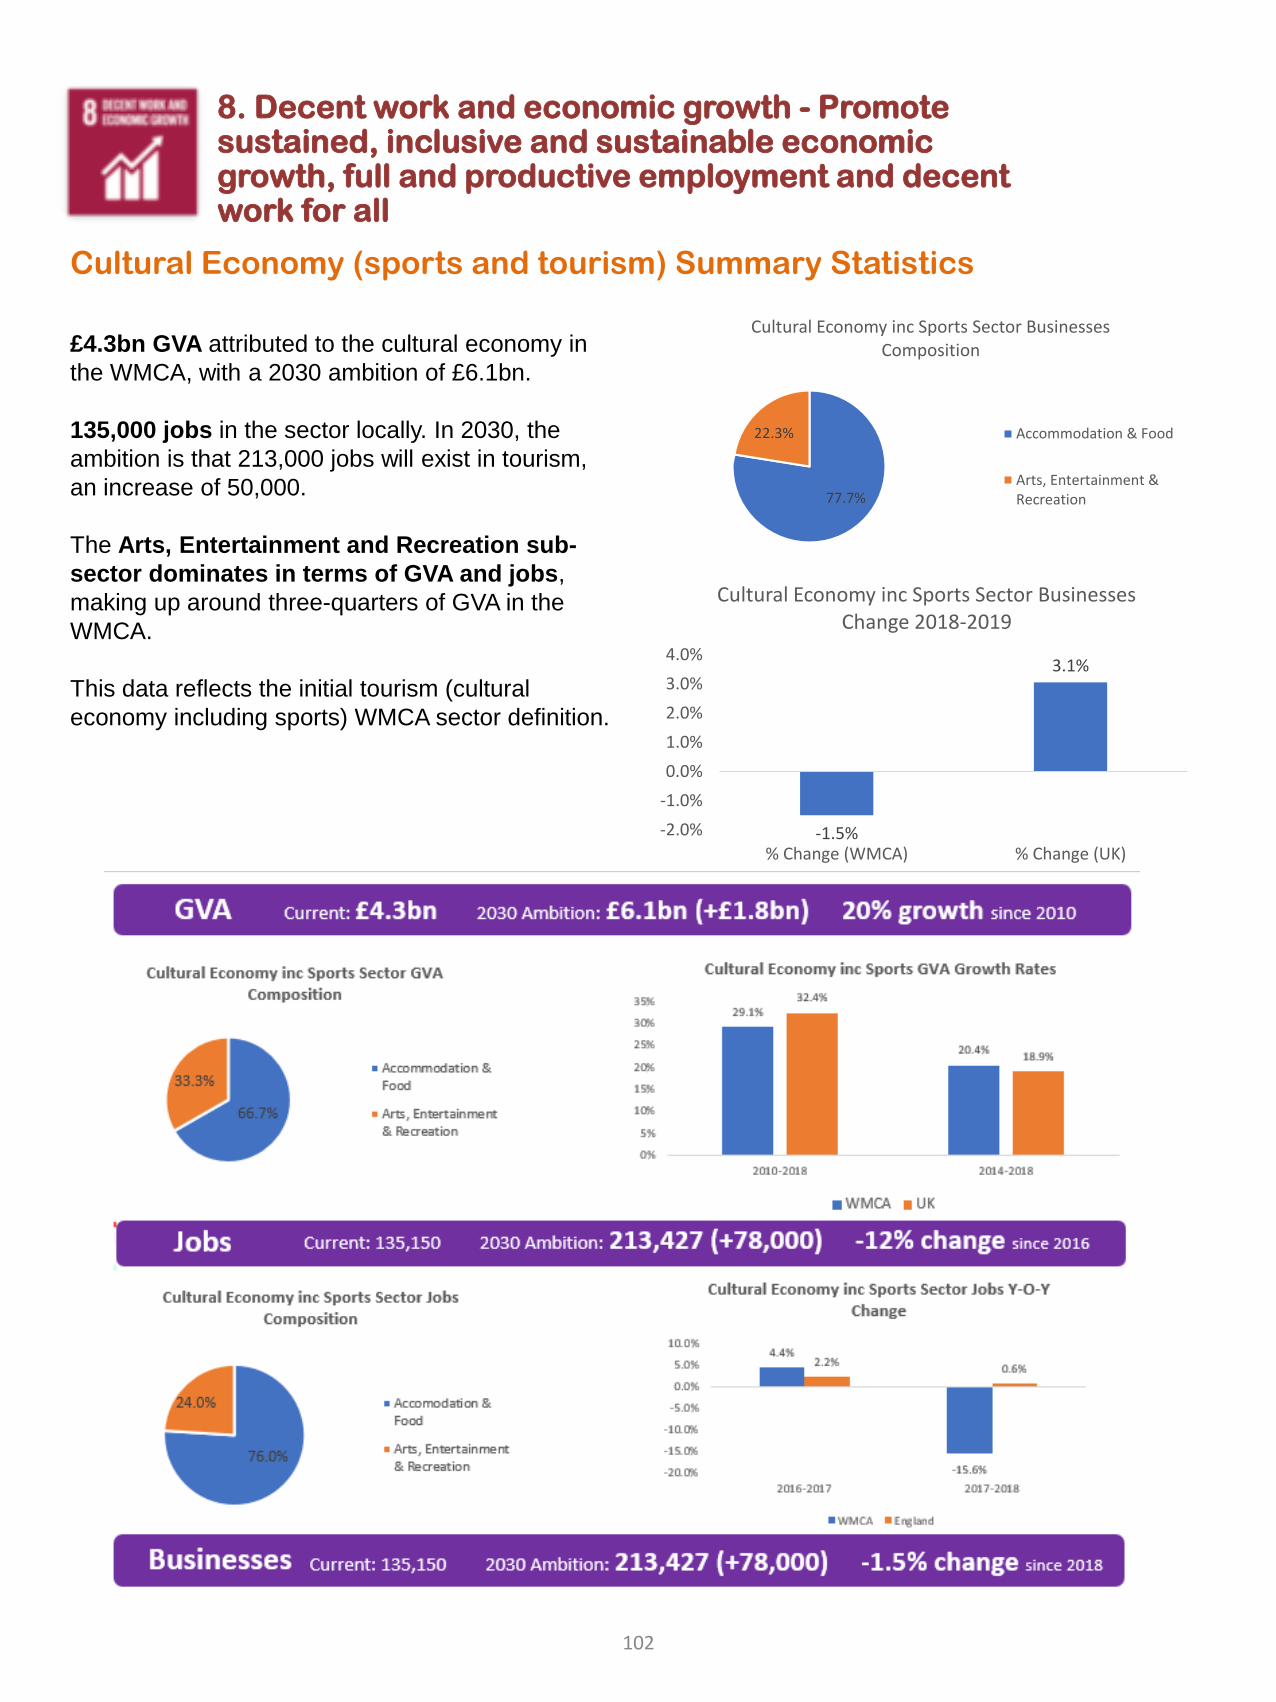
8. Decent work and economic growth - Promote sustained, inclusive and sustainable economic growth, full and productive employment and decent work for all
102
Cultural Economy (sports and tourism) Summary Statistics
£4.3bn GVA attributed to the cultural economy in
the WMCA, with a 2030 ambition of £6.1bn.
135,000 jobs in the sector locally. In 2030, the
ambition is that 213,000 jobs will exist in tourism,
an increase of 50,000.
The Arts, Entertainment and Recreation sub-
sector dominates in terms of GVA and jobs,
making up around three-quarters of GVA in the
WMCA.
This data reflects the initial tourism (cultural
economy including sports) WMCA sector definition.
77.7%
22.3%
Cultural Economy inc Sports Sector Businesses Composition
Accommodation & Food
Arts, Entertainment &Recreation
-1.5%
3.1%
-2.0%
-1.0%
0.0%
1.0%
2.0%
3.0%
4.0%
% Change (WMCA) % Change (UK)
Cultural Economy inc Sports Sector Businesses Change 2018-2019
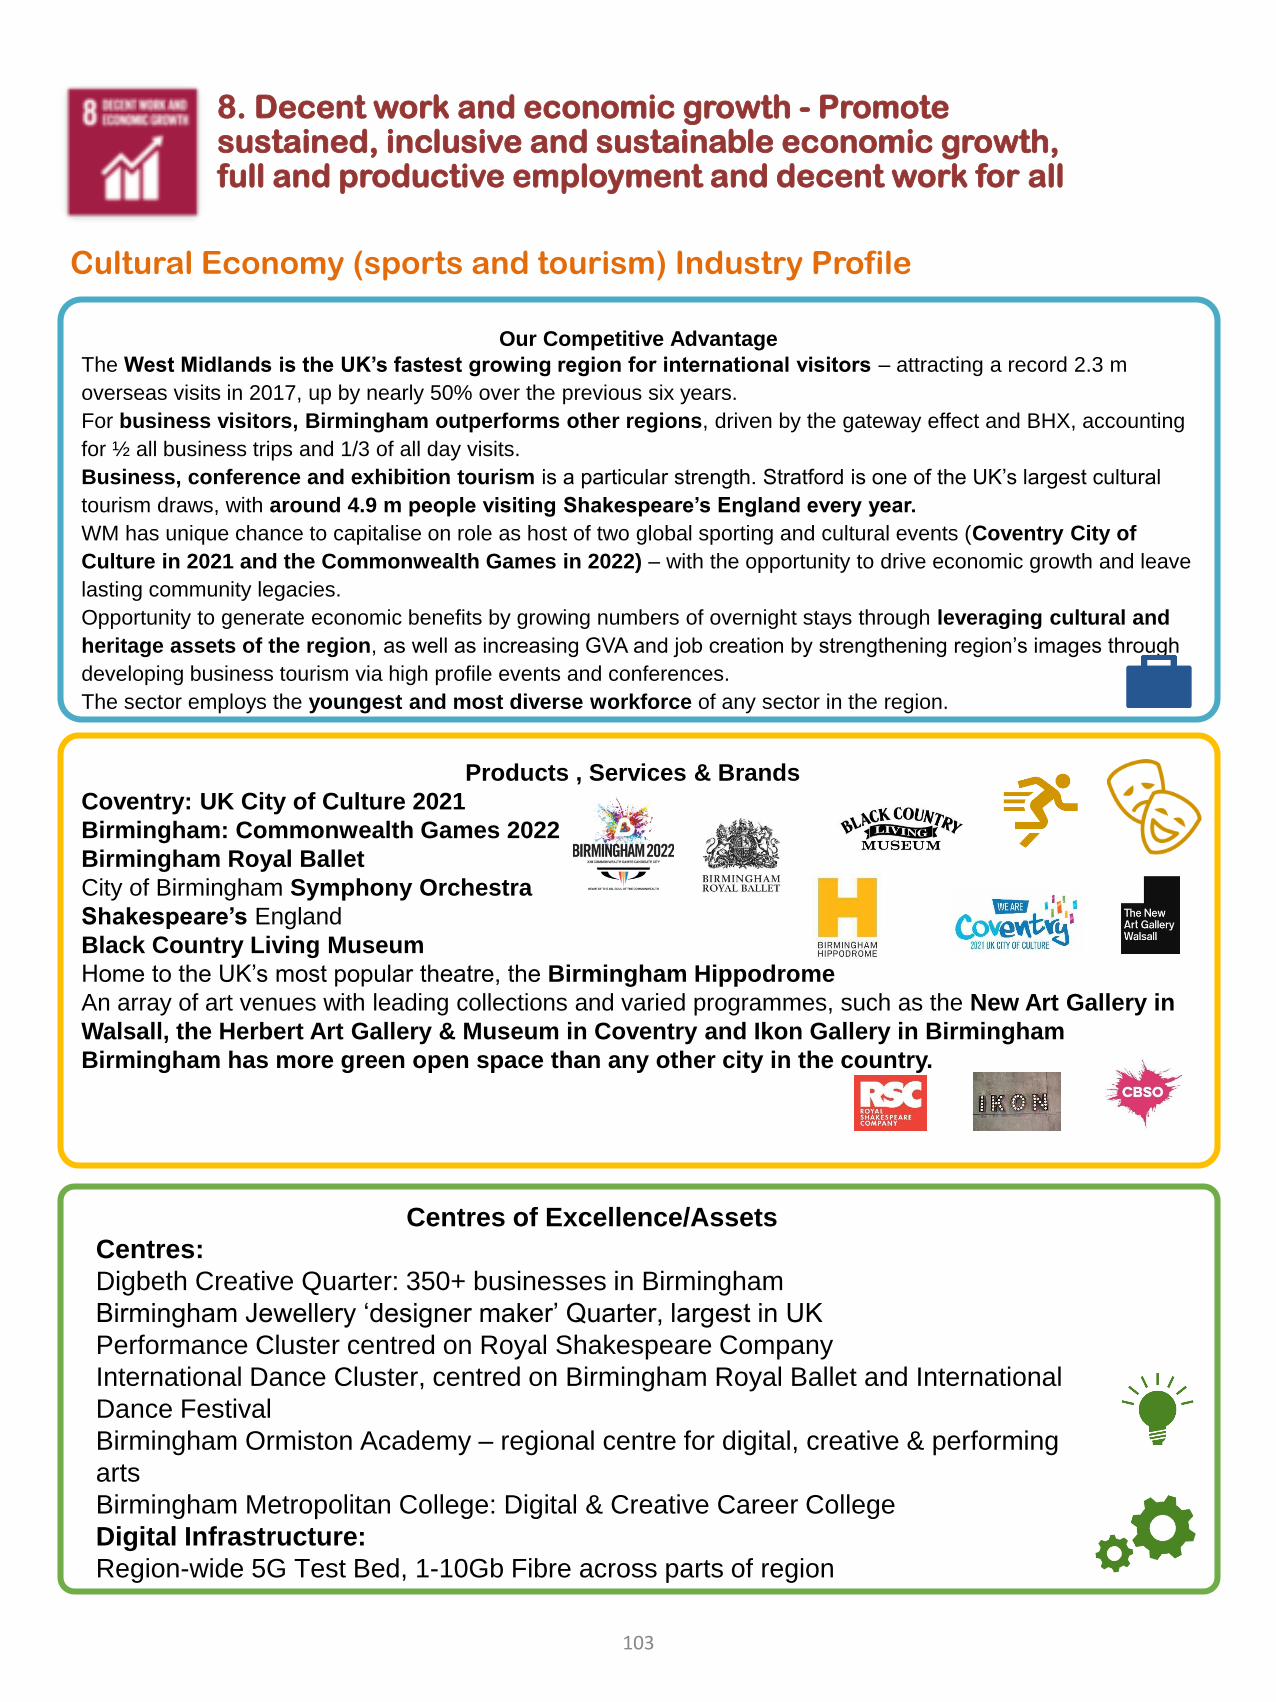
8. Decent work and economic growth - Promote sustained, inclusive and sustainable economic growth, full and productive employment and decent work for all
Cultural Economy (sports and tourism) Industry Profile
Our Competitive Advantage
The West Midlands is the UK’s fastest growing region for international visitors – attracting a record 2.3 m
overseas visits in 2017, up by nearly 50% over the previous six years.
For business visitors, Birmingham outperforms other regions, driven by the gateway effect and BHX, accounting
for ½ all business trips and 1/3 of all day visits.
Business, conference and exhibition tourism is a particular strength. Stratford is one of the UK’s largest cultural
tourism draws, with around 4.9 m people visiting Shakespeare’s England every year.
WM has unique chance to capitalise on role as host of two global sporting and cultural events (Coventry City of
Culture in 2021 and the Commonwealth Games in 2022) – with the opportunity to drive economic growth and leave
lasting community legacies.
Opportunity to generate economic benefits by growing numbers of overnight stays through leveraging cultural and
heritage assets of the region, as well as increasing GVA and job creation by strengthening region’s images through
developing business tourism via high profile events and conferences.
The sector employs the youngest and most diverse workforce of any sector in the region.
Products , Services & Brands
Coventry: UK City of Culture 2021
Birmingham: Commonwealth Games 2022
Birmingham Royal Ballet
City of Birmingham Symphony Orchestra
Shakespeare’s England
Black Country Living Museum
Home to the UK’s most popular theatre, the Birmingham Hippodrome
An array of art venues with leading collections and varied programmes, such as the New Art Gallery in
Walsall, the Herbert Art Gallery & Museum in Coventry and Ikon Gallery in Birmingham
Birmingham has more green open space than any other city in the country.
Centres of Excellence/Assets
Centres:
Digbeth Creative Quarter: 350+ businesses in Birmingham
Birmingham Jewellery ‘designer maker’ Quarter, largest in UK
Performance Cluster centred on Royal Shakespeare Company
International Dance Cluster, centred on Birmingham Royal Ballet and International
Dance Festival
Birmingham Ormiston Academy – regional centre for digital, creative & performing
arts
Birmingham Metropolitan College: Digital & Creative Career College
Digital Infrastructure:
Region-wide 5G Test Bed, 1-10Gb Fibre across parts of region
103
9. Build resilient infrastructure, promote inclusive and sustainable industrialisation and foster innovation
96.5% (1,768,211) of premises have access to ultrafast and superfast broadband in the WMCA in 2019.
The percentage has slightly decreased since 2018 by 0.2pp due to the number of all premises increasing at
a faster rate than the number of premises with ultrafast and superfast broadband access. Across the
WMCA, the overall median data usage was on average 178GB in 2019.
In December 2019, the metro punctuality across the WM 7 Met. was recorded at 96.4%, compared to the
same month in 2018 this has slightly decreased from 97.0%. The latest data (March 2020) for the West
Midlands Rail Public Performance Measure (PPM) was 89.2% slightly below the target of 90.0%.
MIT Regional Entrepreneurship Acceleration Program Research Case Study
In March 2020, MIT launched a pilot in the UK of a ‘lite’ version of its global ‘Regional Entrepreneurship
Acceleration Programme’ (REAP), aimed at helping UK regions with achieving greater productivity,
employment and returns from research and innovation activity. This programme seeks to deepen the
collective efforts and community of practice of entrepreneurship and innovation. The benefit of MIT’s
theoretical and practice-based expertise and regional leadership, focused on this new initiative to support
productivity growth, is a defining factor in the delivery of the UK’s local Industrial Strategies. The West
Midlands Combined Authority (WMCA) is one of six regions currently part of the programme.
The West Midlands Team ‘lite’ REAP team is sponsored by the GBSLEP, BCCLEP and the West Midlands
Combined Authority (WMCA), whilst also representing the Coventry & Warks LEP area. WM REDI is part of
this team, which includes representatives from Government, Academia, Corporates, SMEs, and Risk
Capital. Other organisations involved include the WMCA (Innovation Lead), Innovate UK, GBSLEP, Black
Country Growth LEP, West Midlands Combined Universities, Aston Centre for Growth, Birmingham
University, Midlands Aerospace Alliance, KPMG, Greater Birmingham Chambers, Black Country Chamber,
Innovation Alliance West Midlands, and the British Business Bank. The goal of the MIT REAP-UK Initiative
is to support regional teams of leaders representing Entrepreneurs, Risk Capital Providers, Corporates,
Academia, and Governments in an evidence-based approach to supporting innovation and
entrepreneurship in each team’s local region. The initiative draws on the frameworks founded and
established through the MIT REAP global program and translates them into the UK context with a cohort
composed of entirely UK-based teams. Initial research is now being developed along 4 themes:
Customer Research – surveying entrepreneurs (SMEs) and Risk capital providers to analyse their view of
the innovation ecosystem. We aim to understand our regional portfolio of innovation actors (sector,
maturity, profile, etc.) and identify the most vulnerable sectors and those that have the biggest economic
impact on the region, so we can match them to appropriate business support.
Assessing the ecosystem – developing a set of indicators to assess the capability to support Innovation and
Entrepreneurship in the region.
Mapping Current Business Support – this will let us see if we as a region are supporting the development
and growth of ‘innovation-driven enterprises’ (IDEs) and if not what areas of business support need to
change / gaps need to be addressed. For example, is there appropriate business support available to help
firms to build resilience post Covid-19, around the re-purposing, re-positioning, and re-validating of their
business?
Identification of Innovation Driven Enterprises – these companies pursue global opportunities based on
bringing to customers’ innovations, which have a clear competitive advantage and high growth potential
104
9. Build resilient infrastructure, promote inclusive and sustainable industrialisation and foster innovation
Future Mobility and the Covid-19 Impact on Transport – Case Study
Transport for West Midlands has been reviewing its evidence base and monitoring the impacts of Covid-19
on the current delivery and strategy for transport. The following provides ab outline of the analysis and work
to date and the impacts on transport in the region.
Since the start of the Covid-19 lockdown, the UK transport sector has faced the biggest crisis in modern
times as the pandemic affects the country’s way of life. Unprecedented steps had to be put in place,
following strict Government public health guidelines, for passengers and commuters to limit non-essential
travel and avoid social interaction. This resulted in significant reductions in bus and rail services throughout
the West Midlands and nationally.
Impacts of Lockdown
Public transport usage declined by approximately 90% in the first weeks of the introduction of lockdown,
and motor vehicle usage also declined significantly.
As a result of significantly reduced passengers and revenue, public transport operators had to reduce their
services. Steps were taken to ensure that operators were able to maintain an agreed level of service so
that key workers could still travel.
In response to the challenging environment faced by the rail industry, the Department for Transport
temporarily suspended normal franchise agreements, and transferred all revenue and cost risk to the
government for an initial period of six months.
Outside of London however, bus and light rail services operate in a deregulated market, and therefore
responses were more challenging to coordinate and implement in comparison. The government, as well as
Transport for West Midlands, recognised the importance of maintaining bus services for key workers, and
additional financial and policy measures were put in place.
Transport for West Midlands was able to further support NHS workers by facilitating free bus and tram
travel for all NHS staff and using Ring and Ride services to shuttle frontline staff between hospitals and free
Park and Ride sites.
Remobilising the transport network
In May the Government set out its strategy for lifting the lockdown restrictions which sought a balance
between the risks of incurring a second wave of Covid-19 and enabling a restart to the economy.
105
9. Build resilient infrastructure, promote inclusive and sustainable industrialisation and foster innovation
106
The West Midlands transport recovery is being implemented in collaboration with our local authority
partners and we have set out 5 key objectives for our response.
• Travel that is safe and secure
• Getting workers and businesses back up and running (where safe)
• Supporting travel to schools and keeping children and families safe
• Keeping the clean air, reduced carbon emissions and physical exercise
• Supporting a green recovery
We are taking action to support the transport system to recover and to off-set the potential for a mass
reversion to car use in our urban areas. Work was required to understand how transport services could be
remobilised and support an increase of passengers. This was especially challenging, as on board social
distancing requirements meant that vehicles would only be allowed to carry around 20% of capacity. As a
result, services would still not be commercially viable and funding support would need to continue.
Further challenges remained on how to ensure that transport services matched expected demand, as trip
patterns and demand is likely to change as different lockdown measures ease as part of a phased
approach.
Positive impacts
With transport usage down considerably during lockdown, there were a number of noticeable
improvements to the environment, including:
• In early April, monitoring suggested there had been considerable drops in nitrogen dioxide levels
compared to the previous five year average for the same time period; for Birmingham, this was
suggested to be by around 42%
• There have been reductions in carbon emissions related to recent reduced traffic levels. UK figures from
SIA Partners show UK emissions have reduced by 36% from the start of lockdown to early May.
Indeed, as public transport and motor vehicle usage declined, there was also a noticeable increase in
walking and cycling across the UK, whether for recreation or commuting purposes.
To make it easier for people to walk and cycle, the Government announced the ‘Emergency Active Travel
Fund’ in May to support temporary schemes such as pop up cycle lanes and widening pavements.
There is potentially a positive long-term legacy following lockdown if this sustainable travel behaviour
remains, helping to lock in health and environmental benefits.
Long-term impacts
As of late June 2020 in the West Midlands, traffic on the Strategic Road Network was back to 80% of the
normal pre-Covid level. Metro was up to almost 50%, and bus had recovered by about 35%. Rail on the
other hand remained low at about 10% of normal levels. The longer-term impact of Covid-19 on travel
behaviour is not yet fully known, but it is evident that it might be potentially significant. Whilst there could
be some positive travel behaviour changes, including more working from home and more walking and
cycling, there could also be negative impacts. The message to avoid public transport during the crisis may
remain in people’s mind long after the pandemic has finished, meaning a decrease in long-term
passengers. This may result in greater car usage, which is not only detrimental for economic recovery
through increased congestion, but detrimental to the environment – specifically air quality and carbon
emissions.
9. Build resilient infrastructure, promote inclusive and sustainable industrialisation and foster innovation
The West Midlands has set an ambitious target to achieve net-zero carbon by 2041. Transport accounts
for around one third of carbon emissions and has seen little overall change in emissions. With passenger
numbers still low, and on-board social distancing in place, there is likely to also be a long-lasting impact on
the viability of public transport services; state intervention may be necessary to continue to support the
provision of services which could influence the future role of local and national government in public
transport delivery. Covid-19 has exacerbated many already underlying inequalities and has the potential to
create new ones in the region. Certain groups are disproportionately affected, be it through having a higher
risk contracting it, or being most impacted by its knock-on effects, including:
• Older people
• BAME groups
• Younger people
• Those living in deprived wards
• Lower income earners
• Lone parents
• Disabled people
• Women
These groups are less likely to own a car, be on a lower income, live in more deprived areas and be more
reliant on public transport compared to higher income groups. If accessible and affordable public transport
is therefore not available in both the short and long term, there is a risk of further exacerbating inequalities
in the region.
Looking to the future of government spending, there is also uncertainty over how the government will seek
to address increased borrowing and the predicted economic downturn. Large scale infrastructure projects
could be a tool for significant economic stimulation, or victims of tighter fiscal policy. For the West Midlands,
it is vital for investment into the transport network to continue. The region is rolling out a programme of pop
up cycle infrastructure to respond to the immediate need to support people to travel where public transport
is currently not an option. As we move out of the crisis into recovery it is critical that we continue to review
our transport policies and programmes to ensure a fairer, greener, healthier and more sustainable West
Midlands is achieved for the long-term.
Understanding and planning for the impacts of Covid-19
As the UK went into lockdown, TfWM’s Policy, Strategy & Innovation team were tasked with developing an
understanding of the impacts on the West Midlands transport network. A combination of statistics on
transport usage, relevant news items and key messages were collated into a website to provide daily
monitoring. Further analysis tools were developed to support the transport planning around getting key
workers to the essential services destinations, reflecting the reduced frequency of public transport.
For monitoring public transport usage, Swift Card data was produced daily and used to reflect the public
transport impact across bus, Metro and trains. For highways usage, TfWM signed up to Waze for Cities, to
provide real-time highways disruption information. The programme allowed for the monitoring of speeds
based on 6 corridors on the Key Route Network, helping to monitor the effect of lockdown on easing of
congestion, and any issues with speeding as a result of reduced traffic. In order to coordinate the support
and availability of public transport for key workers, TfWM collated and mapped information to identify areas
of high public transport dependency – helping to ensure that key workers could still travel.
107
9. Build resilient infrastructure, promote inclusive and sustainable industrialisation and foster innovation
In April an online survey was promoted via WMCA social media channels and emailed directly to
members of WMCA/TfWM data bases:
• 6188 responses were received in total, of which:
• 2940 (48%) would like to receive further updates
• 2859 (46%) would like to take part in future research
The survey also provides further evidence of the increases in walking and cycling during the
lockdown and the key sentiments from the survey were that people wanted to see change/ learn
lessons to keep:• cleaner air (81%)
• reduced traffic on roads/ reduced car use (75%), f
• a better work/life balance (67%).
This research is being used to inform our response to the pandemic in partnership with key
stakeholders including local authorities and operators. A second wave of the survey has also
been undertaken in late June. As the transport network remobilises, monitoring the transport
network continues to be vital, and can help to ensure that supply matches demand, especially
with strict on board social distancing in place on public transport.
The fast paced nature of the COVID impact has resulted in the development of additional insight.
The legacy of this work will be the ability to continue to monitor the transport network on a daily
basis and start to use the intelligence we have gathered to start to model changes in travel
behaviour in response to both short term changes e.g. either relaxation or tightening of lockdown
restrictions and changes to social distancing and into the longer term as the realities of a ‘new
normal’ is better understood.
Utilising the combined data sources of the Census, the Human Intelligence COVID survey and a
variety of other sources there has been a mapping of the zones where people reside that work in
specific industries and that commute by certain modes. This enables the understanding of the
public transport provision to specific industries that cannot work from home, in addition those
areas where there is an increase in localised journeys as a result of being able to work from
home has also been identified. The most granular data analysis is taking place as a result of the
bus operators sharing the boarding data by time of day, enabling the busiest bus stops to be
identified, so the travel demand management team can work with nearby businesses and
education institutions, and also facilitating the impact of capacity changes to be estimated,
effectively identifying where a bus is likely to be at capacity along its route. The operators are
using this data to help realign services form those of least or little demand to those that require
additional support. The data analysis is now moving to corridor based impact and also the
increased change in localised journeys, as more data has become available then more impact
analysis is undertaken.
108
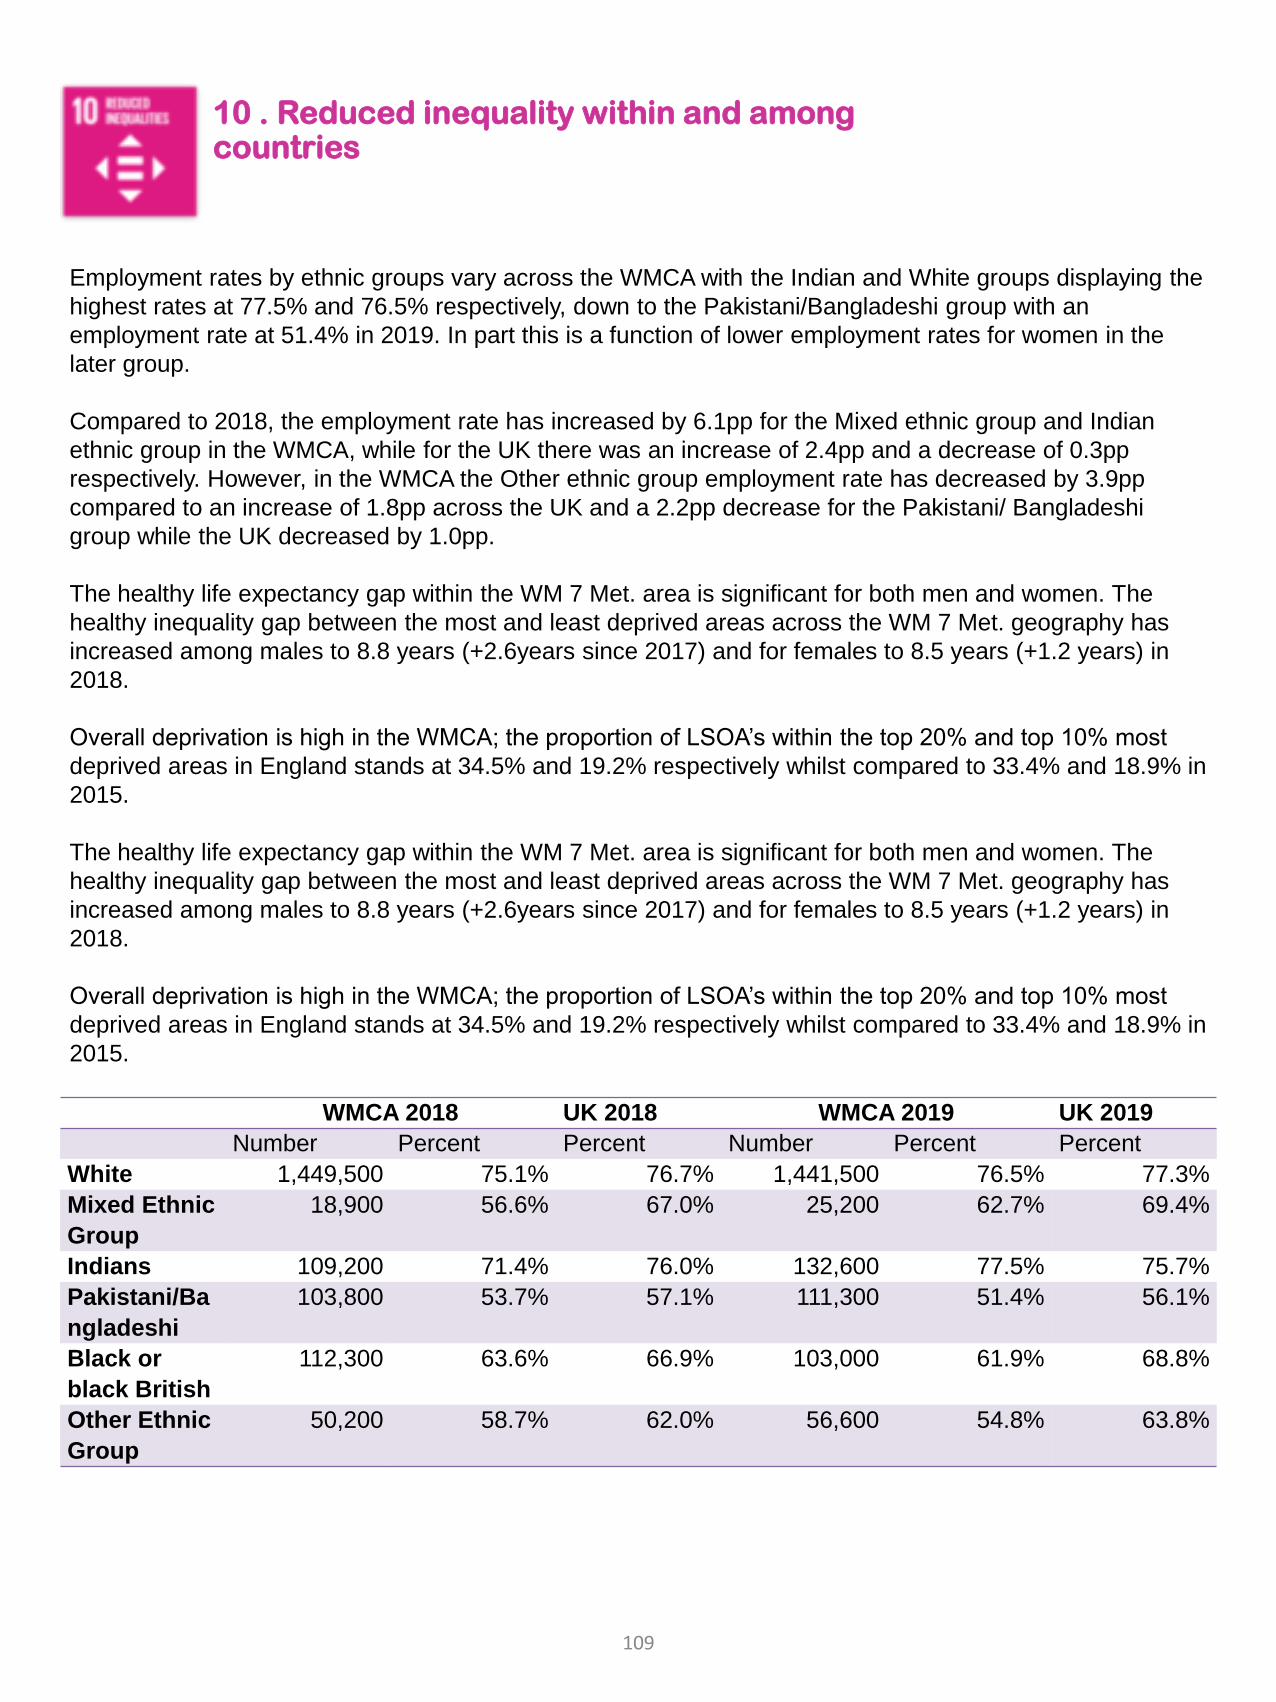
10 . Reduced inequality within and among countries
Employment rates by ethnic groups vary across the WMCA with the Indian and White groups displaying the
highest rates at 77.5% and 76.5% respectively, down to the Pakistani/Bangladeshi group with an
employment rate at 51.4% in 2019. In part this is a function of lower employment rates for women in the
later group.
Compared to 2018, the employment rate has increased by 6.1pp for the Mixed ethnic group and Indian
ethnic group in the WMCA, while for the UK there was an increase of 2.4pp and a decrease of 0.3pp
respectively. However, in the WMCA the Other ethnic group employment rate has decreased by 3.9pp
compared to an increase of 1.8pp across the UK and a 2.2pp decrease for the Pakistani/ Bangladeshi
group while the UK decreased by 1.0pp.
The healthy life expectancy gap within the WM 7 Met. area is significant for both men and women. The
healthy inequality gap between the most and least deprived areas across the WM 7 Met. geography has
increased among males to 8.8 years (+2.6years since 2017) and for females to 8.5 years (+1.2 years) in
2018.
Overall deprivation is high in the WMCA; the proportion of LSOA’s within the top 20% and top 10% most
deprived areas in England stands at 34.5% and 19.2% respectively whilst compared to 33.4% and 18.9% in
2015.
WMCA 2018 UK 2018 WMCA 2019 UK 2019
Number Percent Percent Number Percent Percent
White 1,449,500 75.1% 76.7% 1,441,500 76.5% 77.3%
Mixed Ethnic
Group
18,900 56.6% 67.0% 25,200 62.7% 69.4%
Indians 109,200 71.4% 76.0% 132,600 77.5% 75.7%
Pakistani/Ba
ngladeshi
103,800 53.7% 57.1% 111,300 51.4% 56.1%
Black or
black British
112,300 63.6% 66.9% 103,000 61.9% 68.8%
Other Ethnic
Group
50,200 58.7% 62.0% 56,600 54.8% 63.8%
109
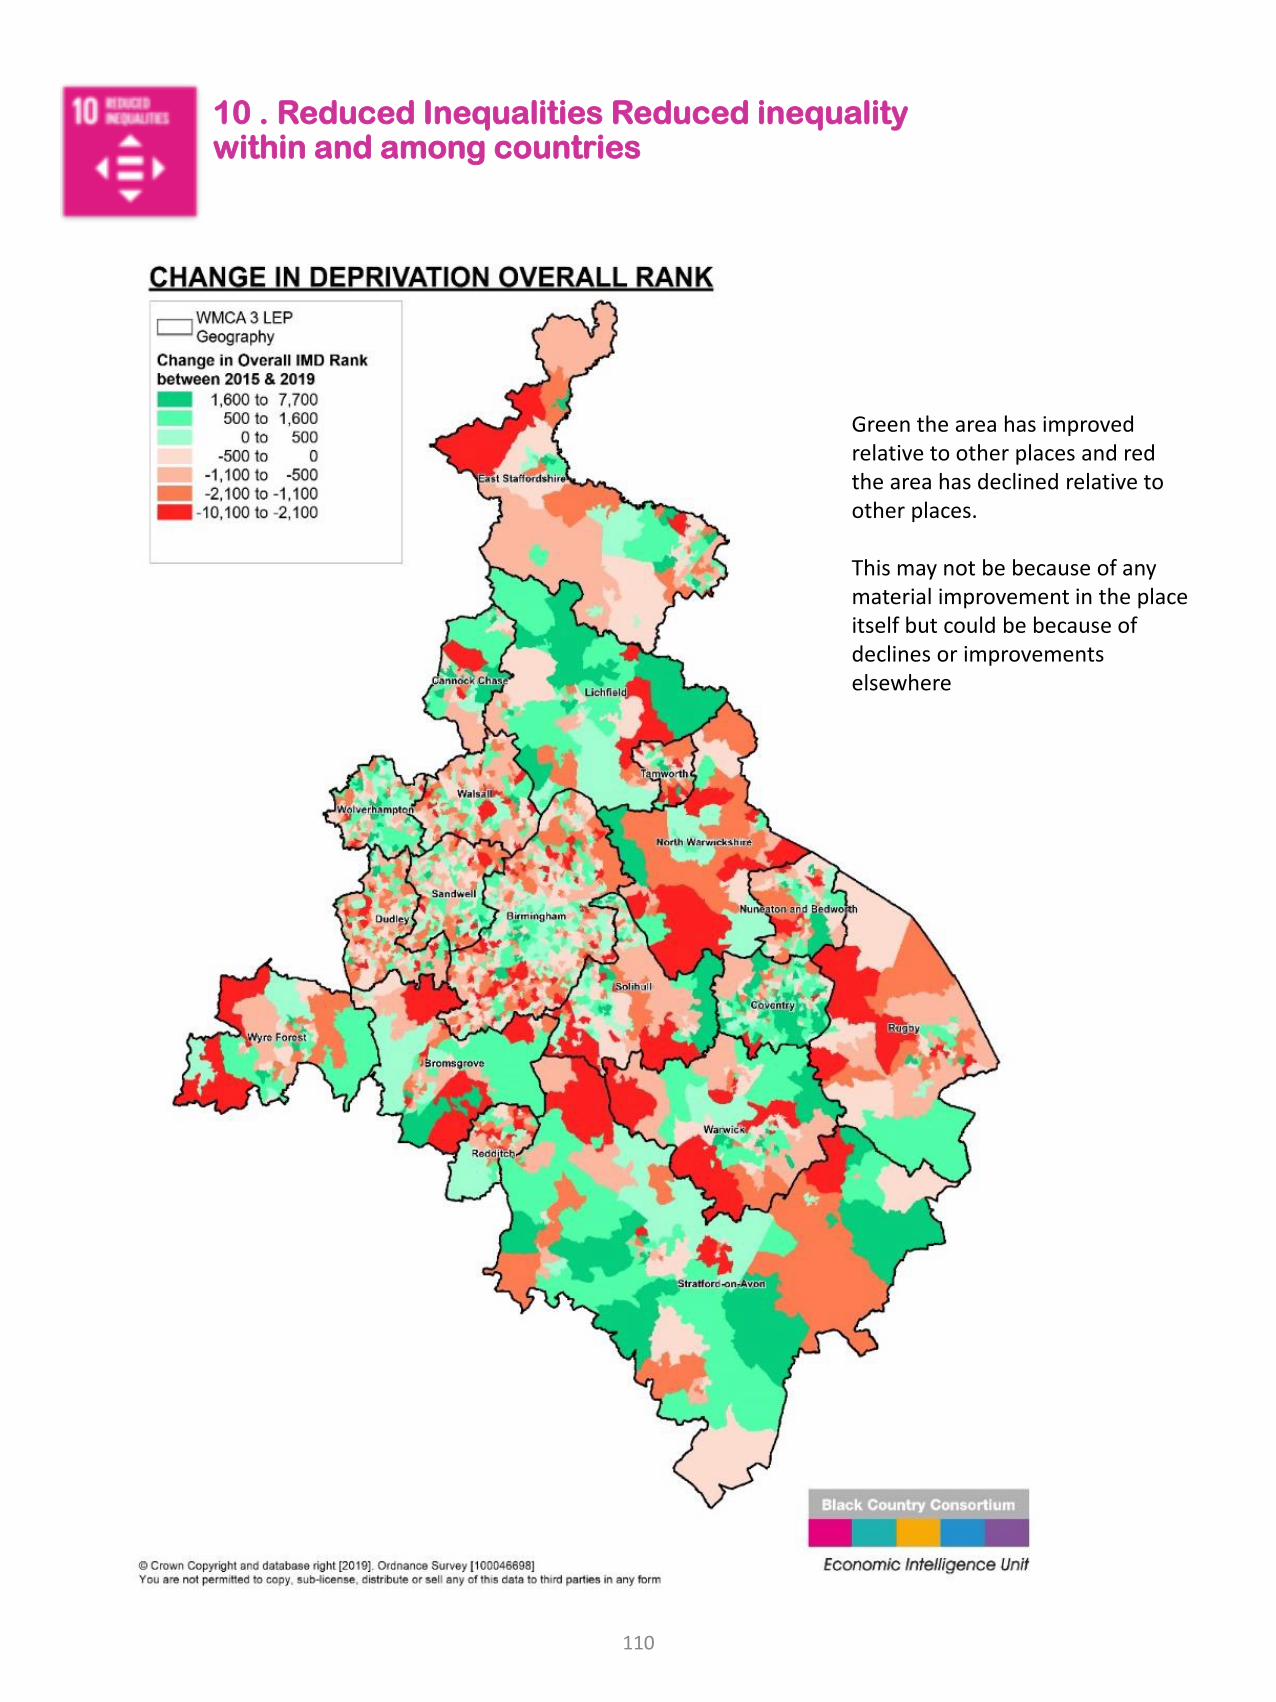
10 . Reduced Inequalities Reduced inequality within and among countries
Green the area has improved relative to other places and red the area has declined relative to other places.
This may not be because of any material improvement in the place itself but could be because of declines or improvements elsewhere
110
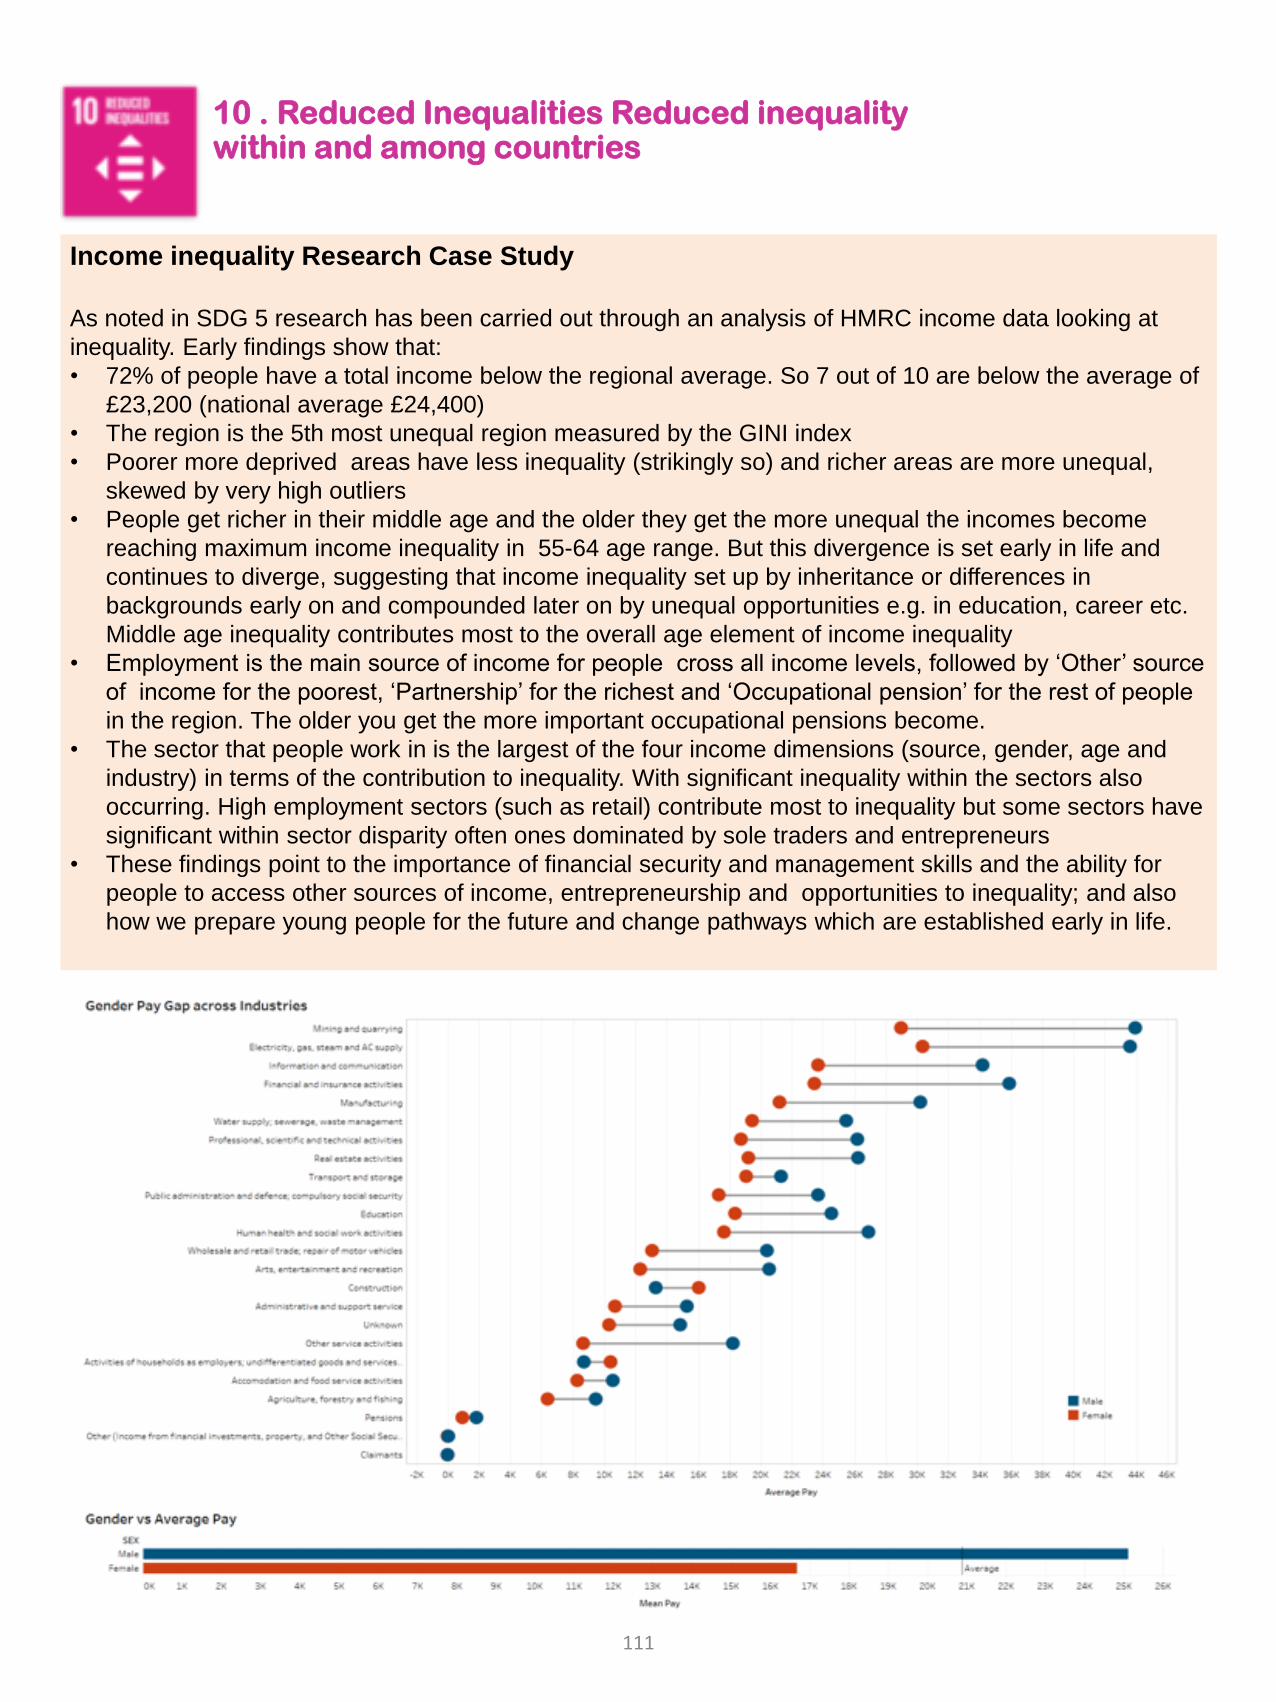
10 . Reduced Inequalities Reduced inequality within and among countries
Income inequality Research Case Study
As noted in SDG 5 research has been carried out through an analysis of HMRC income data looking at
inequality. Early findings show that:
• 72% of people have a total income below the regional average. So 7 out of 10 are below the average of
£23,200 (national average £24,400)
• The region is the 5th most unequal region measured by the GINI index
• Poorer more deprived areas have less inequality (strikingly so) and richer areas are more unequal,
skewed by very high outliers
• People get richer in their middle age and the older they get the more unequal the incomes become
reaching maximum income inequality in 55-64 age range. But this divergence is set early in life and
continues to diverge, suggesting that income inequality set up by inheritance or differences in
backgrounds early on and compounded later on by unequal opportunities e.g. in education, career etc.
Middle age inequality contributes most to the overall age element of income inequality
• Employment is the main source of income for people cross all income levels, followed by ‘Other’ source
of income for the poorest, ‘Partnership’ for the richest and ‘Occupational pension’ for the rest of people
in the region. The older you get the more important occupational pensions become.
• The sector that people work in is the largest of the four income dimensions (source, gender, age and
industry) in terms of the contribution to inequality. With significant inequality within the sectors also
occurring. High employment sectors (such as retail) contribute most to inequality but some sectors have
significant within sector disparity often ones dominated by sole traders and entrepreneurs
• These findings point to the importance of financial security and management skills and the ability for
people to access other sources of income, entrepreneurship and opportunities to inequality; and also
how we prepare young people for the future and change pathways which are established early in life.
111
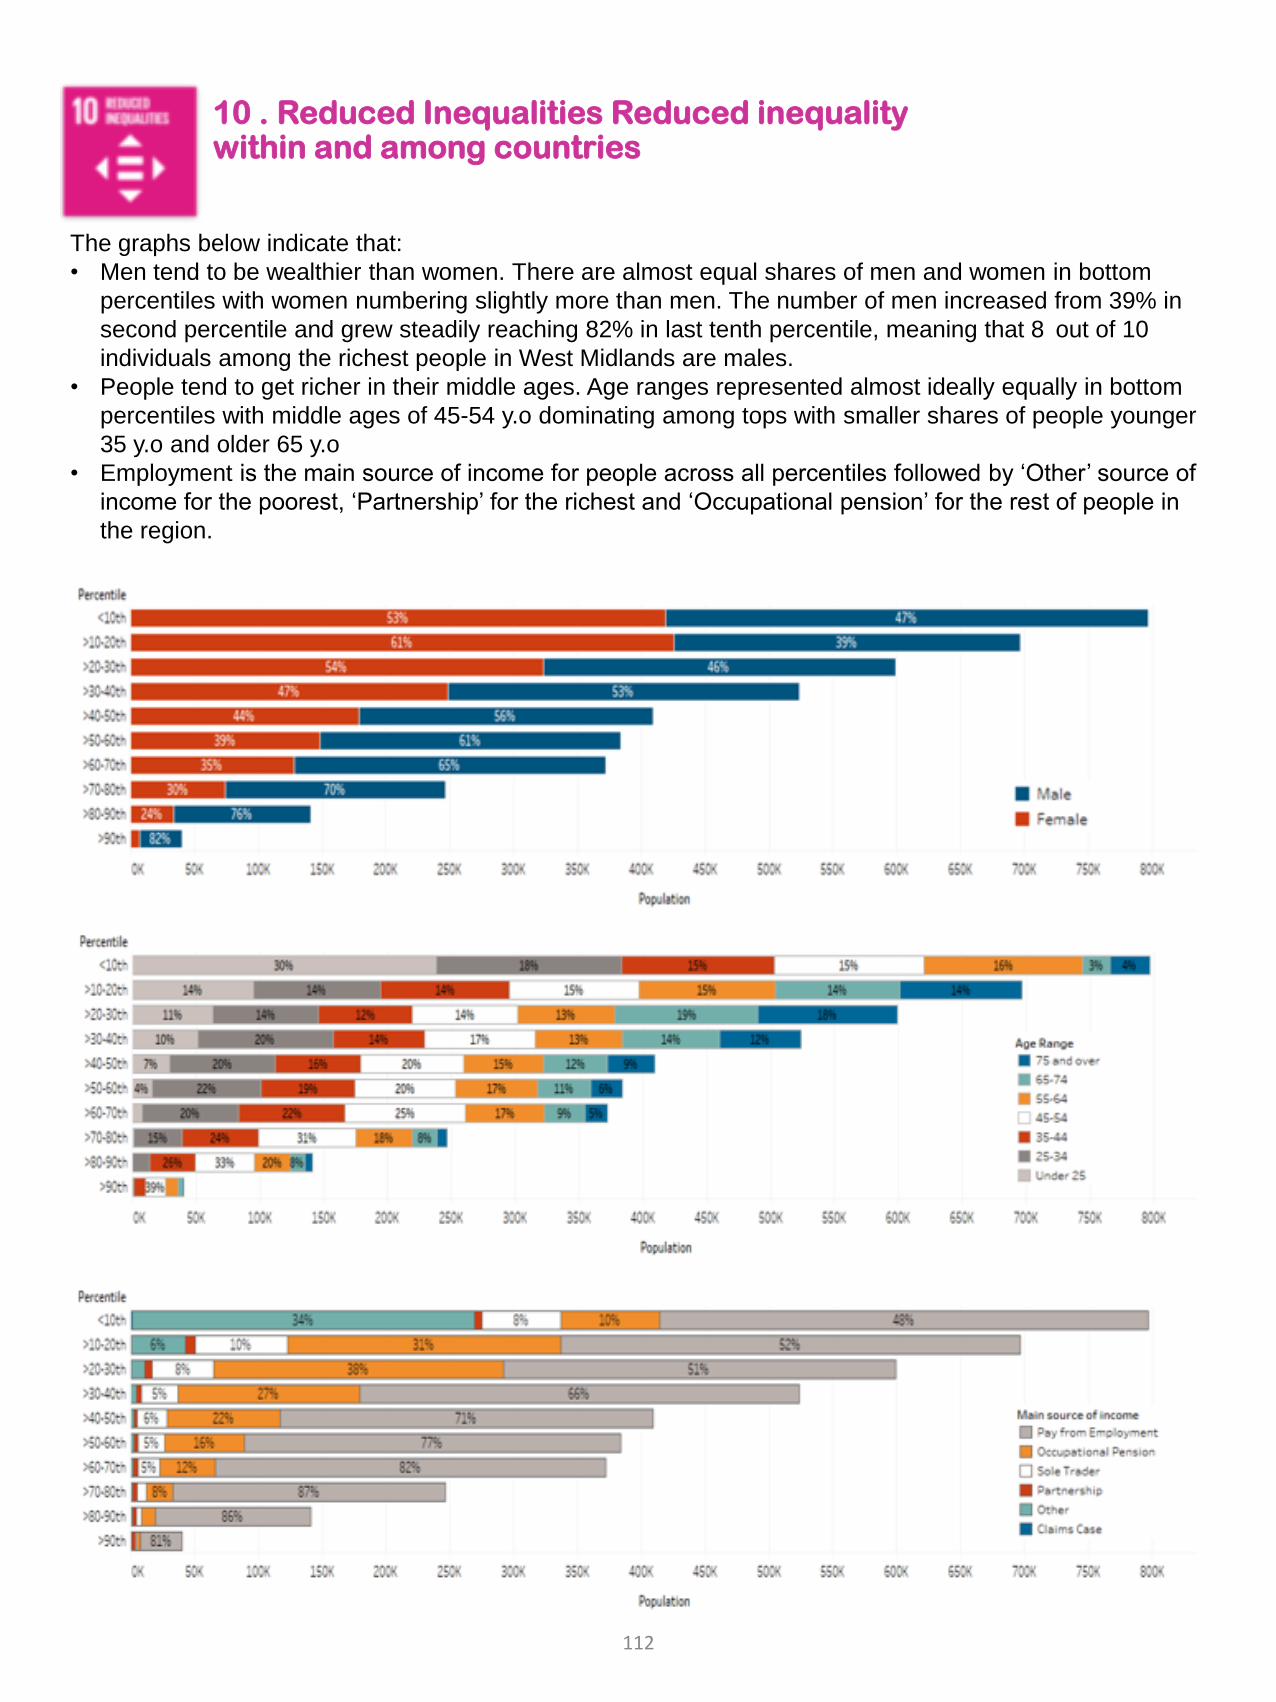
10 . Reduced Inequalities Reduced inequality within and among countries
The graphs below indicate that:
• Men tend to be wealthier than women. There are almost equal shares of men and women in bottom
percentiles with women numbering slightly more than men. The number of men increased from 39% in
second percentile and grew steadily reaching 82% in last tenth percentile, meaning that 8 out of 10
individuals among the richest people in West Midlands are males.
• People tend to get richer in their middle ages. Age ranges represented almost ideally equally in bottom
percentiles with middle ages of 45-54 y.o dominating among tops with smaller shares of people younger
35 y.o and older 65 y.o
• Employment is the main source of income for people across all percentiles followed by ‘Other’ source of
income for the poorest, ‘Partnership’ for the richest and ‘Occupational pension’ for the rest of people in
the region.
112
11. Sustainable Cities and Communities - Make cities and human settlements inclusive, safe, resilient and sustainable
Across the WM 7 Met. area the percentage of the local authority designated as Green Belt land varies from
67% in Solihull down to 12% in Wolverhampton which is the only local authority below the England average
of 13%.
Overall, for the WMCA, the 2019 election results for turnout (the number of valid votes cast as a proportion
of the electorate) is 63.1%, this is below the UK average of 67.3%. Compared to 2017, the turnout has
decreased from 65.6% for the WMCA.
There were 5,564 reported traffic collisions in the WM 7 Met. area in 2018, this has decreased by 5.0% (-
291) since 2017.
In 2018/19 there was a total of 3,822 additional affordable dwellings completions across the WMCA, this
has increased by 353 when compared to 2017/18. There were also 1,960 additional affordable rented
dwelling completions in 2018/19 which has increased by 238 since 2018/19.
There are 1.36 households in temporary accommodation in the WM region compared to 2.66 per 100,000
households nationally. Birmingham is worst at 5.47. 9% of homes in Birmingham are classed as
overcrowded – the second highest rates in the UK)
Children and Young People with a care experience In the West Midlands region overall, 82 children per
100,000 (10,560 children) are in care – this is higher than the national average of 65 per 100,000 . 20.3%
of Children in low income families in WM region (224,965 children) versus 17% nationally. In the West
Midlands region overall, 82 children per 100,000 (10,560 children) have had an experience of care. At a
local Authority level this varies Birmingham (67 per 100,000); Coventry (89 per 100,000); Dudley (95 per
100,000); Sandwell (109 per 100,000); Solihull (90 per 1000,000); Walsall (90 per 100,000) and
Wolverhampton (102 per 100,000)
Percentage of population within 300/900m of a park, public garden or playing field
Source Ordnance Survey 2020
Ethnicity
Within White
Mixed/multiple
ethnic groups
Asian/Asian
British
Black/African/C
aribbean/Black
British
Other ethnic
groups
900m 94% 97% 98% 99% 98%
300m 51% 55% 55% 58% 56%
113
11. Sustainable Cities and Communities - Make cities and human settlements inclusive, safe, resilient and sustainable
Housing and Regeneration Case Study
In the West Midlands, there are over 200,000 jobs in construction, alongside considerably more in related
professional, support and specialist services. In recent years, the urban renaissance in the region has
seen major investment in key infrastructure such as HS2, new employment opportunities create, facilities
for the Commonwealth Games delivered, a national reputation for brownfield regeneration achieved and a
record increase nationally in the number of new homes delivered each year. Covid19 has placed some
significant challenges on that positive trajectory. Viability was already a challenge on development sites
(especially brownfield sites) hence the need for major public sector investment and intervention, town
centres in our region were facing significant retail voids and declining rents and housing affordability was a
growing challenge.
In response to the emerging impacts of the pandemic, the WMCAs Housing and Land Delivery Board
commissioned a review of the Portfolio’s business plan to revise, refine and renew the work programme
that includes town centres, advanced methods of construction, housing delivery, affordable housing,
industry diversity, brownfield regeneration, public-private partnerships, the disposal and development of
public land and alignment between transport and real estate.
To inform this work we have established two working groups of our existing stakeholder forums and round
tables to co-develop and shape our portfolio recovery planning work, providing critical evidence and market
intelligence and ensuring we have key business and public sector engagement throughout. One is a
working group of lead regeneration and housing officials of our local councils, LEPs and Homes England;
the second is a working group of lead real estate investors, housing associations and developers from our
Commercial Property Forum we operate jointly with the British Property Federation.
We are also working very closely with and seeking advice, ideas and sounding from the Overview and
Scrutiny housing group, LEPs, the British Property Federation, the wider real estate and property
community and our expert taskforces such as the AMC (Advanced Methods of Construction) taskforce and
the Town Centre Taskforce led by Jon Bramwell of HSBC.
This engagement is critical to understanding the emerging picture for housing and regeneration in the
region, providing insight and evidence to inform our collective response and ongoing recovery work. Some
of the key themes that have emerged throughout this engagement include:
• Market demand for housing post-lockdown, including types of homes and tenures
• Impact on investor confidence, acquisitions and schemes being brought forward
• Future demand for commercial office space, retail units and town/urban centre locations
• The impact on local authority resources, prioritisation and capacity
• The need for timely, local evidence to inform policy and decision making
This work is ongoing and will be crucial to identifying and understanding the key emerging trends in the
emerging post-lockdown environment, as the West Midlands looks to regain the momentum seen pre-
pandemic.
114
12. Consumption and Production – ensure sustainable consumption and production patterns
In 2018/19 there was a total of 1,274,588 tonnes of local authority waste collected across the WM 7 Met.
area, this drops down to 1,094,011 tonnes when restricting to household waste. However, when compared
to 2017/18 the WM 7 Met. area has increased by 7,377 tonnes for total local authority collected waste and
by 2,267 for household waste.
The proportion of local authority collected waste that is sent for either recycling, composting or reuse has
decreased from 31.0% in 2017/18 to 30.5% in 2018/19. Similar patterns can be seen when restricting to
households where 31.9% was sent for recycling, composting or reuse in 2017/18 to 31.1% in 2018/19.
Institutions collaborate to address the impact of Covid-19 on the Birmingham economy
The Birmingham Anchor Network – which represents seven of the City’s largest institutions, a combined
workforce of over 50,000 people and budget of over £5bn – have released an Action Plan for response to
the impact of Covid-19 on the Birmingham economy. This co-ordinated response is believed to be the first
of its kind anywhere by a network of anchor institutions. Members include:
• Aston University
• Birmingham City Council
• Bournville Village Trust
• Office of the Police and Crime Commissioner West Midlands
• The Pioneer Group
• The University of Birmingham
• University Hospitals Birmingham NHS Foundation Trust
The Birmingham Anchor Network Action Plan builds on two years of work developing the Network by the
economic think tank, the Centre for Local Economic Strategies, funded by the independent charitable
foundation for socially just change, Barrow Cadbury Trust. Last year the members of the Network
committed to progress joint action to utilise their spending power, workforces and land and assets to build a
more inclusive and equitable city economy.
As well as setting out the immediate steps that the anchor institutions in the Network will undertake to
address the economic and social impact of the pandemic, the Action Plan has within it a number of bold
steps that will lead to long term reform of the Birmingham economy. This includes exploring how to link
existing opportunities for employment in the health sector to residents who are facing redundancy due to
Covid-19 and how locally-owned construction firms can access new work from the backlog in housing
association building repairs created by the lockdown.
115
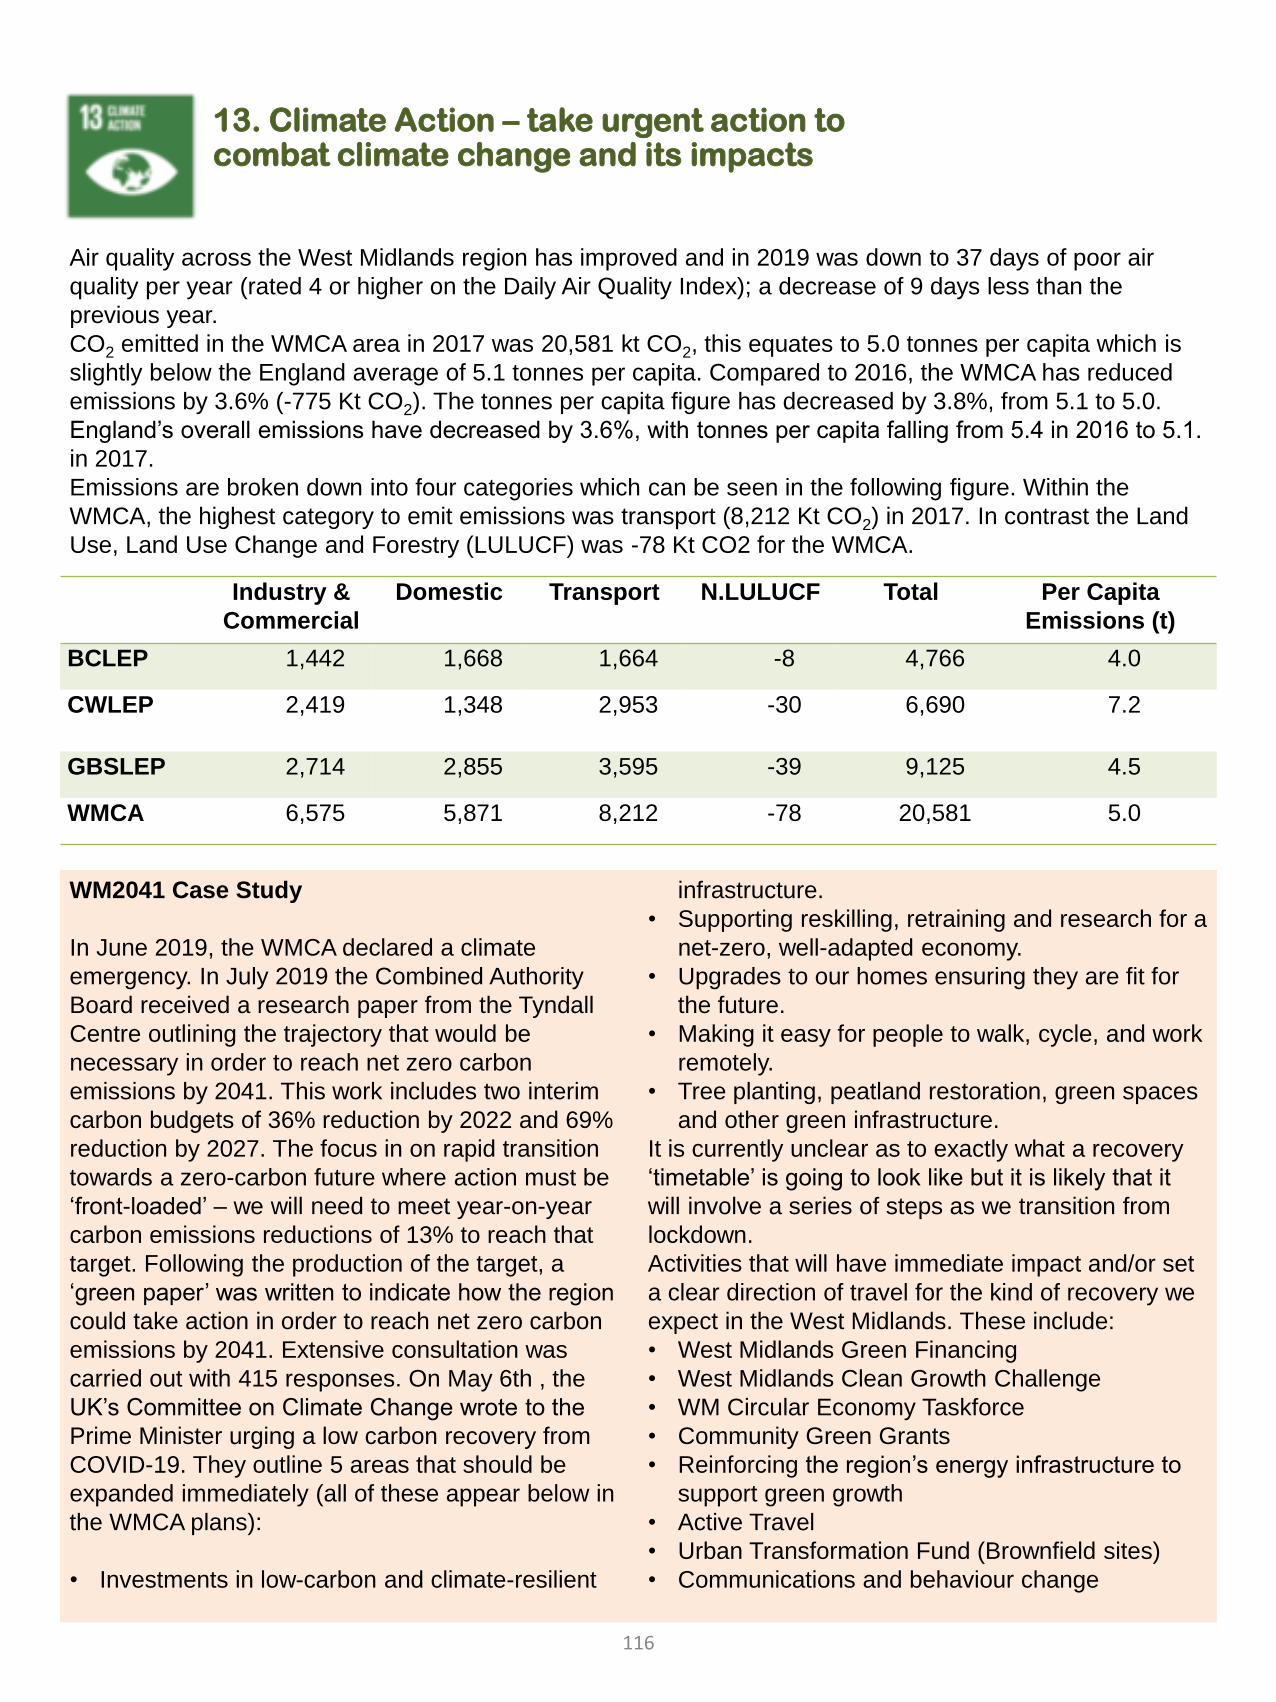
13. Climate Action – take urgent action to combat climate change and its impacts
Air quality across the West Midlands region has improved and in 2019 was down to 37 days of poor air
quality per year (rated 4 or higher on the Daily Air Quality Index); a decrease of 9 days less than the
previous year.
CO2 emitted in the WMCA area in 2017 was 20,581 kt CO2, this equates to 5.0 tonnes per capita which is
slightly below the England average of 5.1 tonnes per capita. Compared to 2016, the WMCA has reduced
emissions by 3.6% (-775 Kt CO2). The tonnes per capita figure has decreased by 3.8%, from 5.1 to 5.0.
England’s overall emissions have decreased by 3.6%, with tonnes per capita falling from 5.4 in 2016 to 5.1.
in 2017.
Emissions are broken down into four categories which can be seen in the following figure. Within the
WMCA, the highest category to emit emissions was transport (8,212 Kt CO2) in 2017. In contrast the Land
Use, Land Use Change and Forestry (LULUCF) was -78 Kt CO2 for the WMCA.
Industry &
Commercial
Domestic Transport N.LULUCF Total Per Capita
Emissions (t)
BCLEP 1,442 1,668 1,664 -8 4,766 4.0
CWLEP 2,419 1,348 2,953 -30 6,690 7.2
GBSLEP 2,714 2,855 3,595 -39 9,125 4.5
WMCA 6,575 5,871 8,212 -78 20,581 5.0
WM2041 Case Study
In June 2019, the WMCA declared a climate
emergency. In July 2019 the Combined Authority
Board received a research paper from the Tyndall
Centre outlining the trajectory that would be
necessary in order to reach net zero carbon
emissions by 2041. This work includes two interim
carbon budgets of 36% reduction by 2022 and 69%
reduction by 2027. The focus in on rapid transition
towards a zero-carbon future where action must be
‘front-loaded’ – we will need to meet year-on-year
carbon emissions reductions of 13% to reach that
target. Following the production of the target, a
‘green paper’ was written to indicate how the region
could take action in order to reach net zero carbon
emissions by 2041. Extensive consultation was
carried out with 415 responses. On May 6th , the
UK’s Committee on Climate Change wrote to the
Prime Minister urging a low carbon recovery from
COVID-19. They outline 5 areas that should be
expanded immediately (all of these appear below in
the WMCA plans):
• Investments in low-carbon and climate-resilient
infrastructure.
• Supporting reskilling, retraining and research for a
net-zero, well-adapted economy.
• Upgrades to our homes ensuring they are fit for
the future.
• Making it easy for people to walk, cycle, and work
remotely.
• Tree planting, peatland restoration, green spaces
and other green infrastructure.
It is currently unclear as to exactly what a recovery
‘timetable’ is going to look like but it is likely that it
will involve a series of steps as we transition from
lockdown.
Activities that will have immediate impact and/or set
a clear direction of travel for the kind of recovery we
expect in the West Midlands. These include:
• West Midlands Green Financing
• West Midlands Clean Growth Challenge
• WM Circular Economy Taskforce
• Community Green Grants
• Reinforcing the region’s energy infrastructure to
support green growth
• Active Travel
• Urban Transformation Fund (Brownfield sites)
• Communications and behaviour change
116
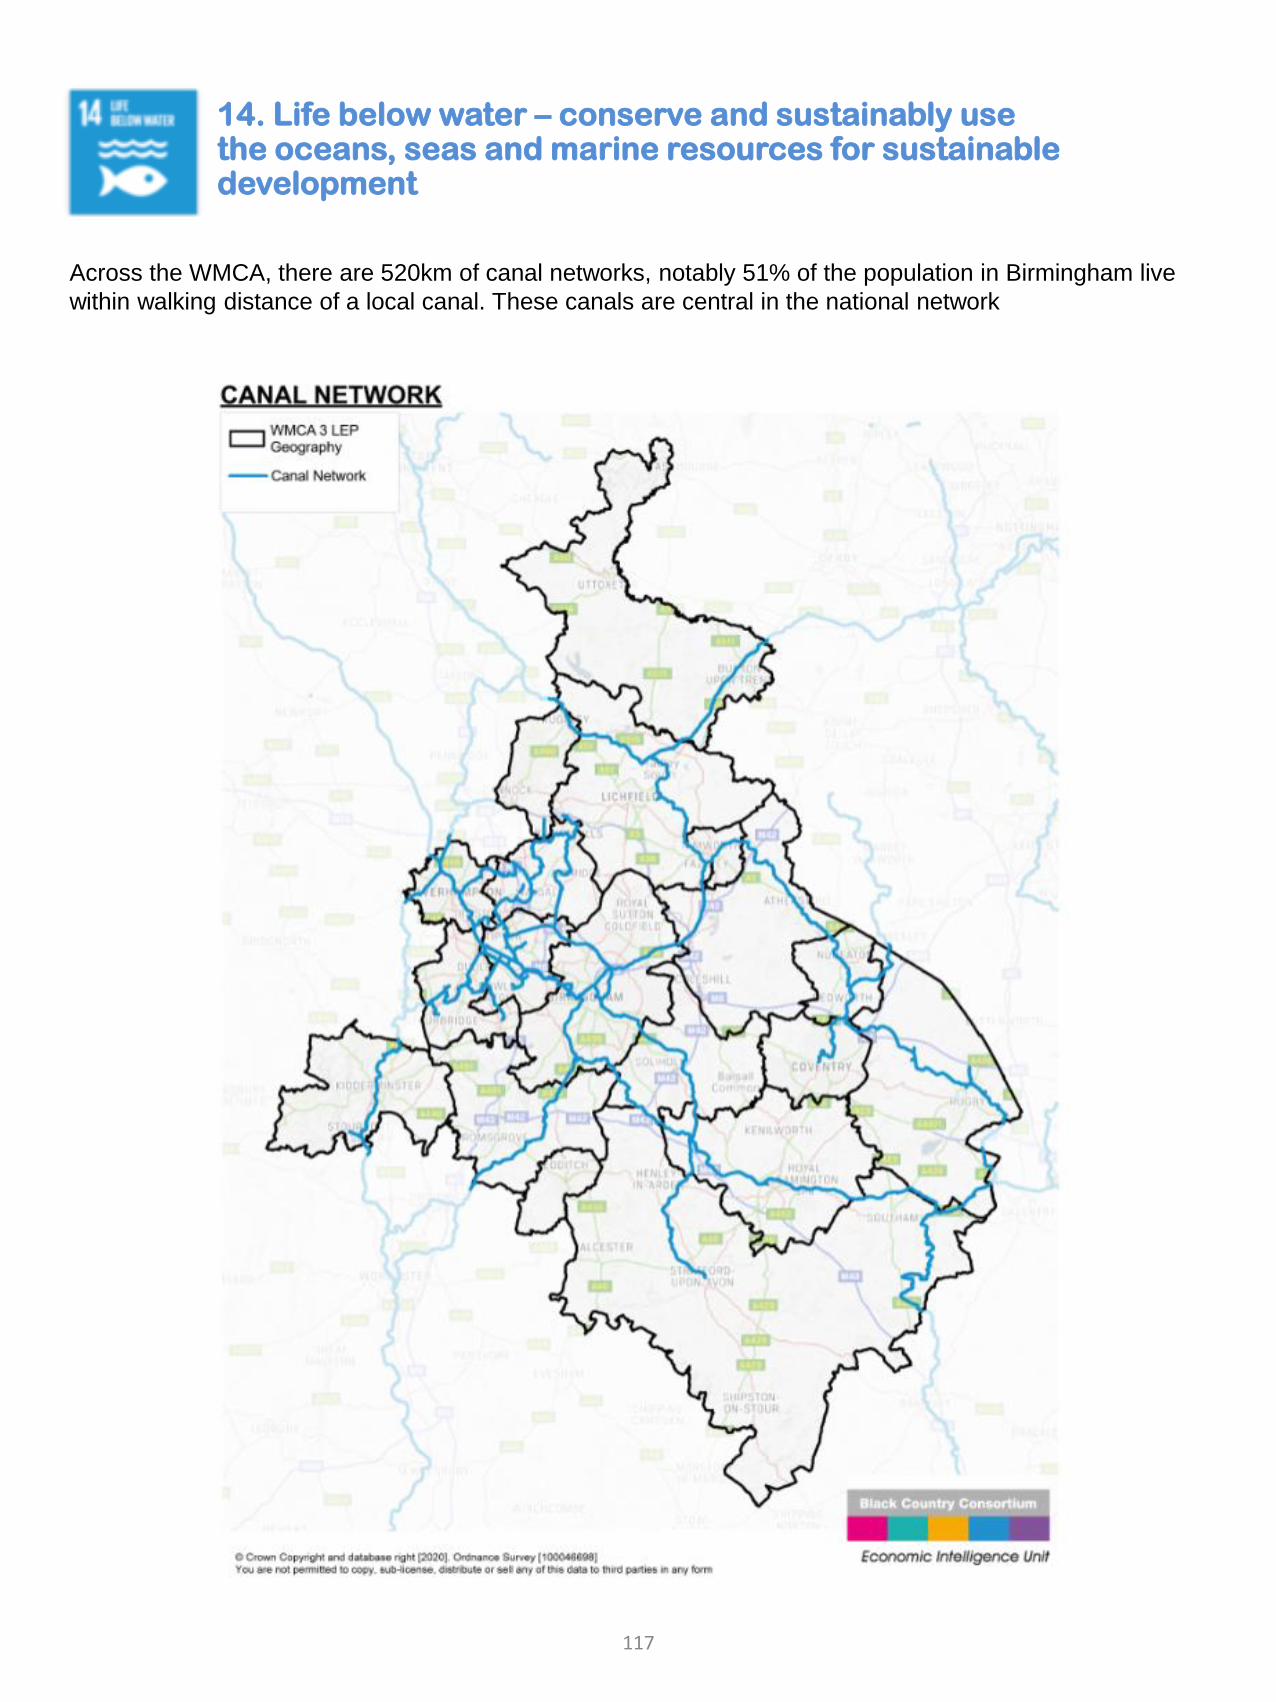
14. Life below water – conserve and sustainably use the oceans, seas and marine resources for sustainable development
Across the WMCA, there are 520km of canal networks, notably 51% of the population in Birmingham live
within walking distance of a local canal. These canals are central in the national network
117
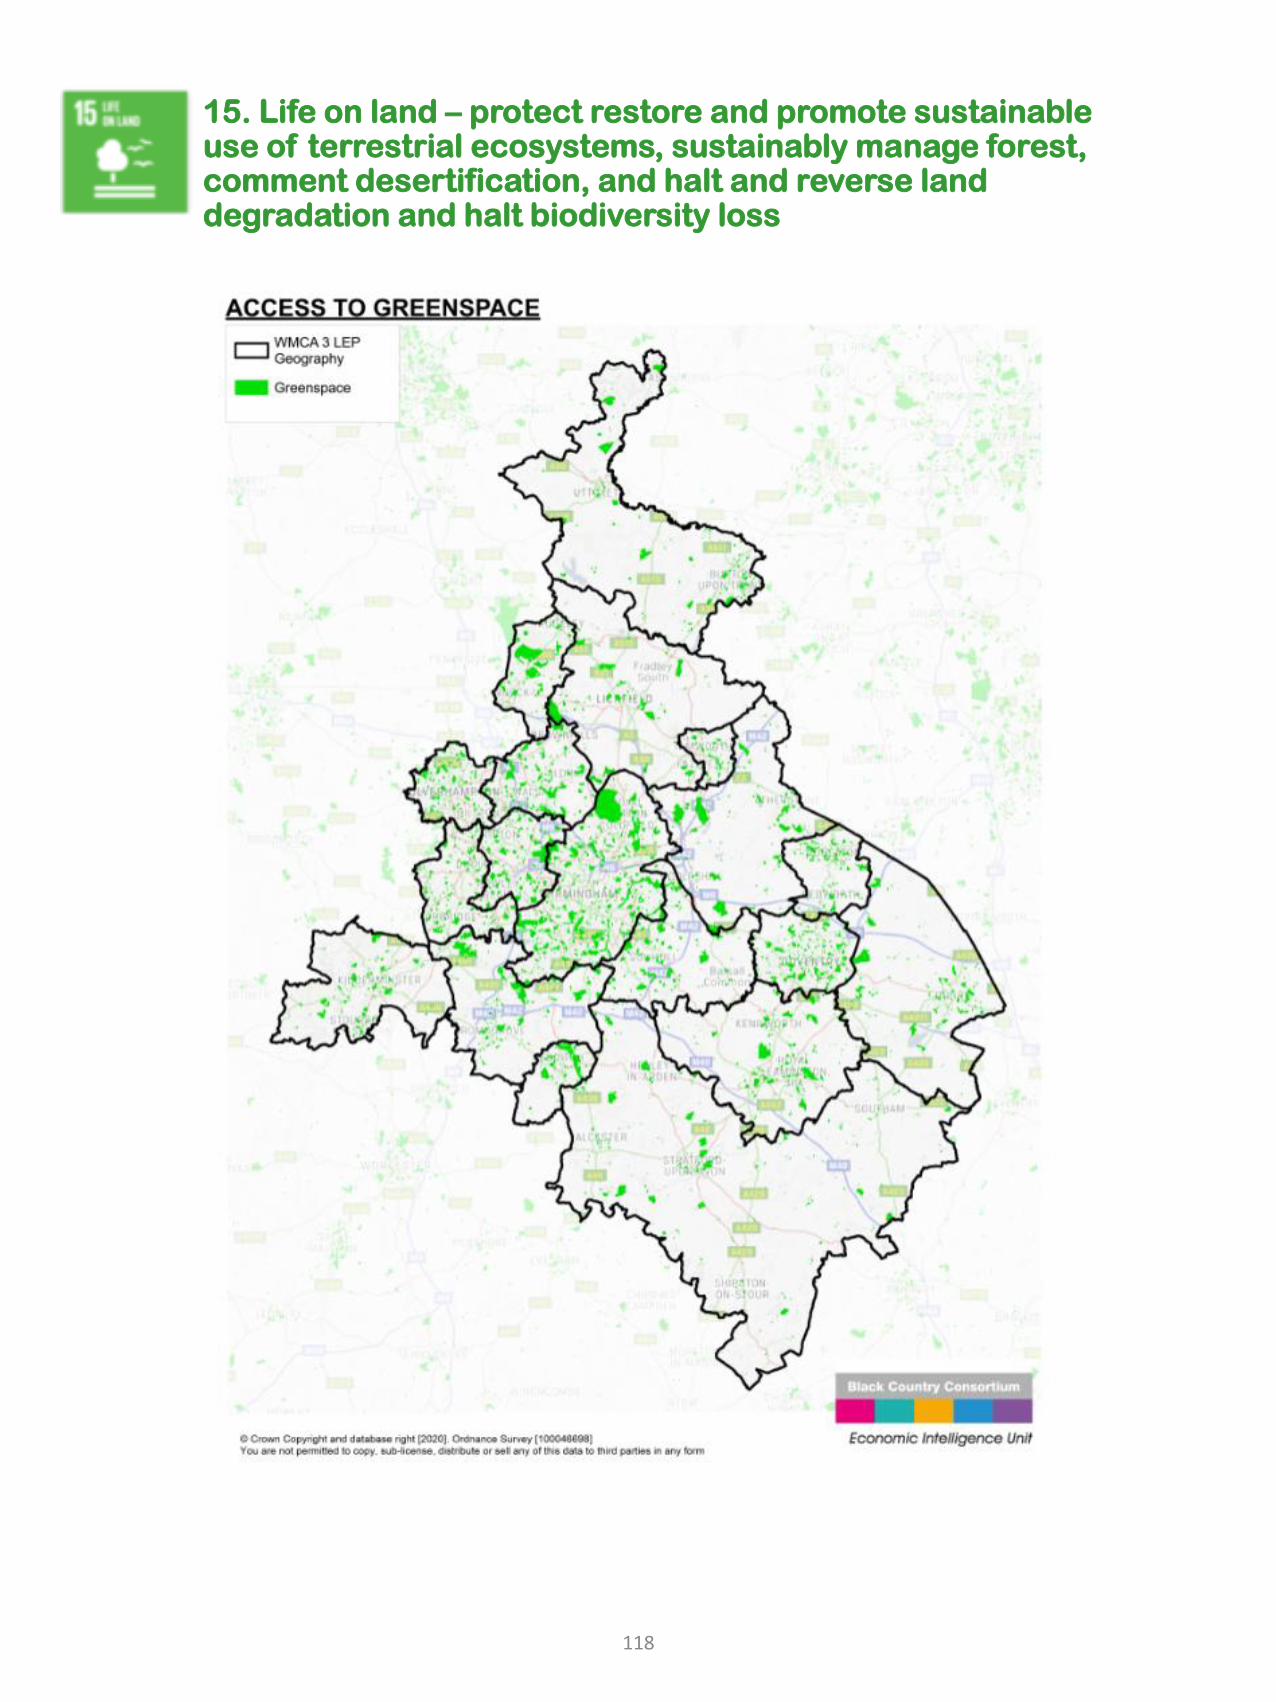
15. Life on land – protect restore and promote sustainable use of terrestrial ecosystems, sustainably manage forest, comment desertification, and halt and reverse land degradation and halt biodiversity loss
118
16. Peace and Justice - Promote peaceful and inclusive societies for sustainable development, provide access to justice for all and build effective, accountable and inclusive institutions at all levels
There were 87,780 reports of violence against the person in 2019. This has increased by 24.4% since
2018, while the national average increase was 9.4%. In 2019, violence against the person was 30.1 per
1,000 population which is slightly above the England average of 29.1 per 1,000 population.
The number of first-time entrants to the youth justice system in the WM 7 Met. area has decreased from
399 per 100,000 in 2018 to 308. Similar patterns where seen across England with a decrease from 296 per
100,000 in 2018 to 239.
Citizen’s Panel Research Case Study
A new Citizens’ Panel has been set up to help guide the West Midlands’ recovery from Covid-19.
The group, which is made up of 36 people representing the diverse make-up of the region, will spend the
next month learning about the impact of Covid-19 on communities and will help guide what recovery plans
should focus on.
This community engagement will complement the region’s ongoing economic recovery work, which is being
spearheaded by the Economic Impact Group, which brings together business leaders, central government,
banks, trade unions and local authorities.
The Citizens’ Panel has been commissioned by the West Midlands Recovery Co-ordination Group (RCG) -
a collaboration of senior officials from the region’s local authorities, emergency services and Local
Enterprise Partnerships.
The panel will share their experiences, consider evidence on impacts from expert witnesses, and deliberate
over challenging trade-offs, before putting forward a set of recommendations to the RCG.
The RCG will use the recommendations of the Citizens’ Panel to help inform the region’s political leaders
on their post-Covid-19 recovery plans.
The programme is being delivered by BritainThinks, an independent insight and strategy agency, and is
supported by Engage Britain, which is a charity focused on bringing together people with different views,
knowledge and experience to help tackle the biggest challenges facing the country.
119
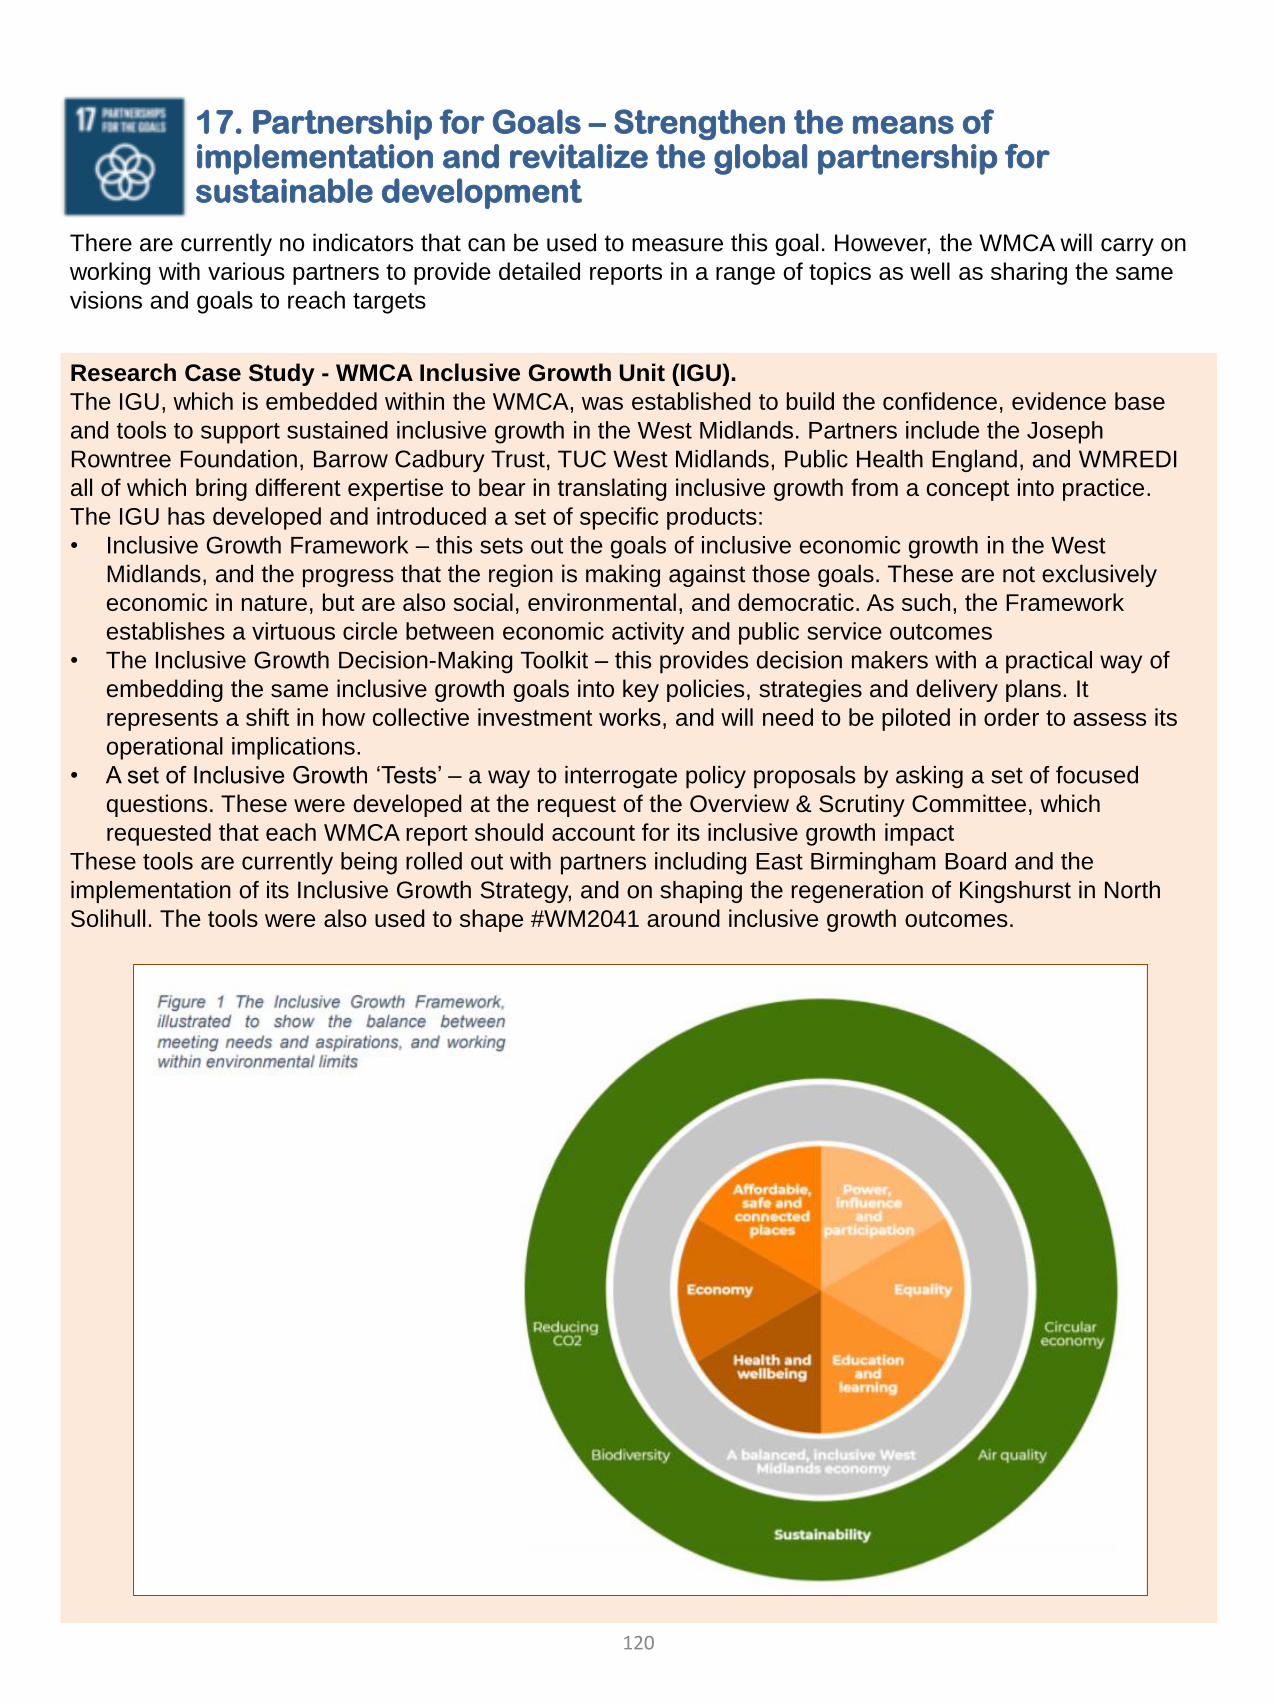
17. Partnership for Goals – Strengthen the means of implementation and revitalize the global partnership for sustainable development
There are currently no indicators that can be used to measure this goal. However, the WMCA will carry on
working with various partners to provide detailed reports in a range of topics as well as sharing the same
visions and goals to reach targets
Research Case Study - WMCA Inclusive Growth Unit (IGU).
The IGU, which is embedded within the WMCA, was established to build the confidence, evidence base
and tools to support sustained inclusive growth in the West Midlands. Partners include the Joseph
Rowntree Foundation, Barrow Cadbury Trust, TUC West Midlands, Public Health England, and WMREDI
all of which bring different expertise to bear in translating inclusive growth from a concept into practice.
The IGU has developed and introduced a set of specific products:
• Inclusive Growth Framework – this sets out the goals of inclusive economic growth in the West
Midlands, and the progress that the region is making against those goals. These are not exclusively
economic in nature, but are also social, environmental, and democratic. As such, the Framework
establishes a virtuous circle between economic activity and public service outcomes
• The Inclusive Growth Decision-Making Toolkit – this provides decision makers with a practical way of
embedding the same inclusive growth goals into key policies, strategies and delivery plans. It
represents a shift in how collective investment works, and will need to be piloted in order to assess its
operational implications.
• A set of Inclusive Growth ‘Tests’ – a way to interrogate policy proposals by asking a set of focused
questions. These were developed at the request of the Overview & Scrutiny Committee, which
requested that each WMCA report should account for its inclusive growth impact
These tools are currently being rolled out with partners including East Birmingham Board and the
implementation of its Inclusive Growth Strategy, and on shaping the regeneration of Kingshurst in North
Solihull. The tools were also used to shape #WM2041 around inclusive growth outcomes.
120
Regional Outcome Indicators
The region continues to monitor change through the comprehensive list of
monitoring indicators to help us understand the performance of the region
The following section provides the detail of those indicators and the how the region
has faired. This data is largely pre covid-19
121
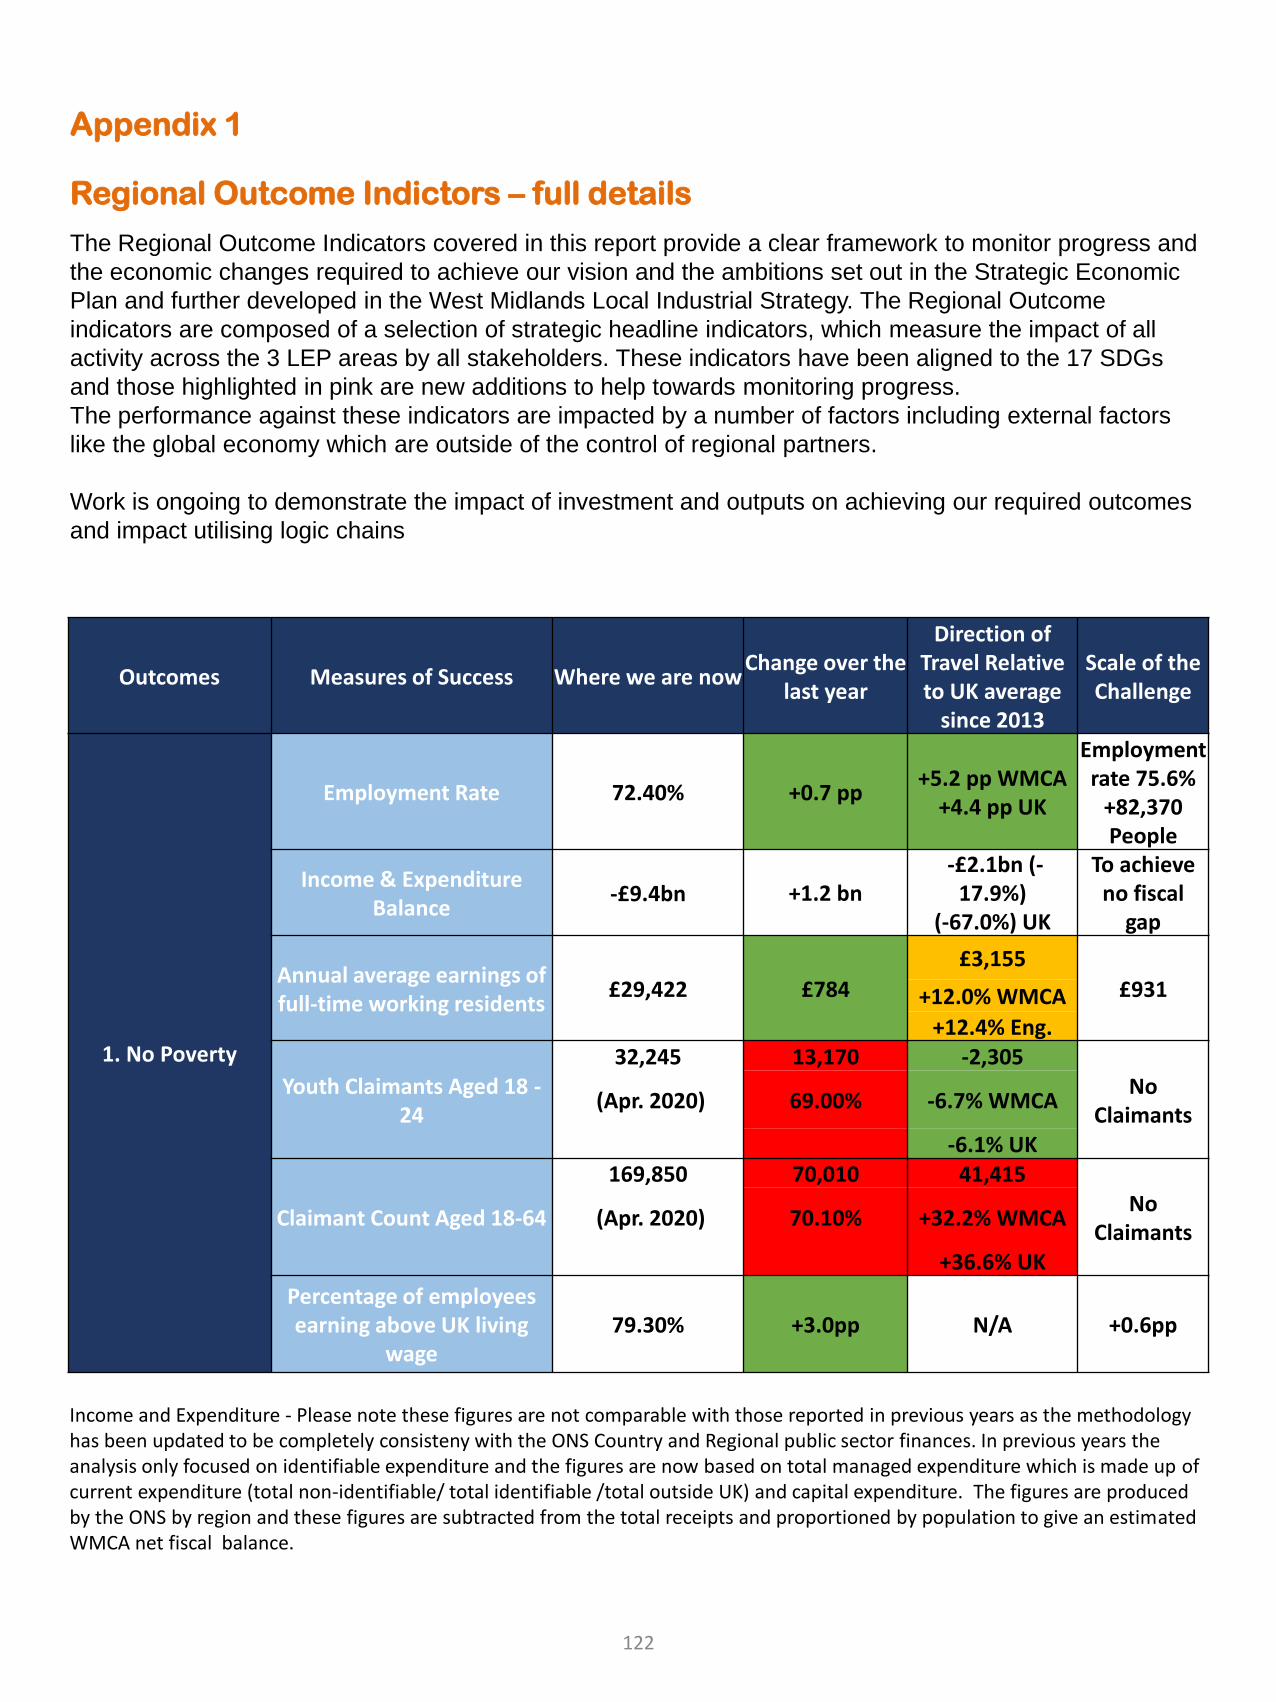
Appendix 1
Regional Outcome Indictors – full details
The Regional Outcome Indicators covered in this report provide a clear framework to monitor progress and
the economic changes required to achieve our vision and the ambitions set out in the Strategic Economic
Plan and further developed in the West Midlands Local Industrial Strategy. The Regional Outcome
indicators are composed of a selection of strategic headline indicators, which measure the impact of all
activity across the 3 LEP areas by all stakeholders. These indicators have been aligned to the 17 SDGs
and those highlighted in pink are new additions to help towards monitoring progress.
The performance against these indicators are impacted by a number of factors including external factors
like the global economy which are outside of the control of regional partners.
Work is ongoing to demonstrate the impact of investment and outputs on achieving our required outcomes
and impact utilising logic chains
Outcomes Measures of Success Where we are nowChange over the
last year
Direction of Travel Relative to UK average
since 2013
Scale of the Challenge
1. No Poverty
Employment Rate 72.40% +0.7 pp+5.2 pp WMCA
+4.4 pp UK
Employment rate 75.6%
+82,370 People
Income & Expenditure Balance
-£9.4bn +1.2 bn-£2.1bn (-
17.9%)(-67.0%) UK
To achieve no fiscal
gap
Annual average earnings of full-time working residents
£29,422 £784
£3,155
£931+12.0% WMCA
+12.4% Eng.
Youth Claimants Aged 18 -24
32,245 13,170 -2,305
(Apr. 2020) 69.00% -6.7% WMCANo
Claimants-6.1% UK
Claimant Count Aged 18-64
169,850 70,010 41,415
(Apr. 2020) 70.10% +32.2% WMCANo
Claimants+36.6% UK
Percentage of employees earning above UK living
wage79.30% +3.0pp N/A +0.6pp
Income and Expenditure - Please note these figures are not comparable with those reported in previous years as the methodology has been updated to be completely consisteny with the ONS Country and Regional public sector finances. In previous years the analysis only focused on identifiable expenditure and the figures are now based on total managed expenditure which is made up ofcurrent expenditure (total non-identifiable/ total identifiable /total outside UK) and capital expenditure. The figures are produced by the ONS by region and these figures are subtracted from the total receipts and proportioned by population to give an estimated WMCA net fiscal balance.
122
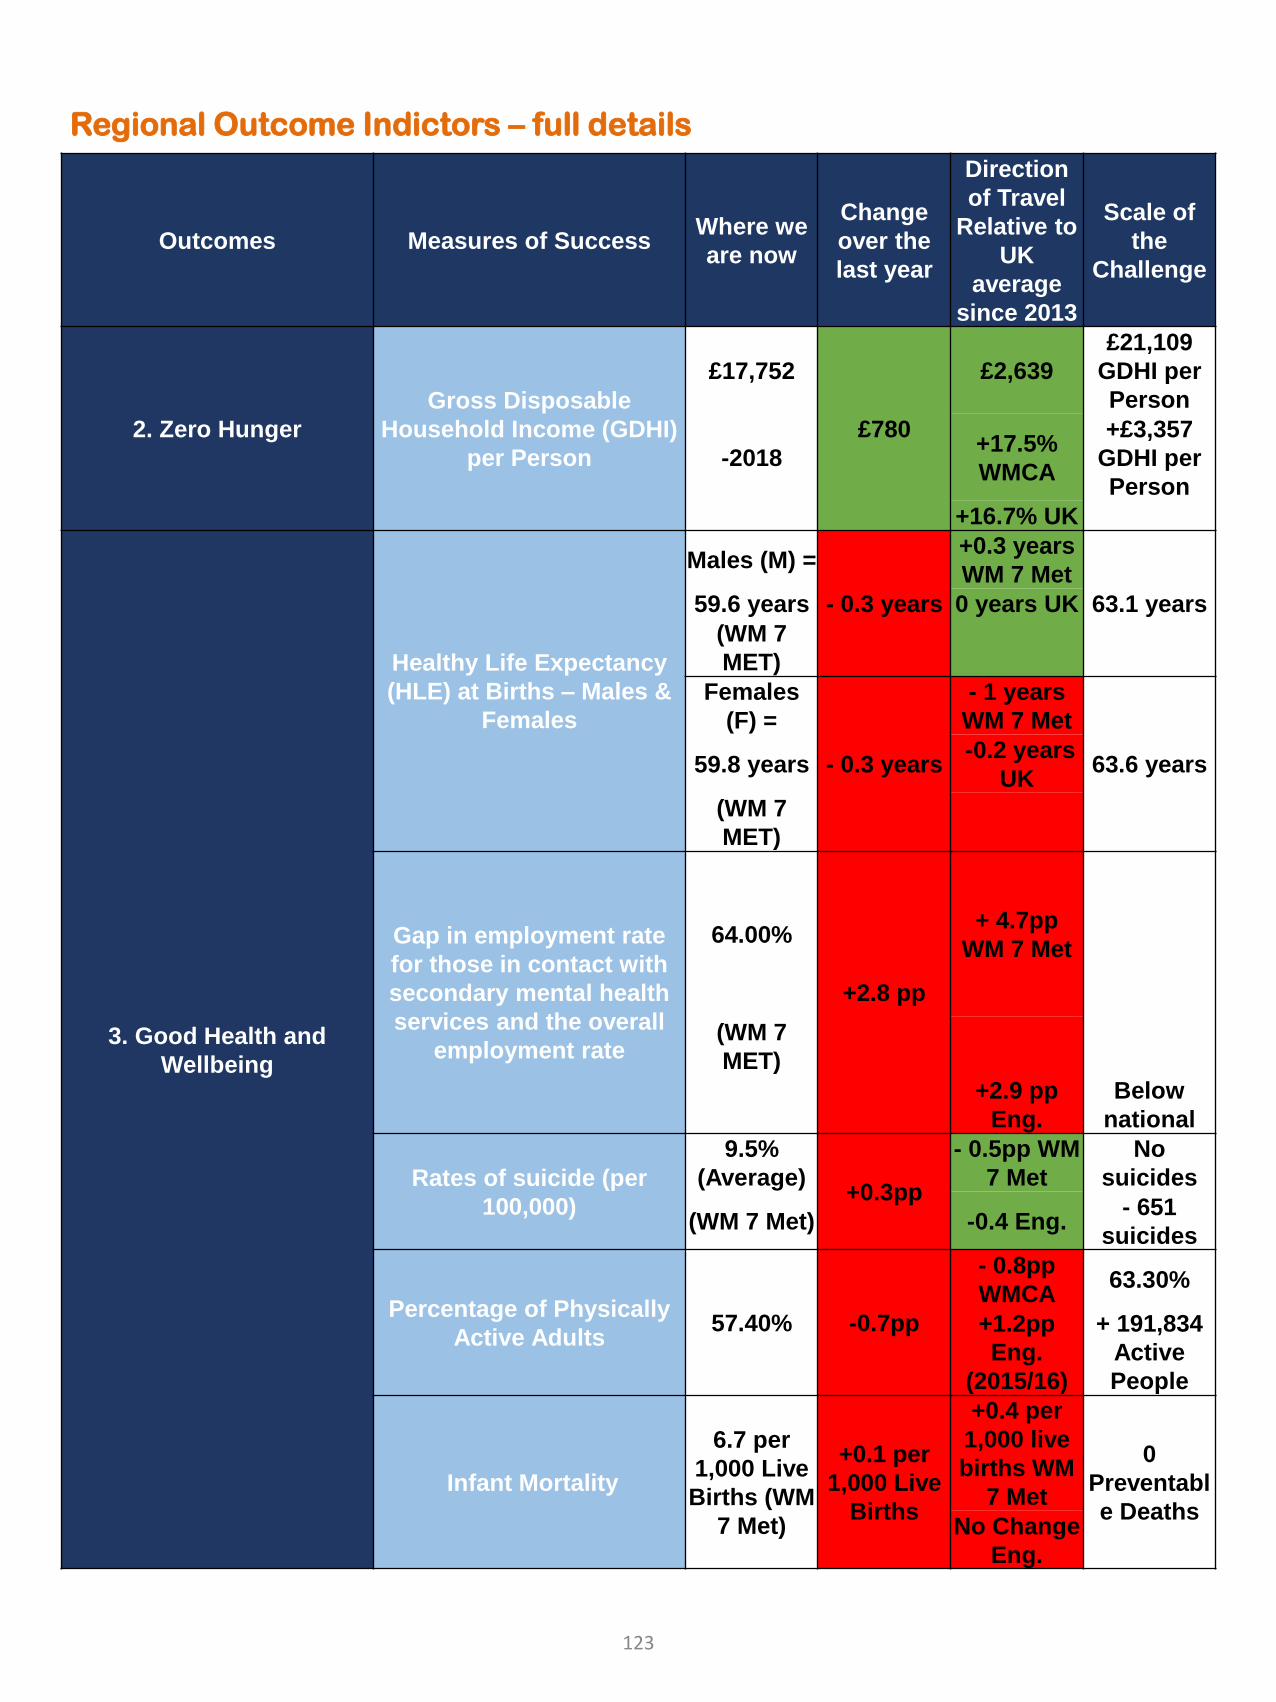
Regional Outcome Indictors – full details
Outcomes Measures of SuccessWhere we
are now
Change
over the
last year
Direction
of Travel
Relative to
UK
average
since 2013
Scale of
the
Challenge
2. Zero Hunger
Gross Disposable
Household Income (GDHI)
per Person
£17,752
£780
£2,639
£21,109
GDHI per
Person
-2018+17.5%
WMCA
+£3,357
GDHI per
Person
+16.7% UK
3. Good Health and
Wellbeing
Healthy Life Expectancy
(HLE) at Births – Males &
Females
Males (M) =
- 0.3 years
+0.3 years
WM 7 Met
63.1 years59.6 years 0 years UK
(WM 7
MET)
Females
(F) =
- 0.3 years
- 1 years
WM 7 Met
63.6 years59.8 years-0.2 years
UK
(WM 7
MET)
Gap in employment rate
for those in contact with
secondary mental health
services and the overall
employment rate
64.00%
+2.8 pp
+ 4.7pp
WM 7 Met
(WM 7
MET)
+2.9 pp
Eng.
Below
national
Rates of suicide (per
100,000)
9.5%
(Average)+0.3pp
- 0.5pp WM
7 Met
No
suicides
(WM 7 Met) -0.4 Eng.- 651
suicides
Percentage of Physically
Active Adults57.40% -0.7pp
- 0.8pp
WMCA63.30%
+1.2pp
Eng.
(2015/16)
+ 191,834
Active
People
Infant Mortality
6.7 per
1,000 Live
Births (WM
7 Met)
+0.1 per
1,000 Live
Births
+0.4 per
1,000 live
births WM
7 Met
0
Preventabl
e DeathsNo Change
Eng.
123
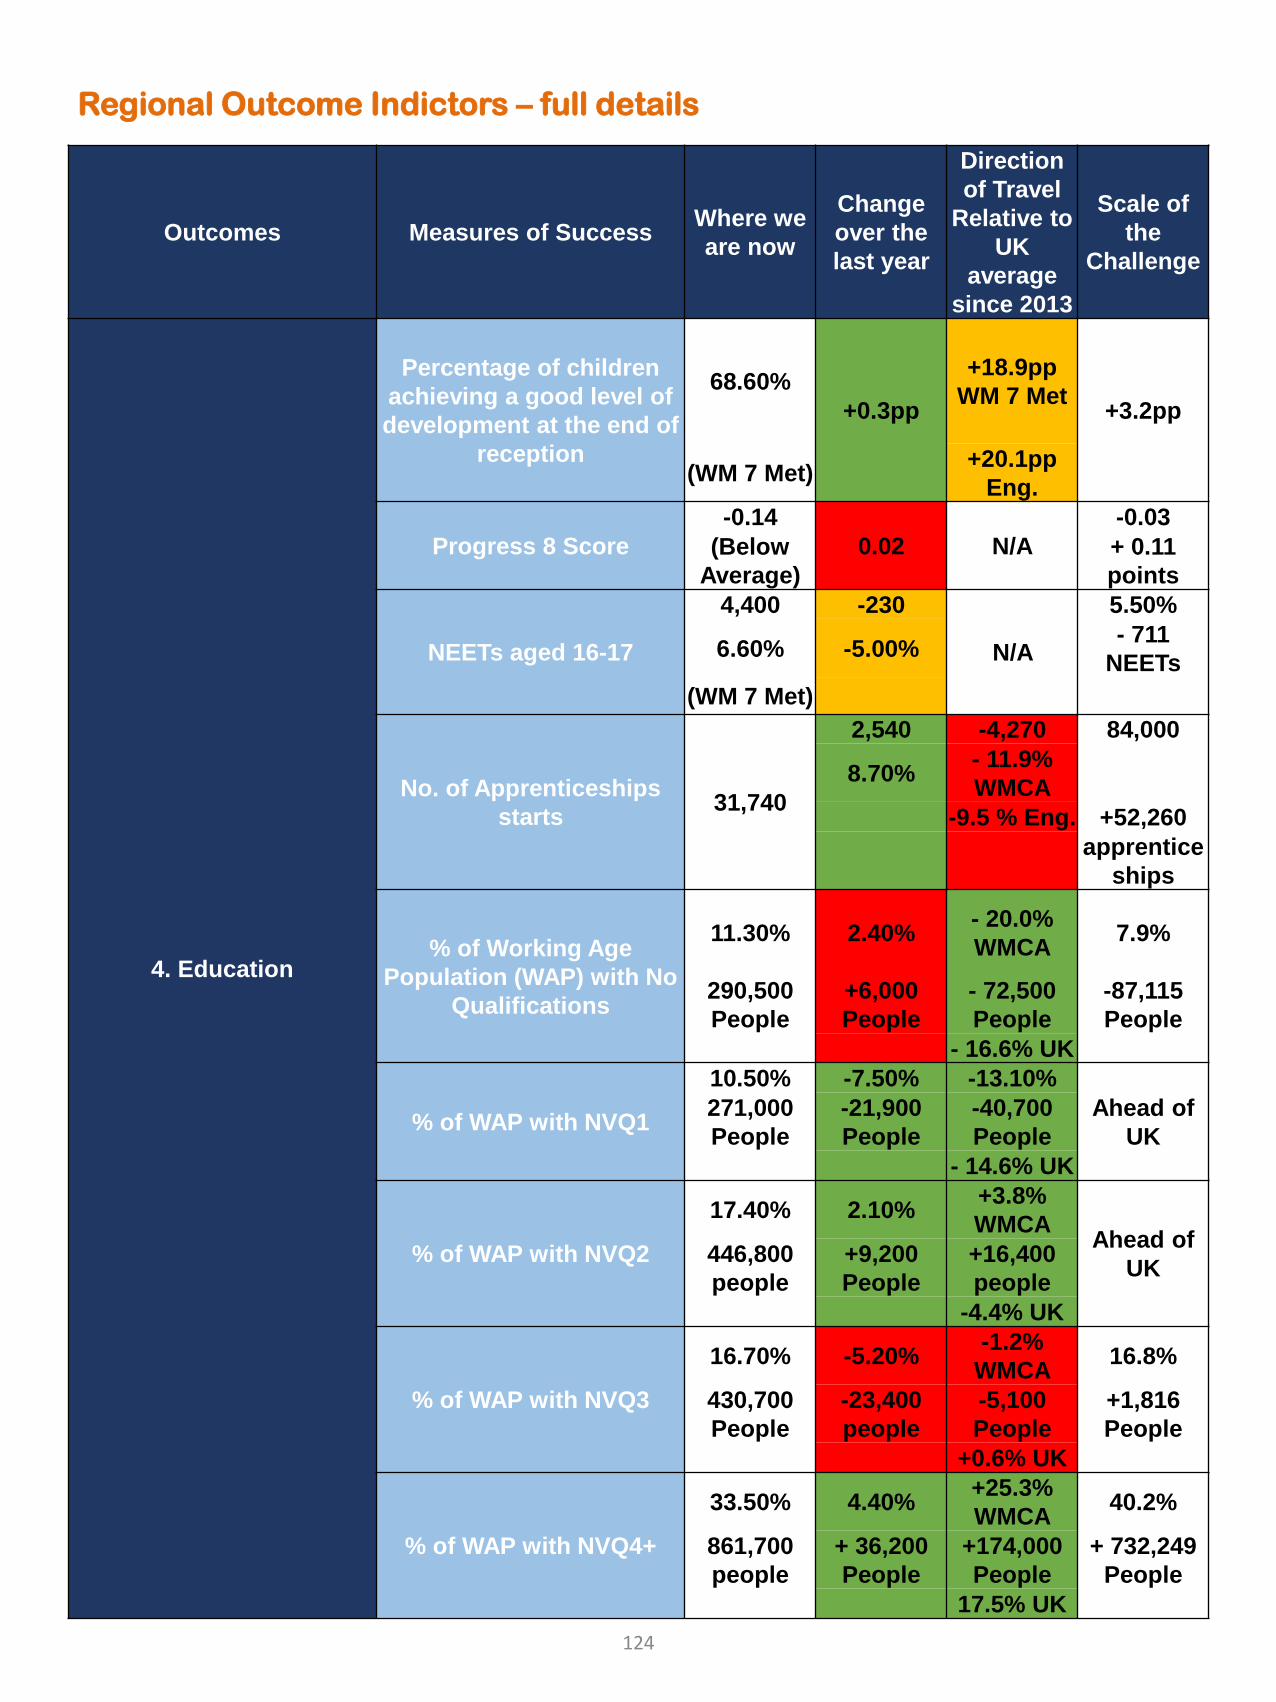
Regional Outcome Indictors – full details
Outcomes Measures of SuccessWhere we
are now
Change
over the
last year
Direction
of Travel
Relative to
UK
average
since 2013
Scale of
the
Challenge
4. Education
Percentage of children
achieving a good level of
development at the end of
reception
68.60%
+0.3pp
+18.9pp
WM 7 Met+3.2pp
(WM 7 Met)+20.1pp
Eng.
Progress 8 Score
-0.14
0.02 N/A
-0.03
(Below
Average)
+ 0.11
points
NEETs aged 16-17
4,400 -230
N/A
5.50%
6.60% -5.00%- 711
NEETs
(WM 7 Met)
No. of Apprenticeships
starts31,740
2,540 -4,270 84,000
8.70%- 11.9%
WMCA
-9.5 % Eng. +52,260
apprentice
ships
% of Working Age
Population (WAP) with No
Qualifications
11.30% 2.40%- 20.0%
WMCA7.9%
290,500
People
+6,000
People
- 72,500
People
-87,115
People
- 16.6% UK
% of WAP with NVQ1
10.50% -7.50% -13.10%
Ahead of
UK
271,000
People
-21,900
People
-40,700
People
- 14.6% UK
% of WAP with NVQ2
17.40% 2.10%+3.8%
WMCAAhead of
UK 446,800
people
+9,200
People
+16,400
people
-4.4% UK
% of WAP with NVQ3
16.70% -5.20%-1.2%
WMCA16.8%
430,700
People
-23,400
people
-5,100
People
+1,816
People
+0.6% UK
% of WAP with NVQ4+
33.50% 4.40%+25.3%
WMCA40.2%
861,700
people
+ 36,200
People
+174,000
People
+ 732,249
People
17.5% UK
124
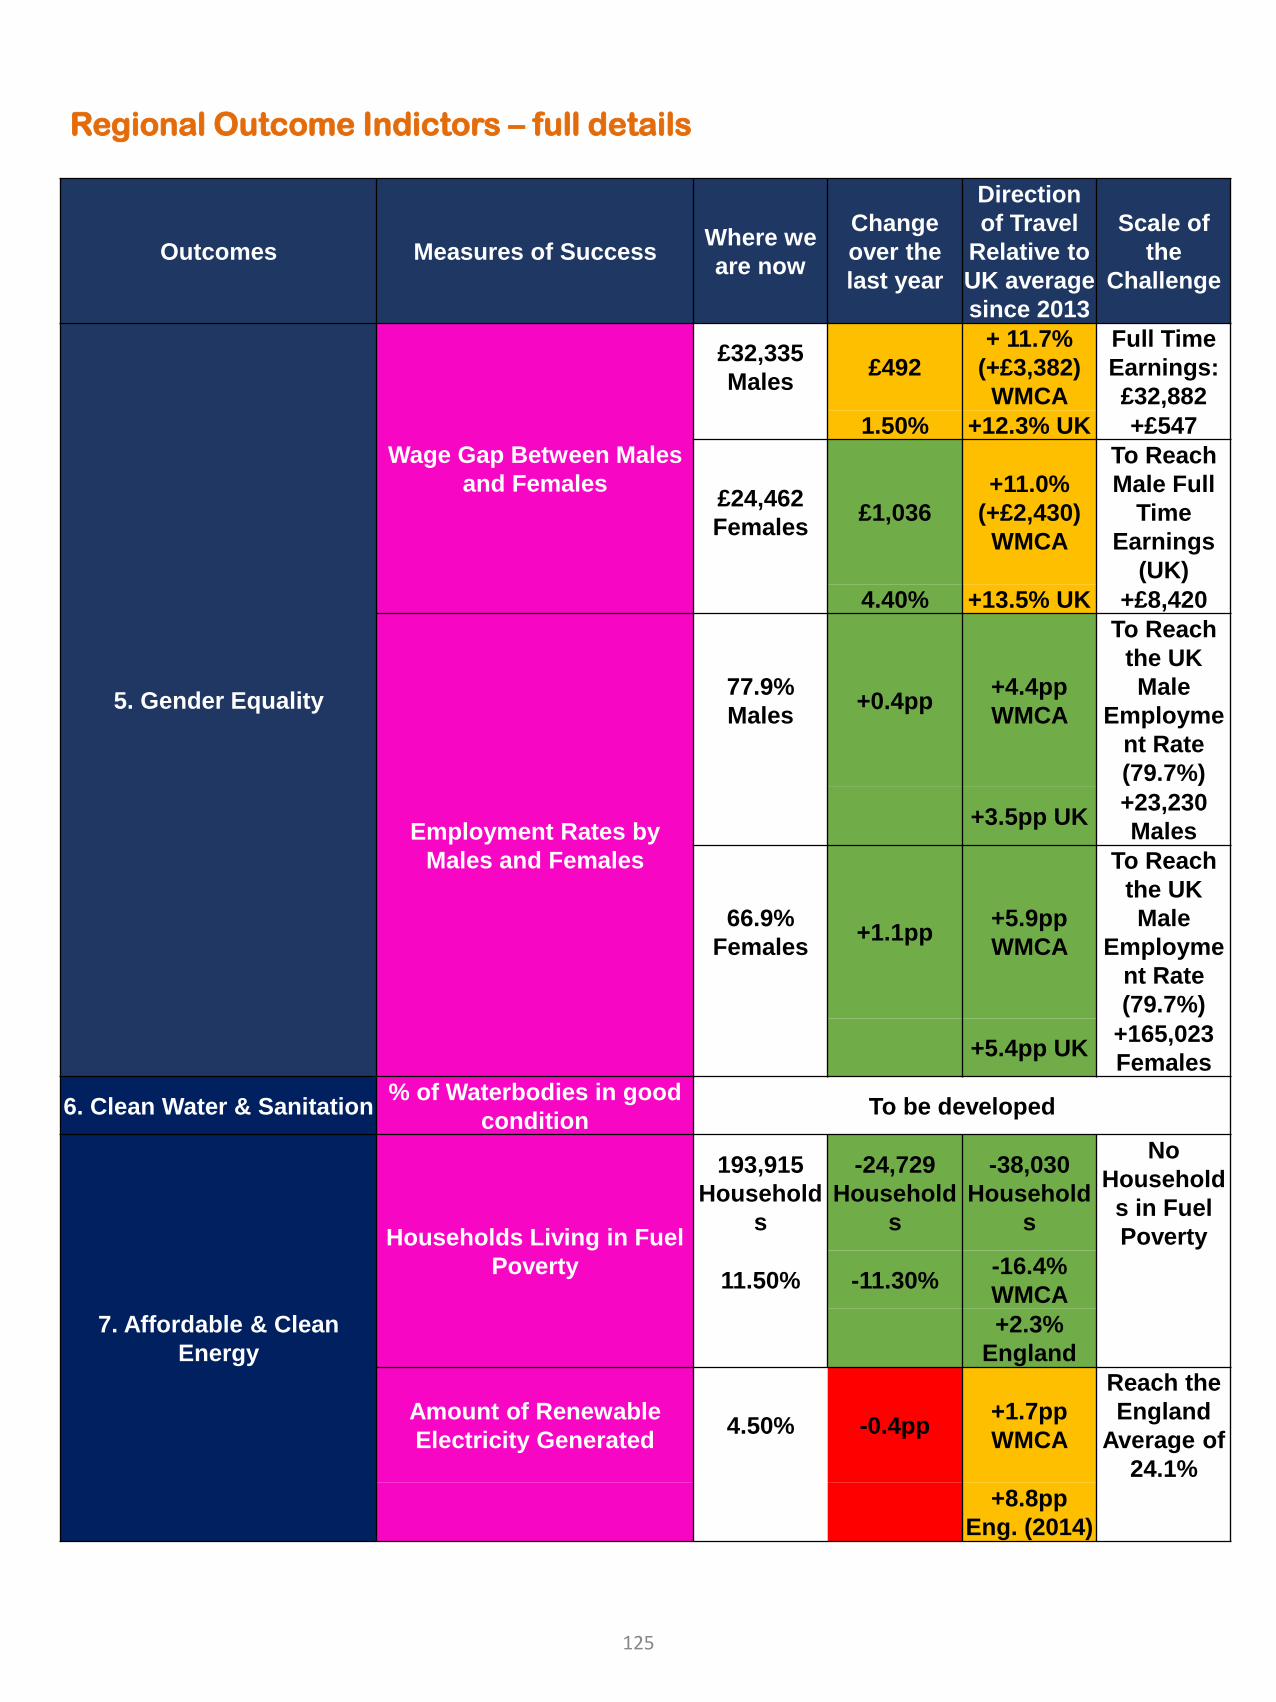
Regional Outcome Indictors – full details
Outcomes Measures of SuccessWhere we
are now
Change
over the
last year
Direction
of Travel
Relative to
UK average
since 2013
Scale of
the
Challenge
5. Gender Equality
Wage Gap Between Males
and Females
£32,335
Males£492
+ 11.7%
(+£3,382)
WMCA
Full Time
Earnings:
£32,882
1.50% +12.3% UK +£547
£24,462
Females£1,036
+11.0%
(+£2,430)
WMCA
To Reach
Male Full
Time
Earnings
(UK)
4.40% +13.5% UK +£8,420
Employment Rates by
Males and Females
77.9%
Males+0.4pp
+4.4pp
WMCA
To Reach
the UK
Male
Employme
nt Rate
(79.7%)
+3.5pp UK+23,230
Males
66.9%
Females+1.1pp
+5.9pp
WMCA
To Reach
the UK
Male
Employme
nt Rate
(79.7%)
+5.4pp UK+165,023
Females
6. Clean Water & Sanitation% of Waterbodies in good
conditionTo be developed
7. Affordable & Clean
Energy
Households Living in Fuel
Poverty
193,915
Household
s
-24,729
Household
s
-38,030
Household
s
No
Household
s in Fuel
Poverty
11.50% -11.30%-16.4%
WMCA
+2.3%
England
Amount of Renewable
Electricity Generated 4.50% -0.4pp
+1.7pp
WMCA
Reach the
England
Average of
24.1%
+8.8pp
Eng. (2014)
125
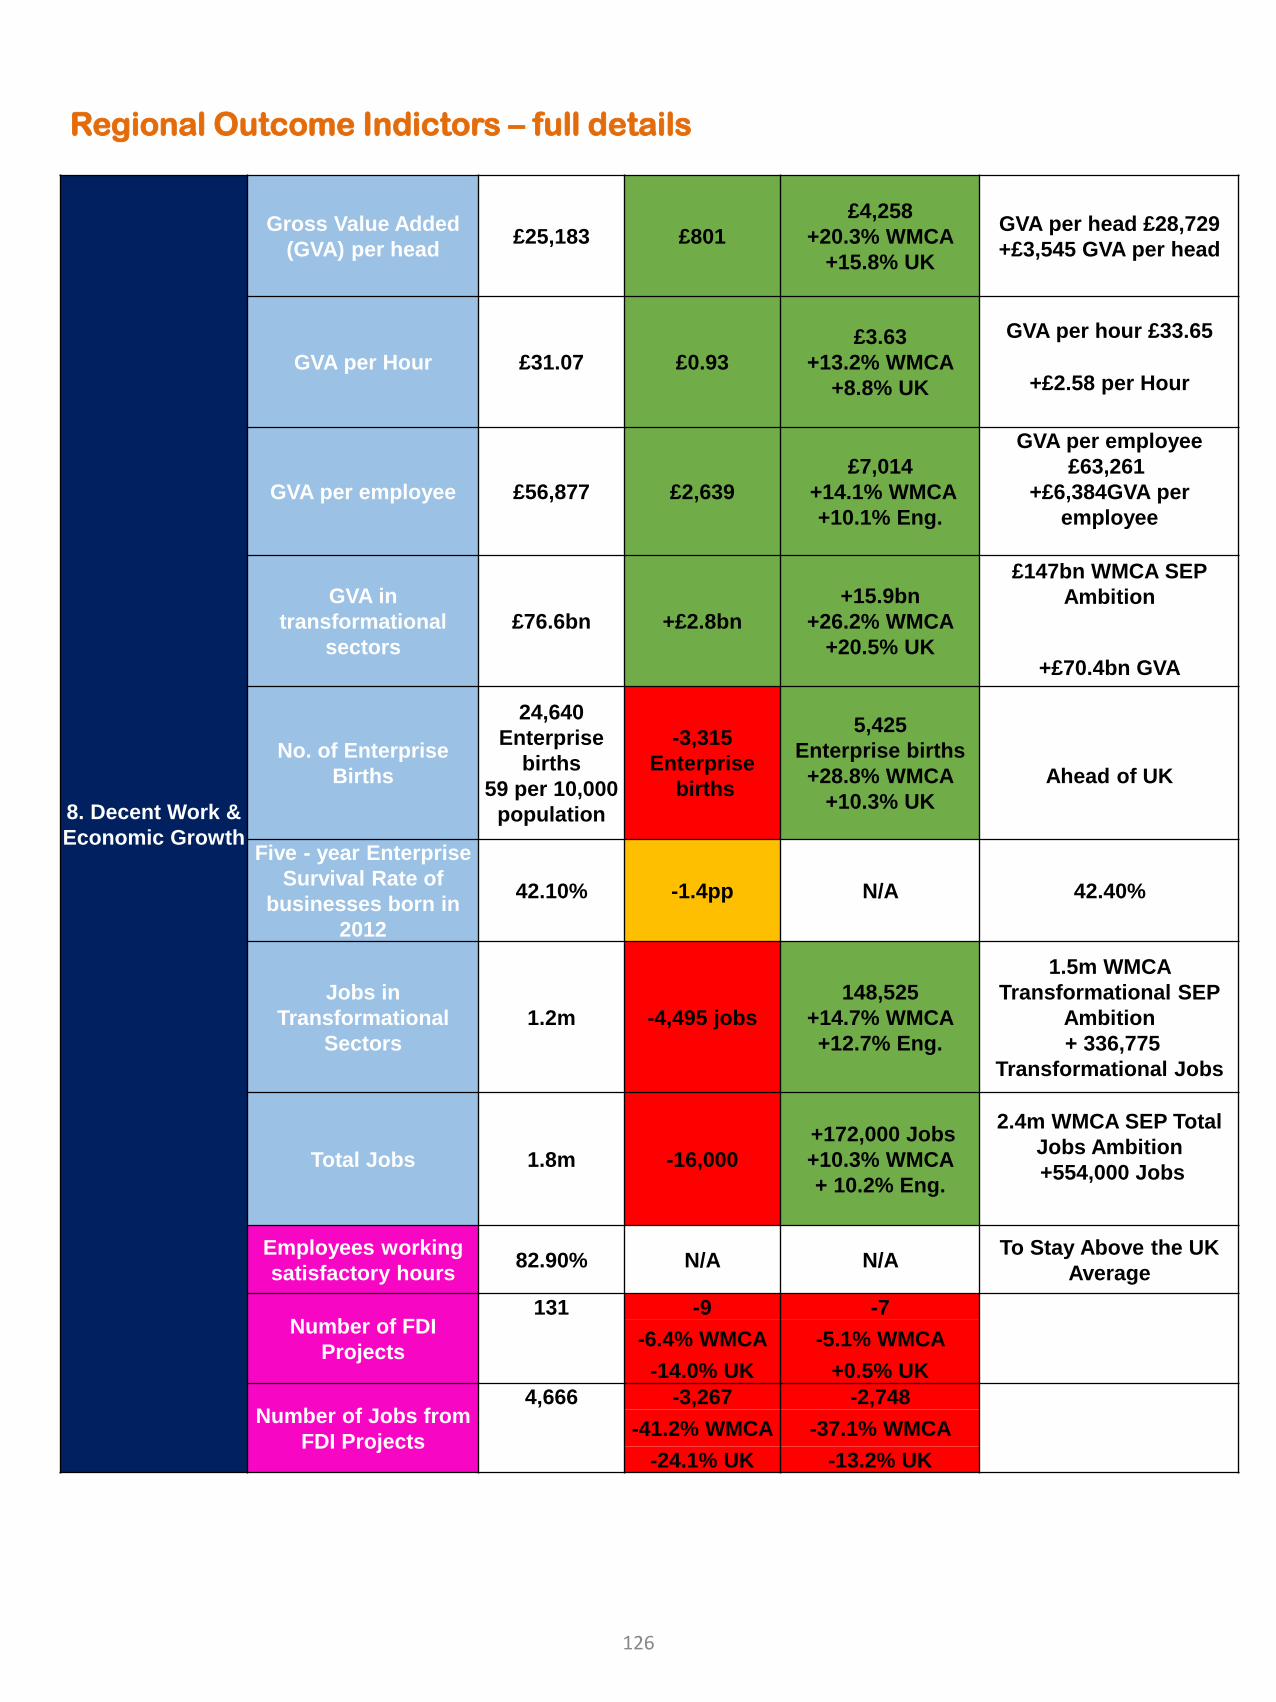
Regional Outcome Indictors – full details
8. Decent Work &
Economic Growth
Gross Value Added
(GVA) per head£25,183 £801
£4,258
+20.3% WMCA
+15.8% UK
GVA per head £28,729
+£3,545 GVA per head
GVA per Hour £31.07 £0.93
£3.63
+13.2% WMCA
+8.8% UK
GVA per hour £33.65
+£2.58 per Hour
GVA per employee £56,877 £2,639
£7,014
+14.1% WMCA
+10.1% Eng.
GVA per employee
£63,261
+£6,384GVA per
employee
GVA in
transformational
sectors
£76.6bn +£2.8bn
+15.9bn
+26.2% WMCA
+20.5% UK
£147bn WMCA SEP
Ambition
+£70.4bn GVA
No. of Enterprise
Births
24,640
Enterprise
births
59 per 10,000
population
-3,315
Enterprise
births
5,425
Enterprise births
+28.8% WMCA
+10.3% UK
Ahead of UK
Five - year Enterprise
Survival Rate of
businesses born in
2012
42.10% -1.4pp N/A 42.40%
Jobs in
Transformational
Sectors
1.2m -4,495 jobs
148,525
+14.7% WMCA
+12.7% Eng.
1.5m WMCA
Transformational SEP
Ambition
+ 336,775
Transformational Jobs
Total Jobs 1.8m -16,000
+172,000 Jobs
+10.3% WMCA
+ 10.2% Eng.
2.4m WMCA SEP Total
Jobs Ambition
+554,000 Jobs
Employees working
satisfactory hours82.90% N/A N/A
To Stay Above the UK
Average
Number of FDI
Projects
131 -9 -7
-6.4% WMCA -5.1% WMCA
-14.0% UK +0.5% UK
Number of Jobs from
FDI Projects
4,666 -3,267 -2,748
-41.2% WMCA -37.1% WMCA
-24.1% UK -13.2% UK
126
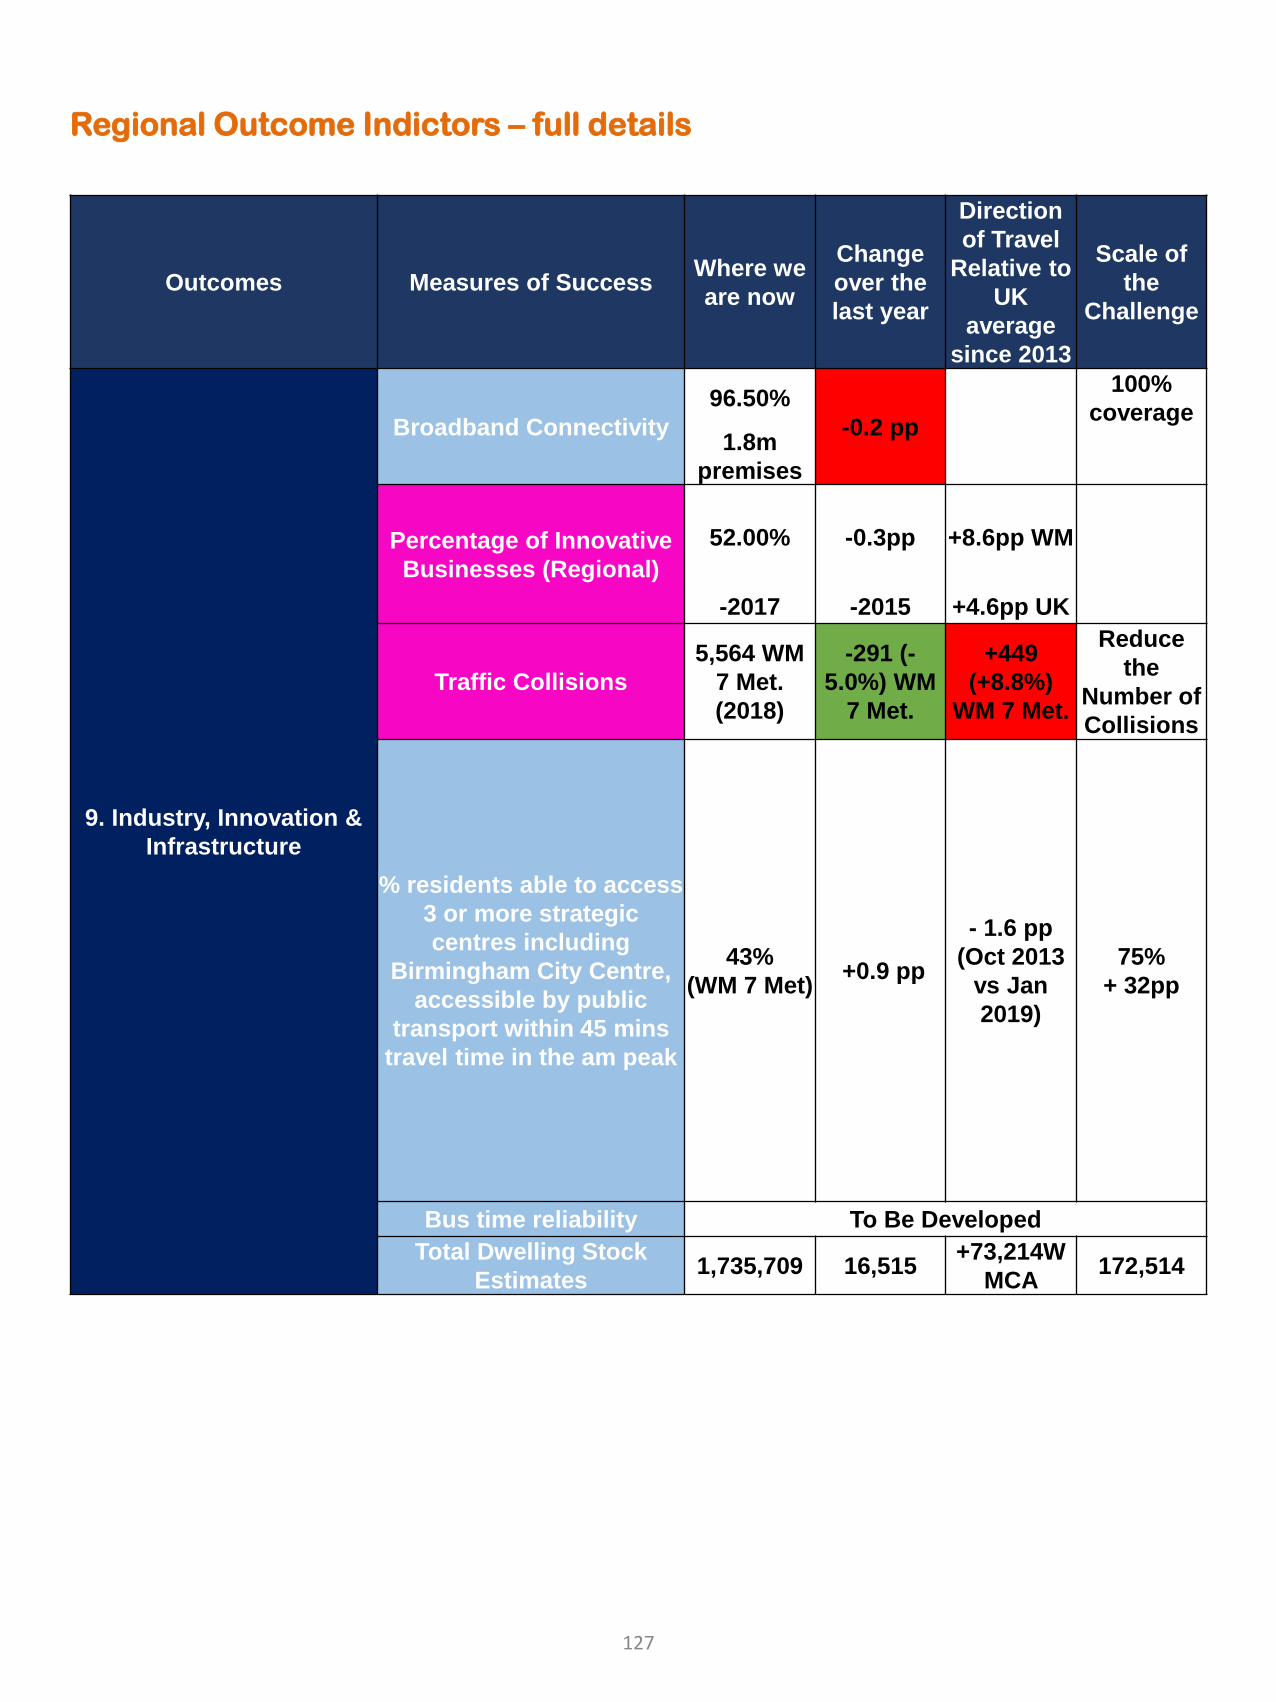
Regional Outcome Indictors – full details
Outcomes Measures of SuccessWhere we
are now
Change
over the
last year
Direction
of Travel
Relative to
UK
average
since 2013
Scale of
the
Challenge
9. Industry, Innovation &
Infrastructure
Broadband Connectivity
96.50%
-0.2 pp
100%
coverage
1.8m
premises
Percentage of Innovative
Businesses (Regional)
52.00% -0.3pp +8.6pp WM
-2017 -2015 +4.6pp UK
Traffic Collisions
5,564 WM
7 Met.
(2018)
-291 (-
5.0%) WM
7 Met.
+449
(+8.8%)
WM 7 Met.
Reduce
the
Number of
Collisions
% residents able to access
3 or more strategic
centres including
Birmingham City Centre,
accessible by public
transport within 45 mins
travel time in the am peak
43%
(WM 7 Met)+0.9 pp
- 1.6 pp
(Oct 2013
vs Jan
2019)
75%
+ 32pp
Bus time reliability To Be Developed
Total Dwelling Stock
Estimates1,735,709 16,515
+73,214W
MCA172,514
127
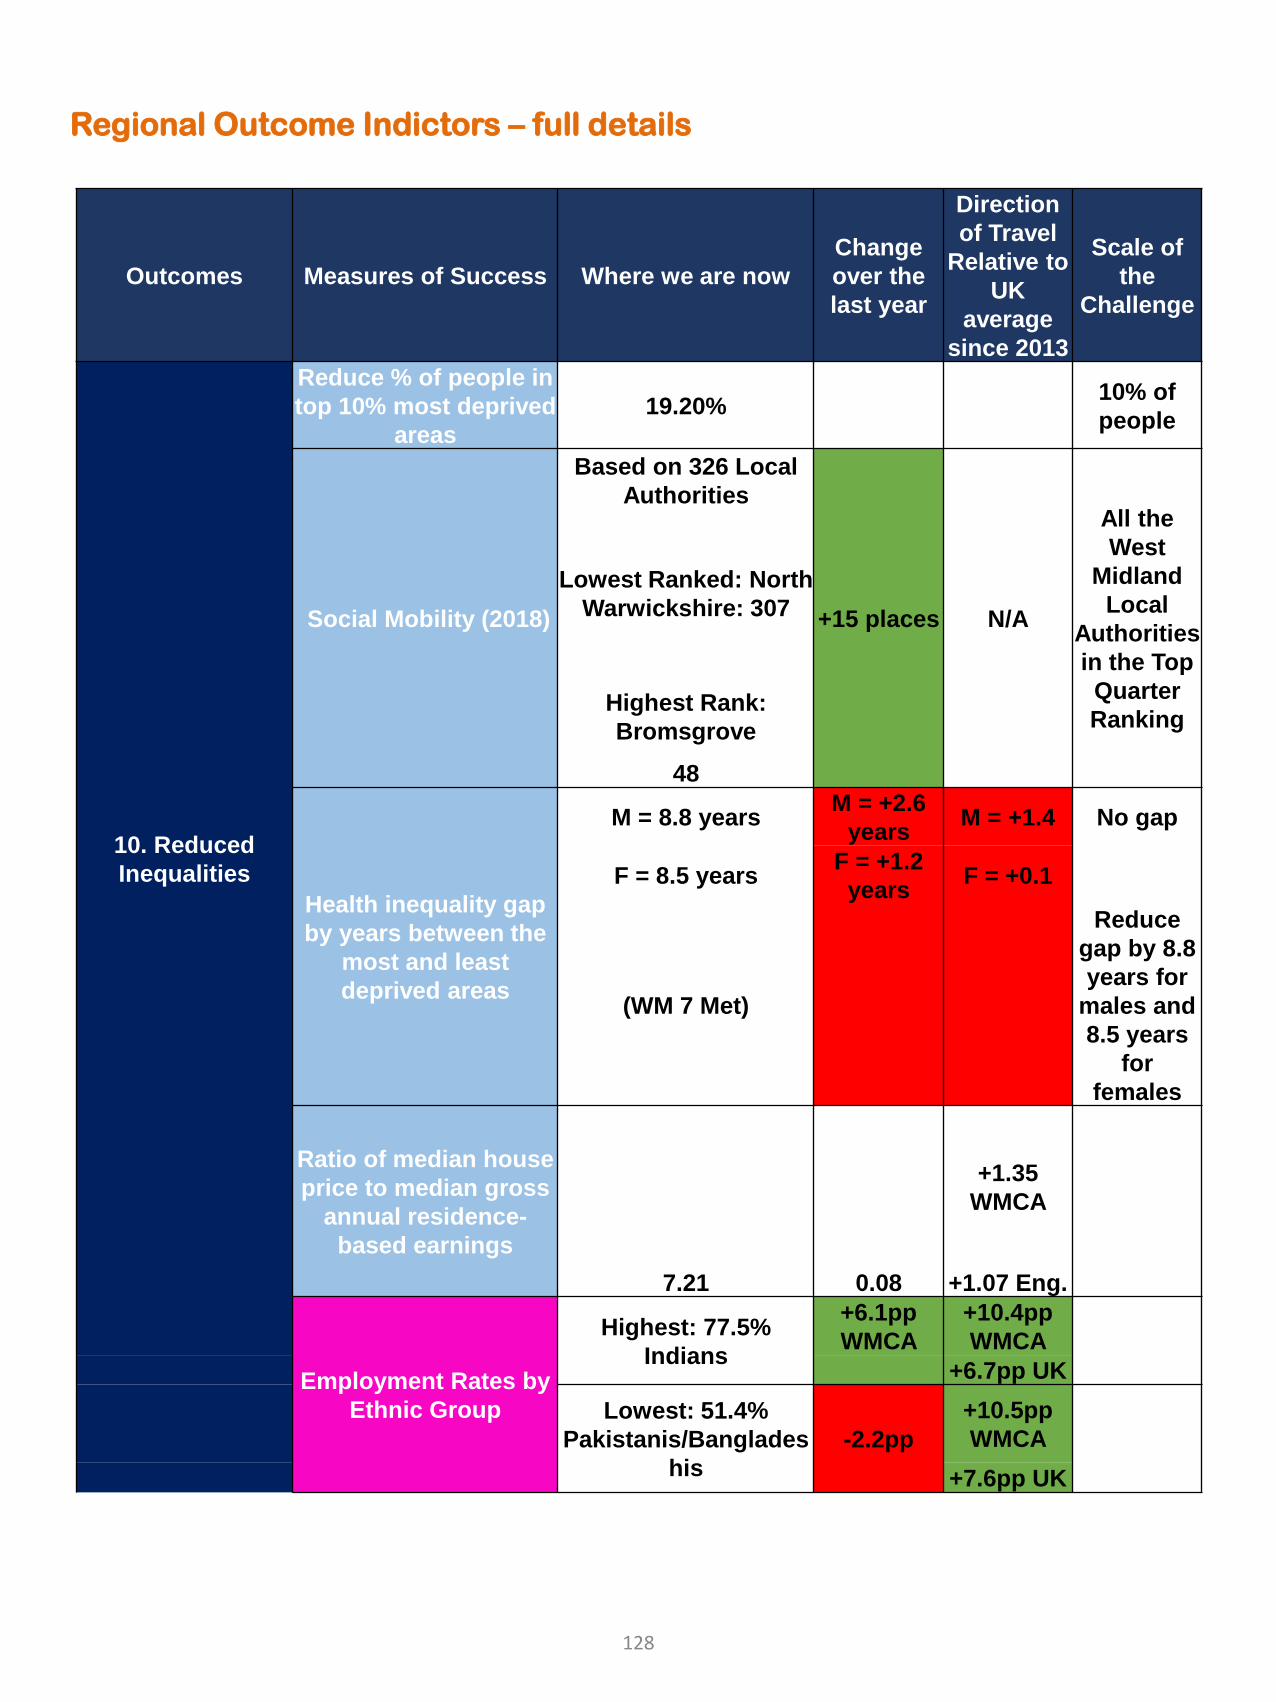
Regional Outcome Indictors – full details
Outcomes Measures of Success Where we are now
Change
over the
last year
Direction
of Travel
Relative to
UK
average
since 2013
Scale of
the
Challenge
10. Reduced
Inequalities
Reduce % of people in
top 10% most deprived
areas
19.20%10% of
people
Social Mobility (2018)
Based on 326 Local
Authorities
+15 places N/A
All the
West
Midland
Local
Authorities
in the Top
Quarter
Ranking
Lowest Ranked: North
Warwickshire: 307
Highest Rank:
Bromsgrove
48
Health inequality gap
by years between the
most and least
deprived areas
M = 8.8 yearsM = +2.6
yearsM = +1.4 No gap
F = 8.5 yearsF = +1.2
yearsF = +0.1
(WM 7 Met)
Reduce
gap by 8.8
years for
males and
8.5 years
for
females
Ratio of median house
price to median gross
annual residence-
based earnings
+1.35
WMCA
7.21 0.08 +1.07 Eng.
Employment Rates by
Ethnic Group
Highest: 77.5%
Indians
+6.1pp
WMCA
+10.4pp
WMCA
+6.7pp UK
Lowest: 51.4%
Pakistanis/Banglades
his
-2.2pp
+10.5pp
WMCA
+7.6pp UK
128
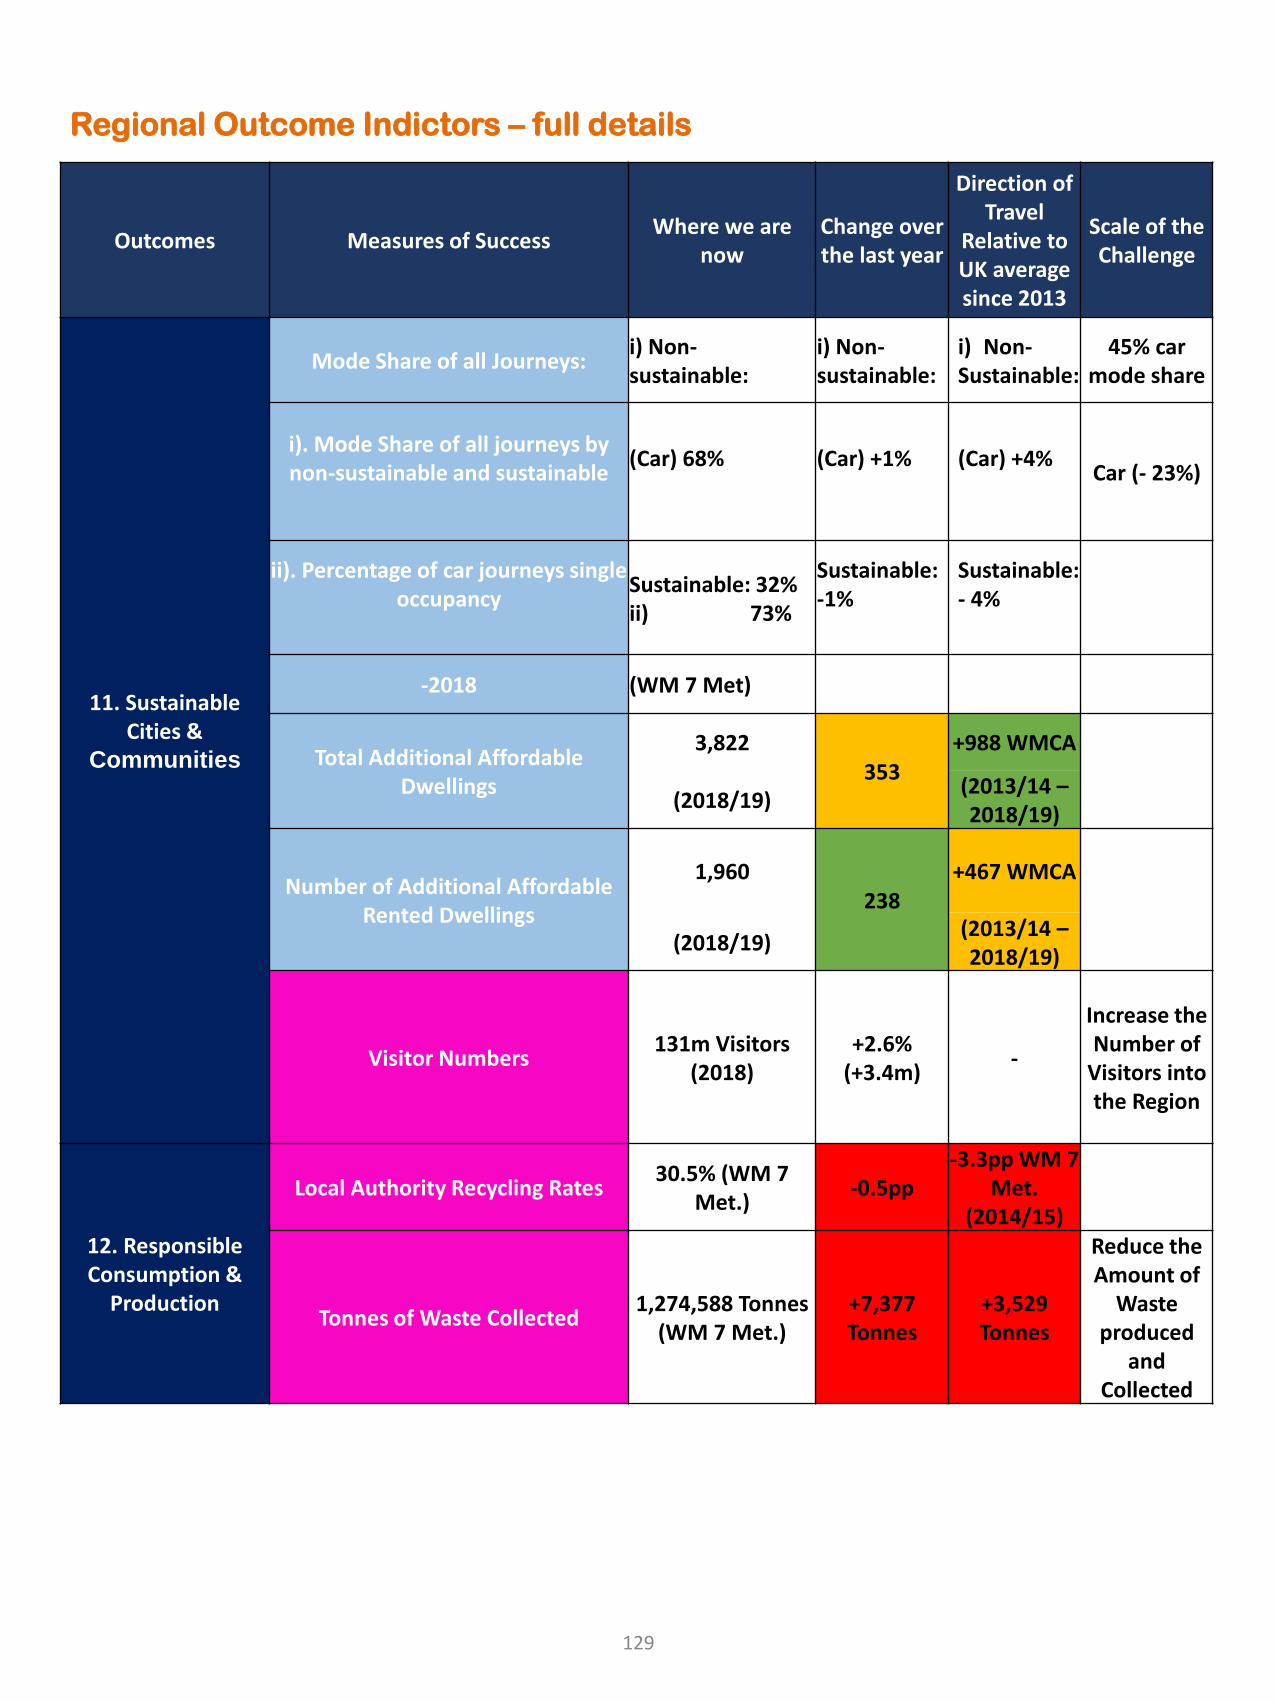
Regional Outcome Indictors – full details
Outcomes Measures of SuccessWhere we are
nowChange over the last year
Direction of Travel
Relative to UK average since 2013
Scale of the Challenge
11. Sustainable Cities &
Communities
Mode Share of all Journeys:i) Non-sustainable:
i) Non-sustainable:
i) Non-Sustainable:
45% car mode share
i). Mode Share of all journeys by non-sustainable and sustainable
(Car) 68% (Car) +1% (Car) +4%Car (- 23%)
ii). Percentage of car journeys single occupancy
Sustainable: 32%ii) 73%
Sustainable: -1%
Sustainable: - 4%
-2018 (WM 7 Met)
Total Additional Affordable Dwellings
3,822353
+988 WMCA
(2018/19)(2013/14 –2018/19)
Number of Additional Affordable Rented Dwellings
1,960238
+467 WMCA
(2018/19)(2013/14 –2018/19)
Visitor Numbers131m Visitors
(2018)+2.6%
(+3.4m)-
Increase the Number of
Visitors into the Region
12. Responsible Consumption &
Production
Local Authority Recycling Rates30.5% (WM 7
Met.)-0.5pp
-3.3pp WM 7 Met.
(2014/15)
Tonnes of Waste Collected 1,274,588 Tonnes
(WM 7 Met.)+7,377 Tonnes
+3,529 Tonnes
Reduce the Amount of
Waste produced
and Collected
129
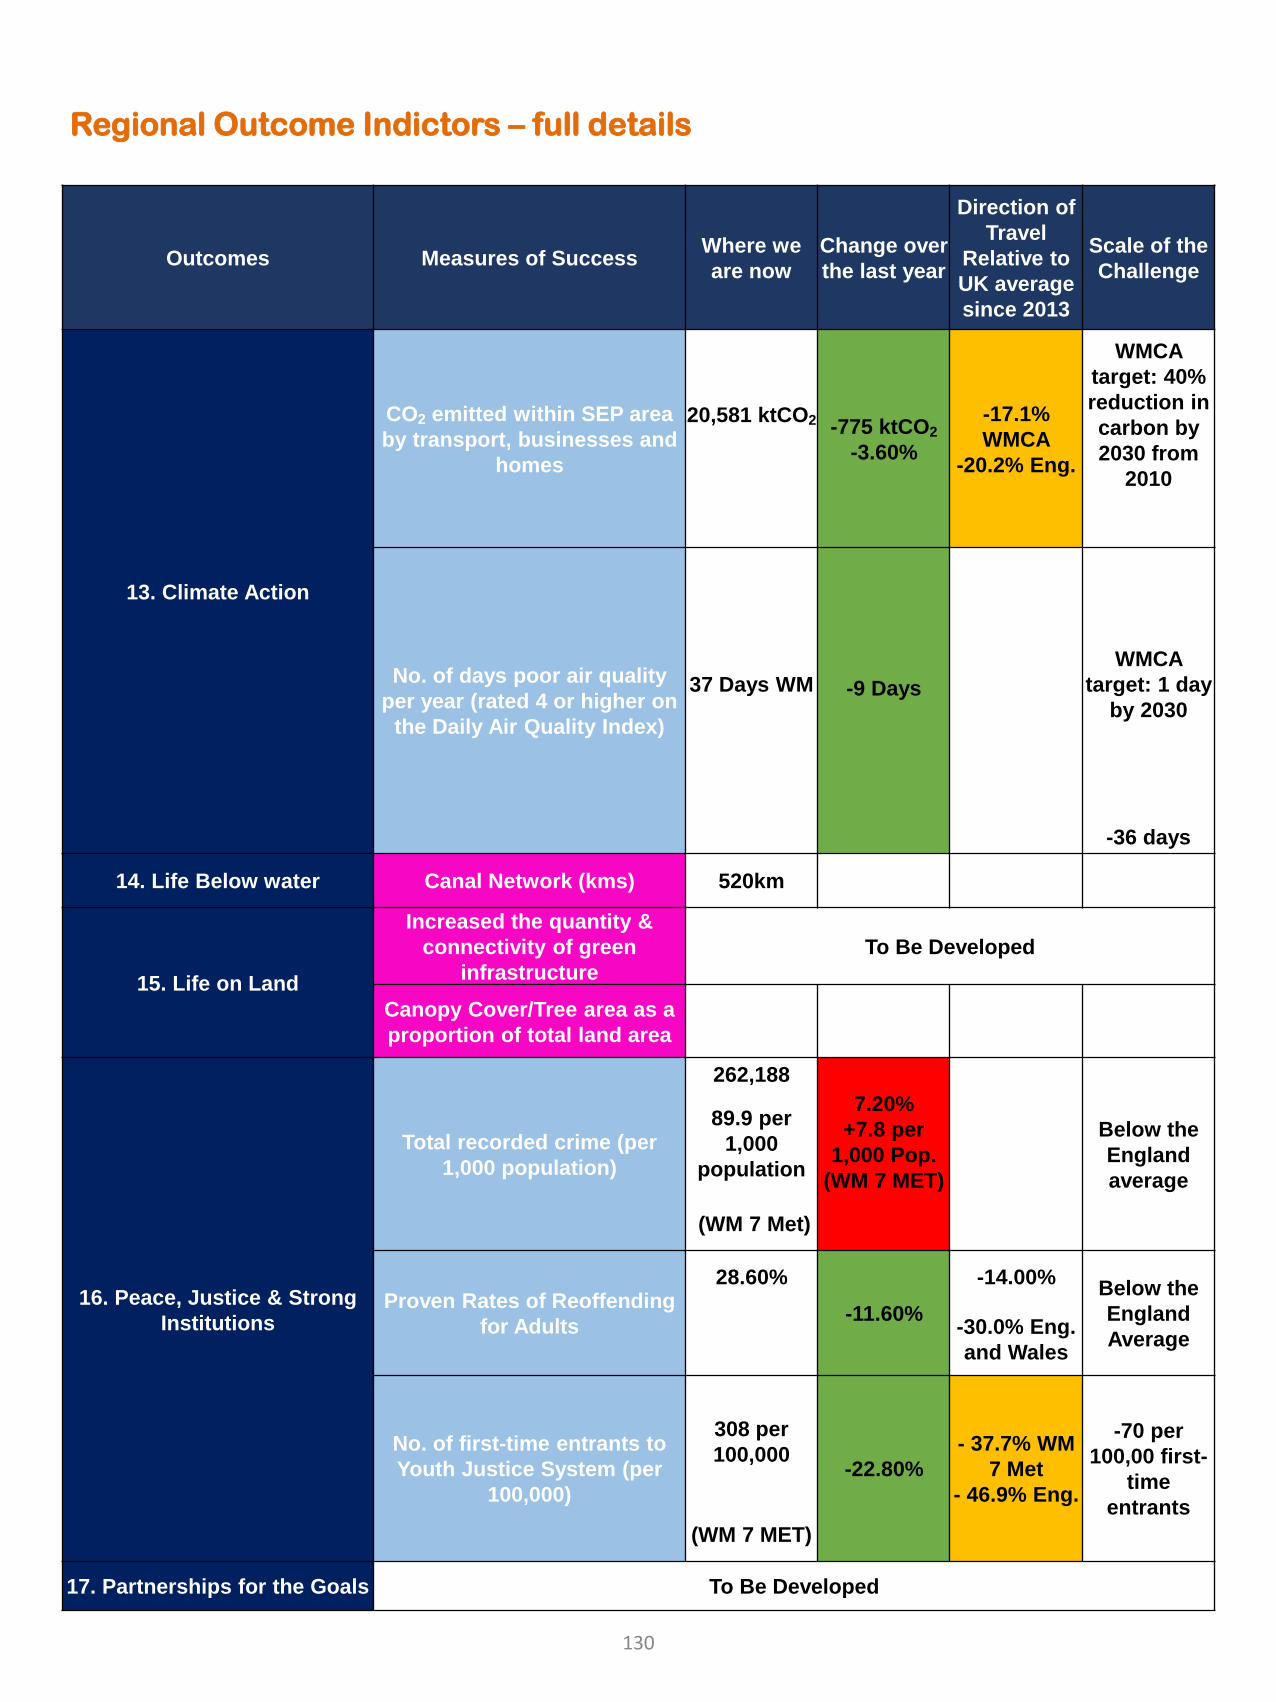
Regional Outcome Indictors – full details
Outcomes Measures of SuccessWhere we
are now
Change over
the last year
Direction of
Travel
Relative to
UK average
since 2013
Scale of the
Challenge
13. Climate Action
CO2 emitted within SEP area
by transport, businesses and
homes
20,581 ktCO2 -775 ktCO2
-3.60%
-17.1%
WMCA
-20.2% Eng.
WMCA
target: 40%
reduction in
carbon by
2030 from
2010
No. of days poor air quality
per year (rated 4 or higher on
the Daily Air Quality Index)
37 Days WM -9 Days
WMCA
target: 1 day
by 2030
-36 days
14. Life Below water Canal Network (kms) 520km
15. Life on Land
Increased the quantity &
connectivity of green
infrastructure
To Be Developed
Canopy Cover/Tree area as a
proportion of total land area
16. Peace, Justice & Strong
Institutions
Total recorded crime (per
1,000 population)
262,188
7.20%
+7.8 per
1,000 Pop.
(WM 7 MET)
Below the
England
average
89.9 per
1,000
population
(WM 7 Met)
Proven Rates of Reoffending
for Adults
28.60%
-11.60%
-14.00%Below the
England
Average-30.0% Eng.
and Wales
No. of first-time entrants to
Youth Justice System (per
100,000)
308 per
100,000-22.80%
- 37.7% WM
7 Met
- 46.9% Eng.
-70 per
100,00 first-
time
entrants
(WM 7 MET)
17. Partnerships for the Goals To Be Developed
130
Supporting documents and references
Recovery Coordination Group Initial Impact Assessment WMCA June 2020
West Midlands Industrial Strategy Sector Summaries Update Black Country Consortium
Economic Intelligence Unit, June 2020
Functional Geography of the West Midlands, WMREDI June 2020 Prof Anne Green
Midlands Engine Independent Economic Review, Midlands Engine Economic Observatory
2020
Inclusive Growth Update; WMCA Board May 2019
Quarterly Monitoring Dashboard (Qtr 3 and 4 2019 and 1 and 2 2020); Strategic Economic
Development Board, WMCA 2020
Investment Board Forecasts, West Midlands Growth Company June 2020
Repowering the Black Country, Black Country LEP June 2020
Covid-19 Policy Review, WMREDI June 2020
Additional Covid-19 Analysis and references can be found in the collection of:
Weekly Monitor; Editions 1 to 17 from March 2020 to July 2020, West Midlands Regional
Economic Development Institute, University of Birmingham
131
Disclaimer
The contents of this document are based on the latest data available as at June 2020 and the contribution of regional partners in a fast paced environment, therefore we urge caution in its use and application
For any queries please contact the lead Authors:
Rebecca Riley [email protected] Dwight [email protected] Anne Green [email protected]
With special thanks to contributing authors from across the partnership organisations, without whom this document could not be produced
The West Midlands Regional Economic Development Institute and the
City-Region Economic Development Institute
In partnership with:
132


![OP 116 CIS Region[Full Report].pdf](https://img.pdfslide.us/doc/110x75/577ce38f1a28abf1038c6dc8/op-116-cis-regionfull-reportpdf.jpg)