Embed Size (px)
Citation preview

State of the Park Report for the
Ecological Integrity of Stanley Park
October 2020
Unceded xʷməθkʷəy̓əm (Musqueam), Sḵwxw̱ú7mesh (Squamish), and səlí̓lwətaʔɬ (Tsleil-Waututh) Territory
Vancouver, British Columbia

Stanley Park Ecology Society, SOPEI 2020 2
Executive Summary
Vancouver’s iconic Stanley Park is one of the world’s largest natural urban parks, yet it is a small remnant of the
forest, wetlands, and seashores that once covered the region encompassed by the traditional, ancestral, and
unceded territory of the xʷməθkʷəy̓əm (Musqueam), Sḵwxw̱ú7mesh (Squamish), and səlí̓lwətaʔɬ (Tsleil-Waututh)
Nations. Bordered by downtown Vancouver and surrounded by ocean, Stanley Park faces the stressors of
recreation, pollution, and climate change. To protect the Park’s habitat and biodiversity, it is crucial to understand
the impact of these stressors and how the ecosystems are changing.
In 2010, Stanley Park Ecology Society (SPES) published its first State of the Park Report on the Ecological Integrity of
Stanley Park (SOPEI 2010). The report provided extensive information on the biophysical aspects of Stanley Park,
evaluated its ecological integrity, and identified knowledge gaps. Still to this day, this comprehensive resource is
highly informative and has informed several management strategies and plans for the Park. SOPEI 2020 (this
report) is intended to build upon SOPEI 2010, rather than to replace it.
The objectives of this report are to:
1) Evaluate the ecological integrity of Stanley Park
SPES has developed a long-term monitoring program to evaluate the ecological integrity of Stanley Park over time.
The format of this “snapshot” evaluation is based on Parks Canada’s State of the Park reports. We evaluated four
ecological integrity indicators through the assessment of strategic measures. For each measure, thresholds were
developed to indicate the current status (in good, fair, or poor condition), and the trend (improving, stable, or
declining). Because this is the first report using these quantitative measures, the trend for each indicator will be
evaluated in subsequent reports.
Climate and Atmosphere Current Status: Fair
The current status of Climate and Atmosphere in Stanley Park is considered fair. Our analysis revealed an increase
in annual air temperature, a probable decrease in summer precipitation, and an increase in sea level. Air quality is
considered good and improving. Based on local and global predictions, climate change is expected to impact
freshwater, intertidal, and terrestrial ecosystems. The main effects of climate change expected to impact Stanley
Park are rise in sea level, precipitation increase in the fall, winter, and spring, precipitation decrease in summer,
and increase in air temperature. The development of appropriate management strategies is crucial to mitigate the
impacts of these changes.
Freshwater Ecosystems Current Status: Poor
The current status of Freshwater Ecosystems is rated as poor and is a main area of concern. Dissolved oxygen and
water temperatures have reached alarming levels for aquatic life in Lost Lagoon and Beaver Lake. Special attention
should be dedicated to management of the Park’s lakes, wetlands, and streams.
Intertidal Ecosystems Current Status: Not Rated
SPES recently developed a monitoring program to assess Intertidal Ecosystems; therefore, the current status and
trend for this indicator will be assessed in subsequent reports.
Stanley Park Ecology Society, SOPEI 2020 3
Terrestrial Ecosystems Current Status: Good
Based on tree cover, Bald Eagle productivity, and a bird community index, Terrestrial Ecosystems are in good
condition. The huckleberry productivity and soil decay rate measures were recently developed, so their assessment
will be presented in subsequent reports.
2) Provide recommendations for future research directions
Based on our ecological integrity evaluation, we listed recommendations for future research. The purpose of these
recommendations is to create a more robust understanding of the Park’s ecological conditions. The report does
not evaluate whether resources may permit the accomplishment of all recommendations, but can be useful to
prioritize actions.
We recommended activities that will improve accuracy and continuity of data collection (e.g. installation of an air
quality station), continue the hosting of citizen science projects (e.g. Bioblitzes), measure the success of restoration
efforts (e.g. survival rate of planted species), examine water flow, develop research of intertidal ecosystems, and
complement studies with Traditional Ecological Knowledge (TEK).
3) Track achievements in habitat restoration and enhancement
Following SOPEI 2010, SPES, the Vancouver Board of Parks and Recreation (VPB), and collaborators have
strategically planned and accomplished many goals that have enhanced the ecosystems of the Park. The
motivation for these stewardship efforts is to benefit native biodiversity and reduce environmental stressors.
Examples include replacing invasive plants with native plant species, installing nest boxes for cavity nesters such as
tree swallows and wood ducks, and enhancing wetland habitat through the installation of elevated boardwalks. In
partnership with the VPB, we tracked the progress of the proposed actions of the Stanley Park Ecological Action
Plan (SPEAP 2011). This has helped to identify milestones and obstacles in reaching the action plan’s goals, and we
intend for it to provide guidance for revisiting prioritized actions.
We aim that SPES’s State of the Park reports continue to help guide management decisions that support the Park’s
ecosystems. SPES is dedicated to assessing, supporting, and raising awareness of the ecological health of Stanley
Park on a continual basis.
Stanley Park Ecology Society’s Mission
Stanley Park Ecology Society promotes awareness of and respect for the natural world through collaborative
leadership in environmental education, research, and conservation in Stanley Park.
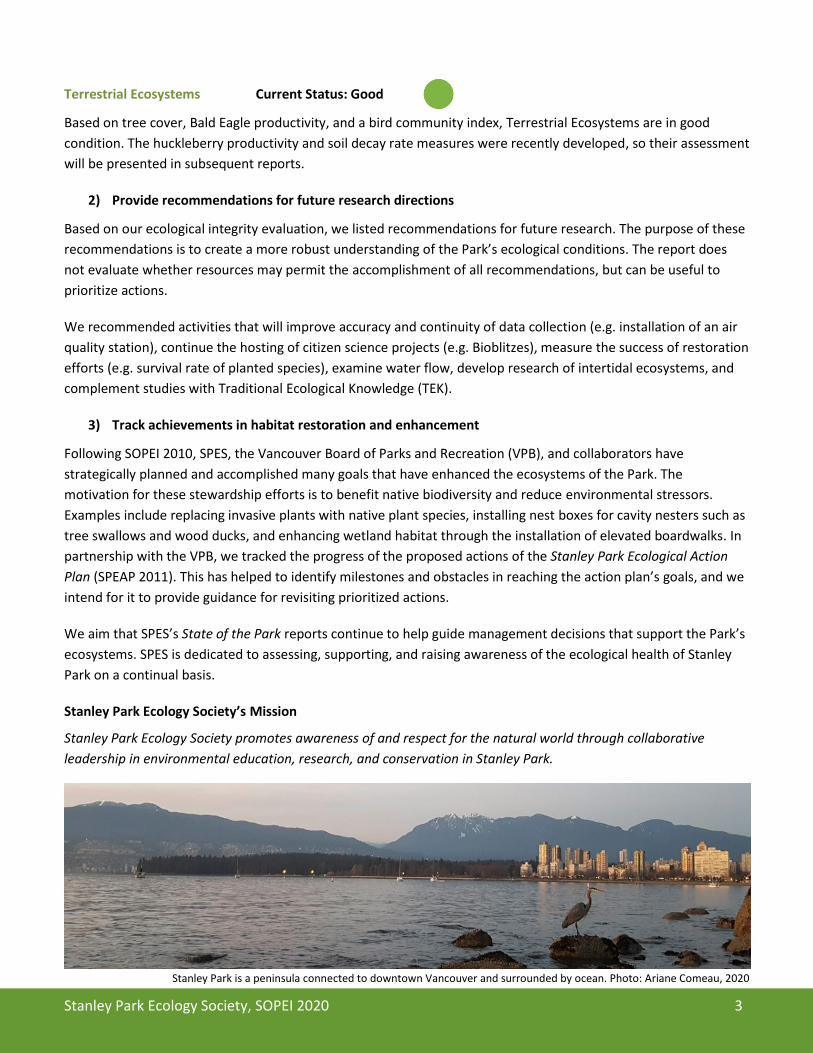
Stanley Park is a peninsula connected to downtown Vancouver and surrounded by ocean. Photo: Ariane Comeau, 2020

Stanley Park Ecology Society, SOPEI 2020 4
Acknowledgments
We gratefully acknowledge that our work takes place on the traditional, ancestral, and unceded territory of the xʷməθkʷəy̓əm
(Musqueam), Sḵwx̱wú7mesh (Squamish), and səlí̓lwətaʔɬ (Tsleil-Waututh) Nations. The study of Stanley Park that we present
here is incredibly young compared to the long history of Traditional Ecological Knowledge of the land held by these three
Nations.
Author
Ariane Comeau, M.Sc., B.I.T, Conservation Projects Manager, SPES
Graphics and Design
Jeannine Johnstone, B.Sc., Stewardship Coordinator, SPES
Contributors
Vanessa Sadler, B.Sc., R.P.Bio, Past Conservation Projects Manager, SPES (analysis, writing)
Dylan Rawlyk, B.Ed. B.Sc., Executive Director, SPES (report guidance)
Meghan Cooling, Ph.D., P. Biol., Conservation Technician, SPES (eagle analysis)
John Cristiani, Ph.D. Candidate, UBC (tree cover analysis)
Hannah Visty, M.Sc., UBC (community bird index)
Vanessa Smith, B.Sc., Past Conservation Technician, SPES (analysis)
Madeleine McGreer, M.Sc., (analysis)
Alan Duncan, M.A. (Planning), Environmental Planner, VPB (SPEAP tracking)
Paul Chiu, M.ConSci., Volunteer, SPES (analysis)
Marine Baud, M. Sc., Volunteer, SPES (analysis)
Rory Macklin, B.Sc, Volunteer, SPES (statistics)
Ecological Assessment Advisors
Maria Egerton, B.Sc., P. Biol., Past Conservation Projects Manager, SPES
Wanli Wu, Ph.D., Ecological Monitoring Specialist, Parks Canada
Philip Lee, Ph.D., Project Manager, Permitting Specialist, Environmental Resources Management (ERM)
Kerry Marchinko, Ph.D., Principal Consultant and Manager of Fisheries Science, ERM
Peer Review
Alan Duncan, M.A. (Planning), Environmental Planner, VPB
Brian Herrin, M.Sc., Board of Directors, SPES
Dana McDonald, M.Sc., Environmental Stewardship Coordinator, VPB
Dylan Rawlyk, B.Ed. B.Sc., Executive Director, SPES
Jessica Roberts-Farina, MJ, Communications Specialist, SPES
Kathleen Stormont, B.Sc., Fundraising and Communications Specialist, SPES
Krista Voth, B.Sc., Environmental Stewardship Coordinator, VPB
Meghan Cooling, Ph.D., P. Biol., Conservation Technician, SPES
Patricia Thomson, B.Sc., Past Executive Director, SPES
Stephen Partington, M.Sc., Board of Directors, SPES
Vanessa Sadler, B.Sc., R.P.Bio, Past Conservation Projects Manager, SPES
A special thank you to SPES’s donors and to all of the volunteers and staff – past and present – who were involved with data
collection and field work.
Project supported by

Stanley Park Ecology Society, SOPEI 2020 5
Table of Contents Executive Summary ........................................................................................................................................................ 2
Acknowledgments .......................................................................................................................................................... 4
Introduction .................................................................................................................................................................... 6
1. Ecological Integrity Assessment ................................................................................................................................. 8
Climate and Atmosphere .......................................................................................................................................... 10
Measure: Air Quality ............................................................................................................................................. 12
Measure: Air Temperature ................................................................................................................................... 13
Measure: Precipitation ......................................................................................................................................... 14
Measure: Sea Level ............................................................................................................................................... 16
Freshwater Ecosystems ............................................................................................................................................ 17
Measure: Water Temperature ............................................................................................................................. 20
Measure: Dissolved Oxygen ................................................................................................................................. 21
Measure: pH ......................................................................................................................................................... 22
Measure: Stream Invertebrate Rating .................................................................................................................. 23
Measure: Amphibian Richness ............................................................................................................................. 24
Intertidal Ecosystems ............................................................................................................................................... 25
Terrestrial Ecosystems .............................................................................................................................................. 28
Measure: Tree Cover ............................................................................................................................................ 30
Measure: Bird Community Index .......................................................................................................................... 31
Measure: Bald Eagle Productivity ......................................................................................................................... 32
Measure: Huckleberry Productivity ...................................................................................................................... 33
Measure: Soil Decay Rate ..................................................................................................................................... 34
2. Recommendations for Future Research Directions ................................................................................................. 35
3. 2010-2019 Ecological Restoration and Habitat Enhancement ................................................................................. 38
References .................................................................................................................................................................... 43
Appendix 1. Survey Schedule .................................................................................................................................... 49
Appendix 2. Method to Evaluate Status and Trends with Thresholds ..................................................................... 50
Appendix 3. Implementation Tracking of 2011’s Stanley Park Ecological Action Plan (SPEAP 2011) ...................... 51
Appendix 4. Stanley Park Species Life List ................................................................................................................ 55

Stanley Park Ecology Society, SOPEI 2020 6
Introduction
Stanley Park is a 400-hectare forested peninsula
located on the traditional, ancestral, and unceded
territory of the xʷməθkʷəyə̓m (Musqueam),
Sḵwxw̱ú7mesh (Squamish), and səlí̓lwətaʔɬ (Tsleil-
Waututh) Nations. Situated in the midst of
Vancouver’s urban landscape, Stanley Park is known
worldwide for its accessibility to diverse ecosystems,
wildlife, and plants.
Stressors
Since the beginning of colonization in the 1860’s,
Stanley Park’s natural ecosystems have faced many
local, regional, and global pressures. Stressors
include loss and fragmentation of natural areas,
degradation of water quality, the introduction and
proliferation of non-native species, park operations,
vehicular and pedestrian traffic, and climate change
(SPES 2010). In 2006 and 2007, hurricane-force
windstorms severely impacted the Park, felling more
than 10,000 trees and breaking sections of the 7 km
perimeter seawall. At Stanley Park Ecology Society
(SPES), the subsequent restoration planning raised
awareness for the importance in gathering
information about the ecology of the Park, which
would help better understand the impacts that
stressors such as windstorms have on the Park.
2010’s State of the Park Report for the Ecological
Integrity of Stanley Park (SOPEI)
In 2010, SPES published the first State of the Park
Report for the Ecological Integrity of Stanley Park
(SOPEI). The report provided a comprehensive
overview of the Park’s history, management, and
biophysical characteristics and included an initial
assessment of the Park’s ecological integrity (SPES
2010). The biophysical inventory was compiled
through a review of scientific literature, Park-specific
monitoring data, and local knowledge. A qualitative
assessment of the ecological integrity of Stanley Park
was conducted through the analysis of
environmental indicators. This process provided a
crucial preliminary understanding of the ecological
integrity of Stanley Park and what issues should be
prioritized for action planning. Following the report,
SPES began long-term monitoring programs to assess
ecological integrity through quantifiable measures.
2011’s Stanley Park Ecological Action Plan (SPEAP)
The information presented in SOPEI 2010 was also
key for establishing the Stanley Park Ecological Action
Plan (SPEAP) (VPB 2011), a comprehensive direction
for the management of five prioritized areas of the
Park: 1) Beaver Lake’s rapid infilling, 2) Lost Lagoon’s
water quality, 3) invasive plant species, 4) habitat
fragmentation, and 5) species of significance.
SOPEI 2020 Objectives
This report (SOPEI 2020) provides an opportunity to
reflect on the current state of the natural
environment and to identify trends and potential
issues as they emerge. Additionally, it offers
knowledge-based context to help guide park
management activities and conservation and
stewardship efforts. The report has been developed
with guidance from the Consolidated Guidelines for
Ecological Integrity Monitoring in Canada's National
Parks (Parks Canada 2011) and the Ecological
Integrity Monitoring Program (Parcs Québec 2014),
and has taken recommendations provided in SOPEI
2010 (SPES 2010).
In the report, we present
1) an assessment of the ecological integrity of
Stanley Park
2) recommendations for future research
directions
3) restoration and habitat enhancement
highlights since SOPEI 2010, including
tracking of the implementation of the actions
recommended in SPEAP 2011

Stanley Park Ecology Society, SOPEI 2020 7
Data Sources: SPES, City of Vancouver, District of North Vancouver

Stanley Park Ecology Society, SOPEI 2020 8
1. Ecological Integrity Assessment
This section evaluates ecological integrity through
the assessment of indicators, which provide a broad
representation of the ecosystems that occur in the
Park. The four indicators are Climate and
Atmosphere, Freshwater Ecosystems, Intertidal
Ecosystems, and Terrestrial Ecosystems. We
strategically selected 17 measures (e.g. water
temperature) for their ability to represent key
ecosystem attributes or processes.
Data were gathered from a variety of sources,
including on-the-ground monitoring (by SPES staff,
interns, and community volunteers), academic
collaborations, and open data inventories (e.g.
DataBC). Appendix 1 presents the schedule and
timeline of when the data were collected.
For each measure, we compared data to reference
threshold values. These thresholds indicate if the
data for a given measure are within an ideal range, a
fair range, or a concerning range. The threshold
values are established based on existing standards,
provincial climate trends, and predictions, developed
through professional consensus, or may require time
to establish through monitoring (Parks Canada 2011).
With this information, the current status of a
measure is scored as good, fair, or poor (Table 1).
The trend of a measure is based on a change in the
current state from a previous state and is categorized
as improving, stable, or declining (Table 2). Appendix
2 provides further explanation on how the status and
trend for each measure and indicator are calculated.
Although SPES set baseline evaluations of the
ecological integrity in 2010 (SPES 2010), the
assessment was qualitative and did not correspond
to the same approach utilized in this report. As a
result, some measures were established in the
making of this report and will be assessed when
sufficient data is collected.
Table 3 summarizes the results for each indicator and
measure.
Table 1. Terms and Symbols Used to Evaluate Current Status
Term Definition Symbol
Good The condition of the measure or
indicator is satisfactory
Fair There is concern regarding the
state of the measure or indicator
Poor The condition of the measure or
indicator is unsatisfactory
Not rated
There is insufficient information
to determine the condition of the
measure or indicator
Source: Parks Canada (2011)
Table 2. Terms and Symbols Used to Evaluate Trends
Term Definition Symbol
Improving
The condition of the measure or
indicator has improved since the
last assessment
Stable
The condition of the measure or
indicator has not changed since
the last assessment
Declining
The condition of the measure or
indicator has worsened since the
last assessment
Not rated
There is insufficient information
to determine the trend of the
measure or indicator
Source: Parks Canada (2011)

Stanley Park Ecology Society, SOPEI 2020 9
Table 3. Ecological indicators and measures selected to evaluate the ecological integrity of Stanley Park, with their current status and trend. Trends for the indicators will be determined in following reports.
Indicator Status Measure Status Trend
Climate and
Atmosphere
Air quality
Air temperature
Precipitation
Sea level rise
Freshwater Ecosystems
Water temperature
Dissolved oxygen
pH
Stream invertebrate rating
Amphibian richness
Intertidal Ecosystems
Marine algae abundance and richness
Sessile invertebrate abundance and richness
Limpet size
Terrestrial Ecosystems
Tree cover
Bird community index
Bald Eagle productivity
Huckleberry productivity
Soil decay rate
Status: Good Fair Poor Not Rated
Trends: Improving Stable Declining Not Rated
For each indicator and measure, the context, methods, and results are described below. The results reflect data
collected up to and including the year 2019 when available.

Stanley Park Ecology Society, SOPEI 2020 10
Climate and Atmosphere
With sea level rising, Stanley Park coastal habitats are expected to reduce in size, experiencing “coastal squeeze”. Currently, winter king tides are occasionally flooding the west side of the Seawall. These flooding events are expected to become more frequent and the waves to
become stronger (NHC 2014). Photo: Frank Lin, 2020
Background
The UN Intergovernmental Panel on Climate Change (IPCC) has concluded that the global atmosphere is warming
(Masson-Delmotte et al. 2018). Most of the warming observed over the last 60 years can be attributed to human
activities that release greenhouse gases into the atmosphere (BC MOE 2016a). Atmospheric warming affects all
parts of the climate system, which in turn influence other related physical systems.
Climate plays a fundamental role in shaping the environment of Stanley Park. SPES regularly examines
governmental data on air quality, temperature, precipitation, and sea level rise to better understand the impacts
of climate change on the Park’s ecosystems and species. Although park management cannot directly control how
the climate and atmosphere are changing, it can adapt to maximise the resiliency of the Park to climate change. In
2019, the Vancouver City Council approved the Climate Emergency Response Report, which identified “six big
moves” including reducing Vancouver’s carbon pollution and developing “negative emission” by restoring forest
and coastal ecosystems (City of Vancouver 2019). The City assessed coastal flood risk using a probability modelling
methodology, identified at-risk zones (some are in Stanley Park), and recognized the need to adapt flood mitigation
strategies for future sea level conditions (NHC 2014, 2015).

Stanley Park Ecology Society, SOPEI 2020 11
For our evaluation of the Climate and Atmosphere indicator, it is difficult to gauge the impact that climate change
has on the ecosystems of Stanley Park and to detect actual climate trends with the limited datasets that we have.
For these reasons, we took a different approach to discuss the Air Temperature, Precipitation, and Sea Level
measures. It is globally predicted that these three measures are changing, and small changes can have great
impacts on ecosystem balance. Therefore, we presented the data that exist for Stanley Park, and rated the
measures based on how the data compare to local governmental predictions and guidelines (Ausenco Sandwell
2011, BC MOE 2016b, Metro Vancouver 2016a). We discuss how these predicted changes and trends may affect
Stanley Park ecosystems. For the four measures of Climate and Atmosphere, we used governmental data available
in open inventories (Figure 1).
Summary
The current status for the Climate and Atmosphere indicator is evaluated as fair. Data showed a possible increase
in air temperature, no annual change in total annual precipitation, a possible decrease in total summer
precipitation, and an increase in sea level. We presume that the ecological integrity of Stanley Park is under a
certain stress caused by these changes. These changes exhibited in the data were not as pronounced as
governmental predictions and guidelines. However, the data that we analysed was not taken from a long enough
period of time to truly represent the trends of these measures, so our results should be interpreted conservatively
and will become more reliable in subsequent reports. The air pollutants nitrogen dioxide (NO2) and sulphur dioxide
(SO2) have been decreasing over the last two decades. Air quality is currently considered in good condition and
improving.
These changes are expected to have growing consequences over time on the ecosystems of Stanley Park. While
challenging, it is crucial that adequate measures are put in place to mitigate the impacts of sea level rise, seasonal
precipitation changes, and increasing air temperatures.
Decreasing summer precipitation combined with
increasing air temperature is expected to have various
concerning ecological effects, such as reducing soil
moisture which will increase erosion and tree mortality,
increasing frequency and severity of forest fires,
increasing evaporation of wetlands creating stressful
conditions for aquatic species, and increasing spread of
invasive species (BC MOE 2016b).
Some important impacts that sea level rise will directly
contribute to in Stanley Park are the loss of intertidal
habitats (coastal squeeze) and increasing salinity in Lost
Lagoon through flooding. Some graduate students have
developed interesting restoration strategies to mitigate
and adapt to the impacts of sea level rise in Stanley Park,
for the west coastline of the Park, and for the future of
Lost Lagoon (bringing it back to a mudflat ecosystem, for
the latter) (Canning 2017, MacKinnon 2018). Figure 1. The data used for the Climate and Atmosphere measures was collected at three governmental stations.

Stanley Park Ecology Society, SOPEI 2020 12
Measure: Air Quality
Status: Good (average of three pollutants)
Trend: Improving
Thresholds (Concentration
in ppb)
Annual peak1 Annual average
Ground-level ozone (O3)
Nitrogen dioxide (NO2)
Sulphur dioxide (SO2)
Poor > 65 > 22 > 12
Fair 50 – 65 3 – 22 3 – 12
Good < 50 < 3 < 3 1 Annual peak (4th-highest) of the daily maximum 8-hour average
concentration
Context
Air quality can deteriorate due to the presence of air
pollutants (ECCC 2018). Ground-level ozone (O3) is a
secondary pollutant formed in the air from other
contaminants with the highest concentrations of
ozone occurring during hot sunny weather. Sulphur
dioxide (SO2) is formed primarily by the combustion
of fossil fuels containing sulphur, such as marine
vessels and the petroleum products industry. Road
vehicles and other transportation are the primary
source of nitrogen dioxide (NO2) emissions, with the
highest average concentrations measured in high-
traffic areas (CCME 2017a).
Method
SPES inferred the ambient air quality of Stanley Park
from the nearest monitoring station in Robson
Square operated by Metro Vancouver. The station
provides long-term hourly data for multiple air
pollutants. Thresholds for Stanley Park were defined
by regional, provincial, and federal pollutant-specific
objectives and standards (BC MOE 2016a, Metro
Vancouver 2016b, CCME 2017b).
Results
To ensure an unbiased summary of the measure’s
status, we equally weighted each pollutant (Parks
Canada 2011). The overall current status of the air
quality measure is good. Mann-Kendall tests found a
significant monotonic decreasing trend in NO2 and
SO2 since 2000 (for NO2, z = - 4.46, p < 0.001, slope of
- 0.50 ppb/year; for SO2 z = - 4.16, p < 0.001, slope of
- 0.26 ppb/year). For O3, Mann-Kendall tests showed
a significant monotonic increasing trend over time
(z = 1.98, p < 0.05, slope of 0.30 ppb/year). While O3
increased over time, it remained within the good
thresholds since 2000 (Figure 2). Based on the trends
of the three pollutants, the trend for air quality is
improving. This reflects national strategies to reduce
NO2 and SO2 emissions (CCME 2017a).
Figure 2. Air pollutant concentrations from 2000 and 2018. A. Annual peak (4th-highest daily maximum 8-hour average) of ground-level ozone (O3) concentrations; B. Annual average of hourly concentrations of nitrogen dioxide (NO2); C. Annual average of hourly concentrations of sulphur dioxide (SO2). The green, yellow, and red areas represent the good, fair, and poor thresholds, respectively. The average concentration from 2012 to 2018 for each pollutant is indicated over each graph and is used to assess the current status of this measure. All data was collected at the Vancouver Robson Square monitoring station (BC MOE 2020). Years that did not satisfy the data completeness criteria were not considered valid for inclusion and have not been presented.
Since the evaluation of this measure is based on data
collected at the Robson Square monitoring station in
downtown Vancouver, it may not reflect what is
happening in Stanley Park. Tree leaves uptake air
pollutants such as O3, NO2, and SO2 (Nowak et al.
2014), so we presume the concentration of these
pollutants would be lower in Stanley Park than
downtown Vancouver. Installing an air quality
monitoring station in Stanley Park would provide a
more accurate assessment for the Park.
0
20
40
60
0
10
20
30
0
4
8
12
Year
A
B
C SO
2 C
on
cen
trat
ion
(pp
b)
NO
2 C
on
cen
trat
ion
(pp
b)
O3 C
on
cen
trat
ion
(pp
b)
average: 36.5 ppb
average: 18.4 ppb
average: 1.5 ppb

Stanley Park Ecology Society, SOPEI 2020 13
Measure: Air Temperature
Status: Fair (appears to be increasing)
Trend: Not rated
Thresholds
Average annual increase in air temperature
Poor > 0.045 °C/year
Fair > 0 – 0.045 °C/year ≤
Good no significant change
(adapted from BC MOE 2016b predictions)
Context and Impacts on Ecosystems
Warming may drive broad-scale shifts in the
distribution of ecosystems and species (BC MOE
2016b). In Stanley Park, it may ease the spread of
invasive species, reduce air moisture contributing to
soil erosion, increase evaporation of wetlands, create
stressful conditions for aquatic species, and increase
the frequency and severity of forest fires. The
Georgia Depression region warmed by 0.8 °C
between 1900 and 2013; this is similar to the global
average rate of 0.9°C per century (BC MOE 2016b).
Regional climate change scenarios predict an
increase from historical normal (1971-2000) in mean
annual temperature of 2.9 °C by the 2050s across
Metro Vancouver (Metro Vancouver 2016a).
Method
SPES examined data recorded through the Vancouver
Harbour climate station (#1108446) located on
Deadman’s Island in Stanley Park (Government of
Canada 2020). The climate station has recorded air
temperature since 1976 and became automated in
1995 (G. Bramwell, Environment and Climate Change
Canada, Personal Communication 2017). To ensure
consistency within the dataset, only information
collected from 1996 and onwards is presented.
Results
Between 2010 and 2019, the annual average
temperature in Stanley Park was 11.6 °C, which is
0.5 °C above the previous decade of 2000-2009.
Although not significant, annual average
temperatures at the Vancouver Harbour climate
station appear to be increasing from 1996 to 2019
(z = 1.52, p > 0.05) (Figure 3). This is reflective of
regional, provincial, and global temperature trends.
Considering that the possible increase in air
temperature is lower than the predictions, and that
the average annual air temperature was higher
during this decade than the previous one, we
evaluate the current status of this measure as fair.
Figure 3. Annual average air temperature per year from 1996 to 2019 at Deadman’s Island in Stanley Park. There is no significant trend exhibited in air temperature over time, but it appears to be increasing. Years that did not satisfy the data completeness criteria were not considered valid for inclusion and have not been presented. Data source: Historical Data (Government of Canada 2020).
This analysis will become more reliable when more
data will be collected and analysed. An increase in air
temperature in Stanley Park may become more
evident over time, such as observed on the regional,
provincial, and global scales (BC MOE 2016b). We will
assess the trend of this measure in subsequent
reports.
y = 0.0264x + 11.026R² = 0.1424
6.0
7.0
8.0
9.0
10.0
11.0
12.0
13.0
19
96
19
98
20
00
20
02
20
04
20
06
20
08
20
10
20
12
20
14
20
16
20
18
Mea
n A
nn
ual
Tem
per
atu
re (
°C)
Year

Stanley Park Ecology Society, SOPEI 2020 14
Measure: Precipitation
Status: Good (No significant change)
Trend: Not rated
Thresholds
Total precipitation change in annual or in one season
Poor Change greater than prediction rate
Fair Change less than or equal to prediction rate
Good No significant change
Predicted change in precipitation over years and seasons (%)
(adapted from Metro Vancouver 2016b)
Annual + 0.08 to 0.12 % per year
Winter + 0.08 to 0.15 % per year
Spring + 0.12 to 0.13 % per year
Summer - 0.30 to - 0.31 % per year
Fall + 0.17 to 0.21 % per year
Context and Impacts on Ecosystems
Regional precipitation projections predict a 5%
increase in total annual precipitation by the 2050s
and a larger increase of 11% by the 2080s, as well as
wetter winters and drier summers, relative to the
baseline period of 1971 to 2000 (Metro Vancouver
2016a). Increased year-to-year variability in
precipitation may have adverse impacts on wetlands
and other ecosystems and make water planning
more complex (BC MOE 2016b).
In Stanley Park, we would expect wetter winters to
create more and worse flooding events, which can:
• Erode the gravel paths surrounding Lost Lagoon,
Beaver Lake, and streams. This impacts aquatic
habitats of fish, invertebrates, amphibians, and
other organisms.
• Lead people to walk around puddles, which may
steer them to outside paths and lead to
trampling plants, habitats, and small organisms.
• Flood buildings and infrastructure around Lost
Lagoon more often during king tide events.
• Generate high water flow in Beaver Creek that
continuously aggravates the head cut (at the
outflow of Beaver Lake) and collapses the
adjacent walking path.
Drier summers are expected (but not limited) to:
• Reduce soil moisture in the summer, resulting in
decline of tree growth, increase of tree
mortality, and less aquatic and moist terrestrial
habitat for amphibians and other organisms.
• Reduce rainwater level in lakes and streams of
the Park. Continuing to add municipal water to
Stanley Park watershed would be beneficial for
the ecosystems; however, water conservation
efforts may no longer permit that as a potential
source of fresh water. Municipal water needs
will increase for drinking water due to drier
summers and due to anticipated growing
population.
• Increase risk, frequency, and severity of forest
fires and human-caused fire events, leading to
decreased air quality from smoke.
Method
We used data recorded by the Vancouver Harbour
climate station (#1108446) located on Deadman’s
Island in Stanley Park for this analysis (Government
of Canada 2020). The climate station has recorded
precipitation since 1976 and became automated in
1995 (G. Bramwell, Environment and Climate Change
Canada, Personal Communication 2017). To ensure
consistency within the dataset, only data collected
from 1996 and onwards were presented. When data
were missing for some days at the station, SPES used
data (1.7% of total dataset) from the Vancouver
INTL A climate station (#1108395) (Government of
Canada 2020). Years that still did not satisfy the data
completeness criteria were not considered valid for
inclusion and are not presented.
Results
From 1996 to 2019, the wettest year was 2010 and
the driest year was 2019, and summer months varied
more than the other seasons in total precipitation
year after year (Figure 4 and Figure 5). Because no
significant trends were detected, annually or
seasonally, the current status for precipitation is
considered good. However, this analysis will become
more reliable when more data will be collected and
analysed. Changes in total precipitation in Stanley

Stanley Park Ecology Society, SOPEI 2020 15
Park may become more evident over time, such as
observed on the regional, provincial, and global
scales (BC MOE 2016b).
Figure 4. Total seasonal precipitation (mm) from 1996 to 2019. No significant trend was detected, but summer precipitation seems to be decreasing. Data source: Historical Data (Government of Canada 2020)
Figure 5. Total annual precipitation (mm) from 1996 to 2019. No statistically significant trend was detected. Data source: Historical Data (Government of Canada 2020).
Drier summers can reduce soil moisture, resulting in decline of tree growth and increase of tree mortality. As Western redcedars
have increasingly been observed declining and dying in larger numbers in the last couple of years, in 2020, Diamond Head Consulting Ltd conducted a preliminary study for the VPB to
quantify and measure the severity of declining Western redcedars in Stanley Park (Diamond Head Consulting Ltd 2020).
Photo: Ariane Comeau, 2020
0
200
400
600
800
1000
19
96
20
00
20
04
20
08
20
12
20
16
20
20
Winter
0
200
400
600
19
96
20
00
20
04
20
08
20
12
20
16
20
20
Spring
0
100
200
300
19
96
20
00
20
04
20
08
20
12
20
16
20
20
Summer
0
200
400
600
800
19
96
20
00
20
04
20
08
20
12
20
16
20
20
Fall
y = -1.7086x + 4967.7R² = 0.0035
1000
1200
1400
1600
1800
2000
2200
19
96
19
98
20
00
20
02
20
04
20
06
20
08
20
10
20
12
20
14
20
16
20
18
20
20
Tota
l Pre
cip
itat
ion
(mm
)
Year
Tota
l pre
cip
itat
ion
(m
m)
Year

Stanley Park Ecology Society, SOPEI 2020 16
Measure: Sea Level
Status: Fair (increase of 0.0053 m/year)
Trend: Not rated
Thresholds
Average annual increase in sea level
Poor > 0.01 m/year
Fair > 0 – 0.01 m/year ≤
Good no significant change
(Adapted from Ausenco Sandwell 2011, NHC 2014 predictions)
Context and Impacts on Ecosystems
Coastal hazards associated with sea level rise include
coastal flooding, erosion, and loss of intertidal
habitat (The Arlington Group Planning + Architecture
Inc. et al. 2013). Sea level rise policy for BC
recommends assuming a one meter rise in global
mean sea level between 2000 and 2100 (Ausenco
Sandwell 2011). The City of Vancouver’s Coastal
Flood Risk Assessment (NHC 2014) modelled different
scenarios predicting 0.6 m and 1.0 m sea level rise by
the year 2100. The City predicts that sea level rise
will directly impact Stanley Park shorelines. With
permanent inundation due to higher sea levels, the
intertidal zone will shrink, resulting in reduced
habitat for mussels, snails, young fish, which will
affect the food chain and the mammals and birds
that feed in the intertidal zone (City of Vancouver
2018). Wave modelling shows that the west side of
Stanley Park is the most exposed side and will be
subject to the largest waves, resulting in more
seawall breakage, undercuts, and flooding.
Method
Annual average sea level data for Stanley Park were
inferred from the nearby Vancouver Harbour Tide
Station (#175), which is operated and governed by
the Canadian Hydrographic Service, Fisheries and
Oceans Canada.
Results
Between 2010 and 2019, the annual average sea
level was 7.139 m, which is 0.060 m above the 2000-
2009 average. It represents an increase of 0.0053 m
per year (5.3 mm/year). Mann Kendall tests indicated
a significant increasing trend in sea level between
2000 and 2019 (z= 2.79, p < 0.01) Figure 6. Because
there is a significant trend in sea level, which we
presume to affect the ecological integrity of the Park,
and that the changing rate is slower than the
predictions, we consider the current status for sea
level to be fair.
Figure 6. Annual mean sea level (m) from 2000 to 2019, at Vancouver Harbour near Stanley Park. In the last two decades, sea level is increasing at a rate of 0.0053 m per year (5.3 mm/year). Data source: Permanent Service for Mean Sea Level (PSMSL 2019).
The trends observed at the Vancouver Harbour Tide
Station are reflective of global, provincial, and
regional trends. Between 1993 and 2013, the rate of
global sea level rise increased to around
0.003 m/year (3 mm/year) (The Arlington Group
Planning + Architecture Inc. et al. 2013). On the BC
coast, sea level rise has occurred in most locations,
but at a lower rate than the global average. In
Vancouver, average sea level rose at a rate of
0.0004 m/year (0.4 mm/year) over the last century
(Province of BC 2017).
y = 0.0053x + 7.055R² = 0.4803
7
7.05
7.1
7.15
7.2
7.25
Mea
n s
ea le
vel (
m)
Year

Stanley Park Ecology Society, SOPEI 2020 17
Freshwater Ecosystems
Beaver Lake is a place of ecological and cultural importance. However, its resilience to facing severe stressors such as invasive species, infilling, and climate change is uncertain. Photo: Michael Schmidt, 2015
Background
Freshwater ecosystems are a subset of aquatic ecosystems, and include lakes, ponds, streams, springs, and
wetlands. Although they occupy less than one per cent of the Earth’s surface, freshwater ecosystems support an
estimated 12 per cent of all animal species (Abromovitz 1996). However, freshwaters are losing a greater
proportion of their species and habitat than any other ecosystem (Revenga and Mock 2000, Ormerod et al. 2010).
Threats to species in freshwater ecosystems are widespread and include habitat degradation, pollution, climate
change, and the introduction of non-native species (Pacific Rivers Council 2007, Ormerod et al. 2010).
Essential freshwater components of Stanley Park consist of Beaver Lake, Lost Lagoon, Ceperley Meadow, several
streams, and ephemeral ponds. They provide critical habitat for aquatic and semiaquatic species, including species
at risk. Since the late 1800s, Beaver Lake and Lost Lagoon have gone through significant human-caused alterations.
Both Beaver Lake and Lost Lagoon are infilling at rapid rates due to alteration to the watershed and its hydrology
over the last century from logging, fragmentation caused by trails and roads, and invasive species, especially the
fragrant water lilies covering most of Beaver Lake’s surface in the summer (more information on the lakes and
watershed history in SOPEI 2010 (SPES 2010)).
Beaver Lake is one of Vancouver’s last natural wetlands, but is infilling at a rapid rate due to invasive plant species,
road construction, and fluctuating seasonal water levels. In 2011, the rapid infilling and accelerated succession of
Beaver Lake was identified as a top priority for short-term restoration and enhancement in the Stanley Park
Ecological Action Plan (SPEAP 2011) (VPB 2011). It was evaluated that without intervention, it would risk losing its

Stanley Park Ecology Society, SOPEI 2020 18
open water by 2020. In 2013, a team of consultants led by AquaTerra Environmental Ltd. was engaged to assess
the issue and develop a vision for Beaver Lake. In 2014, the Ecological and Culturally Sensitive Enhancement Plan
for Beaver Lake was produced (VPB and AquaTerra Environmental Ltd. 2014) and was open to public review (VPB
2014). The goal of this project was “to create a diverse and healthy ecosystem that provides passive recreation
opportunities for the public, maximizes native biodiversity, respects cultural significance and requires minimal
ongoing interventions to maintain its integrity” (VPB and AquaTerra Environmental Ltd. 2014). Even though the
enhancement project was identified as a top priority in SPEAP 2011, there have been considerable delays in the
implementation of the enhancement plan, mostly due to lack of funding from the city’s Capital Plan (City of
Vancouver 2020a). In 2020, Beaver Lake still had open water, and beavers have played an important role in
keeping deep water in the lake. Further information on the progress of this project is provided in Appendix 3 and
on the City of Vancouver’s website (City of Vancouver 2020a).
Lost Lagoon was originally an intertidal mud flat which was separated from Coal Harbour in 1916 by the
construction of the Stanley Park Causeway and has since been a freshwater lake with saltwater intrusion (SOPEI
2010). Today it is a eutrophic system with little submergent vegetation and mostly inhabited by invasive species
such as common carp and yellow flag iris. Nonetheless, Lost Lagoon is an important destination for birds migrating
along the Pacific Flyway and is a refuge for a great number of overwintering and breeding birds. The biofiltration
pond of Lost Lagoon, built in 2001, filtrates pollutants from the Causeway and provides wildlife habitat. Improving
the water quality of Lost Lagoon was identified as a short term priority in SPEAP 2011, but, similarly to the Beaver
Lake enhancement project, it is facing delays. The VPB is contemplating the option of transitioning Lost Lagoon
back to a mud flat, which would be a more productive and healthy ecosystem and mitigate increasing flooding
events due to sea level rise (NHC 2014, MacKinnon 2018).
SPEAP 2011 directed that seasonal freshwater top ups (potable city water) would continue to maintain water
depths, cool waters, and oxygen in the Park’s lake and the Jubilee Fountain in Lost Lagoon would continue
operation in order to aerate the Lagoon. However, policies have shifted and most municipal water in the Park’s
watershed has been shut down since 2015 for water conservation. The Jubilee Fountain was significantly damaged
by a flood in 2016 and estimated costs to fix it has increased. Alternative freshwater sources are being investigated
(Alan Duncan, personal comm. 2020).
To evaluate the current status of the Freshwater Ecosystems indicator for Stanley Park, SPES monitors water
temperature, dissolved oxygen, pH, stream invertebrate rating, and amphibian richness (Figure 7).
Summary
The current state of the Freshwater Ecosystems indicator is evaluated as poor. The current status for water
temperature and for dissolved oxygen (DO) is poor and stable. High summer water temperatures were regularly
recorded in both Beaver Lake and Lost Lagoon and DO reached incredibly low levels in Beaver Lake. These
conditions reached lethal levels to aquatic fish and amphibians and may explain the low number of fish species
inhabiting the lakes. The current status for pH is fair and stable. Water quality in Beaver Creek was evaluated
through stream invertebrate ratings, and the status is fair and declining. Amphibian richness is considered good
and stable.
Other recent studies evaluated heavy metals in Beaver Lake and Lost Lagoon, both exhibiting elevated amounts of
metal in the water column and sediment, exceeding provincial and federal quality guidelines for aquatic life
(Faugeraux and Bendell 2011, VPB and AquaTerra Environmental Ltd. 2014, MacKinnon 2018).

Stanley Park Ecology Society, SOPEI 2020 19
These inadequate aquatic conditions were identified prior to our assessment in several studies. They have negative
effects on aquatic life and will likely continue to decline without intervention. Management strategies such as the
proposed actions identified as priorities and approved by the VPB in SPEAP 2011 are essential to bring freshwater
ecosystems of Stanley Park back to appropriate conditions for aquatic life.
Currently, water temperature, DO, and pH is measured once every other week by SPES staff and volunteers.
Installing water quality and water level data loggers in Lost Lagoon and Beaver Lake would provide a more
continuous and intensive sampling for parameters of interest.
Figure 7. Sites for Freshwater Ecosystems data collection.

Stanley Park Ecology Society, SOPEI 2020 20
Measure: Water Temperature
Status: Poor (maximum 26.9 °C)
Trend: Stable
Thresholds
Maximum water temperature (°C)
Poor Fair Good
> 21 18 - 21 < 18
Context
Water temperature in lakes is an important
environmental factor, playing a pivotal role in the
development, growth, and reproduction of aquatic
organisms (MELP 2001).
Method
Since 2016, SPES has monitored water temperatures
in summer months (between June 1 and September
30) in three locations in Beaver Lake and three
locations in Lost Lagoon, near the shore using a YSI
Professional Plus Meter. Prior to these years, water
temperatures were collected with different methods,
by SPES and other groups. Due to limited data, we
include those measurements here even if collection
was inconsistent. This assessment provides an
indication of stress that aquatic organisms might
experience, especially during low water and drought
conditions. SPES established water temperature
thresholds based on the instant upper lethal water
temperature for Northern red-legged frog egg
survival, at 21 °C and for juvenile and adult salmonid
rearing, between 22 and 24 °C (Licht 1971, MELP
2001, COSEWIC 2002).
Results
Between 2011 and 2019, the maximum water
temperature measured in Beaver Lake ranged from
18.5 °C to 22.9 °C, while the maximum water
temperature measured in Lost Lagoon has ranged
from 24.3 °C to 26.9 °C (Figure 8). For both lakes, the
maximum water temperature exceeded the 21 °C
threshold every year observed, indicating that the
current status for water temperature is poor. In
1984, the maximum water temperature measured in
Beaver Lake was 22 °C (Hatfield Consultants Limited
1984), and in 2010 in Lost Lagoon SPES measured a
maximum temperature of 25 °C. No significant trend
was detected in either Lost Lagoon or Beaver Lake
maximum water temperatures, therefore the trend is
considered stable. However, given that both lakes
are infilling at a relatively rapid rate and becoming
shallower (SPES 2010, VPB and AquaTerra
Environmental Ltd. 2014), we expect water
temperatures to increase.
Figure 8. Maximum water temperature (°C) recorded per year in Beaver Lake and Lost Lagoon. The green, yellow, and red areas represent the good (< 18 °C), fair (18-21 °C), and poor (> 21 °C) thresholds respectively. 1984 data was collected by Hatfield Consultants Limited and the remaining data was collected by SPES.
SPES staff measuring water quality using a YSI Professional Plus Meter. Photo: Michael Schmidt, 2017
10
15
20
25
30
Wat
er t
emp
erat
ure
(°C
)
Year
Beaver Lake
Lost Lagoon

Stanley Park Ecology Society, SOPEI 2020 21
Measure: Dissolved Oxygen
Status: Poor (minimum 0.5 mg/L)
Trend: Stable
Thresholds
Minimum dissolved oxygen in summer
(mg/L)
Poor Fair Good
< 6 6 - 8 > 8
Context
Dissolved oxygen (DO) is one of the most important
parameters in assessing water quality because it
determines whether or not aerobic aquatic
organisms (require oxygen to live) will be able to
survive and reproduce in the water (Zimmermann et
al. 1999)(MELP 1997, Zimmermann et al. 1999).
Method
Since 2016, SPES monitors DO in the summer months
(between June 1 and September 30) in three
locations in Beaver Lake and three locations in Lost
Lagoon, near the shore using a YSI Professional Plus
Meter. It provides information on water quality when
DO levels are at seasonal lows (the water capacity for
DO is lower at warmer temperatures) (MPCA 2009).
The DO thresholds for Beaver Lake and Lost Lagoon
were established based on the recommended criteria
for the protection of aquatic life (instantaneous
minimum of 5 mg/L and 30-day mean of 8 mg/L) and
other resources (Hatfield Consultants Limited 1984,
MELP 1997, Franklin 2013).
Results
Beaver Lake and Lost Lagoon have reached DO values
as low as 0.5 mg/L and 5.3 mg/L, respectively (Figure
9). Because both lakes have experienced reduction in
DO to levels that are harmful for aquatic life, the
current status for DO is poor. No trend was detected,
and the poor status has not changed compared to
data from 1984. We therefore consider the trend
stable, and it is not expected to improve without
restoration.
Figure 9. Minimum dissolved oxygen (DO, in mg/L) recorded per year in Beaver Lake and Lost Lagoon, between June 1 and September 30. The green, yellow, and red areas represent the good (8 mg/L), fair (6 – 8 mg/L), and poor (6 mg/L) thresholds respectively. 1984 Beaver Lake measurement was collected by Hatfield Consultants Limited (1984), and the remaining data was collected by SPES.
Threespine stickleback (Gasterosteus aculeatus) is one of very few species of fish living in Beaver Lake and Lost Lagoon; this is
likely due to its tolerance to severe hypoxia (low oxygen condition) (Regan et al. 2017). Photo: Don Enright, 2014
0
2
4
6
8
10
12
19
84
20
16
20
17
20
18
Dis
solv
ed O
xyge
n (
mg/
L)
Year
Beaver Lake
Lost Lagoon

Stanley Park Ecology Society, SOPEI 2020 22
Measure: pH
Status: Fair (minimum 5.2 and maximum 8.4)
Trend: Stable
Thresholds
Minimum and maximum pH in summer
Poor Fair Good
< 5.0 or > 9.0 5.0 - 6.5
or
8.5 - 9.0
> 6.5 – 8.5 <
Context
Most aquatic organisms have a narrow range of pH
tolerance. If the pH level is too high (too basic) or too
low (too acidic), the organisms living within the
waterbody become stressed. The pH level also affects
the solubility and toxicity of chemicals and heavy
metals in the water, with high and low pH levels
causing toxic chemicals to become more mobile
(Fondriest Environmental Inc. 2016).
Method
SPES has been monitoring pH levels intermittently
since 2010 in Beaver Lake and Lost Lagoon.
Monitoring pH between June 1 and September 30
provides information on water quality during the
summer months when pH levels are at seasonal lows.
We established pH thresholds for Stanley Park based
on the provincial ambient water quality criteria for
aquatic life (McKean and Nagpal 1991).
Results
The summer pH values for both Beaver Lake and Lost
Lagoon were on average within the good threshold,
but reached values within the fair thresholds,
(minimum pH of 5.2 and a maximum pH of
8.4)(Figure 10). The current status for pH is therefore
considered fair. Based on limited data, the trend for
pH is likely stable, but further data collection will be
required to confirm that trend.
Figure 10. Maximum and minimum pH values recorded per year in Beaver Lake and Lost Lagoon between June 1 and September 30. pH is considered poor if under 5 or over 9 (red area), fair if between 5 and 6.5 or between 8.5 and 9 (yellow area), and good if between 6.5 and 8.5 (green area). Data was collected by SPES.
0
2
4
6
8
10
12
14
20
10
20
11
20
12
20
13
20
14
20
15
20
16
20
17
20
18
pH
Year
Beaver Lake
Lost Lagoon

Stanley Park Ecology Society, SOPEI 2020 23
Measure: Stream Invertebrate Rating
Status: Fair (1.9 rating)
Trend: Declining
Thresholds
Stream invertebrate rating
Poor Fair Good
< 1.3 1.3 – 2.7 > 2.7
Context
Stream macroinvertebrates are aquatic invertebrates
living on the substrate of a body of water and are
large enough to be seen with the naked eye (e.g.
damselfly nymphs). Evaluating the abundance and
variety of macroinvertebrates in streams provides an
indication of water purity of that waterbody because
invertebrates differ in their tolerance to pollution
(Benetti et al. 2012, EPA 2016).
Method
Stream invertebrate ratings were taken from The
Streamkeepers Handbook Module 4: Stream
Invertebrate Survey (DFO 1995). SPES conducted
surveys in 2014 and 2018 in Beaver Creek. In 2019,
we began assessing North Creek, Zoo Creek, and
Ceperley Creek as well. The surveys are conducted in
two sites per creek, in spring and fall. In 1998,
Capilano College students conducted a similar survey
at Beaver Creek and North Creek (Benitah et al.
1998). While the survey was not conducted in the
exact same way, we still consider their results in the
analysis. For consistency, we will only analyse results
for Beaver Creek.
Results
For Beaver Creek, between 2014 and 2019, the
annual average stream invertebrate site rating was
1.8. The current status of this measure is fair. In
1998, the rating resulted as good (2.8 rating). The
trend for this measure is considered declining (Figure
11). Further monitoring and of more creeks will
strengthen the assessment and will confirm if the
rating continues to decrease. Aquatic worms, aquatic
sow bugs, caddisfly larvae, and midge fly larvae are
the most abundant stream macroinvertebrates found
in Beaver Creek.
Damselfly nymphs are abundant in Beaver Lake and are more tolerant to water pollution than caddisflies, stoneflies, and
mayflies. Photo by Ariane Comeau, 2015
Figure 11. Stream invertebrate rating for Beaver Creek, Stanley Park in 1998, 2014, 2018, and 2019. The green, yellow, and red areas represent the good (> 2.7), fair (1.3 – 2.7), and poor (< 1.3) thresholds respectively. The current rating is on average 1.9 and considered fair, but declining. 1998 data was collected by Capilano College students (Benitah et al. 1998) and the remaining data was collected by SPES.
SPES volunteer identifying stream invertebrates in Ceperley Creek. Photo: Meghan Cooling, 2019
0
0.5
1
1.5
2
2.5
3
19
98
20
00
20
02
20
04
20
06
20
08
20
10
20
12
20
14
20
16
20
18
Rat
ing
Year

Stanley Park Ecology Society, SOPEI 2020 24
Measure: Amphibian Richness
Status: Good (4 native species)
Trend: Stable
Thresholds
Number of native amphibian species detected
Poor Fair Good
≤ 2 3 ≥ 4
Context
Amphibians are particularly sensitive to water-borne
pollutants and pathogens as they have moist,
permeable skin. In addition, factors such as habitat
loss, introduced species, and climate change are
negatively impacting amphibian populations on a
global scale (Meredith et al. 2016, Griffith 2017).
Method
SPES monitors terrestrial and pond-breeding
amphibians by conducting auditory, capture, and
visual encounter surveys every other year (RIC 1998,
1999). Pond-breeding surveys are done in lakes and
ponds of the Park, early to late spring when
amphibians are laying egg masses. The terrestrial
surveys take place all year long, consisting of
observing presence of terrestrial amphibians under a
dozen coverboards placed within the forest of the
Park. Other sightings outside of surveys are also
recorded. We established thresholds based on the
number of native amphibian species detected in the
Park between 2000 and 2009.
Results
Since 2010, four native amphibian species were
detected, all provincially yellow listed (species that is
at the least risk of being lost/of least concern) (Table
4). The Northern Pacific treefrog made a comeback
around 2015 and a full chorus can now be heard at
Beaver Lake. The current status for amphibian
richness is considered good and, comparing to the
last assessment, the trend is stable.
Table 4. Native amphibian species documented in Stanley Park historically, between 2000 and 2009, and 2010 and 2020
English Name Scientific Name Histo-rically1
2000 to
2009
2010 to
2019
Blue listed (in BC, species of special concern)
Northern red-legged frog
Rana aurora ✓
1-SC (in Canada, species of special concern)
Western toad Anaxyrus boreas
✓
Yellow listed (in BC, species of least concern)
Ensatina Ensatina eschscholtzii
✓ ✓ ✓
Long-toed
salamander
Ambystoma
macrodactylum ✓
Northern Pacific
treefrog
Pseudacris
regilla ✓ ✓
Northwestern
salamander
Ambystoma
gracile ✓ ✓ ✓
Rough-skinned newt Taricha
granulosa ✓ ✓
Western red-backed
salamander
Plethodon
vehiculum ✓ ✓ ✓
Total Native Amphibian Species 8 4 4 1: Data from the Ministry of Environment (2020)
SPES believes that the reappearance of the Northern
Pacific treefrog is most likely due to someone
releasing individuals to Stanley Park. It is unlikely that
the treefrogs made it back on their own as Stanley
Park is highly isolated from other populations. We
suspect that this may be the case for the one rough-
skinned newt found in 2020 (Mike Mackintosh,
personal comm. 2020), since the species was not
detected for ten years.
The invasive American bullfrog (Lithobates
catesbeianus) and green frog (Lithobates clamitans)
are found within the lakes and ponds of the Park.
Invasive species may coexist with some of the native
species; however, they are known to prey on
amphibians (Jancowski and Orchard 2013) and, along
with changes in water temperature and DO, could be
a factor of the disappearance of some of the
historically occurring species. Examining abundance
of native and invasive amphibian species would
provide additional information on their populations.
Stanley Park Ecology Society, SOPEI 2020 25
Intertidal Ecosystems
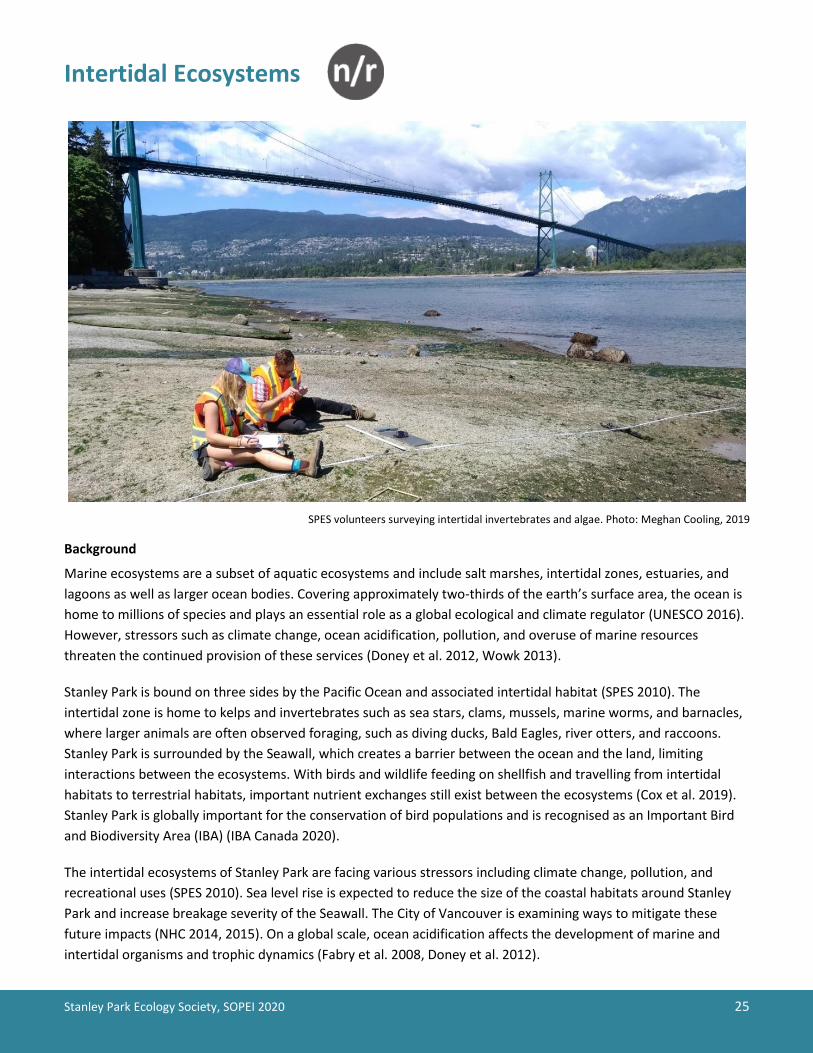
SPES volunteers surveying intertidal invertebrates and algae. Photo: Meghan Cooling, 2019
Background
Marine ecosystems are a subset of aquatic ecosystems and include salt marshes, intertidal zones, estuaries, and
lagoons as well as larger ocean bodies. Covering approximately two-thirds of the earth’s surface area, the ocean is
home to millions of species and plays an essential role as a global ecological and climate regulator (UNESCO 2016).
However, stressors such as climate change, ocean acidification, pollution, and overuse of marine resources
threaten the continued provision of these services (Doney et al. 2012, Wowk 2013).
Stanley Park is bound on three sides by the Pacific Ocean and associated intertidal habitat (SPES 2010). The
intertidal zone is home to kelps and invertebrates such as sea stars, clams, mussels, marine worms, and barnacles,
where larger animals are often observed foraging, such as diving ducks, Bald Eagles, river otters, and raccoons.
Stanley Park is surrounded by the Seawall, which creates a barrier between the ocean and the land, limiting
interactions between the ecosystems. With birds and wildlife feeding on shellfish and travelling from intertidal
habitats to terrestrial habitats, important nutrient exchanges still exist between the ecosystems (Cox et al. 2019).
Stanley Park is globally important for the conservation of bird populations and is recognised as an Important Bird
and Biodiversity Area (IBA) (IBA Canada 2020).
The intertidal ecosystems of Stanley Park are facing various stressors including climate change, pollution, and
recreational uses (SPES 2010). Sea level rise is expected to reduce the size of the coastal habitats around Stanley
Park and increase breakage severity of the Seawall. The City of Vancouver is examining ways to mitigate these
future impacts (NHC 2014, 2015). On a global scale, ocean acidification affects the development of marine and
intertidal organisms and trophic dynamics (Fabry et al. 2008, Doney et al. 2012).

Stanley Park Ecology Society, SOPEI 2020 26
In April 2015, a substantial oil spill occurred in English Bay. The Marathassa oil leak came from a Panamax bulk
grain carrier and it spread to the shorelines of Stanley Park by Siwash Rock. It was roughly estimated that a total of
2,800 L of fuel oil leaked and that approximately half of it was recovered (Canadian Coast Guard 2015). Not enough
baseline data was available to capture how detrimental the oil spill was on the habitats of the Park. Collecting
baseline information in the intertidal ecosystems will provide information on the impact of future stressors such as
oil spills and climate change.
SPES is surveying the intertidal community to understand how it may change over time facing these stressors. So
far, the intertidal habitats have been assessed intermittently; however, a monitoring program has been developed
and regular surveys will be conducted to document changes in marine algae abundance and richness, sessile
invertebrate abundance and richness, and sea surface temperature (Figure 12).
Summary
SPES initiated a long-term monitoring program for the Intertidal Ecosystems indicator in 2019. The data collected
that year was used to established thresholds for each measure. The status and trend for the measures and
indicator will be assessed in subsequent reports when data become available. Since we are currently working with
only three measures, collaborating with local groups doing similar work would be beneficial to provide a stronger
understanding of the intertidal ecosystems’ conditions (e.g. for forage fish, seagrass).
Figure 12. Intertidal Ecosystems data is collected on six sites around Stanley Park. SPES surveys marine algae abundance and richness, sessile invertebrate abundance and richness, and limpet size along 24 random transects on these sites.

Stanley Park Ecology Society, SOPEI 2020 27
Marine Algae Sessile Invertebrates Limpet Size
Status: Not rated
Trend: Not rated
Status: Not rated
Trend: Not rated
Status: Not rated
Trend: Not rated
Thresholds
1. Algae relative abundance (%)
Thresholds
1. Sessile invertebrate relative
abundance (%)
Thresholds
Limpet shell length (mm)
Poor Fair Good Poor Fair Good Poor Fair Good
< 16.5 16.5 –
24.75
> 24.75 < 7.0 7.0 – 10.5 > 10.5 < 3.5 3.5 – 5.25 > 5.25
2. Algae richness (number of species) 2. Sessile invertebrate richness
(number of species)
Poor Fair Good Poor Fair Good
< 1.15 1.15 – 1.73 > 1.73 < 0.75 0.75 – 1.13 > 1.13
Context
Several biological communities are associated with the rocky intertidal habitat surrounding Stanley Park, including
a diversity of algae and invertebrate species (SPES 2010). Marine algae and invertebrate species are vulnerable to
physical and chemical changes in the marine environment, which makes them useful indicators for detecting
environmental change (El Shoubaky 2013). Shifts in species abundance and distribution are expected in response
to climate change, ocean acidification, pollution, and over use of marine resources, although it is unclear how
invertebrate communities respond to warming ocean temperatures (Clark et al. 2016, Loiacono 2016).
Method
An intertidal habitat monitoring program has been developed for SPES by Environmental Resources Management
(ERM 2018). SPES began conducting yearly surveys in 2019 to document changes in abundance and richness of
marine algae and sessile invertebrates, as well as change in limpet size. Sessile invertebrates such as barnacles,
anemones, and mussels are immobile and attached to substrate for at least a part of their life cycle. Limpets are
aquatic snails with conical shells. Their body size and dimensions exhibit variation and are influenced by
environmental factors. Limpets could thus potentially be used as sensitive indicators of temperature and salinity
change (Hobday 1995). We conduct surveys at six sites distributed around Stanley Park (Figure 12).
For the thresholds of each measure, we established that changes less than 25% from the baseline will indicate a
stable community structure while changes greater than 50% would signal significant change (ERM 2018).
Results
In 2019, the average relative abundance at the surveyed sites was 33% coverage for algae and 14% for sessile
invertebrates. The average number of species per quadrats (richness) was 2.3 for algae and 1.5 for sessile
invertebrates. The average limpet length was 7.0 mm. We will use these numbers as baselines and the status and
trend for each measure will be assessed in future reports.

Stanley Park Ecology Society, SOPEI 2020 28
Terrestrial Ecosystems
Forest of Stanley Park. Photo: Michael Schmidt, 2011
Background
Approximately one third of the earth’s land is covered in forest and these terrestrial ecosystems contain over 80%
of terrestrial biodiversity (Aerts and Honnay 2011). Both the extent and quality of forest habitat continues to
decrease, with primary threats including habitat loss and degradation, climate change, invasive species, and
pollution (Malcolm and Pitelka 2000, Coristine and Kerr 2011). Climate change will affect terrestrial biodiversity
and ecosystems; however, ecosystems are complex and it is difficult to model and predict how they will respond
(Malcolm and Pitelka 2000).
More than half of Stanley Park is comprised of forested habitat, which has been altered over time by natural and
anthropogenic influences (SPES 2010). The forest of Stanley Park is composed of various ecological communities
(site associations), most of them provincially listed as “ecosystems at risk” (VPB 2009a, SPES 2012c). It is important
to understand and safeguard these various vegetation compositions, as they support particular flora and fauna
communities. Several invasive plant species are impacting the integrity of those communities. SPES has developed
a mapping program and management plan for invasive plants in Stanley Park to assess the impacts of invasive
species, guide stewardship actions, and monitor the success of those actions (SPES 2013).
Climate change is expected to affect terrestrial ecosystems of Stanley Park, largely through warming temperatures
and decreasing summer precipitation. This is expected to result in reducing air and soil moisture, increasing
erosion, declining tree growth and increasing tree mortality, promoting the spread of invasive species, and

Stanley Park Ecology Society, SOPEI 2020 29
increasing risk, frequency, and severity of human-caused fires (BC MOE 2016b). In the late 2010s, Park goers and
Park staff started noticing a greater number of declining Western redcedars, which could be related to drier
summers and increase in air temperature. To create a baseline of information, a preliminary study was conducted
by Diamond Head Consulting Ltd on declining Western redcedars in Stanley Park (Diamond Head Consulting Ltd
2020).
To provide a snapshot of the Terrestrial Ecosystems condition, SPES established five measures: tree cover, a bird
community index (BCI), Bald Eagle productivity, huckleberry productivity, and soil decay rate (Figure 13).
Summary
The Terrestrial Ecosystems indicator has been rated as good based on tree cover, the BCI, and Bald Eagle
productivity. To look at total tree cover in Stanley Park, we used LiDAR data from the City of Vancouver, which
indicated an increase of 8 % from 2013 to 2018. The current status for tree cover is good and the trend will be
assessed when more data become available. Since 2007, SPES has been surveying breeding birds at 22 forest sites
throughout the Park. This allowed us to develop a bird community index, calculating a score based on the ratio of
specialist and generalist bird species breeding in spring. The current status for breeding birds is considered fair and
the trend to be stable. Several Bald Eagles breed in Stanley Park and their productivity’s current status is
considered good and stable. The huckleberry productivity and soil decay rate measures were implemented in 2019;
therefore, their status and trend will be assessed in subsequent reports.
Although we rated the
Terrestrial Ecosystems indicator
as good, several natural and
anthropogenic stressors
continue to have significant
impacts, such as climate
change, off-trail activities, and
the spread of invasive plants. It
is essential to understand the
impacts of these stressors on
the terrestrial ecosystems in
order to best mitigate them. For
information on ecological
restoration efforts since 2010,
see Section 3 (2010-2019
Ecological Restoration and
Habitat Enhancement) and
Appendix 3 (Implementation
Tracking of 2011’s Stanley Park
Ecological Action Plan (SPEAP
2011)).
Figure 13. Terrestrial Ecosystems data is collected throughout Stanley Park.

Stanley Park Ecology Society, SOPEI 2020 30
Measure: Tree Cover
Status: Good (+1.6 % tree cover per year)
Trend: Not rated
Thresholds
Poor > 1% loss of tree cover per year
Fair ≤ 1% loss of tree cover per year
Good no loss or increase in tree cover
Context
Stanley Park’s forest provides several environmental
and economic benefits, including climate regulation
and valuable ecosystem services. Tree cover loss can
have significant implications for ecosystem
functioning, habitat integrity, climate change
mitigation, and other environmental services (Yale
University and Columbia University 2018). In Stanley
Park, the natural forest has been impacted by
anthropogenic and natural events over time, such as
logging from the 1860s to the 1880s, creation of
roads, widening of those roads, powerful
windstorms, and mown grass areas for recreational
purposes (SPES 2010). Monitoring tree cover allows
tracking changes resulting from forest loss,
reforestation, and afforestation, shedding light on
forest health.
Method
SPES calculated percentage (%) change in tree cover
in Stanley Park between 2013 and 2018 using Light
Detection and Ranging (LiDAR) data, available
through the open data catalogue of the City of
Vancouver (City of Vancouver 2020b). We considered
five metres as the minimum height of tree cover to
ensure that tree saplings and the other types of
vegetation are excluded from the calculation
(Matasci and Coops 2017). The area of the park with
trees above this height was compared between years
to obtain a value for canopy cover. It is, however,
important to note that the 2013 data was collected in
February, while 2018 data was collected in August.
This is not ideal given that foliage increases canopy
cover. Therefore, the percentage increase between
2013 and 2018 is believed to be amplified due to
seasonal timing of the data collection. Also, since this
report is our baseline for this measure, the status
thresholds are provisional and may be revisited in
future reports. For now, we are considering any
positive tree cover change as good.
Results
The total tree cover was 65.0 % of the Park in 2013
and 73.0 % in 2018 (Figure 14). Because tree cover
increased during that period (average of 1.6 % per
year), the current status is considered good. Again,
the results would be more accurate if LiDAR data was
collected in the same month or season each year.
The trend is not rated and will be assessed when
more years of data become available.
Figure 14. Comparison of tree cover in Stanley Park between 2013 and 2018. 1 by 1 m cells where canopy is at least 5 m in height or more is coloured. Blue cells represent tree cover in February 2013, and the green cells represent the gain in tree cover between February 2013 and August 2018 (2018 layer is behind 2013 layer). Gains in canopy cover are present throughout the forest of the Park. Notably, there are major increases in the blowdown areas of the 2006 windstorms where 15,000 trees and shrubs were planted in the two subsequent years to help the forest recover. Tree growth is also visible in other planting sites where invasive plants were removed and native trees and understory plants planted through SPES stewardship events, notably the Brockton Oval edge.

Stanley Park Ecology Society, SOPEI 2020 31
Measure: Bird Community Index
Status: Fair (score of 2.6)
Trend: Stable
Thresholds
Bird Community Index (BCI) Score
Poor Fair Good
> 4.0 2.0 – 4.0 < 2.0
Context
Some bird species survive better than others in
changing environments. Generalist species thrive in a
wide range of environmental conditions, while
specialist species require specific conditions to thrive.
Bird communities provide an indication of
environmental change because they respond to
increasing development in predictable patterns, with
specialist species becoming less common and
generalist species becoming more widespread and
abundant (Goodwin and Shriver 2014).
Method
SPES developed a bird community index (BCI), which
uses the health and diversity of Stanley Park’s bird
community as an indicator of forest ecosystem
health. Higher BCI scores (represented by lower
numbers) describe a community where specialists
are well-represented relative to generalists,
indicating higher ecological integrity. We developed
the BCI for Stanley Park based on O’Connell et al.’s
study (1998). We have conducted breeding bird point
count surveys intermittently since 2007, between
May and July, at eight to 22 forest habitat stations
throughout the Park.
Results
Since 2007, the annual scores have ranged between
1.9 (good) and 3.3 (fair), with the majority of annual
BCI scores ranking as fair (Figure 15). Comparing the
BCI from surveys conducted from 2007-2009 to 2010-
2019, the trend in the breeding bird community is
stable. The stations that had the highest BCI score
(represented by lower numbers) were in coniferous-
dominated forest (VPB 2009a), closer to the centre of
the Park (Figure 16).
Figure 15. Bird community index (BCI) Score per year. The green, yellow, and red areas represent the good (< 2.0), fair (2.0 - 4.0), and poor (> 4.0) thresholds respectively.
Figure 16. Map of the 22 breeding bird point count stations ranked by their 2007-2019 average BCI score. “1.0” is the station with the highest score, and “3.1” the lowest. The green circles indicate the stations with a good BCI, and in yellow, a fair BCI score. No stations were scored poor.
Bewick's Wrens are a specialist species: they require a tree cavity for nesting and are insectivores. Photo: Mark White, 2012
1
1.5
2
2.5
3
3.5
4
4.5
5
20
07
20
08
20
09
20
10
20
11
20
12
20
13
20
14
20
15
20
16
20
17
20
18
20
19
Bir
d c
om
mu
nit
y in
dex
ran
k
Year

Stanley Park Ecology Society, SOPEI 2020 32
Measure: Bald Eagle Productivity
Status: Good (1.00 fledgling per active nest per year)
Trend: Stable
Thresholds
Annual average number of fledglings per
active nest per year
Poor Fair Good
< 0.48 0.48 – 0.70 < ≥ 0.70
Context
Bald Eagle (Haliaeetus leucocephalus) populations
across North America went through declines in the
last century due to several factors, including loss of
habitat, DDT poisoning, rodenticides, and human
disturbance. They have successfully recovered due to
conservation actions targeting their protection (U.S.
Fish and Wildlife Service, Interior 2007), but they
continue to be susceptible to many of these
stressors. Monitoring productivity of Bald Eagles
provides information on the sustainability of a
population and may indicate if habitat requirements
for breeding and feeding are adequate for this top
predator. Here we use Bald Eagle productivity as a
measure for Terrestrial Ecosystems, but as fish-eating
birds, they can also shed light on the aquatic
ecosystems.
Methods
From January through August, SPES monitors Bald
Eagle nests in Stanley Park to identify the number of
active nests and number of fledglings produced every
year. We established thresholds based on the
previous assessment period (2004-2009) and on what
is considered a sustainable Bald Eagle population
(average of 0.7 fledglings per nest) (Sprunt et al.
1973).
Results
From 2004 to 2019, three to five pairs of Bald Eagles
were breeding in the Park every year, and in 15 years
produced over 50 fledglings. On average, 0.64
fledglings per active nest were produced per year
from 2004 to 2009, and 1.00 from 2010 to 2019
(Figure 17). The Bald Eagle population of the Park is
considered sustainable and the status for this
measure is good. No trend was detected, so it is
considered stable.
Figure 17. Bald Eagle productivity in Stanley Park from 2004 to 2019. Bald Eagle populations are considered sustainable if the average number of fledglings per active nest per year is at least 0.7 (Sprunt et al. 1973). On average 0.64 fledglings per active nest were produced per year between 2004 and 2009, and 1.00 between 2010 and 2019. The green, yellow, and red areas represent the good (≥ 0.70), fair (0.48 – 0.70 <), and poor (< 0.48) thresholds, respectively.
Two Bald Eagle eaglets being raised in a tall Douglas fir near the Malkin Bowl. Photo: Michael Schmidt, 2015
0
0.5
1
1.5
2
20
04
20
06
20
08
20
10
20
12
20
14
20
16
20
18
Nu
mb
er o
f fl
edgl
ings
per
acr
ive
nes
t
Year

Stanley Park Ecology Society, SOPEI 2020 33
Measure: Huckleberry Productivity
Status: Not rated
Trend: Not rated
Thresholds
Average annual berry weight (g)
Poor Fair Good
< 0.08 ≥ 0.08 – 0.10 < ≥ 0.10
Context
Changes in berry production are correlated with
variations in climate, particularly temperature
(Holden et al. 2012). Berry monitoring can be an
indicator of changes in local climate that might affect
local forest productivity.
Method
A red huckleberry survey was derived from methods
developed by BC Parks to infer ecosystem
productivity through soapberry survey (Spencer
2017, BC Parks n.d.). The study consists of selecting
ten robust red huckleberry plants that will be
surveyed yearly in June and July. Each year two stems
per selected plant are chosen, on which we count
and weigh ripe berries, to measure the annual berry
weight average. We selected preliminary thresholds
based on a first year of data collected.
Results
SPES commenced surveys in 2019, in which the
average berry weight was 0.11 g (n=142). Because
this was the first year of data collection for the Park,
the thresholds were established from that baseline
data, using it as the reference. Therefore, the current
status and trend are not rated and will be evaluated
after 5 years of data collection.
Huckleberries are counted and weighted to measure annual productivity. Photo: Brian Grover, 2011

Stanley Park Ecology Society, SOPEI 2020 34
Measure: Soil Decay Rate
Status: Not rated
Trend: Not rated
Thresholds
Average mass loss of wood sticks
buried for one year (%)
Poor Fair Good
> 24% 20 – 24% < 20%
Context
Rates of decay are influenced by many factors
including climate, temperature, moisture, substrate
type, nutrient concentrations and availability, litter
type and size, and soil organisms (Environment
Canada 2004). Changes in decay rates and soil
processes are associated with climate change effects.
An increase in temperature can increase the rate of
decomposition, which would then cause an
accelerated release of carbon into the atmosphere.
Tracking decomposition in soils over a long period of
time will provide information about the impacts of
climate change on soil health and productivity
(Environment Canada 2004).
Method
SPES follows the federal decay rate protocols
developed by the Ecological Monitoring and
Assessment Network (EMAN) (Environment Canada
2004). This SPES survey consists of burying wooden
sticks (chopsticks and dowel sticks) under the soil
surface at selected locations throughout the Park and
retrieving them one year later, dry them, and
measure their weight loss. We selected preliminary
thresholds based on a first year of data collected.
Results
Wood sticks were buried at two sites in October 2018
and retrieved in October 2019 to be weighed. On
average, 16% of the original sticks’ mass decayed
(n=16). This survey was expanded to include five
additional forested sites in 2019. Because this is the
first round of data collection for this survey and the
thresholds are based on this data, the current status
and trend for this measure are not rated and will be
determined in future reports.
SPES volunteer buries wood sticks to be retrieved and weighed a year later. Photo: Ariane Comeau, 2018

Stanley Park Ecology Society, SOPEI 2020 35
2. Recommendations for Future Research Directions
SPES recommends future research projects to uncover gaps in ecological information and to measure stressors of
Stanley Park’s ecosystems. The ecological integrity assessment in Section 1 is a snapshot of what is happening
among the ecosystems of Stanley Park; therefore, these recommendations aim to refine our understanding of the
ecological conditions in the Park. In addition to this list, many recommendations listed in SOPEI 2010 are still
applicable (SPES 2010). The ability to pursue these recommendations will be contingent on resources. Overall,
continuing to collaborate with other groups makes these projects possible.
Improving accuracy and continuity of data collection
Additional methods for continuous data collection would benefit long term
monitoring for Stanley Park. Currently, for our air quality analysis, we use
data collected at the closest air quality station, which is at the Robson
Square in downtown Vancouver. Air quality at this urban location is not an
accurate representation of the conditions of the more natural and forested
Park, where air quality is expected to be better. If resources permit, it would
be valuable to install stations recording air quality, pollutants, weather,
noise, and light pollution in the Park, especially near the Stanley Park
Causeway where disturbance is higher.
For water quality and water temperature, SPES staff and volunteers are collecting data once every other week
during summer months in Beaver Lake and Lost Lagoon. Complementing the effort by installing water quality and
water level data loggers would provide a more continuous and intensive sampling for parameters of interest,
including measuring hourly changes. Additionally, monitoring more water quality parameters would enable us to
use the Canadian Council of Ministers of the Environment Water Quality Index (CCME WQI) and provide a more
robust water quality measure. Again, this would be dependent on resource availability.
We are currently using LiDAR data collected by the City of Vancouver to analyse tree cover in the Park. Since the
data in 2013 and 2018 were not collected in the same season, the true annual change in tree cover may not be
accurately represented here. If the City collects LiDAR data on the same month every time, this will prevent
seasonal changes and provide a more accurate analysis.
Continuing to host citizen science projects to identify species
There is a great interest from the community to get involved in citizen science. Since 2011, SPES has hosted a
handful of Bioblitzes, during which experts and the public came together to identify as many species as possible.
SPES has been using the iNaturalist website and App as a platform to host the identification of species and counts.
These events are very educational and help us keep the Stanley Park life list (Appendix 4) updated and identify
which taxa would benefit from focussed research. For example, insects and other arthropods are very
numerous, but under identified. In July 2019, SPES partnered with the Entomological Society of British
Columbia to identify as many insects as possible. Knowing what native and exotic species are present in
the Park helps inform park management, like SPES’s Best Management Practices for Species of Special
Significance and the Invasive Plant Management Plan (SPES 2012c, 2013).
The Stanley Park species life list will be online to allow for more interactivity and
accessibility for all citizens (public, students, researchers), and currency of information.

Stanley Park Ecology Society, SOPEI 2020 36
People will be able to see what species have not been seen recently, but still thought to be present in the Park,
especially the species listed as “possible” in the life list (Appendix 4).
Environmental DNA (eDNA) is still an expensive method to identify aquatic or semiaquatic species, but it is gaining
in popularity. This is a powerful tool to detect the presence of rare species or migrating birds living in water.
Some currently undetected species at risk or amphibians could be detected by eDNA studies. This type of study in
Stanley Park may be possible through larger research done by universities or governmental groups.
We use amphibian richness as a measure for the freshwater indicator, but we do not necessarily know if the
population of each species is truly healthy. For example, there was one incidental sighting of rough-skinned newt in
January 2020. More extensive research on the abundance of amphibian and reptiles should be done and could be
a student project.
Measuring success of restoration efforts
One of the main stewardship efforts of SPES is to remove invasive plants to
restore the natural habitat of the Park and for native plants to thrive again. To
be able to quantify the success of the restored sites, we started to measure
regrowth of invasive plants in previous work, resiliency of native plants,
survival rate of planted species, and bird richness and abundance before and
after restoring a site. SPES and volunteers continue to map invasive plants in
Stanley Park on the edges of the trails. Measuring percentage cover of invasive
species and their ecological effect within the Park permits SPES to identify areas of
the Park to prioritise for restoration efforts, and to measure the success of restoration
efforts (manual removal, native species planting, chemical control of giant hogweed and Japanese knotweed) (SPES
2013). Additionally, the VPB is working with the Musqueam, Squamish, and Tsleil-Waututh First Nations to create
an invasive plant management plan for all of Vancouver Parks.
To mitigate forest fragmentation, one of the proposed actions in SPEAP 2011 is for the VPB to obstruct unofficial
trails with fallen trees in conjunction with forest thinning and maintenance (VPB 2011). It would be valuable to
measure the effectiveness of the obstructions of unofficial trails, as well as the effectiveness of replanting
encampment sites.
Examining water flow and the importance of streams
Since 2015, most of municipal water input into the Park’s watershed was shut down (Alan Duncan, personal comm.
2020). A study should be conducted, potentially by university students, to determine how eliminating municipal
water input affects the watershed and its aquatic inhabitants. With summers becoming drier, this may become an
increasing concern for water levels in the lakes and creeks.
Another valuable study would be on the water flow through the
culverts of the Park’s watershed. Many of the culverts throughout
the park are undersized and are thought to be challenging for vertebrates
desiring to cross them. A few culverts were widened at Cathedral Trail and it would be valuable to study how water
flow changes through the seasons and examine how corridors are used by vertebrates. This would identify which
culverts are not facilitating adequate water flow and thus which to prioritize for widening.

Stanley Park Ecology Society, SOPEI 2020 37
Developing research for intertidal ecosystems
Our evaluation of the Intertidal Ecosystems indicator (Section 1) is currently based on three measures. Developing
an additional measure for intertidal ecosystems would strengthen the evaluation. We started collaborating with
BCIT to survey mussel abundance and size and we plan to use this survey has an
additional measure. Partnering with local organizations that also focus
on intertidal and ocean research would be a great option.
Sea level rise is expected to significantly affect the coastal habitats of
the Park in the next decades (NHC 2014). While our Intertidal
Ecosystems measures are expected to indirectly represent the impact
of climate change and sea level rise, measuring long-term coastal squeeze
over time should be examined. Remote sensing data might be useful to quantify
the change in the total area of the intertidal zones.
Complementing ecological science with Traditional Ecological Knowledge (TEK)
In this report, we evaluate the ecological integrity of the Park based on metrics from a Western science
perspective. This is an incredibly young study of Stanley Park compared to the long history of Indigenous
knowledge of the land held by the Musqueam, Squamish, and Tsleil-Waututh Nations. SPES would
benefit from an increase in Indigenous relationship building. Future iterations of this report will
strive to build knowledge based on the complementarity of Traditional Ecological Knowledge
(TEK) and Western science in order to understand past ecological integrity and how
ecosystems are changing today.
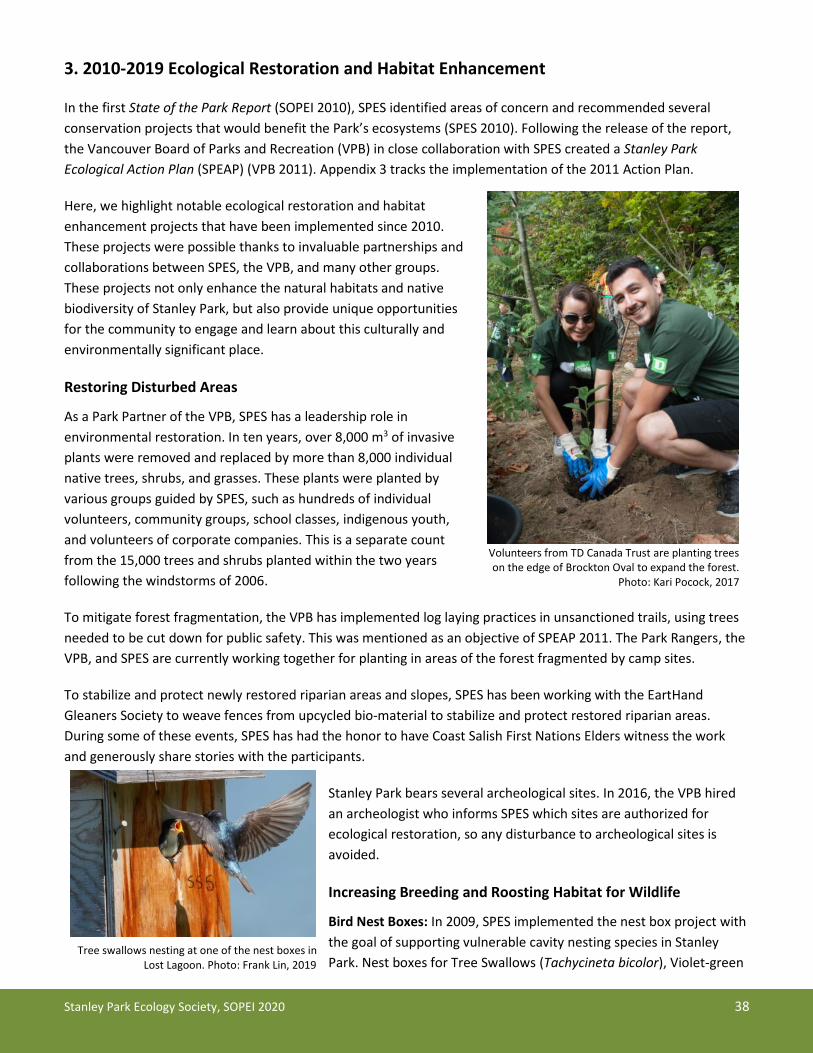
Stanley Park Ecology Society, SOPEI 2020 38
3. 2010-2019 Ecological Restoration and Habitat Enhancement
In the first State of the Park Report (SOPEI 2010), SPES identified areas of concern and recommended several
conservation projects that would benefit the Park’s ecosystems (SPES 2010). Following the release of the report,
the Vancouver Board of Parks and Recreation (VPB) in close collaboration with SPES created a Stanley Park
Ecological Action Plan (SPEAP) (VPB 2011). Appendix 3 tracks the implementation of the 2011 Action Plan.
Here, we highlight notable ecological restoration and habitat
enhancement projects that have been implemented since 2010.
These projects were possible thanks to invaluable partnerships and
collaborations between SPES, the VPB, and many other groups.
These projects not only enhance the natural habitats and native
biodiversity of Stanley Park, but also provide unique opportunities
for the community to engage and learn about this culturally and
environmentally significant place.
Restoring Disturbed Areas
As a Park Partner of the VPB, SPES has a leadership role in
environmental restoration. In ten years, over 8,000 m3 of invasive
plants were removed and replaced by more than 8,000 individual
native trees, shrubs, and grasses. These plants were planted by
various groups guided by SPES, such as hundreds of individual
volunteers, community groups, school classes, indigenous youth,
and volunteers of corporate companies. This is a separate count
from the 15,000 trees and shrubs planted within the two years
following the windstorms of 2006.
To mitigate forest fragmentation, the VPB has implemented log laying practices in unsanctioned trails, using trees
needed to be cut down for public safety. This was mentioned as an objective of SPEAP 2011. The Park Rangers, the
VPB, and SPES are currently working together for planting in areas of the forest fragmented by camp sites.
To stabilize and protect newly restored riparian areas and slopes, SPES has been working with the EartHand
Gleaners Society to weave fences from upcycled bio-material to stabilize and protect restored riparian areas.
During some of these events, SPES has had the honor to have Coast Salish First Nations Elders witness the work
and generously share stories with the participants.
Stanley Park bears several archeological sites. In 2016, the VPB hired
an archeologist who informs SPES which sites are authorized for
ecological restoration, so any disturbance to archeological sites is
avoided.
Increasing Breeding and Roosting Habitat for Wildlife
Bird Nest Boxes: In 2009, SPES implemented the nest box project with
the goal of supporting vulnerable cavity nesting species in Stanley
Park. Nest boxes for Tree Swallows (Tachycineta bicolor), Violet-green Tree swallows nesting at one of the nest boxes in
Lost Lagoon. Photo: Frank Lin, 2019
Volunteers from TD Canada Trust are planting trees on the edge of Brockton Oval to expand the forest.
Photo: Kari Pocock, 2017

Stanley Park Ecology Society, SOPEI 2020 39
Swallows (Tachycineta thalassina), and Wood Ducks (Aix sponsa) are installed in
Lost Lagoon and Beaver Lake. In the past, some swallow nest boxes were installed
on the Nature House wall, but these boxes were used by the invasive House
Sparrows. Installing these nest boxes only over the water reduce competition
between swallows and other bird species and provide protection from land
predators such as raccoons and squirrels. These birds are adapted to nesting and
take off over water. Currently, 15 swallow nest boxes and six Wood Duck nest
boxes are installed at Lost Lagoon and Beaver Lake every spring. SPES volunteers,
members, and donors have contributed to the construction, installation, cleaning,
and monitoring of the boxes. These nest boxes provide ongoing environmental
education and receive the attention of thousands of visitors, including local media.
Bat Boxes: Stanley Park is home to at least six species of bats, including the
federally endangered little brown myotis (Myotis lucifugus). It is key to the bats’
survival to have access to a variety of roosts, so the right temperatures are
available throughout the seasons. Installing bat boxes in various locations, some in
the sun and some the shade, can provide the right temperature for bats on a given
day or night (Lausen 2020). In 2019, SPES installed 12 new bat boxes by South Creek Trail and Ravine Trail, in
addition to the other existing boxes on buildings and on trees of the forest. These bat boxes were provided by the
VPB, the BC Community Bats Program (BCCBP), South Coast Bats (SCBats) and SPES donors, and some were built
during community events with SPES. Every year, SPES, SCBats and the BCCBP monitor maternity roost of bats at
the Stanley Park Pavilion, the Vancouver Rowing Club, and other potential roosts in the Park. Through emergence
count surveys, in 2019, we counted 547 bats at the Stanley Park Pavilion, the
highest number of bats counted since surveying started in 2010.
Mason Bees Condos: In recent years, there has been a rapid decline in native bee
populations across North America, mainly due to habitat loss, fragmentation, and
degradation of habitat, along with pesticide use (Potts et al. 2010). Every year, SPES
installs and manages three manmade condos in Stanley Park for the blue orchard
mason bee (Osmia lignaria), a remarkably effective pollinator, native to the region.
The current bee condos are at the Stanley Park Pavilion, at Lost Lagoon near the
Nature House, and at
the Stanley Park Community Garden. The condos
consist of wooden and plastic tunnels for the solitary
bee to lay eggs in. The tunnels and bee cocoons are
cleaned from parasites every fall, stored for the
winter, and put back in early spring.
Lost Lagoon Islands and Logs: Eight islands around
Lost Lagoon provide sheltered habitat for ducks and
waterfowls. Invasive plant species, mostly bamboo,
took over most of these islands. To provide better
sheltered habitat for migrating and resident ducks
and waterfowl, SPES worked with students, HSBC, and
community volunteers to enhance three of those
A male mason bee emerged from its cocoon at the Air Bee n Bee near the Nature House. Photo:
Ariane Comeau, 2019
Small islands in Lost Lagoon provide shelter for ducks and waterfowls. Photo: Brian Titaro, 2013
Twelve bat boxes were installed in 2019 near Beaver Lake. Photo:
Ariane Comeau, 2019

Stanley Park Ecology Society, SOPEI 2020 40
islands, by removing invasive plants, reorganizing rock alignment, adding liners, planting native species and adding
perching logs.
Restoring Sensitive Ecosystems
Ceperley Meadow: Ceperley Meadow, located to the
northwest side of Lost Lagoon, used to be a mowed
grass area for people to use. Recently, SPES, the VPB,
and sponsors such as HSBC partnered to re-establish
the space as a wet meadow, a rare ecosystem
remaining in Vancouver. Reducing mowing activity at
the area permits the meadow to expand its habitat
capacity. Grasses such as rushes and sedges were
planted and are thriving in this water-saturated soil.
Beavers, river otters, owls, hummingbirds, ducks, and
many other species are often observed in this
important wetland. The regular flooding events of
Ceperley Creek is better retained with the restored
meadow.
Beaver Lake Bog: The south side of Beaver Lake has
boggy areas with sphagnum. Since 2011, SPES, with
the support of the Camosun Bog Restoration Group,
has been safeguarding 500 m2 of the Beaver Lake bog area, where sphagnum, round-leaved sundew, bog laurel,
Labrador tea and bog cranberry are thriving (SPES 2012b). To protect the bog, encroaching non-bog plants were
removed and bog plants were transplanted into damaged areas to restore the bog’s historic diversity and size.
Liners were installed underground to minimize non-bog species
encroachment over the bog, one on the edge of the forest and one
along the water side. The VPB is working with consultants and SPES
to design and install a boardwalk around the restored bog for
visitors to experience this secretive yet astounding environment.
Beaver Creek: Beaver Creek is the main outflow of Beaver Lake and
has been impacted in various ways. To stabilize the steep and
heavily eroded bank near Beaver Lake, the VPB installed a large
fence. Further down Beaver Creek, also to stabilize the shore, SPES
planted native plants such as salmonberry. This provides better
habitat, especially for the Coho salmon that are released every
spring by elementary classes through the DFO Salmonids in the
Classroom program (DFO 2017). For information on the beaver
baffler installed between Beaver Lake and Beaver Creek, see the
section below on Co-existing with Wildlife.
Cathedral Trail’s Boardwalk: In 2013, SPES assisted the VPB to
install the first boardwalk in Stanley Park at Cathedral Trail, to
reconnect a divided wetland, thus improving drainage, wildlife
The Beaver Lake bog is home to plants such as round-leaved sundew, bog cranberry, bog laurel, Labrador tea, and various species of
sphagnum. Photo: Brian Titaro, 2015
The first boardwalk in Stanley Park was installed at Cathedral Trail to reconnect a divided wetland. Photo:
Patricia Thomson, 2013
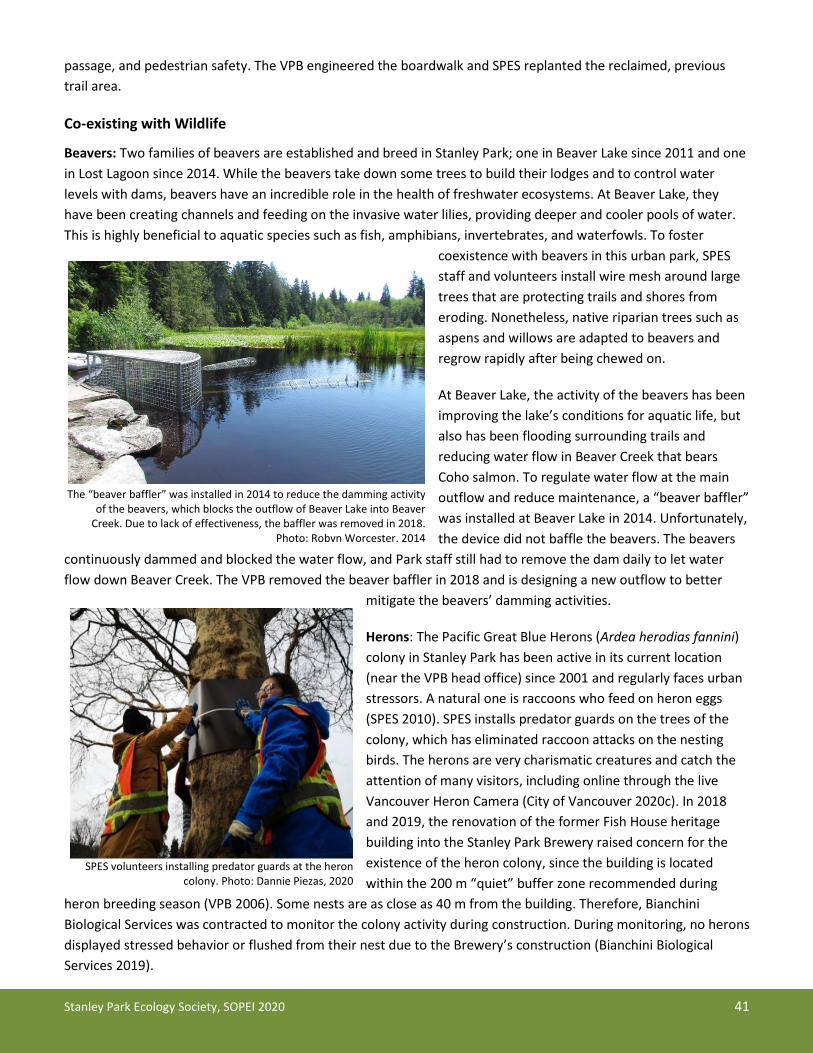
Stanley Park Ecology Society, SOPEI 2020 41
passage, and pedestrian safety. The VPB engineered the boardwalk and SPES replanted the reclaimed, previous
trail area.
Co-existing with Wildlife
Beavers: Two families of beavers are established and breed in Stanley Park; one in Beaver Lake since 2011 and one
in Lost Lagoon since 2014. While the beavers take down some trees to build their lodges and to control water
levels with dams, beavers have an incredible role in the health of freshwater ecosystems. At Beaver Lake, they
have been creating channels and feeding on the invasive water lilies, providing deeper and cooler pools of water.
This is highly beneficial to aquatic species such as fish, amphibians, invertebrates, and waterfowls. To foster
coexistence with beavers in this urban park, SPES
staff and volunteers install wire mesh around large
trees that are protecting trails and shores from
eroding. Nonetheless, native riparian trees such as
aspens and willows are adapted to beavers and
regrow rapidly after being chewed on.
At Beaver Lake, the activity of the beavers has been
improving the lake’s conditions for aquatic life, but
also has been flooding surrounding trails and
reducing water flow in Beaver Creek that bears
Coho salmon. To regulate water flow at the main
outflow and reduce maintenance, a “beaver baffler”
was installed at Beaver Lake in 2014. Unfortunately,
the device did not baffle the beavers. The beavers
continuously dammed and blocked the water flow, and Park staff still had to remove the dam daily to let water
flow down Beaver Creek. The VPB removed the beaver baffler in 2018 and is designing a new outflow to better
mitigate the beavers’ damming activities.
Herons: The Pacific Great Blue Herons (Ardea herodias fannini)
colony in Stanley Park has been active in its current location
(near the VPB head office) since 2001 and regularly faces urban
stressors. A natural one is raccoons who feed on heron eggs
(SPES 2010). SPES installs predator guards on the trees of the
colony, which has eliminated raccoon attacks on the nesting
birds. The herons are very charismatic creatures and catch the
attention of many visitors, including online through the live
Vancouver Heron Camera (City of Vancouver 2020c). In 2018
and 2019, the renovation of the former Fish House heritage
building into the Stanley Park Brewery raised concern for the
existence of the heron colony, since the building is located
within the 200 m “quiet” buffer zone recommended during
heron breeding season (VPB 2006). Some nests are as close as 40 m from the building. Therefore, Bianchini
Biological Services was contracted to monitor the colony activity during construction. During monitoring, no herons
displayed stressed behavior or flushed from their nest due to the Brewery’s construction (Bianchini Biological
Services 2019).
SPES volunteers installing predator guards at the heron colony. Photo: Dannie Piezas, 2020
The “beaver baffler” was installed in 2014 to reduce the damming activity of the beavers, which blocks the outflow of Beaver Lake into Beaver
Creek. Due to lack of effectiveness, the baffler was removed in 2018. Photo: Robyn Worcester, 2014

Stanley Park Ecology Society, SOPEI 2020 42
Other notable events and documents from 2010 to 2019
2010 State of the Park Report for the Ecological Integrity of Stanley Park (SPES 2010)
2010 Smoking banned in Vancouver city parks (VPB 2010)
2011 Stanley Park Ecological Action Plan (VPB 2011)
2012 Best Management Practices for Species of Significance in Stanley Park (SPES 2012c)
2012 Beaver Lake Bog Restoration Report (SPES 2012b)
2012 Stanley Park Cycling Plan (VPB 2012)
2013 Stanley Park Invasive Plant Management Plan (SPES 2013)
2014 Ecologically and Culturally Sensitive Enhancement Plan for Beaver Lake (VPB and AquaTerra Environmental
Ltd. 2014)
Mid 2010s Recreational drones emerge on the scene creating disturbances to wildlife
Mid 2010s Increase in marine mammal sightings around Stanley Park
2015 Vancouver Bird Strategy (VBAC 2015)
2015 Summer droughts cause cut offs for potable water to freshwater bodies
2015 Marathassa Oil Spill (Canadian Coast Guard 2015)
2015 Widening of the causeway sidewalks (VPB 2015)
2016 Biodiversity Strategy (VPB 2016)
2016 Canada’s First municipal archeologist, Geordie Howe, hired by the VPB on the recommendation of the
Musqueam, Squamish, and Tsleil-Waututh Nations
2016 Lost Lagoon Fountain is no longer functional
2017 Bird anti-collision window stickers installed at Park Board office (VPB 2017)
2018 A Restoration Strategy for Lost Lagoon in Stanley Park, Vancouver, British Columbia (MacKinnon 2018)
2018 Urban Forest Strategy 2018 Update (City of Vancouver and VPB 2018)
2018-2019 Major reparations to the seawall (City of Vancouver 2020d)
2019 Design of the Metro Vancouver’s Stanley Park Water Supply Tunnel project (Metro Vancouver 2020)
In the last five years, there has been an increase in marine mammal sightings in the waters surrounding Stanley Park, including orcas, humpback whales, and porpoises. Photo: James Marks, 2015

Stanley Park Ecology Society, SOPEI 2020 43
References
Abromovitz, J. N. 1996. Imperiled Waters,
Impoverished Future: The Decline of Freshwater
Ecosystems.
Aerts, R., and O. Honnay. 2011. Forest Restoration,
Biodiversity and Ecosystem Functioning. BMC
Ecology 11.
Ausenco Sandwell. 2011. Climate Change Adaptation
Guidelines for Sea Dikes and Coastal Flood Hazard
Land Use: Guidelines for Management of Coastal
Flood Hazard Land Use. Prepared for BC Ministry of
Environment, Vancouver, BC.
BC MOE. 2016a. British Columbia Ambient Air Quality
Objectives. B.C. Ministry of Environment (MOE),
Victoria, BC.
BC MOE. 2016b. Indicators of Climate Change for
British Columbia, 2016 Update. B.C. Ministry of
Environment (MOE), Victoria, BC.
BC MOE. 2020. BC Air Data Archive.
https://envistaweb.env.gov.bc.ca/.
BC Parks. (n.d.). Soapberry Production Counts. British
Columbia.
Benetti, C. J., A. Perez-Bilbao, and J. Garrido. 2012.
Macroinvertebrates as Indicators of Water Quality
in Running Waters: 10 Years of Research in Rivers
with Different Degrees of Anthropogenic Impacts.
Pages 95–122 Ecological Water Quality - Water
Treatment and Reuse. InTech.
Benitah, A., S. Dixon, B. Ghofraniha, and C. Jollymore.
1998. Capilano College Environmental Science
Program. Beaver Lake Ecological Studies. Capilano
College, Vancouver, BC.
Bianchini Biological Services. 2019. Summary of the
Initial 2019 Fulltime Monitoring Session of the
Stanley Park Great Blue Heron Colony (Feb 28 - Mar
19, 2019) - DRAFT. Internal Document. Bianchini
Biological Services, Delta, BC.
Canadian Coast Guard. 2015. Independent Review of
the M/V Marathassa Fuel Oil Spill Environmental
Response Operation. Vancouver, BC.
Canning, A. 2017, April. Walled Off Re-Imagining the
Stanley Park Coastline. University of British
Columbia, Vancouver, BC.
CCME. 2017a. CCME’s 2017 State of the Air Report.
Canadian Council of Ministers of the Environment
(CCME), Ontario.
CCME. 2017b. Canadian Council of Ministers of the
Environment (CCME).
https://www.ccme.ca/en/about/index.html.
City of Vancouver. 2018. Vancouver’s Changing
Shoreline Preparing for Sea Level Rise. Vancouver,
BC.
City of Vancouver. 2019. Climate Emergency
Response. City of Vancouver, Vancouver, BC.
City of Vancouver. 2020a. Enhancing Beaver Lake.
https://vancouver.ca/parks-recreation-
culture/beaver-lake-restoration.aspx.
City of Vancouver. 2020b. Open data.
https://vancouver.ca/your-government/open-data-
catalogue.aspx.
City of Vancouver. 2020c. Watch the Pacific Great
Blue Herons live from Stanley Park.
https://vancouver.ca/parks-recreation-
culture/heron-cam.aspx.
City of Vancouver. 2020d. Stanley Park Seawall
restoration. https://vancouver.ca/parks-recreation-
culture/stanley-park-seawall-restoration.aspx.
City of Vancouver, and VPB. 2018. Urban Forest
Strategy 2018 Update. Vancouver, BC.
Clark, M. S., U. Sommer, J. K. Sihra, M. A. S. Thorne, S.
A. Morley, M. King, M. R. Viant, and L. S. Peck.

Stanley Park Ecology Society, SOPEI 2020 44
2016. Biodiversity in Marine Invertebrate
Responses to Acute Warming Revealed by a
Comparative Multi-omics Approach. Global Change
Biology 23:318–330.
Coristine, L. E., and J. T. Kerr. 2011. Habitat Loss,
Climate Change, and Emerging Conservation
Challenges in Canada. Canadian Journal of Zoology
89:435–451.
COSEWIC. 2002. COSEWIC Assessment and Status
Report on the Red-legged frog Rana aurora.
Committee on the Status of Endangered Wildlife in
Canada (COSEWIC), Ottawa.
Cox, K. D., H. Davies L., K. Davidson H., T. G. Gerwing,
S. E. Dubas, and F. Juanes. 2019. Shellfish subsidies
along the Pacific coast of North America. Ecography
43:668–681.
DFO. 1995. The Streamkeepers Handbook: a Practical
Guide to Stream and Wetland Care. Salmonid
Enhancement Program, Department of Fisheries
and Oceans (DFO), Vancouver, BC.
DFO. 2017. Lesson Plan - Salmonids in the classroom -
Primary. https://www.pac.dfo-
mpo.gc.ca/education/lessonplans-
lecons/sicprimary-secprimaire-eng.html.
Diamond Head Consulting Ltd. 2020. Detection of
dead and declining Western Redcedar (Thuja
plicata) in Stanley Park. Summary Report. Diamond
Head Consulting Ltd, Vancouver, BC.
Doney, S. C., M. Ruckelshaus, J. E. Duffy, J. P. Barry, F.
Chan, C. A. English, H. M. Galindo, J. M. Grebmeier,
A. B. Hollowed, N. Knowlton, J. Polovina, N. N.
Rabalais, W. J. Sydeman, and L. D. Talley. 2012.
Climate Change Impacts on Marine Ecosystems.
Annual Review of Marine Science 4:11–37.
Duncan, A. 2020, February 21. Personal
Communication.
ECCC. 2017. Canadian Environmental Sustainability
Indicators: Ecological Integrity of National Parks.
Environment and Climate Change Canada (ECCC),
Gatineau, QC.
ECCC. 2018. Canadian Environmental Sustainability
Indicators: Air Quality. Environment and Climate
Change Canada (ECCC), Gatineau, QC.
El Shoubaky, G. A. 2013. Comparison of the Impacts
of Climate Change and Anthropogenic Disturbances
on the EI Arish Coast and Seaweed Vegetation after
10 Years in 2010, North Sinai, Egypt. Oceanologia
55:663–685.
Environment Canada. 2004. Annual Decay Rates.
Ecological Monitoring and Assessment Network
(EMAN), Canada.
Environment Canada. 2012. Data Sources and
Methods for the Park Ecological Integrity Indicator.
Gatineau, QC.
EPA. 2016. Indicators: Benthic Macroinvertebrates.
https://www.epa.gov/national-aquatic-resource-
surveys/indicators-benthic-macroinvertebrates.
ERM. 2018. Intertidal Survey Methods, Stanley Park.
Environmental Resources Management (ERM),
Vancouver, BC.
Fabry, V. J., B. A. Seibel, R. A. Feely, and J. C. Orr.
2008. Impacts of ocean acidification on marine
fauna and ecosystem processes. ICES Journal of
Marine Science 65:414–432.
Faugeraux, D., and L. Bendell. 2011. Sediment
Characteristics of Beaver Lake and Implications for
Remediation: A Pilot Project. Simon Fraser
University. (unpublished), Vancouver, BC.
Fondriest Environmental Inc. 2016. Fundamentals of
Environmental Measurements.
https://www.fondriest.com/environmental-
measurements/parameters/water-
quality/dissolved-oxygen/#1.
Franklin, P. A. 2013. Dissolved Oxygen Criteria for
Freshwater Fish in New Zealand: A Revised

Stanley Park Ecology Society, SOPEI 2020 45
Approach. New Zealand Journal of Marine and
Freshwater Research.
Goodwin, S. E., and W. G. Shriver. 2014. Using a Bird
Community Index to Evaluate National Parks in the
Urbanized National Capital Region. Urban Ecosyst.
Government of Canada. 2020, March 19. Historical
Data.
http://climate.weather.gc.ca/historical_data/search
_historic_data_e.html.
Griffith, H. 2017. E-Fauna BC: Electronic Atlas of the
Fauna of British Columbia. Lab for Advanced Spatial
Analysis, Department of Geography, University of
British Columbia., Vancouver, BC.
Hatfield Consultants Limited. 1984. Beaver Lake-
Creek Enhancement Study. Prepared for Parks and
Recreation Board of the City of Vancouver and the
Salmonid Enhancement Program of Fisheries and
Oceans Canada., West Vancouver, BC.
Hobday, A. 1995. Body-size variation exhibited by an
intertidal limpet: Influence of wave exposure, tidal
height and migratory behavior. Journal of
Experimental Marine Biology and Ecology 189:29–
45.
Holden, Z., W. Kasworm, C. Servheen, B. Hahn, and S.
Dobrowski. 2012. Sensitivity of Berry Productivity to
Climatic Variation in the Cabinet-Yaak Grizzly Bear
Recovery Zone, Northwest United States, 1989 -
2010. Wildlife Society Bulletin 36:226–231.
IBA Canada. 2020, May 13. IBA Canada Important
Bird Areas. https://www.ibacanada.com.
Jancowski, K., and S. A. Orchard. 2013. Stomach
contents from invasive American bullfrogs Rana
catesbeiana (= Lithobates catesbeianus) on
southern Vancouver Island, British Columbia,
Canada. NeoBiota 16:17–37.
Lausen, C. 2020, March 13. Back to the Basics: Re-
evaluating Bat Boxes based on Bat Needs with Cori
Lausen. Webinar, Kootenay, BC.
LeNoble, J. 2017, June. Genomics tool for monitoring
engineered stormwater treatment wetlands.
University of British Columbia, Vancouver, BC.
Licht, L. E. 1971. Breeding habits and embryonic
thermal requirements of the frogs, Rana aurora
aurora and Rana pretiosa pretiosa, in the Pacific
Northwest. Ecology 52:116–124.
Loiacono, S. 2016. Effects of Substrate Warming on
Sessile Marine Invertebrate Communities in
Monterey Bay, California. Master’s Theses, San Jose
State University, San Jose, CA.
MacKinnon, D. E. 2018. A restoration strategy for
Lost Lagoon in Stanley Park, Vancouver, British
Columbia. Simon Fraser University and British
Columbia Institute of Technology, Burnaby, BC.
Malcolm, J. R., and L. F. Pitelka. 2000. Ecosystems
and Global Climate Change: A Review of Potential
Impacts on U.S. Terrestrial Ecosystems and
Biodiversity. Prepared for Pew Center on Global
Climate Change, Arlington, VA, US.
Masson-Delmotte, V., P. Zhai, H. O. Pörtner, D.
Roberts, J. Skea, P. R. Shukla, A. Pirani, W.
Moufouma-Okia, C. Péan, R. Pidcock, S. Connors, J.
B. R. Matthews, Y. Chen, X. Zhou, M. I. Gomis, E.
Lonnoy, T. Maycock, M. Tignor, and T. (eds. .
Waterfield. 2018. Global warming of 1.5°C. An IPCC
Special Report on the impacts of global warming of
1.5°C above pre-industrial levels and related global
greenhouse gas emission pathways, in the context
of strengthening the global response to the threat
of climate change, sustainable development, and
efforts to eradicate poverty. The Intergovernmental
Panel on Climate Change (IPCC), Geneva,
Switzerland.
Matasci, G., and N. Coops. 2017. An automatic lidar-
based workflow for large tree detection and
characterization in the City of Vancouver.
Integrated Remote Sensing Studio (IRSS), University
of British Columbia, Department of Forest
Resources Management, Vancouver, BC.

Stanley Park Ecology Society, SOPEI 2020 46
McKean, C. J. P., and N. K. Nagpal. 1991. Ambient
Water Quality Criteria for pH. Technical Appendix,
Ministry of Environment, Victoria, BC.
MELP. 1997. Ambient Water Quality Criteria for
Dissolved Oxygen. Ministry of Environment, Lands
and Parks (MELP), Victoria, BC.
MELP. 2001. Towards a Water Quality Guideline for
Temperature in the Province of British Columbia.
Ministry of Environment, Lands and Parks (MELP),
Victoria, BC.
Meredith, H. M. R., C. Van Buren, and R. E. Antwis.
2016. Making Amphibian Conservation More
Effective. Conservation Evidence 13:1–5.
Metro Vancouver. 2016a. Climate Projections for
Metro Vancouver. Burnaby, BC, Burnaby, BC.
Metro Vancouver. 2016b. Metro Vancouver’s
Ambient Air Quality Objectives. Burnaby, BC.
Metro Vancouver. 2020. Stanley Park Water Supply
Tunnel.
http://www.metrovancouver.org/services/water/e
ngagement/construction-projects/Pages/Stanley-
Park-Water-Tunnel.aspx.
Mike Mackintosh. 2020, January 20. Personal
Communication.
Ministry of Environment. 2020. BC Frogwatch Atlas.
http://maps.gov.bc.ca/ess/hm/bcfa/.
MPCA. 2009. Low Dissolved Oxygen in Water. Causes,
Impact on Aquatic Life - An Overview. Minnesota
Pollution Control Agency, St-Paul, MN.
NHC. 2014. City of Vancouver Coastal Flood Risk
Assessment Phase I. Prepared for City of
Vancouver, Vancouver, BC.
NHC. 2015. City of Vancouver Coastal Flood Risk
Assessment Phase II. Vancouver, BC.
Nowak, D. J., S. Hirabayashi, A. Bodine, and E.
Greenfield. 2014. Tree and forest effects on air
quality and human health in the United States.
Environmental pollution 193:119–129.
O’Connell, T. J., L. E. Jackson, and R. P. Brooks. 1998.
A Bird Community Index of Biotic Integrity for the
Mid-Atlantic Highlands. Environmental Monitoring
and Assessment 51:145–156.
Ormerod, S. J., M. Dobson, A. G. Hildrew, and C. R.
Townsend. 2010. Multiple Stressors in Freshwater
Ecosystems. Freshwater Biology 55:1–4.
Pacific Rivers Council. 2007. Freshwater Ecosystems
in Crisis: A Synopsis of Decline. 2007 Pacific Rivers
Council, Eugene, OR.
Parcs Québec. 2014. Ecological Integrity Monitoring
Program. Société des établissements de plein air du
Québec, Québec City, QC.
Parks Canada. 2011. Consolidated Guidelines for
Ecological Integrity Monitoring in Canada’s National
Parks. Protected Areas Establishment and
Conservation Branch, Parks Canada, Gatineau, QC.
Potts, S. G., J. C. Biesmeijer, C. Kremen, P. Neumann,
O. Schweiger, and W. E. Kunin. 2010. Global
pollinator declines: trends, impacts and drivers.
Trends in ecology & evolution 25:345–353.
Province of BC. 2017. Change in Sea Level in B.C.
(1910-2014).
http://www.env.gov.bc.ca/soe/indicators/climate-
change/sea-level.html.
PSMSL. 2019. Permanent Service for Mean Sea Level.
http://www.psmsl.org/data/obtaining/stations/175
.php.
Regan, M. D., I. S. Gill, and J. G. Richards. 2017.
Metabolic depression and the evolution of hypoxia
tolerance in threespine stickleback, Gasterosteus
aculeatus. Biology letters 13:20170392.
Revenga, C., and G. Mock. 2000. Freshwater
Biodiversity in Crisis. Adapted from PAGE:
Freshwater Systems 2000 and World Resources

Stanley Park Ecology Society, SOPEI 2020 47
1998-99., World Resources Institute, Washington,
DC.
RIC. 1998. Inventory Methods for Pond-breeding
Amphibians and Painted Turtle. Version 2.0,
Prepared by Ministry of Environment, Lands and
Parks Resources Inventory Branch for the
Terrestrial Ecosystems Task Force Resources
Inventory Committee (RIC), Victoria, BC.
RIC. 1999. Inventory Methods for Plethodontid
Salamanders. Version 2.0, Prepared by Ministry of
Environment, Lands and Parks Resources Inventory
Branch for the Terrestrial Ecosystems Task Force
Resources Inventory Committee (RIC), Victoria, BC.
Spencer, M. 2017. Forest Understory Monitoring
Protocols for Stanley Park Ecology Society. Final
Project Report, University of Victoria, Victoria, BC.
SPES. 2010. State of the Park Report for the
Ecological Integrity of Stanley Park. Stanley Park
Ecology Society (SPES), Vancouver, BC.
SPES. 2012a. Invasive Plant Mapping in Stanley Park.
Stanley Park Ecology Society (SPES), Vancouver, BC.
SPES. 2012b. Beaver Lake Bog Restoration Report.
Stanley Park Ecology Society (SPES), Vancouver, BC.
SPES. 2012c. Best Management Practices for Species
of Significance in Stanley Park. Page 177 pages.
Stanley Park Ecology Society (SPES), Vancouver, BC.
SPES. 2013. Stanley Park Ecology Society Invasive
Plant Management Plan. Stanley Park Ecology
Society (SPES), Vancouver, BC.
SPES. 2020. Stanley Park Species Life List.
https://stanleyparkecology.shinyapps.io/life_list/.
Sprunt, A. I., W. B. J. Robertson, S. Postupalsky, R. J.
Hensel, C. E. Knoder, and F. J. Ligas. 1973.
Comparative productivity of six bald eagle
populations. Transactions of the North American
Wildlife and Natural Resources Conference 38:96–
106.
The Arlington Group Planning + Architecture Inc.,
EBA, a Tetra Tech Company, DE Jardine Consulting,
and Sustainability Solutions Group. 2013. Sea Level
Rise Adaptation Primer. A Toolkit to Build Adaptive
Capacity on Canada’s South Coasts. Prepared for BC
Ministry of Environment, Vancouver, BC.
UNESCO. 2016. The Interactions between Ocean and
Climate.
U.S. Fish and Wildlife Service, Interior. 2007.
Endangered and Threatened Wildlife and Plants;
Removing the Bald Eagle in the Lower 48 States
From the List of Endangered and Threatened
Wildlife. Federal Register 72:37346–37372.
VBAC. 2015. Vancouver Bird Strategy. Prepared by
Vancouver Bird Advisory Committee (VBAC) for the
City of Vancouver, Vancouver, BC.
VPB. 2006. Stanley Park Heronry Management Plan.
Internal Document. Vancouver Board of Parks and
Recreation (VPB), Vancouver, BC.
VPB. 2009a, March. Stanley Park Atlas, 1st Edition.
Vancouver Board of Parks and Recreation.
VPB. 2009b. Stanley Park Forest Management Plan.
Vancouver Board of Parks and Recreation,
Vancouver, BC.
VPB. 2010. A By-law of the City of Vancouver Board
of Parks and Recreation to regulate sm oking in
parks. Vancouver, BC.
VPB. 2011. Stanley Park Ecological Action Plan. Page
32. Vancouver Board of Parks and Recreation (VPB),
Vancouver, BC.
VPB. 2012. Stanley Park Cycling Plan. Vancouver
Board of Parks and Recreation, Vancouver, BC.
VPB. 2014. Beaver Lake Enhancement Plan: Summary
of Comments Received. Vancouver Board of Parks
and Recreation (VPB), Vancouver, BC.

Stanley Park Ecology Society, SOPEI 2020 48
VPB. 2015. Stanley Park Causeway Safety
Improvements. Vancouver Board of Parks and
Recreation (VPB), Vancouver, BC.
VPB. 2016. Biodiversity Strategy. Vancouver Board of
Parks and Recreation (VPB), Vancouver, BC.
VPB. 2017. Bird Friendly Windows - Corporate
Sponsorship Funding. Vancouver Board of Parks and
Recreation (VPB), Vancouver, BC.
VPB, and AquaTerra Environmental Ltd. 2014.
Ecological and Culturally Sensitive Enhancement
Plan for Beaver Lake. Vancouver Board of Parks and
Recreation, Vancouver, BC.
Wowk, K. M. 2013. Paths to Sustainable Ocean
Resources. Page Managing Ocean Environments in
a Changing Climate. Elsevier, Burlington, MA.
Yale University, and Columbia University. 2018. 2018
Environmental Performance Index (EPI) Report.
New Haven, CT.
Zimmermann, A., C. McIlhagga, C. Jarock, and O.
Rogers. 1999. A Study of the Beaver Creek
Watershed: Historical Sedimentation,
Contemporary Ecology and Hydrology with
Predictive Modeling. University of British Columbia,
Vancouver, BC.

Stanley Park Ecology Society, SOPEI 2020 49
Appendix 1. Survey Schedule
Table 5. Annual survey schedule for measures including year, frequency, and seasonal timing
Measure
20
18
20
19
20
20
20
21
20
22
Frequency Timing
Climate and Atmosphere
Air quality1 ✓ ✓ ✓ ✓ ✓ - -
Air temperature1 ✓ ✓ ✓ ✓ ✓ - -
Precipitation1 ✓ ✓ ✓ ✓ ✓ - -
Sea level1 ✓ ✓ ✓ ✓ ✓ - -
Freshwater Ecosystems
Water temperature ✓ ✓ ✓ ✓ ✓ 2 x / month Jun 01 – Sep 30
Dissolved oxygen ✓ ✓ ✓ ✓ ✓ 2 x / month Jun 01 – Sep 30
pH ✓ ✓ ✓ ✓ ✓ 2 x / month Jun 01 – Sep 30
Stream invertebrate rating
✓ ✓ ✓ ✓ ✓ 2 x / year Spring and Fall
Amphibian richness2 ✓ ✓ ✓ 1 x / month January - December
Intertidal Ecosystems
Marine algae abundance & richness
✓ ✓ ✓ ✓ 1 x / year May - June
Sessile invertebrate abundance & richness
✓ ✓ ✓ ✓ 1 x / year May - June
Limpet size ✓ ✓ ✓ ✓ 1 x / year May - June
Terrestrial Ecosystems
Tree cover1 ✓ Every 5 years -
Bird community index ✓ ✓ ✓ ✓ ✓ 2 x / year April - July
Bald Eagle productivity ✓ ✓ ✓ ✓ ✓ 1 x / week January - August
Huckleberry productivity
✓ ✓ ✓ ✓ 1 x / year June - August
Soil decay rate ✓ ✓ ✓ ✓ 1 x / year October
1 Data available through open data inventories (not collected by SPES)
2 Terrestrial cover board surveys conducted monthly throughout the year, pond-breeding surveys conducted monthly between February and
May, and acoustic surveys conducted monthly between March and July

Stanley Park Ecology Society, SOPEI 2020 50
Appendix 2. Method to Evaluate Status and Trends with Thresholds
SPES developed the ecological integrity assessment for Stanley Park by following the Consolidated Guidelines for
Ecological Integrity Monitoring in Canada’s National Parks (Parks Canada 2011). Below are guidelines to evaluate
the status and trend of each measure and indicator via thresholds.
Status and Trend for Measures
The current status of a measure is scored as good, fair, or poor relative to the threshold values, which correspond
to scores of two points, one point, and zero points, respectively (Environment Canada 2012, ECCC 2017).
If a measure is composed of several field measurements, the current state of each component is evaluated. If one
third or more of the component measures are scored as poor, the measure is also scored as poor. If not, the
overall measure score is determined by the average score of the components as determined by the following
equation:
𝑀𝑒𝑎𝑠𝑢𝑟𝑒 𝑆𝑐𝑜𝑟𝑒 = ∑ 𝐶𝑜𝑚𝑝𝑜𝑛𝑒𝑛𝑡 𝑆𝑐𝑜𝑟𝑒𝑠
𝑁 × 50
where N is the number of components for a particular measure and a score of 0 – 33 is classified as poor, 34 – 66 is
classified as fair, and 67 – 100 is classified as good (Parks Canada 2011). Although alternative weighting schemes
may better reflect the ecological importance of different measures, equal weighting was chosen for simplicity
(Environment Canada 2012).
The trend of a measure is based on a change in the current state from a previous state and are categorized as
improving, stable, or declining (Environment Canada 2012). Trends can be evaluated statistically when sufficient
time-series data is available (e.g., Mann-Kendall test). When there is not enough data available for statistical
analysis, a simpler approach is used (Parks Canada 2011). Specifically, a value of ⅓ of the difference between the
upper and lower threshold values (the critical range) is recommended as the criterion for change in a measure
(Parks Canada 2011).
Status and Trend for Indicators
The current status for an indicator is determined from the status of its component measures (Parks Canada 2011,
Environment Canada 2012). This is calculated using the same formula as described for measures, where each
measure is scored and summed to provide an overall indicator score.
The assessment of the overall trend for an ecosystem indicator is based on a change in its current status from its
previous status (Environment Canada 2012). We will evaluate indicator trends in the following reports when
sufficient data will become available.

Stanley Park Ecology Society, SOPEI 2020 51
Appendix 3. Implementation Tracking of 2011’s Stanley Park Ecological Action Plan
(SPEAP 2011)
The 2011’s Stanley Park Ecological Action Plan (SPEAP 2011) was developed by the Vancouver Board of Parks and
Recreation (VPB) in close collaboration with SPES. It prioritizes proposed actions from SOPEI 2010 and provides a
comprehensive direction for the management of the Park (VPB 2011). Five priority areas were identified for
restoration and enhancement activities:
• Beaver Lake’s rapid infilling
• Lost Lagoon’s water quality
• Invasive plant species
• Fragmentation of habitat
• Species of Significance
Table 6 to Table 10 track the status (Complete, On Track, Ongoing, Not Started, Paused) of the proposed actions in
SPEAP 2011 up to 2019, and identify the project lead (VPB and/or SPES). The areas of SPEAP that were led and
completed by the VPB were reported to SPES by Alan Duncan, VPB Environmental Planner.
Table 6. Status on SPEAP 2011-proposed actions for Beaver Lake’s rapid infilling
Proposed actions for Beaver Lake’s rapid infilling
Status Lead Additional information
1. Undertake a consultancy to
A) conduct assessment of Beaver Lake’s
environment Complete VPB
AquaTerra Environmental Ltd completed
wildlife and vegetation assessments of Beaver
Lake in the spring and summer of 2013. They
created recommendations on how to
enhance Beaver Lake.
B) Develop a public visioning process to
inform the future of the lake
Complete VPB
An open house was held to review and
comment on options developed by the
consultant team. Summary of comments
available here:
https://vancouver.ca/files/cov/beaver-lake-
enhancement-nov-2013-open-house-
comments.pdf
C) Recommend vision and strategy
Complete VPB
The project team reviewed the commentary
and developed a preferred concept that the
Park Board approved in October 2014. The
plan called for dredging the lake, creating
islands for mammal and fish habitat, and
building viewing platforms and a boardwalk
(VPB and AquaTerra Environmental Ltd.
2014).
2. Implementation of the approved plan
Not Started VPB
Reconstructing the outflow areas with beaver
deterring features and fish ladder to begin in
2020. Further works contingent on funding.

Stanley Park Ecology Society, SOPEI 2020 52
Proposed actions for Beaver Lake’s rapid infilling
Status Lead Additional information
3. Update baseline information on the Beaver
Lake bog and monitor changes On Track SPES
SPES produced a baseline information report
and restoration summary (SPES 2012b) and
continues to monitor changes.
4. Install a boardwalk, viewing platform, and
signage at bog Ongoing VPB +
SPES
Postponed due to technical challenges and
effects of beaver activity on the surrounding
forest.
5. Restore bog’s size and habitat value
On Track SPES
SPES continues to manage the bog’s integrity
with support from the Camosun Bog
Restoration Group by removing encroaching
non-bog species.
6. Continue to maintain water levels with
municipal water until alternative sources
found Paused VPB
Most municipal water has been shut down
since 2015 for water conservation and
temporarily turned on in 2016. Alternative
sources are being investigated.
7. Develop strategy for invasive plant species
management during and following lake
restoration
Not Started VPB +
SPES
First phase of lake restoration and associated
interventions must be completed before
implementation.
8. Develop a maintenance strategy to control
the rate of infilling Not Started VPB
The design will minimize infilling and major
maintenance. Likely need to conduct
sediment core samples over time.
Table 7. Status on SPEAP 2011-proposed actions for Lost Lagoon’s water quality
Proposed actions for Lost Lagoon’s water quality
Status Lead Additional information
1. Undertake a consultancy to
A) conduct assessment of Lost Lagoon
water quality parameters, bottom profile,
etc. Ongoing VPB
A bathymetry and topographic survey were
completed in 2018. Additionally, a student
project provided water quality data, heavy
metal data, and a restoration strategy
(MacKinnon 2018).
B) Develop short-term options for
remediation Not Started VPB Experience with Beaver Lake may affect
drafting. Option of returning Lost Lagoon to
tidal mud flat or to some combination of
habitats is being considered.
C) Develop long-term solutions to improve
water quality, enhance wildlife habitat and
aesthetics, and reduce reliance on potable
water (e.g. dredging, creating habitat
islands, large-scale riparian restoration,
redirecting storm water)
Not Started VPB
D) Provide recommended strategy and plan Not Started VPB
2. Conduct 10-year forebay sediment removal
and water quality testing in existing
biofiltration pond Complete VPB
Sediment removal conducted in 2013.
Recommend cleaning forebay again in
September 2024. A genomic study was
performed in 2015-2016 to survey the
effectiveness of the biofiltration water and
sediment treatment (LeNoble 2017)

Stanley Park Ecology Society, SOPEI 2020 53
Proposed actions for Lost Lagoon’s water quality
Status Lead Additional information
3. Undertake implementation of 1. D Not Started
VPB +
SPES
Requires completion of 1.D
4. Continue ongoing restoration of existing
shoreline vegetation (invasive plant removal
and native willow planting) Ongoing
VPB +
SPES
Through volunteer opportunities, SPES leads
events on an ongoing basis to remove
invasive species and plant native species on
the shoreline of Lost Lagoon. Two islands
were cleared of invasive bamboo to increase
their value for wildlife.
5. Maintain Jubilee Fountain and water levels
with municipal water until alternative sources
found Not Started VPB
The Jubilee Fountain was significantly
damaged due to a flood in 2016.
Contemporary requirements have increased
the estimated costs for repairs. Plans to
reconnect Lost Lagoon to Coal Harbour may
also affect the future of the fountain.
6. Develop protocols to prevent sedimentation
from trail and road runoff and operational
activities Not Started VPB
May be informed by the findings of the
Beaver Lake consultant team and by the
ultimate decision on reconnecting Lost
Lagoon to Coal Harbour.
Table 8. Status on SPEAP 2011-proposed actions for invasive plant species
Proposed actions Status Lead Additional information
1. Purchase equipment for chemical control of
hogweed and knotweed Complete VPB
Contractors treat and remove these species.
Hogweed and knotweed are still present in
Stanley Park, but are controlled.
2. Update mapping of invasive species in Stanley
Park and develop operational systems to
allow consistent map updates
Complete SPES
SPES provided an invasive species mapping
report in 2012 (SPES 2012a) and an invasive
plant management plan for Stanley Park in
2013 (SPES 2013). SPES continues to map
invasive species on a regular basis, which
inform areas to prioritize. The VPB is working
with the Musqueam, Squamish, and Tsleil-
Waututh Nations to develop a city-wide
invasive species management strategy.
3. Develop a program to increase awareness
within the Park’s stakeholders about invasive
plant management Complete SPES
Posters were created and distributed to
strategic locations within Park offices and
work rooms.
4. Provide material support for SPES’ efforts to
control most species Complete VPB +
SPES
SPES possesses the material and equipment
required for manual removal.
5. Use Best Management Practices outlined in
the Forest Management Plan for the control
of other invasive plants in the Park (VPB
2009b)
On Track VPB +
SPES
Best Management Practices are followed by
SPES and VPB.
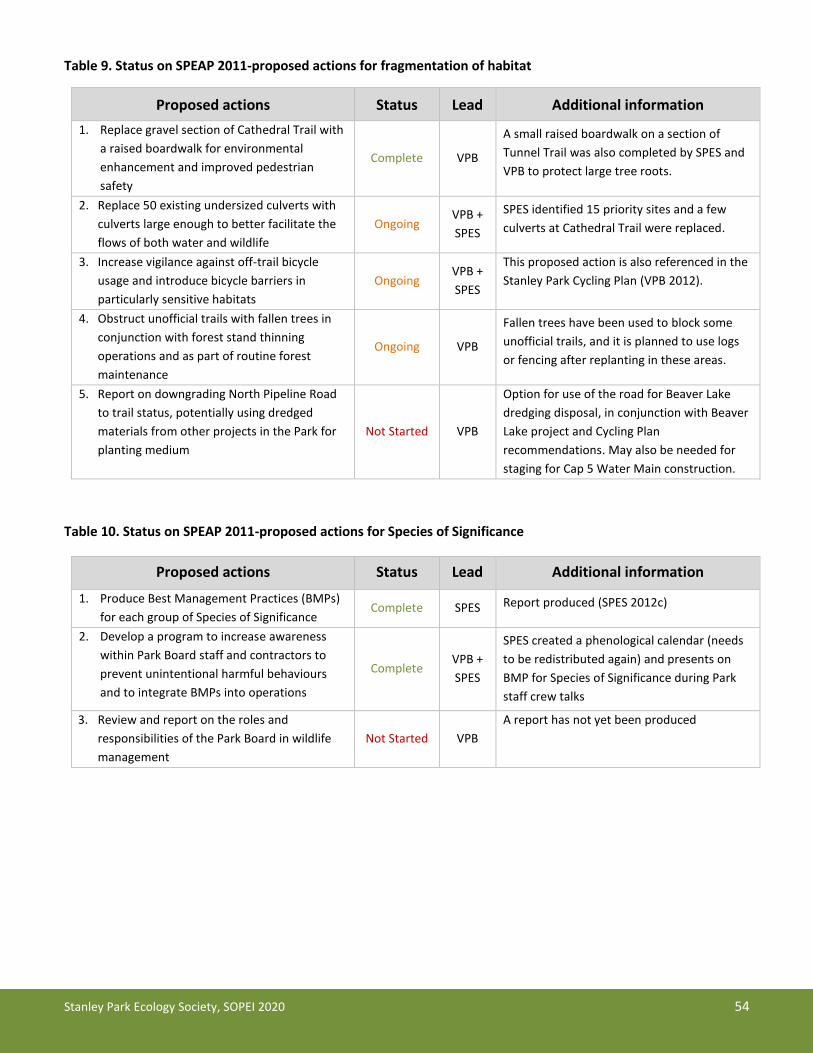
Stanley Park Ecology Society, SOPEI 2020 54
Table 9. Status on SPEAP 2011-proposed actions for fragmentation of habitat
Proposed actions Status Lead Additional information
1. Replace gravel section of Cathedral Trail with
a raised boardwalk for environmental
enhancement and improved pedestrian
safety
Complete VPB
A small raised boardwalk on a section of
Tunnel Trail was also completed by SPES and
VPB to protect large tree roots.
2. Replace 50 existing undersized culverts with
culverts large enough to better facilitate the
flows of both water and wildlife
Ongoing VPB +
SPES
SPES identified 15 priority sites and a few
culverts at Cathedral Trail were replaced.
3. Increase vigilance against off-trail bicycle
usage and introduce bicycle barriers in
particularly sensitive habitats
Ongoing VPB +
SPES
This proposed action is also referenced in the
Stanley Park Cycling Plan (VPB 2012).
4. Obstruct unofficial trails with fallen trees in
conjunction with forest stand thinning
operations and as part of routine forest
maintenance
Ongoing VPB
Fallen trees have been used to block some
unofficial trails, and it is planned to use logs
or fencing after replanting in these areas.
5. Report on downgrading North Pipeline Road
to trail status, potentially using dredged
materials from other projects in the Park for
planting medium
Not Started VPB
Option for use of the road for Beaver Lake
dredging disposal, in conjunction with Beaver
Lake project and Cycling Plan
recommendations. May also be needed for
staging for Cap 5 Water Main construction.
Table 10. Status on SPEAP 2011-proposed actions for Species of Significance
Proposed actions Status Lead Additional information
1. Produce Best Management Practices (BMPs)
for each group of Species of Significance Complete SPES Report produced (SPES 2012c)
2. Develop a program to increase awareness
within Park Board staff and contractors to
prevent unintentional harmful behaviours
and to integrate BMPs into operations
Complete VPB +
SPES
SPES created a phenological calendar (needs
to be redistributed again) and presents on
BMP for Species of Significance during Park
staff crew talks
3. Review and report on the roles and
responsibilities of the Park Board in wildlife
management
Not Started VPB
A report has not yet been produced

Stanley Park Ecology Society, SOPEI 2020 55
Appendix 4. Stanley Park Species Life List
SPES maintains a Species Life List for Stanley Park (summary: Table 11 and
Table 13) (SPES 2020). It is generated from a variety of sources including
literature, online citizen database monitoring programs (e.g. eBird,
iNaturalist), Bioblitzes, experts, students, and incident sightings reported
by the public, naturalists, volunteers, and staff. When available, the year a
given species was last documented is indicated to help track
which species are still present in the Park and which ones
require more information (e.g. invertebrates).
Since 2010, 1030 native species were confirmed present in the
Park, including 20 species listed federally under the Species at Risk Act (SARA), and 41 species listed blue or red by
the B.C. Conservation Data Centre (CDC) (Table 11). The species at risk confirmed in Stanley Park since 2010 are
listed in Table 12. In 2012, SPES created the Best Management Practices for Species of Significance in Stanley Park
report to provide background information on species and ecosystems at risk present in the Park, as well as what
can be done to limit impacts on them during Park operations and other human activities (SPES 2012c). SPES
implemented monitoring programs for species of special significance that are breeding in the Park, such as for
Pacific Great Blue Heron, Bald Eagles, Barn Swallows, various bat species, and North American beavers. Monthly
bird counts and coastal waterbird surveys provide information on other species at risk.
Table 11. Number of native species documented in Stanley Park listed by category
Category Presence confirmed
(2010 to 2020)
Possibly present (last confirmed between 1980 –
2009)
Unlikely, extirpated or
unknown (not confirmed
after 1979)
Total
Total native species 1030 272 248 1550
Red listed (provincially at risk) 10 3 6 19
Blue listed (prov. of special concern) 31 4 10 45
Yellow listed (prov. of least concern) 479 31 66 576
SARA 1-E (federally endangered) 3 1 2 6
SARA 1-T (federally threatened) 6 0 0 6
SARA 1-SC (fed. of special concern) 11 1 5 17
Birds 239 34 13 286
Mammals 27 2 28 57
Fish 18 5 54* 77
Reptiles 2 1 2 5
Amphibians 5 1 2 8
Invertebrates and Zooplankton** 325 199 83* 607
Vascular Plants 149 1 18 168
Mosses & Liverworts 99 0 10 109
Algae and Phytoplankton 55 29 11* 95
Fungi & Lichens 111 0 27* 138
*Some of the species in this category are suspected to be present but have not been detected recently.
**Some of the arthropod species counted might be introduced.
One of the largest known colonies of Barn Swallows in BC is in Stanley Park with over 80 nests. In 2019, 163 Barn
Swallow fledglings were born at the colony. Barn Swallows are a species at risk and their nests are protected all year by the Migratory Birds Convention Act. Photo: Frank Lin, 2019

Stanley Park Ecology Society, SOPEI 2020 56
Table 12. List of Species at Risk observed in Stanley Park, BC, from 2010 to 2020
Scientific Name Common Name BC List Species at Risk Act (SARA)
Arthropods Pachydiplax longipennis Blue Dasher Blue
Birds
Aechmophorus occidentalis Western Grebe Red Special Concern
Ardea herodia; ssp fannini Pacific Great Blue Heron Blue Special Concern
Botaurus lentiginosus American Bittern Blue
Brachyramphus marmoratus Marbled Murrelet Blue Threatened
Branta bernicla Brant Blue
Buteo lagopus Rough-legged Hawk Blue
Butorides virescens Green Heron Blue
Chordeiles minor Common Nighthawk Yellow Threatened
Clangula hyemalis Long-tailed Duck Blue
Coccothraustes vespertinus Evening Grosbeak Yellow Special Concern
Columba fasciata Band-tailed Pigeon Blue
Contopus cooperi Olive-sided Flycatcher Blue Threatened
Coturnicops noveboracensis Yellow Rail Red Special Concern
Cygnus columbianus Tundra Swan Blue
Cypseloides niger Black Swift Blue Endangered
Falco peregrinus Peregrine Falcon No Status Special Concern
Hirundo rustica Barn Swallow Blue Threatened
Hydroprogne caspia Caspian Tern Blue
Larus californicus California Gull Blue
Megascops kennicottii; ssp kennicottii Western Screech Owl Blue Threatened
Melanitta americana Black Scoter Blue
Melanitta perspicillata Surf Scoter Blue
Numenius phaeopus Whimbrel Red
Nycticorax nycticorax Black-crowned Night-Heron Red
Pelecanus erythrorhynchos American White Pelican Red
Phalacrocorax auritus Double-crested Cormorant Blue
Phalacrocorax penicillatus Brandt's Cormorant Red
Phalaropus lobatus Red-necked Phalarope Blue Special Concern
Podiceps auritus Horned Grebe Yellow Special Concern
Podiceps nigricollis Eared Grebe Blue
Progne subis Purple Martin Blue
Setophaga virens Black-throated Green Warbler Blue
Stercorarius parasiticus Parasitic Jaeger Red
Synthliboramphus antiquus Ancient Murrelet Blue Special Concern
Uria aalge Common Murre Red
Herbs
Oxalis oregana Redwood Sorrel Blue
Fish Oncorhynchus clarkii; ssp clarkii Coastal Cutthroat Trout Blue Mammals Eschrichtius robustus Grey Whale Blue Special Concern
Megaptera novaeangliae Humpback Whale Blue Special Concern
Myotis lucifugus Little Brown Myotis Yellow Endangered
Orcinus orca pop. 3 Orca (Transient population) Red Threatened
Phocoena phocoena Harbour Porpoise Blue Special Concern
Mosses & Liverworts
Frullania franciscana Woodsman's Eczema Blue
Metzgeria temperata Metzgeria temperata Blue Reptiles Chrysemys picta pop. 1 Painted Turtle - Pacific Coast Pop. Red Endangered

Stanley Park Ecology Society, SOPEI 2020 57
Many introduced species are present in Stanley Park, including 89 invasive species of plants and animals confirmed
in the last decade (summary: Table 13) (SPES 2020). SPES developed and follows an Invasive Plant Management
Plan to mitigate the spread and impacts of invasive plant species in the Park (SPES 2013).
Table 13. Number of introduced species documented in Stanley Park listed by category. The number of invasive species is in parentheses.
Category Presence confirmed
(2010 to 2020)
Possibly present (last confirmed between 1980 –
2009)
Unknown (more surveys needed)
Total
Total introduced species (invasive species in parenthesis)
200 (89) 16 (0) 365 (8) 581 (97)
Birds 7 (6)
7 (6)
Mammals 3 (3) 1 (1) 4 (4)
Fish 2 (2)
2 (2)
Reptiles 3 (2) 3 (2)
Amphibians 2 (2)
2 (2)
Invertebrates 42 (8) 16 (0) 2 (0) 60 (8)
Plants 142 (66)
361* (7) 503 (73)
*Many plant species are ornamental and found in the gardens of the Park; their presence needs to be re-confirmed.
Italian arum (Arum italicum) is an exotic plant that was introduced to Stanley Park as an ornamental plant and is currently present in a mown grass area south of Lost Lagoon. While it is
not currently listed as an invasive species in BC, it is recognised as invasive in Oregon and Washington and is difficult to eradicate. Photo: Jeannine Johnstone, 2019