Embed Size (px)
Citation preview
State of the North Carolina Workforce An Assessment of the State’s Labor Force
Demand and Supply 2007 – 2017
The North Carolina Commission on Workforce Development
January 2007
The North Carolina Commission on Workforce Development procured the services of the following organizations to
conduct this research
Table of Contents
Members of the Commission .................................................................................................. i Executive Summary................................................................................................................ ii Following are the eight key trends identified in the report:...................................................... iii Many Traditional NC Manufacturing Industries Are Shedding Jobs ....................................... iii North Carolina’s Traditional “Middle Jobs” Are Disappearing................................................. iv New Job Creation Is Concentrating in Fast-growing Urban Areas ......................................... v Many Areas Are Not Prospering ............................................................................................. v Future Prosperity Depends on Achieving Higher Educational Attainment Levels .................. v Baby-boom Retirements Will Deplete Labor Force Talent...................................................... vi High Skill In-migrants Can Help Close the Skills Gap............................................................. vi Low Skill In-migrants Present Opportunities and Challenges ................................................. vii Call to Action................................................................................................................. ......... vii Introduction ............................................................................................................................. 1 Defining Sub-state Units of Analysis....................................................................................... 2 Identifying a Rural-Urban Hierarchy.............................................................................. ......... 3 Defining North Carolina’s Three Primary Geographic Regions .................................... ......... 6 The Piedmont Region ............................................................................................................. 7 The Coastal Region ................................................................................................................ 8 The Mountain Region ............................................................................................................. 9 State Workforce Demand and Supply .................................................................................... 9 Workforce Demand................................................................................................................. 9 About the Data........................................................................................................................ 9 Industry Job Trends and Projections ...................................................................................... 12 Occupational Employment Trends and Projections ................................................................ 17 Summary of Key Demand Analysis ........................................................................................ 27 Workforce Supply.......................................................................................................... ......... 28 Demographic Analysis ............................................................................................................ 28 Summary of Key Supply Analysis ........................................................................................... 42 Employer Demand & Workforce Supply Gap Analysis ........................................................... 44 Conclusions ............................................................................................................................ 48 Appendix 1: Summary of Existing Economic and Workforce Developments Studies and Plans II Regional Vision Plans................................................................................................... ......... II Vision Plan Strategies for Workforce, Education and Training ............................................... III Selected Workforce Development Strategies Already in Place .................................... ......... VII Appendix 2: 200 Fastest Growing Industries in North Carolina ............................................. X Appendix 3: NC Selected Occupational Employment Projections ......................................... XVII
i
North Carolina Commission on Workforce Development Members Sylvia Anderson Guilford County Schools Greensboro, NC Dr. June Atkinson NC Department of Public Instruction Raleigh, NC Commissioner Cherie Berry NC Department of Labor Raleigh, NC Lonnie H. Blizzard Education Consultant Kinston, NC Ronnie Bugnar Person County Schools Roxboro, NC Marianna Clampett Clampett Enterprise Raleigh, NC H. Lee Clyburn Grubbs & Ellis/Thomas Linderman Raleigh, NC Paul Combs Paul Combs Enterprises Boone, NC Ray Deane William Barnet & Son, LLC Kinston, NC Charley Donohoe LifeSteps LLC Winston-Salem, NC Bill Downey L.A. Downey & Son Durham, NC Sandy Drum Nash-Rocky Mount Public Schools Nashville, NC
Secretary Jim Fain NC Department of Commerce Raleigh, NC Bill Farmer Time Warner Cable Charlotte, NC Ken Gregory Durham Exchange Club Industries, Inc. Durham, NC Phrantceena Halres Aelmings Human Resources Corp. Raleigh, NC Scott T. Hamilton Henderson County Partnership for Economic Development Hendersonville, NC Jim Henderson Castle Worldwide Inc. Morrisville, NC Meredythe Holmes Monarch Services Durham, NC Earl Jaggers AFL-CIO (BCT-317-T) Burlington, NC Edward W. Kelly III Greensboro, NC President Martin Lancaster NC Community College System Raleigh, NC Susan Lassiter Roanoke-Chowan Hospital Ahoskie, NC Helga Mattei Consultant Raleigh, NC
Martha Matthews Biogen Idec RTP, NC David McCune McCune Technology Fayetteville, NC MaryBe McMillan NC State AFL-CIO Raleigh, NC Sec. Carmen Hooker-Odom NC Dept. Health & Human Services Raleigh, NC Michael Okun NC AFL-CIO Raleigh, NC Chairman Harry Payne Employment Security Commission Raleigh, NC Juanita Pilgrim County of Cumberland Fayetteville, NC Bill Ragland Ragland Electrical Supply Brevard, NC Alex Rankin Concord Engineering & Surveying Concord, NC Chris Rolfe Duke Energy Corporation Charlotte, NC Chip Roth International Brotherhood of Teamsters Greensboro, NC Mark Sorrells Golden Leaf Foundation Rocky Mount, NC Terry A. Wethington B.R. Retried, Union New Bern, NC
ii
State of the North Carolina Workforce An Assessment of the State’s Labor Force
Demand and Supply 2007 - 2017
Executive Summary
The North Carolina economy is transforming in many ways and on many levels. One key transformation involves the State’s shift from an economy based on traditional manufacturing to a new economy driven increasingly by knowledge-intensive, business services activities. In response to this transformation, many firms are changing their products or production processes and offering expanded services as they adapt new technologies and build closer ties with suppliers and customers. Just as important is continued service sector growth, which is creating a large demand for both jobs requiring high skills and offering high wages and jobs requiring minimal skills, leaving a significant gap in the demand for jobs in the “middle.” When viewed in the aggregate, economic and occupational shifts are having dramatic impacts on the state’s workforce.
This “State of the North Carolina Workforce” report seeks to shed light on statewide trends and to unmask significant regional patterns in job creation and its impact on the demand for workers. In particular, the study examines economic and workforce development patterns in the state’s urban areas, small towns, and rural communities as well as North Carolina’s geographic regions–the Mountains, Piedmont, and Coast. Based on an in-depth quantitative analysis of the current and projected labor market supply and demand, the goal of the study is to describe North Carolina’s progress to date and the challenges and opportunities for completing a successful economic transformation.
Important caveats should be noted related to this analysis. First, this analysis uses data calibrated to the US Bureau of Economic Analysis (BEA) definition for employment. The BEA combines employment data from the North Carolina Employment Security Commission’s unemployment insurance administrative records (the most commonly used data source in counting jobs) with data on proprietors, farm workers, and government workers. Second, the forecasts are based on both past trends and assumptions about anticipated future developments, assuming no changes in policy or economic conditions. Thus, these forecasts should be used in the spirit in which they are provided, as a tool for assessing likely future growth patterns in the event that no policy action takes place to change that future and there are no major unforeseen economic upheavals. Third, other analyses may differ slightly in their outlook for certain industries or occupations. These differences come from using different projection tools and models. However, the core predictions hold true across methodologies and represent an accurate picture of the future, assuming current trends do not change.
iii
Following are the eight key trends identified in the report: • Many of North Carolina’s traditional manufacturing industries continue to shed jobs as
part of an on-going economic transition. • North Carolina’s traditional “middle jobs”—those that paid a family-sustaining wage and
required minimal formal education or training—are disappearing as part of this transition. • New job creation is concentrating in certain fast-growing metropolitan areas. • Many areas of North Carolina are not prospering from the economic transformation. • The future prosperity of all North Carolinians depends on achieving higher educational
attainment levels for all citizens. • Impending baby-boom retirements will exacerbate an emerging skills gap among
experienced, skilled workers. • High-skill in-migrants will help fill part, but not all, of this skills gap. • Low-skill in-migrants present both opportunities and challenges in meeting the state’s
workforce needs.
This report reviews each of these trends, identifies key issues and challenges for North Carolina, and examines both industry’s demand for labor and the supply of workers available to meet those needs. It should be noted that while these trends are presented separately, many are integrally linked and are only presented discretely for ease of assimilation. Policy actions should take into account the whole of the picture and the relationship among the trends. Following is a brief discussion regarding the eight key trends from the study.
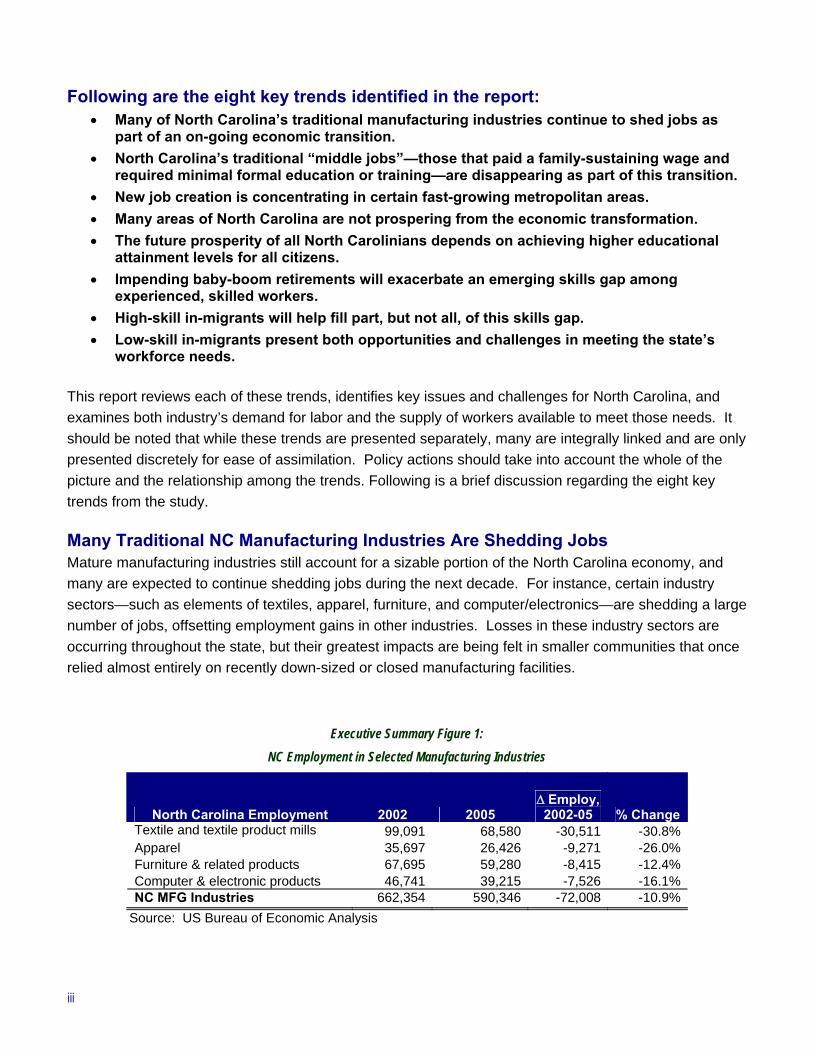
Many Traditional NC Manufacturing Industries Are Shedding Jobs Mature manufacturing industries still account for a sizable portion of the North Carolina economy, and many are expected to continue shedding jobs during the next decade. For instance, certain industry sectors—such as elements of textiles, apparel, furniture, and computer/electronics—are shedding a large number of jobs, offsetting employment gains in other industries. Losses in these industry sectors are occurring throughout the state, but their greatest impacts are being felt in smaller communities that once relied almost entirely on recently down-sized or closed manufacturing facilities.
Executive Summary Figure 1: NC Employment in Selected Manufacturing Industries
North Carolina Employment 2002 2005 Δ Employ, 2002-05 % Change
Textile and textile product mills 99,091 68,580 -30,511 -30.8%Apparel 35,697 26,426 -9,271 -26.0%Furniture & related products 67,695 59,280 -8,415 -12.4%Computer & electronic products 46,741 39,215 -7,526 -16.1%NC MFG Industries 662,354 590,346 -72,008 -10.9%
Source: US Bureau of Economic Analysis
iv
Executive Summary Figure 2:
US and NC Net New Jobs by Required Education (Estimated Change 2007-2017)
0%
5%
10%
15%
20%
25%
30%
35%
40%
45%
50%
Perc
ent o
f Tot
al N
ew E
mpl
oym
ent (
2007
-17)
USA
NC‘Disappearing’
Traditional Middle Jobs
‘New Middle’Jobs
0%
5%
10%
15%
20%
25%
30%
35%
40%
45%
50%
Perc
ent o
f Tot
al N
ew E
mpl
oym
ent (
2007
-17)
USA
NC‘Disappearing’
Traditional Middle Jobs
‘New Middle’Jobs
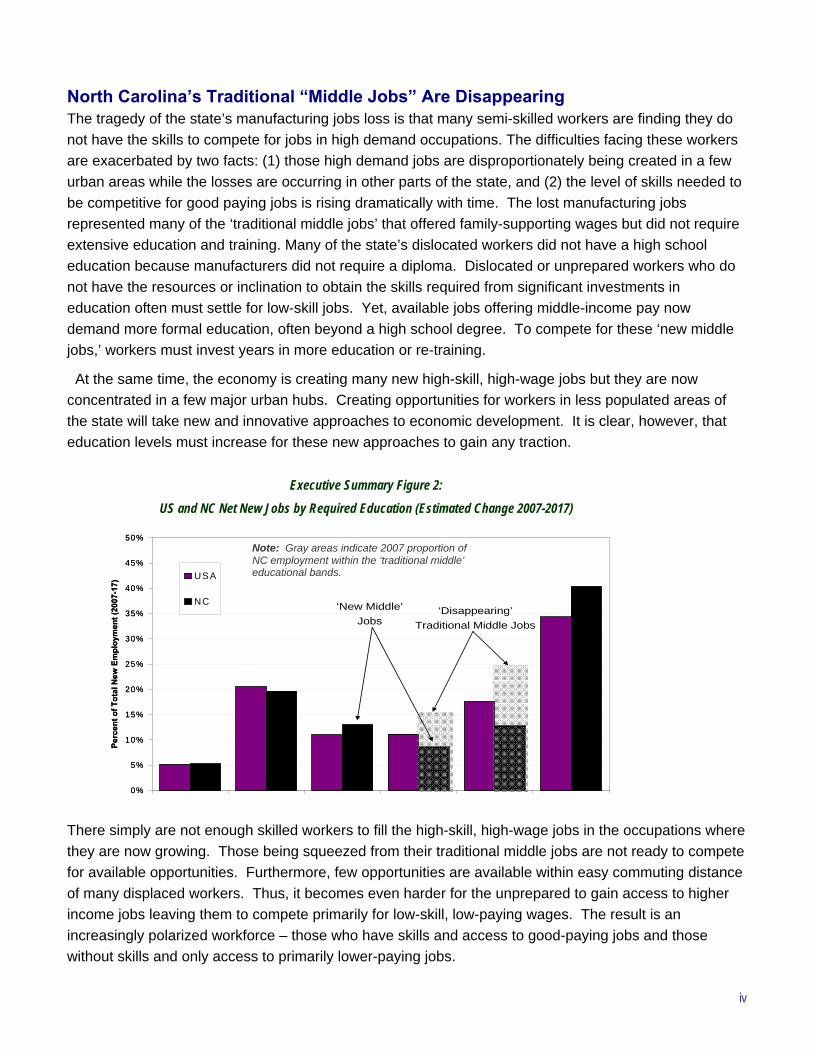
North Carolina’s Traditional “Middle Jobs” Are Disappearing The tragedy of the state’s manufacturing jobs loss is that many semi-skilled workers are finding they do not have the skills to compete for jobs in high demand occupations. The difficulties facing these workers are exacerbated by two facts: (1) those high demand jobs are disproportionately being created in a few urban areas while the losses are occurring in other parts of the state, and (2) the level of skills needed to be competitive for good paying jobs is rising dramatically with time. The lost manufacturing jobs represented many of the ‘traditional middle jobs’ that offered family-supporting wages but did not require extensive education and training. Many of the state’s dislocated workers did not have a high school education because manufacturers did not require a diploma. Dislocated or unprepared workers who do not have the resources or inclination to obtain the skills required from significant investments in education often must settle for low-skill jobs. Yet, available jobs offering middle-income pay now demand more formal education, often beyond a high school degree. To compete for these ‘new middle jobs,’ workers must invest years in more education or re-training.
At the same time, the economy is creating many new high-skill, high-wage jobs but they are now concentrated in a few major urban hubs. Creating opportunities for workers in less populated areas of the state will take new and innovative approaches to economic development. It is clear, however, that education levels must increase for these new approaches to gain any traction.
There simply are not enough skilled workers to fill the high-skill, high-wage jobs in the occupations where they are now growing. Those being squeezed from their traditional middle jobs are not ready to compete for available opportunities. Furthermore, few opportunities are available within easy commuting distance of many displaced workers. Thus, it becomes even harder for the unprepared to gain access to higher income jobs leaving them to compete primarily for low-skill, low-paying wages. The result is an increasingly polarized workforce – those who have skills and access to good-paying jobs and those without skills and only access to primarily lower-paying jobs.
Note: Gray areas indicate 2007 proportion of NC employment within the ‘traditional middle’ educational bands.
v
New Job Creation Is Concentrating in Fast-growing Urban Areas As North Carolina’s traditional economic base declines, the data reveal that the state’s overall economy is becoming more diverse and more similar to the rest of the country. The state’s services sector is expected to grow more rapidly in the coming decade, as a combination of high-skill, high value-added services and low-skill, low value-added services replace the jobs lost in mature goods-producing sectors. Whereas the state’s traditional manufacturers are often located in small towns, we see that the bulk of these emerging new activities, particularly those that require higher skills and thus have higher pay are concentrating in the state’s larger metropolitan areas. Many of the metropolitan counties of the Piedmont region, for instance, enjoy the most dynamic economies. The companies in the Piedmont account for 64 percent of current jobs and 68 percent of new jobs projected to be created in the next decade. Statewide, metropolitan counties have 74 percent of current jobs while 81 percent of projected new jobs are expected to be created in these metropolitan areas.
Many Areas Are Not Prospering In contrast to the success in the Piedmont, especially around Charlotte and the Research Triangle, relatively slower growth has occurred throughout much of the rest of the state, especially in the Mountains and Coastal regions. While many of the largest metropolitan areas are growing rapidly, smaller urban (or “micropolitan”) areas and rural counties are creating fewer jobs, many of which include lower wage consumer services or temporary jobs. In addition, the Piedmont Triad has also not yet gained traction in finding a new economic base to replace its declining manufacturing industries.
Overall, about 40 percent of the state’s new jobs will require little more than short-term training (see “Below GED” in Executive Summary Figure 2), but in the micropolitan and rural areas, that figure is closer to 50 percent. Unfortunately, these low-skill jobs pay approximately 60 percent of the state’s current average earnings.
The metro areas are enduring labor supply shortages even though they offer higher average wages. Increasingly, they are tapping the workforce in nearby micropolitan and rural labor markets for the best and brightest talent, requiring either relocation or extended commuting patterns.
Quite simply, the state’s micropolitan and rural economies are not creating enough high- and middle-income jobs to meet all of their local employment needs. For some workers, the option is to settle for underemployment or no employment.
Future Prosperity Depends on Achieving Higher Educational Attainment Levels Even in the most successful regions, North Carolina’s earnings trail the rest of the country. Not only is this true statewide, but also in the state’s high earning metro counties and Piedmont region where average earnings trail the US by 4 percent. Based on the mix of industries and occupations projected to grow the fastest in North Carolina, this relative earnings pattern will not change during the coming decade. To close that gap, the future prosperity of North Carolinians relies heavily upon further enhancing workers’ education and skills.
Simply put, the more education that an occupation demands, the higher the average earnings. Workers with no post-secondary education or certification are finding it increasingly difficult to compete for jobs in
vi
high wage occupations. The highest wage occupations require an advanced degree and pay 106 percent greater than the state average. Those requiring a bachelor’s degree pay 90 percent greater than the state average. Those occupations requiring some college or an associate’s degree offer earnings 15 percent higher than the state average. Even jobs that required some college or at least one year of training and experience paid about 5 percent above average.
The good news is that, overall, the state’s educational attainment levels are rising. In 1990, 70 percent of North Carolina adults aged 25 and older held a high school degree, increasing to 84 percent by 2005. Likewise, in 1990, only 17 percent of adult North Carolinians held a bachelor’s degree or higher, but this rate increased to 27 percent by 2005. Even with this significant progress during the past 15 years, the state continues to trail the nation in educational attainment and still has far to go to ensure that workers without a formal post-secondary education, especially those without access to or the resources to take advantage of education opportunities, do not fall farther behind.
Baby-boom Retirements Will Deplete Labor Force Talent Global demographic shifts will create additional challenges in meeting North Carolina’s future workforce needs. Perhaps most pressing is the impending retirement of the first wave of the baby-boom generation (those born between 1946 and 1955). If this segment of the workforce is lost en masse, it could create tremendous upheaval in the workplace.
While the boomers are retiring, the state is projected to add about 30,000 new adults each year as potential workers, enough to replace the retirees but not enough to fill the new jobs being created. With 70,000 new jobs being created each year during the next 10 years, 40,000 net new jobs could go begging for workers annually. The retirement of one-quarter of the workforce, especially many of the state’s most experienced workers, in just 13 years has the potential to leave a gaping hole in the supply of workers during the next two decades.
High Skill In-migrants Can Help Close the Skills Gap Fortunately, new in-migrating workers are helping to mitigate the state’s current labor shortages. New North Carolinians represent several key cohorts – including highly-prized college-educated, young adults (especially those aged 20-29). In addition, Hispanics, Asians, and foreign-born residents are also common in-migrants to North Carolina. While the state’s overall age structure is relatively similar to the US, in-migrants are, on average, about seven years younger. In-migrants provide potential solutions to the demand for workers for both high-skill and low-skill occupations.
Attracting young talent is not the only solution for closing the state’s skill gap. The state is also attracting retirees and, importantly, ‘pre-retirees’ (aged 50-64). These pre-retirees are often looking for their eventual retirement destination, but they are not yet ready to leave the workforce. Nearly one in four retirement and pre-retirement age in-migrants chose to move to Charlotte during the last decade. The Raleigh-Durham area has also served as a major destination for pre-retirees. Certainly, Asheville has also benefited from in-migrations among this group, with 9 percent of all 50-and-older in-migrants to North Carolina choosing the Asheville metropolitan area as their new home.
vii
Low Skill In-migrants Present Opportunities and Challenges Just as experienced in-migrants help in closing the state’s skills gap, the state is also attracting a large number of unskilled or semi-skilled in-migrants. One of the largest cohorts within this group of in-migrants is Hispanic workers. This cohort of new North Carolinians poses new challenges for the state’s workforce development leaders. Growth in the state’s Hispanic population continues to far outpace the national average. In 2005, North Carolina was ranked 11th for total number of Hispanic residents, and official estimates put that number at over 600,000. However, recent research on unauthorized at the Pew Hispanic Center (www.pewhispanic.org) of unauthorized migrants suggests that the total may actually be as high as 1 million (or 11 percent) North Carolinians are of Hispanic origin.
The large scale influx of low-skill Hispanic workers provides a significant source of workers for many industries, including construction, agriculture, food processing and a number of other services. Nevertheless, this population also poses several real challenges for the state’s education, workforce and social services providers. Many low-skill workers, especially persons whose first language is not English, could inhibit growth of the state’s standard of living. Efforts to acculturate this new in-migrant community will be critically important to the state’s economic success.
Call to Action North Carolina’s changing economy will demand an adaptable workforce. During the past decade, jobs losses in traditional manufacturing sectors have resulted in significant economic hardship across the state. Many of those dislocated workers settled for lower paying, low-skill jobs because they did not qualify for the new jobs that offered better wages, but demanded higher skills or better education. Furthermore, many dislocated workers lacked access to educational resources, could not afford to take advantage of those educational opportunities, or simply were not inclined to disrupt their lives any further by going back to school. These issues continue in those basic sectors as certain manufacturing industries shed more jobs in the future, but North Carolina’s future economy will look very different. New industries are emerging, many of which offer high wages to those with the most skills. Consequently, North Carolina finds itself with a widening gap: on one end is a growing shortage of high skill talent needed to fill emerging well paying jobs and on the other end are many low skill workers settling for jobs that do not offer a family-sustaining wage.
The state’s workforce and education system faces the challenge of preparing an increasingly larger proportion of North Carolinians for better-paying, higher skill jobs. This challenge is made more daunting by the large existing pool of workers that lack the most basic skills or credentials (e.g., a high school degree or post-secondary training and education) necessary for these new higher quality jobs. As a result, North Carolina must seek to provide the state’s existing workforce with better access to longer-term training and education to meet the needs of its fast-growing industries. Importantly the State must also create opportunities throughout all of North Carolina.
As leaders review the key trends facing the state, North Carolina must consider the implications for state policy. How do we respond most effectively to the painful transitions caused by worker dislocations in our traditional industries? How do we prepare workers for emerging, fast-growing industries? How do we help the entire state to prosper while encouraging the state’s fast-growing urban economies to continue operating at their fullest capacity? How do we help our citizens to value education more highly

viii
to ensure that they are fully prepared for the opportunities that fast-growing new industries offer? These are some of the questions raised key challenges facing our state.
State and local policy makers and practitioners involved in workforce development, education, and economic development must all participate fully in developing the solutions to address these challenges effectively. The responses from these existing networks and the state’s multi-billion dollar investment in education, workforce development and economic development should be directed to efforts that create an environment in which the economy continues to develop and allows all citizens to contribute as valued members of that economy. These solutions must recognize that North Carolina is no longer a source for low-cost, low-skill labor for global markets. Our success will be based on innovation, new ideas, entrepreneurial behaviors, and continuously advancing education levels. How we achieve these ideals and create a more integrated system of life-long learning are at the heart of whether North Carolina can continue to prosper and truly become “The State of Minds.”
To access the complete State of the Workforce Report electronically, please visit: http://www.nccommerce.com/workforce/swr
1
North Carolina State of the Workforce: An Assessment of the
State’s Labor Force Demand and Supply
Introduction North Carolina’s economy is undergoing a critical economic transformation. For decades, the state
depended on agriculture and manufacturing industries for its middle-income, family-sustaining jobs. Increasingly, North Carolinians are finding those jobs subsumed by an economy that is much more globally oriented, knowledge-driven, and service-based. During the past several years, numerous studies and strategies have characterized these challenges and identified potential policy responses. Appendix 1 summarizes several of the state’s key regional economic development plans, as well as representative workforce studies conducted in various state regions.
The transformation occurring in North Carolina has significant implications for the state’s businesses and workers, changing what they do and how they compete in a globally integrated economy. This analysis explores how far North Carolina has traveled in the transformation process and looks to the future to identify the jobs that will provide family-supporting wages. Not only is the goal of this analysis to examine projections of where jobs will be in the future, but the analysis also explores the readiness of North Carolina’s workforce to fill those jobs. What kinds of jobs can the state expect to be available? Will North Carolina have the workers required to fill these jobs? How might the state’s public education and training system prepare for North Carolina’s economy as it continues this historic shift during the next ten years?
In looking to the future, we must rely on economic forecasts, which are, at best, educated guesses about what the future holds. Forecasts, such as the one offered in this report, provide users with a sense of the state’s direction as well as information about expected growth patterns should no policy action be taken to change the future. However, it is critical to note that forecasts rely on information about recent trends and assumptions about future behaviors. Furthermore, not all economists agree on what these trends mean or what assumptions should be made. In addition, these trends are subject to unforeseen events as well as the concerted efforts of policy makers to address the state’s challenges. In fact, the most important reason for examining these past and projected patterns is to help policymakers determine how best to invest resources to change undesirable trends. This study of the state’s workforce is designed primarily to provide policy makers with information about the state’s growth path, in order to help leaders understand what may happen if the economy follows its current trajectory.
In making strategic investments or critical policy choices, leaders can, of course, help dramatically redirect economic and workforce development trends. In North Carolina, leaders make many of these strategic choices at the regional and local level without a single statewide vision. Assuming access to resources that can influence development, this approach is appropriate in a state, such as North Carolina, with many regional economies bound together by a single political border. Clearly, the economies of the Piedmont metropolitan areas of Charlotte and Raleigh-Durham are very different from the Mountain or Coastal regions. Policies that will influence growth and development in these fast-growing metropolitan economies should differ substantially from those that create opportunity in
2
stagnating rural areas. Even so, this report will define the similarities among those sub-state regional economies, as much as it confirms some of the differences that we expect to find.
In the following pages, the report examines both North Carolina’s labor market demand and supply. Labor market demand is determined by assessing which industry sectors are growing and what occupations those industries require. This analysis projects the number of jobs required today and in ten years to meet the state’s economic demands. It also examines the education and training requirements demanded by those industries and occupations. Following this analysis of worker demand, the report explores the labor market supply so as to determine which people are available (and will likely be available) to fill the jobs being created in the state’s economy. The focus of the discussion is on identifying the skills necessary to meet the market’s need for workers.
The study concludes with an analysis of the existing education and training system’s capacity to meet the demand by adapting the supply of workers to meet those needs. It also offers key findings and conclusions that will better allow the State’s Workforce Commission to determine appropriate recommendations for action. In the next section, the report focuses on how and why the state’s economy has been subdivided in the analysis, and provides a glimpse of what kind of data were used in this assessment.
Defining Sub-state Units of Analysis North Carolina possesses a significant amount of economic diversity, and therefore the issues facing
its workforce differ widely across the state. In places like Charlotte and the Research Triangle, firms require highly-skilled workers to support activities in rapidly growing economic sectors such as financial services, information technology, and biosciences. While the Charlotte and Research Triangle regions are two of the nation’s most economically dynamic regions, other parts of the state struggle to face the challenges of transforming in response to the needs of an increasingly knowledge-driven economy. In western North Carolina, for instance, industries that once employed many of the region’s workers, including textiles, apparel and furniture, no longer provide enough viable employment options. Similarly, in eastern North Carolina, textiles and tobacco no longer drive employment and economic growth. If the regions lack the competitive advantage to support emerging knowledge-driven sectors, they are seeking alternative economic drivers, frequently relying on solutions designed to attract tourists or new residents. However, these new solutions often result in creating consumer service jobs that typically pay workers less than the jobs being shed from declining industries.
Clearly, assessing these trends at the state-wide level is necessary but not sufficient for understanding the full range of dynamic change affecting North Carolina. One approach to consider sub-state differences would be to focus at the individual county level. Of course, county level distinctions are an important part of the North Carolina culture; counties often tackle problems independently of the state or one another. However, frequently adjacent counties face many similar political, social, and economic challenges and could equally benefit from opportunities to collaborate regionally. Consequently, the study opts to assess relevant patterns and trends at a multi-county level of analysis.
There are several ways to conduct a multi-county analysis – some focus on grouping counties through adjacent geographies while others focus on grouping counties with similar characteristics. One approach, for instance, compares the observed economic dynamism and prosperity in the Piedmont with
3
the identified poverty and unemployment in the Mountains and along the Coast. This is relevant because, at that geographic scale, multiple (and sometimes disparate) challenges face the different parts of North Carolina.
Another approach recognizes that these adjacent counties may not always share common challenges. Why, for instance, is Watauga County doing so well economically while surrounding counties struggle? Why has Durham County not been able to take as much of an advantage of the success of the Research Triangle Park as have Wake and Orange counties? What has caused the economic struggles of the Piedmont’s micropolitan areas while nearby metro areas flourish? Why are several eastern counties, such as Lenoir and Edgecombe, experiencing population declines while nearby counties enjoy growth?
The conventional wisdom is that the west and east both are suffering economically while the state’s large metropolitan areas continue to grow. It is important not only to validate this perception, but also to better appreciate the nuanced challenges facing North Carolina’s industries and workforce in different parts of the state. Consequently, this report must look beyond the obvious regional breakdowns to find the key issues that inhibit the state from enjoying more balanced economic development.
After detailed assessments of possible regional configurations, the project team collaborated with the state Workforce Commission’s Policy Research and Assessment Committee (PRAC) to identify several regional distinctions for study. These distinctions focused on the rural-urban nature of the state’s population as well as the traditional view that the state is composed of three major regions – the Coast, the Piedmont, and the Mountains. The analysis also recognizes the critical role for counties as well as the potential role the legislatively defined regional economic partnerships might play in developing greater demand for labor. Thus the analysis is consciously built on units that respect the partnership boundaries.
Identifying a Rural-Urban Hierarchy The state’s urban-rural dichotomy explains some of the differences in economic performance.
Traditionally, North Carolina has been a state of small towns and rural places. Its agrarian culture was celebrated for generations. The rise of the textile industry in small communities across the state at the turn of the 20th century marked the initial shift of a large portion of the state’s economy toward manufacturing. During the past generation, the state’s growth was concentrated in its larger urban centers. The state may have reached a tipping point with the emergence of three major urban areas with more than one million people–Charlotte, the Piedmont Triad, and the Research Triangle. About half of the state’s population now lives in one of these three regions, frequently called the “Golden Crescent.”
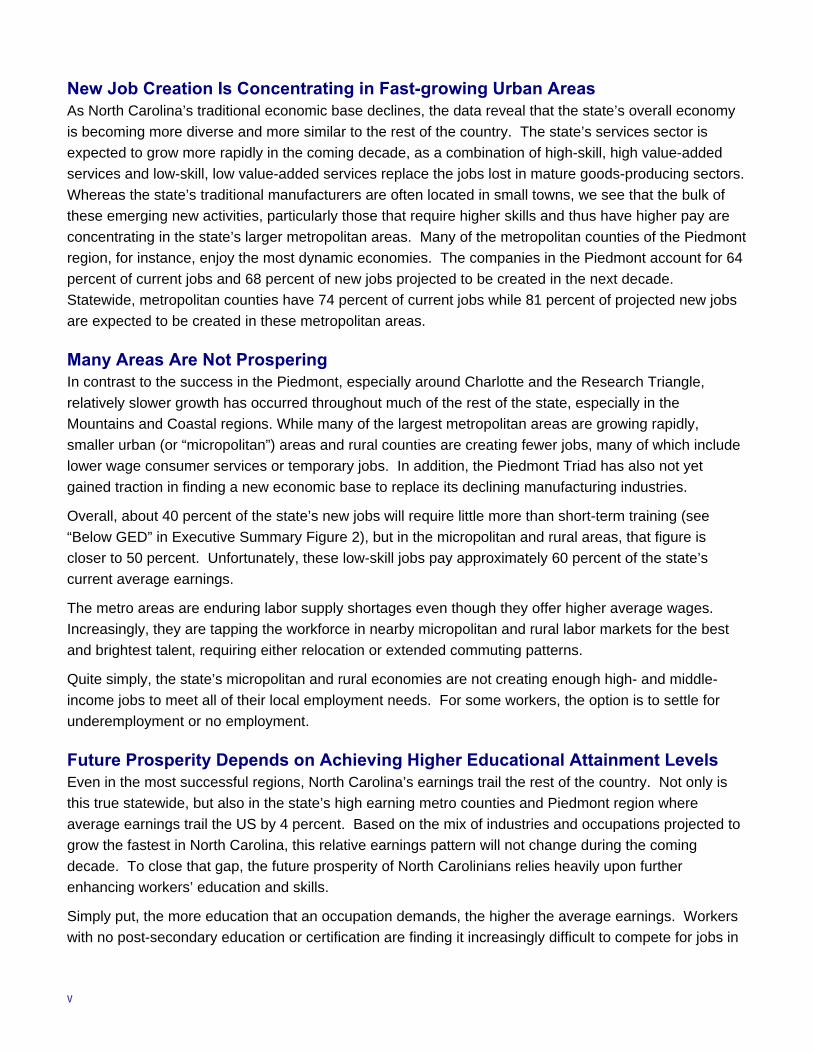
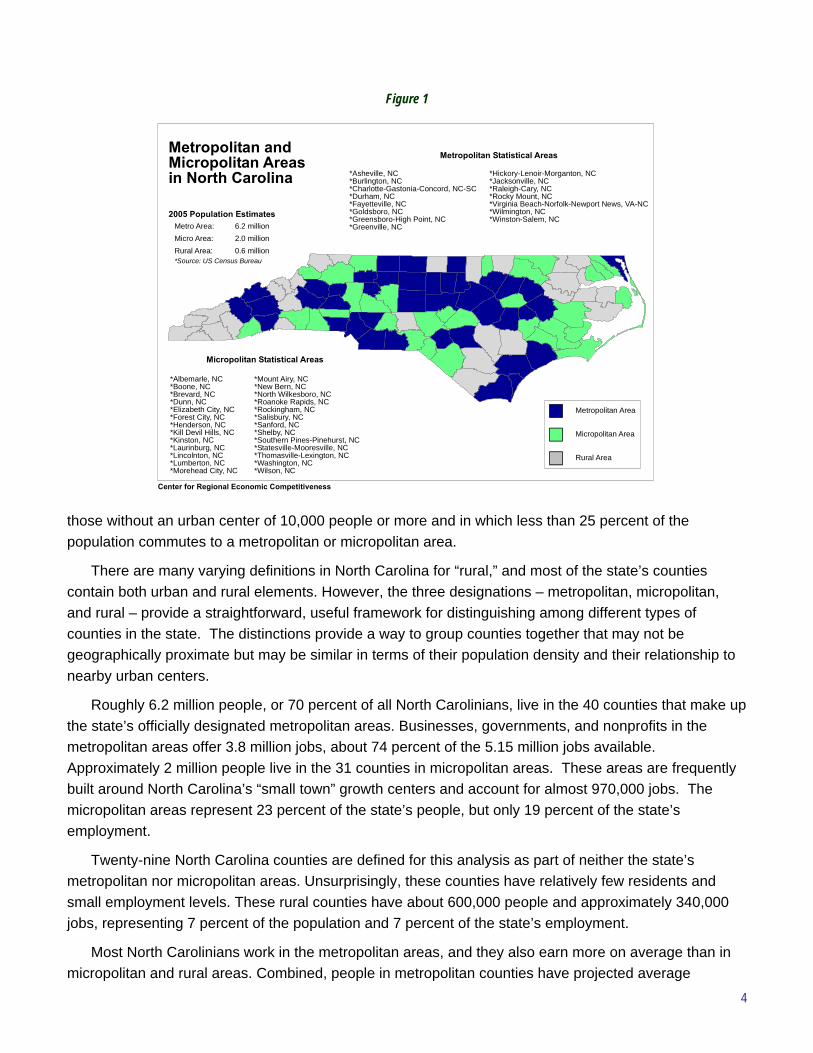
Large cities, small cities, towns, and rural areas all face different kinds of workforce challenges and opportunities. Figure 1 shows North Carolina’s metropolitan, micropolitan and rural counties.1 The definition established by the US Office of Management and Budget identifies metropolitan counties as those with an urban area of 50,000 people or more. These areas include adjacent counties in which 25 percent or more of the population commutes to the urban center. Micropolitan counties are those with 10,000 to 50,000 people. For the purposes of simplicity, counties that are not classified as either metropolitan or micropolitan are identified as “rural counties” in this report. Rural counties are defined as 1 Regional distinctions provided by the US Office of Management and Budget, 2003 and updates; Calculations by CREC based on US Census Bureau 2005 population estimates.
4
those without an urban center of 10,000 people or more and in which less than 25 percent of the population commutes to a metropolitan or micropolitan area.
There are many varying definitions in North Carolina for “rural,” and most of the state’s counties contain both urban and rural elements. However, the three designations – metropolitan, micropolitan, and rural – provide a straightforward, useful framework for distinguishing among different types of counties in the state. The distinctions provide a way to group counties together that may not be geographically proximate but may be similar in terms of their population density and their relationship to nearby urban centers.
Roughly 6.2 million people, or 70 percent of all North Carolinians, live in the 40 counties that make up the state’s officially designated metropolitan areas. Businesses, governments, and nonprofits in the metropolitan areas offer 3.8 million jobs, about 74 percent of the 5.15 million jobs available. Approximately 2 million people live in the 31 counties in micropolitan areas. These areas are frequently built around North Carolina’s “small town” growth centers and account for almost 970,000 jobs. The micropolitan areas represent 23 percent of the state’s people, but only 19 percent of the state’s employment.
Twenty-nine North Carolina counties are defined for this analysis as part of neither the state’s metropolitan nor micropolitan areas. Unsurprisingly, these counties have relatively few residents and small employment levels. These rural counties have about 600,000 people and approximately 340,000 jobs, representing 7 percent of the population and 7 percent of the state’s employment.
Most North Carolinians work in the metropolitan areas, and they also earn more on average than in micropolitan and rural areas. Combined, people in metropolitan counties have projected average
Figure 1
Center for Regional Economic Competitiveness
Metropolitan andMicropolitan Areasin North Carolina
Metropolitan Area
Micropolitan Area
Rural Area
2005 Population EstimatesMetro Area: 6.2 millionMicro Area: 2.0 millionRural Area: 0.6 million*Source: US Census Bureau
*Hickory-Lenoir-Morganton, NC*Jacksonville, NC*Raleigh-Cary, NC*Rocky Mount, NC*Virginia Beach-Norfolk-Newport News, VA-NC*Wilmington, NC*Winston-Salem, NC
*Asheville, NC*Burlington, NC*Charlotte-Gastonia-Concord, NC-SC*Durham, NC*Fayetteville, NC*Goldsboro, NC*Greensboro-High Point, NC*Greenville, NC
Metropolitan Statistical Areas
*Mount Airy, NC*New Bern, NC*North Wilkesboro, NC*Roanoke Rapids, NC*Rockingham, NC*Salisbury, NC*Sanford, NC*Shelby, NC*Southern Pines-Pinehurst, NC*Statesville-Mooresville, NC*Thomasville-Lexington, NC*Washington, NC*Wilson, NC
*Albemarle, NC*Boone, NC*Brevard, NC*Dunn, NC*Elizabeth City, NC*Forest City, NC*Henderson, NC*Kill Devil Hills, NC*Kinston, NC*Laurinburg, NC*Lincolnton, NC*Lumberton, NC*Morehead City, NC
Micropolitan Statistical Areas
5
earnings2 for 2007 of $42,784 which is about $3,000 more (7 percent higher) than the statewide average of $39,953. Conversely counties in micropolitan and rural counties have below average earnings at $32,836 and $27,944 respectively.
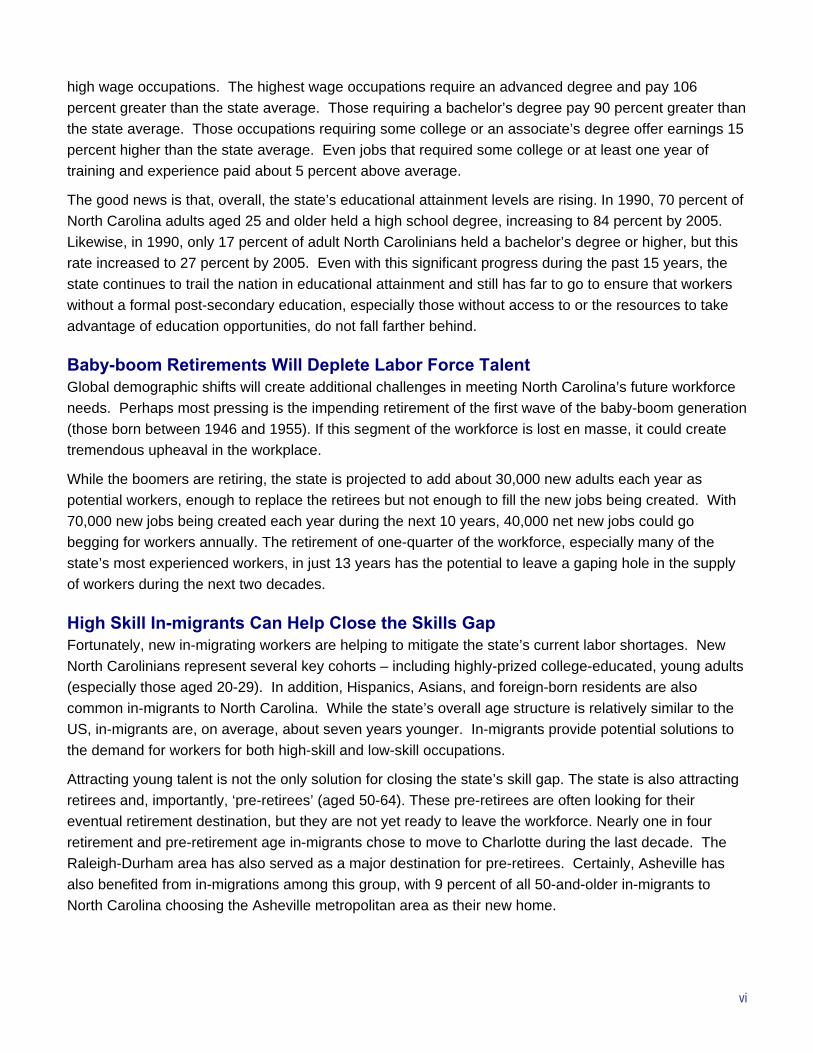
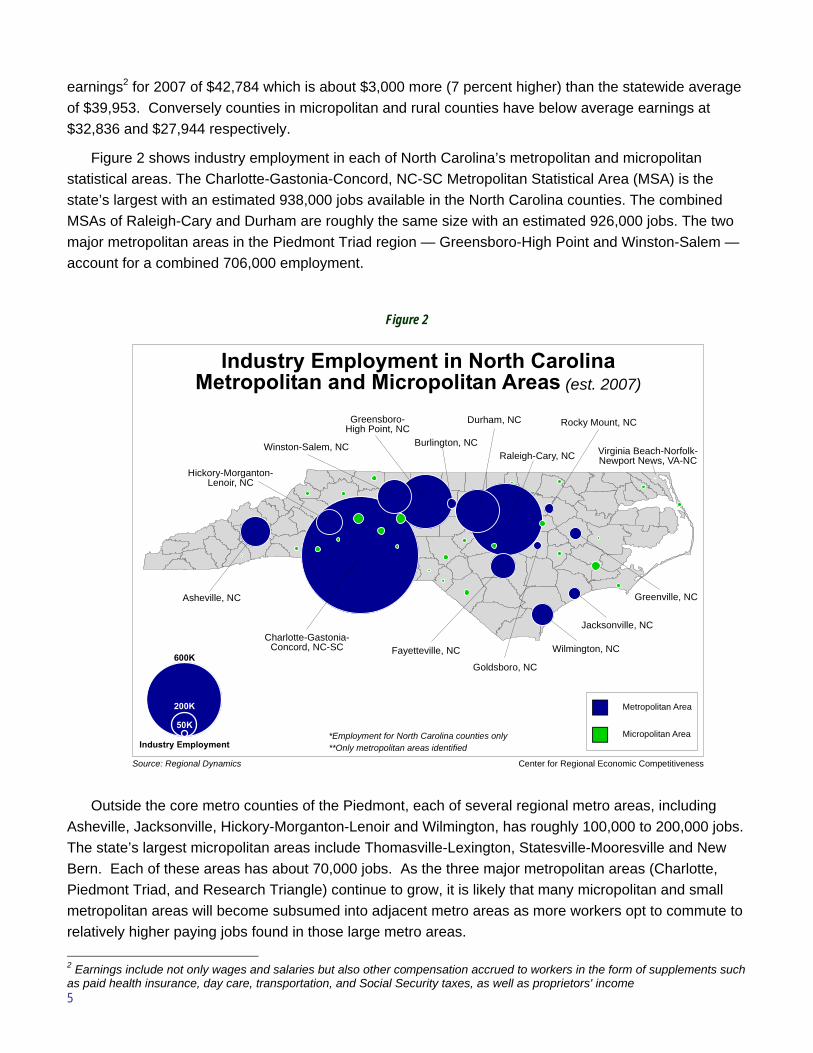
Figure 2 shows industry employment in each of North Carolina’s metropolitan and micropolitan statistical areas. The Charlotte-Gastonia-Concord, NC-SC Metropolitan Statistical Area (MSA) is the state’s largest with an estimated 938,000 jobs available in the North Carolina counties. The combined MSAs of Raleigh-Cary and Durham are roughly the same size with an estimated 926,000 jobs. The two major metropolitan areas in the Piedmont Triad region — Greensboro-High Point and Winston-Salem — account for a combined 706,000 employment.
Outside the core metro counties of the Piedmont, each of several regional metro areas, including Asheville, Jacksonville, Hickory-Morganton-Lenoir and Wilmington, has roughly 100,000 to 200,000 jobs. The state’s largest micropolitan areas include Thomasville-Lexington, Statesville-Mooresville and New Bern. Each of these areas has about 70,000 jobs. As the three major metropolitan areas (Charlotte, Piedmont Triad, and Research Triangle) continue to grow, it is likely that many micropolitan and small metropolitan areas will become subsumed into adjacent metro areas as more workers opt to commute to relatively higher paying jobs found in those large metro areas. 2 Earnings include not only wages and salaries but also other compensation accrued to workers in the form of supplements such as paid health insurance, day care, transportation, and Social Security taxes, as well as proprietors' income
Figure 2
Source: Regional Dynamics Center for Regional Economic Competitiveness
Charlotte-Gastonia-Concord, NC-SC
Asheville, NC
Hickory-Morganton-Lenoir, NC
Winston-Salem, NC
Greensboro-High Point, NC
Burlington, NC
Durham, NC
Raleigh-Cary, NC
Fayetteville, NC
Goldsboro, NC
Jacksonville, NC
Greenville, NC
Rocky Mount, NC
Virginia Beach-Norfolk-Newport News, VA-NC
Wilmington, NC
Metropolitan Area
Micropolitan Area50K
200K
600K
Industry Employment
Industry Employment in North CarolinaMetropolitan and Micropolitan Areas (est. 2007)
*Employment for North Carolina counties only**Only metropolitan areas identified
6
Defining North Carolina’s Three Primary Geographic Regions In addition to metropolitan, micropolitan and rural distinctions, this study also explores differences
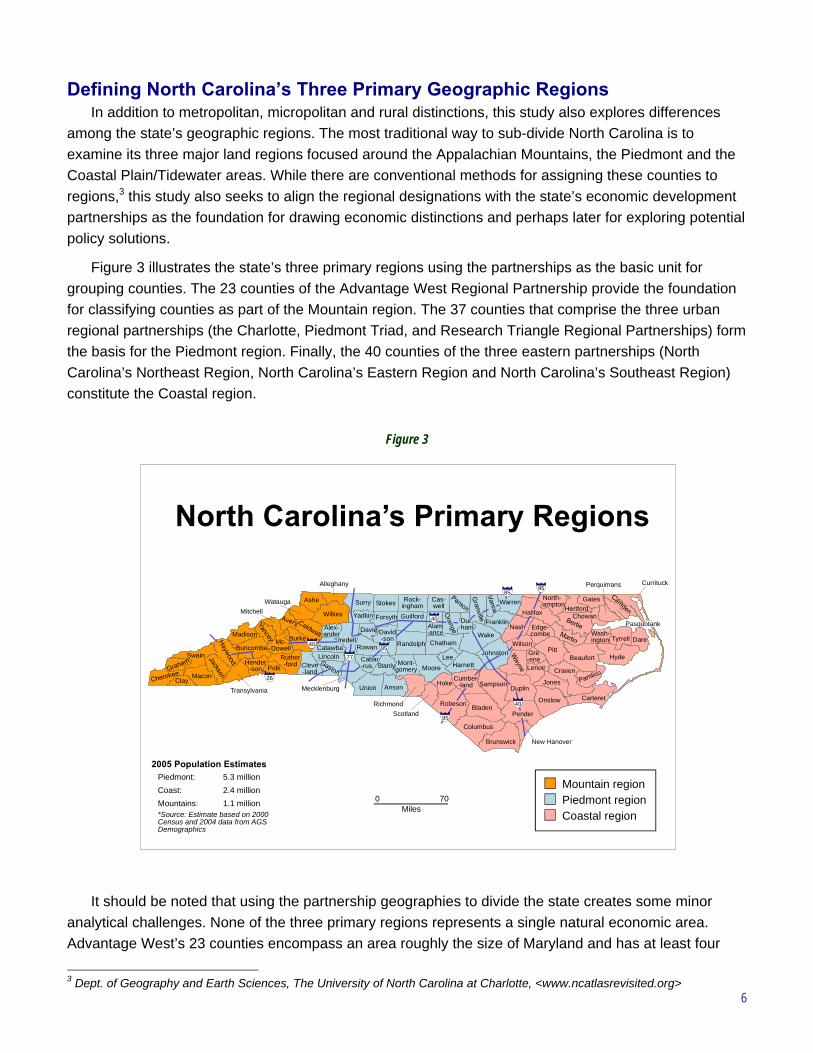
among the state’s geographic regions. The most traditional way to sub-divide North Carolina is to examine its three major land regions focused around the Appalachian Mountains, the Piedmont and the Coastal Plain/Tidewater areas. While there are conventional methods for assigning these counties to regions,3 this study also seeks to align the regional designations with the state’s economic development partnerships as the foundation for drawing economic distinctions and perhaps later for exploring potential policy solutions.
Figure 3 illustrates the state’s three primary regions using the partnerships as the basic unit for grouping counties. The 23 counties of the Advantage West Regional Partnership provide the foundation for classifying counties as part of the Mountain region. The 37 counties that comprise the three urban regional partnerships (the Charlotte, Piedmont Triad, and Research Triangle Regional Partnerships) form the basis for the Piedmont region. Finally, the 40 counties of the three eastern partnerships (North Carolina’s Northeast Region, North Carolina’s Eastern Region and North Carolina’s Southeast Region) constitute the Coastal region.
It should be noted that using the partnership geographies to divide the state creates some minor analytical challenges. None of the three primary regions represents a single natural economic area. Advantage West’s 23 counties encompass an area roughly the size of Maryland and has at least four
3 Dept. of Geography and Earth Sciences, The University of North Carolina at Charlotte, <www.ncatlasrevisited.org>
Figure 3
95
95
40
8577
26
40
40
85
Miles0 70
JohnstonWilson
Clay
Swain
Macon
Transylvania
Polk
Madison
BuncombeMc-
Dowell
MitchellWatauga Ashe
Alleghany
Wilkes
Burke
Ruther-ford Cleve
-land
LincolnCatawba
Alex-ander
Iredell
Surry Stokes
Yadkin
Davie
Rowan
Cabar-rus
Mecklenburg Union Anson
Forsyth
David-son
Rock-inghamGuilford
Randolph
Stanly Mont-gomery
RichmondScotland
Cas-well
Alam-anceChatham
LeeMoore
Dur-ham
Wake
Harnett
Hoke
Robeson
Columbus
Brunswick
Bladen
Cumber-land Sampson
New Hanover
Pender
Duplin
Onslow Carteret
Jones
Lenoir Craven
Gre-ene
Pitt
NashFranklin
WarrenHalifax
North-ampton
Edge-combe
Beaufort Hyde
DareTyrrellWash-ington
HertfordChowan
Gates
Perquimans
Pasquotank
Currituck
Hender-son
Mountain regionPiedmont regionCoastal region
2005 Population EstimatesPiedmont: 5.3 millionCoast: 2.4 millionMountains: 1.1 million*Source: Estimate based on 2000Census and 2004 data from AGSDemographics
North Carolina’s Primary Regions
7
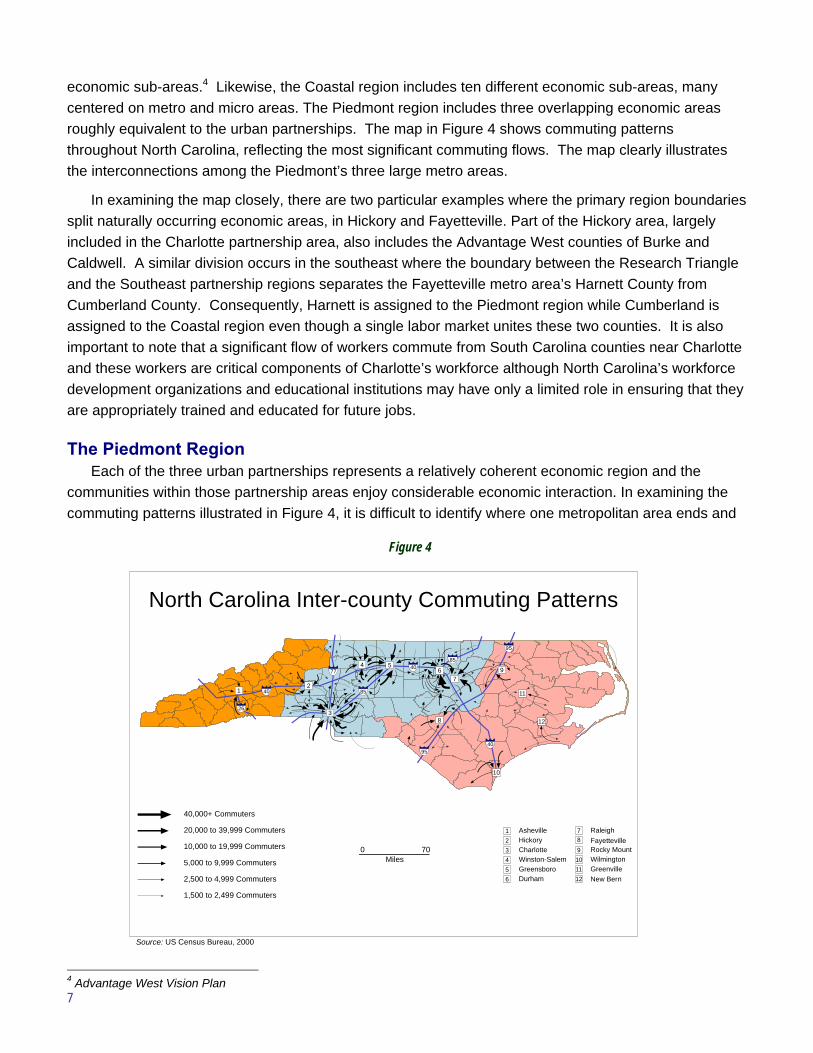
economic sub-areas.4 Likewise, the Coastal region includes ten different economic sub-areas, many centered on metro and micro areas. The Piedmont region includes three overlapping economic areas roughly equivalent to the urban partnerships. The map in Figure 4 shows commuting patterns throughout North Carolina, reflecting the most significant commuting flows. The map clearly illustrates the interconnections among the Piedmont’s three large metro areas.
In examining the map closely, there are two particular examples where the primary region boundaries split naturally occurring economic areas, in Hickory and Fayetteville. Part of the Hickory area, largely included in the Charlotte partnership area, also includes the Advantage West counties of Burke and Caldwell. A similar division occurs in the southeast where the boundary between the Research Triangle and the Southeast partnership regions separates the Fayetteville metro area’s Harnett County from Cumberland County. Consequently, Harnett is assigned to the Piedmont region while Cumberland is assigned to the Coastal region even though a single labor market unites these two counties. It is also important to note that a significant flow of workers commute from South Carolina counties near Charlotte and these workers are critical components of Charlotte’s workforce although North Carolina’s workforce development organizations and educational institutions may have only a limited role in ensuring that they are appropriately trained and educated for future jobs.
The Piedmont Region Each of the three urban partnerships represents a relatively coherent economic region and the
communities within those partnership areas enjoy considerable economic interaction. In examining the commuting patterns illustrated in Figure 4, it is difficult to identify where one metropolitan area ends and
4 Advantage West Vision Plan
Figure 4
95
12
3
4 56
7
8
9
12
10
11
9540
85
77
26
40
40
85
Asheville1Hickory2Charlotte3Winston-Salem4Greensboro5Durham6
7 Raleigh8 Fayetteville9 Rocky Mount10 Wilmington11 Greenville12 New Bern
40,000+ Commuters
20,000 to 39,999 Commuters
10,000 to 19,999 Commuters
5,000 to 9,999 Commuters
2,500 to 4,999 Commuters
1,500 to 2,499 Commuters
Miles0 70
Source: US Census Bureau, 2000
North Carolina Inter-county Commuting Patterns
8
another begins. Incorporating the state’s largest urban areas, the Piedmont drives much of North Carolina’s economy. Roughly 60 percent (5.3 million) of the state’s population resides in the region. About 3.3 million people work in the Piedmont region, representing 64 percent of the state’s workers. The Piedmont’s average earnings are $43,077 per year, exceeding the state average of $39,953 by almost 8 percent. Even though, the regions’ partnerships are relatively inter-connected, their economies each tend to focus on a different set of activities.
The 12-county Charlotte Regional Partnership includes the Charlotte metropolitan area as well as several smaller satellite cities. The region’s economy not only includes declining industries like textiles and furniture, but also advanced and emerging growth segments like financial services and motor sports. The Piedmont Triad includes the Winston Salem-Greensboro-High Point center, but it also includes a number of less urbanized rural counties. The Piedmont Triad area, more so than other parts of the Piedmont region, traditionally relied on mature industries such as furniture, apparel, textiles and tobacco for its economic base. As a result, the Piedmont Triad’s economy has been slower than the other two urban regions in making the necessary economic transformations. Similarly, the Research Triangle region’s center is Raleigh, Durham and Chapel Hill, but there are a number of outlying rural communities that also historically relied on textiles, apparel, and tobacco. The Research Triangle’s economic base has developed so that it now relies heavily on high value-added activities such as biotechnology, information technology and higher education. Raleigh’s role as the state capital also makes government employment and related activities a particularly significant component of the region’s economy.
The Coastal Region Roughly 2.4 million people live and 1.3 million people work in the Coastal region. This represents
about 27 percent of the state’s population and 25 percent of the workforce. The Coastal region’s average earnings, at $35,706 per year, represent only 89 percent of the state average and trail the state average by more than $4,000 annually. Tourism represents an important component of the region’s economy, building on assets such as the state’s barrier islands and the Atlantic coast. The tourism industry, however, tends to pay lower than average wages and offers jobs that are typically more seasonal in nature.
The Coast has also been one of the state’s leading agricultural regions, relying on tobacco, pork and poultry. Tobacco has historically been one of the region’s leading agricultural products, but livestock production also employs large numbers of workers. Manufacturing and distribution operations, particularly along I-95, offer another source of regional employment. The northeastern part of the region is especially dependent on tourism and agriculture. The low wages and seasonality of the work are part of the reason why it is one of North Carolina’s poorest regions.
The region’s significant military presence plays an important role in its economy. About one in nine workers, or 140,000 people, are employed at one of the Coastal region’s major military installations (i.e., Fort Bragg, Pope Air Force Base, Seymour Johnson Air Force Base, Cherry Point Naval Air Depot, and Camp Lejeune). The relatively good paying jobs associated with these bases help raise the region’s average earnings. Anecdotal evidence, based on interviews with military leaders, suggest that while some retiring military professionals stay in the area upon their retirement, many others leave the area due to the limited post-military occupational opportunities available for themselves or their spouses. That
9
said, the Coastal region, especially communities near the ocean, is becoming a destination for new residents seeking second or retirement homes.
The Mountain Region Of the three main geographic regions, the Mountain region has both the smallest population and the
lowest overall average earnings. The region has slightly more than one million residents and 570,821 jobs. Consequently, the area has 13 percent of the state’s people but only 11 percent of the state’s employment. Average earnings in the Mountains are $31,561 per year, or 79 percent of the state average. The Asheville metropolitan area is the region’s largest with roughly 400,000 people. Portions of the Hickory-Morganton-Lenoir metropolitan area located in the region also represent an important urban hub for the Foothills.
Communities in the Mountains are undergoing a significant economic transformation. Industries such as textiles and furniture manufacturing historically provided much of the region’s economic base, particularly in the Foothills area. These industries are in decline, creating economic hardships for workers and curtailing opportunities for those seeking new careers in the area.
Much like the Coast, tourism is one of the Mountain region’s fastest growing industries. Unfortunately, the work’s low wages and seasonal nature do not typically translate into economic prosperity for a large number of people. The area has also proven to be an attractive destination for retirees and second home buyers. These new residents bring money into the region and have contributed to a growing demand for jobs in key industries such as residential construction and retail.
State Workforce Demand and Supply
Workforce Demand This section examines the current industrial and occupational composition of the North Carolina
economy. The goal is to examine detailed geographic differences and long-term projected trends in the demand for new workers. The research focuses on estimated employment for 2007 and net new employment between 2007 and 2017 in order to identify future demand trends. The study also examines relevant geographic differences as well as explores detailed trends in the mix of industries and occupations.
About the Data To accomplish the study’s intended goals, data used were developed and provided through the
ReDYN economic forecasting model, published by Regional Dynamics.5 The analysts use this model in lieu of data provided by the North Carolina Employment Security Commission (NCESC), in part, because the proprietary model defines employment more broadly, projects employment for detailed industries and occupations through 2017, and estimates employment at the five-digit North American Industry Classification System (NAICS) level for all 100 North Carolina counties.
5 Unless otherwise described, employment estimates and projections were developed using an econometric model developed by Regional Dynamics, an economic forecasting firm. The model was developed by researchers at the University of Georgia for tax, transportation, and economic planning The base data set used in developing the estimates is the US Bureau of Economic Analysis with data estimates calibrated using US Bureau of Labor Statistics and US Census Bureau County Business Patterns (CBP). The ReDYN model includes employment estimates and projections of wage and salaried employment, proprietorships, military, farm, government, and certain private education institutions.
10
This workforce analysis recognizes the comprehensive definition of employment used by the US Bureau of Economic Analysis (BEA). The BEA definition builds on NCESC’s very sound snapshot of wage and salary employment and adds other kinds of employment not included in the NCESC reports. Under the US Bureau of Labor Statistics (BLS)-sponsored national labor market information program, NCESC reports employment using data from its administrative records created for the unemployment insurance program. Each quarter, the NCESC does a census of employees and payroll for companies participating in the program to compare the data against the taxes paid monthly. The Quarterly Census of Employment and Wages (QCEW) data collection program, sponsored by BLS, provides monthly updates based on firm payroll employment and taxes reports and offers the timeliest snapshot of state employment. Consequently, it is one of the most useful data sources in tracking current NC employment and wage patterns. NCESC does not, however, typically report information about employment for proprietors or other enterprises that do not participate in the unemployment insurance program. Even so, NCESC’s estimates represent about 80 to 85 percent of all employment within nine months of the initial business report to the government. Furthermore, the proportion of employees represented in the QCEW report is particularly high in certain sectors—such as manufacturing—but it is somewhat lower in others like construction, real estate, and government (especially military employment). NCESC provides the most vital foundation estimate for determining North Carolina’s employment estimates. NCESC data is integral to many other data estimates, but the US BEA measures a larger share of the total employment picture.
Annually, approximately 12 to 18 months after the end of the reporting year, the BEA reports all employment by industry using a variety of data sources including labor market information provided by NCESC and its sister agencies in other states, Internal Revenue Service proprietorship tax filings, and a variety of other data sources to develop the employment and earnings data required for calculating the national Gross Domestic Product and other BEA data products. In addition to proprietorships, BEA employment estimates data for farmers and farm workers, railroad workers, military personnel, and certain government agency employees that do not participate in the unemployment insurance program.
NCESC data is extremely valuable for describing the patterns and challenges facing many traditional employers. It is also useful in examining large geographic areas or broad industry groupings; however, one of the most significant drawbacks in using this data for this study’s purposes is that NCESC is precluded by law from releasing data at sufficient geographic or industry-level detail to meet the needs of this study. NCESC is legally restricted from disclosing data that could potentially reveal information about a specific firm. Thus, the publicly available information for certain industries with particularly large firms or related to county-level employment includes suppressions designed to protect the confidentiality of reporting firms.
This analysis required constructing multi-county data tables that required detailed data be available at an individual county level. Data suppressions in NCESC-provided reports are particularly problematic in obtaining industry detail for most North Carolina counties. Several proprietary enterprises encounter these challenges on a regular basis and have created algorithms designed to estimate the number of workers in a specific county and/or industry where data disclosure issues arise. The data used for this analysis was derived from one such model.
NCESC also provides very useful and soundly developed employment projections that recognize the broader employment definitions described earlier. The data available at the time of this analysis included
11
NCESC’s projections from 2002 to 2012. More recent data, based on 2004 employment estimates and including projections to 2014 were due for release by January 2007. Unfortunately, these NCESC projections also suffer from the data suppression limitations noted earlier. Furthermore, sub-state projections are made only at the workforce development board level. Thus, the projections available were not well aligned with the study’s needs since this analysis was aimed at understanding projected employment changes at the metropolitan, micropolitan, or rural area level as well as the economic development partnership level.
The Workforce Commission’s Policy Research and Assessment Committee (PRAC) and the consulting team felt that the broader US BEA definition of employment was most appropriate for this analysis. This decision was based on recent shifts in the North Carolina economy from its traditional
dependence on manufacturing to services, the growing importance of entrepreneurial enterprises as an employment source, and the critical role of military employment as an economic driver. The PRAC and consultants also felt that the projection period for this analysis should be at least 10 years into the future in order to help educational institutions, the State Workforce Commission, and local area workforce boards consider longer-term strategies for adjusting to the state’s changing economic realities. Finally, the PRAC and consultants were very interested in examining patterns and projections in detailed industries and geographies that could not be revealed by NCESC data due to state and federal data disclosure laws. Thus, the PRAC and consultants opted to utilize a data source that builds on NCESC data while also making efforts to address the acknowledged data limitations and concerns.
The US BEA does not make industry projections, and the data detail US BEA makes available at the sub-state level is limited. Thus, the PRAC and consulting team opted to explore the use of at least two proprietary data sets. Both benchmarked their estimates to the data provided by the US Bureau of Economic Analysis. Researchers who developed the ReDYN® model, which provides much of the projections data used in this report, calibrate their individual county-level industry estimates to BEA benchmarks using a combination of data sources, including the US Census Bureau County Business Patterns annual business survey data (which reports ranges of employment for industries where disclosure issues arise), North Carolina Employment Security Commission and US Bureau of Labor
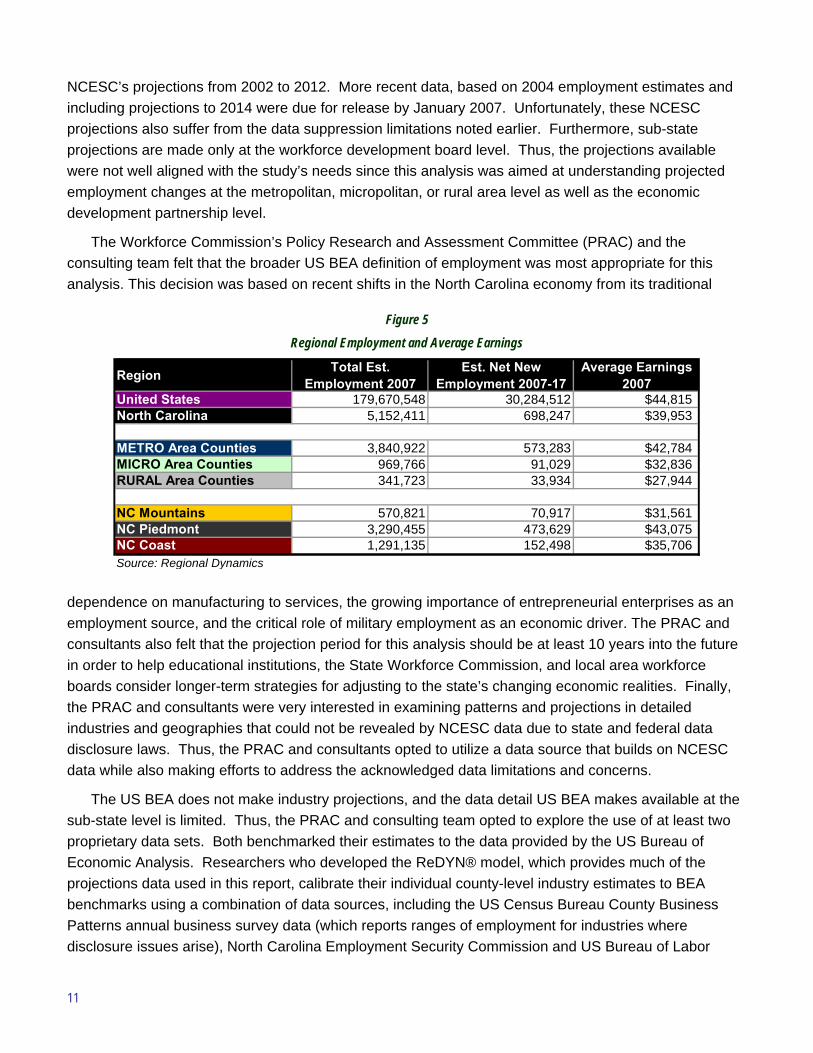
Figure 5 Regional Employment and Average Earnings
Region Total Est. Employment 2007
Est. Net New Employment 2007-17
Average Earnings 2007
United States 179,670,548 30,284,512 $44,815North Carolina 5,152,411 698,247 $39,953
METRO Area Counties 3,840,922 573,283 $42,784MICRO Area Counties 969,766 91,029 $32,836RURAL Area Counties 341,723 33,934 $27,944
NC Mountains 570,821 70,917 $31,561NC Piedmont 3,290,455 473,629 $43,075NC Coast 1,291,135 152,498 $35,706Source: Regional Dynamics
12
Statistics forecasts, as well as data from the US Bureau of Economic Analysis’s Regional Economic Information Systems data.
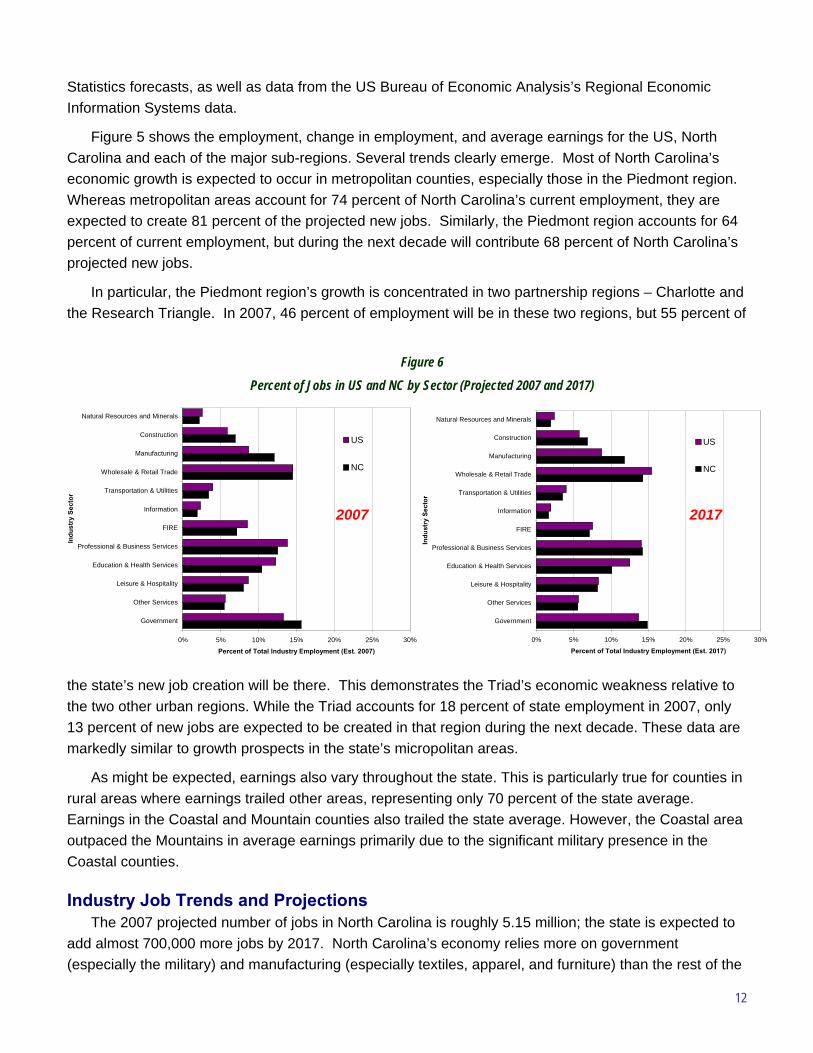
Figure 5 shows the employment, change in employment, and average earnings for the US, North Carolina and each of the major sub-regions. Several trends clearly emerge. Most of North Carolina’s economic growth is expected to occur in metropolitan counties, especially those in the Piedmont region. Whereas metropolitan areas account for 74 percent of North Carolina’s current employment, they are expected to create 81 percent of the projected new jobs. Similarly, the Piedmont region accounts for 64 percent of current employment, but during the next decade will contribute 68 percent of North Carolina’s projected new jobs.
In particular, the Piedmont region’s growth is concentrated in two partnership regions – Charlotte and the Research Triangle. In 2007, 46 percent of employment will be in these two regions, but 55 percent of
the state’s new job creation will be there. This demonstrates the Triad’s economic weakness relative to the two other urban regions. While the Triad accounts for 18 percent of state employment in 2007, only 13 percent of new jobs are expected to be created in that region during the next decade. These data are markedly similar to growth prospects in the state’s micropolitan areas.
As might be expected, earnings also vary throughout the state. This is particularly true for counties in rural areas where earnings trailed other areas, representing only 70 percent of the state average. Earnings in the Coastal and Mountain counties also trailed the state average. However, the Coastal area outpaced the Mountains in average earnings primarily due to the significant military presence in the Coastal counties.
Industry Job Trends and Projections The 2007 projected number of jobs in North Carolina is roughly 5.15 million; the state is expected to
add almost 700,000 more jobs by 2017. North Carolina’s economy relies more on government (especially the military) and manufacturing (especially textiles, apparel, and furniture) than the rest of the
Figure 6 Percent of Jobs in US and NC by Sector (Projected 2007 and 2017)
0% 5% 10% 15% 20% 25% 30%
Government
Other Services
Leisure & Hospitality
Education & Health Services
Professional & Business Services
FIRE
Information
Transportation & Utilities
Wholesale & Retail Trade
Manufacturing
Construction
Natural Resources and Minerals
Indu
stry
Sec
tor
Percent of Total Industry Employment (Est. 2007)
US
NC
0% 5% 10% 15% 20% 25% 30%
Government
Other Services
Leisure & Hospitality
Education & Health Services
Professional & Business Services
FIRE
Information
Transportation & Utilities
Wholesale & Retail Trade
Manufacturing
Construction
Natural Resources and MineralsIn
dust
ry S
ecto
r
Percent of Total Industry Employment (Est. 2017)
US
NC
2007 2017
13
US. Figure 6 shows that whereas manufacturing accounts for 8.7 percent of all jobs nationwide, it represents 12 percent of all jobs in North Carolina. This reliance on manufacturing is even more pronounced in the state’s micropolitan and rural areas, where manufacturing employment contributes 14.9 percent and 16.5 percent of all employment, respectively. Manufacturing in the Piedmont Triad represents 15.6 percent of all employment. According to both the forecasted data provided here and additional analysis using US Bureau of Economic Analysis data, the military represents about 16 percent of all government employment in North Carolina while the military represents about 8.5 percent of government employment nationally.
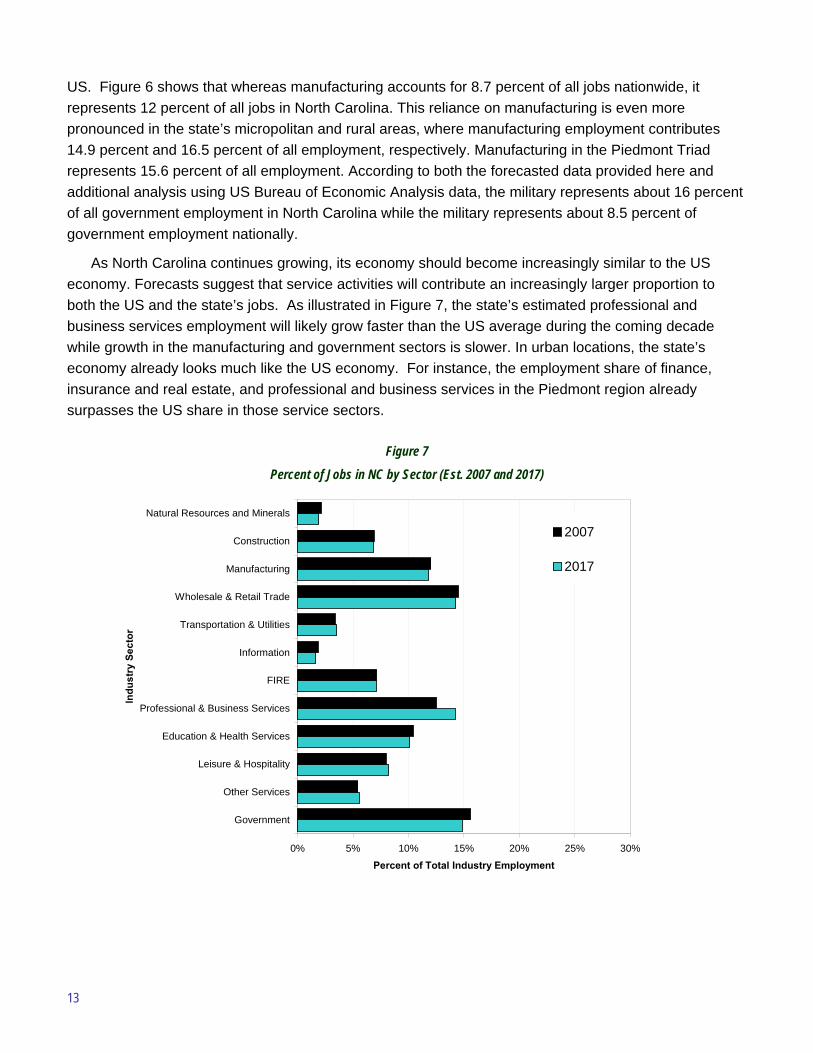
As North Carolina continues growing, its economy should become increasingly similar to the US economy. Forecasts suggest that service activities will contribute an increasingly larger proportion to both the US and the state’s jobs. As illustrated in Figure 7, the state’s estimated professional and business services employment will likely grow faster than the US average during the coming decade while growth in the manufacturing and government sectors is slower. In urban locations, the state’s economy already looks much like the US economy. For instance, the employment share of finance, insurance and real estate, and professional and business services in the Piedmont region already surpasses the US share in those service sectors.
Figure 7 Percent of Jobs in NC by Sector (Est. 2007 and 2017)
0% 5% 10% 15% 20% 25% 30%
Government
Other Services
Leisure & Hospitality
Education & Health Services
Professional & Business Services
FIRE
Information
Transportation & Utilities
Wholesale & Retail Trade
Manufacturing
Construction
Natural Resources and Minerals
Indu
stry
Sec
tor
Percent of Total Industry Employment
2007
2017
14
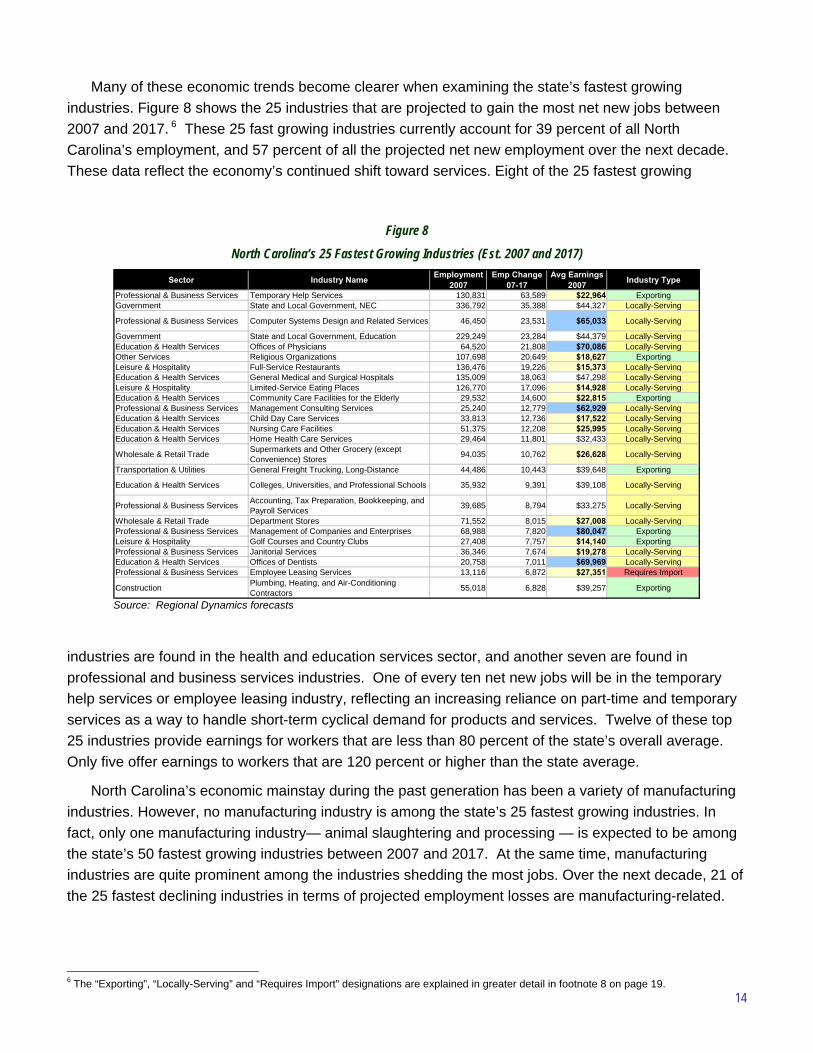
Many of these economic trends become clearer when examining the state’s fastest growing industries. Figure 8 shows the 25 industries that are projected to gain the most net new jobs between 2007 and 2017. 6 These 25 fast growing industries currently account for 39 percent of all North Carolina’s employment, and 57 percent of all the projected net new employment over the next decade. These data reflect the economy’s continued shift toward services. Eight of the 25 fastest growing
industries are found in the health and education services sector, and another seven are found in professional and business services industries. One of every ten net new jobs will be in the temporary help services or employee leasing industry, reflecting an increasing reliance on part-time and temporary services as a way to handle short-term cyclical demand for products and services. Twelve of these top 25 industries provide earnings for workers that are less than 80 percent of the state’s overall average. Only five offer earnings to workers that are 120 percent or higher than the state average.
North Carolina’s economic mainstay during the past generation has been a variety of manufacturing industries. However, no manufacturing industry is among the state’s 25 fastest growing industries. In fact, only one manufacturing industry— animal slaughtering and processing — is expected to be among the state’s 50 fastest growing industries between 2007 and 2017. At the same time, manufacturing industries are quite prominent among the industries shedding the most jobs. Over the next decade, 21 of the 25 fastest declining industries in terms of projected employment losses are manufacturing-related.
6 The “Exporting”, “Locally-Serving” and “Requires Import” designations are explained in greater detail in footnote 8 on page 19.
Figure 8 North Carolina’s 25 Fastest Growing Industries (Est. 2007 and 2017)
Sector Industry Name Employment 2007
Emp Change 07-17
Avg Earnings 2007 Industry Type
Professional & Business Services Temporary Help Services 130,831 63,589 $22,964 ExportingGovernment State and Local Government, NEC 336,792 35,388 $44,327 Locally-Serving
Professional & Business Services Computer Systems Design and Related Services 46,450 23,531 $65,033 Locally-Serving
Government State and Local Government, Education 229,249 23,284 $44,379 Locally-ServingEducation & Health Services Offices of Physicians 64,520 21,808 $70,086 Locally-ServingOther Services Religious Organizations 107,698 20,649 $18,627 ExportingLeisure & Hospitality Full-Service Restaurants 136,476 19,226 $15,373 Locally-ServingEducation & Health Services General Medical and Surgical Hospitals 135,009 18,063 $47,298 Locally-ServingLeisure & Hospitality Limited-Service Eating Places 126,770 17,096 $14,928 Locally-ServingEducation & Health Services Community Care Facilities for the Elderly 29,532 14,600 $22,815 ExportingProfessional & Business Services Management Consulting Services 25,240 12,779 $62,929 Locally-ServingEducation & Health Services Child Day Care Services 33,813 12,736 $17,522 Locally-ServingEducation & Health Services Nursing Care Facilities 51,375 12,208 $25,995 Locally-ServingEducation & Health Services Home Health Care Services 29,464 11,801 $32,433 Locally-Serving
Wholesale & Retail Trade Supermarkets and Other Grocery (except Convenience) Stores 94,035 10,762 $26,628 Locally-Serving
Transportation & Utilities General Freight Trucking, Long-Distance 44,486 10,443 $39,648 Exporting
Education & Health Services Colleges, Universities, and Professional Schools 35,932 9,391 $39,108 Locally-Serving
Professional & Business Services Accounting, Tax Preparation, Bookkeeping, and Payroll Services 39,685 8,794 $33,275 Locally-Serving
Wholesale & Retail Trade Department Stores 71,552 8,015 $27,008 Locally-ServingProfessional & Business Services Management of Companies and Enterprises 68,988 7,820 $80,047 ExportingLeisure & Hospitality Golf Courses and Country Clubs 27,408 7,757 $14,140 ExportingProfessional & Business Services Janitorial Services 36,346 7,674 $19,278 Locally-ServingEducation & Health Services Offices of Dentists 20,758 7,011 $69,969 Locally-ServingProfessional & Business Services Employee Leasing Services 13,116 6,872 $27,351 Requires Import
Construction Plumbing, Heating, and Air-Conditioning Contractors 55,018 6,828 $39,257 Exporting
Source: Regional Dynamics forecasts
15
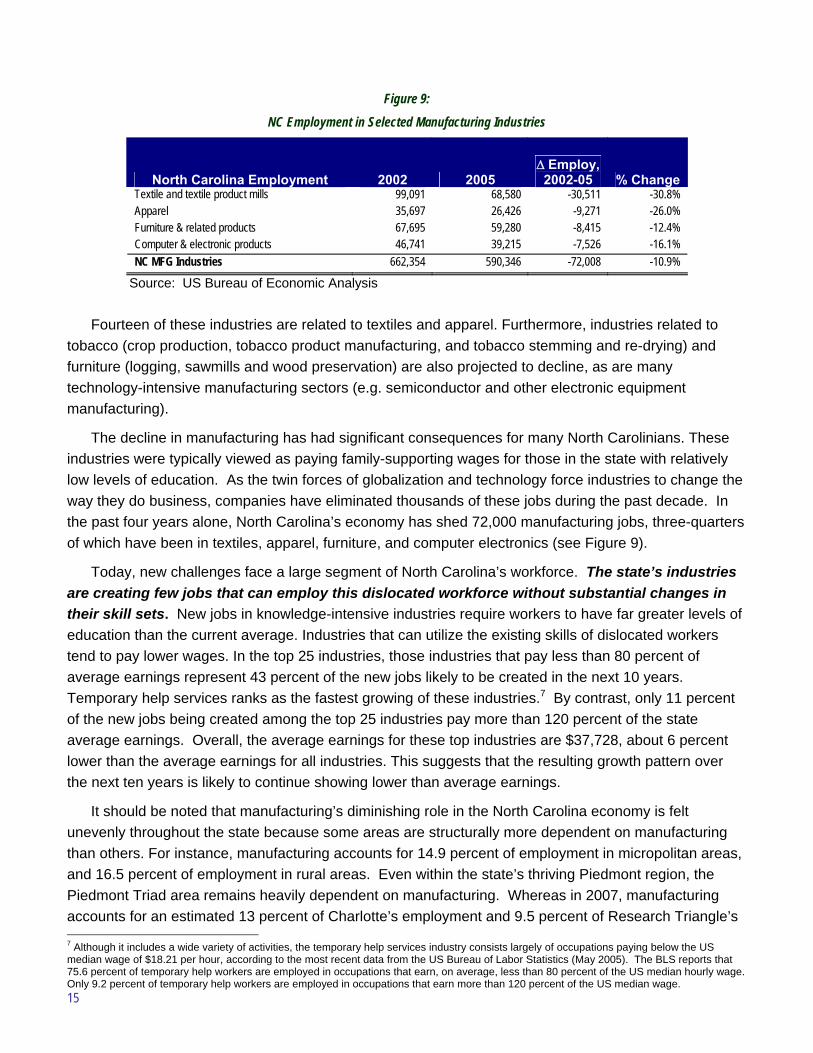
Fourteen of these industries are related to textiles and apparel. Furthermore, industries related to tobacco (crop production, tobacco product manufacturing, and tobacco stemming and re-drying) and furniture (logging, sawmills and wood preservation) are also projected to decline, as are many technology-intensive manufacturing sectors (e.g. semiconductor and other electronic equipment manufacturing).
The decline in manufacturing has had significant consequences for many North Carolinians. These industries were typically viewed as paying family-supporting wages for those in the state with relatively low levels of education. As the twin forces of globalization and technology force industries to change the way they do business, companies have eliminated thousands of these jobs during the past decade. In the past four years alone, North Carolina’s economy has shed 72,000 manufacturing jobs, three-quarters of which have been in textiles, apparel, furniture, and computer electronics (see Figure 9).
Today, new challenges face a large segment of North Carolina’s workforce. The state’s industries are creating few jobs that can employ this dislocated workforce without substantial changes in their skill sets. New jobs in knowledge-intensive industries require workers to have far greater levels of education than the current average. Industries that can utilize the existing skills of dislocated workers tend to pay lower wages. In the top 25 industries, those industries that pay less than 80 percent of average earnings represent 43 percent of the new jobs likely to be created in the next 10 years. Temporary help services ranks as the fastest growing of these industries.7 By contrast, only 11 percent of the new jobs being created among the top 25 industries pay more than 120 percent of the state average earnings. Overall, the average earnings for these top industries are $37,728, about 6 percent lower than the average earnings for all industries. This suggests that the resulting growth pattern over the next ten years is likely to continue showing lower than average earnings.
It should be noted that manufacturing’s diminishing role in the North Carolina economy is felt unevenly throughout the state because some areas are structurally more dependent on manufacturing than others. For instance, manufacturing accounts for 14.9 percent of employment in micropolitan areas, and 16.5 percent of employment in rural areas. Even within the state’s thriving Piedmont region, the Piedmont Triad area remains heavily dependent on manufacturing. Whereas in 2007, manufacturing accounts for an estimated 13 percent of Charlotte’s employment and 9.5 percent of Research Triangle’s 7 Although it includes a wide variety of activities, the temporary help services industry consists largely of occupations paying below the US median wage of $18.21 per hour, according to the most recent data from the US Bureau of Labor Statistics (May 2005). The BLS reports that 75.6 percent of temporary help workers are employed in occupations that earn, on average, less than 80 percent of the US median hourly wage. Only 9.2 percent of temporary help workers are employed in occupations that earn more than 120 percent of the US median wage.
Figure 9: NC Employment in Selected Manufacturing Industries
North Carolina Employment 2002 2005 Δ Employ, 2002-05 % Change
Textile and textile product mills 99,091 68,580 -30,511 -30.8% Apparel 35,697 26,426 -9,271 -26.0% Furniture & related products 67,695 59,280 -8,415 -12.4% Computer & electronic products 46,741 39,215 -7,526 -16.1% NC MFG Industries 662,354 590,346 -72,008 -10.9%
Source: US Bureau of Economic Analysis
16
employment, this sector still represents 15.6 percent of the Piedmont Triad’s total industry employment. Of course, these manufacturing jobs are not all in the traditional manufacturing industries of tobacco production, textiles, apparel, and furniture. However, even excluding those industries, the Piedmont Triad still has a greater proportion of manufacturing-related employment than any other area in the state. Structurally, the Piedmont Triad’s economic sectoral composition closely resembles many of the state’s micropolitan areas, and not surprisingly the area is enduring many of the same transitional challenges as smaller manufacturing-dependent communities.
Appendix 2 lists North Carolina’s 200 fastest growing industries. Some of these industries have a higher concentration of employees in North Carolina than nationally.8 These highly concentrated industries are said to have enough workers to produce more than enough of their goods or services to serve the state’s needs so it is expected that they export beyond the state boundaries. These “exporting” industries are particularly interesting for economic development purposes because their relatively high concentration is a sign that the state may have a competitive advantage in attracting and retaining companies in those economic sectors. In selling their goods or services outside the state, exporting industries bring new money into the state.
North Carolina’s exporting industries include those related to animal slaughtering and processing, as well as pharmaceutical and medicine manufacturing. Slightly more than 26 percent of the 2007 projected jobs in the top 200 industries are categorized as export-oriented. This group is expected to grow faster than other parts of the economy, accounting for 29 percent of the new jobs created during the next decade. Exporting oriented industries offer above average earnings at $43,029, but the fastest growing exporting industries offer average earnings of only $37,427. Most of this discrepancy is driven by the anticipated growth in temporary help services, religious organizations, and elderly care facilities.
Other industries leak wealth because so few workers are involved in them that state businesses and consumers are expected to have to “import” the industry’s goods or services from elsewhere. Economic developers are concerned about these industries because they represent potential increased economic activity that could improve the competitiveness of local firms or serve local businesses or residents. Industries that seem to be particularly underdeveloped in North Carolina include employee leasing services; outpatient care centers; vocational rehabilitation services; data processing services; services for the elderly and persons with disabilities; machinery equipment rental; and telephone call centers. These industries are growing at some of the fastest rates, sometimes to meet the growing demand of the local population as well as to capture leakages from the state’s economy. These and similar industries account for about 3 percent of the top 200 jobs, but will represent about 5 percent of the new jobs being created during the next decade. On average, these jobs are projected to pay about $45,735 in 2007 estimated earnings, but the fastest growing industries tend to pay much lower with average earnings expected to be $36,127.
A third category of industry, designated as “locally serving,” generates employment as a share of the total economy at a ratio that resembles the national share. Locally serving industries create employment, but they are more apt to capture existing money recycling through the economy than to bring new money 8 These industry concentrations are frequently referred to as “location quotients” or LQs. LQs represent a ratio of each North Carolina industry as a share of the state’s employment compared with a similar ratio of that same industry’s national employment total as a share of all US employment. An LQ of 1.2 or higher was used to designate “exporting” industries and an LQ of 0.6 was used to designate “requires importing” industries. Industries with LQs between 0.6 and 1.2 represent the group identified as “locally serving.” Each of the top 200 industries is categorized in Appendix 1.
17
into the state. In addition, their growth tends to be most closely correlated to population growth. Activities such as healthcare and retail are frequently considered locally serving industries. However, on occasions, these sectors may differ in certain communities. For instance, large factory outlet malls or retail targeted to tourists such as Concord Mills may attract shopping dollars from people who live outside the region. Specialized healthcare facilities or advanced hospitals like the Duke or UNC medical centers may provide very specialized care and therefore attract patients from across the nation. On the whole, however, these examples represent exceptions to the norm.
Locally serving industries account for 71 percent of all jobs in the top 200 industries, but only about two-thirds of the jobs being created during the next decade. These industries are sizable and many are growing at a moderate pace, driven by the state’s population growth rather than by any comparative economic advantage. Not surprisingly, the state’s locally serving industries tend to grow most and fastest where the population is large and growing fastest—mainly the metropolitan areas and the Piedmont region. Overall, average earnings for locally serving industries are slightly below average at a projected $38,077 for 2007.
This approach to categorizing the industries of the economy into three broad areas is useful as a way to help economic and workforce developers better understand their respective differences. From the workforce perspective, the interest is in finding a large number of jobs that require moderate skills or moderate training to improve the skills of the workforce, no matter the industry. Thus, their efforts frequently focus on supporting locally serving industries where the number of jobs being created is higher, and the pay for new jobs is expected to be slightly higher. From the economic development perspective, the efforts focus on identifying the largest and best paying sectors that export goods and services or that replace goods and services currently being imported into the state. The job numbers associated with these industries may well be relatively small because the focus is on new wealth creation or retention. Due to their differing goals, the industries and occupations of interest to economic and workforce developers are not always the same.
Occupational Employment Trends and Projections The occupational data mirror many of the trends illustrated in the industry data. Notably, the
projections show strong growth in healthcare and services-related occupations and steep declines in the occupations related to traditional manufacturing industries such as textiles and apparel. These data also show a strong relationship between educational attainment and earnings. To demonstrate these trends, we organized the occupational data according to the 11 different categories used by the US Bureau of Labor Statistics (BLS). These categories identify the most common educational attainment requirements for each of several hundred occupations.9 Seven of these categories involve formalized postsecondary education, while the other four categories are based on work experience and on-the-job training (OJT). In some cases, high school completion is a pre-requisite for training while in others high school completion is not required to receive training. For our purposes, however, eleven categories were too many. Consequently, we collapsed the 11 BLS categories into six different ‘education bands’ designed to allow us to make comparisons with available labor supply categorizations made by the Census Bureau. Census gathers data on educational attainment for potential workers among citizens age 25 and older. The bands used for analyzing occupational trends and projections are:
9 For more detail about these 11 occupational education requirements see: http://www.bls.gov/emp/optd/optd004.pdf.
18
• Band 1: Advanced Degree — Occupations requiring advanced degrees (e.g., Ph.D., MA/MS) or professional degrees (e.g., MD, JD)
• Band 2: Four-year College Degree — Occupations requiring either a baccalaureate degree or a bachelor’s degree plus experience
• Band 3: Tech-Some Post — Occupations requiring either an associate degree or some kind of postsecondary vocational award or certification as well as those that typically require some college but may not require a degree
• Band 4: High School Diploma/GED and Some Experience — Occupations requiring at least a high school diploma or a general educational development (GED) degree and significant work experience and more than a year of on-the-job training (OJT)
• Band 5: High School Diploma/GED Entry Level — Occupations requiring at least a high school diploma or GED plus moderate-term OJT (typically more than one month, but less than one year)
• Band 6: Below GED — Occupations requiring short-term OJT (less than one month); few of these occupations require a high school diploma
The first two bands are considered the best, high wage jobs. These bands include the knowledge-intensive jobs associated with an economy increasingly driven by high-end business services. Conversely, the jobs in the last band ‘Below GED’ are those that require little skill or training and often pay well below average. Therefore, workers often face difficulty earning a family-sustaining wage while working one of these jobs.
Bands 4 and 5—GED-Some Experience and GED Entry Level—have traditionally been the occupations that were the backbone of North Carolina’s workforce. These ‘Traditional Middle Jobs’ typically provided decent wages for people with relatively limited levels of educational attainment. Unfortunately, many of these occupations are found in mature industries such as textiles, apparel and furniture manufacturing. They continue to be important to the state, but globalization and technological changes have reduced the demand for jobs in these occupations significantly.
Consequently, growth is occurring rapidly among the higher end jobs and those in occupations in Band 3. Combined, the occupations in Band 3 and 4 constitute what one might describe as the ’New Middle Jobs.’ These occupations increasingly require advanced skills so workers need more training to attain and keep their jobs. For instance, the growing prevalence of advanced manufacturing techniques demands more technology skills and knowledge for people in production occupations. Similarly, the use of just-in-time delivery systems requires workers in logistics and distribution occupations to increase their math and IT skills. New middle jobs requires workers who may be currently employed in traditional middle jobs to invest in significant up-skilling to retain their employment or to move into the new middle jobs. Those that do not make the investment or whose companies do not adapt, run the risk of falling behind. Increasingly, those that do not adapt are losing their jobs and settling for re-employment opportunities in one of the low skill occupations in Band 6—Below GED.
Key Occupations by Employment Band By allocating occupations to each of these six bands, workforce professionals can project which
types of occupations will need to be filled, the level of compensation likely to be available, and the number of workers that will be required over the next ten years at each educational level. Figure 10 provides a snapshot summary of the proportion of the state and national workforce found in occupations at each of these educational bands.
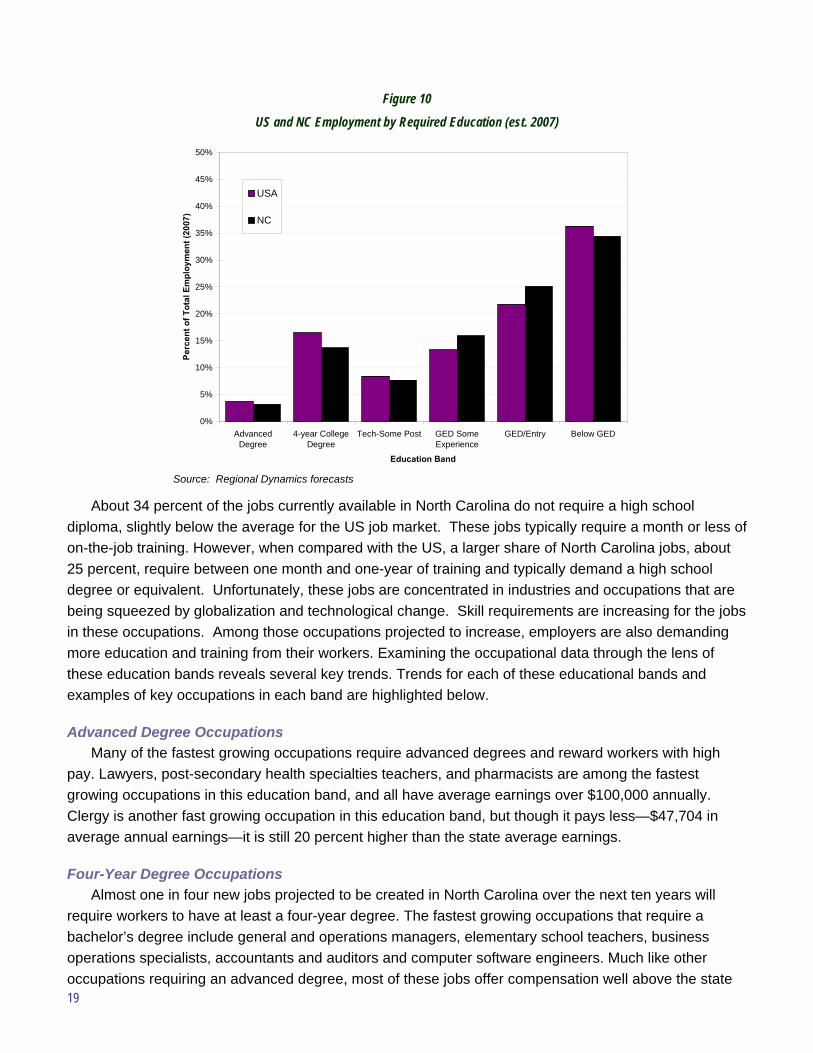
19
About 34 percent of the jobs currently available in North Carolina do not require a high school diploma, slightly below the average for the US job market. These jobs typically require a month or less of on-the-job training. However, when compared with the US, a larger share of North Carolina jobs, about 25 percent, require between one month and one-year of training and typically demand a high school degree or equivalent. Unfortunately, these jobs are concentrated in industries and occupations that are being squeezed by globalization and technological change. Skill requirements are increasing for the jobs in these occupations. Among those occupations projected to increase, employers are also demanding more education and training from their workers. Examining the occupational data through the lens of these education bands reveals several key trends. Trends for each of these educational bands and examples of key occupations in each band are highlighted below.
Advanced Degree Occupations Many of the fastest growing occupations require advanced degrees and reward workers with high
pay. Lawyers, post-secondary health specialties teachers, and pharmacists are among the fastest growing occupations in this education band, and all have average earnings over $100,000 annually. Clergy is another fast growing occupation in this education band, but though it pays less—$47,704 in average annual earnings—it is still 20 percent higher than the state average earnings.
Four-Year Degree Occupations Almost one in four new jobs projected to be created in North Carolina over the next ten years will
require workers to have at least a four-year degree. The fastest growing occupations that require a bachelor’s degree include general and operations managers, elementary school teachers, business operations specialists, accountants and auditors and computer software engineers. Much like other occupations requiring an advanced degree, most of these jobs offer compensation well above the state
Figure 10 US and NC Employment by Required Education (est. 2007)
0%
5%
10%
15%
20%
25%
30%
35%
40%
45%
50%
AdvancedDegree
4-year CollegeDegree
Tech-Some Post GED SomeExperience
GED/Entry Below GED
Education Band
Perc
ent o
f Tot
al E
mpl
oym
ent (
2007
)USA
NC
Source: Regional Dynamics forecasts
20
average. Although the growth of Charlotte’s financial sector adds to the number of accountants and auditors and Research Triangle’s information technology industry boosts the number of software engineers, employment growth for occupations like managers and teachers will depend on the state’s continued population growth.
Technical Degree and Some Post-Secondary Education Degree Occupations Given the healthcare industry’s rapid growth, it should surprise no one that many of the fastest
growing occupations in this education band relate to that industry. For instance, Registered Nurses (RNs) represent the fastest growing occupational category among those requiring at least a two-year degree or some kind of postsecondary vocational award.10 Currently, the state employs an estimated 90,916 RNs and will need to add another 24,308 over the next decade to meet its projected demand. To put this in context, these forecasts suggest that registered nurses will account for 3.5 percent of the state’s net new jobs between 2007 and 2017. With average earnings of $61,347, RNs are also one of the best paying occupations within this education band. The growing demand for healthcare workers includes a call for new RNs and Licensed Practical and Licensed Vocational Nurses (LPN/LVNs). There are currently an estimated 20,147 LPN/LVNs working in the state, with a demand for 4,430 more LPN/LVNs over the next decade.
Healthcare-related occupations are not the only fast growing occupations in this education band. In addition to health care workers, North Carolina will need more than 13,000 new preschool teachers. The state will also require more than 5,300 net new computer support specialists. It will also require roughly 5,300 automotive service technicians and mechanics and 2,200 bus and truck mechanics and diesel engine specialists. Moreover, there will be a growing demand for many workers—such as electrical and electronic engineering technicians--necessary to support the state’s increasingly sophisticated manufacturing industry. These occupations represent a significant component of the state’s new middle jobs.
High School Diploma/GED and Some Experience The occupations within the three education bands described above all require workers to possess
some kind of postsecondary training. The next three education bands require varying degrees of work-related experience and on-the-job training (OJT). The fastest growing occupations that fall in this “GED/Some Experience” education band include team-supervisor or skilled-trades occupations. Four of the six fastest growing occupations in this education band are supervisors and managers in areas such as construction, retail, food preparation, and maintenance. Construction trades supervisors (at an average of $53,210 in 2007) earn nearly two-thirds more than food service supervisors (at an average of $31,652). In addition, two other fast growing occupations are carpenters and electricians. The state will need an estimated 6,428 net new carpenters and 3,688 net new electricians over the next decade. These trades occupations typically require long-term work experience and they represent, much like the jobs requiring a 2-year degree, a large segment of the state’s new middle jobs. The workers in these occupations are vital for the state to maintain its current pace of growth as well as preserving many workers’ standard of living. That said, this band also includes many of the fastest declining occupations,
10 This represents the minimum degree required for many nursing positions. According to a 2005 US Bureau of Labor Statistics survey, 58% of nurses aged 25-44 have a bachelor’s degree or higher. In addition, many employers are increasingly requiring four-year nursing degrees of their job applicants.
21
and most are expected to continue their decline into the next ten years. Corresponding with declines in the state’s textile industry, one occupation alone – textile knitting and weaving machine setters, operators, and tenders – is projected to lose another 38,000 jobs in the next ten years.
High School Diploma/GED Entry Level Unlike the majority of the occupations described above, most of the occupations falling within the
GED/Entry Level education band pay below the state average earnings. One notable exception is heavy and tractor-trailer truck drivers. North Carolina now has an estimated 78,832 truck drivers and will need another 19,029 net new truck drivers over the next ten years. The average earnings for truck drivers are $40,659 per year, roughly $1,000 more than the state average. Other fast growing occupations in this educational band include customer service representatives, general installation and repair workers, and team assemblers. In fact, team assemblers comprise the state’s fastest growing production-related occupation, as represented by the increased hiring for major facilities like Dell in the Triad area. Not surprisingly, certain occupations within the “High School/GED Entry-Level” education occupation band are projected to decline. North Carolina manufacturers are expected to shed another 56,000 of the 155,000 remaining machine operator and tender jobs in the textile and apparel industries during the next ten years.
Below GED Occupations Occupations within the “Below GED” education band are among the state’s fastest growing. Many of
these jobs are found in retail occupations, where the state will add roughly 25,000 net new salespersons between 2007 and 2017. Food service employees are also high growth occupations. Healthcare employment growth will also be responsible for generating a large number of new low-skill jobs. For instance, the state will add approximately 21,150 home health aides and 13,115 nursing aides, orderlies, and attendants over the next decade. There are also several occupations in this education band that are expected to decline, again related to losses in the manufacturing sector. The anticipated losses in these occupations are not nearly as dramatic as the textiles-related losses anticipated in the two bands discussed earlier. Instead, occupations such as utility meter readers or order clerks are losing jobs as a direct result of automation.
In general, the majority of America’s and North Carolina’s jobs can be found in the last two educational bands (“High School/GED Entry-Level” and “Below GED” occupations), but a growing number of jobs require formal college experience or long-term job training. The greatest job losses are occurring among jobs that do not require formal college education. When compared with the United States, North Carolina has a higher concentration of its workforce in these occupations. The evidence suggests that new jobs being created are more likely to require higher education and will demand more from their workers in terms of education levels. Appendix 3 provides more detail about the fastest growing and declining occupations.
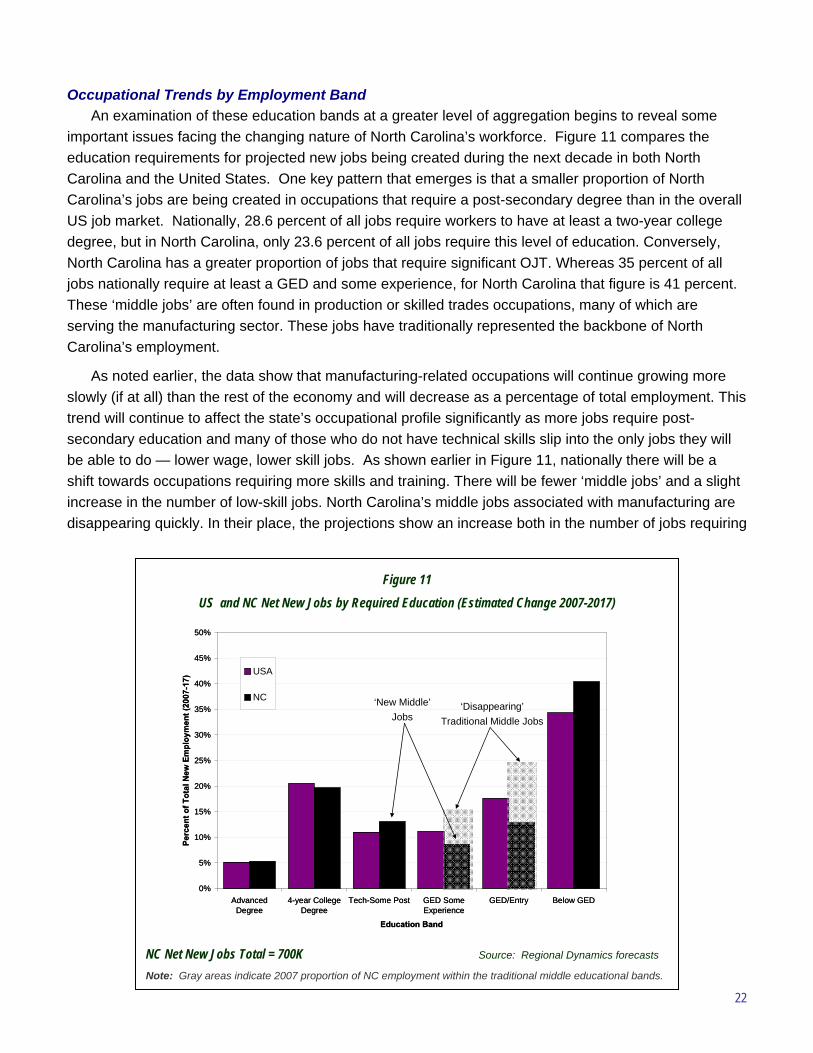
22
Occupational Trends by Employment Band An examination of these education bands at a greater level of aggregation begins to reveal some
important issues facing the changing nature of North Carolina’s workforce. Figure 11 compares the education requirements for projected new jobs being created during the next decade in both North Carolina and the United States. One key pattern that emerges is that a smaller proportion of North Carolina’s jobs are being created in occupations that require a post-secondary degree than in the overall US job market. Nationally, 28.6 percent of all jobs require workers to have at least a two-year college degree, but in North Carolina, only 23.6 percent of all jobs require this level of education. Conversely, North Carolina has a greater proportion of jobs that require significant OJT. Whereas 35 percent of all jobs nationally require at least a GED and some experience, for North Carolina that figure is 41 percent. These ‘middle jobs’ are often found in production or skilled trades occupations, many of which are serving the manufacturing sector. These jobs have traditionally represented the backbone of North Carolina’s employment.
As noted earlier, the data show that manufacturing-related occupations will continue growing more slowly (if at all) than the rest of the economy and will decrease as a percentage of total employment. This trend will continue to affect the state’s occupational profile significantly as more jobs require post-secondary education and many of those who do not have technical skills slip into the only jobs they will be able to do — lower wage, lower skill jobs. As shown earlier in Figure 11, nationally there will be a shift towards occupations requiring more skills and training. There will be fewer ‘middle jobs’ and a slight increase in the number of low-skill jobs. North Carolina’s middle jobs associated with manufacturing are disappearing quickly. In their place, the projections show an increase both in the number of jobs requiring
Figure 11 US and NC Net New Jobs by Required Education (Estimated Change 2007-2017)
0%
5%
10%
15%
20%
25%
30%
35%
40%
45%
50%
AdvancedDegree
4-year CollegeDegree
Tech-Some Post GED SomeExperience
GED/Entry Below GED
Education Band
Perc
ent o
f Tot
al N
ew E
mpl
oym
ent (
2007
-17)
USA
NC‘Disappearing’
Traditional Middle Jobs
‘New Middle’Jobs
0%
5%
10%
15%
20%
25%
30%
35%
40%
45%
50%
AdvancedDegree
4-year CollegeDegree
Tech-Some Post GED SomeExperience
GED/Entry Below GED
Education Band
Perc
ent o
f Tot
al N
ew E
mpl
oym
ent (
2007
-17)
USA
NC‘Disappearing’
Traditional Middle Jobs
‘New Middle’Jobs
NC Net New Jobs Total = 700K Source: Regional Dynamics forecasts Note: Gray areas indicate 2007 proportion of NC employment within the traditional middle educational bands.
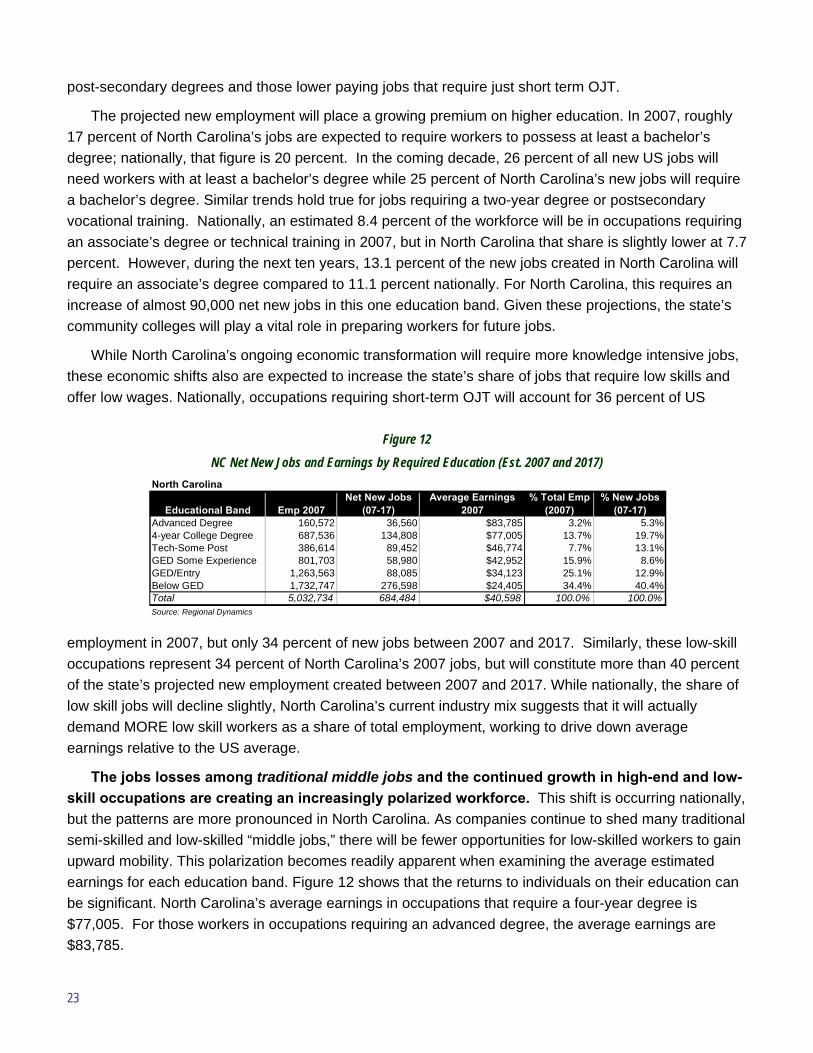
23
post-secondary degrees and those lower paying jobs that require just short term OJT.
The projected new employment will place a growing premium on higher education. In 2007, roughly 17 percent of North Carolina’s jobs are expected to require workers to possess at least a bachelor’s degree; nationally, that figure is 20 percent. In the coming decade, 26 percent of all new US jobs will need workers with at least a bachelor’s degree while 25 percent of North Carolina’s new jobs will require a bachelor’s degree. Similar trends hold true for jobs requiring a two-year degree or postsecondary vocational training. Nationally, an estimated 8.4 percent of the workforce will be in occupations requiring an associate’s degree or technical training in 2007, but in North Carolina that share is slightly lower at 7.7 percent. However, during the next ten years, 13.1 percent of the new jobs created in North Carolina will require an associate’s degree compared to 11.1 percent nationally. For North Carolina, this requires an increase of almost 90,000 net new jobs in this one education band. Given these projections, the state’s community colleges will play a vital role in preparing workers for future jobs.
While North Carolina’s ongoing economic transformation will require more knowledge intensive jobs, these economic shifts also are expected to increase the state’s share of jobs that require low skills and offer low wages. Nationally, occupations requiring short-term OJT will account for 36 percent of US
employment in 2007, but only 34 percent of new jobs between 2007 and 2017. Similarly, these low-skill occupations represent 34 percent of North Carolina’s 2007 jobs, but will constitute more than 40 percent of the state’s projected new employment created between 2007 and 2017. While nationally, the share of low skill jobs will decline slightly, North Carolina’s current industry mix suggests that it will actually demand MORE low skill workers as a share of total employment, working to drive down average earnings relative to the US average.
The jobs losses among traditional middle jobs and the continued growth in high-end and low-skill occupations are creating an increasingly polarized workforce. This shift is occurring nationally, but the patterns are more pronounced in North Carolina. As companies continue to shed many traditional semi-skilled and low-skilled “middle jobs,” there will be fewer opportunities for low-skilled workers to gain upward mobility. This polarization becomes readily apparent when examining the average estimated earnings for each education band. Figure 12 shows that the returns to individuals on their education can be significant. North Carolina’s average earnings in occupations that require a four-year degree is $77,005. For those workers in occupations requiring an advanced degree, the average earnings are $83,785.
Figure 12 NC Net New Jobs and Earnings by Required Education (Est. 2007 and 2017)
Educational Band Emp 2007Net New Jobs
(07-17)Average Earnings
2007% Total Emp
(2007)% New Jobs
(07-17)Advanced Degree 160,572 36,560 $83,785 3.2% 5.3%4-year College Degree 687,536 134,808 $77,005 13.7% 19.7%Tech-Some Post 386,614 89,452 $46,774 7.7% 13.1%GED Some Experience 801,703 58,980 $42,952 15.9% 8.6%GED/Entry 1,263,563 88,085 $34,123 25.1% 12.9%Below GED 1,732,747 276,598 $24,405 34.4% 40.4%Total 5,032,734 684,484 $40,598 100.0% 100.0%Source: Regional Dynamics
North Carolina
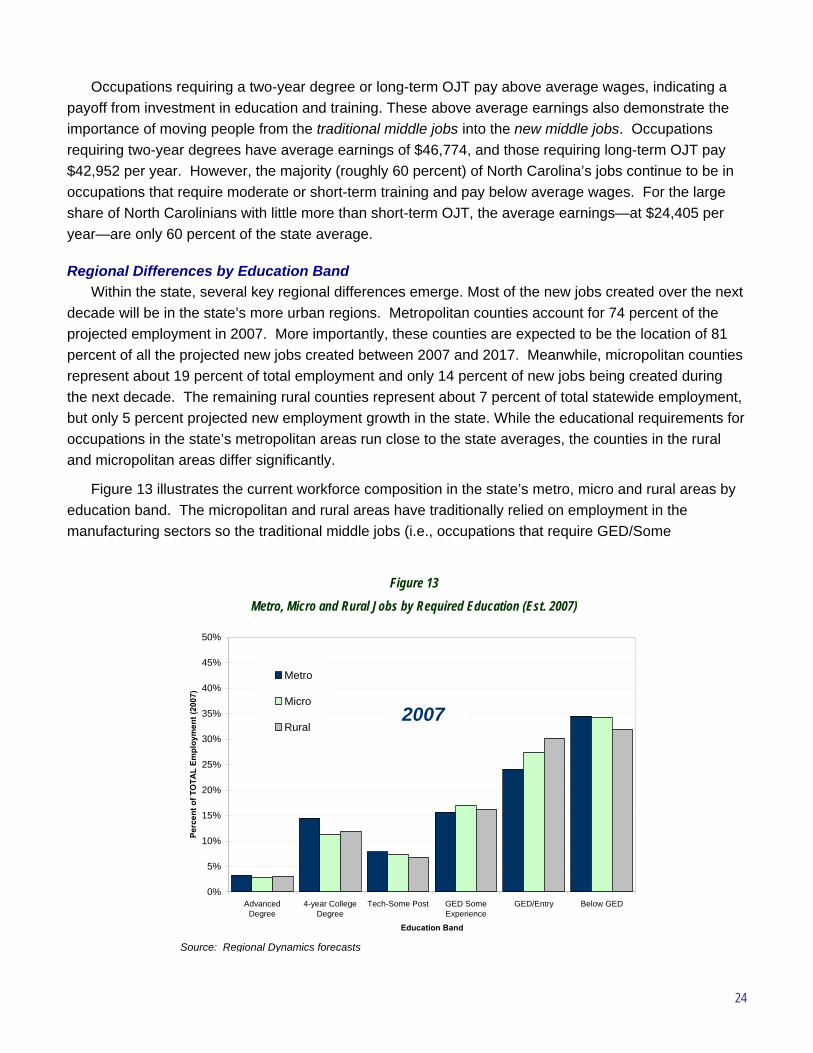
24
Occupations requiring a two-year degree or long-term OJT pay above average wages, indicating a payoff from investment in education and training. These above average earnings also demonstrate the importance of moving people from the traditional middle jobs into the new middle jobs. Occupations requiring two-year degrees have average earnings of $46,774, and those requiring long-term OJT pay $42,952 per year. However, the majority (roughly 60 percent) of North Carolina’s jobs continue to be in occupations that require moderate or short-term training and pay below average wages. For the large share of North Carolinians with little more than short-term OJT, the average earnings—at $24,405 per year—are only 60 percent of the state average.
Regional Differences by Education Band Within the state, several key regional differences emerge. Most of the new jobs created over the next
decade will be in the state’s more urban regions. Metropolitan counties account for 74 percent of the projected employment in 2007. More importantly, these counties are expected to be the location of 81 percent of all the projected new jobs created between 2007 and 2017. Meanwhile, micropolitan counties represent about 19 percent of total employment and only 14 percent of new jobs being created during the next decade. The remaining rural counties represent about 7 percent of total statewide employment, but only 5 percent projected new employment growth in the state. While the educational requirements for occupations in the state’s metropolitan areas run close to the state averages, the counties in the rural and micropolitan areas differ significantly.
Figure 13 illustrates the current workforce composition in the state’s metro, micro and rural areas by education band. The micropolitan and rural areas have traditionally relied on employment in the manufacturing sectors so the traditional middle jobs (i.e., occupations that require GED/Some
Figure 13 Metro, Micro and Rural Jobs by Required Education (Est. 2007)
0%
5%
10%
15%
20%
25%
30%
35%
40%
45%
50%
AdvancedDegree
4-year CollegeDegree
Tech-Some Post GED SomeExperience
GED/Entry Below GED
Education Band
Perc
ent o
f TO
TAL
Empl
oym
ent (
2007
)
Metro
Micro
Rural2007
Source: Regional Dynamics forecasts
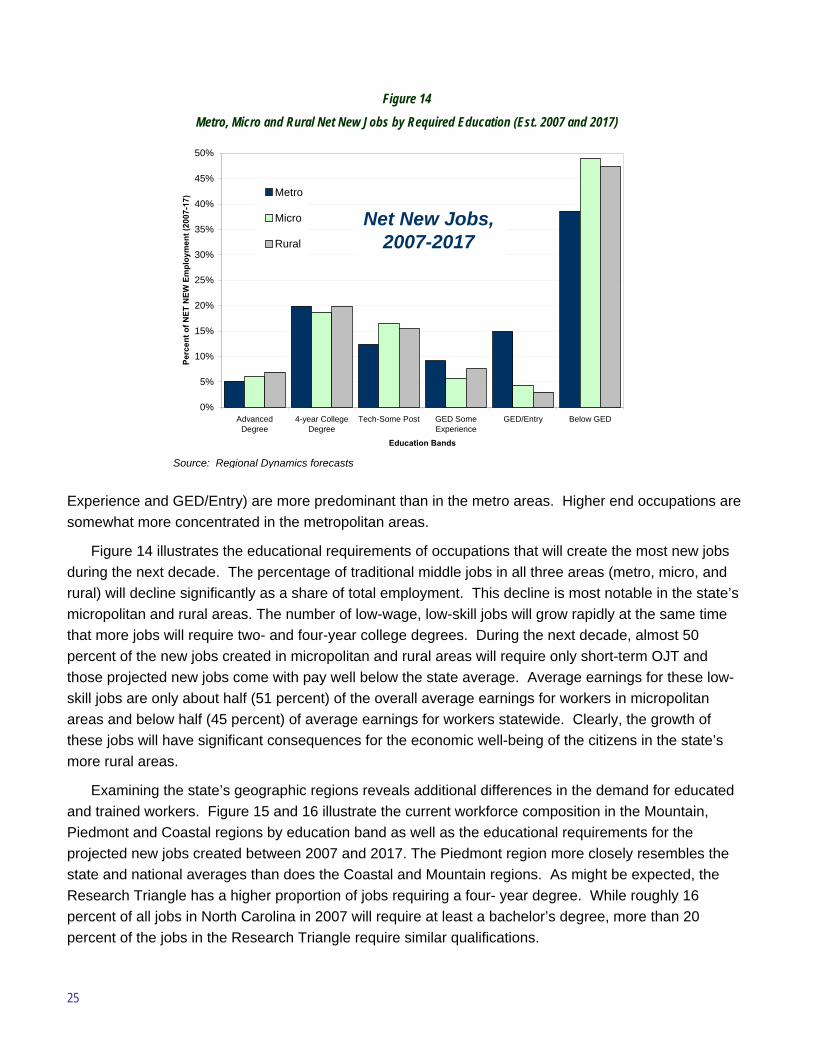
25
Experience and GED/Entry) are more predominant than in the metro areas. Higher end occupations are somewhat more concentrated in the metropolitan areas.
Figure 14 illustrates the educational requirements of occupations that will create the most new jobs during the next decade. The percentage of traditional middle jobs in all three areas (metro, micro, and rural) will decline significantly as a share of total employment. This decline is most notable in the state’s micropolitan and rural areas. The number of low-wage, low-skill jobs will grow rapidly at the same time that more jobs will require two- and four-year college degrees. During the next decade, almost 50 percent of the new jobs created in micropolitan and rural areas will require only short-term OJT and those projected new jobs come with pay well below the state average. Average earnings for these low-skill jobs are only about half (51 percent) of the overall average earnings for workers in micropolitan areas and below half (45 percent) of average earnings for workers statewide. Clearly, the growth of these jobs will have significant consequences for the economic well-being of the citizens in the state’s more rural areas.
Examining the state’s geographic regions reveals additional differences in the demand for educated and trained workers. Figure 15 and 16 illustrate the current workforce composition in the Mountain, Piedmont and Coastal regions by education band as well as the educational requirements for the projected new jobs created between 2007 and 2017. The Piedmont region more closely resembles the state and national averages than does the Coastal and Mountain regions. As might be expected, the Research Triangle has a higher proportion of jobs requiring a four- year degree. While roughly 16 percent of all jobs in North Carolina in 2007 will require at least a bachelor’s degree, more than 20 percent of the jobs in the Research Triangle require similar qualifications.
Figure 14 Metro, Micro and Rural Net New Jobs by Required Education (Est. 2007 and 2017)
0%
5%
10%
15%
20%
25%
30%
35%
40%
45%
50%
AdvancedDegree
4-year CollegeDegree
Tech-Some Post GED SomeExperience
GED/Entry Below GED
Education Bands
Perc
ent o
f NET
NEW
Em
ploy
men
t (20
07-1
7)Metro
Micro
Rural
Net New Jobs,2007-2017
Source: Regional Dynamics forecasts
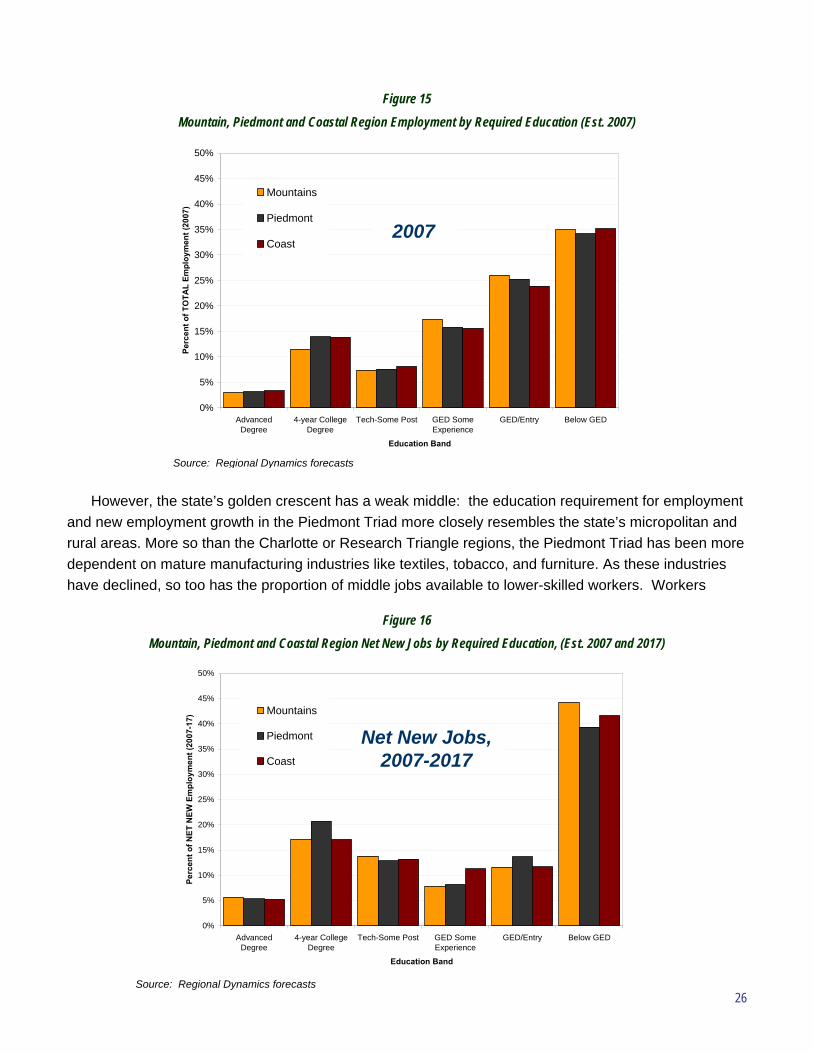
26
However, the state’s golden crescent has a weak middle: the education requirement for employment and new employment growth in the Piedmont Triad more closely resembles the state’s micropolitan and rural areas. More so than the Charlotte or Research Triangle regions, the Piedmont Triad has been more dependent on mature manufacturing industries like textiles, tobacco, and furniture. As these industries have declined, so too has the proportion of middle jobs available to lower-skilled workers. Workers
Figure 15 Mountain, Piedmont and Coastal Region Employment by Required Education (Est. 2007)
0%
5%
10%
15%
20%
25%
30%
35%
40%
45%
50%
AdvancedDegree
4-year CollegeDegree
Tech-Some Post GED SomeExperience
GED/Entry Below GED
Education Band
Perc
ent o
f TO
TAL
Empl
oym
ent (
2007
)Mountains
Piedmont
Coast2007
Source: Regional Dynamics forecasts
Figure 16 Mountain, Piedmont and Coastal Region Net New Jobs by Required Education, (Est. 2007 and 2017)
0%
5%
10%
15%
20%
25%
30%
35%
40%
45%
50%
AdvancedDegree
4-year CollegeDegree
Tech-Some Post GED SomeExperience
GED/Entry Below GED
Education Band
Perc
ent o
f NET
NEW
Em
ploy
men
t (20
07-1
7)
Mountains
Piedmont
Coast
Net New Jobs,2007-2017
Source: Regional Dynamics forecasts
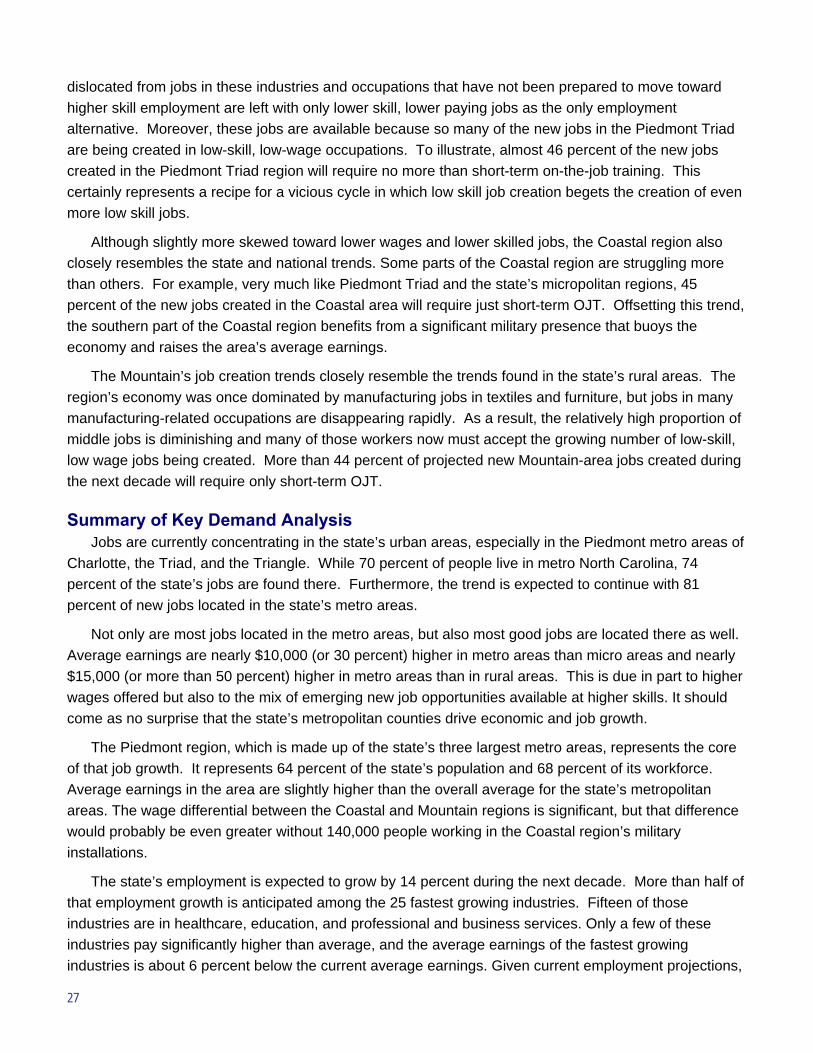
27
dislocated from jobs in these industries and occupations that have not been prepared to move toward higher skill employment are left with only lower skill, lower paying jobs as the only employment alternative. Moreover, these jobs are available because so many of the new jobs in the Piedmont Triad are being created in low-skill, low-wage occupations. To illustrate, almost 46 percent of the new jobs created in the Piedmont Triad region will require no more than short-term on-the-job training. This certainly represents a recipe for a vicious cycle in which low skill job creation begets the creation of even more low skill jobs.
Although slightly more skewed toward lower wages and lower skilled jobs, the Coastal region also closely resembles the state and national trends. Some parts of the Coastal region are struggling more than others. For example, very much like Piedmont Triad and the state’s micropolitan regions, 45 percent of the new jobs created in the Coastal area will require just short-term OJT. Offsetting this trend, the southern part of the Coastal region benefits from a significant military presence that buoys the economy and raises the area’s average earnings.
The Mountain’s job creation trends closely resemble the trends found in the state’s rural areas. The region’s economy was once dominated by manufacturing jobs in textiles and furniture, but jobs in many manufacturing-related occupations are disappearing rapidly. As a result, the relatively high proportion of middle jobs is diminishing and many of those workers now must accept the growing number of low-skill, low wage jobs being created. More than 44 percent of projected new Mountain-area jobs created during the next decade will require only short-term OJT.
Summary of Key Demand Analysis Jobs are currently concentrating in the state’s urban areas, especially in the Piedmont metro areas of
Charlotte, the Triad, and the Triangle. While 70 percent of people live in metro North Carolina, 74 percent of the state’s jobs are found there. Furthermore, the trend is expected to continue with 81 percent of new jobs located in the state’s metro areas.
Not only are most jobs located in the metro areas, but also most good jobs are located there as well. Average earnings are nearly $10,000 (or 30 percent) higher in metro areas than micro areas and nearly $15,000 (or more than 50 percent) higher in metro areas than in rural areas. This is due in part to higher wages offered but also to the mix of emerging new job opportunities available at higher skills. It should come as no surprise that the state’s metropolitan counties drive economic and job growth.
The Piedmont region, which is made up of the state’s three largest metro areas, represents the core of that job growth. It represents 64 percent of the state’s population and 68 percent of its workforce. Average earnings in the area are slightly higher than the overall average for the state’s metropolitan areas. The wage differential between the Coastal and Mountain regions is significant, but that difference would probably be even greater without 140,000 people working in the Coastal region’s military installations.
The state’s employment is expected to grow by 14 percent during the next decade. More than half of that employment growth is anticipated among the 25 fastest growing industries. Fifteen of those industries are in healthcare, education, and professional and business services. Only a few of these industries pay significantly higher than average, and the average earnings of the fastest growing industries is about 6 percent below the current average earnings. Given current employment projections,
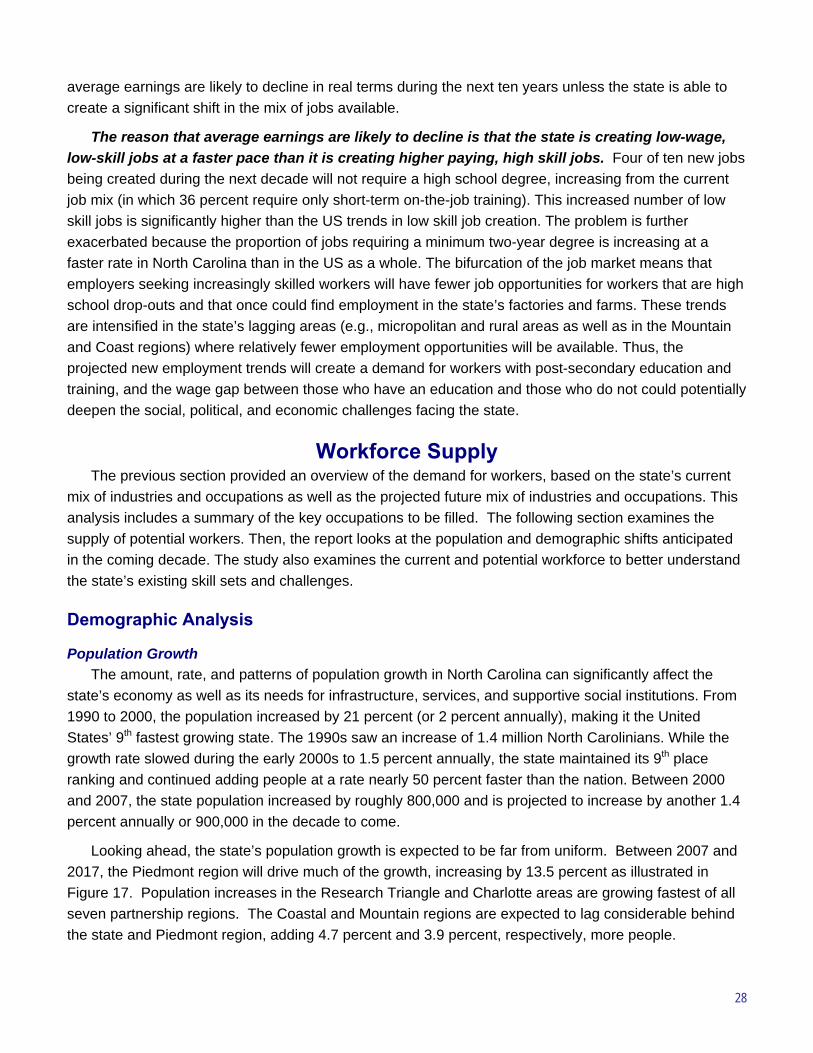
28
average earnings are likely to decline in real terms during the next ten years unless the state is able to create a significant shift in the mix of jobs available.
The reason that average earnings are likely to decline is that the state is creating low-wage, low-skill jobs at a faster pace than it is creating higher paying, high skill jobs. Four of ten new jobs being created during the next decade will not require a high school degree, increasing from the current job mix (in which 36 percent require only short-term on-the-job training). This increased number of low skill jobs is significantly higher than the US trends in low skill job creation. The problem is further exacerbated because the proportion of jobs requiring a minimum two-year degree is increasing at a faster rate in North Carolina than in the US as a whole. The bifurcation of the job market means that employers seeking increasingly skilled workers will have fewer job opportunities for workers that are high school drop-outs and that once could find employment in the state’s factories and farms. These trends are intensified in the state’s lagging areas (e.g., micropolitan and rural areas as well as in the Mountain and Coast regions) where relatively fewer employment opportunities will be available. Thus, the projected new employment trends will create a demand for workers with post-secondary education and training, and the wage gap between those who have an education and those who do not could potentially deepen the social, political, and economic challenges facing the state.
Workforce Supply The previous section provided an overview of the demand for workers, based on the state’s current
mix of industries and occupations as well as the projected future mix of industries and occupations. This analysis includes a summary of the key occupations to be filled. The following section examines the supply of potential workers. Then, the report looks at the population and demographic shifts anticipated in the coming decade. The study also examines the current and potential workforce to better understand the state’s existing skill sets and challenges.
Demographic Analysis
Population Growth The amount, rate, and patterns of population growth in North Carolina can significantly affect the
state’s economy as well as its needs for infrastructure, services, and supportive social institutions. From 1990 to 2000, the population increased by 21 percent (or 2 percent annually), making it the United States’ 9th fastest growing state. The 1990s saw an increase of 1.4 million North Carolinians. While the growth rate slowed during the early 2000s to 1.5 percent annually, the state maintained its 9th place ranking and continued adding people at a rate nearly 50 percent faster than the nation. Between 2000 and 2007, the state population increased by roughly 800,000 and is projected to increase by another 1.4 percent annually or 900,000 in the decade to come.
Looking ahead, the state’s population growth is expected to be far from uniform. Between 2007 and 2017, the Piedmont region will drive much of the growth, increasing by 13.5 percent as illustrated in Figure 17. Population increases in the Research Triangle and Charlotte areas are growing fastest of all seven partnership regions. The Coastal and Mountain regions are expected to lag considerable behind the state and Piedmont region, adding 4.7 percent and 3.9 percent, respectively, more people.
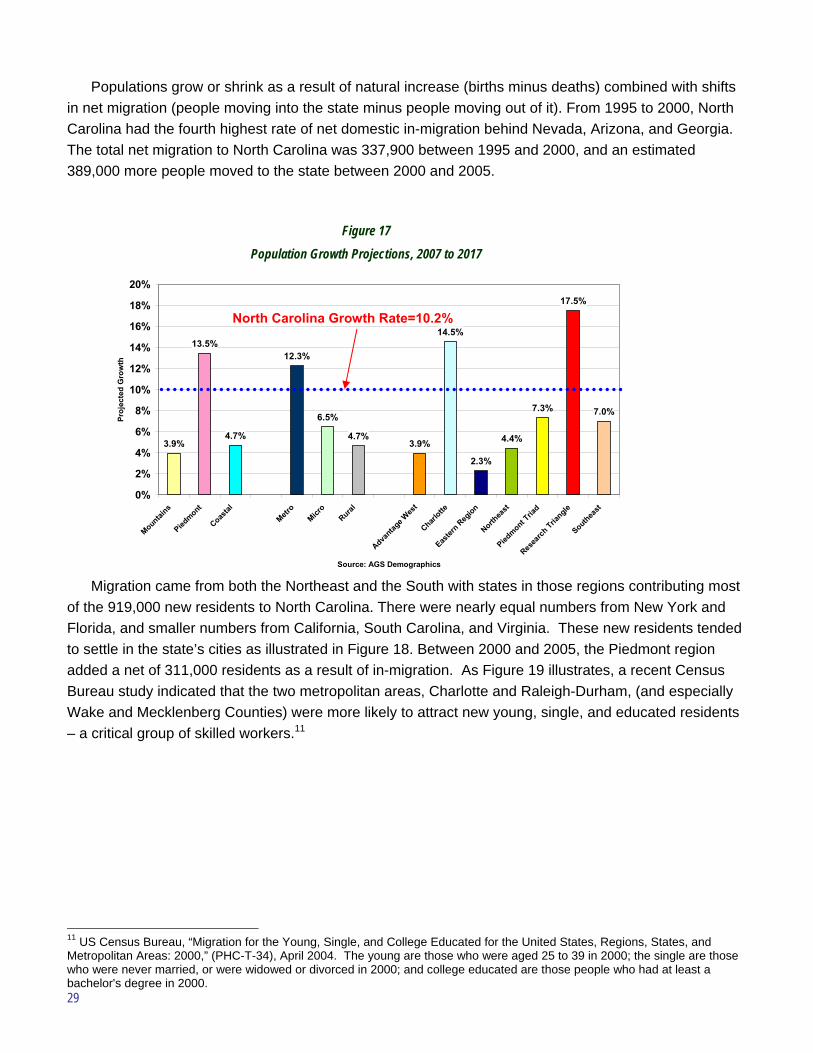
29
Populations grow or shrink as a result of natural increase (births minus deaths) combined with shifts in net migration (people moving into the state minus people moving out of it). From 1995 to 2000, North Carolina had the fourth highest rate of net domestic in-migration behind Nevada, Arizona, and Georgia. The total net migration to North Carolina was 337,900 between 1995 and 2000, and an estimated 389,000 more people moved to the state between 2000 and 2005.
Migration came from both the Northeast and the South with states in those regions contributing most of the 919,000 new residents to North Carolina. There were nearly equal numbers from New York and Florida, and smaller numbers from California, South Carolina, and Virginia. These new residents tended to settle in the state’s cities as illustrated in Figure 18. Between 2000 and 2005, the Piedmont region added a net of 311,000 residents as a result of in-migration. As Figure 19 illustrates, a recent Census Bureau study indicated that the two metropolitan areas, Charlotte and Raleigh-Durham, (and especially Wake and Mecklenberg Counties) were more likely to attract new young, single, and educated residents – a critical group of skilled workers.11
11 US Census Bureau, “Migration for the Young, Single, and College Educated for the United States, Regions, States, and Metropolitan Areas: 2000,” (PHC-T-34), April 2004. The young are those who were aged 25 to 39 in 2000; the single are those who were never married, or were widowed or divorced in 2000; and college educated are those people who had at least a bachelor's degree in 2000.
Figure 17 Population Growth Projections, 2007 to 2017
3.9%
13.5%
4.7%
12.3%
6.5%
4.7%3.9%
14.5%
2.3%
4.4%
7.3%
17.5%
7.0%
0%
2%
4%
6%
8%
10%
12%
14%
16%
18%
20%
Mountai
ns
Piedmont
Coastal
Metro
Micro
Rural
Advantag
e Wes
t
Charlotte
Easter
n Reg
ion
Northea
st
Piedmont T
riad
Resea
rch Tria
ngle
Southeast
Source: AGS Demographics
Proj
ecte
d G
row
th
North Carolina Growth Rate=10.2%
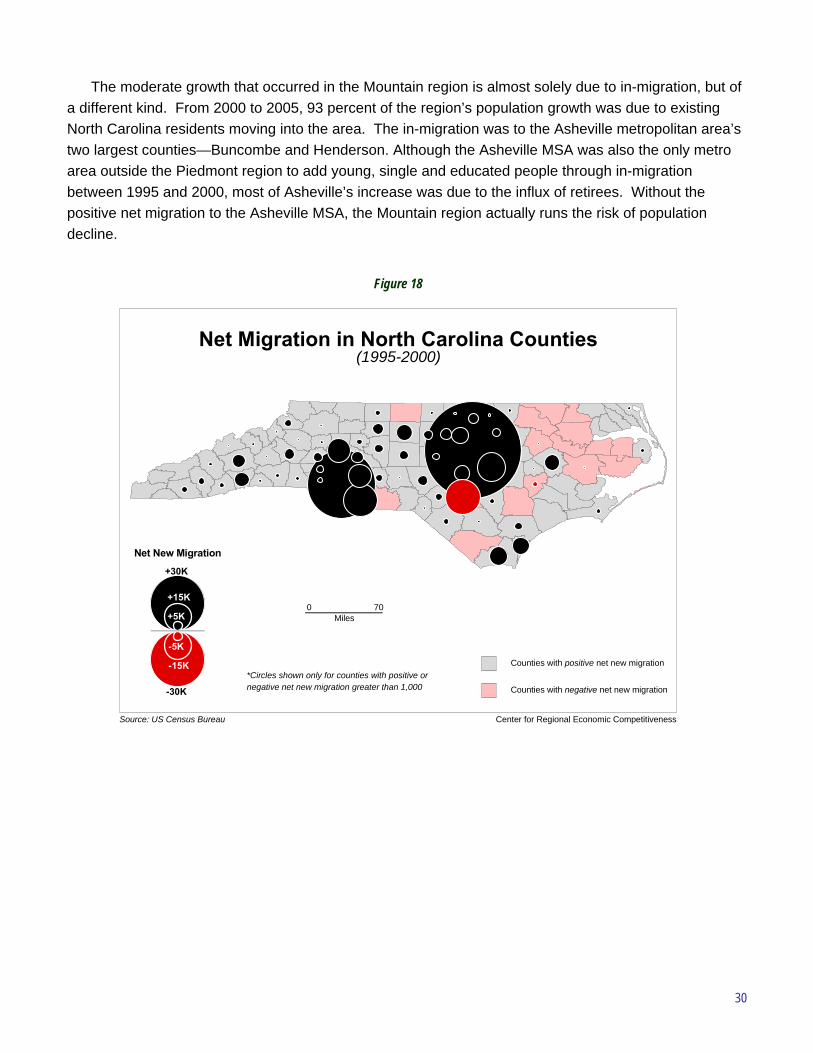
30
The moderate growth that occurred in the Mountain region is almost solely due to in-migration, but of a different kind. From 2000 to 2005, 93 percent of the region’s population growth was due to existing North Carolina residents moving into the area. The in-migration was to the Asheville metropolitan area’s two largest counties—Buncombe and Henderson. Although the Asheville MSA was also the only metro area outside the Piedmont region to add young, single and educated people through in-migration between 1995 and 2000, most of Asheville’s increase was due to the influx of retirees. Without the positive net migration to the Asheville MSA, the Mountain region actually runs the risk of population decline.
Figure 18
Source: US Census Bureau Center for Regional Economic Competitiveness
Net Migration in North Carolina Counties(1995-2000)
Counties with positive net new migration
Counties with negative net new migration
*Circles shown only for counties with positive ornegative net new migration greater than 1,000
+5K
+15K
+30K
-5K
-15K
-30K
Net New Migration
Miles0 70
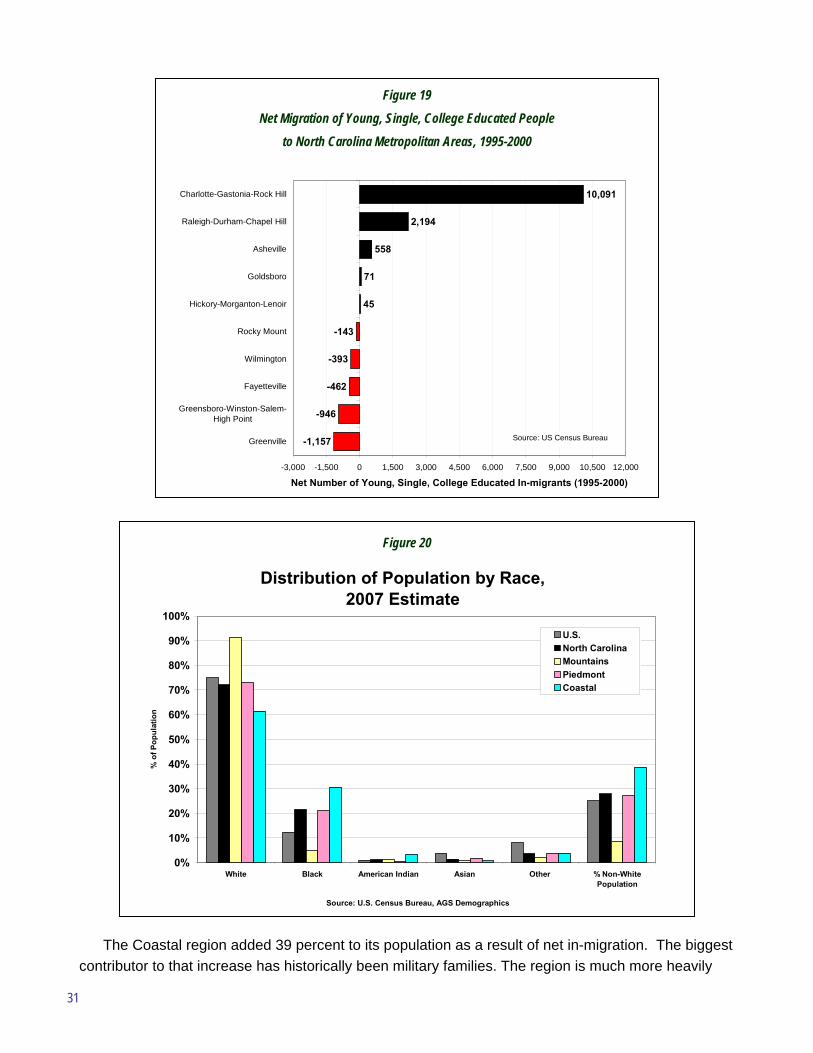
31
The Coastal region added 39 percent to its population as a result of net in-migration. The biggest contributor to that increase has historically been military families. The region is much more heavily
Figure 19 Net Migration of Young, Single, College Educated People
to North Carolina Metropolitan Areas, 1995-2000
-1,157
-946
-462
-393
-143
45
71
558
2,194
10,091
-3,000 -1,500 0 1,500 3,000 4,500 6,000 7,500 9,000 10,500 12,000
Greenville
Greensboro-Winston-Salem-High Point
Fayetteville
Wilmington
Rocky Mount
Hickory-Morganton-Lenoir
Goldsboro
Asheville
Raleigh-Durham-Chapel Hill
Charlotte-Gastonia-Rock Hill
Net Number of Young, Single, College Educated In-migrants (1995-2000)
Source: US Census Bureau
Figure 20
Distribution of Population by Race,2007 Estimate
0%
10%
20%
30%
40%
50%
60%
70%
80%
90%
100%
White Black American Indian Asian Other % Non-WhitePopulation
Source: U.S. Census Bureau, AGS Demographics
% o
f Pop
ulat
ion
U.S.North CarolinaMountainsPiedmontCoastal
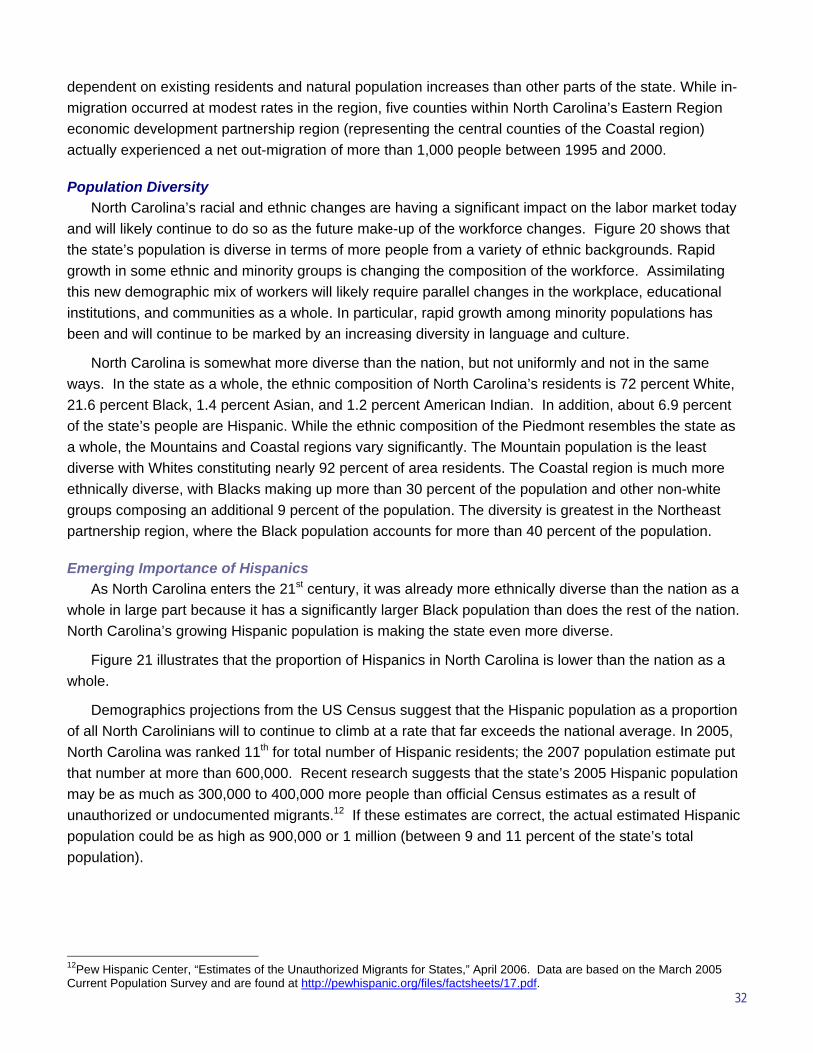
32
dependent on existing residents and natural population increases than other parts of the state. While in-migration occurred at modest rates in the region, five counties within North Carolina’s Eastern Region economic development partnership region (representing the central counties of the Coastal region) actually experienced a net out-migration of more than 1,000 people between 1995 and 2000.
Population Diversity North Carolina’s racial and ethnic changes are having a significant impact on the labor market today
and will likely continue to do so as the future make-up of the workforce changes. Figure 20 shows that the state’s population is diverse in terms of more people from a variety of ethnic backgrounds. Rapid growth in some ethnic and minority groups is changing the composition of the workforce. Assimilating this new demographic mix of workers will likely require parallel changes in the workplace, educational institutions, and communities as a whole. In particular, rapid growth among minority populations has been and will continue to be marked by an increasing diversity in language and culture.
North Carolina is somewhat more diverse than the nation, but not uniformly and not in the same ways. In the state as a whole, the ethnic composition of North Carolina’s residents is 72 percent White, 21.6 percent Black, 1.4 percent Asian, and 1.2 percent American Indian. In addition, about 6.9 percent of the state’s people are Hispanic. While the ethnic composition of the Piedmont resembles the state as a whole, the Mountains and Coastal regions vary significantly. The Mountain population is the least diverse with Whites constituting nearly 92 percent of area residents. The Coastal region is much more ethnically diverse, with Blacks making up more than 30 percent of the population and other non-white groups composing an additional 9 percent of the population. The diversity is greatest in the Northeast partnership region, where the Black population accounts for more than 40 percent of the population.
Emerging Importance of Hispanics As North Carolina enters the 21st century, it was already more ethnically diverse than the nation as a
whole in large part because it has a significantly larger Black population than does the rest of the nation. North Carolina’s growing Hispanic population is making the state even more diverse.
Figure 21 illustrates that the proportion of Hispanics in North Carolina is lower than the nation as a whole.
Demographics projections from the US Census suggest that the Hispanic population as a proportion of all North Carolinians will to continue to climb at a rate that far exceeds the national average. In 2005, North Carolina was ranked 11th for total number of Hispanic residents; the 2007 population estimate put that number at more than 600,000. Recent research suggests that the state’s 2005 Hispanic population may be as much as 300,000 to 400,000 more people than official Census estimates as a result of unauthorized or undocumented migrants.12 If these estimates are correct, the actual estimated Hispanic population could be as high as 900,000 or 1 million (between 9 and 11 percent of the state’s total population).
12Pew Hispanic Center, “Estimates of the Unauthorized Migrants for States,” April 2006. Data are based on the March 2005 Current Population Survey and are found at http://pewhispanic.org/files/factsheets/17.pdf.
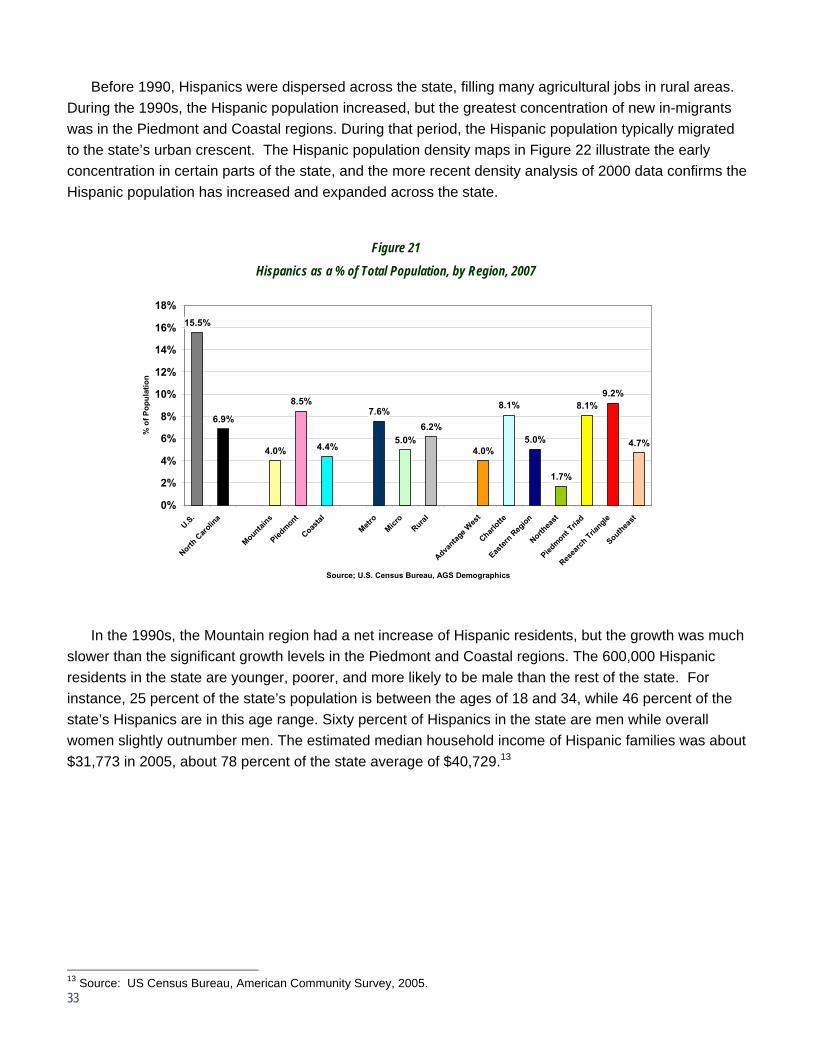
33
Before 1990, Hispanics were dispersed across the state, filling many agricultural jobs in rural areas. During the 1990s, the Hispanic population increased, but the greatest concentration of new in-migrants was in the Piedmont and Coastal regions. During that period, the Hispanic population typically migrated to the state’s urban crescent. The Hispanic population density maps in Figure 22 illustrate the early concentration in certain parts of the state, and the more recent density analysis of 2000 data confirms the Hispanic population has increased and expanded across the state.
In the 1990s, the Mountain region had a net increase of Hispanic residents, but the growth was much slower than the significant growth levels in the Piedmont and Coastal regions. The 600,000 Hispanic residents in the state are younger, poorer, and more likely to be male than the rest of the state. For instance, 25 percent of the state’s population is between the ages of 18 and 34, while 46 percent of the state’s Hispanics are in this age range. Sixty percent of Hispanics in the state are men while overall women slightly outnumber men. The estimated median household income of Hispanic families was about $31,773 in 2005, about 78 percent of the state average of $40,729.13
13 Source: US Census Bureau, American Community Survey, 2005.
Figure 21 Hispanics as a % of Total Population, by Region, 2007
15.5%
6.9%
4.0%
8.5%
4.4%
7.6%
5.0%6.2%
4.0%
8.1%
5.0%
1.7%
8.1%9.2%
4.7%
0%
2%
4%
6%
8%
10%
12%
14%
16%
18%
U.S.
North C
arolin
a
Mountains
Piedmont
Coastal
Metro
Micro
Rural
Advantag
e Wes
t
Charlotte
Easter
n Reg
ion
Northea
st
Piedmont T
riad
Resea
rch Tria
ngle
Southea
st
Source; U.S. Census Bureau, AGS Demographics
% o
f Pop
ulat
ion
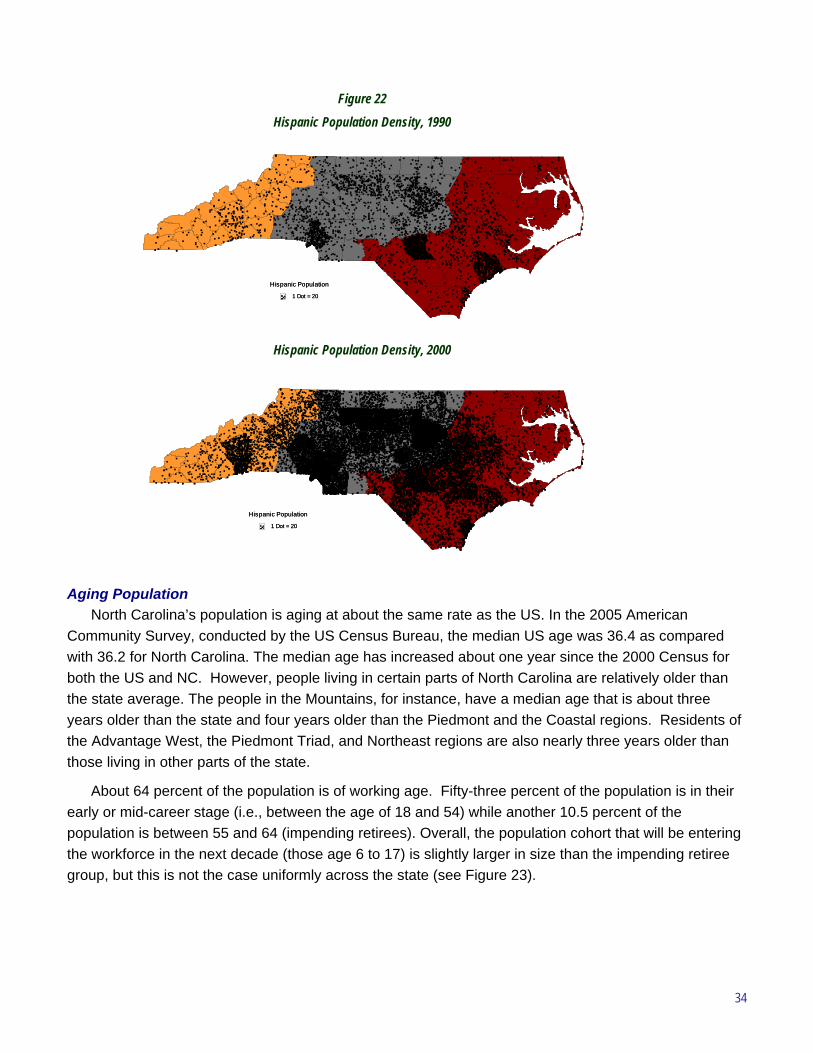
34
Aging Population North Carolina’s population is aging at about the same rate as the US. In the 2005 American
Community Survey, conducted by the US Census Bureau, the median US age was 36.4 as compared with 36.2 for North Carolina. The median age has increased about one year since the 2000 Census for both the US and NC. However, people living in certain parts of North Carolina are relatively older than the state average. The people in the Mountains, for instance, have a median age that is about three years older than the state and four years older than the Piedmont and the Coastal regions. Residents of the Advantage West, the Piedmont Triad, and Northeast regions are also nearly three years older than those living in other parts of the state.
About 64 percent of the population is of working age. Fifty-three percent of the population is in their early or mid-career stage (i.e., between the age of 18 and 54) while another 10.5 percent of the population is between 55 and 64 (impending retirees). Overall, the population cohort that will be entering the workforce in the next decade (those age 6 to 17) is slightly larger in size than the impending retiree group, but this is not the case uniformly across the state (see Figure 23).
Figure 22 Hispanic Population Density, 1990
Hispanic Population
1 Dot = 20
Hispanic Population
1 Dot = 20
Hispanic Population Density, 2000
Hispanic Population
1 Dot = 20
Hispanic Population
1 Dot = 20
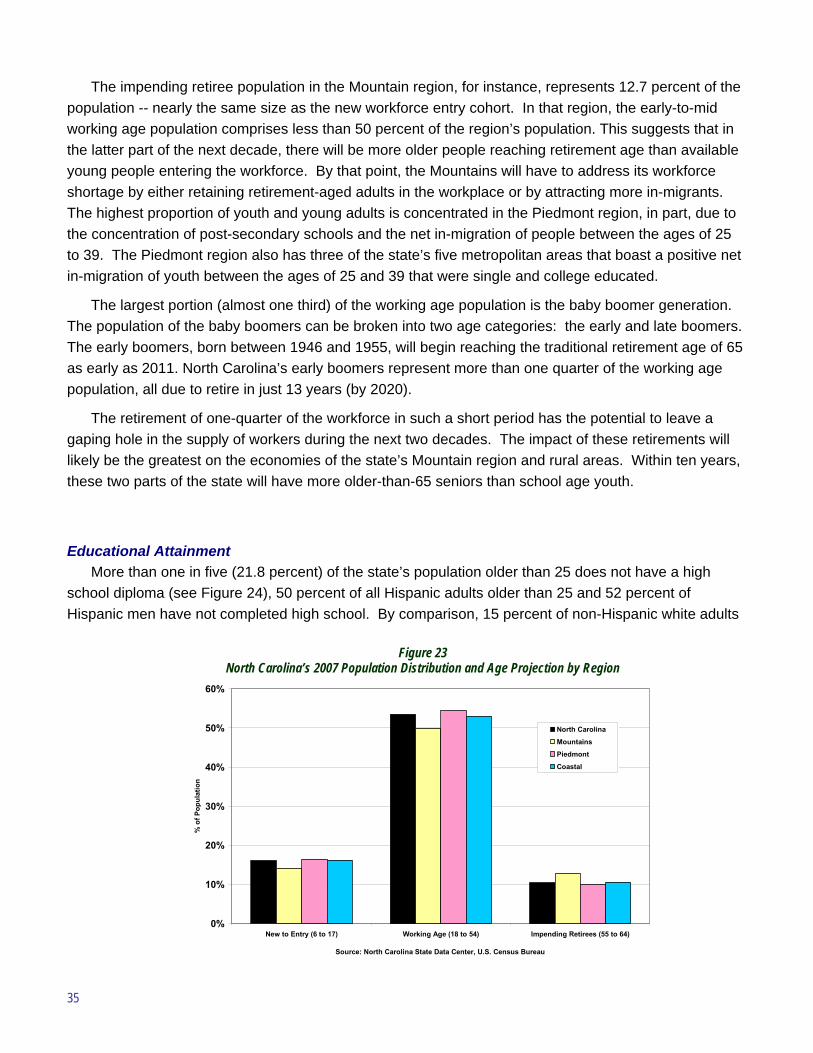
35
The impending retiree population in the Mountain region, for instance, represents 12.7 percent of the population -- nearly the same size as the new workforce entry cohort. In that region, the early-to-mid working age population comprises less than 50 percent of the region’s population. This suggests that in the latter part of the next decade, there will be more older people reaching retirement age than available young people entering the workforce. By that point, the Mountains will have to address its workforce shortage by either retaining retirement-aged adults in the workplace or by attracting more in-migrants. The highest proportion of youth and young adults is concentrated in the Piedmont region, in part, due to the concentration of post-secondary schools and the net in-migration of people between the ages of 25 to 39. The Piedmont region also has three of the state’s five metropolitan areas that boast a positive net in-migration of youth between the ages of 25 and 39 that were single and college educated.
The largest portion (almost one third) of the working age population is the baby boomer generation. The population of the baby boomers can be broken into two age categories: the early and late boomers. The early boomers, born between 1946 and 1955, will begin reaching the traditional retirement age of 65 as early as 2011. North Carolina’s early boomers represent more than one quarter of the working age population, all due to retire in just 13 years (by 2020).
The retirement of one-quarter of the workforce in such a short period has the potential to leave a gaping hole in the supply of workers during the next two decades. The impact of these retirements will likely be the greatest on the economies of the state’s Mountain region and rural areas. Within ten years, these two parts of the state will have more older-than-65 seniors than school age youth.
Educational Attainment More than one in five (21.8 percent) of the state’s population older than 25 does not have a high
school diploma (see Figure 24), 50 percent of all Hispanic adults older than 25 and 52 percent of Hispanic men have not completed high school. By comparison, 15 percent of non-Hispanic white adults
Figure 23 North Carolina’s 2007 Population Distribution and Age Projection by Region
0%
10%
20%
30%
40%
50%
60%
New to Entry (6 to 17) Working Age (18 to 54) Impending Retirees (55 to 64)
Source: North Carolina State Data Center, U.S. Census Bureau
% o
f Pop
ulat
ion
North Carolina
Mountains
Piedmont
Coastal
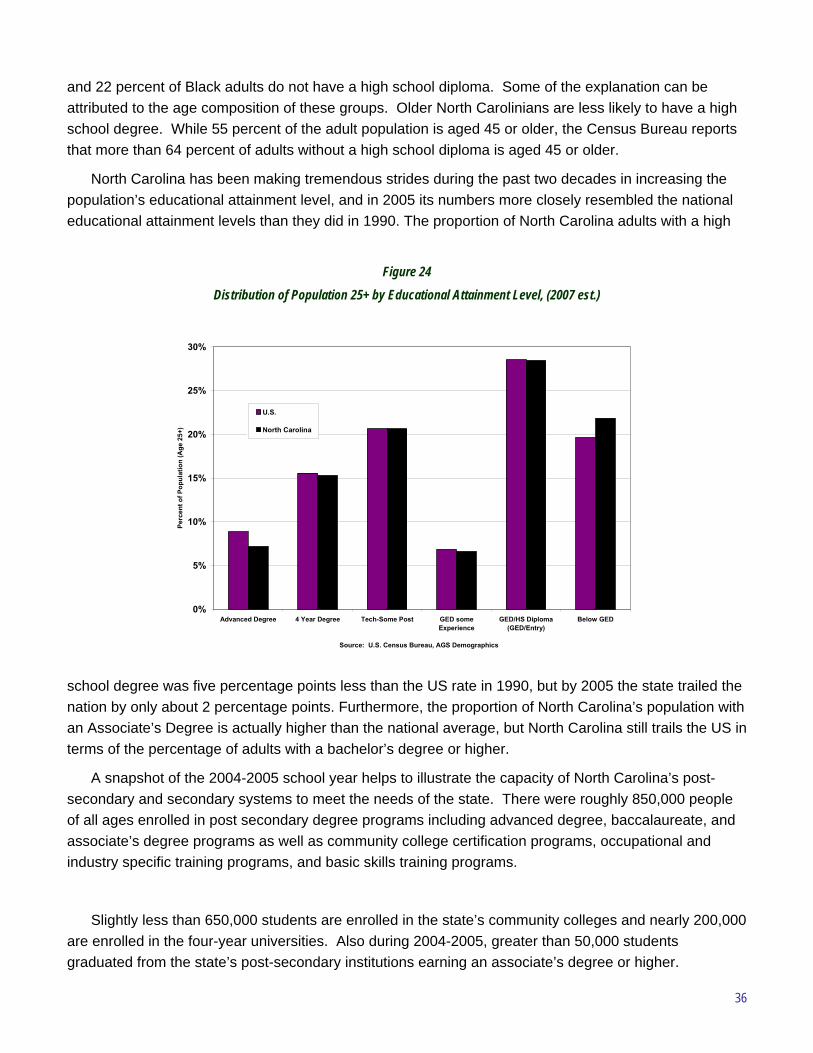
36
and 22 percent of Black adults do not have a high school diploma. Some of the explanation can be attributed to the age composition of these groups. Older North Carolinians are less likely to have a high school degree. While 55 percent of the adult population is aged 45 or older, the Census Bureau reports that more than 64 percent of adults without a high school diploma is aged 45 or older.
North Carolina has been making tremendous strides during the past two decades in increasing the population’s educational attainment level, and in 2005 its numbers more closely resembled the national educational attainment levels than they did in 1990. The proportion of North Carolina adults with a high
school degree was five percentage points less than the US rate in 1990, but by 2005 the state trailed the nation by only about 2 percentage points. Furthermore, the proportion of North Carolina’s population with an Associate’s Degree is actually higher than the national average, but North Carolina still trails the US in terms of the percentage of adults with a bachelor’s degree or higher.
A snapshot of the 2004-2005 school year helps to illustrate the capacity of North Carolina’s post-secondary and secondary systems to meet the needs of the state. There were roughly 850,000 people of all ages enrolled in post secondary degree programs including advanced degree, baccalaureate, and associate’s degree programs as well as community college certification programs, occupational and industry specific training programs, and basic skills training programs.
Slightly less than 650,000 students are enrolled in the state’s community colleges and nearly 200,000 are enrolled in the four-year universities. Also during 2004-2005, greater than 50,000 students graduated from the state’s post-secondary institutions earning an associate’s degree or higher.
Figure 24 Distribution of Population 25+ by Educational Attainment Level, (2007 est.)
0%
5%
10%
15%
20%
25%
30%
Advanced Degree 4 Year Degree Tech-Some Post GED someExperience
GED/HS Diploma(GED/Entry)
Below GED
Source: U.S. Census Bureau, AGS Demographics
Perc
ent o
f Pop
ulat
ion
(Age
25+
)
U.S.
North Carolina
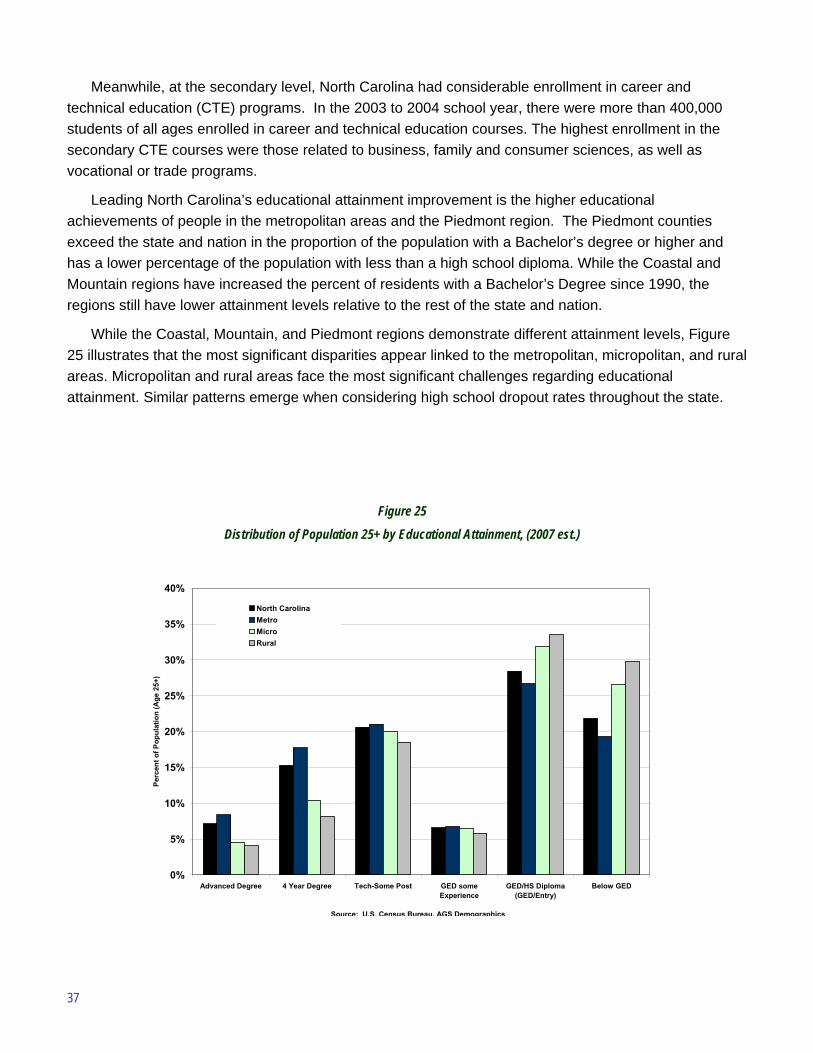
37
Meanwhile, at the secondary level, North Carolina had considerable enrollment in career and technical education (CTE) programs. In the 2003 to 2004 school year, there were more than 400,000 students of all ages enrolled in career and technical education courses. The highest enrollment in the secondary CTE courses were those related to business, family and consumer sciences, as well as vocational or trade programs.
Leading North Carolina’s educational attainment improvement is the higher educational achievements of people in the metropolitan areas and the Piedmont region. The Piedmont counties exceed the state and nation in the proportion of the population with a Bachelor’s degree or higher and has a lower percentage of the population with less than a high school diploma. While the Coastal and Mountain regions have increased the percent of residents with a Bachelor’s Degree since 1990, the regions still have lower attainment levels relative to the rest of the state and nation.
While the Coastal, Mountain, and Piedmont regions demonstrate different attainment levels, Figure 25 illustrates that the most significant disparities appear linked to the metropolitan, micropolitan, and rural areas. Micropolitan and rural areas face the most significant challenges regarding educational attainment. Similar patterns emerge when considering high school dropout rates throughout the state.
Figure 25 Distribution of Population 25+ by Educational Attainment, (2007 est.)
0%
5%
10%
15%
20%
25%
30%
35%
40%
Advanced Degree 4 Year Degree Tech-Some Post GED someExperience
GED/HS Diploma(GED/Entry)
Below GED
Source: U.S. Census Bureau, AGS Demographics
Perc
ent o
f Pop
ulat
ion
(Age
25+
)
North CarolinaMetroMicroRural
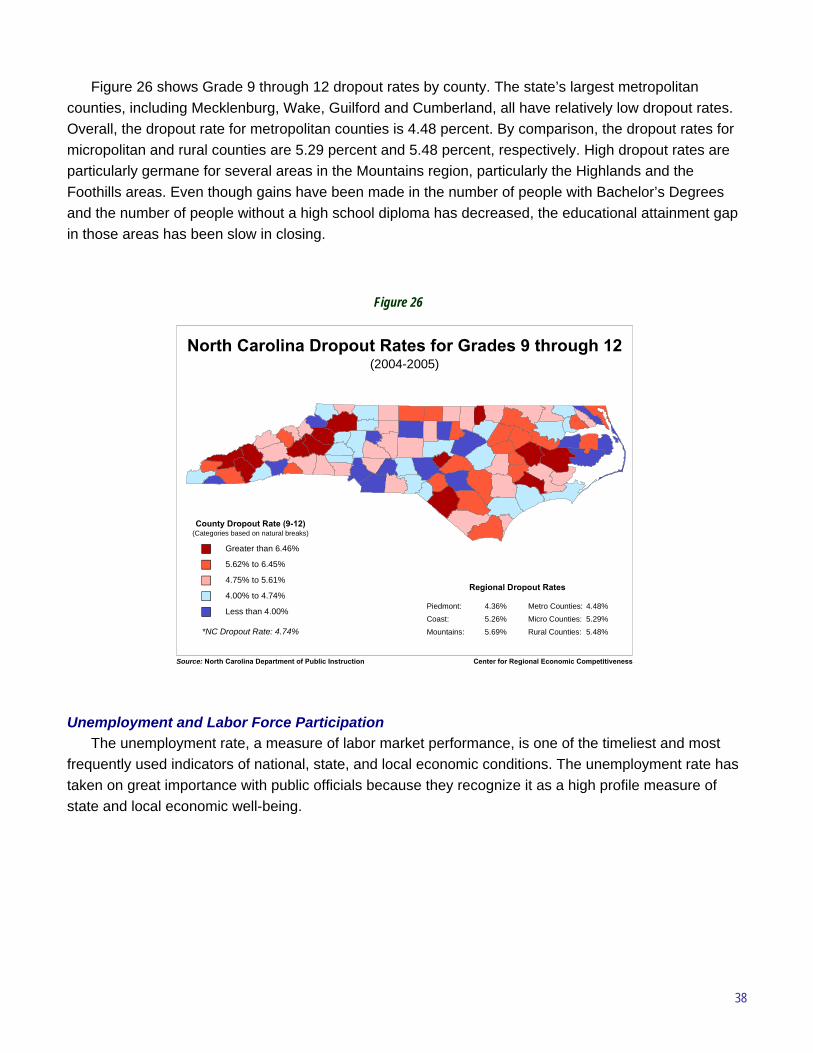
38
Figure 26 shows Grade 9 through 12 dropout rates by county. The state’s largest metropolitan counties, including Mecklenburg, Wake, Guilford and Cumberland, all have relatively low dropout rates. Overall, the dropout rate for metropolitan counties is 4.48 percent. By comparison, the dropout rates for micropolitan and rural counties are 5.29 percent and 5.48 percent, respectively. High dropout rates are particularly germane for several areas in the Mountains region, particularly the Highlands and the Foothills areas. Even though gains have been made in the number of people with Bachelor’s Degrees and the number of people without a high school diploma has decreased, the educational attainment gap in those areas has been slow in closing.
Unemployment and Labor Force Participation The unemployment rate, a measure of labor market performance, is one of the timeliest and most
frequently used indicators of national, state, and local economic conditions. The unemployment rate has taken on great importance with public officials because they recognize it as a high profile measure of state and local economic well-being.
Figure 26
Center for Regional Economic CompetitivenessSource: North Carolina Department of Public Instruction
North Carolina Dropout Rates for Grades 9 through 12(2004-2005)
Greater than 6.46%
5.62% to 6.45%
4.75% to 5.61%
4.00% to 4.74%
Less than 4.00%
County Dropout Rate (9-12)(Categories based on natural breaks)
*NC Dropout Rate: 4.74%
Regional Dropout Rates
Piedmont: 4.36%Coast: 5.26%
Mountains: 5.69%
4.48%Metro Counties:5.29%Micro Counties:
5.48%Rural Counties:
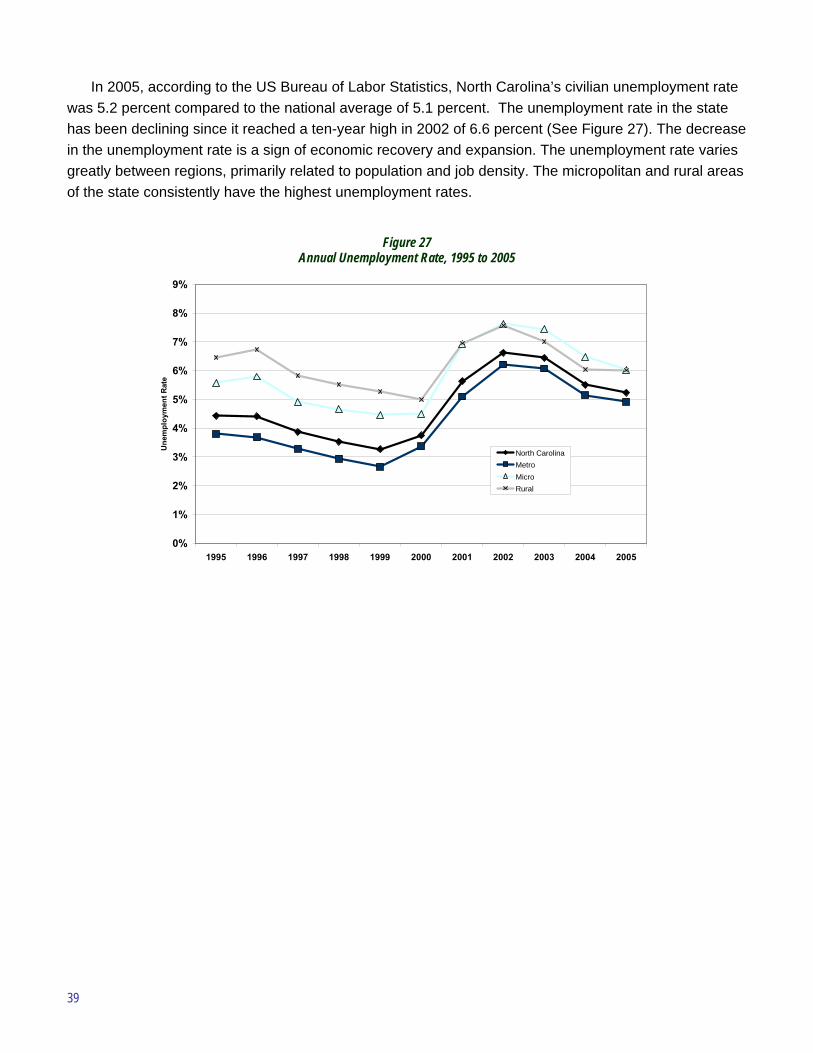
39
In 2005, according to the US Bureau of Labor Statistics, North Carolina’s civilian unemployment rate was 5.2 percent compared to the national average of 5.1 percent. The unemployment rate in the state has been declining since it reached a ten-year high in 2002 of 6.6 percent (See Figure 27). The decrease in the unemployment rate is a sign of economic recovery and expansion. The unemployment rate varies greatly between regions, primarily related to population and job density. The micropolitan and rural areas of the state consistently have the highest unemployment rates.
Figure 27 Annual Unemployment Rate, 1995 to 2005
0%
1%
2%
3%
4%
5%
6%
7%
8%
9%
1995 1996 1997 1998 1999 2000 2001 2002 2003 2004 2005
Une
mpl
oym
ent R
ate
North CarolinaMetroMicroRural
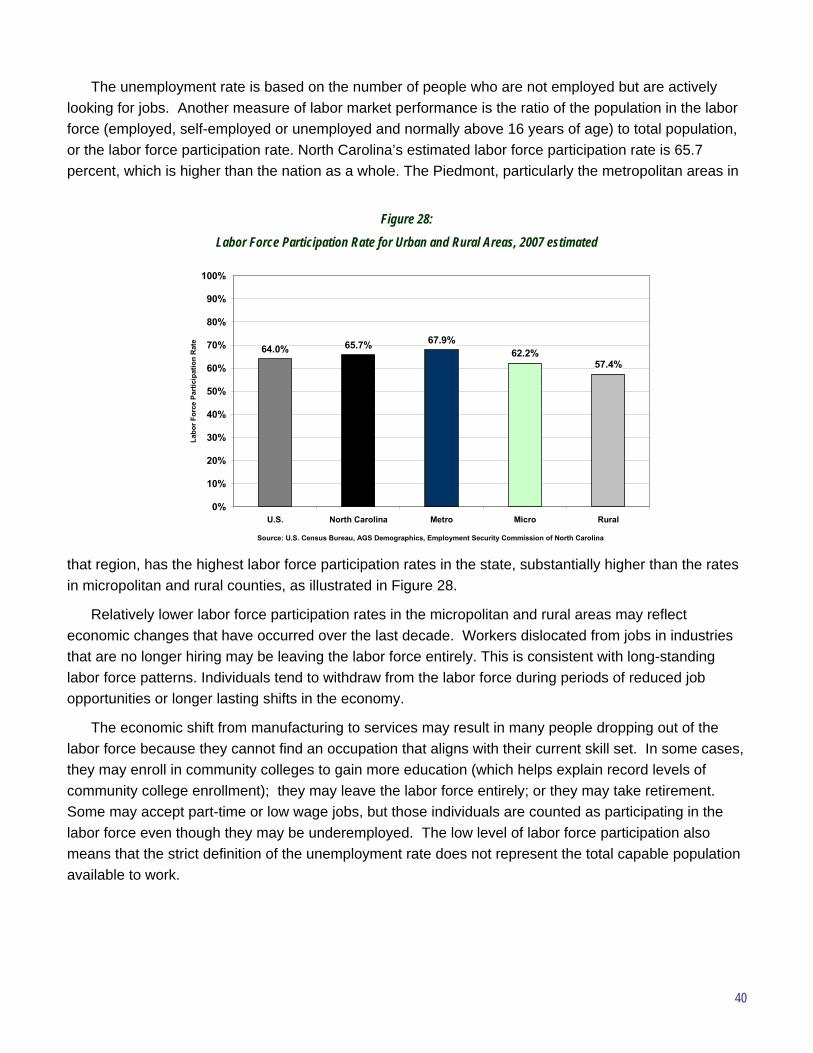
40
The unemployment rate is based on the number of people who are not employed but are actively looking for jobs. Another measure of labor market performance is the ratio of the population in the labor force (employed, self-employed or unemployed and normally above 16 years of age) to total population, or the labor force participation rate. North Carolina’s estimated labor force participation rate is 65.7 percent, which is higher than the nation as a whole. The Piedmont, particularly the metropolitan areas in
that region, has the highest labor force participation rates in the state, substantially higher than the rates in micropolitan and rural counties, as illustrated in Figure 28.
Relatively lower labor force participation rates in the micropolitan and rural areas may reflect economic changes that have occurred over the last decade. Workers dislocated from jobs in industries that are no longer hiring may be leaving the labor force entirely. This is consistent with long-standing labor force patterns. Individuals tend to withdraw from the labor force during periods of reduced job opportunities or longer lasting shifts in the economy.
The economic shift from manufacturing to services may result in many people dropping out of the labor force because they cannot find an occupation that aligns with their current skill set. In some cases, they may enroll in community colleges to gain more education (which helps explain record levels of community college enrollment); they may leave the labor force entirely; or they may take retirement. Some may accept part-time or low wage jobs, but those individuals are counted as participating in the labor force even though they may be underemployed. The low level of labor force participation also means that the strict definition of the unemployment rate does not represent the total capable population available to work.
Figure 28: Labor Force Participation Rate for Urban and Rural Areas, 2007 estimated
64.0% 65.7% 67.9%62.2%
57.4%
0%
10%
20%
30%
40%
50%
60%
70%
80%
90%
100%
U.S. North Carolina Metro Micro Rural
Source: U.S. Census Bureau, AGS Demographics, Employment Security Commission of North Carolina
Labo
r For
ce P
artic
ipat
ion
Rat
e
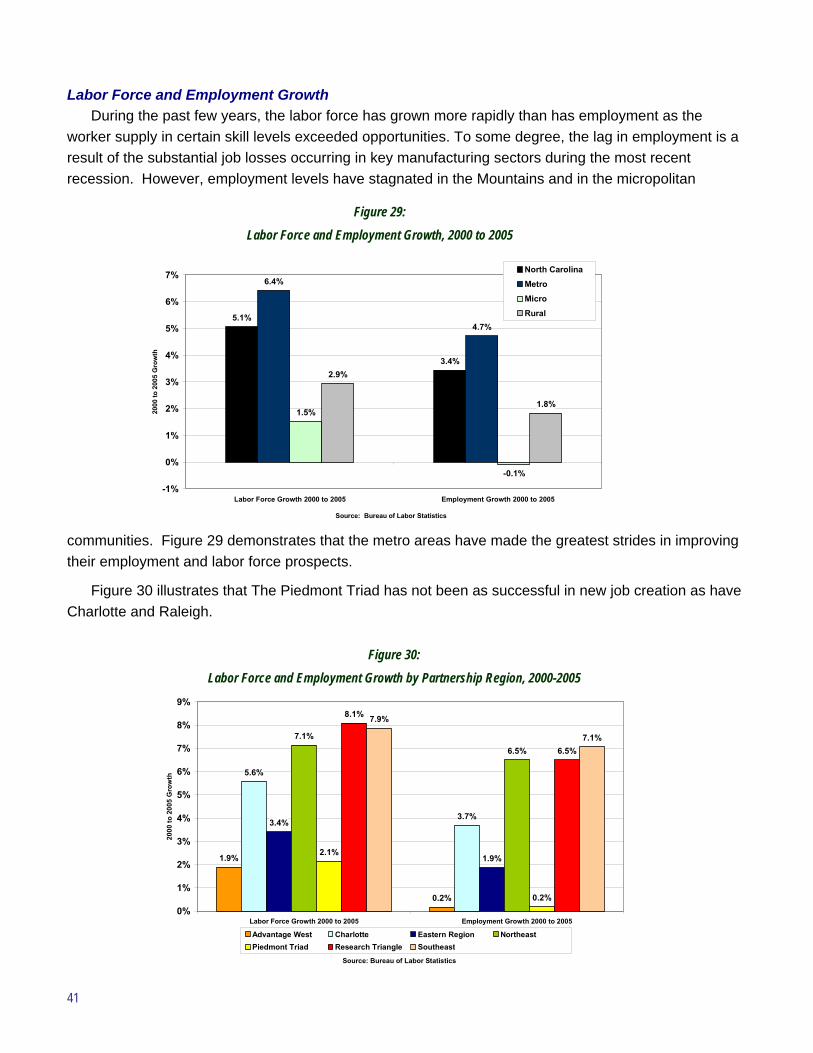
41
Labor Force and Employment Growth During the past few years, the labor force has grown more rapidly than has employment as the
worker supply in certain skill levels exceeded opportunities. To some degree, the lag in employment is a result of the substantial job losses occurring in key manufacturing sectors during the most recent recession. However, employment levels have stagnated in the Mountains and in the micropolitan
communities. Figure 29 demonstrates that the metro areas have made the greatest strides in improving their employment and labor force prospects.
Figure 30 illustrates that The Piedmont Triad has not been as successful in new job creation as have Charlotte and Raleigh.
Figure 29: Labor Force and Employment Growth, 2000 to 2005
5.1%
3.4%
6.4%
4.7%
1.5%
-0.1%
2.9%
1.8%
-1%
0%
1%
2%
3%
4%
5%
6%
7%
Labor Force Growth 2000 to 2005 Employment Growth 2000 to 2005
Source: Bureau of Labor Statistics
2000
to 2
005
Gro
wth
North Carolina
Metro
Micro
Rural
Figure 30: Labor Force and Employment Growth by Partnership Region, 2000-2005
1.9%
0.2%
5.6%
3.7%3.4%
1.9%
7.1%
6.5%
2.1%
0.2%
8.1%
6.5%
7.9%
7.1%
0%
1%
2%
3%
4%
5%
6%
7%
8%
9%
Labor Force Growth 2000 to 2005 Employment Growth 2000 to 2005
Source: Bureau of Labor Statistics
2000
to 2
005
Gro
wth
Advantage West Charlotte Eastern Region NortheastPiedmont Triad Research Triangle Southeast
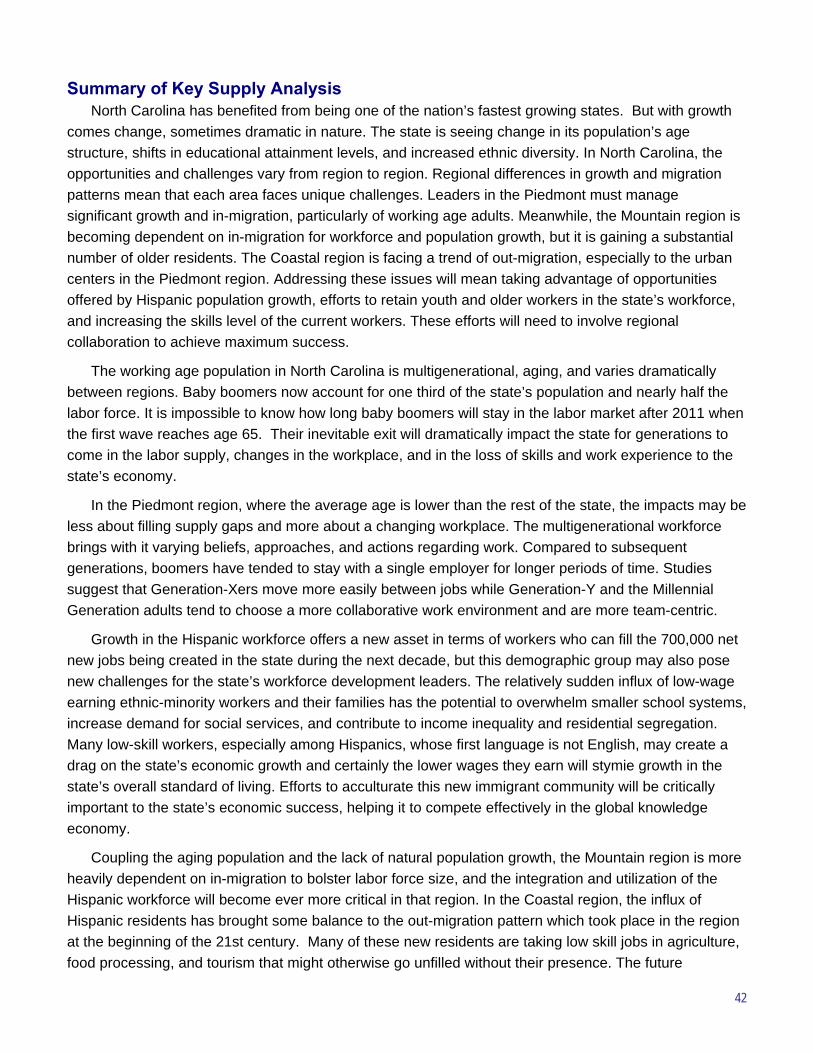
42
Summary of Key Supply Analysis North Carolina has benefited from being one of the nation’s fastest growing states. But with growth
comes change, sometimes dramatic in nature. The state is seeing change in its population’s age structure, shifts in educational attainment levels, and increased ethnic diversity. In North Carolina, the opportunities and challenges vary from region to region. Regional differences in growth and migration patterns mean that each area faces unique challenges. Leaders in the Piedmont must manage significant growth and in-migration, particularly of working age adults. Meanwhile, the Mountain region is becoming dependent on in-migration for workforce and population growth, but it is gaining a substantial number of older residents. The Coastal region is facing a trend of out-migration, especially to the urban centers in the Piedmont region. Addressing these issues will mean taking advantage of opportunities offered by Hispanic population growth, efforts to retain youth and older workers in the state’s workforce, and increasing the skills level of the current workers. These efforts will need to involve regional collaboration to achieve maximum success.
The working age population in North Carolina is multigenerational, aging, and varies dramatically between regions. Baby boomers now account for one third of the state’s population and nearly half the labor force. It is impossible to know how long baby boomers will stay in the labor market after 2011 when the first wave reaches age 65. Their inevitable exit will dramatically impact the state for generations to come in the labor supply, changes in the workplace, and in the loss of skills and work experience to the state’s economy.
In the Piedmont region, where the average age is lower than the rest of the state, the impacts may be less about filling supply gaps and more about a changing workplace. The multigenerational workforce brings with it varying beliefs, approaches, and actions regarding work. Compared to subsequent generations, boomers have tended to stay with a single employer for longer periods of time. Studies suggest that Generation-Xers move more easily between jobs while Generation-Y and the Millennial Generation adults tend to choose a more collaborative work environment and are more team-centric.
Growth in the Hispanic workforce offers a new asset in terms of workers who can fill the 700,000 net new jobs being created in the state during the next decade, but this demographic group may also pose new challenges for the state’s workforce development leaders. The relatively sudden influx of low-wage earning ethnic-minority workers and their families has the potential to overwhelm smaller school systems, increase demand for social services, and contribute to income inequality and residential segregation. Many low-skill workers, especially among Hispanics, whose first language is not English, may create a drag on the state’s economic growth and certainly the lower wages they earn will stymie growth in the state’s overall standard of living. Efforts to acculturate this new immigrant community will be critically important to the state’s economic success, helping it to compete effectively in the global knowledge economy.
Coupling the aging population and the lack of natural population growth, the Mountain region is more heavily dependent on in-migration to bolster labor force size, and the integration and utilization of the Hispanic workforce will become ever more critical in that region. In the Coastal region, the influx of Hispanic residents has brought some balance to the out-migration pattern which took place in the region at the beginning of the 21st century. Many of these new residents are taking low skill jobs in agriculture, food processing, and tourism that might otherwise go unfilled without their presence. The future
43
challenge will be to enhance the skills of the state’s Hispanic workforce to meet increased demands from employers as they adopt new technologies and processes to compete globally. In addition, current challenges involve helping employers overcome barriers to hiring a culturally and linguistically diverse workforce.
Overall, North Carolina has improved its educational attainment levels, but the newly arrived Hispanic workforce has significantly below average levels of formal education. North Carolina continues to have a greater percentage of adults without a high school diploma than the rest of the nation, and increases in educational attainment levels have not been uniform throughout the state. Currently the Piedmont region has the highest educational attainment level, but the data reveals that urban areas have an advantage in attainment levels over their micropolitan and rural counterparts. The state’s traditional dependence on moderate paying low-skilled manufacturing jobs has left many individuals in micropolitan and rural area unprepared for the economic shifts that occurred in the state. This lower attainment level of these displaced workers has hindered the state’s shift from its traditional manufacturing base to a high value-added, knowledge-driven service economy.
Not surprisingly, either many of these lower skilled workers are losing out in the competition for higher wage jobs or they are giving up entirely in the face of greater skill demands from potential employers. High unemployment and low labor force participation rates reflect the inability of unskilled labor to regain decent, family sustaining employment. In micropolitan areas and rural areas, the unemployment rate has consistently been higher than in the metropolitan areas. While the low level of labor force participation is a challenge, it may also reveal a potential opportunity if the state makes investments aimed at improving the skills of this currently underutilized, but potentially valuable workforce.
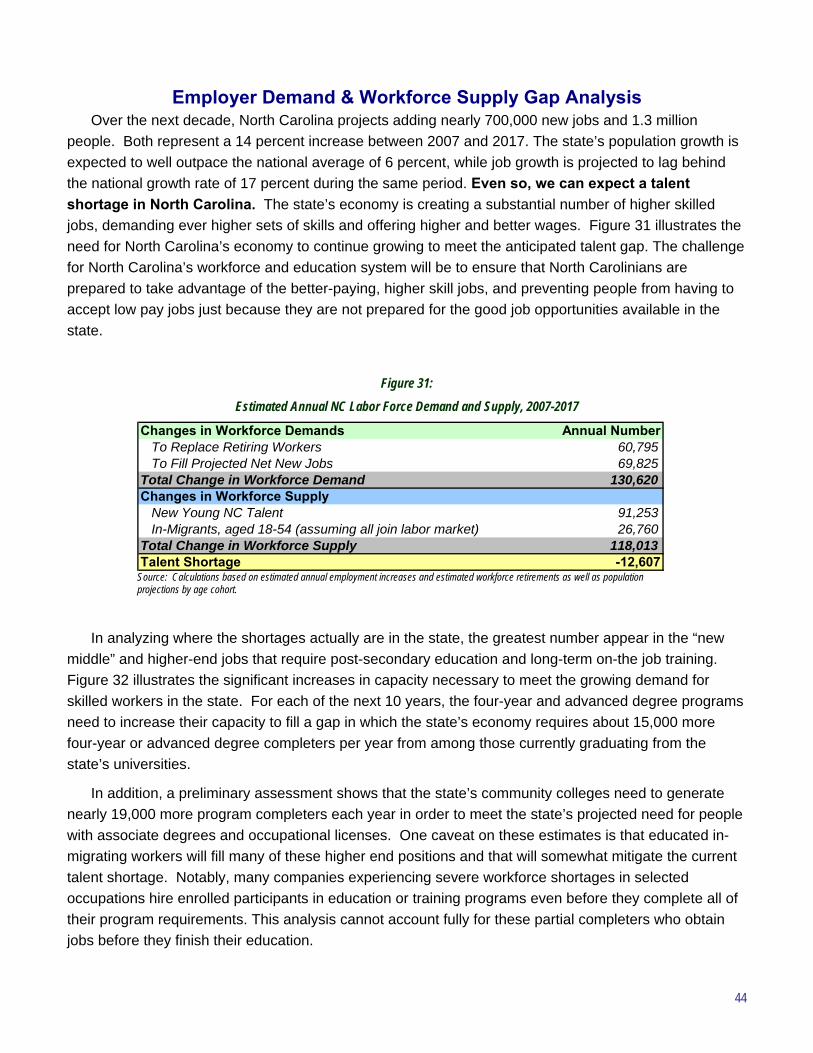
44
Employer Demand & Workforce Supply Gap Analysis Over the next decade, North Carolina projects adding nearly 700,000 new jobs and 1.3 million
people. Both represent a 14 percent increase between 2007 and 2017. The state’s population growth is expected to well outpace the national average of 6 percent, while job growth is projected to lag behind the national growth rate of 17 percent during the same period. Even so, we can expect a talent shortage in North Carolina. The state’s economy is creating a substantial number of higher skilled jobs, demanding ever higher sets of skills and offering higher and better wages. Figure 31 illustrates the need for North Carolina’s economy to continue growing to meet the anticipated talent gap. The challenge for North Carolina’s workforce and education system will be to ensure that North Carolinians are prepared to take advantage of the better-paying, higher skill jobs, and preventing people from having to accept low pay jobs just because they are not prepared for the good job opportunities available in the state.
In analyzing where the shortages actually are in the state, the greatest number appear in the “new middle” and higher-end jobs that require post-secondary education and long-term on-the job training. Figure 32 illustrates the significant increases in capacity necessary to meet the growing demand for skilled workers in the state. For each of the next 10 years, the four-year and advanced degree programs need to increase their capacity to fill a gap in which the state’s economy requires about 15,000 more four-year or advanced degree completers per year from among those currently graduating from the state’s universities.
In addition, a preliminary assessment shows that the state’s community colleges need to generate nearly 19,000 more program completers each year in order to meet the state’s projected need for people with associate degrees and occupational licenses. One caveat on these estimates is that educated in-migrating workers will fill many of these higher end positions and that will somewhat mitigate the current talent shortage. Notably, many companies experiencing severe workforce shortages in selected occupations hire enrolled participants in education or training programs even before they complete all of their program requirements. This analysis cannot account fully for these partial completers who obtain jobs before they finish their education.
Figure 31: Estimated Annual NC Labor Force Demand and Supply, 2007-2017
Changes in Workforce Demands Annual Number To Replace Retiring Workers 60,795 To Fill Projected Net New Jobs 69,825Total Change in Workforce Demand 130,620Changes in Workforce Supply New Young NC Talent 91,253 In-Migrants, aged 18-54 (assuming all join labor market) 26,760Total Change in Workforce Supply 118,013Talent Shortage -12,607
Source: Calculations based on estimated annual employment increases and estimated workforce retirements as well as population projections by age cohort.
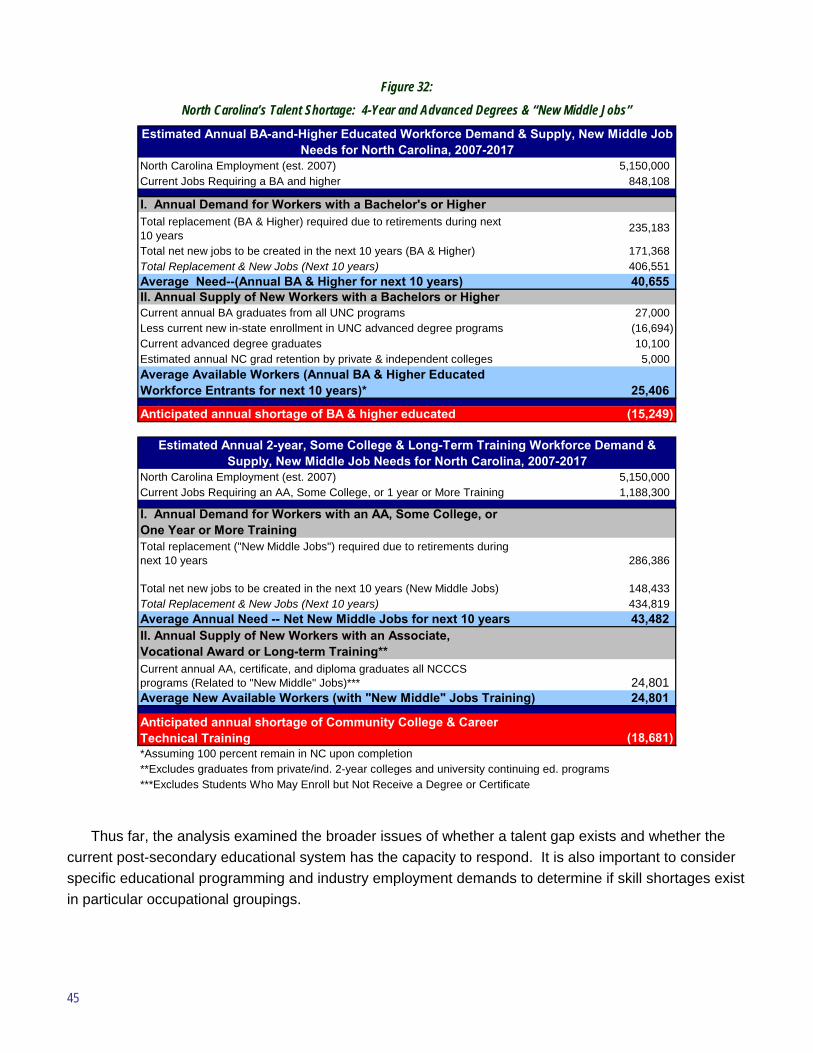
45
Thus far, the analysis examined the broader issues of whether a talent gap exists and whether the current post-secondary educational system has the capacity to respond. It is also important to consider specific educational programming and industry employment demands to determine if skill shortages exist in particular occupational groupings.
Figure 32: North Carolina’s Talent Shortage: 4-Year and Advanced Degrees & “New Middle Jobs”
North Carolina Employment (est. 2007) 5,150,000 Current Jobs Requiring a BA and higher 848,108
235,183
171,368 406,551 40,655
27,000 (16,694) 10,100
5,000
25,406
(15,249)
North Carolina Employment (est. 2007) 5,150,000 Current Jobs Requiring an AA, Some College, or 1 year or More Training 1,188,300
286,386
148,433 Total Replacement & New Jobs (Next 10 years) 434,819 Average Annual Need -- Net New Middle Jobs for next 10 years 43,482
24,801 Average New Available Workers (with "New Middle" Jobs Training) 24,801
(18,681)
Estimated Annual BA-and-Higher Educated Workforce Demand & Supply, New Middle Job Needs for North Carolina, 2007-2017
I. Annual Demand for Workers with a Bachelor's or HigherTotal replacement (BA & Higher) required due to retirements during next 10 years
Total replacement ("New Middle Jobs") required due to retirements during next 10 years
Estimated Annual 2-year, Some College & Long-Term Training Workforce Demand & Supply, New Middle Job Needs for North Carolina, 2007-2017
I. Annual Demand for Workers with an AA, Some College, or One Year or More Training
Total net new jobs to be created in the next 10 years (BA & Higher)Total Replacement & New Jobs (Next 10 years)
II. Annual Supply of New Workers with a Bachelors or HigherCurrent annual BA graduates from all UNC programsLess current new in-state enrollment in UNC advanced degree programsCurrent advanced degree graduatesEstimated annual NC grad retention by private & independent colleges
Average Need--(Annual BA & Higher for next 10 years)
Anticipated annual shortage of Community College & Career Technical Training*Assuming 100 percent remain in NC upon completion
***Excludes Students Who May Enroll but Not Receive a Degree or Certificate
Average Available Workers (Annual BA & Higher Educated Workforce Entrants for next 10 years)*
Anticipated annual shortage of BA & higher educated
Total net new jobs to be created in the next 10 years (New Middle Jobs)
Current annual AA, certificate, and diploma graduates all NCCCS programs (Related to "New Middle" Jobs)***
II. Annual Supply of New Workers with an Associate, Vocational Award or Long-term Training**
**Excludes graduates from private/ind. 2-year colleges and university continuing ed. programs
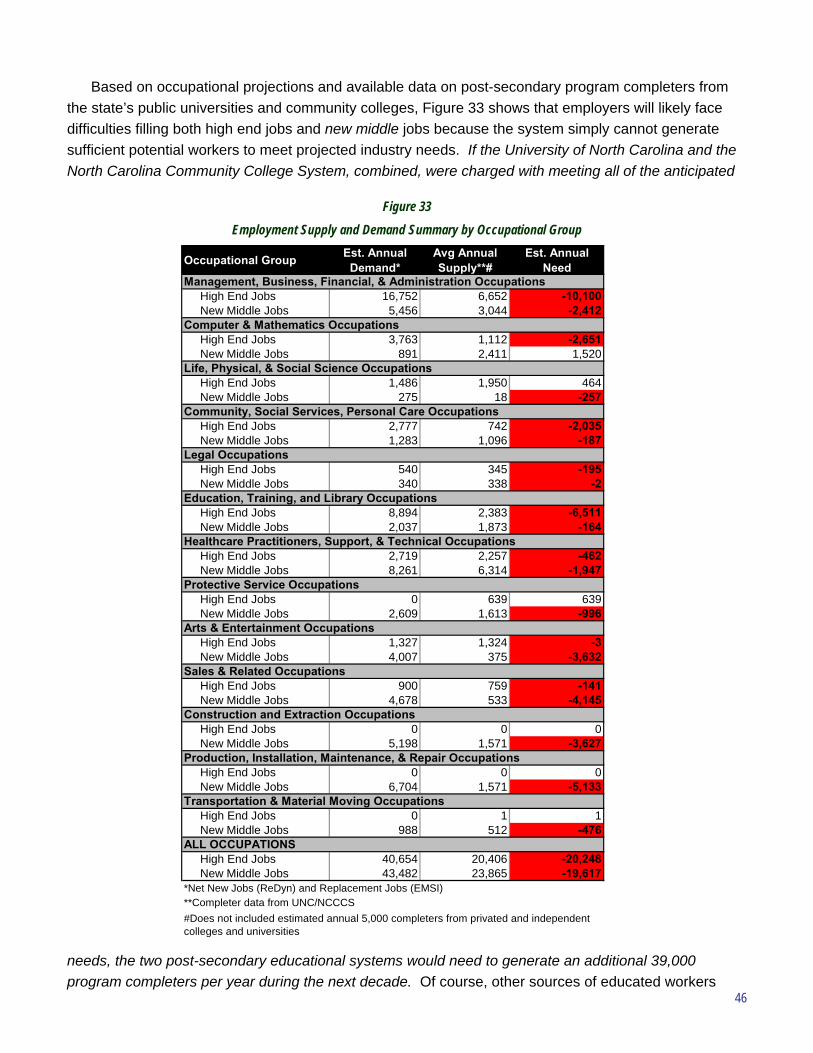
46
Based on occupational projections and available data on post-secondary program completers from the state’s public universities and community colleges, Figure 33 shows that employers will likely face difficulties filling both high end jobs and new middle jobs because the system simply cannot generate sufficient potential workers to meet projected industry needs. If the University of North Carolina and the North Carolina Community College System, combined, were charged with meeting all of the anticipated
needs, the two post-secondary educational systems would need to generate an additional 39,000 program completers per year during the next decade. Of course, other sources of educated workers
Figure 33 Employment Supply and Demand Summary by Occupational Group
Occupational Group Est. Annual Demand*
Avg Annual Supply**#
Est. Annual Need
High End Jobs 16,752 6,652 -10,100 New Middle Jobs 5,456 3,044 -2,412
High End Jobs 3,763 1,112 -2,651 New Middle Jobs 891 2,411 1,520
High End Jobs 1,486 1,950 464 New Middle Jobs 275 18 -257
High End Jobs 2,777 742 -2,035 New Middle Jobs 1,283 1,096 -187
High End Jobs 540 345 -195 New Middle Jobs 340 338 -2
High End Jobs 8,894 2,383 -6,511 New Middle Jobs 2,037 1,873 -164
High End Jobs 2,719 2,257 -462 New Middle Jobs 8,261 6,314 -1,947
High End Jobs 0 639 639 New Middle Jobs 2,609 1,613 -996
High End Jobs 1,327 1,324 -3 New Middle Jobs 4,007 375 -3,632
High End Jobs 900 759 -141 New Middle Jobs 4,678 533 -4,145
High End Jobs 0 0 0 New Middle Jobs 5,198 1,571 -3,627
High End Jobs 0 0 0 New Middle Jobs 6,704 1,571 -5,133
High End Jobs 0 1 1 New Middle Jobs 988 512 -476
High End Jobs 40,654 20,406 -20,248 New Middle Jobs 43,482 23,865 -19,617
Construction and Extraction Occupations
Production, Installation, Maintenance, & Repair Occupations
Transportation & Material Moving Occupations
ALL OCCUPATIONS
*Net New Jobs (ReDyn) and Replacement Jobs (EMSI)**Completer data from UNC/NCCCS#Does not included estimated annual 5,000 completers from privated and independent colleges and universities
Protective Service Occupations
Arts & Entertainment Occupations
Sales & Related Occupations
Community, Social Services, Personal Care Occupations
Legal Occupations
Education, Training, and Library Occupations
Healthcare Practitioners, Support, & Technical Occupations
Management, Business, Financial, & Administration Occupations
Computer & Mathematics Occupations
Life, Physical, & Social Science Occupations
47
(e.g., private and independent colleges and universities, in-migrating workers, long-term incumbent worker training, and informal, on-the-job professional development) will also contribute to filling this pipeline but data are not readily available about the quantity of the supply from these sources.
The following analysis describes how several key occupational groups might be particularly affected by the skilled worker shortage and to what extent the state’s public colleges and universities are producing completers that might be able to meet that demand. 14
• The projected demand for people to fill high end jobs within management, business, financial and administration occupations far outstrips the current estimated supply. To meet projected demand, the post-secondary systems would need to generate about 10,000 more completers. This need is so substantial because these occupations are ubiquitous across industries and are projected to grow rapidly in the coming decade.
• North Carolina needs roughly 6,500 more completers – beyond the current levels – to meet its current annual demand in education, training and library occupations. The teacher shortage is one of the contributing factors to this great need. This represents a mid-point of other forecasts which projected a need for between 2,000 and 10,000 new teachers in the state.
• Construction and extraction occupations represent another set of jobs where demand will increase as the state continues growing. Relative to the current rates of education/training completers, the state will need another 3,600 workers who have completed technical training and long-term job experience to meet projected growth needs. This demand is particularly acute for first-line supervisors and the skilled trades (including experienced carpenters, electricians and plumbers).
• The healthcare occupations will need about 2,400 more completers annually than the educational system is currently providing. Most of those, approximately 2,000 per year, will require at least an associate’s degree, technical training or formalized on-the-job training. In this occupational grouping, nurses and nurse’s aides are two of the occupations where demand is greatest and will likely to continue growing.
• Many of the state’s knowledge-driven industries also face a growing need for filling the computer and mathematics occupations. Statewide, there is an estimated demand for almost 3,800 people with at least a 4-year degree in computer and mathematics, but currently the university system is only producing around 1,100 annually. As a result, the state’s economy requires 2,650 more computer and math workers than are available each year from the educational system.
• Even though the manufacturing sector is declining both nationally and statewide, these occupations still offer tremendous numbers of opportunities and manufacturers are already feeling the pinch as they struggle to find skilled, capable workers. In particular, the remaining manufacturing jobs are demanding increasingly higher levels of skills. Estimations show a projected need each year of 5,100 more people than are being supplied currently from the post-secondary education and training system to fill new middle jobs in production, installation, maintenance, and repair occupations.
In order to support its expanding economy North Carolina will not only need more workers, but it will
also need the right kind of workers. The state will need to find an estimated 40,000 new workers capable of filling the demand for ‘high end’ and ‘new middle’ jobs. In some occupational categories the demand is more acute than others, for instance in management, healthcare or the construction trades. While increasing the capacity of University of North Carolina and North Carolina Community College System represents an important component in filling the gap between employer demand and workforce supply, it is not the only answer. Other sources of skilled workers, such as attracting in-migrants and long-term incumbent worker training programs, will also be necessary to meet these needs.
14 Due to data limitations, this analysis assumes that there is a closed system. As a result, in this analysis North Carolina’s higher education institutions provide the only source of new degreed workers. As a result, it does not take into consideration the in-migration of skilled workers into the state or out-migration of workers from the state. Moreover this analysis does not assume that workers without degrees and higher education will fill positions requiring these levels of educational attainment. Consequently, this analysis cannot present a complete picture of the state’s worker shortages, but it does identify some of the important trends affecting the state’s key occupational groups.
48
Conclusions Brainpower and creativity increasingly outweigh “brawnpower and routine” as the most valued talents
in the global knowledge economy. While the economy demands that more North Carolinians have these skills, many workers are not yet ready to compete. During the past two decades, the state has made rapid strides, but it is not quite keeping pace. Some areas of the state out-perform the US, and gain recognition as global centers of knowledge-driven activities. However, large segments of North Carolina are still transitioning from the 20th century industrial economy that once served as the state’s primary economic foundation.
This report summarizes some of the key issues and challenges facing North Carolina as it moves forward. Those issues and challenges include:
• Many of North Carolina’s traditional manufacturing industries continue to shed jobs as part of an on-going economic transition.
• North Carolina’s traditional “middle jobs”—those that paid a family-sustaining wage and required minimal formal education or training—are disappearing as part of this transition.
• New job creation is concentrating in certain fast-growing metropolitan areas. • Many areas of North Carolina are not prospering from the economic transformation. • The future prosperity of all North Carolinians depends on achieving higher educational attainment levels for
all citizens. • Impending baby-boom retirements will exacerbate an emerging skills gap among experienced, skilled
workers. • High-skill in-migrants will help fill part, but not all, of this skills gap. • Low-skill in-migrants present both opportunities and challenges in meeting the state’s workforce needs.
Making generalizations about North Carolina’s economic trends proves problematic because the regional differences can be so dramatic. For instance, although the state creates many high value-added financial, professional, and technical service jobs requiring four-year and more advanced degrees, these jobs are concentrating in the Research Triangle and Charlotte. Many other areas of the state are underperforming because of their traditional dependence on mature, declining industries such as apparel, textiles, furniture and computer electronics and their inability to find new economic niches. This is the fundamental issue driving the state’s economic divide.
The economic divide is most apparent when one compares the Piedmont to other areas of the state. The micropolitan and rural economies are struggling to keep their best and brightest while Charlotte and the Research Triangle attract single, young, educated adults to meet their talent needs. The Coast and Mountain regions are among the state’s poorest areas and many parts of them offer minimal prospects for new economic activity. In some cases, the communities have used tourism, retail, and retirement attraction as avenues for providing opportunities to local residents. However, many of the jobs associated with these industries are part-time, low paying, and often seasonal in nature. As a result, these disadvantaged regional economies are not creating the kinds of jobs that will retain the best talent. Workers must therefore choose between finding opportunities elsewhere or settling for underemployment.
Even in the Piedmont, all is not well. The Piedmont Triad economy looks much more like the economy of the state’s micropolitan areas than that of Charlotte or the Research Triangle. Like the
49
Mountains and Coast, the Triad’s success in attracting new migrants has focused primarily on those moving to North Carolina for retirement or recreational reasons rather than for economic opportunities. Many areas of the state are losing their working age adults as they struggle to retain their traditional middle jobs as an incentive to support those workers. In short, many parts of the state are seeing their human capital assets follow the employment opportunities concentrated in the state’s two largest metropolitan areas. Understanding these more localized differences will be important in creating effective strategies tailored to the state’s different regions.
Yet, the response to the challenge cannot focus on how the rest of the state is losing to Charlotte and the Research Triangle. On the contrary, even the strongest areas of North Carolina are falling behind the rest of the nation economically. Earnings for North Carolina workers are currently $5,000 less per year than the US average. Even in the Piedmont region, average earnings are below the national average and the mix of new jobs being created is likely to prevent the state’s average earnings from gaining ground on the US. The lower skill jobs being created so rapidly in the state’s economy pay well below average. The opportunities for North Carolina lie in creating more high-end jobs, but the state must have the talent to fill those jobs. For areas outside the Piedmont, this challenge is particularly problematic given the limited number of high-end jobs projected to be created in those regions.
During the next decade, most economic opportunities will continue to occur in North Carolina’s metropolitan counties. While 74 percent of the state’s jobs are found in these counties, 81 percent of new jobs are being created there. Many more of the higher skill, higher paying jobs will follow the people and concentrate in the state’s metropolitan counties. The key issue will be how the state can either help micropolitan and rural areas better link their people and workers to the job opportunities becoming available in the metropolitan areas or create more opportunities for good jobs in the micro and rural areas.
The state’s industry trends also suggest that manufacturing, while it continues to remain important to the economy, will create fewer new jobs than other sectors. However, manufacturing is no monolith and certain segments will do quite well while others continue to struggle. For instance, projections suggest that certain furniture and wood products industries may actually grow during the next decade, driven by construction and other activities that are not part of the traditional commodity furniture industry that served for so long as a critical part of the state’s economy. However, key traditional manufacturing industries, especially apparel and tobacco production will continue shedding workers in the future.
Many of the fastest growing industries are in education, health care, and professional and business services. These industries require, on average, much greater education and a different set of skills than the state’s traditional economic base. The resulting shift away from manufacturing and towards services will give North Carolina an economy that more closely resembles the US economy. As a result, the state’s workforce must more closely reflect the US workforce, with many more high school and college graduates as well as a stronger commitment to workplace learning.
The data clearly show that the returns to education can be quite significant. Occupations with the highest education requirements pay well above the state average. For instance, over a 30 year period the average earnings for a person with a bachelor’s degree is an estimated $1 million greater than the average person with a high school degree plus experience. That said, roughly 60 percent of the state workforce can be found in occupations that require no postsecondary education and minimal on-the-job
50
training. These are the jobs that were traditionally the targets of the state’s workforce development efforts, but they are also the jobs that are at greatest risk to globalization and technological change. Workers in these jobs frequently face barriers that prevent them from investing the time necessary to get the training that would allow workers to move into more skilled jobs. As the economy continues to transition, the training needs will be longer-term and the challenges for unprepared workers seeking to achieve the necessary skills will be exponentially greater.
Since jobs requiring an education pay more, those workers who dropped out of school to take jobs in the state’s traditional manufacturing industries are at great risk of falling further behind in terms of earning potential. As a consequence, the chasm is widening between the unskilled worker and the state’s wide array of available economic opportunities. This is causing North Carolina’s workforce to become increasingly polarized. The traditional ‘middle jobs’ – those that require relatively lower skills but offer near-average wages – are being lost to economic transformation. Meanwhile, the dislocated ‘middle-job’ workers are left with few options but to drift toward lower-skilled, lower paying jobs because they are simply not prepared for the more demanding and better-paying jobs that constitute the ‘new middle jobs.’
The result of that squeeze will be more labor contending for fewer jobs in the traditional middle at the lower end of the skills range, driving down those wages ever lower. As a consequence, North Carolina may be left with a growing number of underemployed or unemployed workers competing for low wage jobs. To find jobs with a family-sustaining wage, these workers must invest significant time and money into training and education to become competitive in the workplace again. As the needs for longer term education and training rise, the workforce system may simply not be ready to respond.
Other challenges to the workforce system can also be found in the demographic make-up of the population left at the lower end of the education spectrum. To achieve a competitive workforce advantage, North Carolina will need all of its talent, but the group that may be in the greatest need of education and training is the state’s rapidly growing Hispanic workforce. Many newly arrived Hispanic North Carolinians use English as their second language, and the large majority of this cohort of migrants are young adult men of working age. One-half of the state’s estimated 276,000 Hispanic adults do not have a high school diploma or equivalency. This in turn poses significant challenges for the state’s community college and public workforce system. This group represents an important opportunity for filling the state’s labor force shortages, especially for skilled and semi-skilled professions. However more than one-third of this group speaks limited English, so education and training responses must be adapted to respond to the needs of a very different linguistic and cultural group.
Despite the influx of a large group of undereducated migrants, the Census Bureau shows that the state continues to make significant progress on its educational attainment levels. Since 1990, the proportion of the population without a high school degree has declined from 30 percent to 18 percent in 2005. Meanwhile the proportion of the population with a bachelor’s degree or higher has risen from 17 percent in 1990 to 25 percent in 2005. However, North Carolina remains about 2 percentage points below the national average in both educational attainment levels. The greatest advances during the past 15 years has been in improving educational attainment levels in the state’s metro areas as well as in the Piedmont region. In these areas, high school and college completion rates are now the same or higher than the national average.
51
Yet again, the labor force in the state’s micropolitan and rural areas continue their struggle to adapt. In these smaller communities, labor force participation is declining. Many former mill workers have given up on the labor market and have settled for lives that rely on temporary jobs, family support, or public assistance. Compared with participation rates in metropolitan areas, the workforce participation rate in rural counties is 12 percent less. Even when they do remain in the labor force, these workers are more likely to be underemployed when compared to the salaries and positions they held in their former careers. Others are taking advantage of the state’s extensive community college network to create their own new opportunities in the knowledge-driven economy. In increasing numbers, these and other North Carolinians are also turning to entrepreneurship as a way to control their own economic future.
Certainly, among the older members of the baby-boom generation, dislocated workers are more likely to opt for early retirement rather than to adapt to a new world of work. With baby boomers now accounting for one third of North Carolina’s working age adults, their impending retirement during the next 10 to 20 years will mean dramatic shifts in the labor market and the workplace. As employers assess the impacts of the impending baby boomer retirement, they must look to replace the most experienced segment of their workforce.
Employers are finding that the outlook for a robust workforce pipeline is not encouraging. An analysis of the talent shortage suggests that the state’s workforce has about 12,000 fewer new workers entering the state’s labor market each year than it needs. That shortage is concentrated at the upper and “new middle” ends of the workforce, where the total shortages may be as high as 34,000 new workers. Shortages among workers with technical skills in business and management as well as health care and education are most significant, but the shortages exist across much of the state’s economic spectrum.
Overall, fewer new people are entering the workforce; consequently, employers must better utilize their existing labor force to fill the future gaps created by a retiring generation of experienced workers and the creation of new higher skill jobs. For example, many employers will need to improve productivity dramatically through technological change because they will never be able to find all the workers they currently need. This shortage may also create opportunities for historically underutilized labor pools in the state’s rural, micropolitan, Mountain, and Coastal areas if the state develops a strategy aimed at linking those areas to the job opportunities available in its fast-growing metropolitan economies.
In order to prosper, employers must adapt to a changing workforce by recognizing diversity, adopting new technologies, offering flexible hours, and responding to a new workplace culture, reflecting the values of the next generation. North Carolina must also find a way to position its ever changing workforce to respond to the myriad challenges—and take full advantage of the new opportunities—arising from a rapidly changing global knowledge economy. As North Carolina’s economy continues to change and create many new well paying jobs, business and industry will continue demanding an increasingly educated, skilled and adaptable workforce.

I
Appendices Appendix 1: Summary of Existing Economic and Workforce Developments Studies and Plans
Appendix 2: 200 Fastest Growing Industries in North Carolina
Appendix 3: NC Selected Occupational Employment Projections
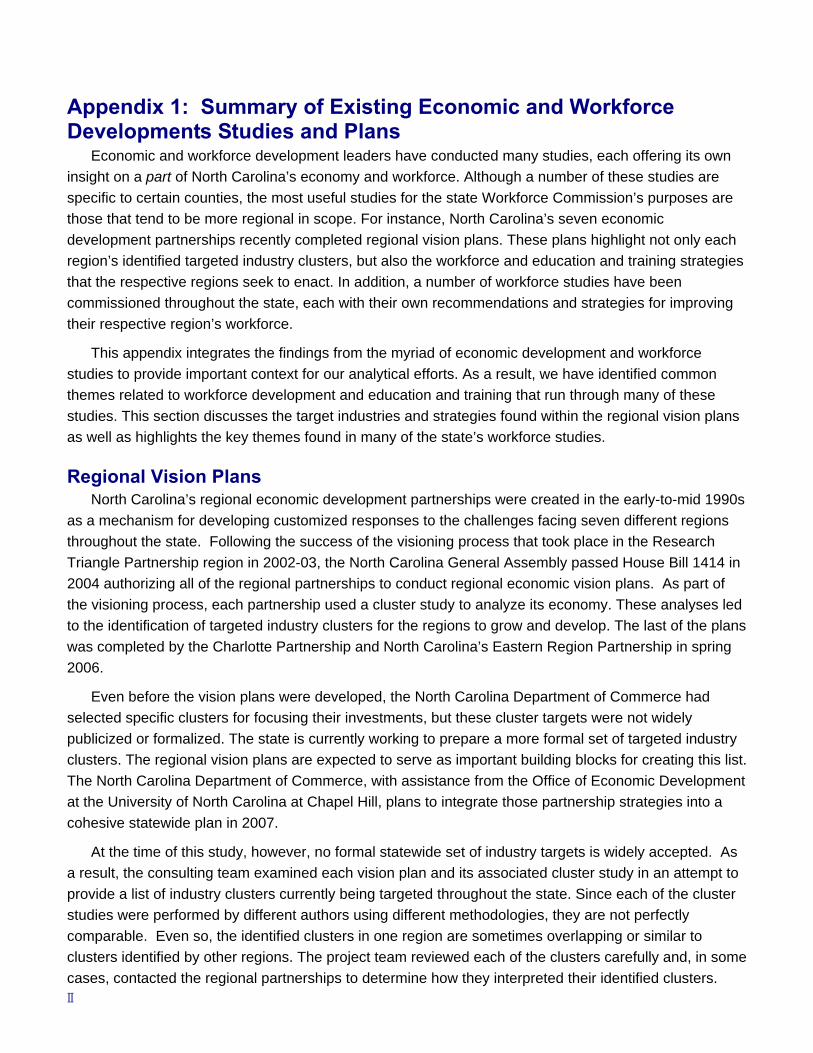
II
Appendix 1: Summary of Existing Economic and Workforce Developments Studies and Plans
Economic and workforce development leaders have conducted many studies, each offering its own insight on a part of North Carolina’s economy and workforce. Although a number of these studies are specific to certain counties, the most useful studies for the state Workforce Commission’s purposes are those that tend to be more regional in scope. For instance, North Carolina’s seven economic development partnerships recently completed regional vision plans. These plans highlight not only each region’s identified targeted industry clusters, but also the workforce and education and training strategies that the respective regions seek to enact. In addition, a number of workforce studies have been commissioned throughout the state, each with their own recommendations and strategies for improving their respective region’s workforce.
This appendix integrates the findings from the myriad of economic development and workforce studies to provide important context for our analytical efforts. As a result, we have identified common themes related to workforce development and education and training that run through many of these studies. This section discusses the target industries and strategies found within the regional vision plans as well as highlights the key themes found in many of the state’s workforce studies.
Regional Vision Plans North Carolina’s regional economic development partnerships were created in the early-to-mid 1990s
as a mechanism for developing customized responses to the challenges facing seven different regions throughout the state. Following the success of the visioning process that took place in the Research Triangle Partnership region in 2002-03, the North Carolina General Assembly passed House Bill 1414 in 2004 authorizing all of the regional partnerships to conduct regional economic vision plans. As part of the visioning process, each partnership used a cluster study to analyze its economy. These analyses led to the identification of targeted industry clusters for the regions to grow and develop. The last of the plans was completed by the Charlotte Partnership and North Carolina’s Eastern Region Partnership in spring 2006.
Even before the vision plans were developed, the North Carolina Department of Commerce had selected specific clusters for focusing their investments, but these cluster targets were not widely publicized or formalized. The state is currently working to prepare a more formal set of targeted industry clusters. The regional vision plans are expected to serve as important building blocks for creating this list. The North Carolina Department of Commerce, with assistance from the Office of Economic Development at the University of North Carolina at Chapel Hill, plans to integrate those partnership strategies into a cohesive statewide plan in 2007.
At the time of this study, however, no formal statewide set of industry targets is widely accepted. As a result, the consulting team examined each vision plan and its associated cluster study in an attempt to provide a list of industry clusters currently being targeted throughout the state. Since each of the cluster studies were performed by different authors using different methodologies, they are not perfectly comparable. Even so, the identified clusters in one region are sometimes overlapping or similar to clusters identified by other regions. The project team reviewed each of the clusters carefully and, in some cases, contacted the regional partnerships to determine how they interpreted their identified clusters.
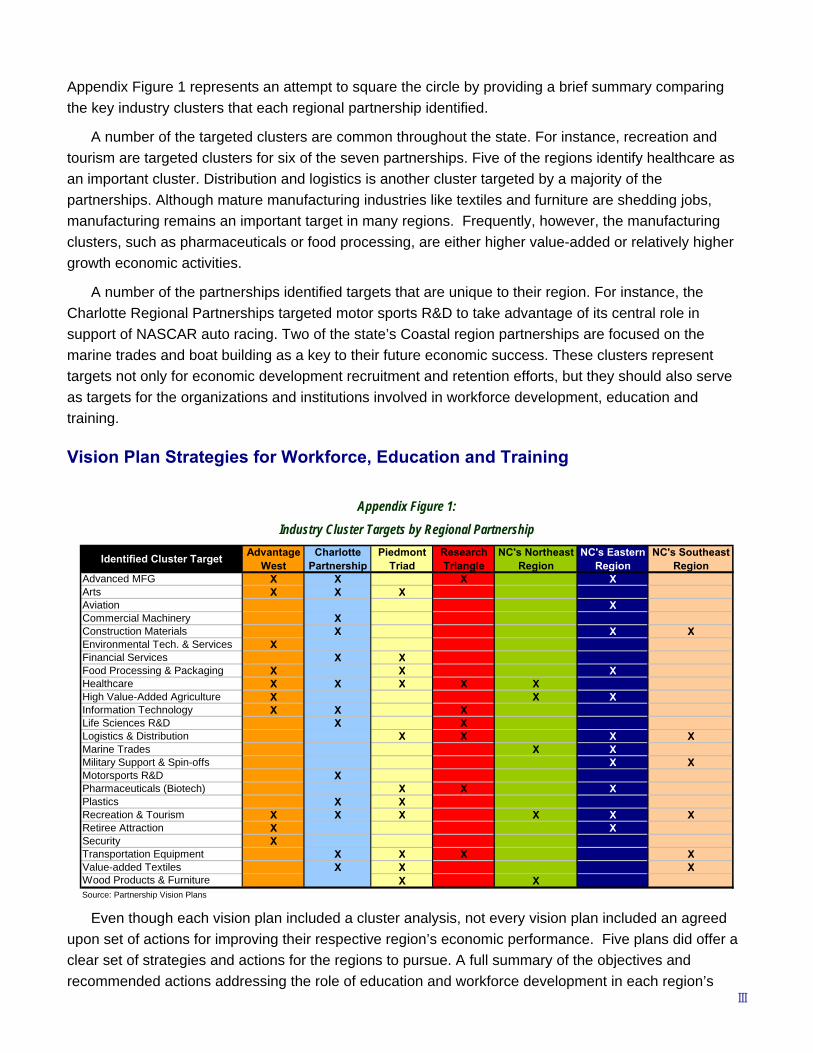
III
Appendix Figure 1 represents an attempt to square the circle by providing a brief summary comparing the key industry clusters that each regional partnership identified.
A number of the targeted clusters are common throughout the state. For instance, recreation and tourism are targeted clusters for six of the seven partnerships. Five of the regions identify healthcare as an important cluster. Distribution and logistics is another cluster targeted by a majority of the partnerships. Although mature manufacturing industries like textiles and furniture are shedding jobs, manufacturing remains an important target in many regions. Frequently, however, the manufacturing clusters, such as pharmaceuticals or food processing, are either higher value-added or relatively higher growth economic activities.
A number of the partnerships identified targets that are unique to their region. For instance, the Charlotte Regional Partnerships targeted motor sports R&D to take advantage of its central role in support of NASCAR auto racing. Two of the state’s Coastal region partnerships are focused on the marine trades and boat building as a key to their future economic success. These clusters represent targets not only for economic development recruitment and retention efforts, but they should also serve as targets for the organizations and institutions involved in workforce development, education and training.
Vision Plan Strategies for Workforce, Education and Training
Even though each vision plan included a cluster analysis, not every vision plan included an agreed upon set of actions for improving their respective region’s economic performance. Five plans did offer a clear set of strategies and actions for the regions to pursue. A full summary of the objectives and recommended actions addressing the role of education and workforce development in each region’s
Appendix Figure 1: Industry Cluster Targets by Regional Partnership
Identified Cluster Target Advantage West
Charlotte Partnership
Piedmont Triad
Research Triangle
NC's Northeast Region
NC's Eastern Region
NC's Southeast Region
Advanced MFG X X X XArts X X XAviation XCommercial Machinery XConstruction Materials X X XEnvironmental Tech. & Services XFinancial Services X XFood Processing & Packaging X X XHealthcare X X X X XHigh Value-Added Agriculture X X XInformation Technology X X XLife Sciences R&D X XLogistics & Distribution X X X XMarine Trades X XMilitary Support & Spin-offs X XMotorsports R&D XPharmaceuticals (Biotech) X X XPlastics X XRecreation & Tourism X X X X X XRetiree Attraction X XSecurity XTransportation Equipment X X X XValue-added Textiles X X XWood Products & Furniture X XSource: Partnership Vision Plans
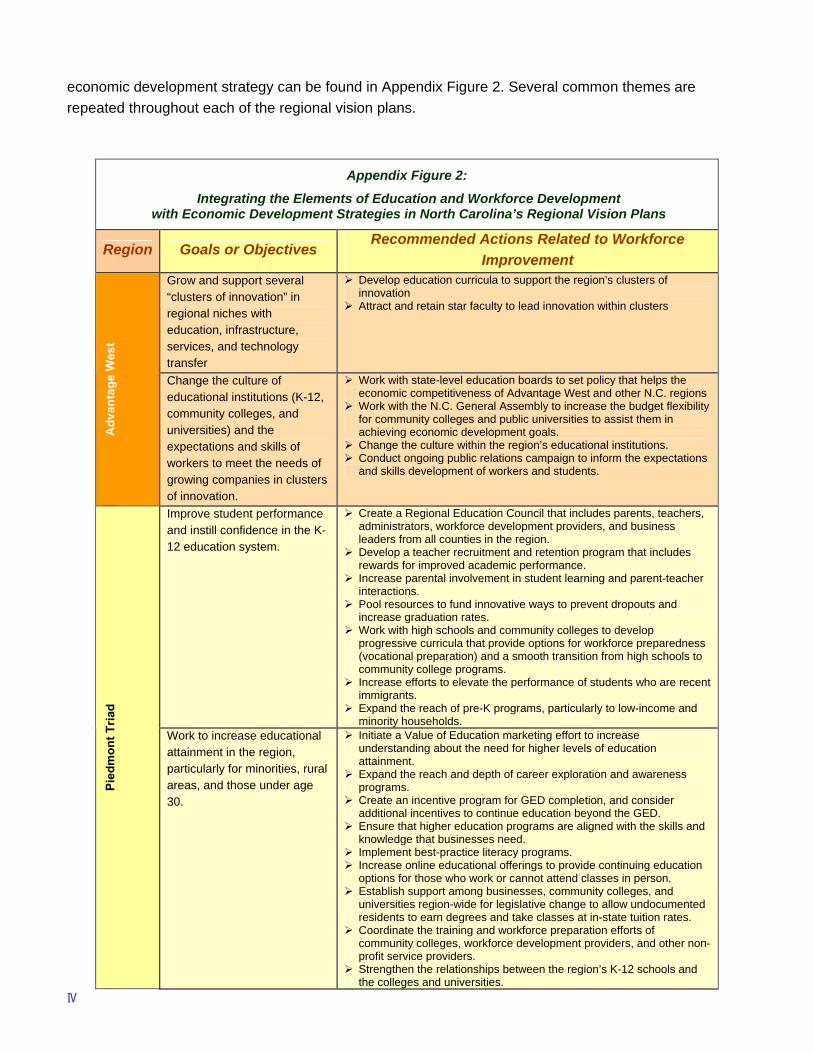
IV
economic development strategy can be found in Appendix Figure 2. Several common themes are repeated throughout each of the regional vision plans.
Appendix Figure 2:
Integrating the Elements of Education and Workforce Development with Economic Development Strategies in North Carolina’s Regional Vision Plans
Region Goals or Objectives Recommended Actions Related to Workforce
Improvement Grow and support several “clusters of innovation” in regional niches with education, infrastructure, services, and technology transfer
Develop education curricula to support the region’s clusters of innovation
Attract and retain star faculty to lead innovation within clusters
Adv
anta
ge W
est
Change the culture of educational institutions (K-12, community colleges, and universities) and the expectations and skills of workers to meet the needs of growing companies in clusters of innovation.
Work with state-level education boards to set policy that helps the economic competitiveness of Advantage West and other N.C. regions
Work with the N.C. General Assembly to increase the budget flexibility for community colleges and public universities to assist them in achieving economic development goals.
Change the culture within the region’s educational institutions. Conduct ongoing public relations campaign to inform the expectations and skills development of workers and students.
Improve student performance and instill confidence in the K-12 education system.
Create a Regional Education Council that includes parents, teachers, administrators, workforce development providers, and business leaders from all counties in the region.
Develop a teacher recruitment and retention program that includes rewards for improved academic performance.
Increase parental involvement in student learning and parent-teacher interactions.
Pool resources to fund innovative ways to prevent dropouts and increase graduation rates.
Work with high schools and community colleges to develop progressive curricula that provide options for workforce preparedness (vocational preparation) and a smooth transition from high schools to community college programs.
Increase efforts to elevate the performance of students who are recent immigrants.
Expand the reach of pre-K programs, particularly to low-income and minority households.
Pied
mon
t Tria
d
Work to increase educational attainment in the region, particularly for minorities, rural areas, and those under age 30.
Initiate a Value of Education marketing effort to increase understanding about the need for higher levels of education attainment.
Expand the reach and depth of career exploration and awareness programs.
Create an incentive program for GED completion, and consider additional incentives to continue education beyond the GED.
Ensure that higher education programs are aligned with the skills and knowledge that businesses need.
Implement best-practice literacy programs. Increase online educational offerings to provide continuing education options for those who work or cannot attend classes in person.
Establish support among businesses, community colleges, and universities region-wide for legislative change to allow undocumented residents to earn degrees and take classes at in-state tuition rates.
Coordinate the training and workforce preparation efforts of community colleges, workforce development providers, and other non-profit service providers.
Strengthen the relationships between the region’s K-12 schools and the colleges and universities.
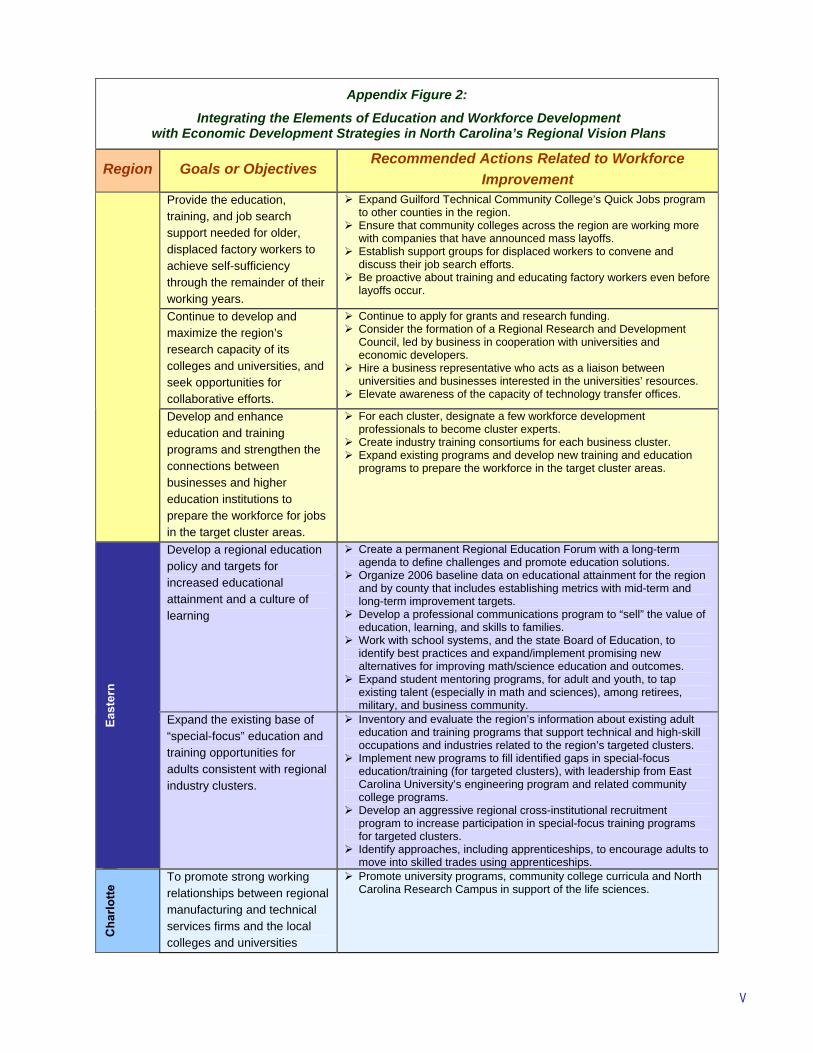
V
Appendix Figure 2:
Integrating the Elements of Education and Workforce Development with Economic Development Strategies in North Carolina’s Regional Vision Plans
Region Goals or Objectives Recommended Actions Related to Workforce
Improvement Provide the education, training, and job search support needed for older, displaced factory workers to achieve self-sufficiency through the remainder of their working years.
Expand Guilford Technical Community College’s Quick Jobs program to other counties in the region.
Ensure that community colleges across the region are working more with companies that have announced mass layoffs.
Establish support groups for displaced workers to convene and discuss their job search efforts.
Be proactive about training and educating factory workers even before layoffs occur.
Continue to develop and maximize the region’s research capacity of its colleges and universities, and seek opportunities for collaborative efforts.
Continue to apply for grants and research funding. Consider the formation of a Regional Research and Development Council, led by business in cooperation with universities and economic developers.
Hire a business representative who acts as a liaison between universities and businesses interested in the universities’ resources.
Elevate awareness of the capacity of technology transfer offices.
Develop and enhance education and training programs and strengthen the connections between businesses and higher education institutions to prepare the workforce for jobs in the target cluster areas.
For each cluster, designate a few workforce development professionals to become cluster experts.
Create industry training consortiums for each business cluster. Expand existing programs and develop new training and education programs to prepare the workforce in the target cluster areas.
Develop a regional education policy and targets for increased educational attainment and a culture of learning
Create a permanent Regional Education Forum with a long-term agenda to define challenges and promote education solutions.
Organize 2006 baseline data on educational attainment for the region and by county that includes establishing metrics with mid-term and long-term improvement targets.
Develop a professional communications program to “sell” the value of education, learning, and skills to families.
Work with school systems, and the state Board of Education, to identify best practices and expand/implement promising new alternatives for improving math/science education and outcomes.
Expand student mentoring programs, for adult and youth, to tap existing talent (especially in math and sciences), among retirees, military, and business community.
East
ern
Expand the existing base of “special-focus” education and training opportunities for adults consistent with regional industry clusters.
Inventory and evaluate the region’s information about existing adult education and training programs that support technical and high-skill occupations and industries related to the region’s targeted clusters.
Implement new programs to fill identified gaps in special-focus education/training (for targeted clusters), with leadership from East Carolina University’s engineering program and related community college programs.
Develop an aggressive regional cross-institutional recruitment program to increase participation in special-focus training programs for targeted clusters.
Identify approaches, including apprenticeships, to encourage adults to move into skilled trades using apprenticeships.
Cha
rlotte
To promote strong working relationships between regional manufacturing and technical services firms and the local colleges and universities
Promote university programs, community college curricula and North Carolina Research Campus in support of the life sciences.
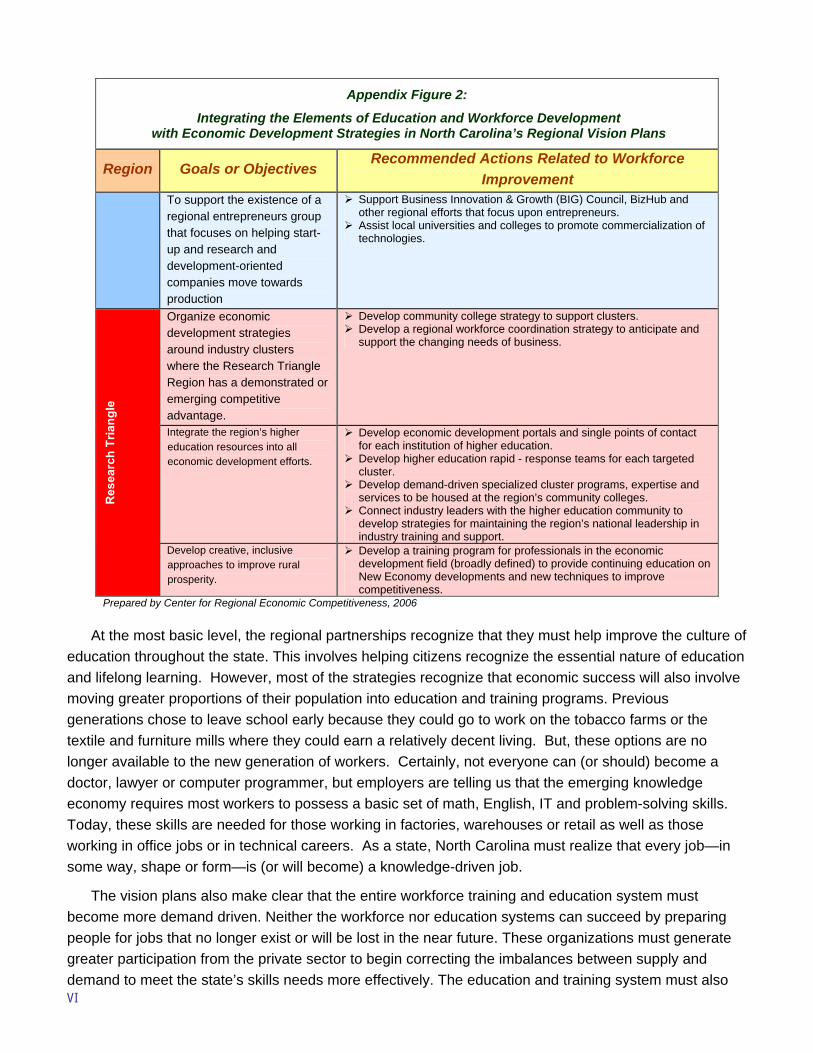
VI
Appendix Figure 2:
Integrating the Elements of Education and Workforce Development with Economic Development Strategies in North Carolina’s Regional Vision Plans
Region Goals or Objectives Recommended Actions Related to Workforce
Improvement To support the existence of a regional entrepreneurs group that focuses on helping start-up and research and development-oriented companies move towards production
Support Business Innovation & Growth (BIG) Council, BizHub and other regional efforts that focus upon entrepreneurs.
Assist local universities and colleges to promote commercialization of technologies.
Organize economic development strategies around industry clusters where the Research Triangle Region has a demonstrated or emerging competitive advantage.
Develop community college strategy to support clusters. Develop a regional workforce coordination strategy to anticipate and support the changing needs of business.
Integrate the region’s higher education resources into all economic development efforts.
Develop economic development portals and single points of contact for each institution of higher education.
Develop higher education rapid - response teams for each targeted cluster.
Develop demand-driven specialized cluster programs, expertise and services to be housed at the region’s community colleges.
Connect industry leaders with the higher education community to develop strategies for maintaining the region’s national leadership in industry training and support.
Res
earc
h Tr
iang
le
Develop creative, inclusive approaches to improve rural prosperity.
Develop a training program for professionals in the economic development field (broadly defined) to provide continuing education on New Economy developments and new techniques to improve competitiveness.
Prepared by Center for Regional Economic Competitiveness, 2006
At the most basic level, the regional partnerships recognize that they must help improve the culture of education throughout the state. This involves helping citizens recognize the essential nature of education and lifelong learning. However, most of the strategies recognize that economic success will also involve moving greater proportions of their population into education and training programs. Previous generations chose to leave school early because they could go to work on the tobacco farms or the textile and furniture mills where they could earn a relatively decent living. But, these options are no longer available to the new generation of workers. Certainly, not everyone can (or should) become a doctor, lawyer or computer programmer, but employers are telling us that the emerging knowledge economy requires most workers to possess a basic set of math, English, IT and problem-solving skills. Today, these skills are needed for those working in factories, warehouses or retail as well as those working in office jobs or in technical careers. As a state, North Carolina must realize that every job—in some way, shape or form—is (or will become) a knowledge-driven job.
The vision plans also make clear that the entire workforce training and education system must become more demand driven. Neither the workforce nor education systems can succeed by preparing people for jobs that no longer exist or will be lost in the near future. These organizations must generate greater participation from the private sector to begin correcting the imbalances between supply and demand to meet the state’s skills needs more effectively. The education and training system must also
VII
become more nimble to provide people with the necessary skills to fill jobs that exist now, rather than two years from now. For the state and the respective regions to successfully grow and develop their targeted industry clusters, workforce and training efforts must also coordinate their efforts with economic development organizations. As a result, most vision plans indicate a need to greater align their region’s education and training resources with the workforce and skill needs of their targeted industry clusters.
Another major current running through the regional vision plans is the need to strengthen and continue building North Carolina’s entrepreneurial culture. While considerable energy and resources goes into industry recruitment, there is growing recognition that the state and its regions must grow its own businesses. Particularly for the state’s more rural areas, employment growth and opportunities are more likely to come from a lot of five-person companies becoming ten-person companies than from local economic developers attracting a single large auto assembly plant. This involves not only providing financial and technical support for entrepreneurs, but also introducing entrepreneurialism into training and education curriculum at all levels—from the middle schools all the way through continuing education programs.
Selected Workforce Development Strategies Already in Place During the past five years, several organizations have conducted studies separate from the regional
economic development vision plans designed to look at the state of the state’s workforce. A few of these projects have been statewide in nature, but most have focused on the needs of small areas, individual counties, workforce regions, or other multi-county areas. The North Carolina Justice Center and the Economic Policy Institute prepared a 2004 study, The State of Working North Carolina. The report noted that labor force growth and participation rates were both declining as workers stopped looking for work. The workers who could find jobs were settling for inferior jobs to the ones lost. The group cited the growing disparity in wages among different groups and the growing income gap that was creating “two North Carolinas.” The group noted that the fastest growing parts of the labor force – new Hispanic workers, lower educated dislocated workers – were not prepared for future work. The authors noted that North Carolina is headed toward a potential crisis as companies demand higher skills for knowledge-based jobs, today’s workers will not be ready.
Another statewide study of the workforce focused on the state’s nursing shortage. The 2004 North Carolina Nursing Task Force consisted of a number of groups participating with the North Carolina Institute of Medicine, including the North Carolina Nurses’ Association, North Carolina Center for Nursing, North Carolina Board of Nursing, North Carolina Area Health Education Centers Program, and the North Carolina Hospital Association. The task force determined that the state overall does not currently have an “extreme shortage” of nurses, but there are shortages in certain areas such as long-term care, certain rural communities, and nursing faculty. The group noted that the current NC nursing workforce situation could deteriorate, however, without concerted action to address an upcoming shortage caused by the aging of the nursing workforce, the declining growth rate in new Registered Nurses in NC, and the state’s increasing reliance on attracting RNs educated outside the state. The group recommended increasing the capacity of nursing programs at the post-secondary level and attracting funding to support these education and training programs.
These two studies provide examples of the kinds of analysis done to date at the state level. Many of the economic development vision plans, highlighted earlier, identify and recommend workforce
VIII
development strategies to prepare the regions. In addition, a number of regional and local workforce organizations, especially the workforce boards, identified their own sets of challenges and strategies aimed at preparing the regional workforces for the global knowledge economy. The following section summarizes key aspects of those studies.
Workforce Strategies in the Mountain Region In the Mountains region, the Appalachian Regional Commission published the most recent study in
2005, “Emerging Patterns of Population Redistribution and Migration in Appalachia,” completed by researchers at Ohio State University. The study highlights the challenges facing the entire Appalachian region from an aging workforce and the continued out-migration of young adults. The study also identifies disparities throughout Appalachia with urban centers, such as Asheville, doing relatively well while the more isolated rural areas continue to lag the rest of the nation substantially.
Asheville, the largest economic engine of the Mountain region, developed a strategic economic development plan in 2003 that identified the need for building on the region’s quality technical education and training programs. Regional leaders expressed concerns about labor productivity and the work ethic of its emerging labor force. Leaders also noted that they lacked the graduates and university research in science and engineering disciplines that the area would need for success.
In 2002, twelve counties in the Mountains and Foothills (including the Hickory, Statesville, and Lincolnton areas spanning the Advantage West and Charlotte Partnership region) came together to develop a strategic economic plan. The Future Forward strategy identified a broad array of issues related to the challenges facing dislocated workers and in finding new companies to replace those jobs. The strategy’s workforce development efforts focused on improving the information exchange among jobseekers and employers, increasing access to two- and four-year educational programs in the region, and increasing public awareness about the importance of post-secondary education for economic success. Project leaders recently helped to raise about $1.5 million to fund and renovate a four-year degree granting engineering center. In addition, Future Forward leaders have worked to attract four-year programs in allied health, teacher education, and the liberal arts.
As early as 2001, Advantage West conducted a labor study and workforce development plan. The study noted that the region did not have a comprehensive workforce development system that could meet the needs of current and future workers. With the manufacturing downturn and an aging workforce, the plan suggested that the region needed to enhance the skills of its workforce and it needed a combined workforce and economic development strategy. That combined strategy was later realized with the completion of the Advantage West vision plan in 2003.
Workforce Strategies in the Piedmont Region The Piedmont region has been replete with numerous workforce and economic development
strategies developed to address the fundamental challenges facing the region. Among these strategies include comprehensive economic development efforts, such as the one completed in 2005 by the Northwest North Carolina Comprehensive Economic Development Strategy (CEDS). The Northwest NC CEDS, covering the Winston-Salem metro area and counties northwest, identified several challenges including the region’s low attainment level and poor alignment of workforce skills with job opportunities. The strategy calls for improving access to the workforce and education system to help those hit hardest

IX
by economic transformation. Reflecting the challenges facing many micropolitan and rural areas, the Northwest Piedmont workforce board also completed a state of the workforce report that highlighted the region’s increased diversity, its aging workforce, its increasing poverty, and the region’s growth in low-wage jobs that do not require an education.
The story for Charlotte was very different. The Centralina Workforce Development Board, serving the counties surrounding Mecklenburg, created their own State of the Workforce Report in 2003. The Charlotte economy is unique in North Carolina in that it is growing faster than the state and nation. The region seeks to develop more entrepreneurial strategies and become a leader in developing sector-specific strategies.
The Durham Strategic Workforce Development Plan, completed in May 2005, tells the story of two North Carolinas in one county. The strategy notes that employers are having a difficult time finding workers to fill high skill jobs while many jobseekers are facing barriers to employment caused by poverty. The Research Triangle Park, located in Durham County, saw substantial downsizing during the first part of the decade and many well educated workers lost their jobs, but the public workforce system was simply unable to respond. Today, the Park and surrounding areas are adding jobs very rapidly, but Durham’s workforce system has not yet determined how best to adapt to a job market that requires high skill workers and relies more on technology to recruit workers. Fragmentation among service providers inhibits information sharing and slows the system’s ability to respond to employer needs.
Workforce Strategies in the Coastal Region Studies in the Coastal region have found that population and labor force growth have lagged the rest
of the state and the nation. In the Economic and Demographic Profile of North Carolina’s Eastern Region, completed in December 2003, study authors note a large increase in the age of Coastal residents. The study also noted that some counties in the region were experiencing negative population growth, despite the overall rapid population increases that the state is experiencing. While unemployment rates are dropping, labor force participation rates are declining in the region as well. The low educational attainment levels are creating further barriers to employment. Increasingly, the region is coming to rely on healthcare, services, and the military for jobs.
The State of the Workforce report, completed in 2006, for Eastern Carolina’s Workforce Development Board found large growth in the region’s Hispanic population and an aging workforce. In responding to the challenges, the report calls for increases in entrepreneurship and building on the cluster-based industry strategy developed as part of the Eastern Regional Partnership’s vision plan.
In closing this section, the discussion of workforce and economic development studies is in no way meant to provide a complete inventory. Instead, the review is simply designed to provide a sample of the kinds of research that is being done and the findings from those studies. It is instructive to learn that this report’s demand and supply analysis validate many of the findings about the workforce supply included in the various studies already prepared. Furthermore, the demand analysis done for this study provides additional detail about the job opportunities available to training and education participants.
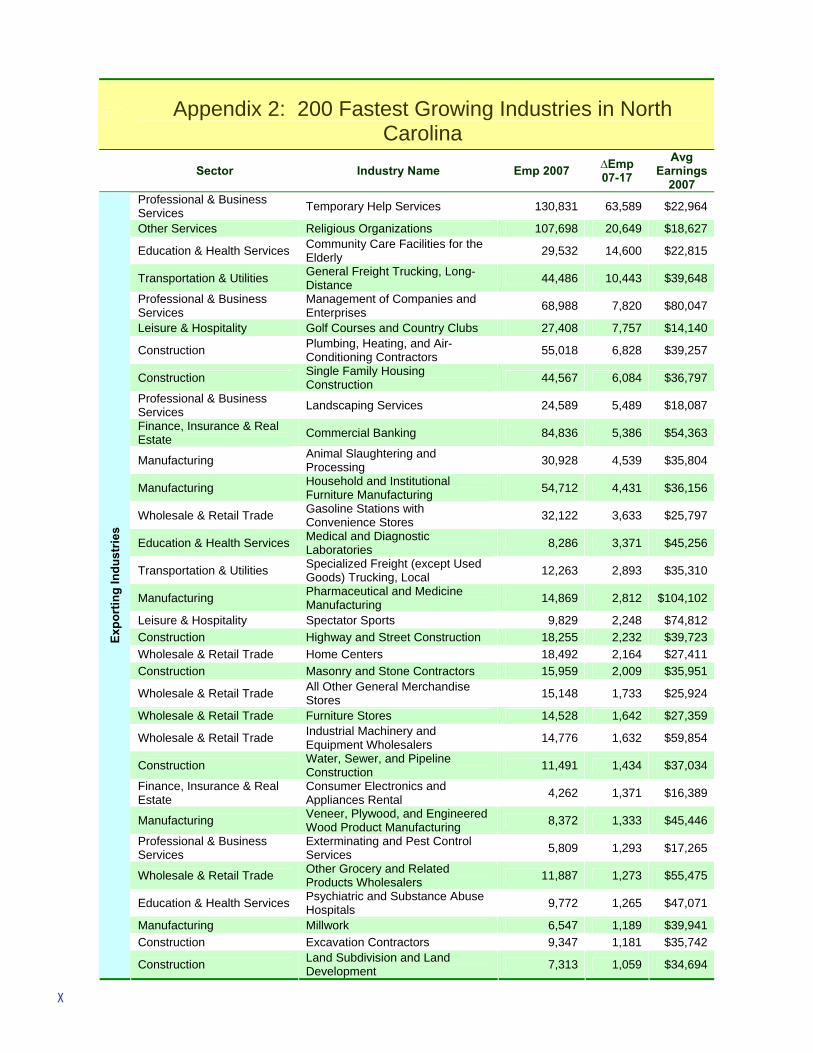
X
Appendix 2: 200 Fastest Growing Industries in North Carolina
Sector Industry Name Emp 2007 ∆Emp 07-17
Avg Earnings
2007 Professional & Business Services Temporary Help Services 130,831 63,589 $22,964
Other Services Religious Organizations 107,698 20,649 $18,627
Education & Health Services Community Care Facilities for the Elderly 29,532 14,600 $22,815
Transportation & Utilities General Freight Trucking, Long-Distance 44,486 10,443 $39,648
Professional & Business Services
Management of Companies and Enterprises 68,988 7,820 $80,047
Leisure & Hospitality Golf Courses and Country Clubs 27,408 7,757 $14,140
Construction Plumbing, Heating, and Air-Conditioning Contractors 55,018 6,828 $39,257
Construction Single Family Housing Construction 44,567 6,084 $36,797
Professional & Business Services Landscaping Services 24,589 5,489 $18,087
Finance, Insurance & Real Estate Commercial Banking 84,836 5,386 $54,363
Manufacturing Animal Slaughtering and Processing 30,928 4,539 $35,804
Manufacturing Household and Institutional Furniture Manufacturing 54,712 4,431 $36,156
Wholesale & Retail Trade Gasoline Stations with Convenience Stores 32,122 3,633 $25,797
Education & Health Services Medical and Diagnostic Laboratories 8,286 3,371 $45,256
Transportation & Utilities Specialized Freight (except Used Goods) Trucking, Local 12,263 2,893 $35,310
Manufacturing Pharmaceutical and Medicine Manufacturing 14,869 2,812 $104,102
Leisure & Hospitality Spectator Sports 9,829 2,248 $74,812 Construction Highway and Street Construction 18,255 2,232 $39,723 Wholesale & Retail Trade Home Centers 18,492 2,164 $27,411 Construction Masonry and Stone Contractors 15,959 2,009 $35,951
Wholesale & Retail Trade All Other General Merchandise Stores 15,148 1,733 $25,924
Wholesale & Retail Trade Furniture Stores 14,528 1,642 $27,359
Wholesale & Retail Trade Industrial Machinery and Equipment Wholesalers 14,776 1,632 $59,854
Construction Water, Sewer, and Pipeline Construction 11,491 1,434 $37,034
Finance, Insurance & Real Estate
Consumer Electronics and Appliances Rental 4,262 1,371 $16,389
Manufacturing Veneer, Plywood, and Engineered Wood Product Manufacturing 8,372 1,333 $45,446
Professional & Business Services
Exterminating and Pest Control Services 5,809 1,293 $17,265
Wholesale & Retail Trade Other Grocery and Related Products Wholesalers 11,887 1,273 $55,475
Education & Health Services Psychiatric and Substance Abuse Hospitals 9,772 1,265 $47,071
Manufacturing Millwork 6,547 1,189 $39,941 Construction Excavation Contractors 9,347 1,181 $35,742
Expo
rtin
g In
dust
ries
Construction Land Subdivision and Land Development 7,313 1,059 $34,694
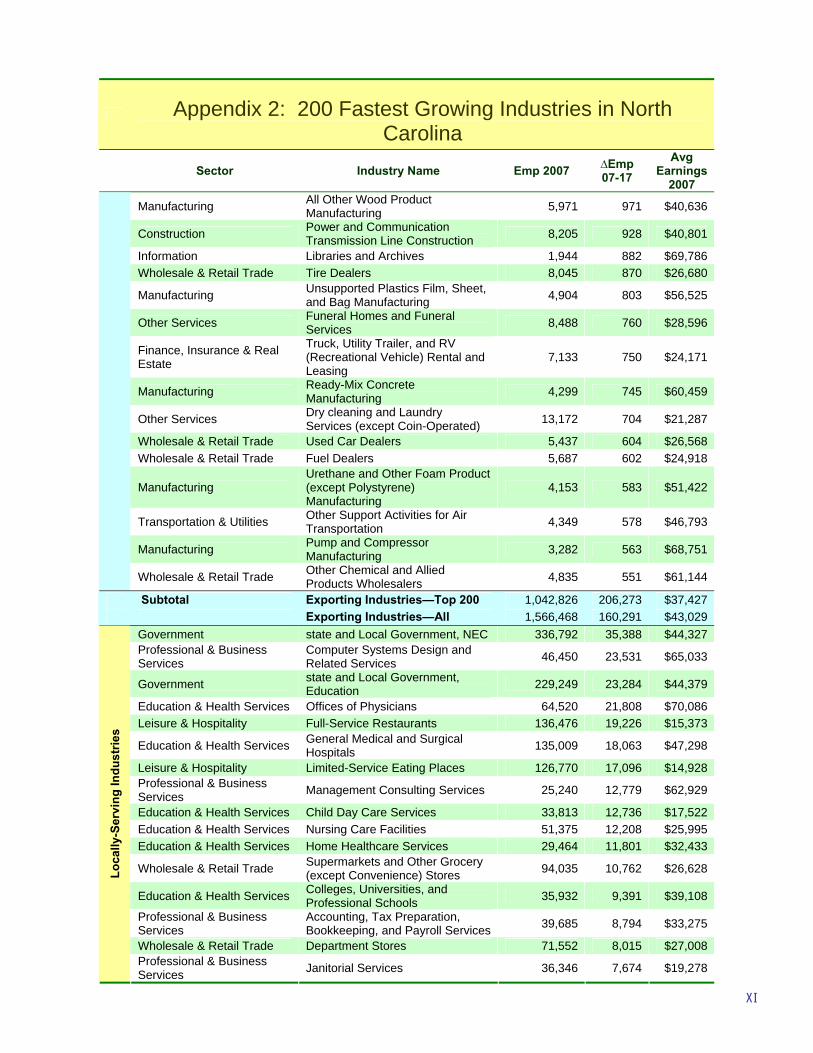
XI
Appendix 2: 200 Fastest Growing Industries in North Carolina
Sector Industry Name Emp 2007 ∆Emp 07-17
Avg Earnings
2007
Manufacturing All Other Wood Product Manufacturing 5,971 971 $40,636
Construction Power and Communication Transmission Line Construction 8,205 928 $40,801
Information Libraries and Archives 1,944 882 $69,786 Wholesale & Retail Trade Tire Dealers 8,045 870 $26,680
Manufacturing Unsupported Plastics Film, Sheet, and Bag Manufacturing 4,904 803 $56,525
Other Services Funeral Homes and Funeral Services 8,488 760 $28,596
Finance, Insurance & Real Estate
Truck, Utility Trailer, and RV (Recreational Vehicle) Rental and Leasing
7,133 750 $24,171
Manufacturing Ready-Mix Concrete Manufacturing 4,299 745 $60,459
Other Services Dry cleaning and Laundry Services (except Coin-Operated) 13,172 704 $21,287
Wholesale & Retail Trade Used Car Dealers 5,437 604 $26,568 Wholesale & Retail Trade Fuel Dealers 5,687 602 $24,918
Manufacturing Urethane and Other Foam Product (except Polystyrene) Manufacturing
4,153 583 $51,422
Transportation & Utilities Other Support Activities for Air Transportation 4,349 578 $46,793
Manufacturing Pump and Compressor Manufacturing 3,282 563 $68,751
Wholesale & Retail Trade Other Chemical and Allied Products Wholesalers 4,835 551 $61,144
Subtotal Exporting Industries—Top 200 1,042,826 206,273 $37,427 Exporting Industries—All 1,566,468 160,291 $43,029
Government state and Local Government, NEC 336,792 35,388 $44,327 Professional & Business Services
Computer Systems Design and Related Services 46,450 23,531 $65,033
Government state and Local Government, Education 229,249 23,284 $44,379
Education & Health Services Offices of Physicians 64,520 21,808 $70,086 Leisure & Hospitality Full-Service Restaurants 136,476 19,226 $15,373
Education & Health Services General Medical and Surgical Hospitals 135,009 18,063 $47,298
Leisure & Hospitality Limited-Service Eating Places 126,770 17,096 $14,928 Professional & Business Services Management Consulting Services 25,240 12,779 $62,929
Education & Health Services Child Day Care Services 33,813 12,736 $17,522 Education & Health Services Nursing Care Facilities 51,375 12,208 $25,995 Education & Health Services Home Healthcare Services 29,464 11,801 $32,433
Wholesale & Retail Trade Supermarkets and Other Grocery (except Convenience) Stores 94,035 10,762 $26,628
Education & Health Services Colleges, Universities, and Professional Schools 35,932 9,391 $39,108
Professional & Business Services
Accounting, Tax Preparation, Bookkeeping, and Payroll Services 39,685 8,794 $33,275
Wholesale & Retail Trade Department Stores 71,552 8,015 $27,008
Loca
lly-S
ervi
ng In
dust
ries
Professional & Business Services Janitorial Services 36,346 7,674 $19,278
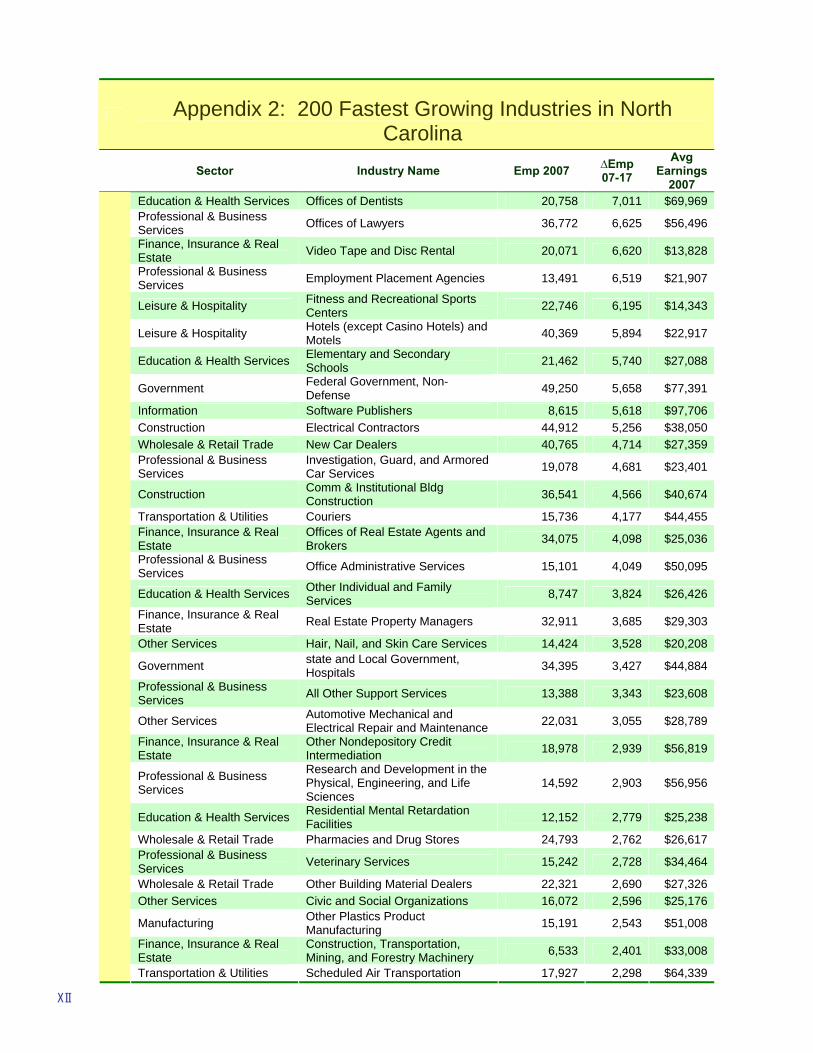
XII
Appendix 2: 200 Fastest Growing Industries in North Carolina
Sector Industry Name Emp 2007 ∆Emp 07-17
Avg Earnings
2007 Education & Health Services Offices of Dentists 20,758 7,011 $69,969 Professional & Business Services Offices of Lawyers 36,772 6,625 $56,496
Finance, Insurance & Real Estate Video Tape and Disc Rental 20,071 6,620 $13,828
Professional & Business Services Employment Placement Agencies 13,491 6,519 $21,907
Leisure & Hospitality Fitness and Recreational Sports Centers 22,746 6,195 $14,343
Leisure & Hospitality Hotels (except Casino Hotels) and Motels 40,369 5,894 $22,917
Education & Health Services Elementary and Secondary Schools 21,462 5,740 $27,088
Government Federal Government, Non-Defense 49,250 5,658 $77,391
Information Software Publishers 8,615 5,618 $97,706 Construction Electrical Contractors 44,912 5,256 $38,050 Wholesale & Retail Trade New Car Dealers 40,765 4,714 $27,359 Professional & Business Services
Investigation, Guard, and Armored Car Services 19,078 4,681 $23,401
Construction Comm & Institutional Bldg Construction 36,541 4,566 $40,674
Transportation & Utilities Couriers 15,736 4,177 $44,455 Finance, Insurance & Real Estate
Offices of Real Estate Agents and Brokers 34,075 4,098 $25,036
Professional & Business Services Office Administrative Services 15,101 4,049 $50,095
Education & Health Services Other Individual and Family Services 8,747 3,824 $26,426
Finance, Insurance & Real Estate Real Estate Property Managers 32,911 3,685 $29,303
Other Services Hair, Nail, and Skin Care Services 14,424 3,528 $20,208
Government state and Local Government, Hospitals 34,395 3,427 $44,884
Professional & Business Services All Other Support Services 13,388 3,343 $23,608
Other Services Automotive Mechanical and Electrical Repair and Maintenance 22,031 3,055 $28,789
Finance, Insurance & Real Estate
Other Nondepository Credit Intermediation 18,978 2,939 $56,819
Professional & Business Services
Research and Development in the Physical, Engineering, and Life Sciences
14,592 2,903 $56,956
Education & Health Services Residential Mental Retardation Facilities 12,152 2,779 $25,238
Wholesale & Retail Trade Pharmacies and Drug Stores 24,793 2,762 $26,617 Professional & Business Services Veterinary Services 15,242 2,728 $34,464
Wholesale & Retail Trade Other Building Material Dealers 22,321 2,690 $27,326 Other Services Civic and Social Organizations 16,072 2,596 $25,176
Manufacturing Other Plastics Product Manufacturing 15,191 2,543 $51,008
Finance, Insurance & Real Estate
Construction, Transportation, Mining, and Forestry Machinery 6,533 2,401 $33,008
Transportation & Utilities Scheduled Air Transportation 17,927 2,298 $64,339
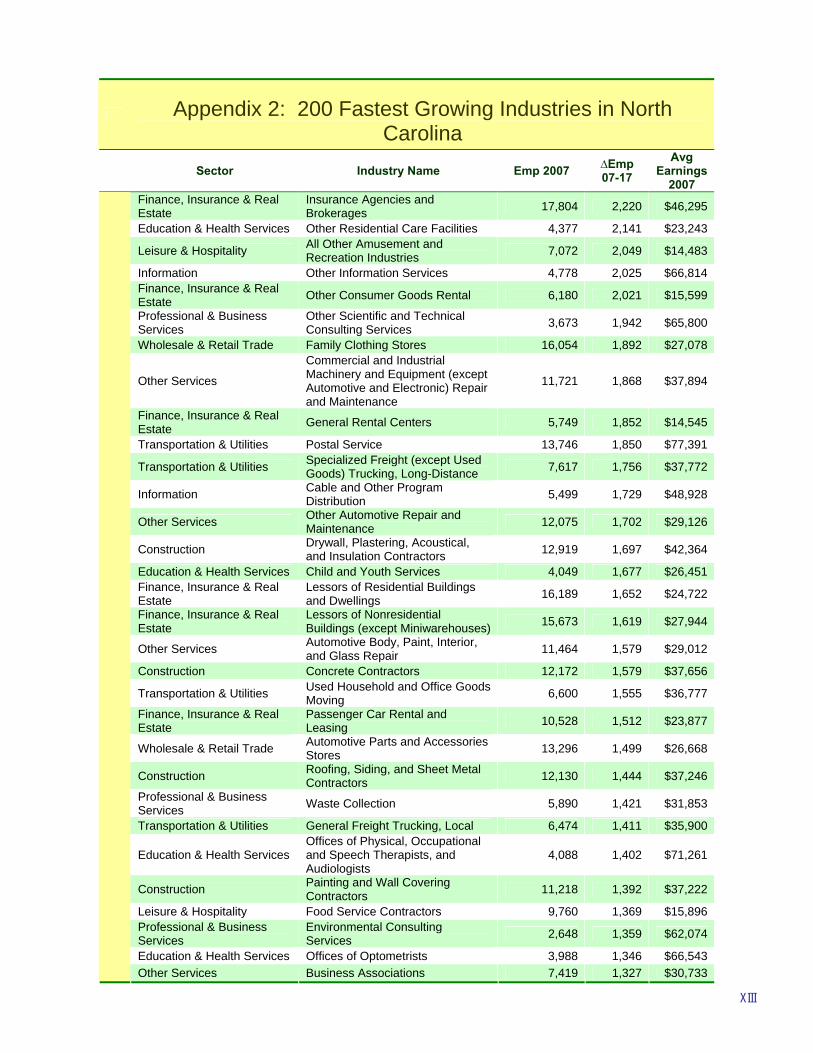
XIII
Appendix 2: 200 Fastest Growing Industries in North Carolina
Sector Industry Name Emp 2007 ∆Emp 07-17
Avg Earnings
2007 Finance, Insurance & Real Estate
Insurance Agencies and Brokerages 17,804 2,220 $46,295
Education & Health Services Other Residential Care Facilities 4,377 2,141 $23,243
Leisure & Hospitality All Other Amusement and Recreation Industries 7,072 2,049 $14,483
Information Other Information Services 4,778 2,025 $66,814 Finance, Insurance & Real Estate Other Consumer Goods Rental 6,180 2,021 $15,599
Professional & Business Services
Other Scientific and Technical Consulting Services 3,673 1,942 $65,800
Wholesale & Retail Trade Family Clothing Stores 16,054 1,892 $27,078
Other Services
Commercial and Industrial Machinery and Equipment (except Automotive and Electronic) Repair and Maintenance
11,721 1,868 $37,894
Finance, Insurance & Real Estate General Rental Centers 5,749 1,852 $14,545
Transportation & Utilities Postal Service 13,746 1,850 $77,391
Transportation & Utilities Specialized Freight (except Used Goods) Trucking, Long-Distance 7,617 1,756 $37,772
Information Cable and Other Program Distribution 5,499 1,729 $48,928
Other Services Other Automotive Repair and Maintenance 12,075 1,702 $29,126
Construction Drywall, Plastering, Acoustical, and Insulation Contractors 12,919 1,697 $42,364
Education & Health Services Child and Youth Services 4,049 1,677 $26,451 Finance, Insurance & Real Estate
Lessors of Residential Buildings and Dwellings 16,189 1,652 $24,722
Finance, Insurance & Real Estate
Lessors of Nonresidential Buildings (except Miniwarehouses) 15,673 1,619 $27,944
Other Services Automotive Body, Paint, Interior, and Glass Repair 11,464 1,579 $29,012
Construction Concrete Contractors 12,172 1,579 $37,656
Transportation & Utilities Used Household and Office Goods Moving 6,600 1,555 $36,777
Finance, Insurance & Real Estate
Passenger Car Rental and Leasing 10,528 1,512 $23,877
Wholesale & Retail Trade Automotive Parts and Accessories Stores 13,296 1,499 $26,668
Construction Roofing, Siding, and Sheet Metal Contractors 12,130 1,444 $37,246
Professional & Business Services Waste Collection 5,890 1,421 $31,853
Transportation & Utilities General Freight Trucking, Local 6,474 1,411 $35,900
Education & Health Services Offices of Physical, Occupational and Speech Therapists, and Audiologists
4,088 1,402 $71,261
Construction Painting and Wall Covering Contractors 11,218 1,392 $37,222
Leisure & Hospitality Food Service Contractors 9,760 1,369 $15,896 Professional & Business Services
Environmental Consulting Services 2,648 1,359 $62,074
Education & Health Services Offices of Optometrists 3,988 1,346 $66,543 Other Services Business Associations 7,419 1,327 $30,733
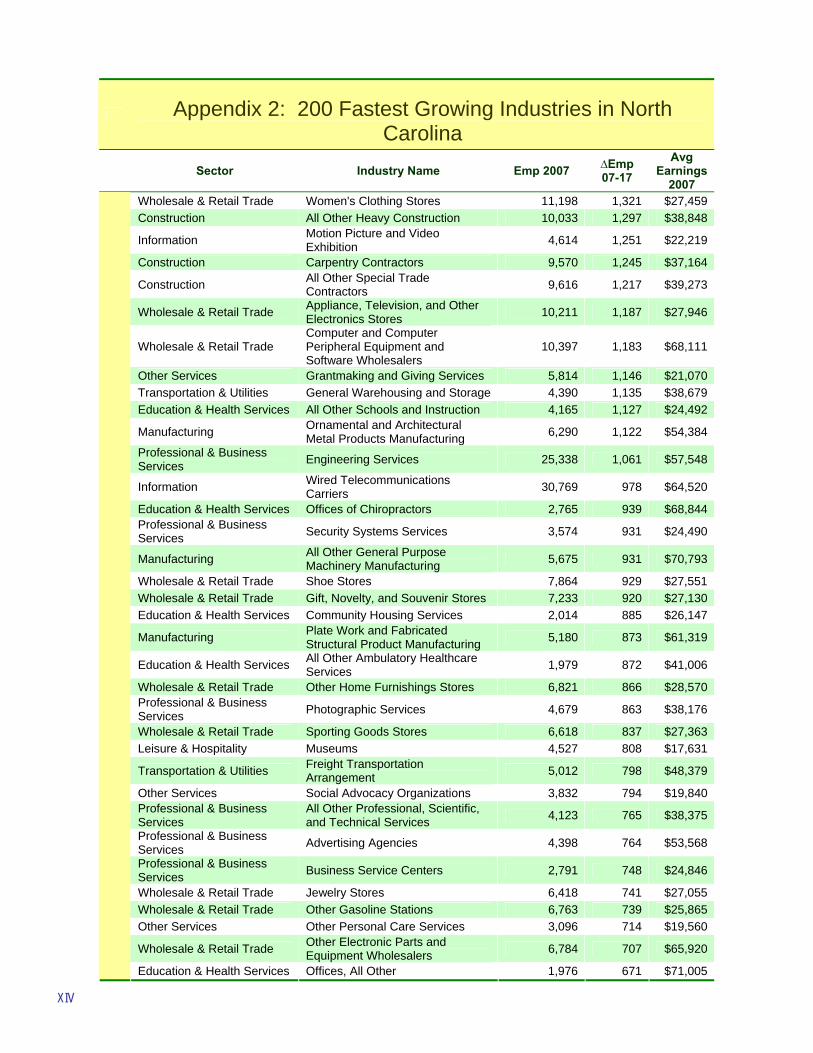
XIV
Appendix 2: 200 Fastest Growing Industries in North Carolina
Sector Industry Name Emp 2007 ∆Emp 07-17
Avg Earnings
2007 Wholesale & Retail Trade Women's Clothing Stores 11,198 1,321 $27,459 Construction All Other Heavy Construction 10,033 1,297 $38,848
Information Motion Picture and Video Exhibition 4,614 1,251 $22,219
Construction Carpentry Contractors 9,570 1,245 $37,164
Construction All Other Special Trade Contractors 9,616 1,217 $39,273
Wholesale & Retail Trade Appliance, Television, and Other Electronics Stores 10,211 1,187 $27,946
Wholesale & Retail Trade Computer and Computer Peripheral Equipment and Software Wholesalers
10,397 1,183 $68,111
Other Services Grantmaking and Giving Services 5,814 1,146 $21,070 Transportation & Utilities General Warehousing and Storage 4,390 1,135 $38,679 Education & Health Services All Other Schools and Instruction 4,165 1,127 $24,492
Manufacturing Ornamental and Architectural Metal Products Manufacturing 6,290 1,122 $54,384
Professional & Business Services Engineering Services 25,338 1,061 $57,548
Information Wired Telecommunications Carriers 30,769 978 $64,520
Education & Health Services Offices of Chiropractors 2,765 939 $68,844 Professional & Business Services Security Systems Services 3,574 931 $24,490
Manufacturing All Other General Purpose Machinery Manufacturing 5,675 931 $70,793
Wholesale & Retail Trade Shoe Stores 7,864 929 $27,551 Wholesale & Retail Trade Gift, Novelty, and Souvenir Stores 7,233 920 $27,130 Education & Health Services Community Housing Services 2,014 885 $26,147
Manufacturing Plate Work and Fabricated Structural Product Manufacturing 5,180 873 $61,319
Education & Health Services All Other Ambulatory Healthcare Services 1,979 872 $41,006
Wholesale & Retail Trade Other Home Furnishings Stores 6,821 866 $28,570 Professional & Business Services Photographic Services 4,679 863 $38,176
Wholesale & Retail Trade Sporting Goods Stores 6,618 837 $27,363 Leisure & Hospitality Museums 4,527 808 $17,631
Transportation & Utilities Freight Transportation Arrangement 5,012 798 $48,379
Other Services Social Advocacy Organizations 3,832 794 $19,840 Professional & Business Services
All Other Professional, Scientific, and Technical Services 4,123 765 $38,375
Professional & Business Services Advertising Agencies 4,398 764 $53,568
Professional & Business Services Business Service Centers 2,791 748 $24,846
Wholesale & Retail Trade Jewelry Stores 6,418 741 $27,055 Wholesale & Retail Trade Other Gasoline Stations 6,763 739 $25,865 Other Services Other Personal Care Services 3,096 714 $19,560
Wholesale & Retail Trade Other Electronic Parts and Equipment Wholesalers 6,784 707 $65,920
Education & Health Services Offices, All Other 1,976 671 $71,005
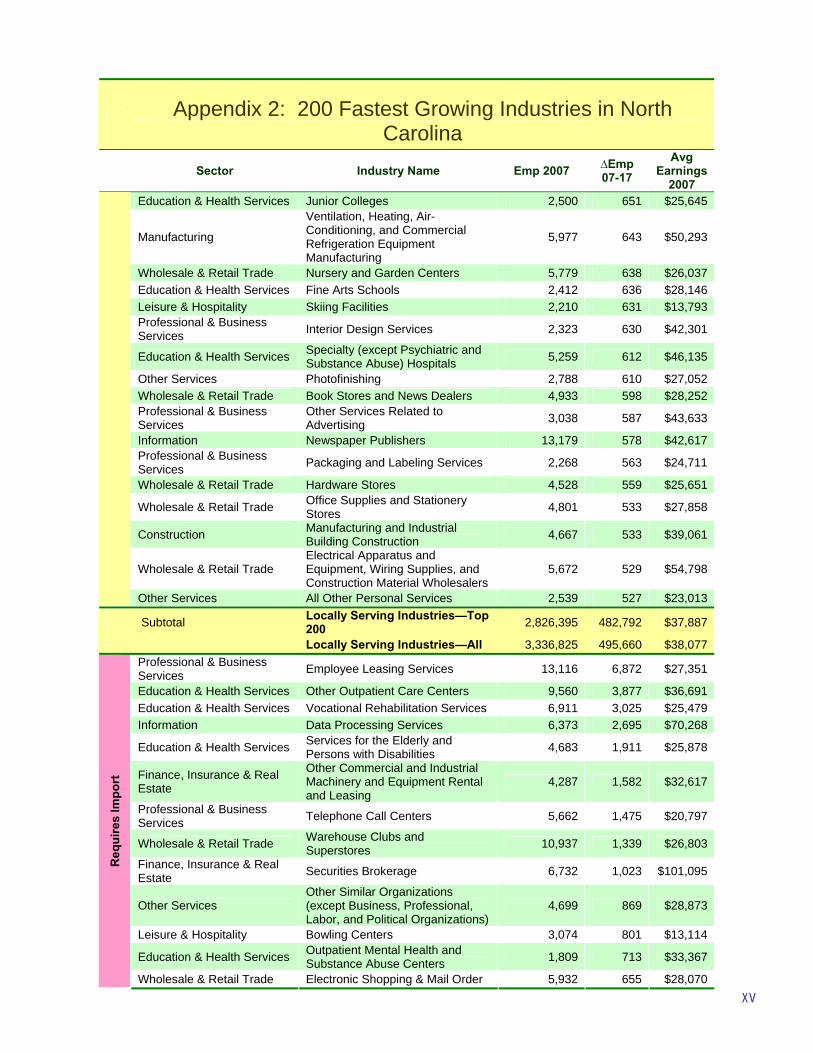
XV
Appendix 2: 200 Fastest Growing Industries in North Carolina
Sector Industry Name Emp 2007 ∆Emp 07-17
Avg Earnings
2007 Education & Health Services Junior Colleges 2,500 651 $25,645
Manufacturing
Ventilation, Heating, Air-Conditioning, and Commercial Refrigeration Equipment Manufacturing
5,977 643 $50,293
Wholesale & Retail Trade Nursery and Garden Centers 5,779 638 $26,037 Education & Health Services Fine Arts Schools 2,412 636 $28,146 Leisure & Hospitality Skiing Facilities 2,210 631 $13,793 Professional & Business Services Interior Design Services 2,323 630 $42,301
Education & Health Services Specialty (except Psychiatric and Substance Abuse) Hospitals 5,259 612 $46,135
Other Services Photofinishing 2,788 610 $27,052 Wholesale & Retail Trade Book Stores and News Dealers 4,933 598 $28,252 Professional & Business Services
Other Services Related to Advertising 3,038 587 $43,633
Information Newspaper Publishers 13,179 578 $42,617 Professional & Business Services Packaging and Labeling Services 2,268 563 $24,711
Wholesale & Retail Trade Hardware Stores 4,528 559 $25,651
Wholesale & Retail Trade Office Supplies and Stationery Stores 4,801 533 $27,858
Construction Manufacturing and Industrial Building Construction 4,667 533 $39,061
Wholesale & Retail Trade Electrical Apparatus and Equipment, Wiring Supplies, and Construction Material Wholesalers
5,672 529 $54,798
Other Services All Other Personal Services 2,539 527 $23,013
Subtotal Locally Serving Industries—Top 200 2,826,395 482,792 $37,887
Locally Serving Industries—All 3,336,825 495,660 $38,077 Professional & Business Services Employee Leasing Services 13,116 6,872 $27,351
Education & Health Services Other Outpatient Care Centers 9,560 3,877 $36,691 Education & Health Services Vocational Rehabilitation Services 6,911 3,025 $25,479 Information Data Processing Services 6,373 2,695 $70,268
Education & Health Services Services for the Elderly and Persons with Disabilities 4,683 1,911 $25,878
Finance, Insurance & Real Estate
Other Commercial and Industrial Machinery and Equipment Rental and Leasing
4,287 1,582 $32,617
Professional & Business Services Telephone Call Centers 5,662 1,475 $20,797
Wholesale & Retail Trade Warehouse Clubs and Superstores 10,937 1,339 $26,803
Finance, Insurance & Real Estate Securities Brokerage 6,732 1,023 $101,095
Other Services Other Similar Organizations (except Business, Professional, Labor, and Political Organizations)
4,699 869 $28,873
Leisure & Hospitality Bowling Centers 3,074 801 $13,114
Education & Health Services Outpatient Mental Health and Substance Abuse Centers 1,809 713 $33,367
Req
uire
s Im
port
Wholesale & Retail Trade Electronic Shopping & Mail Order 5,932 655 $28,070
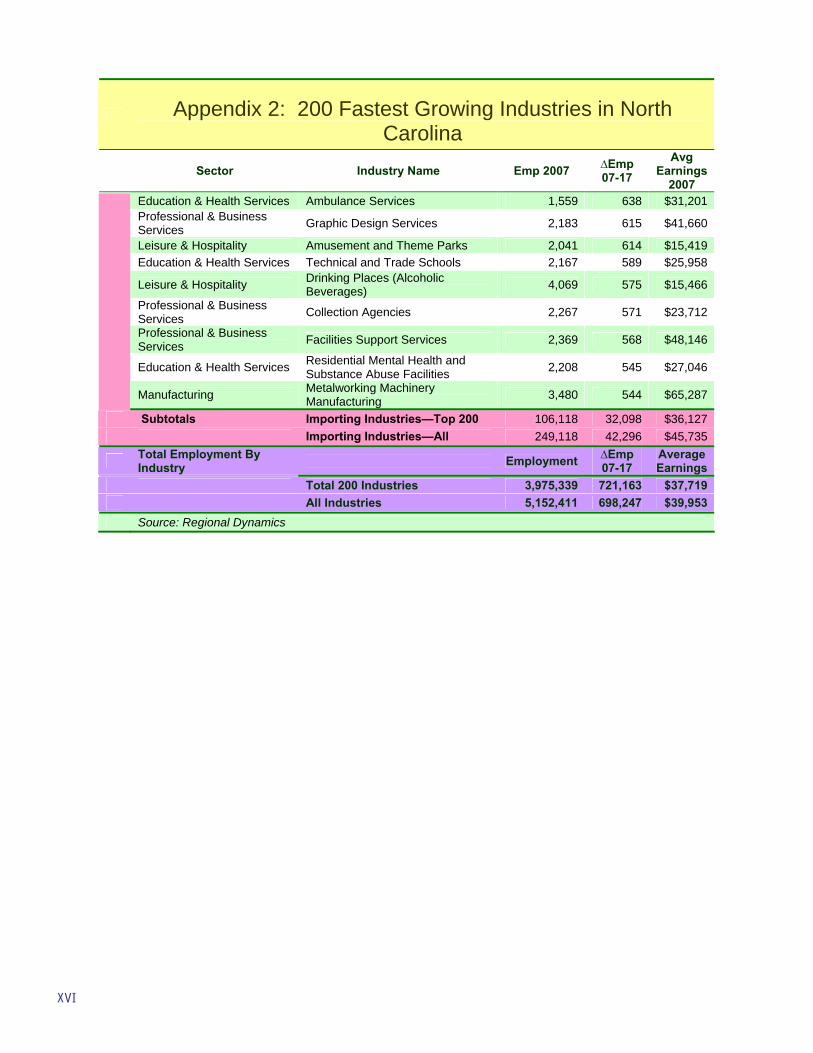
XVI
Appendix 2: 200 Fastest Growing Industries in North Carolina
Sector Industry Name Emp 2007 ∆Emp 07-17
Avg Earnings
2007 Education & Health Services Ambulance Services 1,559 638 $31,201 Professional & Business Services Graphic Design Services 2,183 615 $41,660
Leisure & Hospitality Amusement and Theme Parks 2,041 614 $15,419 Education & Health Services Technical and Trade Schools 2,167 589 $25,958
Leisure & Hospitality Drinking Places (Alcoholic Beverages) 4,069 575 $15,466
Professional & Business Services Collection Agencies 2,267 571 $23,712
Professional & Business Services Facilities Support Services 2,369 568 $48,146
Education & Health Services Residential Mental Health and Substance Abuse Facilities 2,208 545 $27,046
Manufacturing Metalworking Machinery Manufacturing 3,480 544 $65,287
Subtotals Importing Industries—Top 200 106,118 32,098 $36,127 Importing Industries—All 249,118 42,296 $45,735
Total Employment By Industry Employment ∆Emp
07-17 Average Earnings
Total 200 Industries 3,975,339 721,163 $37,719 All Industries 5,152,411 698,247 $39,953 Source: Regional Dynamics
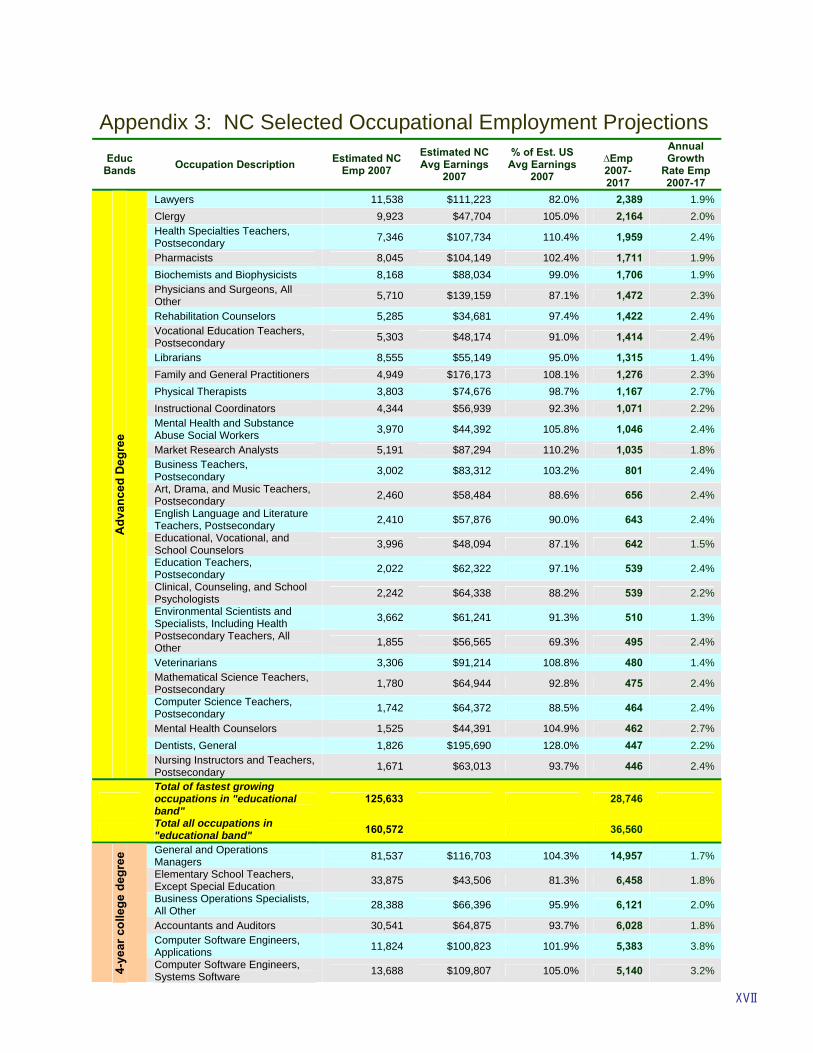
XVII
Appendix 3: NC Selected Occupational Employment Projections Educ
Bands Occupation Description Estimated NC Emp 2007
Estimated NC Avg Earnings
2007
% of Est. US Avg Earnings
2007
∆Emp 2007-2017
Annual Growth
Rate Emp 2007-17
Lawyers 11,538 $111,223 82.0% 2,389 1.9% Clergy 9,923 $47,704 105.0% 2,164 2.0% Health Specialties Teachers, Postsecondary 7,346 $107,734 110.4% 1,959 2.4%
Pharmacists 8,045 $104,149 102.4% 1,711 1.9% Biochemists and Biophysicists 8,168 $88,034 99.0% 1,706 1.9% Physicians and Surgeons, All Other 5,710 $139,159 87.1% 1,472 2.3%
Rehabilitation Counselors 5,285 $34,681 97.4% 1,422 2.4% Vocational Education Teachers, Postsecondary 5,303 $48,174 91.0% 1,414 2.4%
Librarians 8,555 $55,149 95.0% 1,315 1.4% Family and General Practitioners 4,949 $176,173 108.1% 1,276 2.3% Physical Therapists 3,803 $74,676 98.7% 1,167 2.7% Instructional Coordinators 4,344 $56,939 92.3% 1,071 2.2% Mental Health and Substance Abuse Social Workers 3,970 $44,392 105.8% 1,046 2.4%
Market Research Analysts 5,191 $87,294 110.2% 1,035 1.8% Business Teachers, Postsecondary 3,002 $83,312 103.2% 801 2.4%
Art, Drama, and Music Teachers, Postsecondary 2,460 $58,484 88.6% 656 2.4%
English Language and Literature Teachers, Postsecondary 2,410 $57,876 90.0% 643 2.4%
Educational, Vocational, and School Counselors 3,996 $48,094 87.1% 642 1.5%
Education Teachers, Postsecondary 2,022 $62,322 97.1% 539 2.4%
Clinical, Counseling, and School Psychologists 2,242 $64,338 88.2% 539 2.2%
Environmental Scientists and Specialists, Including Health 3,662 $61,241 91.3% 510 1.3%
Postsecondary Teachers, All Other 1,855 $56,565 69.3% 495 2.4%
Veterinarians 3,306 $91,214 108.8% 480 1.4% Mathematical Science Teachers, Postsecondary 1,780 $64,944 92.8% 475 2.4%
Computer Science Teachers, Postsecondary 1,742 $64,372 88.5% 464 2.4%
Mental Health Counselors 1,525 $44,391 104.9% 462 2.7% Dentists, General 1,826 $195,690 128.0% 447 2.2%
Adv
ance
d D
egre
e
Nursing Instructors and Teachers, Postsecondary 1,671 $63,013 93.7% 446 2.4%
Total of fastest growing occupations in "educational band"
125,633 28,746
Total all occupations in "educational band" 160,572 36,560
General and Operations Managers 81,537 $116,703 104.3% 14,957 1.7%
Elementary School Teachers, Except Special Education 33,875 $43,506 81.3% 6,458 1.8%
Business Operations Specialists, All Other 28,388 $66,396 95.9% 6,121 2.0%
Accountants and Auditors 30,541 $64,875 93.7% 6,028 1.8% Computer Software Engineers, Applications 11,824 $100,823 101.9% 5,383 3.8%
4-ye
ar c
olle
ge d
egre
e
Computer Software Engineers, Systems Software 13,688 $109,807 105.0% 5,140 3.2%
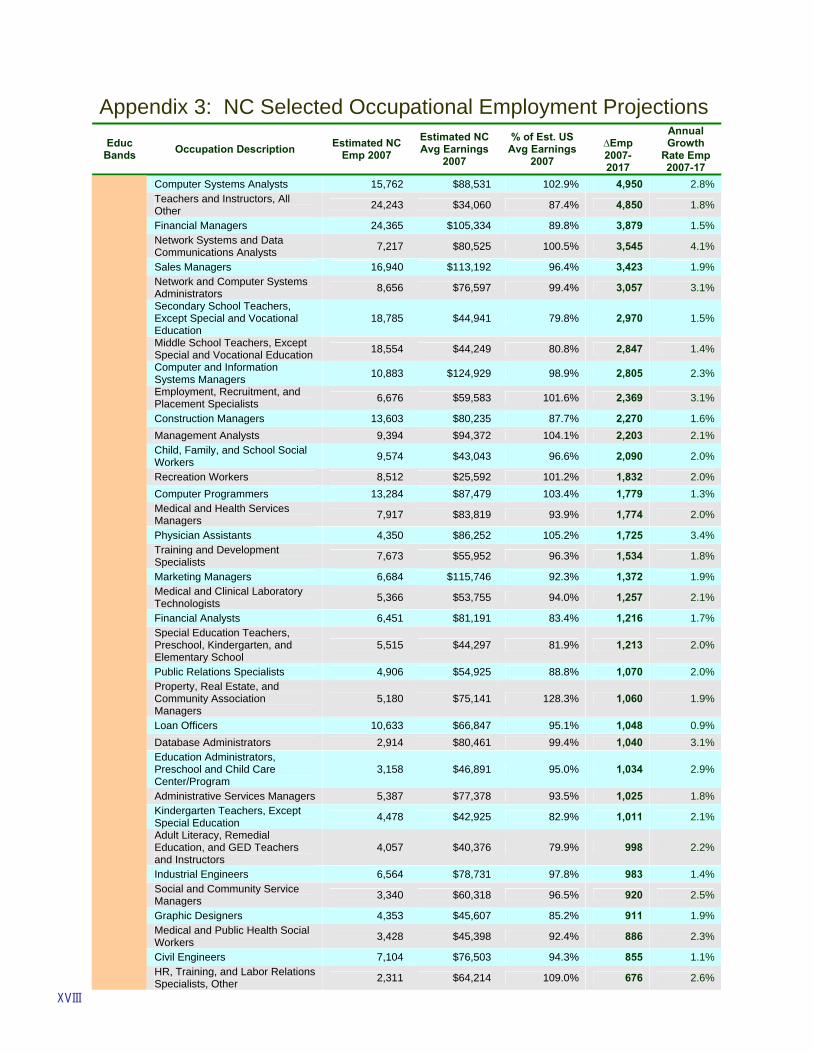
XVIII
Appendix 3: NC Selected Occupational Employment Projections Educ
Bands Occupation Description Estimated NC Emp 2007
Estimated NC Avg Earnings
2007
% of Est. US Avg Earnings
2007
∆Emp 2007-2017
Annual Growth
Rate Emp 2007-17
Computer Systems Analysts 15,762 $88,531 102.9% 4,950 2.8% Teachers and Instructors, All Other 24,243 $34,060 87.4% 4,850 1.8%
Financial Managers 24,365 $105,334 89.8% 3,879 1.5% Network Systems and Data Communications Analysts 7,217 $80,525 100.5% 3,545 4.1%
Sales Managers 16,940 $113,192 96.4% 3,423 1.9% Network and Computer Systems Administrators 8,656 $76,597 99.4% 3,057 3.1%
Secondary School Teachers, Except Special and Vocational Education
18,785 $44,941 79.8% 2,970 1.5%
Middle School Teachers, Except Special and Vocational Education 18,554 $44,249 80.8% 2,847 1.4%
Computer and Information Systems Managers 10,883 $124,929 98.9% 2,805 2.3%
Employment, Recruitment, and Placement Specialists 6,676 $59,583 101.6% 2,369 3.1%
Construction Managers 13,603 $80,235 87.7% 2,270 1.6% Management Analysts 9,394 $94,372 104.1% 2,203 2.1% Child, Family, and School Social Workers 9,574 $43,043 96.6% 2,090 2.0%
Recreation Workers 8,512 $25,592 101.2% 1,832 2.0% Computer Programmers 13,284 $87,479 103.4% 1,779 1.3% Medical and Health Services Managers 7,917 $83,819 93.9% 1,774 2.0%
Physician Assistants 4,350 $86,252 105.2% 1,725 3.4% Training and Development Specialists 7,673 $55,952 96.3% 1,534 1.8%
Marketing Managers 6,684 $115,746 92.3% 1,372 1.9% Medical and Clinical Laboratory Technologists 5,366 $53,755 94.0% 1,257 2.1%
Financial Analysts 6,451 $81,191 83.4% 1,216 1.7% Special Education Teachers, Preschool, Kindergarten, and Elementary School
5,515 $44,297 81.9% 1,213 2.0%
Public Relations Specialists 4,906 $54,925 88.8% 1,070 2.0% Property, Real Estate, and Community Association Managers
5,180 $75,141 128.3% 1,060 1.9%
Loan Officers 10,633 $66,847 95.1% 1,048 0.9% Database Administrators 2,914 $80,461 99.4% 1,040 3.1% Education Administrators, Preschool and Child Care Center/Program
3,158 $46,891 95.0% 1,034 2.9%
Administrative Services Managers 5,387 $77,378 93.5% 1,025 1.8% Kindergarten Teachers, Except Special Education 4,478 $42,925 82.9% 1,011 2.1%
Adult Literacy, Remedial Education, and GED Teachers and Instructors
4,057 $40,376 79.9% 998 2.2%
Industrial Engineers 6,564 $78,731 97.8% 983 1.4% Social and Community Service Managers 3,340 $60,318 96.5% 920 2.5%
Graphic Designers 4,353 $45,607 85.2% 911 1.9% Medical and Public Health Social Workers 3,428 $45,398 92.4% 886 2.3%
Civil Engineers 7,104 $76,503 94.3% 855 1.1% HR, Training, and Labor Relations Specialists, Other 2,311 $64,214 109.0% 676 2.6%
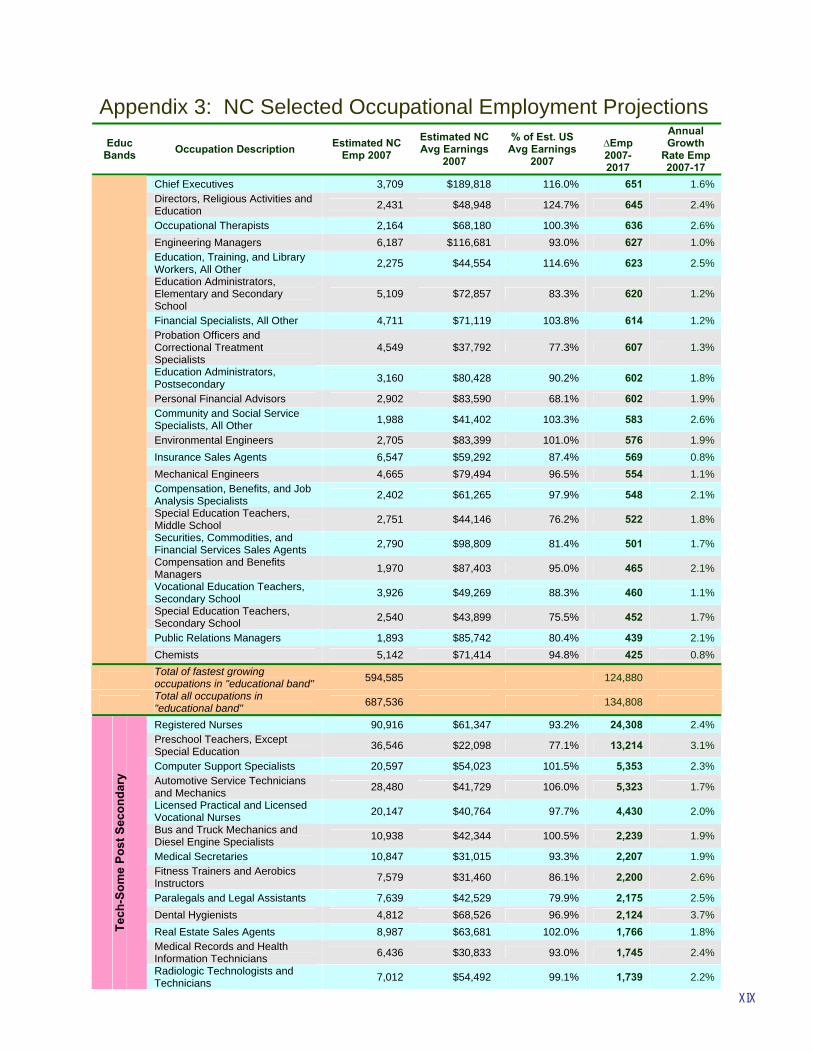
XIX
Appendix 3: NC Selected Occupational Employment Projections Educ
Bands Occupation Description Estimated NC Emp 2007
Estimated NC Avg Earnings
2007
% of Est. US Avg Earnings
2007
∆Emp 2007-2017
Annual Growth
Rate Emp 2007-17
Chief Executives 3,709 $189,818 116.0% 651 1.6% Directors, Religious Activities and Education 2,431 $48,948 124.7% 645 2.4%
Occupational Therapists 2,164 $68,180 100.3% 636 2.6% Engineering Managers 6,187 $116,681 93.0% 627 1.0% Education, Training, and Library Workers, All Other 2,275 $44,554 114.6% 623 2.5%
Education Administrators, Elementary and Secondary School
5,109 $72,857 83.3% 620 1.2%
Financial Specialists, All Other 4,711 $71,119 103.8% 614 1.2% Probation Officers and Correctional Treatment Specialists
4,549 $37,792 77.3% 607 1.3%
Education Administrators, Postsecondary 3,160 $80,428 90.2% 602 1.8%
Personal Financial Advisors 2,902 $83,590 68.1% 602 1.9% Community and Social Service Specialists, All Other 1,988 $41,402 103.3% 583 2.6%
Environmental Engineers 2,705 $83,399 101.0% 576 1.9% Insurance Sales Agents 6,547 $59,292 87.4% 569 0.8% Mechanical Engineers 4,665 $79,494 96.5% 554 1.1% Compensation, Benefits, and Job Analysis Specialists 2,402 $61,265 97.9% 548 2.1%
Special Education Teachers, Middle School 2,751 $44,146 76.2% 522 1.8%
Securities, Commodities, and Financial Services Sales Agents 2,790 $98,809 81.4% 501 1.7%
Compensation and Benefits Managers 1,970 $87,403 95.0% 465 2.1%
Vocational Education Teachers, Secondary School 3,926 $49,269 88.3% 460 1.1%
Special Education Teachers, Secondary School 2,540 $43,899 75.5% 452 1.7%
Public Relations Managers 1,893 $85,742 80.4% 439 2.1% Chemists 5,142 $71,414 94.8% 425 0.8%
Total of fastest growing occupations in "educational band" 594,585 124,880
Total all occupations in "educational band" 687,536 134,808
Registered Nurses 90,916 $61,347 93.2% 24,308 2.4% Preschool Teachers, Except Special Education 36,546 $22,098 77.1% 13,214 3.1%
Computer Support Specialists 20,597 $54,023 101.5% 5,353 2.3% Automotive Service Technicians and Mechanics 28,480 $41,729 106.0% 5,323 1.7%
Licensed Practical and Licensed Vocational Nurses 20,147 $40,764 97.7% 4,430 2.0%
Bus and Truck Mechanics and Diesel Engine Specialists 10,938 $42,344 100.5% 2,239 1.9%
Medical Secretaries 10,847 $31,015 93.3% 2,207 1.9% Fitness Trainers and Aerobics Instructors 7,579 $31,460 86.1% 2,200 2.6%
Paralegals and Legal Assistants 7,639 $42,529 79.9% 2,175 2.5% Dental Hygienists 4,812 $68,526 96.9% 2,124 3.7% Real Estate Sales Agents 8,987 $63,681 102.0% 1,766 1.8% Medical Records and Health Information Technicians 6,436 $30,833 93.0% 1,745 2.4%
Tech
-Som
e Po
st S
econ
dary
Radiologic Technologists and Technicians 7,012 $54,492 99.1% 1,739 2.2%
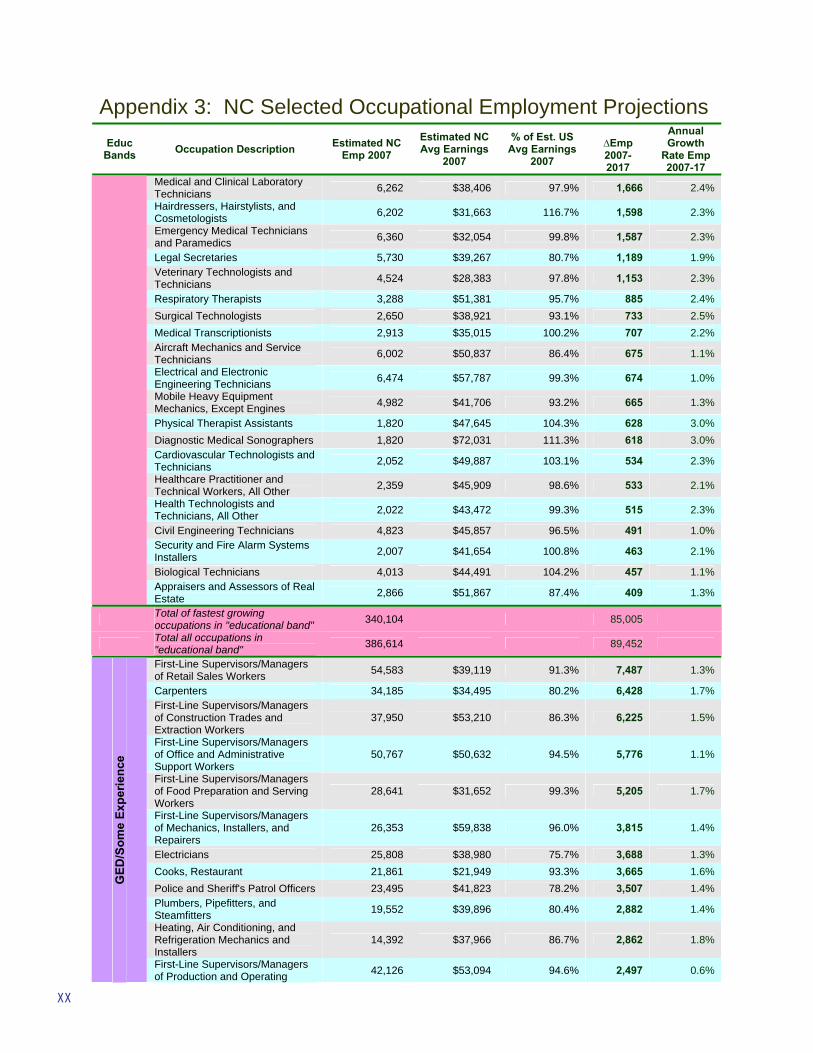
XX
Appendix 3: NC Selected Occupational Employment Projections Educ
Bands Occupation Description Estimated NC Emp 2007
Estimated NC Avg Earnings
2007
% of Est. US Avg Earnings
2007
∆Emp 2007-2017
Annual Growth
Rate Emp 2007-17
Medical and Clinical Laboratory Technicians 6,262 $38,406 97.9% 1,666 2.4%
Hairdressers, Hairstylists, and Cosmetologists 6,202 $31,663 116.7% 1,598 2.3%
Emergency Medical Technicians and Paramedics 6,360 $32,054 99.8% 1,587 2.3%
Legal Secretaries 5,730 $39,267 80.7% 1,189 1.9% Veterinary Technologists and Technicians 4,524 $28,383 97.8% 1,153 2.3%
Respiratory Therapists 3,288 $51,381 95.7% 885 2.4% Surgical Technologists 2,650 $38,921 93.1% 733 2.5% Medical Transcriptionists 2,913 $35,015 100.2% 707 2.2% Aircraft Mechanics and Service Technicians 6,002 $50,837 86.4% 675 1.1%
Electrical and Electronic Engineering Technicians 6,474 $57,787 99.3% 674 1.0%
Mobile Heavy Equipment Mechanics, Except Engines 4,982 $41,706 93.2% 665 1.3%
Physical Therapist Assistants 1,820 $47,645 104.3% 628 3.0% Diagnostic Medical Sonographers 1,820 $72,031 111.3% 618 3.0% Cardiovascular Technologists and Technicians 2,052 $49,887 103.1% 534 2.3%
Healthcare Practitioner and Technical Workers, All Other 2,359 $45,909 98.6% 533 2.1%
Health Technologists and Technicians, All Other 2,022 $43,472 99.3% 515 2.3%
Civil Engineering Technicians 4,823 $45,857 96.5% 491 1.0% Security and Fire Alarm Systems Installers 2,007 $41,654 100.8% 463 2.1%
Biological Technicians 4,013 $44,491 104.2% 457 1.1% Appraisers and Assessors of Real Estate 2,866 $51,867 87.4% 409 1.3%
Total of fastest growing occupations in "educational band" 340,104 85,005
Total all occupations in "educational band" 386,614 89,452
First-Line Supervisors/Managers of Retail Sales Workers 54,583 $39,119 91.3% 7,487 1.3%
Carpenters 34,185 $34,495 80.2% 6,428 1.7% First-Line Supervisors/Managers of Construction Trades and Extraction Workers
37,950 $53,210 86.3% 6,225 1.5%
First-Line Supervisors/Managers of Office and Administrative Support Workers
50,767 $50,632 94.5% 5,776 1.1%
First-Line Supervisors/Managers of Food Preparation and Serving Workers
28,641 $31,652 99.3% 5,205 1.7%
First-Line Supervisors/Managers of Mechanics, Installers, and Repairers
26,353 $59,838 96.0% 3,815 1.4%
Electricians 25,808 $38,980 75.7% 3,688 1.3% Cooks, Restaurant 21,861 $21,949 93.3% 3,665 1.6% Police and Sheriff's Patrol Officers 23,495 $41,823 78.2% 3,507 1.4% Plumbers, Pipefitters, and Steamfitters 19,552 $39,896 80.4% 2,882 1.4%
Heating, Air Conditioning, and Refrigeration Mechanics and Installers
14,392 $37,966 86.7% 2,862 1.8%
GED
/Som
e Ex
perie
nce
First-Line Supervisors/Managers of Production and Operating 42,126 $53,094 94.6% 2,497 0.6%
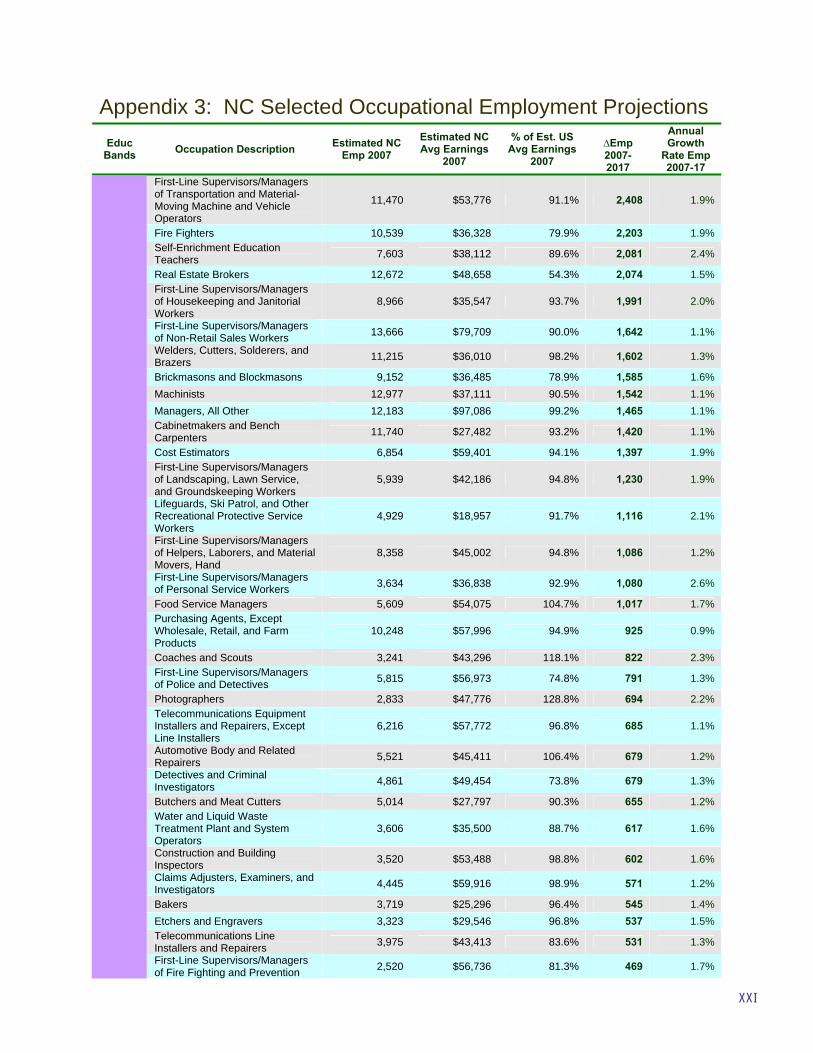
XXI
Appendix 3: NC Selected Occupational Employment Projections Educ
Bands Occupation Description Estimated NC Emp 2007
Estimated NC Avg Earnings
2007
% of Est. US Avg Earnings
2007
∆Emp 2007-2017
Annual Growth
Rate Emp 2007-17
First-Line Supervisors/Managers of Transportation and Material-Moving Machine and Vehicle Operators
11,470 $53,776 91.1% 2,408 1.9%
Fire Fighters 10,539 $36,328 79.9% 2,203 1.9% Self-Enrichment Education Teachers 7,603 $38,112 89.6% 2,081 2.4%
Real Estate Brokers 12,672 $48,658 54.3% 2,074 1.5% First-Line Supervisors/Managers of Housekeeping and Janitorial Workers
8,966 $35,547 93.7% 1,991 2.0%
First-Line Supervisors/Managers of Non-Retail Sales Workers 13,666 $79,709 90.0% 1,642 1.1%
Welders, Cutters, Solderers, and Brazers 11,215 $36,010 98.2% 1,602 1.3%
Brickmasons and Blockmasons 9,152 $36,485 78.9% 1,585 1.6% Machinists 12,977 $37,111 90.5% 1,542 1.1% Managers, All Other 12,183 $97,086 99.2% 1,465 1.1% Cabinetmakers and Bench Carpenters 11,740 $27,482 93.2% 1,420 1.1%
Cost Estimators 6,854 $59,401 94.1% 1,397 1.9% First-Line Supervisors/Managers of Landscaping, Lawn Service, and Groundskeeping Workers
5,939 $42,186 94.8% 1,230 1.9%
Lifeguards, Ski Patrol, and Other Recreational Protective Service Workers
4,929 $18,957 91.7% 1,116 2.1%
First-Line Supervisors/Managers of Helpers, Laborers, and Material Movers, Hand
8,358 $45,002 94.8% 1,086 1.2%
First-Line Supervisors/Managers of Personal Service Workers 3,634 $36,838 92.9% 1,080 2.6%
Food Service Managers 5,609 $54,075 104.7% 1,017 1.7% Purchasing Agents, Except Wholesale, Retail, and Farm Products
10,248 $57,996 94.9% 925 0.9%
Coaches and Scouts 3,241 $43,296 118.1% 822 2.3% First-Line Supervisors/Managers of Police and Detectives 5,815 $56,973 74.8% 791 1.3%
Photographers 2,833 $47,776 128.8% 694 2.2% Telecommunications Equipment Installers and Repairers, Except Line Installers
6,216 $57,772 96.8% 685 1.1%
Automotive Body and Related Repairers 5,521 $45,411 106.4% 679 1.2%
Detectives and Criminal Investigators 4,861 $49,454 73.8% 679 1.3%
Butchers and Meat Cutters 5,014 $27,797 90.3% 655 1.2% Water and Liquid Waste Treatment Plant and System Operators
3,606 $35,500 88.7% 617 1.6%
Construction and Building Inspectors 3,520 $53,488 98.8% 602 1.6%
Claims Adjusters, Examiners, and Investigators 4,445 $59,916 98.9% 571 1.2%
Bakers 3,719 $25,296 96.4% 545 1.4% Etchers and Engravers 3,323 $29,546 96.8% 537 1.5% Telecommunications Line Installers and Repairers 3,975 $43,413 83.6% 531 1.3%
First-Line Supervisors/Managers of Fire Fighting and Prevention 2,520 $56,736 81.3% 469 1.7%
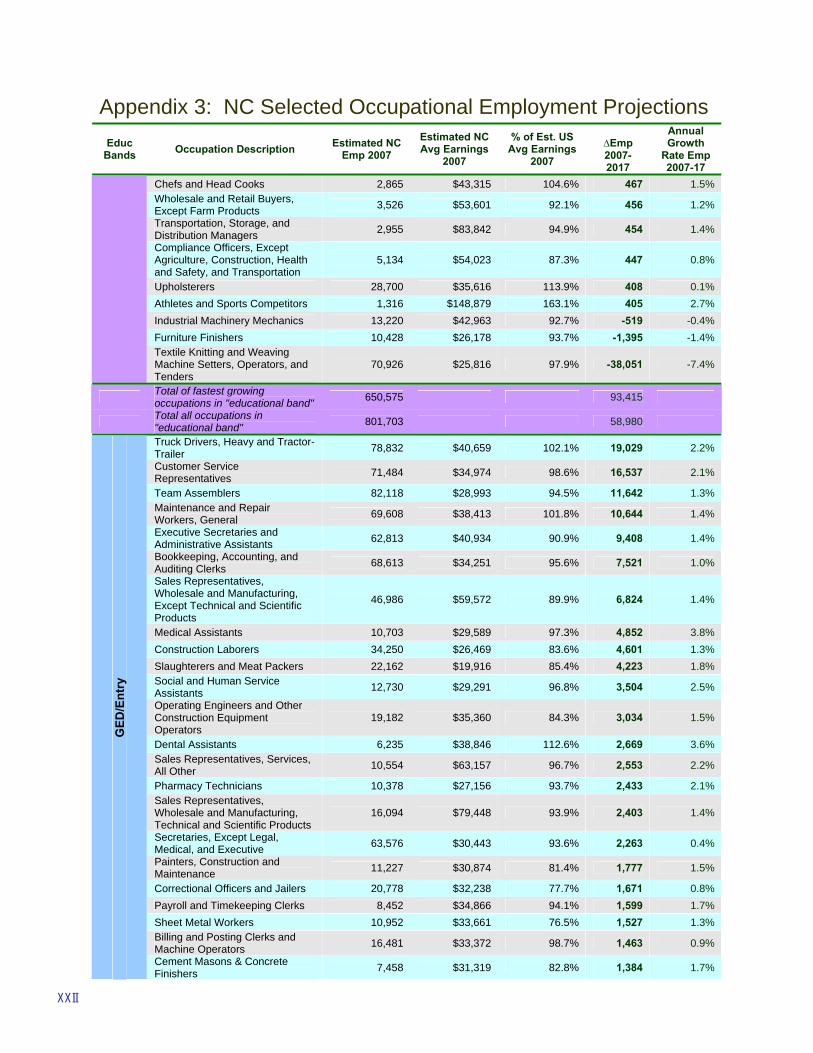
XXII
Appendix 3: NC Selected Occupational Employment Projections Educ
Bands Occupation Description Estimated NC Emp 2007
Estimated NC Avg Earnings
2007
% of Est. US Avg Earnings
2007
∆Emp 2007-2017
Annual Growth
Rate Emp 2007-17
Chefs and Head Cooks 2,865 $43,315 104.6% 467 1.5% Wholesale and Retail Buyers, Except Farm Products 3,526 $53,601 92.1% 456 1.2%
Transportation, Storage, and Distribution Managers 2,955 $83,842 94.9% 454 1.4%
Compliance Officers, Except Agriculture, Construction, Health and Safety, and Transportation
5,134 $54,023 87.3% 447 0.8%
Upholsterers 28,700 $35,616 113.9% 408 0.1% Athletes and Sports Competitors 1,316 $148,879 163.1% 405 2.7% Industrial Machinery Mechanics 13,220 $42,963 92.7% -519 -0.4% Furniture Finishers 10,428 $26,178 93.7% -1,395 -1.4% Textile Knitting and Weaving Machine Setters, Operators, and Tenders
70,926 $25,816 97.9% -38,051 -7.4%
Total of fastest growing occupations in "educational band" 650,575 93,415
Total all occupations in "educational band" 801,703 58,980
Truck Drivers, Heavy and Tractor-Trailer 78,832 $40,659 102.1% 19,029 2.2%
Customer Service Representatives 71,484 $34,974 98.6% 16,537 2.1%
Team Assemblers 82,118 $28,993 94.5% 11,642 1.3% Maintenance and Repair Workers, General 69,608 $38,413 101.8% 10,644 1.4%
Executive Secretaries and Administrative Assistants 62,813 $40,934 90.9% 9,408 1.4%
Bookkeeping, Accounting, and Auditing Clerks 68,613 $34,251 95.6% 7,521 1.0%
Sales Representatives, Wholesale and Manufacturing, Except Technical and Scientific Products
46,986 $59,572 89.9% 6,824 1.4%
Medical Assistants 10,703 $29,589 97.3% 4,852 3.8% Construction Laborers 34,250 $26,469 83.6% 4,601 1.3% Slaughterers and Meat Packers 22,162 $19,916 85.4% 4,223 1.8% Social and Human Service Assistants 12,730 $29,291 96.8% 3,504 2.5%
Operating Engineers and Other Construction Equipment Operators
19,182 $35,360 84.3% 3,034 1.5%
Dental Assistants 6,235 $38,846 112.6% 2,669 3.6% Sales Representatives, Services, All Other 10,554 $63,157 96.7% 2,553 2.2%
Pharmacy Technicians 10,378 $27,156 93.7% 2,433 2.1% Sales Representatives, Wholesale and Manufacturing, Technical and Scientific Products
16,094 $79,448 93.9% 2,403 1.4%
Secretaries, Except Legal, Medical, and Executive 63,576 $30,443 93.6% 2,263 0.4%
Painters, Construction and Maintenance 11,227 $30,874 81.4% 1,777 1.5%
Correctional Officers and Jailers 20,778 $32,238 77.7% 1,671 0.8% Payroll and Timekeeping Clerks 8,452 $34,866 94.1% 1,599 1.7% Sheet Metal Workers 10,952 $33,661 76.5% 1,527 1.3% Billing and Posting Clerks and Machine Operators 16,481 $33,372 98.7% 1,463 0.9%
GED
/Ent
ry
Cement Masons & Concrete Finishers 7,458 $31,319 82.8% 1,384 1.7%
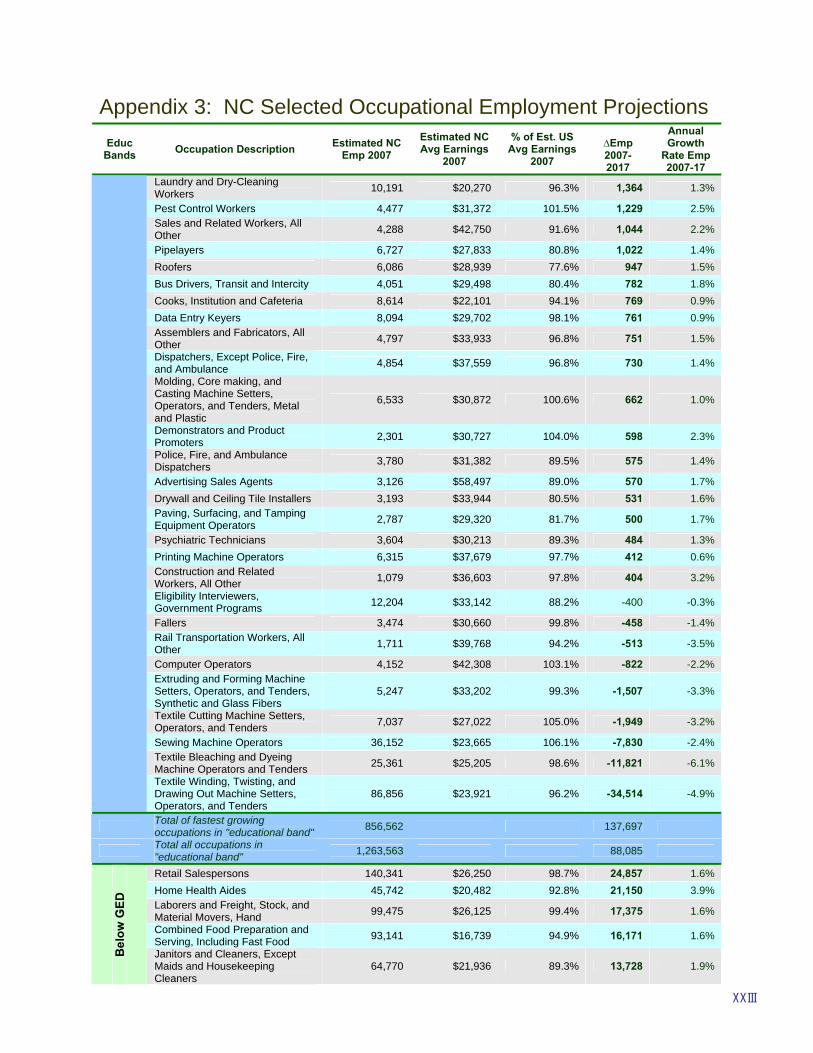
XXIII
Appendix 3: NC Selected Occupational Employment Projections Educ
Bands Occupation Description Estimated NC Emp 2007
Estimated NC Avg Earnings
2007
% of Est. US Avg Earnings
2007
∆Emp 2007-2017
Annual Growth
Rate Emp 2007-17
Laundry and Dry-Cleaning Workers 10,191 $20,270 96.3% 1,364 1.3%
Pest Control Workers 4,477 $31,372 101.5% 1,229 2.5% Sales and Related Workers, All Other 4,288 $42,750 91.6% 1,044 2.2%
Pipelayers 6,727 $27,833 80.8% 1,022 1.4% Roofers 6,086 $28,939 77.6% 947 1.5% Bus Drivers, Transit and Intercity 4,051 $29,498 80.4% 782 1.8% Cooks, Institution and Cafeteria 8,614 $22,101 94.1% 769 0.9% Data Entry Keyers 8,094 $29,702 98.1% 761 0.9% Assemblers and Fabricators, All Other 4,797 $33,933 96.8% 751 1.5%
Dispatchers, Except Police, Fire, and Ambulance 4,854 $37,559 96.8% 730 1.4%
Molding, Core making, and Casting Machine Setters, Operators, and Tenders, Metal and Plastic
6,533 $30,872 100.6% 662 1.0%
Demonstrators and Product Promoters 2,301 $30,727 104.0% 598 2.3%
Police, Fire, and Ambulance Dispatchers 3,780 $31,382 89.5% 575 1.4%
Advertising Sales Agents 3,126 $58,497 89.0% 570 1.7% Drywall and Ceiling Tile Installers 3,193 $33,944 80.5% 531 1.6% Paving, Surfacing, and Tamping Equipment Operators 2,787 $29,320 81.7% 500 1.7%
Psychiatric Technicians 3,604 $30,213 89.3% 484 1.3% Printing Machine Operators 6,315 $37,679 97.7% 412 0.6% Construction and Related Workers, All Other 1,079 $36,603 97.8% 404 3.2%
Eligibility Interviewers, Government Programs 12,204 $33,142 88.2% -400 -0.3%
Fallers 3,474 $30,660 99.8% -458 -1.4% Rail Transportation Workers, All Other 1,711 $39,768 94.2% -513 -3.5%
Computer Operators 4,152 $42,308 103.1% -822 -2.2% Extruding and Forming Machine Setters, Operators, and Tenders, Synthetic and Glass Fibers
5,247 $33,202 99.3% -1,507 -3.3%
Textile Cutting Machine Setters, Operators, and Tenders 7,037 $27,022 105.0% -1,949 -3.2%
Sewing Machine Operators 36,152 $23,665 106.1% -7,830 -2.4% Textile Bleaching and Dyeing Machine Operators and Tenders 25,361 $25,205 98.6% -11,821 -6.1%
Textile Winding, Twisting, and Drawing Out Machine Setters, Operators, and Tenders
86,856 $23,921 96.2% -34,514 -4.9%
Total of fastest growing occupations in "educational band" 856,562 137,697
Total all occupations in "educational band" 1,263,563 88,085
Retail Salespersons 140,341 $26,250 98.7% 24,857 1.6% Home Health Aides 45,742 $20,482 92.8% 21,150 3.9% Laborers and Freight, Stock, and Material Movers, Hand 99,475 $26,125 99.4% 17,375 1.6%
Combined Food Preparation and Serving, Including Fast Food 93,141 $16,739 94.9% 16,171 1.6%
Bel
ow G
ED
Janitors and Cleaners, Except Maids and Housekeeping Cleaners
64,770 $21,936 89.3% 13,728 1.9%
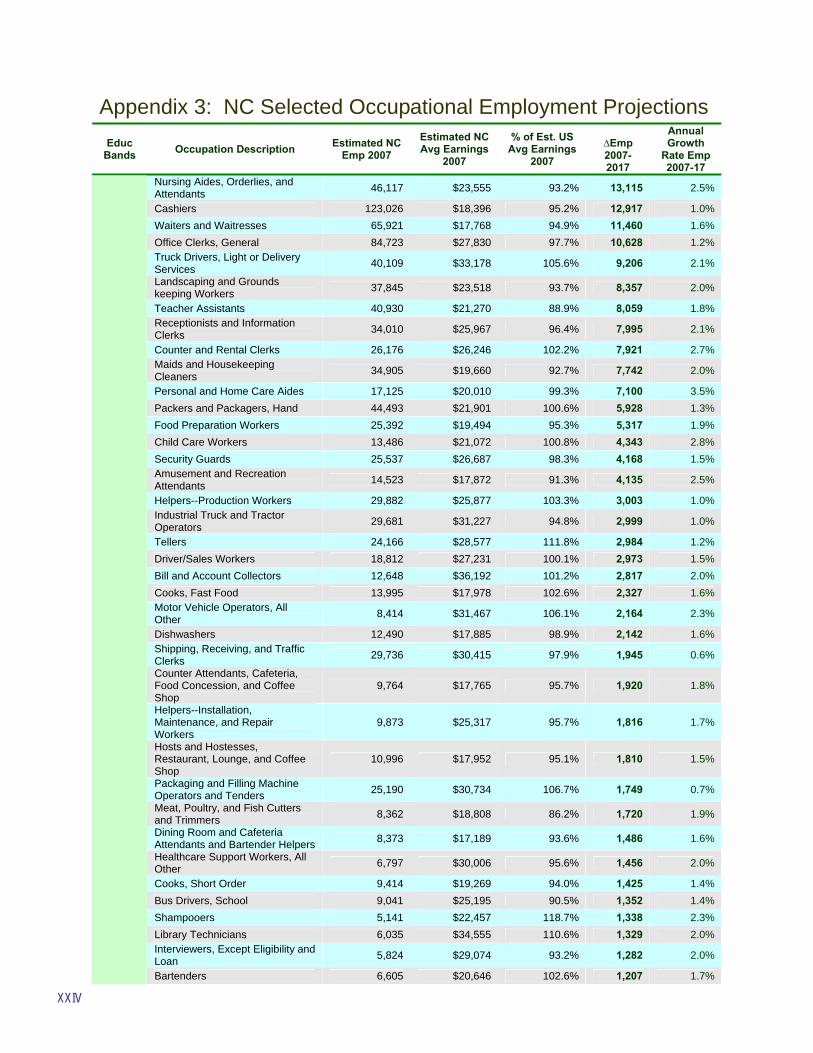
XXIV
Appendix 3: NC Selected Occupational Employment Projections Educ
Bands Occupation Description Estimated NC Emp 2007
Estimated NC Avg Earnings
2007
% of Est. US Avg Earnings
2007
∆Emp 2007-2017
Annual Growth
Rate Emp 2007-17
Nursing Aides, Orderlies, and Attendants 46,117 $23,555 93.2% 13,115 2.5%
Cashiers 123,026 $18,396 95.2% 12,917 1.0% Waiters and Waitresses 65,921 $17,768 94.9% 11,460 1.6% Office Clerks, General 84,723 $27,830 97.7% 10,628 1.2% Truck Drivers, Light or Delivery Services 40,109 $33,178 105.6% 9,206 2.1%
Landscaping and Grounds keeping Workers 37,845 $23,518 93.7% 8,357 2.0%
Teacher Assistants 40,930 $21,270 88.9% 8,059 1.8% Receptionists and Information Clerks 34,010 $25,967 96.4% 7,995 2.1%
Counter and Rental Clerks 26,176 $26,246 102.2% 7,921 2.7% Maids and Housekeeping Cleaners 34,905 $19,660 92.7% 7,742 2.0%
Personal and Home Care Aides 17,125 $20,010 99.3% 7,100 3.5% Packers and Packagers, Hand 44,493 $21,901 100.6% 5,928 1.3% Food Preparation Workers 25,392 $19,494 95.3% 5,317 1.9% Child Care Workers 13,486 $21,072 100.8% 4,343 2.8% Security Guards 25,537 $26,687 98.3% 4,168 1.5% Amusement and Recreation Attendants 14,523 $17,872 91.3% 4,135 2.5%
Helpers--Production Workers 29,882 $25,877 103.3% 3,003 1.0% Industrial Truck and Tractor Operators 29,681 $31,227 94.8% 2,999 1.0%
Tellers 24,166 $28,577 111.8% 2,984 1.2% Driver/Sales Workers 18,812 $27,231 100.1% 2,973 1.5% Bill and Account Collectors 12,648 $36,192 101.2% 2,817 2.0% Cooks, Fast Food 13,995 $17,978 102.6% 2,327 1.6% Motor Vehicle Operators, All Other 8,414 $31,467 106.1% 2,164 2.3%
Dishwashers 12,490 $17,885 98.9% 2,142 1.6% Shipping, Receiving, and Traffic Clerks 29,736 $30,415 97.9% 1,945 0.6%
Counter Attendants, Cafeteria, Food Concession, and Coffee Shop
9,764 $17,765 95.7% 1,920 1.8%
Helpers--Installation, Maintenance, and Repair Workers
9,873 $25,317 95.7% 1,816 1.7%
Hosts and Hostesses, Restaurant, Lounge, and Coffee Shop
10,996 $17,952 95.1% 1,810 1.5%
Packaging and Filling Machine Operators and Tenders 25,190 $30,734 106.7% 1,749 0.7%
Meat, Poultry, and Fish Cutters and Trimmers 8,362 $18,808 86.2% 1,720 1.9%
Dining Room and Cafeteria Attendants and Bartender Helpers 8,373 $17,189 93.6% 1,486 1.6%
Healthcare Support Workers, All Other 6,797 $30,006 95.6% 1,456 2.0%
Cooks, Short Order 9,414 $19,269 94.0% 1,425 1.4% Bus Drivers, School 9,041 $25,195 90.5% 1,352 1.4% Shampooers 5,141 $22,457 118.7% 1,338 2.3% Library Technicians 6,035 $34,555 110.6% 1,329 2.0% Interviewers, Except Eligibility and Loan 5,824 $29,074 93.2% 1,282 2.0%
Bartenders 6,605 $20,646 102.6% 1,207 1.7%
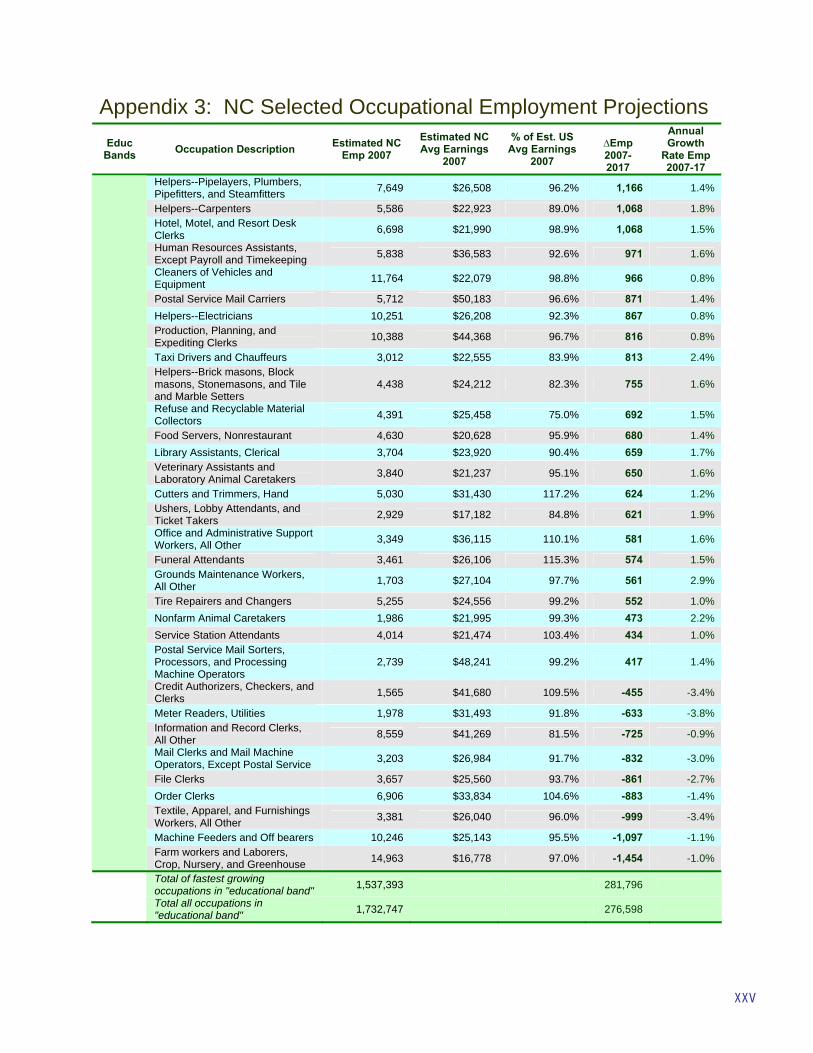
XXV
Appendix 3: NC Selected Occupational Employment Projections Educ
Bands Occupation Description Estimated NC Emp 2007
Estimated NC Avg Earnings
2007
% of Est. US Avg Earnings
2007
∆Emp 2007-2017
Annual Growth
Rate Emp 2007-17
Helpers--Pipelayers, Plumbers, Pipefitters, and Steamfitters 7,649 $26,508 96.2% 1,166 1.4%
Helpers--Carpenters 5,586 $22,923 89.0% 1,068 1.8% Hotel, Motel, and Resort Desk Clerks 6,698 $21,990 98.9% 1,068 1.5%
Human Resources Assistants, Except Payroll and Timekeeping 5,838 $36,583 92.6% 971 1.6%
Cleaners of Vehicles and Equipment 11,764 $22,079 98.8% 966 0.8%
Postal Service Mail Carriers 5,712 $50,183 96.6% 871 1.4% Helpers--Electricians 10,251 $26,208 92.3% 867 0.8% Production, Planning, and Expediting Clerks 10,388 $44,368 96.7% 816 0.8%
Taxi Drivers and Chauffeurs 3,012 $22,555 83.9% 813 2.4% Helpers--Brick masons, Block masons, Stonemasons, and Tile and Marble Setters
4,438 $24,212 82.3% 755 1.6%
Refuse and Recyclable Material Collectors 4,391 $25,458 75.0% 692 1.5%
Food Servers, Nonrestaurant 4,630 $20,628 95.9% 680 1.4% Library Assistants, Clerical 3,704 $23,920 90.4% 659 1.7% Veterinary Assistants and Laboratory Animal Caretakers 3,840 $21,237 95.1% 650 1.6%
Cutters and Trimmers, Hand 5,030 $31,430 117.2% 624 1.2% Ushers, Lobby Attendants, and Ticket Takers 2,929 $17,182 84.8% 621 1.9%
Office and Administrative Support Workers, All Other 3,349 $36,115 110.1% 581 1.6%
Funeral Attendants 3,461 $26,106 115.3% 574 1.5% Grounds Maintenance Workers, All Other 1,703 $27,104 97.7% 561 2.9%
Tire Repairers and Changers 5,255 $24,556 99.2% 552 1.0% Nonfarm Animal Caretakers 1,986 $21,995 99.3% 473 2.2% Service Station Attendants 4,014 $21,474 103.4% 434 1.0% Postal Service Mail Sorters, Processors, and Processing Machine Operators
2,739 $48,241 99.2% 417 1.4%
Credit Authorizers, Checkers, and Clerks 1,565 $41,680 109.5% -455 -3.4%
Meter Readers, Utilities 1,978 $31,493 91.8% -633 -3.8% Information and Record Clerks, All Other 8,559 $41,269 81.5% -725 -0.9%
Mail Clerks and Mail Machine Operators, Except Postal Service 3,203 $26,984 91.7% -832 -3.0%
File Clerks 3,657 $25,560 93.7% -861 -2.7% Order Clerks 6,906 $33,834 104.6% -883 -1.4% Textile, Apparel, and Furnishings Workers, All Other 3,381 $26,040 96.0% -999 -3.4%
Machine Feeders and Off bearers 10,246 $25,143 95.5% -1,097 -1.1% Farm workers and Laborers, Crop, Nursery, and Greenhouse 14,963 $16,778 97.0% -1,454 -1.0%
Total of fastest growing occupations in "educational band" 1,537,393 281,796
Total all occupations in "educational band" 1,732,747 276,598

2
North Carolina Commission on Workforce Development 4327 Mail Service Center | Raleigh, NC 27699-4327 | 919.715.3300
www.nccommerce.com
500 copies of this document were printed at a total cost of $9,465 or approximately $18.93 per copy.