Embed Size (px)
Citation preview
State of the nation report poverty worklessness and welfare dependency in the UK
StateofthenationreportpovertyworklessnessandwelfaredependencyintheUK 3
Foreword by the Secretary of Statefor Work and Pensions
AddressingpovertyandinequalityinBritainis attheheartofouragendaforgovernmentIt isunacceptablethatinoneofthewealthiest nationsintheworldmillionsofadults andchildrenarelivinginpovertyWhole communitiesareexistingatthemarginsof societytrappedindependencyandunableto progressIntheseareasaspirationandsocial mobilitydisappearleavingdisadvantagedchildren tobecomedisadvantagedadults
Overthepast13yearswehaveseenmoreand moremoneyspentonthebenefitssysteminan attempttomovepeoplefrombelowthe60 povertythresholdtoaboveitExpenditureon child-relatedbenefitsalonehasalmostdoubled Yetdespitethisexpenditurethefiguresinthis documentshowthatthisapproachisfailing
Incomeinequalityisatitshighestsincerecords beganmillionsofpeoplearesimplyparkedon benefitswithlittlehopeofeverprogressing intoworkthereare800000moreworking-ageadultsinpovertythanin199899andhigh levelsoffamilybreakdowneducationalfailure addictionandhealthinequalityarehavinga severeimpactonoutcomesforbothadultsand children
ThisGovernmentrecognisesthattackling theseissueswillrequirecross-departmental actionThatiswhywehaveestablishedaSocial JusticeCabinetCommitteeAsChairmanofthe CommitteeIwillbechampioninganapproachto povertythatrecognisesitsmultifacetednature Wewilltacklethefactorsthattrappeoplein povertyandtherebybreaktheintergenerational cycleofdisadvantageOurapproachwilldeliver sustainableprogress
Attheheartofthisfightagainstpovertymust beworkIwillworktodeliverradicalreforms tothewelfaresystemOurcoregoalwillbeto improvethequalityoflifefortheworstoffndashfor pensionerschildrenandworking-ageadults
Onlybyreformingthewelfaresystemincluding benefitsreformwillwetakewelfareintothe 21stcentury
IainDuncanSmith SecretaryofStateforWorkandPensions
StateofthenationreportpovertyworklessnessandwelfaredependencyintheUK 5
Contents Executivesummary 6
Chapter1 Incomepovertyinequalityandsocialimmobility 14
Chapter2 Worklessnessunemploymentandinactivity 27
Chapter3 Welfaredependency 33
Chapter4 Poorhealthandeducationaldisadvantage 40
Chapter5 Familiesandcommunities 49
Chapter6 Multipledisadvantage 59
SomeofthedataoutlinedinthisdocumentappliesacrosstheUKHoweversomeofthe figuresapplyto EnglandonlyorEnglandandWalesonlyWherethisisthecaseithasbeennoted
Manyaspectsofpolicyhighlightedinthedocumentaredevolvedindifferingsettlementsto the administrationsinNorthernIrelandScotlandandWalesItisthebenefitofdevolutionthattheDevolved Administrationscantailortheirpoliciesandthusdeliverpublicservicestomeetthespecificneedsoftheir citizens
TheGovernmentandtheDevolvedAdministrationswillcontinuetoworkcloselytogethertobuildamore prosperousstrongerfairerUKwhilerecognisingthateachhasparticularandvarying responsibilities
6 StateofthenationreportpovertyworklessnessandwelfaredependencyintheUK
Executive summary
The Coalition Government is committed to building a fairer society where opportunity is more equally distributed In Britain today too many people are held back because of poverty family background and other factors We will dismantle these barriers and take action to ensure that everyone has the best possible chance to fulfil their potential and leave poverty behind
Thisreportsetsoutacomprehensiveassessment ofpovertyintheUKatthestartofthenew Governmentestablishingaclearlsquostateofthe nationrsquooverviewthatwillbeusedtoinform policydecisionsinthemonthsandyearsahead astheGovernmentadvancesitsaimsoftackling povertyandimprovinglifechances
TheCoalitionGovernmentrecognisesthat povertyisamultifacetedandwide-reaching problemThisreportthereforeincludesabroad rangeofpovertyanddeprivationindicators includingincomepovertyindebtedness unemploymenteducationalandhealth inequalitiesfamilystructureandcommunity breakdown
Takentogetherthesemeasurementssetouta clearpictureofpovertyintheUKTheyshow thatwhilesomeprogresshasbeenmadein someareasacrossawiderangeofareasthe governmentrsquosperformanceintacklingpoverty andinequalityhasstalledordeterioratedThisis despitespendingbillionsofpoundsonstate-led programmesAsaresultpovertyandinequality remainadeeplyentrenchedproblemthatblights manyfamiliesandcommunitiesacrosstheUK
Keystatistics bull Newanalysisshowsthat53millionpeoplein
theUKsufferfrommultipledisadvantage1
bull Newanalysisshowsthat14millionpeoplein theUKhavebeenonanout-of-workbenefit fornineormoreofthelast10years2
bull Newanalysisshowsthatanestimated670000 householdsintheUKareeligibleforbenefits andtaxcreditsofoverpound15600peryear3
bull IncomeinequalityintheUKisnowatits highestlevelsincecomparablestatisticsbegan in1961
bull SocialmobilityinBritainisintermsofsonsrsquo earningsrelativetotheirfathersrsquoworsethan intheUSAFranceGermanySpainSweden CanadaFinlandandDenmark
bull Ahigherproportionofchildrengrowupin worklesshouseholdsintheUKthaninalmost anyotherEUcountry
bull Ahigherproportionofyoungpeopleinthe UKarenotinworkeducationortraining thaninalmostanyotherEUcountry
bull Peoplelivinginthepoorestneighbourhoods inEnglandwillonaveragediesevenyears earlierthanpeoplelivingintherichest neighbourhoods
bull Healthinequalitiesasproxiedbylife expectancyatbirtharehighernowthanthey wereinthe1970s
1 SocialExclusionTaskForceandStrategyUnitinternalresearch 2 DepartmentforWorkandPensionsinternalresearch 3 DepartmentforWorkandPensionsinternalestimates
StateofthenationreportpovertyworklessnessandwelfaredependencyintheUK 7
bull Thegapineducationalattainmentbetween childrenfromrichandpoorbackgrounds remainspersistentlyhigh
bull Thegapinincomebetweenthemiddleand thebottomhasnotimprovedinthepast decadeandonsomemeasuresappearsto haveincreased
Income poverty inequality and indebtedness In2010incomepovertyandinequalityremain amajorproblemintheUKSeverepovertyndash definedasahouseholdincomelowerthan40 ofthemedianhouseholdincomendashhasincreased inrecentyearsInadditionrelativepovertyndash definedasahouseholdincomelowerthan60 ofthemedianhouseholdincomendashhasalso increasedsince199899amongsingleadultsand coupleswithoutchildren
Lowincomenotonlyresultsinlowerstandards oflivingbutalsoaffectspeoplersquoslifechances andopportunitiesForexampleexperiencing
incomepovertyasachildisassociatedwith increasedriskofeducationalunder-achievement andunemploymentlaterinlifeParenting homeenvironmentandschoolexperiencemay beasinfluentialindetermininganindividualrsquos trajectoryinlifeashouseholdincomein childhoodNeverthelessitisclearthatin2010 lowincomeremainsabarriertomanypeoplein theUKForexamplewhileonsomemeasures relativeincomepovertyhasfallen(particularly forpensionersandchildren)
bull severepovertyhasincreasedsince200405
bull almostoneintenpeople(8)livein persistentpovertymeasuredasspending threeyearsorlongeroutofthepastfour yearsinrelativepoverty
bull theproportionofthepopulationlivingin relativepovertyishigherintheUKthanin manyotherEuropeancountriesincluding FranceGermanyandPortugaland
bull overthepastdecadepersonaldebtreached recordlevelsndashandUKhouseholddebtis amongthehighestofanydevelopedcountry
Figure 1 The UKrsquos relative poverty rate is high compared with other European countries
Spain
Ita
ly UK
Portu
gal
EU27
EU15
German
y
Finla
nd
Fran
ce
Swed
en
Netherl
ands
20
15
10
5
0
o
f ho
useh
olds
bel
ow 6
0 o
feq
uiva
lise
d m
edia
n in
com
e
Source Eurostat 2007
8 StateofthenationreportpovertyworklessnessandwelfaredependencyintheUK
Riskofpovertyisunevenlyspreadinterms ofregionethnicityhouseholdstructureand disabilitystatusOverhalf(52)ofPakistanis andBangladeshisareinrelativepovertywhile childrenlivinginfamilieswithatleastone disabledmemberhavea29chanceoflivingin povertycomparedwith20forthoselivingin familieswithnodisabledmemberTheadditional costsassociatedwithdisabilitymeanthata narrowfocusonincomesdoesnotfullycapture thelevelsofdisadvantageexperienced
Thereisalsoevidenceofgrowingincome inequalityintheUKIn200809forthesecond consecutiveyearincomeinequalitymeasured bytheGinicoefficientwasatitshighestlevel sincecomparablestatisticsbeganin1961andthe
UKranksabovetheOrganisationforEconomic Co-operationandDevelopment(OECD) averageIntheUKtodaywealthinequalityis evenmorepronouncedthanincomeinequality Accordingtothelatestdatathebottomthird ofthewealthdistributionownsonly3oftotal wealthintheUK
Onsomemeasuressocialmobilityalsoappears tohavestalledinrecentyearsThereisahigher correlationbetweenindividualandparental earningsinBritainthaninGermanyFranceand theUSAmeaningthatfamilybackgroundisa biggerfactorindetermininglifechancesinBritain thaninmanycomparablecountries(Figure2)
Figure 2 Britain has a poor record of social mobility as indicated by the extent to which sonsrsquo earnings levels reflect those of their fathers
05
04
03
02
01
00
Cor
rela
tion
bet
wee
n fa
ther
srsquo a
nd s
onsrsquo
ear
ning
s
Britain USA France Germany Spain Sweden Canada Finland Denmark
Source OECD (2010) Economic Policy Reforms Going For Growth Chapter 5
StateofthenationreportpovertyworklessnessandwelfaredependencyintheUK 9
Figure 3 The UK ranks poorly against comparator countries in key statistics
children in jobless households (European comparator)
2828
adults in jobless households (European comparator)
2527
young people not in education employment or training (OECD comparator)
2224
Source Eurostat People living in jobless households 2008 data and OECD Education at a Glance 2008 2007 data Note Low numbers suggest poor performance against indicators Base varies depending on the country sample
Worklessness In2010unemploymentandinactivityisprevalent inmanyUKcommunitiesAhigherproportionof childrenintheUKliveinhouseholdswhereno oneworksthaninalmostanyotherEUcountry
Worklesshouseholdsaresignificantlymorelikely toexperiencepovertyandseverepovertythan householdsinwhichatleastoneadultisinwork Forexamplechildrenlivingincouplehouseholds wherenoadultworkshaveovera64chanceof livinginpovertycomparedwithjusta1chance forthoselivinginahouseholdwithtwoadults infull-timeworkEvidencealsosuggeststhat childrengrowingupwithoutaworkingadultmay belesslikelytoworkthemselvesthanchildren growingupinhouseholdswheresomeone isinworkThishighlightstheimportanceof measuringemploymentatahouseholdaswellas anindividuallevel
Keystatistics bull Morethanoneinfourworking-ageadultsndash
106millionpeoplendashintheUKdonotwork
bull TheUKhasoneofthehighestratesof worklesshouseholdsintheEUwith48million working-agepeoplelivinginahouseholdin whichnooneofworking-ageisinwork
bull TheUKhasoneofthehighestratesof childrenlivinginworklesshouseholdsinthe EUwith19 millionchildrenlivinginworkless households(Figure3)
bull Over25millionpeopleareunemployed includingaround94000016ndash24-year-oldsupfromaround650000in1997The unemploymentratefor16ndash17-year-oldsis now35
bull Certaingroupsareparticularlylikelytobeout ofworkForexampleoverathirdofBlack Africanhouseholdsarenotinworkwhile overhalfofdisabledpeoplearenotinwork
10 StateofthenationreportpovertyworklessnessandwelfaredependencyintheUK
Figure 4 Annual expenditure on working-age benefits is high compared with many other areas of government expenditure
NHS Workingshy Schools Defence Transport Justice Overseas Energy age budget aid and climate
benefits change
0
10
20
30
40
50
60
70
80
90
100
pound bi
llion
Source HMT 2009 Public Expenditure Statistical Publications (PESA) Department for Work and Pensions All figures for 200910
Welfare dependency In2010welfaredependencyremainsasignificant problemintheUKFortoomanypeoplethe welfaresystemdoesnotprovidesufficient incentivestoworkandpeopleonbenefitsor lowincomesfacesignificantbarrierstoworking theirwayoutofpoverty
Keystatistics bull Atleast12millionworking-agehouseholds
receivebenefitseachweek(includingtax creditsandChildBenefit)atacostofaround pound85billionperannum(Figure4)
bull Around26millionpeoplehavespentatleast halfofthelasttenyearsonsomeformofout-of-workbenefit
bull Thenumberofworking-ageadultsclaiming DisabilityLivingAllowancehasrisenbyover 40inthepastdecadendashfrom12millionin 1997to18millionin2009
bull Thepoorest20ofhouseholdsreceiveon average58oftheirincomefromthestate
bull Anestimated670000householdsintheUK areeligibleforbenefitsandtaxcreditsofover pound15600peryear
bull Somelow-incomefamilieskeepaslittleas five penceineveryadditionalpoundearned (notincludingadditionalin-workcosts)while 70000familiesfacedeductionratesover90
StateofthenationreportpovertyworklessnessandwelfaredependencyintheUK 11
Figure 5 Obesity and behaviours that put health at risk are prevalent in England (percentage of adult population)
Smoking
21
Obesity
25
Hazardous alcohol consumption
24
Source The Health and Social Care Information Centre (2009) Social Care Statistics
Health disadvantage In2010thehealthgapintheUKbetween richandpoorremainswideHealthnotonly influencesqualityoflifedirectlybutitcan affecttheextenttowhichpeopleareableto participateinthelabourmarketandwider societyIntheUKtodaytoomanypeoplersquos healthisdeterminedbytheirwealthandthere aretoomanypeoplewhoexperiencepoor physicalandmentalhealth
bull InEnglandpeoplelivinginthepoorest neighbourhoodswillonaveragedieseven yearsearlierthanpeoplelivingintherichest neighbourhoods
bull Disabledpeoplearemorelikelytolivein povertytobeworklessandtohavelower skillsthannon-disabledpeopleAmong disabledpeople32reportdifficultiesin accessinggoodsandservicesand22donot havefrequentchoiceandcontrolovertheir lives
bull Healthinequalitiesasproxiedbylife expectancyatbirtharenowhigherthanthey wereinthe1970s
ItisalsoclearthattheUKcontinuestoexhibit highratesofobesityandriskyhealthbehaviours
bull Aquarter(25)ofadultsintheUKare obeseupfrom15in1993Obesityrates intheUKaresignificantlyhigherthanthe OECDaverageandthosefromlowersocio-economicgroupsaremorelikelytobeobese thantherestofthepopulation
bull Some24millionadultsregularlydrinkmore thandoubletheNHSguidelinesBritish teenagersalsodrinkmoreandearlierthan theirEuropeancounterparts
bull Some21ofadultsstillsmokewhileover4 aredependentondrugsotherthanalcohol
bull Thereisacorrelationbetweenyouth offendingandalcoholconsumptionanddrug use
12 StateofthenationreportpovertyworklessnessandwelfaredependencyintheUK
Educational disadvantage In2010thegapineducationalattainment betweenchildrenfromwealthyanddeprived backgroundsremainshighAchildintheUK eligibleforfreeschoolmealsishalfaslikelyto achievefiveormoreGSCEsatgradeAndashC includingEnglishandmathsasachildfroma wealthierbackgroundInadditiontoomany otherpeopleintheUKareheldbackbecauseof alackofskills
Keystatistics bull Some10oftheworking-agepopulation
havenoqualificationswhichrisesto24for disabledadults
bull Internationalbenchmarkssuggestthatthe proportionofadultswithoutuppersecondary levelsofqualificationsintheUKisabovethe OECDaveragewiththeUKalsoperforming relativelypoorlyinmanyotherstudiesof attainment
bull Theattainmentgapforchildrenincarehas widenedsince2001withtheproportion ofchildrenincareachievingfiveGCSEsor equivalentatgradeAndashCrisingfrom8 in2001to14in2008comparedwithan overallrisefrom48to65
bull Just1ofchildreneligibleforfreeschool mealsgotoauniversityintheRussellGroup comparedwith7ofnon-freeschoolmeal students
bull Of81000pupilsonfreeschoolmealsonly 45 wenttoOxbridge
bull In200809therewerearound208000 persistentabsenteesinprimarystate-funded secondaryandspecialschoolswiththose eligibleforfreeschoolmealssubstantially morelikelytobepersistentlyabsentand almostthreetimesaslikelytobeexcludedfor fixedperiods
Family structure Familystructuremayhaveapowerfulimpact onlifechancesandtheriskofpovertyinthe UKThereisaclearcorrelationbetweenfamily structureandwideroutcomesRelationship
breakdowniscorrelatedwithmentalhealth problemsforexamplewhilechildrenwho experienceparentalseparationappeartosuffer onarangeofeducationalandbehavioural outcomescomparedwiththosewhodonot
Keystatistics bull TheUKhasthehighestrateofteenbirthsin
theEU
bull TheUKhasoneofthehighestproportionsof loneparentfamiliesintheOECD
bull Childreninloneparentandstepfamiliesare twiceaslikelytobeinthebottom20of childoutcomesaschildreninmarriedfamilies
bull Ofthe142000mostdisadvantagedfamilies intheUK(measuredintermsofthose whosufferfromfiveormoreselected disadvantages)under20arefrommarried householdscomparedwitharound65forall families
bull WomeninBritainare40morelikelyto enterpovertyiftheydivorcethanifthey remainmarried
bull Loneparentfamiliesaretwiceaslikelytobe inthebottomincomequintileastwo-parent families
Loneliness and lack of social capital In2010lonelinessandlackofsocialcapitalare aseriousproblemimpactingonwell-beingand awiderangeofotherindicatorsPeoplewith fewersocialnetworksmayforexamplebeless successfulinjob-searchingwhilelonelinesscan affectmentalhealth
Keystatistics bull Halfofallpeopleaged75andoverlivealone
withnearlyhalfofallolderpeople(45) consideringthetelevisionastheirmainform ofcompany
bull Over500000olderpeoplespentChristmas dayalonein2006
bull Overhalfoftheadultpopulationdidnot participateinanycivicactivitiesinthelast year
StateofthenationreportpovertyworklessnessandwelfaredependencyintheUK 13
bull Some6ofpeoplereporthavingnoclose friendsandafurther32reporthavingonly onetotwoclosefriends
Poor housing and local environment In2010poor-qualityhousingandthegrowing waitinglistforsocialhousingisasignificant problemintheUKandhasadirectimpacton economichealthandsocialoutcomes
bull Some74millionhomes(33)wereclassified asnon-decentin2008
bull Socialhousingwaitinglistshavegrownbyover 70since1997
bull Some400to800peoplemaybesleeping roughinLondononanyonenight
bull Some7ofhouseholdsinEnglandreport noisetobeaseriousproblem
bull Some10ofhouseholdsreportcrimetobea seriousproblemintheirarea
Someofourpoorestcommunitiesaretypified byacombinationofpoorsocialandeconomic outcomesandpoorqualitylivingenvironment thatinteractandreinforceeachotherTheresult canbeconcentrationsofdeprivationthatcan persistforgenerations
bull Low-incomehouseholdsareconcentratedin inner-cityandisolatedruralareas
bull Some40ofpeopleonout-of-work benefitsliveinthe20mostdeprived neighbourhoods
bull Therateofworklessnessamongthosein socialhousingismorethandoublethatofthe generalpopulation
bull Indicatorsofeducationaldisadvantagesuchas absenceratesarehigherinthemostdeprived areas
Multiple disadvantage In2010multipledisadvantageisasignificant problemintheUKOverthepastdecadethere hasbeennodemonstrableprogressinreducing thenumbersofpeoplewhosuffermultiple disadvantageOver60oftheindicatorsin oneofthemainannualsurveysshoweither noprogressoratrendinthewrongdirection Newanalysisshows53millionpeople(11) sufferfrommultipledisadvantageintheUKand 37 millionpeopledosopersistently
Thereisstrongevidencethatmultiple disadvantageisintergenerational27ofchildren fromfamiliesexperiencingsixormoreparent-relateddisadvantagesalsohavethreeormore disadvantagescomparedwithonly4ofthose withnoparent-relateddisadvantages
14 StateofthenationreportpovertyworklessnessandwelfaredependencyintheUK
Chapter 1 Income poverty inequality and social immobility
Income poverty and inequality continue to be significant problems in the UK today and remain a barrier to social progress Across a wide range of indicators it is clear that while on some measures progress has been made on others including severe poverty the situation has got worse in recent years
Incomepovertyandinequalityareimportant forunderstandingdisadvantageinsocietyLiving inincomepovertymeansbeingunabletohave thestandardoflivingmanytakeforgranted Italsoaffectspeoplersquosfuturechancesand opportunitiesLivinginincomepovertyasachild isassociatedwithincreasedrisksoflowerschool performanceandofbeingworklessinlaterlife forexamplewhilehavinglowincomeduring workingagereducesthechanceofbeingableto buildupthepensionandsavingsrequiredfora secureretirement
Howeverwhileincomepovertyandinequality remainsignificantitisimportanttonotethat evidencesuggeststhatotherfactorssuchas parentingstylehomeenvironmentandschool experiencecanbeasinfluentialindeterminingan individualrsquosoutcomesashouseholdincomelevels inchildhoodItisthereforecrucialthatpolicyis notskewedtowardsincreasingincomesalone butrathertakesaholisticapproachtopoverty anddisadvantageandtacklesthedriversbehind them
Thischapterexplores
bull trendsandinternationalcomparisonsof incomepoverty
bull thepersistenceofincomepovertyandgroups whichareparticularlyvulnerable
bull levelsofpersonalindebtedness
bull thedegreeofincomeandwealthinequality and
bull theextentofsocialmobility
Keystatistics bull Povertyamongsingleadultsandcouples
withoutchildrenhasrisensince199798 Amongsingleadultsforexamplepovertyhas risenbyaboutathird
bull Theproportionlivinginsevereincome povertyhasincreasedsince200405
bull Almostoneintenliveinhouseholdsthat experiencepersistentincomepoverty
bull TheUKhasahigherproportionofthe populationonlowincomesthanmanyother Europeancountries
bull Therewere109millionpeoplelivingin relativeincomepovertyin200809300000 fewerthanin199899butup900000since 200405
bull Almost7millionpeopleliveinabsolute poverty
bull Whilethenumberofchildreninrelative povertyhasfallenaccordingtoSavethe Childrenrsquosmaterialpovertymeasurethe proportionofchildrenlivinginpovertyinthe UKhasincreasedfrom11in200405to13 in200708
StateofthenationreportpovertyworklessnessandwelfaredependencyintheUK 15
bull TheUKhasrelativelyhighlevelsofincome inequalitycomparedwiththeOrganisation forEconomicCo-operationandDevelopment (OECD)averagewhilewealthinequalityis evengreaterthanincomeinequality
bull Ononemeasuresocialmobilityisworsein BritainthanintheUSAFranceGermany SpainSwedenCanadaFinlandorDenmark
Trends in income poverty in the UK Thissectionconsidersmeasuresofrelative absoluteandseverepovertyaswellasmeasures ofmaterialdeprivation
Relative poverty Relativepovertyisameasureoftheproportion ofpeopleearninglessthanaparticular percentageofmedianincomeOnthismeasure
bull usingapovertylineof60ofmedianincome 109millionpeople(18ofthepopulation) liveinrelativepovertybeforehousingcosts4 (BHC)and134millionpeople(22)after housingcosts(AHC)5
bull usingapovertylineof50ofmedianincome 63millionpeople(10ofthepopulation) liveinrelativepovertyBHCand94million people(16ofthepopulation)AHCand
bull ingeneralrelativepovertyfellovertheperiod 199798to200809bothbeforeandafter housingcostshoweversince200405there hasbeenarise
Absolute poverty Absolutemeasuresofincomepovertyfocuson levelsoflowincomecomparedwithaparticular pointinthepastorwiththelevelofincome neededtopurchasecertainitemsThismeasure reflectswhetherlivingstandardsareincreasing forthoseatthelowerendoftheincome distribution
IntheUKtheabsolutemeasureofpovertyused inrecentyearshasbeenthenumberofpeople livinginhouseholdswithincomebelow60of the199899real-termsmedianincomeThedata showthat
bull around89million(15)ofthepopulation liveinabsolutepovertyAHCandaround68 million(11)BHCand
bull absolutepovertylevelshavefallenoverthe pastdecade
Material deprivation of children Materialdeprivationmeasuresattemptto identifythegoodsandservicesthatahousehold isabletoaffordAccordingtodatafrom Households Below Average Income 200809while thevastmajorityofpeopleintheUKareableto affordbasicconsumergoodssuchasawashing machineorcolourtelevisionthereremain relativelyhighlevelsofunmetneedforbasic consumergoods
bull Around40ofchildrenareinfamilieswhere theadultsreportnotbeingabletoafforda weekrsquosannualholidayawayfromhome
bull Aroundafifthofchildrenareinfamilieswhere theadultsreportnotbeingabletoaffordto provideguestswithamealonceamonth
bull Over30ofchildrenareinfamilieswhere theadultsreportnotbeingabletoaffordto replacefurniture
4 RelativepovertyismeasuredbyincomenetoftaxesbeforeorafterhousingcostsaredeductedTheafterhousing costs(AHC)measuretendstoprovideabetterreflectionofthelivingstandardsofpensionerscomparedwiththerestof societysincethemajorityofpensioners(72in200809)owntheirownhomesoutrightComparingpensionerincomes withthoseoftherestofthepopulationBHCdoesnotreflectthefactthatworking-agepeoplegenerallyhavetouse someoftheirincometopayforhousingWhenassessingworkingageandchildpovertytheBHCmeasureisabetter reflectionofrelativelivingstandardsasthesehouseholdsexercisesomechoicearoundtheamountoftheirincomethey spendonhousing 5 DepartmentforWorkandPensionsHouseholdsBelowAverageIncome199405ndash200809Unlessotherwisestated alldataaredrawnfromthissource
16 StateofthenationreportpovertyworklessnessandwelfaredependencyintheUK
Severe poverty Despitesomeprogressonrelativeandabsolute povertythereissomeevidencetosuggestthat severeincomepovertyndashcommonlydefined asincomebelow40ofmedianincomendashhas increasedinthepastdecadeBetween199899 and200809thismeasureofseverepoverty appearedtorisefrom5to6BHC(Figure11)
ThisdatamustbetreatedwithcautionAsthe InstituteforFiscalStudies(IFS)notesincreases wereaccompaniedbyfallsinpersistentpoverty andnochangeinsevereexpenditurepoverty6 Secondtherearedifficultiesinaccurately measuringtheincomesofthoseatthelowest endoftheincomespectrum7Concernsabout measuringverylowincomesarealsodiscussedin theHouseholds Below Average Incomereport
Anotherwayofapproachingmaterialmeasures ofseverepovertyisproposedbySavethe Children8Onthismeasure17millionchildren werelivinginpovertyBHCin200708The proportionincreasedfrom11ofallchildren in200405to13in200708Inmoneyterms thismeanslivingonlessthanpound12220ayear(for acouplewithonechildunder14)Thisamount leavesfamiliesaroundpound113aweekshortofwhat theyneedtocoverfoodelectricityandgas phonesotherbillsclotheswashingtransport andhealthcare9
Figure 11 Severe poverty (BHC) ndash there is evidence that the proportion of households with less than 40 of median income has grown
Per
cent
age
of ind
ivid
uals
7
6
5
4
3
2
1
0
30 to 40 of median 20 to 30 of median
10 to 20 of median 0 to 10 of median
0 net income
1998 2000 2002 2004 2006
Source Institute for Fiscal Studies 2010
6 DefinedbytheIFSaslessthan40ofmedianconsumptionexpenditurendashseeInstituteforFiscalStudies(2010)What hashappenedtolsquoseverepovertyrsquounderLabour2010ElectionBriefingNoteNo3 7 ibid 8 Accordingtothismeasurechildrenarelivinginseverepovertyiftheyliveinlsquoahouseholdwithanincomeofbelow50 ofthemedian(AHC)andwherebothadultsandchildrenlackatleastonebasicnecessityandeitheradultsorchildren orbothgroupslackatleasttwobasicnecessitiesrsquoSeeMagadiandMiddleton(2007)SevereChildPovertyintheUK SavetheChildren 9 SavetheChildren(2010)MeasuringSevereChildPovertyintheUKPolicyBriefing
StateofthenationreportpovertyworklessnessandwelfaredependencyintheUK 17
International comparisons of income poverty Theproportionofthepopulationlivingon relativelylowincomesishigherintheUKthan inmanyotherEuropeancountriesincluding FranceGermanyandPortugal(seeFigure12) ComparedwithourEuropeancounterparts
theUKalsofarespoorlyintermsoftherisk ofpovertyforthoseaged65andover(30 comparedwithanEUaverageof19onaBHC basis)whilein2007thechildrenatriskof povertyratefortheUKwasthreepercentage pointshigherthantheEU27averageat23 (BHC)10
Figure 12 The UKrsquos relative poverty rate is high compared to other European countries
Spain
Ita
ly UK
Portu
gal
EU27
EU15
German
y
Finla
nd
Fran
ce
Swed
en
Netherl
ands
20
15
10
5
0
o
f ho
useh
olds
bel
ow 6
0 o
f eq
uiva
lised
med
ian
inco
me
Source EU Community Statistics on Income and Living Conditions (2009) 2008 data
10 EUCommunityStatisticsonIncomeandLivingConditions(2009)
18 StateofthenationreportpovertyworklessnessandwelfaredependencyintheUK
Persistence of income poverty Themeasuresofincomepovertyusedabove captureasnapshotofthepopulationatacertain momentintimeButanewentranttothe labourmarketforexamplemaytemporarily experienceincomepovertybutthenmoveout ofpovertybyprogressingatworkPersistent povertyfigures(heredefinedasthoseliving below60ofmedianincomeforatleastthree outoffouryearsBHC)attempttofiltersuch groupsoutThedatasuggestthat
bull inGreatBritain8ofindividualslivein householdsthatexperiencepersistent povertyBHCwhilethefigureis10AHC
bull theproportionofchildrenandpensioners inpersistentpovertyisaround10and 14respectivelyBHCand15and9 respectivelyAHCand
bull disabledpeoplearetwiceaslikelytobein persistentpovertyasnon-disabledpeopleat 11and5respectivelyBHC
Figure 13 The percentage of the population experiencing persistent poverty before housing costs is greatest among pensioners at 14 (2004-07)
All population
8 Workingshyage adults
5 Pensioners
14 Children
10
Source Department of Work and Pensions Low Income Dynamics 1991ndash2007
StateofthenationreportpovertyworklessnessandwelfaredependencyintheUK 19
Personal indebtedness in the UK Overthepastdecadepersonaldebtreachedrecordlevels(Figure14)andUKhouseholddebtwas amongthehighestofanydevelopedcountryOtherevidenceshowsthat
bull although24ofborrowinghouseholdsowedlessthanpound1000onunsecuredcredit28owed inexcessofpound10000in20080911
bull between7and9millionpeopleinBritainhavereportedhavinghadaseriousdebtproblem12
bull BritishconsumersareonaveragetwiceasindebtedasthoseincontinentalEurope13
Figure 14 UK personal debt as a percentage of total disposable income has risen sharply although secured debt accounts for most of this increase
00
02
04
06
08
Deb
t as
o
f to
tal d
ispo
sabl
e in
com
e
10
12
14 Unsecured
Secured
16
1995 1997 1999 2001 2003 2005 2007 2009
Source Office for National Statistics Financial Statistics Consistent 2010
ForsomehouseholdsthismaynotbeacauseforconcernStudentsforexamplemayget intodebtbutreasonablyexpecttopayitoffastheymoveintothelabourmarketHowever examinationofsurveydataonarrearsndashameasureofhowdifferentgroupsarecopingwiththeir indebtednessndashshowsthatdebtproblemsseemcorrelatedwithgroupsmostatriskofpoverty TheWealthandAssetsSurvey14foundthattheproportionofhouseholdsfallingbehindwith payments
bull fallswithageNearly25ofthoseinarrearsarebetween16and24
bull ishighestamongtheunemployedthoselookingafterafamilyhomeandthosetemporarilysick ordisabled
bull ishigherinroutineoccupationsandthelong-termunemployedNearly25ofthoseinarrears haveneverworkedorarelong-termunemployedand
bull isparticularlyhighamongloneparentswithdependentchildrenOver30ofthoseinarrears fallintothisgroupdoublethepercentageinthenextlargestcategory
11 DepartmentforBusinessInnovationandSkills(2010)Over-indebtednessinBritainSecondfollow-upreport 12 SocialJusticePolicyGroup(2007)BreakthroughBritainVolume5SeriousPersonalDebt 13 ibid 14 OfficeforNationalStatistics(2009)MainResultsfromtheWealthandAssetsSurvey200608
20 StateofthenationreportpovertyworklessnessandwelfaredependencyintheUK
A breakdown of poverty in the UK Levelsofincomepovertyareunevenly distributedamonghouseholdtypesregionsand constituentcountriesoftheUKdisabilitystatus andethnicity15
bull Thepercentageofpensionersinpovertyhas declinedfrom29to16(AHC199899 to200809)resultingin11millionfewer pensionersinpoverty
bull Pensionerpovertycontinuestobegreatest amongolderandfemalepensionersdisabled pensionersnotinreceiptofdisabilitybenefits andethnicminorities
bull Intermsofchildpovertythetargetofarate one-quarterlowerin200405thantherate in199899wasmissedby100000BHCand 300000AHCalthoughrelativepovertyfell by600000inthe10yearsfrom199899to 200809
bull Intermsofhouseholdtypesingleparentsare mostatriskofpoverty(Figure15)
bull Coupleswithchildrenhaveseennosignificant changebetween199899and200809 whereascoupleswithnochildrenhaveseen ariseinpoverty(8to10BHC199899to 200809)
bull PovertyishigherintheNorthEastand theWestMidlandsBHCandinLondon (particularlyInnerLondon)theNorthEast andtheWestMidlandsAHCAtthecountry levelincomepovertyratesarehigherin Wales(BHCandAHC)andNorthernIreland (BHC)thantheUKaverage
bull Thereisagreaterlikelihoodofdisabled peoplelivinginpovertyForexample23 ofindividualsinfamilieswhereatleastone memberisdisabledareinpovertycompared with16offamilieswithnodisabledmember (BHC)
bull Relativepovertyratesvarybyethnicityand arehighestamongthoseofPakistaniand Bangladeshibackgroundat52BHCand60 AHC16
15 Thefiguresinthissectionrefertorelativepovertyas60ofcontemporarymedianincomeunlessotherwisenoted 16 60ofmedianincomemeasureBHCandAHC
StateofthenationreportpovertyworklessnessandwelfaredependencyintheUK 21
Figure 15 The risk of poverty is greatest among single parents and single pensioners Figures refer to those at risk of poverty measured as 60 of contemporary median BHC by household type 200809
Single without children
20
Single with children
34 Single pensioner 23
Pensioner couple 18
Couple with children 17
Couple without children 10
Source Department for Work and Pensions Households Below Average Income 199495ndash200809
International comparisons of income inequality IncomeinequalitymeasuredintermsoftheGini coefficientisatitshighestlevelforthesecond consecutiveyearsincerecordsbeganin1961In additionthegapinincomeinequalitybetween themiddleandthebottommeasuredinterms ofthe5010ratiohasnotimprovedinthepast decadeanditappearsthatincomesofthe bottom5havefallenonaverageinrealterms whilethemedianhasgrownby16perannum
Levelsofincomeinequalityaregenerally high comparedwithotherOECDcountries (Figure16)
bull TheUKhashigherlevelsofinequalitythan SwedenFranceGermanyAustraliaCanada JapanandSpain
bull TheUKhaslowerlevelsofinequalitythan ItalyandtheUSA
WhiletheUKperformspoorlyintermsof incomeinequalitycomparedwithotherG8 nationsthelevelsofincomeinequalityinthe UKaresubstantiallybelowthoseofanumberof developingcountriesndashMexicoforexamplehas aGinicoefficientinexcessof40oftheOECD average(AlthoughtheUKisstartingfroma highbasemostotherOECDcountrieshave experiencedhigherratesofgrowthininequality sincethemid-1990s)
22 StateofthenationreportpovertyworklessnessandwelfaredependencyintheUK
Figure 16 By international standards the UK is relatively high in terms of income inequality
UK
Japa
n
Spain
Canad
a
OECD30
Austra
lia
German
y
Fran
ce
Swed
en
USA
Italy
04
Gin
i coe
ffic
ien t
03
02
01
00
Source Growing unequal Income distribution and poverty in OECD countries OECD 2008
Wealth inequality Inequalityinwealthisevengreaterthan inequalityofincome
bull The200608Wealth and Assets Surveyfinds thattheleastwealthyhalfofhouseholdsowns only9oftotalwealthinBritainwiththe lowestthirdowning3(Figure17)Thetop 20bycontrastowns62
bull Themedianhourlywageofthetop10of householdswas39timesthatofthebottom 10
bull Bycontrastthetop10ofhouseholds possess100timesthewealthofthebottom 10
Intermsofthetrendsinwealthinequality wealthownedbythetop15and10ofthe populationincreasedfrom1990peakingaround 200001beforefallingbackslightlyWealth inequalityin2005wasthereforearoundthe samelevel(atleastforthetop15and10) asin199617
17 HerMajestyrsquosRevenueampCustomsDistributionofPersonalWealthSeries
StateofthenationreportpovertyworklessnessandwelfaredependencyintheUK 23
Figure 17 Only 3 of total wealth is owned by the bottom third of households
3 22
75
0 10 20 30 40 50 60 70 80 90 100
Wealth decile
Source ONS Wealth and Assets Survey 200608 data
Social mobility Socialmobilityisakeycomponentofafair societyWithoutitthosewhoarebornto disadvantagewillfinditdifficultorimpossible toadvanceinsocietyandprovideeffective supportfortheirfamiliesIntheabsenceofsocial mobilityincomeinequalityalsobecomesharder tojustifySocialmobilityisimportantasit
bull impliesequalityofopportunitybygiving individualstheopportunitymotivationand toolstolsquogetonrsquoand
bull allowsabetterallocationofhumanresources maximisingproductivityandindividual potential18
Enhancingsocialmobilityhastwocore components
bull absolutemobilityensuringagreater proportionofjobsineachsuccessive generationarehighskillandhighvalueadded (lsquoroomatthetoprsquo)and
bull relativemobilityensuringwithineach generationthatallgroupsareabletoaccess theopportunitiesavailablebyreducingthe impactofparentalachievementandpersonal characteristicssuchasracegenderdisability andsexualorientation
Absolute mobility Thereissomeevidencethatthequalityofjobs onofferinthelabourmarkethasimprovedin thepastdecadeechoinglonger-termtrends wheretheUKhasmovedawayfromroutine semi-skilledandunskilledmanualworktowards moremanagerialandprofessionaljobssuchas thatofdoctorlawyerandmanagerHowever itisclearthatthereisstillalonglsquotailrsquooflow-skilledemploymentinthelabourmarketinthe UKwitharelativelyhighproportionofthe workforceengagedinlowvalue-addedwork Thereisalsoevidencetosuggestthatwhilethe levelofqualificationatthelowendisimproving thedemandforjobsrequiringthesequalifications isnotgrowinginresponseresultinginmore jobsthatreportnotrequiringqualificationsthan peoplewithnoqualifications19
18 Socialmobilitycanalsocontributetoimprovingthewell-beingofthoseinworkandtheirfamiliesalthoughthispartly dependsonthedefinitionofwell-being 19 FelsteadGallieGreenandZhu(2007)SkillsatWork1986ndash2006Thestudyreportsasizeableandgrowinggap betweenthenumberofjobsthatdonotrequireaqualification(6990in2006)andpeoplewithnoqualification(2232in 2006)
24 StateofthenationreportpovertyworklessnessandwelfaredependencyintheUK
Relative mobility Evidencesuggeststhatbackgroundmattersto successintheUKforexampleonly7ofthe populationattendedindependentschoolsyet asFigure18makesclearthosewhoattended
independentschoolsmakeupoverhalfofmany professionsincluding75ofjudges70of financedirectorsand45oftopcivilservants
Figure 18 A high proportion of those in professional occupations have attended independent schools
Top civil servants
45
Top journalists
54
Solicitors
55
Lords
62
Top barristers
68
Finance directors
70
Judges
75
Source Fair Access to the Professions 2009
StateofthenationreportpovertyworklessnessandwelfaredependencyintheUK 25
TheFair Access to the Professionsstudyalsofound thatseniorprofessionalshaveincreasinglycome fromwealthier-than-averagebackgrounds Acrosstheprofessionsasawholethetypical professionalgrewupinafamilywithanincome wellabovetheaveragefamilyrsquostodayrsquosyounger professionals(bornin1970)typicallygrewupin afamilywithanincome27abovethatofthe averagefamilycomparedwith17fortodayrsquos olderprofessionals(bornin1958)whileinnine ofthetwelveprofessionsrecordedthedata showsanincreaseinpeoplecomingfrombetter-offfamiliesbetweenthe1958and1970birth cohortsThisispartlyexplainedbytheincreasing
linkbetweenfamilyincomeandeducational attainmentastheadditionalopportunities tostayineducationfor16ndash18-year-olds disproportionatelybenefittedthosefrombetter-offbackgroundsashasthefurtherexpansionof highereducationfromthe1980s20
MeasuredbyintergenerationalearningsBritain performspoorlyhavingthehighestcorrelation betweensonsrsquoandfathersrsquoearningscompared withothercountriesincludingCanadaFinland andDenmarkwheresocialmobilityismuch higher(Figure 19)
Figure 19 Great Britain has a poor record of social mobility as indicated by the extent to which sonsrsquo earnings levels reflect those of their fathers
05
04
03
02
01
00
Cor
rela
tion
betw
een
fath
ersrsquo
and
son
srsquo e
arni
ngs
Britain USA France Germany Spain Sweden Canada Finland Denmark
Source OECD (2010) Economic Policy Reforms Going For Growth Chapter 5
20 BadenMachinGregg(2005)ChangesinintergenerationalmobilityinBritainCentreforEconomicPerformance
26 StateofthenationreportpovertyworklessnessandwelfaredependencyintheUK
Furtherusingabirthcohortstudyevidence showsthat21
bull ofsonsborntoparentsinthebottom25 oftheincomedistribution37areinthe bottom25byage33ndash34withonly13 havingmadeittothetop25and
bull ofsonsborntoparentsinthetop25of theincomedistribution45arealsointhe top25byage33ndash34withonly13inthe bottom25
Evidencefrominternationalcomparisonsofthe importanceoffamilybackgroundtobothincome andoccupationalclassrelyingondatafromthe 1970s1980sand1990sisunclearForchildren borninthe1960saccordingtoonestudythe UKwasatthetopofalistofninecountriesin termsoftheimportanceoffamilybackgroundon individualsrsquoincomesbutotherliteraturesuggests theUKisclosertothemeanFurtherrobust evidencewillbeavailablethroughtheMillennium CohortStudyseriesbutthisonlybeganinthe early2000ssoevidencewillonlyemergeover time
21 ibid
StateofthenationreportpovertyworklessnessandwelfaredependencyintheUK 27
Chapter 2 Worklessness unemployment and inactivity
In too many communities in the UK worklessness is prevalent A higher proportion of children live in households where no one works than in any other EU country22
and in total more than one in four adults of working age are out of work There is a particular problem with unemployment among young people with around 940000 16ndash24-year-olds currently unemployed23 and over 300000 more 16ndash17-year-olds not in employment or full-time education than there were in 199724
Worklesshouseholdsaresignificantlymore likelytoexperiencepovertythanhouseholds inwhichatleastoneadultisinwork25and evidenceshowsthatchildrengrowingupin poororworklesshouseholdsaremorelikely tobeworklessorpoorthemselvesasadults thanchildrenwhogrowupinhouseholdswhere someoneisinwork26Itisthereforeimportant thatworklessnessismeasuredatahousehold levelaswellasanindividuallevel
Employmentoffersthebestandmostsustainable routeoutofpovertychildreninhouseholds wheretwoadultsareinfulltimeworkhavea1 chanceofbeinginpovertycomparedwitha64 chanceforchildrenintwo-parenthouseholds whereneitheradultworks27Thereisalsoclear evidencethatworklessnesscontributestoill healthunhappinessanddepression28withpeople whomoveintoworktendingtoreportsubstantial
improvementsinmentalhealthPeriodsof unemploymentcanalsohavealastingnegative impactonearningsForexampleyoungpeople whospendtimenotineducationemploymentor trainingcanfacea10ndash15wagepenalty29
Thischaptersetsoutanalysisof
bull employmentunemploymentandinactivity trendsoverthepastdecadeincluding evidenceofhowtheUKcompareswith internationalcomparatorsand
bull thegroupsinoursocietymostatriskof worklessness
Itdemonstratesthatdespiterelativelyhighlevels oflabourmarketparticipationtheUKhasone ofthehighestratesofworklesshouseholds intheEUwithnearly48millionpeopleof workingageandafurther19millionchildren livinginworklesshouseholds30Some26million
22 OfficeforNationalStatisticsWorkandWorklessnessamongHouseholds2009Thiscomparisonisbasedon countrieswhichrecordthesestatisticsonEurostat 23 UnlessotherwisestatedreferencesinthisreporttounemploymentrefertotheILOrsquosinternationallyrecognised measureofunemploymentratherthanthenumbersofpeopleclaimingJobseekerrsquosAllowanceFigurespublishedinOffice forNationalStatisticsLabourMarketStatisticsMay2010 24 OfficeforNationalStatisticsLabourMarketStatisticalBulletin2010 25 OfficeforNationalStatisticsHouseholdsBelowAverageIncome2010 26 GreggHarknessandMachin(1999)ChildpovertyanditsconsequencesJosephRowntreeFoundationandSuchand Walker(2002)lsquoFallingBehindResearchontransmitteddeprivationrsquoBenefits 27 DepartmentforWorkandPensionsHouseholdsBelowAverageIncome200809 28 Black(2008)DameCarolBlackrsquosReviewofthehealthofBritainrsquosworkingagepopulationTSO 29 GreggandTominey(2005)ThewagescarfromyouthunemploymentLabourEconomics12andGregoryandJukes (2001)UnemploymentandsubsequentearningsestimatingscarringamongBritishmen1984-1994EconomicJournal111 30 OfficeforNationalStatisticsWorkandWorklessnessAmongHouseholds2009
28 StateofthenationreportpovertyworklessnessandwelfaredependencyintheUK
peopleareonincapacitybenefitswhileover 25millionpeopleareunemployedincluding around94000016ndash24-year-olds31Anumber ofthedriversofthisworklessnessincluding disincentivestoworkinherentinthecurrent benefitssystemandlowlevelsofeducational attainmentparticularlyamongdisadvantaged groupsarediscussedinsubsequentchapters
Employment unemployment and inactivity Labourmarketparticipationcanbeanalysedat boththeindividuallevelandthehouseholdlevel Thissectionexploreseachinturn
Individual level Inspiteofthebillionsofpoundsspentviathe NewDealandothergovernmentschemesthere hasbeennoimprovementinoverallemployment ratesinthepastdecadeThecurrentrateis72 meaningmorethanoneinfouroftheworking-agepopulationndash106millionpeoplendasharenot working32
Therelativelyconstantoverallemploymentrate hidesthelong-termdeclineintheemployment rateformenwhichnowstandsbelow75 comparedwithover90inthe1970s33although thisdeclinehasbeenoffsetbyrisingfemale participationrates
Ofthe106millionpeoplenotworkingarounda quarterareclassifiedasunemployed(ieactively seekingandavailabletotakeupwork)
bull followingtherecentrecessionalmost 25 millionpeopleofworkingagearenow unemployedwiththenumberscontinuingto rise(therewasa53000increasebetween October2009andMarch2010)and
bull youngpeoplearedisproportionately representedamongtheunemployedAround 940000youngpeopleareunemployed (277000ofwhomareinfull-timeeducation) consistingof20700016ndash17-year-olds(an unemploymentrateof353)and734000 18ndash24-year-olds(anunemploymentrateof 179)34
Evenbeforetherecentrecessiontoomany peopleexperiencedlsquochurnrsquobetweenlow-paidjobsandout-of-workbenefitsTheusual lsquosnapshotrsquounemploymentdatamissthisissue Almostonemillionpeoplemadefiveormore claimsforJobseekerrsquosAllowancebetween October2000andMarch201035Whileahigh churnratecanreflectasystemthatisworking wellinencouragingpeopletoaccepttemporary jobsinsteadofbenefitstheprevalenceof repeatedclaimsoveraperiodofyearssuggests thatmorecouldbedonetohelppeople turnatemporaryopportunityintosustained employment
Inadditiontothosewhoareunemployedand activelyseekingandavailableforworkthere arearecord82millionpeople(215ofthe working-agepopulation)classifiedasinactivendash thatiseithernotseekingornotavailablefor employment(Increasednumbersaredueinpart topopulationchangeandnotallofthesepeople aredisadvantagedasthefiguresincludeagrowing numberofstudentsandthoselookingafter homeandfamily)36Thereare26millionpeople inreceiptofsicknessanddisabilitybenefits 39ofwhomhavespentatleastfiveyearson benefitsAftertwoyearsonincapacitybenefits thechanceofleavingthesebenefitsinthenext yearislessthan20
31 FigurespublishedinOfficeforNationalStatisticsLabourMarketStatisticsMay2010 32 ibid 33 OfficeforNationalStatisticsLabourMarketStatisticsndashIntegratedFirstReleaseTimeSeriesData 34 OfficeforNationalStatisticsLabourMarketStatistics2010 35 OfficeforNationalStatisticsEconomicandLabourMarketReviewJune2010 36 OfficeforNationalStatisticsLabourMarketStatistics2010
StateofthenationreportpovertyworklessnessandwelfaredependencyintheUK 29
Oneofthefastestgrowinginactivegroupsis theunder-25sInthefirstquarterof2010over halfofthe14millionunder-25snotinfull-time educationoremploymentwereclassifiedas inactivewiththeremainderunemployed37 Some 45ofthoseinthisgrouphaveneverhada paidjob
Theemploymentratefor16ndash17-year-oldsnot infull-timeeducationhasbeendecliningandis nowjust364whileinactivityamongthisgroup hasrisenfrom142in1992to394today38 BetweenFebruaryndashApril1997andJanuaryndash
March2010thenumberof16ndash24-year-oldsnot inemploymentorfull-timeeducationincreased from11millionto14 millionanincreaseofover 300000(althoughpartofthisincreasereflects populationgrowth)39
Spendingtimenotineducationemployment ortrainingcanhavealastingimpactonwages withevidenceofa10ndash15wagepenaltyfor youngpeople40TheUKstillsuffersfroma relativelyhighproportionofyoungpeoplenot ineducationemploymentortrainingcompared withmostotherOECDcountries(Figure21)
Figure 21 The UK has a high proportion of young people not in education employment or training compared with most EU and OECD countries
OECD avera
ge
USA
Fran
ce
Irelan
d
German
y
Finla
nd
Ital
Portu
galy
UK
Spain
12
o
f th
e po
pula
tion
aged
15ndash
19 n
ot in
edu
catio
nem
ploy
men
t or
trai
ning 8
4
0
Source OECD Education at a Glance 2009 (figures relate to 15ndash19-year-olds 2007 data)
37 OfficeforNationalStatisticsLabourForceSurvey 38 ibid 39 OfficeforNationalStatisticsLabourMarketStatisticalBulletin2010 40 GreggandTominey(2005)ThewagescarfromyouthunemploymentLabourEconomics12andGregoryandJukes (2001)UnemploymentandsubsequentearningsestimatingscarringamongBritishmen1984-1994EconomicJournal111
30 StateofthenationreportpovertyworklessnessandwelfaredependencyintheUK
Workless households Measuringdisengagementfromthelabour marketatthehouseholdratherthanthe individuallevelhighlightstheseverityofthe situationintheUKcomparedwithourEU counterpartsandthelackofprogressthathas beenmadeoverthepastdecade
bull theUKhasthethirdhighestoverallrateof adultslivinginworklesshouseholdsinthe EUbehindonlyBelgiumandHungary41with 48millionworking-agepeoplelivingina householdinwhichnooneisinwork
bull theUKhasthehighestrateofchildren inworklesshouseholdsintheEUwith 19 millionchildrenlivinginworkless households(Figure22)42
bull theworklesshouseholdratehasremained consistentlyabove155since199943and
bull around30ofpeoplewhohavelivedin worklesshouseholdsinthepast10yearsdid soforatleasthalfofthatperiod44
Figure 22 The UK has the highest rate of children in workless households in the EU with 19 million children under 16 living in a household in which no one of working age is in work
Italy
Spain
Austri
a
Netherl
ands
Portu
gal
Greece
UK
Irelan
d
German
y
Fran
ce
20
16
12
8
4
0
o
f ch
ildre
n liv
ing
in jo
bles
s ho
useh
olds
Source Eurostat People living in jobless households aged 0ndash17 2008 data
41 EurostatPeoplelivinginjoblesshouseholds18-592008data 42 OfficeforNationalStatisticsWorkandWorklessnessamongHouseholds2009Thiscomparisonisbasedon countrieswhichrecordthesestatisticsonEurostat 43 OfficeforNationalStatisticsWorkandWorklessnessamongHouseholds2009 44 BritishHouseholdPanelSurveydata199798ndash200708
StateofthenationreportpovertyworklessnessandwelfaredependencyintheUK 31
Geographical concentrations of worklessness Therearestronggeographicaldisparitiesin worklesshouseholdratesAtaregionallevelthe highestratesareintheNorthEastfollowedby WalesLondonandtheNorthWestThelowest ratesareintheEastofEnglandWorklessnessis alsohighlyconcentratedatalocalauthorityand neighbourhoodlevel
bull athirdofpeopleinworklesshouseholds liveinjust10oflocalauthorityareas andatwardlevelfouroutof10peopleon out-of-workbenefitsliveinthe20most deprivedneighbourhoodsndashover16million individuals45
bull thereisastronglinkbetweenworklessness andsocialhousingndashhalfofworkless householdsareinsocialhousing46and
bull theemploymentrateinthemostdeprived 10ofneighbourhoodswas549in20089 comparedwith752intherestofEngland47
Figure 23 Unemployment rates in the UK are particularly high among certain groups including the young disabled people and certain ethnic minorities
Longshyterm disabled
11
16ndash17 years old
35
Ethnic minorities
13 18ndash24
years old
18
Source Office for National Statistics and Department for Work and Pensions
45 DepartmentforWorkandPensionsAdministrativeDataNOMIS 46 OfficeforNationalStatisticsLabourForceSurvey 47 CommunitiesandLocalGovernmentanalysisofDepartmentforWorkandPensionsworking-ageclientgroupdata 2009
32 StateofthenationreportpovertyworklessnessandwelfaredependencyintheUK
Vulnerable groups Ratesofunemploymentandinactivityvaryacross theUKbyageethnicityeducationdisability statusfamilytypeandregion(Figure23)The datasuggestthatthereareanumberofgroups whohavebeenparticularlydisadvantagedover thepastdecade
bull Asmentionedearlierinthechapterand consistentwithothercountriesyoungpeople facesignificantlyhigherunemploymentrates thanthewiderworking-agepopulation
bull Unemploymentratesalsovarysignificantly betweenethnicminoritiesForexample theethnicminoritygroupwiththelowest unemploymentratesisIndians(68)and thehighestrateisamongPakistanis(190) comparedwithanaverageunemployment rateamongethnicminoritiesof128Black Africanworklesshouseholdratesare36 morethandoublethenationalaverage48
bull Lessthanhalfofallpeoplewithno qualificationsareinworkIn2008those peoplewithnoqualificationsexperienced unemploymentratesof180compared withjust42forpeoplewithdegreesor equivalentlevelqualifications49
bull Lessthanhalfofalldisabledpeopleare employedwithsomegroupssuchaspeople withlearningdisabilitieshavingasignificantly loweremploymentrateandafurther10are unemployed50
bull Employmentratesamongloneparentsare significantlylowerthanthenationalaverage (57comparedwith72)whileaquarterof allworklesshouseholds(23)aremadeupof asingleadultanddependentchildren51
48 OfficeforNationalStatisticsLabourForceSurveyQuarter12010 49 ibid 50 LabourForceSurvey2009 51 OfficeforNationalStatisticsWorkandWorklessnessamongHouseholds2009
StateofthenationreportpovertyworklessnessandwelfaredependencyintheUK 33
Chapter 3 Welfare dependency
Welfare dependency is a significant problem in the UK today Around 14 million people have been on an out-of-work benefit for nine or more of the last 10 years52
and at least 12 million working-age households receive financial support from the Government each week This costs around pound85 billion per annum53
Welfaredependencycreatesanumberofcosts forindividualsandforsocietyForindividuals itcansetpeopleapartfromtherestofsociety withevidencetosuggestthatthesourceof incomemaybemoreimportantthanthe levelofincomeindetermininglevelsofsocial exclusion54Thisismainlyduetodisengagement fromthelabourmarketwhichcanhavewider effectsthelongerpeopleremainoutofwork forexamplethemorelikelyitisthattheirhealth willdeteriorateandmoreobstaclestowork willdevelopWelfaredependencycanalsohave widerunintendedconsequencessuchascreating disincentivestosaveForsocietywelfare dependencyimplieshighlevelsofgovernment expenditureontransferpaymentsandthelossof potentialtaxrevenue
Thebenefitssystemitselfalsoimpactsnegatively onincentivestoworkThecombinedratesat whichbenefitsandtaxcreditsarewithdrawnas peopleincreasetheirhoursofworkcanbeas highas955meaningfamilieskeeplessthan fivepenceineveryadditionalpoundearned(not includingadditionalin‑workcosts)Some70000 familiesfacedeductionratesofover90
Working-age benefit dependency Volumes Evenfollowingprolongedeconomicgrowthfor muchofthe1990sand2000sandwithsubstantial expenditureonemploymentprogrammes claimantnumbersformanyout‑of‑workbenefits remaintoohighThesehaverisenasaresultof therecentrecessionForexample
bull claimantnumbersofthemainout‑of‑work working‑agebenefitshavenowreached 49milliontheirhighestlevelsince199899
bull in‑workbenefitclaimantnumbershave risensubstantiallypartlyasaresultofpolicy decisionstoexpandeligibilitywithfor example24millionhouseholdsnowreceiving WorkingTaxCredit
bull thenumbersofworking‑agepeoplereceiving someofthebenefitsthatmaybeclaimed bothoutofworkandinworkhavealsorisen substantiallyForexamplethenumbersof working‑agepeopleclaimingDisabilityLiving Allowancehaverisenbyover40since1997 to18million(Figure31)(Overallnumbers ofDisabilityLivingAllowanceclaimantshave grownfrom20millionin1997to31million includingpensionersandchildren)and
52 DepartmentforWorkandPensionsinternalresearch1999ndash2009 53 OfficeforNationalStatisticsFamilyResourcesSurvey200708ThesefiguresincludeChildBenefitandtaxcredits 54 httpresearchdwpgovukasdasd5report_abstractsrr_abstractsrra _219asp
34 StateofthenationreportpovertyworklessnessandwelfaredependencyintheUK
Figure 31 The numbers of working-age Disability Living Allowance claimants have increased by over 40 since 1997 from 12 million to 18 million
Number of claimants
1997
12m
2003
15m
2009
18m
Source DWP Tabulation Tool and Quarterly Statistical Releases
bull forseveralotherbenefitsthatmaybeclaimed bothoutofworkandinworkclaimant numbershaveremainedhighForexample 32millionworking‑agehouseholdsnowclaim HousingBenefiteachweek55
Duration of benefit claims Thereisahighdegreeofpersistenceamong claimantsofmanylow‑incomeandout‑of‑work benefitsForexample
bull around26millionpeoplespentatleasthalfof thelast10yearsonsomeformofout‑of‑work benefitand14millionpeoplehavebeenonan out‑of‑workbenefitfornineormoreofthe last10years56
bull almost25millionworking‑agepeoplehave beenclaimingIncomeSupportorincapacity benefitsfortwoyearsormoreofwhom aroundtwomillionareclaimingonincapacity grounds57
bull around22millionpeopleincluding11million peopleofworkingagehavebeenclaiming DisabilityLivingAllowanceforoverfive years58and
bull aroundhalfofallHousingBenefitclaimants and40ofworking‑ageclaimantshavebeen receivingthebenefitforoverfiveyears
Justathirdofthosewhohavebeenclaiming out‑of‑workbenefitsfortwoyearsormoreare agedover55afurtherthirdareagedbetween 45and54andtheremainingthirdareaged under45
Fraud and error Inadditiontothelargenumbersofpeople claimingbenefitsandtaxcreditslegitimately thereremainsignificantnumbersofpeople eitherclaimingfraudulentlyorbeingpaid toomuchinerrorThetotalamountlostto fraudanderroreveryyearisestimatedat overpound45billionOfficialestimatesoffraud anderrorinthetax‑creditsystemalonerun ataroundpound17billionayearRegardingother benefitsestimatesoflossstandatpound10billion in200910forfraud(uppound200millionsince 200708)andpound21billionforcustomerand officialerror
55 DepartmentforWorkandPensionsTabulationTool 56 DepartmentforWorkandPensionsWorkandPensionsLongitudinalStudy1999ndash2009 57 wwwpovertyorguk14indexshtml 58 DepartmentforWorkandPensionsTabulationTool
StateofthenationreportpovertyworklessnessandwelfaredependencyintheUK 35
Working-age benefit costs Partlyduetorisingvolumesthecostsofthese working‑agebenefitsandtaxcreditshave increaseddramaticallytopound846billionfrom pound609billionin199697(Figure32bothfigures in200910prices)Muchofthisincreaseisdue totheintroductionoftaxcreditshoweverin addition
bull expenditureonworking‑ageHousingBenefit hasincreasedbynearly40frompound104 billion in199697topound142billionin200910(both figuresin200910prices)Themaximum HousingBenefitawardisnowoverpound93000 ayearwiththeaverageawardintheprivate rentedsectoroverpound5500ayearand
bull expenditureonDisabilityLivingAllowancefor working‑ageclaimantshasincreasedbyalmost 60frompound39billionin199697topound62billion in200910(bothfiguresin200910prices)
Figure33placesexpenditureonout‑of‑work benefitssuchasIncapacityBenefitIncome SupportandJobseekerrsquosAllowanceinthe contextofotherbenefitsandtaxcreditsand otherselecteddepartmentalexpenditure
Figure 32 Spend on working-age household benefits and tax credits increased by almost 40 from 199697 to 200910
199697
pound61bn
200910
pound85bn
Source Department for Work and Pensions and HM Revenue and Customs costs in 200910 prices
36 StateofthenationreportpovertyworklessnessandwelfaredependencyintheUK
Figure 33 The cost of the most expensive benefits and tax credits relative to selected other departmental expenditure
Priso
ns
Educa
tion f
or un
dershyf
ives
Other b
enef
Furth
er ed
ucati
onits
Inca
pacit
y ben
ef
Pens
ion C
reditits
Inco
me Sup
port
Jobs
eeke
rrsquos A
llowan
ce
Child B
enefi
t
State
Sec
ond P
ensio
n
DLA amp A
ttend
ance
Allo
wance
Tax c
redits
Housin
g and
Cou
ncil T
ax B
enefi
ts
Basic
State
Pen
sion
60
50
40
30
20
10
0
pound bi
llion
Sources DWP Tabulation Tool DWP Statistical Analysis 2010 HMRC Child and tax credit statistics 2007 and 2009 and House of Commons Written Answers 12 March 2010
Low-income households Forthepoorest20ofhouseholdsstate supportintheformofbenefitsandtaxcredits constitutes58oftheirgrossincome59and whenmultiplebenefitsarepaidndashusually tofamiliesfacinghighrentscaringforlarge numbersofchildrenandorlivingwithsevere disabilitiesndashratescanbehighrelativetoworking peersForexampleithasbeenestimatedthat around175000householdsintheUKare entitledtooverpound400aweekincashbenefits andtaxcreditstheequivalentofoverpound20000a yearofwhich
bull 125000householdsareentitledtopound400to pound500aweek(pound20800topound26000ayear)and
bull 50000householdsareentitledtooverpound500a week(overpound26000ayear)60(Figure34)
59 OfficeforNationalStatisticsTheeffectoftaxesandbenefitsonhouseholdincome2009 60 DepartmentforWorkandPensionsinternalestimates
StateofthenationreportpovertyworklessnessandwelfaredependencyintheUK 37
Figure 34 670000 households are entitled to benefits of over pound15000 per year
495000 households
pound15600ndash pound21000
125000 households
pound21000ndash pound26000
50000 households
pound26000+
Source Department for Work and Pensions internal estimates
Incentives to work Thebenefitssystemcontinuestoadverselyaffect theworkincentivesofthosewhomostneedan incentivetoworkOfthevariousdisincentivesto workthreeofthemostsignificantarethat
bull becauseoftheadditionalcostsassociated withwork(suchastravelclothingandchild care)andthelossofout‑of‑workbenefits somepeoplewillseerelativelysmallgains fromenteringworkandmayevenhaveless moneyaftertakingaccountofthesecosts thantheyhadonbenefits
bull forthoseonanumberofbenefitsthatcan beclaimedinworkthecombinationof howtheseparatebenefitsarewithdrawn asincomerisesmeansthatsomeindividuals
seeverysmallgainstoprogressinginwork Thesecombinedwithdrawalratescanbeas highas955forfamiliesonlowincomes meaningtheykeeplessthanfivepencein everyadditionalpoundearned(notincluding additionalinworkcosts)and70000families faceratesofover90and
bull thecomplexityofthebenefitssystemmeans thatwithsomepeoplereceivingmultiple benefitsallwithdifferingeligibilityrulesthe financialimpactofworkcanbedifficultto calculateTheoftenconfusingandfrustrating experienceofclaimingbenefitscanalsomean claimantsarereluctanttotakeonajobthat maynotworkout
38 StateofthenationreportpovertyworklessnessandwelfaredependencyintheUK
Figure 35 Transfers from the State makes up 58 of the income of the poorest 20 of households and 2 of the income of the richest 20 of households
60
o
f gr
oss
inco
me
50
40
30
20
10
0 Bottom 2nd 3rd 4th Top
Household quintiles
Source Office for National Statistics (2009) The effects of taxes and benefits on household income 200708
Higher income households ItisnotjustthepooresthouseholdsintheUK thatreceivefinancialsupportfromtheState Householdsinthetopfiveincomedecilesreceive anaverageofpound2885eachyearincashbenefits andeventhetopincomequintileofhouseholds receive2oftheirgrossincomefromtheState (Figure35)Householdswithchildrenare eligibleforChildBenefitandmaternitybenefits regardlessofincomeandoveroneinfiveof DisabilityLivingAllowanceclaimantsareinthe toptwoincomequintiles(whenDisabilityLiving Allowanceisincludedasincomeandnoaccount istakenofextracostsofdisability)
Welfare dependency among pensioners Thischapterhasfocusedonwelfare dependencyamongtheworking‑age populationgiventhepotentialofdisincentives toworkforthisagegroupTherehashowever alsobeenanincreaseinthenumberof pensionersreceivingbenefitsdriveninpart bytheintroductionofPensionCreditOver threemillionpensionerhouseholdsarenow inreceiptofmeans‑testedbenefitsprimarily intheformofPensionCreditraisingissues aroundtheextenttowhichthishascreated disincentivestosave
StateofthenationreportpovertyworklessnessandwelfaredependencyintheUK 39
Vulnerable groups Thenumbersofpeopleclaimingbenefitsandthe durationofbenefitclaimsvaryacrosstheUKby ethnicityeducationfamilytypeandregion
bull Levelofqualificationisstronglycorrelated withratesofbenefitclaimingForexample almosthalf(46)ofthe26millionpeople onincapacitybenefitshavenoformal qualificationsandafurther13hold qualificationsbelowarecognisedLevel261 MorethanoneinfiveofnewJobseekerrsquos Allowanceclaimants(22)haveno qualifications62
bull Likelihoodofclaimingbenefitsalsovaries accordingtofamilytypewithitlikelythat moreloneparentsreceivefinancialsupport fromtheStatethantwo‑parentfamilies
bull ThoseoutsidetheSouthEastofEnglandare significantlymorelikelytobeclaimingcertain benefitsForexample61ofworking‑age peopleclaimDisabilityLivingAllowanceinthe NorthWestcomparedwith35intheSouth East63
bull Over40ofbenefitclaimantsarefoundin the20mostdeprivedneighbourhoodsThe rateofIncapacityBenefitclaimantsinthese neighbourhoodsisnearlydoubletherate inEnglandfortheworking‑agepopulation (132comparedwith69)Thisamountsto roughly820000people64
61 DepartmentforWorkandPensionsNewDealforDisabledPeopleEligiblePopulationSurveyWaveThree2006 62 Knight(2010)ResearchReportNo624JobseekersRegimeandFlexibleNewDealtheSixMonthOfferandSupport fortheNewlyUnemployedevaluationsAnearlyprocessstudyDepartmentforWorkandPensions 63 DepartmentforWorkandPensionstabulationtoolOfficeforNationalStatisticspopulationestimates2008 64 CommunitiesandLocalGovernmentanalysisofDepartmentforWorkandPensionsWorkingAgeClientGroupdata 2009
40 State of the nation report poverty worklessness and welfare dependency in the UK
Chapter 4 Poor health and educational disadvantage
In 2010 the health gap proxied by life expectancy at birth between those from high and low socio-economic backgrounds is wider now than in the 1970s65 while the gap in educational attainment between children from wealthy and deprived backgrounds remains high
Heath not only influences quality of life directly but can also affect the extent to which people are able to participate in the labour market and in wider society Despite growing life expectancy there are many people who continue to experience poor physical and mental health and the prevalence of risky behaviours remains an issue Childrenrsquos health and well-being appear particularly poor relative to other countries A recent report by the Organisation for Economic Co-operation and Development (OECD)66
suggests that ndash except for material well-being and quality of school life ndash the UK ranks below the middle on most other dimensions and our young people rank almost bottom on risky behaviours
In terms of education a child in the UK eligible to free school meals is half as likely to achieve five or more GSCEs at grade AndashC including English and maths as a child from a wealthier background In addition many people in the UK are held back because of a lack of skills with qualifications being correlated with stronger employment outcomes higher wages and better
health Of the working-age population 10 still have no qualifications which rises to 24 for working-age disabled adults67 International benchmarks suggest that the proportion of adults without upper secondary levels of qualifications in the UK is above the OECD average68
Health disadvantage Although life expectancy continues to increase69
large numbers of people in the UK still suffer from poor health outcomes Around 27 million adults (6) aged 16 and over in England report having bad or very bad health70 The number of people who report having a long-term health condition is around 18 million of which around 10 million report suffering from a limiting long-standing illness71 Some 32 of disabled people report difficulties in accessing goods and services and 22 do not have frequent choice and control over their lives
65 ONS Longitudinal Study estimates of life expectancy by social class 1972ndash2005 66 OECD Doing Better for Children 2009 67 Labour Force Survey Quarter 2 2008 68 OECD Education at a Glance 2009 69 Life expectancy has risen to 77 years for males and 82 years for females a rise of six and five years respectively over 25 years Office for National Statistics (2009) Social Trends No 39 70 NHS Information Centre Health Survey for England 2008 This figure has fluctuated between 6 and 7 between 2003 and 2008 Figure provided for 2008
State of the nation report poverty worklessness and welfare dependency in the UK 41
Mental health There are particular concerns around the state of the UKrsquos mental health because of the profound effect this has on quality of life and because over 40 of people claiming health-related social security benefits cite mental-health problems as the reason72 The overall cost of mental illness has been estimated at pound77 billion a year73 Several studies show or imply the prevalence of mental illnesses in particular
bullaround 6 million (15) adults aged 16 and over have at least one common mental-health disorder74 and 3 million adults have symptoms severe enough to require treatment75
bullthe number of prescription items for anti-depressant drugs has increased from nine million in 1991 to 34 million in 200776
(although greater availability of drugs and better diagnoses will account for some of this increase) and
bullroughly 1 of the population suffers from a severe mental illness like schizophrenia77
Alcohol smoking and drugs consumption It is notable that the UK experiences relatively high levels of risky behaviours such as alcohol consumption smoking and drug dependency The volumes of alcohol consumption by international standards are high (Figure 41) and the pattern of consumption exacerbates this
bullAround 24 million adults regularly drink more than double the amount specified by NHS guidelines ndash an average of 78 units per week78 Alcohol consumption has doubled over the last 50 years with nearly a quarter of the adult population drinking nearly three-quarters of all the alcohol consumed in England79
bullAround 16 million adults are moderately or severely dependent on alcohol80
bullSocietal harm from alcohol each year includes approximately one million incidents of violent crime over 100000 cases of domestic abuse and over 600 deaths from drink driving81
while costs to society are estimated at between pound17 billion and pound22 billion82
71 Office for National Statistics General Lifestyle Survey 2008 data Data for 2008 shows 178 million reporting long-term health conditions and 104 million reporting suffering from limiting long-standing illness72 Department for Work and Pensions Tabulation Tool (Incapacity BenefitSevere Disablement Allowance data 2009)73 Sainsbury Centre for Mental Health (2003) The economic and social costs of mental illness Policy Paper 374 The Clinical Interview Scheduled ndash Revised 2007 data The Clinical Interview Schedule ndash Revised (CIS-R) is an interviewer-administered structured interview schedule covering non-psychotic symptoms in the week prior to interview It can be used to provide prevalence estimates for 14 types of neurotic symptoms six types of common mental disorder and a continuous scale that reflects the overall severity of neurotic psychopathology It provides a more accurate estimate of the prevalence of common mental disorders in a population than survey-based measures such as the GHQ or SF-361275 McManus Meltzer Brugha Bebbington amp Jenkins (2009) Adult psychiatric morbidity in England 2007 Results of a household survey A survey carried out for The NHS Information Centre for health and social care by the National Centre for Social Research and the Department of Health Sciences University of Leicester76 Young Foundation (2009) Sinking and Swimming Understanding Britainrsquos Unmet Needs based on Office for National Statistics Social Trends data 200977 ibid 78 According to the NHS guidelines men should not regularly drink more than 3ndash4 units a day and women should not regularly drink more than 2ndash3 units a day79 Department of Health analysis of General Lifestyle Survey January 201080 McManus Meltzer Brugha Bebbington amp Jenkins (2009) Adult psychiatric morbidity in England 2007 Figures in 2007 were 111340 incidents of alcohol-related violent crime and 608 deaths from drink driving 81 ibid 82 From Cabinet Office (2003) Alcohol misuse how much does it cost With updated estimates from Home Office and Department of Health Costs from disorder and crime between pound8 billion and pound13 billion unemployment and workplace sickness pound64 billion and NHS costs pound27 billion
42 State of the nation report poverty worklessness and welfare dependency in the UK
bullBritish teenagers drink more and earlier than their European counterparts with UK 15-year-olds more likely to have both drunk alcohol and been drunk in the last 12 months than the European average (88 and 57 compared with 82 and 39 respectively)83
In terms of drugs and smoking
bullaround 34 of adults aged 16 and over in England are dependent on drugs other than alcohol84
bullthe problem is particularly acute among young adults with 102 of 16ndash24-year-olds dependent on drugs other than alcohol
bullcannabis is the most common drug of dependency with 87 of 16ndash24-year-olds being dependent on it (27 of the overall population)85 and
bull21 of adults smoke cigarettes86
Figure 41 The average person in the UK consumes 115 litres of pure alcohol per year
Ital
Norway
y
Irelan
d
German
y UK
Fran
ce
Spain
Denmark
Netherl
ands
Finla
nd
140
120
100
80
60
40
20
00
Litr
es o
f pu
re a
lcoh
ol c
onsu
med
per
per
son
per
year
Source World Health Organization Global Information System on Alchol and Health (GISAH) 2008 2003 data for adults over 15
83 European School Survey Project on Alcohol and Other Drugs 2007 84 The NHS Information Centre Adult psychiatric morbidity in England 2007 Other drugs of dependency include cocaine heroin and methadone but drugs that are less associated with dependency like LSD magic mushrooms etc are not included 85 ibid 86 General Lifestyle Survey 2008
State of the nation report poverty worklessness and welfare dependency in the UK 43
Figure 42 There is strong drug dependence among adults in England with addiction concentrated among young adults
All Male Female 16
ndash24shy
year
sshyol
d
102 133 70
Ove
rall
popu
lati
on
34 45 23 Source Understanding the risks of social exclusion across the life course Families with Children Social Exclusion Task Force Cabinet Office 2009
Obesity The UK also suffers from rising levels of obesity
bullaround 10 million adults (245) in England aged 16 years and over are obese (Figure 43) up from 149 in 199387
bullof those 800000 (20) are morbidly obese88
bullaround 14 million children aged 2ndash15 years (160) are obese up from 117 in 199589
and
bullthe prevalence of obesity in the UK is much greater than the average for OECD countries (240 versus 162) with only the USA and Mexico reporting higher rates in 200690
87 The NHS Information Centre Health Survey for England 2008 2009 88 ibid 89 ibid 90 OECD Health Data 2009 Note that data is only available for 14 of the 30 OECD countries in the sample
44 State of the nation report poverty worklessness and welfare dependency in the UK
Figure 43 25 of the UK adult population was obese in 2008
1993
15
1999
20
2008
25
Source NHS Information Centre Health Survey for England 2008 Trend Tables 2009
Childrenrsquos health and well-being in the UK appears particularly poor relative to other countries A recent OECD report suggests that ndash except for material well-being and quality of school life ndash the UK ranks below the middle on other dimensions91 Our young people rank almost bottom on risky behaviours
Distribution of health inequalities Health problems and diseases are not experienced equally As a recent independent report Fair Society Healthy Lives has identified there remain significant and systematic differences in health the poorer and more disadvantaged you are the more likely you are to die early and to spend significantly more of your shorter life in poor health92
bullIn England people living in the poorest neighbourhoods die on average seven years earlier than people living in the richest neighbourhoods Between the very richest and poorest the gap is even larger93
bullThe gap in terms of quality of life as measured by disability-free life expectancy is greater still with the average difference between those living in the poorest and richest neighbourhoods being 17 years the gap between the very richest and poorest is also larger
bullThe death rate for females under 75 from circulatory diseases in the most deprived wards is almost three times higher than in the least deprived wards (27 times higher for men)
bullThe death rate for females under 75 from cancer in the most deprived wards is 14 times higher than for those in the least deprived wards (17 for men)94
In terms of obesity and risky behaviours
bullaround 26 of those in routine or manual occupations smoke with 7 being heavy smokers compared with 3 in managerial and professional occupations95 and
91 Organisation for Economic Co-operation and Development (2009) Doing better for children 92 The Marmot Review (2010) Fair Society Healthy Lives Strategic Review of Health Inequalities in England post-2010 93 i bid 2003 data 94 Mortality by deprivation and cause of death in England and Wales 1999ndash2003 (Ester Romeri Allan Baker and Clare Griffiths) in Health Statistics Quarterly 32 (Winter 2006) ONS data for 1999ndash2003 for England and Wales by the Office for National Statistics A similar link between health and deprivation is observed in other main causes of death including ischaemic heart disease stroke all cancers respiratory diseases and general accidents 95 NHS information centre statistics on smoking England 2009
State of the nation report poverty worklessness and welfare dependency in the UK 45
bullaround 34 of those in routine or manual occupations are expected to be obese by 2012 compared with 29 of those in non-manual occupations with the gap expected to widen by 201596
These systematic gaps cannot be explained in terms of chance or genetics alone They are partly driven by clustering effects In 2003 around 30 of men in social class V reported at least two combinations of being smokers drinking alcohol at unsafe levels and having a poor diet this compares with less than 10 of adult males from the highest social class97
Educational disadvantage and a poor start for children In the future the Government may use different benchmarks to measure the health of our society and the levels of disadvantage within it Yet it is clear that despite large increases in expenditure on education and growth in the proportion of children attaining current expected levels of educational achievement over the past decade there are still a substantial number of children and adults who are not achieving their full potential especially in the most disadvantaged
communities Moreover the UK scores poorly on a range of other indicators of child well-being98 a recent World Health Organization survey showed the UKrsquos performance on social and psychological indicators of child health and happiness to be disappointing99 As a consequence it has been estimated that the UK spends a third more than other countries in Europe on addressing social problems100
Early years Social class is strongly associated with levels of development in the early years This is shown by research into the 1970 birth cohort where a group of childrenrsquos ability levels were assessed at four points in time The results imply that during primary schooling (around age 6) children with low ability (as assessed at 22 months) from families in the high Socio Economic Status (SES) overtake the children with high ability from families in the low SES group (Figure 44)101
This appears to be confirmed by a recent study suggesting an emerging social class gap in the early years for children born in 2000 although recent analysis of qualifications at 16 suggests a weakening link between parental income and child outcomes at that age102
96 NHS information centre statistics on obesity physical activity and diet England 2010 97 Department of Health analysis of Health Survey for England 2003 published in Department of Health (2008) Health Inequalities Progress and Next Steps 98 Bradshaw and Richardson (2009 published online) lsquoAn Index of Child Wellbeing in Europersquo Child Indicators research 99 World Health Organisation Regional Office for Europe (2008) lsquoSocial Cohesion of mental wellbeing among adolescentsrsquo WHOHBSC forum 2007 final report 100 Aked et al (2009) Backing the Future lsquoWhy Investing in Children is Good for us Allrsquo New Economics Foundation 101 Feinstein (2003) Inequality in the Early Cognitive Development of British Children in the 1970 Cohort Economica Vol70 102 Blanden and Machin (2007) Recent Changes in Intergenerational Mobility
46 State of the nation report poverty worklessness and welfare dependency in the UK
Figure 44 Socio-economic background is strongly associated with early-years attainment
100
90
80
70
60
50
40
30
20
10
0 22
Atta
inm
ent p
erce
ntile
Low socioshyeconomic status high early rank High socioshyeconomic status high early rank Low socioshyeconomic status low early rank High socioshyeconomic status low early rank
32 42 52 62 72 82 92 102 112
Age (months)
Source Feinstein (2003) Inequality in the Early Cognitive Development of British Children in the 1970 Cohort Economica Vol 70
Evidence from long-term studies such as the Effective Pre-school and Primary Education (EPPE) study shows that in the early years good-quality childcare is second only to parenting in determining the childrsquos outcomes ndash both short and long term Good-quality childcare as well as good-quality parenting programmes are therefore particularly important for children from disadvantaged backgrounds and can help to narrow gaps in achievement which are still visible up to age 10103 The EPPE study also found that the quality of the learning environment of the home (where parents are actively engaged in activities with children) promotes intellectual and social development in all children
By international standards the UK ranks 11th in the OECD countries in terms of the percentage
of the population taking part in early years education104
Children at primary and secondary school There is a clear link between poverty and under-attainment throughout the education system pupils who are eligible for free school meals have on average lower attainment than other pupils By the end of Key Stage 2 (end of primary education) the chance of a pupil who is eligible for free school meals achieving Level 4 in reading writing and maths is almost 15 times lower than that of a pupil who is not eligible for free school meals105
In secondary education a child eligible to free school meals is half as likely to achieve five or more GSCEs at grade AndashC including English and maths than a child from a wealthier background106
103 Sylva et al (2008) Final Report from the Primary Phase of the Effective Pre-school and Primary Education (EPPE) study published as DCSF RR061 104 OECD Education at a Glance 2009 105 The percentage of FSM pupils achieving level 4 and above in English and maths is 53 compared with 76 for non-FSM pupils 106 Department for Children Schools and Familes Achievement tables Time series of GCSE achievements by pupil characteristics England 2006ndash09
State of the nation report poverty worklessness and welfare dependency in the UK 47
Figure 45 There is a clear and consistent link between poverty and educational attainment
The gap between those eligible and ineligible for free school meals has remained persistently high at around 28 percentage points
Eligible
27
Ineligible
54
achieving 5+ AndashC grades including English and maths
Source Department for Children Schools and Families Achievement Tables time series of GCSE achievement by pupil characteristics England 2006ndash09
Although the gap in attainment between those eligible for free school meals and those who are not has narrowed in recent years it has done so only slightly By 2009 the gap was 23 percentage points at Key Stage 2 (with 76 of children ineligible for free school meals reaching Level 4 in English and maths compared with only 53 of children eligible for free school meals) and around 28 percentage points at GCSE (54 of children ineligible for free school meals obtained five or more AndashC grades including English and maths compared with 27 of children eligible for free school meals ndash see Figure 45)
There are also large gaps in attainment in terms of the area in which pupils live Although differences have narrowed slightly recently there is still for example a 39 percentage point gap in gaining five or more AndashC grades at GCSE between those living in the most and in the least deprived areas
Other disadvantaged groups are also falling behind with a growing education gap for children in care While the proportion of children in care achieving five GCSEs or equivalent at grade AndashC has risen from 8 in 2001 to 148 in 2009 (and to 21 on new data taking in a broader range of qualifications) over the same period the proportion of all children achieving those grades
at GCSE has risen from 48 to 70 The gap has therefore widened from 40 percentage points in 2001 to about 55 percentage points by 2009
Pupil achievement is hampered by absence from school The number of persistent absentees fell from 273000 in 200607 to 208000 in 200809 but there are still relatively high numbers of pupils from disadvantaged backgrounds who are persistently absent
bullAn average of 8 of half days are missed in the most deprived areas compared with 46 in the least deprived
bullThose known to be eligible for free school meals are much more likely to be persistent absentees (73 versus 25 for other pupils in 200809)
bullOf pupils resident in the most deprived areas 57 are persistent absentees compared with just 13 in the least deprived areas
bullOf those with a statement of special educational needs (SEN) 92 are persistent absentees compared with 21 of pupils with no identified SEN in 200809107
107 For all the bullets above Department for Children Schools and Families Achievement Tables England 2006ndash09
48 State of the nation report poverty worklessness and welfare dependency in the UK
Even more critical than persistent absenteeism is the issue of pupils who are permanently excluded from school In 200708 there were around 8100 permanent exclusions (11 in every 10000) and around 380000 fixed-period exclusions (51 of the school population) Children eligible for free school meals are around three times more likely to receive either a permanent or fixed-period exclusion than children who are not eligible For fixed-period exclusions the rates were 116 and 40 respectively Black Caribbean pupils have consistently been around three times more likely than the overall average to be permanently excluded and twice as likely to receive fixed-period exclusions108
By international standards the UK ranks in the middle of 18 OECD countries surveyed in terms of overall reading achievement of 10-year-olds109
For secondary education the UK ranks 14th out of 57 countries in science (behind for example Finland Canada Japan and Germany) 17th in reading and 24th in maths110
Higher education Research shows that individuals with higher qualifications are more likely to be employed than those with lower qualifications and once in work they earn more on average than similar individuals with lower-level skills
Participation in higher education is marked by socio-economic background For example
bullfewer than one in five young people from the most disadvantaged areas participate in higher education compared with more than one in two for the most advantaged areas111
bulljust 1 of pupils eligible for free school meals go on to a Russell Group university compared with 7 of pupils who are ineligible112 and
bullout of the 81000 pupils eligible for free school meals in 200607 only 45 went to Oxbridge
Adult population Despite a growing lsquolifelong learningrsquo culture in the UK it is clear that there are millions of adults who may be regarded as suffering from educational disadvantage
bull73 million adults in England (24) lack at least a Level 2 qualification ie those academic and vocational qualifications that are equivalent to five GCSEs AndashC113
bullthose with lower-level skills are less likely to receive work-related training through their employer are less likely to participate in informal training and face greater barriers to learning with just 47 of those with no qualifications engaging in further learning (compared with 97 of those with a higher degree)114 and
bull3 to 5 of adults lack basic numeracy or literacy skills115
International benchmarks suggest that the proportion of adults without Level 2 qualifications in the UK is higher than the OECD average and substantially above levels in Germany Sweden and the USA116
108 In 200708 036 of Black Caribbean pupils were permanently excluded compared with 012 of the school population as a whole (111 versus 577 for fixed-period exclusions)109 IEA PIRLS 2006110 OECD PISA 2006 It should be noted that the scores of many countries are similar and therefore rankings should not be over-interpreted as many countries have scores that are not statistically different 111 HEFCE 201003 wwwhefceacukpubshefce201010_03112 BIS analysis of matched National Pupil Database and HESA student record113 2009 data Statistical First Release on Post-16 Education amp Skills wwwthedataserviceorgukstatisticssfrmar10114 National Adult Learning Survey Department for Education and Skills (2006) Research Report 815115 Estimates for 2002ndash03 Skills for Life Survey The survey is currently being updated116 OECD (2009) Education at a glance
StateofthenationreportpovertyworklessnessandwelfaredependencyintheUK 49
Chapter 5 Families and communities
There are severe problems in the UK today related to family breakdown low levels of social capital the shortage of good-quality housing and the extent of neighbourhood deprivation
AroundthreemillionchildrenintheUKhave experiencedtheseparationoftheirparents117 andtheUKhasoneofthehighestratesof teenagebirthsinEurope118Some6report havingnoclosefriends119whileover500000 olderpeoplespentChristmasdayalone in2006120Some74millionhomes(33) areclassifiedaslsquonon-decentrsquo121while7of householdsinEnglandreportnoisetobea seriousproblem122
Aswithotheraspectsofdisadvantagethese problemsareunevenlyspreadPeoplein managerialandprofessionaloccupationsare morelikelythanallotheroccupationalgroups tohaveparticipatedincivicengagementfor example123
Thereisaclearrelationshipbetweenthese aspectsofdisadvantageandthosesetoutin earlierchaptersIntermsoffamilystructure thereisforexampleastrongcorrelation
betweenrelationshipbreakdownandadultill-health124andthereisalsoevidenceofsignificant differencesbetweenchildrenwhoexperience parentalseparationcomparedwithchildren inlsquointactcouplefamiliesrsquoacrossarangeof educationalbehaviouralemotionalandhealth outcomesIntermsofsocialcapitalyoung peoplefromlowersocio-economicbackgrounds arelesslikelytoestablishsocialnetworksbeyond theirimmediatecircleforexampleandthismay restrictjobopportunities125
Intermsofhousinglinkshavebeenfound betweenpoorqualityhousing(suchashomes thataredamporhardtoheat)andarangeof healthoutcomessuchasrespiratoryconditions andstomachproblemsAtaneighbourhood levelgrowingupinaneighbourhoodwith highlevelsofcrimeandantisocialbehaviour increasesthechancesofbeingeitheravictimor perpetratorofcrimewhilecertainareashave
117 HerMajestysGovernment(2004)ParentalSeparationChildrenrsquosNeedsandParentsrsquoResponsibilities 118 OECD(2009)Doingbetterforchildren 119 CommunitiesandLocalGovernment(2009)CitizenshipSurvey200708 120 YoungFoundation(2009)SinkingandSwimmingunderstandingBritainrsquosunmetneeds 121 CommunitiesandLocalGovernment(2010)EnglishHousingSurveyHeadlineReport200809 122 CommunitiesandLocalGovernment(2009)SurveyofEnglishHousing200708 123 CommunitiesandLocalGovernment(2009)CitizenshipSurvey200708 124 ColemanandGlenn(2009)WhenCouplesPartUnderstandingtheconsequencesforadultsandchildren 125 Websteretal(2004)PoorTransitionsYoungAdultsandSocialExclusion
50 StateofthenationreportpovertyworklessnessandwelfaredependencyintheUK
concentrationsofworklessnessandwelfare dependencyThereisalsoastronglinkbetween socialhousingpovertyandworklessnesshalfof allworklesshouseholdsareinsocialhousing126
Changes in family structure Thereisevidenceofsignificantchangesinfamily structuresinthelast30yearsacrossarangeof measures
bull Around3millionchildrenintheUKhave experiencedtheseparationoftheirparents Thisispartlyattributabletoarisein cohabitationgiventheincreasedlikelihood ofbreak-upforcohabitingcouplesrelative tomarriedcouples127Approximatelyone inthreeofthoseparentscohabitingatbirth willseparatebeforethechildisfiveyearsold comparedwith1in10marriedparents128
Figure 51 The proportion of children being born outside of marriage has risen from under 5 in the 1950s to 45 in 2008
Rat
e pe
r th
ousa
nd li
ve b
irth
s
500 All outsideshymarriage live births Cohabitants Lone parents
400
300
200
100
0
1900
1908
1916
1924
1932
1940
1948
1956
1964
1972
1980
1988
1996
2004
Source Institute for Fiscal Studies (2010) Cohabitation Marriage and Child Outcomes
126 StrategyUnitSocialExclusionTaskForceanalysisofLabourForceSurvey2009 127 Benson(2009)FamilypolicybreakdownandstructureBCFT 128 KiernanandMensahPartnershiptrajectoriesparentandchildwellbeinginHansenJoshiandDex(2010)Childrenof the21stCenturyVolume2thefirstfiveyears
StateofthenationreportpovertyworklessnessandwelfaredependencyintheUK 51
bull Birthsoutsideofmarriagerosefrom37 to45between1997and2008(Figure51) composedalmostentirelyofanincrease inbirthstocohabitingparents129Thisis consistentwithtrendsacrossEurope130
bull Themarriageratehasdeclinedby38since 1970inlinewiththeEuropeanaveragethe numberofdependentchildreninmarried-couplefamiliesfellby13millionfrom 96 millionto83millionbetween1997and 2009131butthisremainsthemostcommon familyform
bull Therearearound2millionfamiliesheaded byaloneparent(90ofwhichareheaded byamotherandthemajorityresultingfrom relationshipbreakdown)Thisrepresents aroundaquarterofallfamilieswithchildren thefifthhighestproportionintheOECD (Figure52forselectedcountriesonly)132
Theratevariessignificantlybyethnicityin theUKwith56ofBlackorBlackBritish childrenlivinginloneparentfamilies133
Figure 52 The UK has one of the highest proportions of lone-parent families in the OECD (selected countries only)
USA
UK
Irelan
d
Norway
OECDshy29
Fran
ce
Swed
en
Spain
German
y Ita
ly
Netherl
ands
Portu
gal
30
25
20
15
10
5
0
o
f lo
ne p
aren
t hou
seho
lds
Source OECD (2009) Family Database SF1 Family size and composition
129 InstitueforFiscalStudies(2010)Cohabitationmarriageandchildoutcomes 130 RobertsStaffordDuffyRossandUnell(2009)Literaturereviewontheimpactoffamilybreakdownonchildren BrusselsEuropeanCommissionDirectorate-GeneralforEmploymentSocialAffairsandEqualOpportunitiesUnitfor SocialandDemographicAnalysis 131 OfficeforNationalStatistics(2009)SocialTrends40 132 OECD(2009)FamilyDatabaseSF1Familysizeandcomposition 133 OfficeforNationalStatistics(2009)SocialTrends40
52 StateofthenationreportpovertyworklessnessandwelfaredependencyintheUK
bull In2007thedivorcerateinEnglandand Waleswas119per1000marriedpopulation divorcerateshaveremainedrelativelystable sincethemid-1980s134
bull Stepfamiliesarethefastestgrowingfamily typeintheUK135Around1in10children nowliveinstepfamiliesabovetheOECD average136
bull Whilebirthsamongunder-18sareattheir lowestrateforover20yearstheUKhasthe highestteenagebirthrateinEurope (Figure53)137
Figure 53 The UK has the highest teenage birth rate in Europe
Swed
en
Fran
ce
Netherl
ands
Ita
ly UK
German
y
Norway
Spain
0
5
10
15
20
25
Bir
ths
per
100
0 w
omen
age
d 15
ndash19
Source OECD (2009) Doing better for children Teenage fertility rates (15ndash19) per 1000 women aged 15ndash19 2005
134 OfficeforNationalStatistics(2009)SocialTrends40 135 MooneyOliverandSmith(2009)Impactoffamilybreakdownonchildrenrsquoswellbeingevidencereview 136 OECD(2009)Doingbetterforchildren 137 OECD(2009)Doingbetterforchildren
StateofthenationreportpovertyworklessnessandwelfaredependencyintheUK 53
Familybreakdownisassociatedwithanumber ofpooroutcomesfortheadultsandchildren involvedForexamplethereisastrong correlationbetweencouplerelationship breakdownandadultill-health138particularly maternalmentalhealthmotherslivingwith thefatheroftheirchildreportlessdepressive symptomsthanthoselivingwithotherpartners orasloneparents139Thereisalsoevidenceof significantdifferencesbetweenchildrenwho experienceparentalseparationcomparedwith childreninlsquointactcouplefamiliesrsquoacrossarange ofeducationalbehaviouralemotionalandhealth outcomesForexamplechildreninlone-parent andstepfamiliesaretwiceaslikelytobeinthe bottom20ofchildoutcomesaschildrenin marriedfamilies140Itisalsonoteworthythatof the142000mostdisadvantagedfamiliesinthe UK(measuredintermsofthosewhosufferfrom fiveormoreselecteddisadvantages)under20 werefrommarriedhouseholdscomparedwith around65ofallfamilies(Figure54)141
Lone-parentfamiliesaretwiceaslikelytobe inthebottomincomequintileastwo-parent families(39beforehousingcostsand44after housingcostsforloneparentfamiliescompared with20and21respectivelyfortwo-parent families)
Thesecorrelationsshouldhoweverbe interpretedwithsomecautionbecauseitis difficulttoassessaccuratelythedirectionand extentofcausalitybetweenfamilybreakdown riskfactors(suchaspovertyandmaternalmental health)andoutcomes142Forexamplechildrenin householdsheadedbymarriedcouplesmayhave betteroutcomesduetothefactthatpeoplewho havehadabettereducationaremorelikelyto getmarriedratherthanmarriageitselfcausing thoseoutcomesThescaleanddurationofthe impactonchildrenisalsocontestedResearch indicatesthatoutcomegapsvarysignificantly withinfamilystructuresandarerelativelysmall comparedwithsocio-economicfactorswhile separationmayinfactbenefitchildrenwhere therearehighlevelsofparentalconflict143
Neverthelessthestrongevidencelinkingthe experienceoffamilybreakdownanddysfunction topooreroutcomesforbothadultsandchildren indicatestheimportanceoffamilystructureand homeenvironmentforpolicy
138 ColemanandGlenn(2009)WhenCouplesPartUnderstandingtheconsequencesforadultsandchildren 139 BrownandMoran(1997)SinglemotherspovertyanddepressionHetherington(1999)Shouldwestaytogetherfor thesakeofthechildrenHetherington(1999)Copingwithdivorcesingleparentingandremarriage 140 LexmondandReeves(2009)BuildingCharacter(Demos) 141 SocialExclusionTaskForceanalysisofFACS2006data2010 142 Giventheinter-relationshipsbetweenloneparenthoodincomematernalmentalhealthandparentingthereremains debateoverthevalidityofcontrollingforthesehighlycorrelatedvariablesForexamplewomeninBritainare40 morelikelytoenterpovertyiftheydivorcethaniftheyremainmarried(withanaveragefallofincomeof17)since separationoftenmeansthedirectlossofafamilyearnerandmayalsomakeitharderforthemothertoworksosimply discountingforincomeignoresthiscausalpathway 143 MooneyOliverandSmith(2009)Impactoffamilybreakdownonchildrenrsquoswellbeingevidencereview
54 StateofthenationreportpovertyworklessnessandwelfaredependencyintheUK
Figure 54 Under 20 of the most disadvantaged families have married couples heading them
100
80
60
40
20
0
Com
posi
tion
of f
amili
es b
y ty
pe
Most disadvantaged 142000 families of all families
Stepfamily
Cohabiting couple
Married couple
Lone parent ndash other (divorced separated widowed)
Lone parent ndash single never married
Source Social Exclusion Task Force analysis of GHS and FACS 2006 data 2010
Thereisstrongeragreementthatfamily breakdownismostdetrimentaltochildrenwhere therearerepeatedchangestofamilystructure forexamplefromanlsquointactcouplefamilyrsquoto loneparenthoodtostepfamilystatusandback toloneparenthoodFamilytransitionsareoften linkedtoanumberofotherchangesinliving circumstancesparentalemploymentschools andfluctuationsinincomeandtheeffectsof thesechangesarebelievedtobecumulative withmultipletransitionsbeingparticularly detrimentaltochildrenrsquoswell-being144Recent researchindicatesthatrisksofpovertymaternal depressionandchildrenhavingemotionaland behaviouralproblemsarehighestwherelone mothersexperiencelsquoperiodsofpartnershiprsquowith thefatherandorotherpartners(Figure55)145
Familybreakdowndoesnotaffectallpartsofthe countryorallsectionsofcommunitiesequally Forexampleloneparentfamiliesareheavily concentratedindeprivedurbanareaswhich haveratesofover40comparedtounder15 inseveralpartsofSouthEastandEastEngland146 whilestudieshavefoundaclearassociation betweenlivinginadeprivedwardandadolescent pregnancyintheUK147
Theevidencealsosuggeststhatriskoffamily breakdownislikelytobetransmittedinter-generationallywithchildrenofdivorcedparents estimatedtobetwiceaslikelyaschildrenof non-divorcedparentstoexperiencedivorce themselves148
144 MooneyOliverandSmith(2009)Impactoffamilybreakdownonchildrenrsquoswellbeingevidencereview 145 KiernanandMensahPartnershiptrajectoriesparentandchildwellbeinginHansenJoshiandDex(2010)Childrenof the21stCenturyVolume2thefirstfiveyears 146 OfficeforNationalStatistics(2007)Focusonfamilies 147 SloggetandJoshi(1998)McCulloch(2001)reviewedinWorldHealthOrganization(2004)AdolescentPregnancy IssuesinAdolescentHealthandDevelopment 148 MooneyOliverandSmith(2009)Impactoffamilybreakdownonchildrenrsquoswellbeingevidencereview
StateofthenationreportpovertyworklessnessandwelfaredependencyintheUK 55
Figure 55 Proportion of children experiencing behavioural problems at age five by family structure and relationship structure
Marr
ied at
birth
ndash sta
ble
Cohab
iting
at bi
rth ndash
stable
Cohab
iting
to m
arried
LP
LP
Marr
ied at
birth
to L
P
to m
arried
LP Coh
abiti
ng to
LP
at bi
rth ndash
stable
to co
habit
ing
Cohab
iting
to re
shypart
nered
LP to n
ew pa
rtner
LP to p
eriod
s of p
artne
rship
35
Prop
ortio
n of
chi
ldre
n ex
peri
enci
ng b
ehav
iour
al
prob
lem
s at
the
age
of f
ive
30
25
20
15
10
5
0
Source Kiernan and Mensah 2010 Partnership trajectories parent and child wellbeing in Hansen Joshi and Dex Children of the 21st Century the first five years
Loneliness and lack of social capital Thenatureandqualityofpeoplersquossocial relationswhetherwithfriendsandfamilyor widercivicengagementthroughorganisations andothersocialnetworksplaysanimportant roleindeterminingwellbeingAlthoughthe UKcomparesfavourablywithothercountries onanumberofindicatorsofsocialcapital suchaswillingnesstodonatetocharitythere remainsubstantialnumberswhosufferfrom disadvantageineithercivicorpersonalsocial capital
Intermsofcivicengagementlargenumbersof citizensareactivelyinvolvedintheircommunities with47ofallpeoplecarryingoutatleastone formofcivicengagementactivityinthelast year149Evenmorecitizens(64)takepartin someformofvolunteeringatleastonceayear
Nonethelessthereseemstobesomeuntapped demandforgreaterinvolvement
bull only39ofpeopleagreetheycaninfluence decisionsthataffecttheirlocalareaandeven fewer(22)agreetheycaninfluencedecisions affectingthecountryasawhole
149 CommunitiesandLocalGovernment(2010)CitizenshipSurvey200809Civicengagementactivityincludescivil activismcivicconsultationandcivicparticipationAllotherreferencesinthissectionaretothe200809Citizenship Surveyunlessotherwisestated
56 StateofthenationreportpovertyworklessnessandwelfaredependencyintheUK
bull 49ofpeoplesaythattheywouldliketobe moreinvolvedindecisionsaffectingtheirlocal areaand
bull only10ofpeoplehaveinthelastyear participatedincivicactivism150
Moreovertherearedifferencesinthe characteristicsofpeoplewhoarelikelytoget involved
bull Whitepeoplearemorelikelythanmost otherethnicgroupstosaythattheyhave participatedincivicengagement
bull peopleaged16ndash25arelesslikelythanmost agegroupstoparticipateincivicengagement and
bull peoplewithmanagerialandprofessional occupationsaremorelikelythanallother occupationalgroupstohaveparticipatedin civicengagement
Intermsofsocialnetworksmanypeople(41) reporthavingthreetofiveclosefriends151 Howeverthereseemtobesomepeoplewho havefewsocialnetworksandaperceivedlackof socialsupport
bull around29millionpeople(8)feeltheylack oneormoreofthefollowingsomeoneto listensomeonetohelpinacrisissomeone torelaxwithsomeonewhoappreciatesthem andsomeonetocountontooffercomfort Some2ofthepopulationlackallofthese formsofsupportindicatingaminoritywho experienceadeepformofsocialisolation152
bull around25millionpeople(6)report having noclosefriendsandafurther133million (32) reporthavingonlyoneortwoclosefriends153
bull theEnglishHealthSurveyof2005foundthat onequarterofthepopulationsufferedlsquosome lackrsquoofsocialsupportwith14sufferinga lsquoseverelackrsquo154and
bull onlyhalfofpeoplefeelthatpeopleintheir neighbourhoodcanbetrustedwithtrust lowestamongthoseaged16ndash24years(33) andthoseinthemostdeprivedareas(21)
Theelderlyaremostlikelytosufferfrom lonelinessHalfofallpeopleaged75andover livealonewithnearlyhalfofallolderpeople (45)consideringthetelevisionastheirmain formofcompanyandover500000olderpeople spendingChristmasdayalonein2006155
Housing and quality of local environment Poorqualityhousingremainsaproblemformany peopleintheUK
bull overcrowdingremainsaproblemincertain areasAcrossalltenures68ofhouseholds inLondonforexamplewerelivingin overcrowdedaccommodationin200708156
150 Eitherindirectdecision-makingaboutlocalservicesorissuesorintheactualprovisionoftheseservicesbytakingon arolesuchasalocalcouncillorschoolgovernorormagistrate 151 CitizenshipSurvey2007-08ThequestionisaskedlsquoSomepeoplehaveclosefriendsThesearepeopletheyfeelat easewithcantalktoaboutprivatemattersorcallofforhelpWouldyousayyouhavenofriendsoneortwothreeto fivesixtotenormorethanthatrsquo 152 BasedonindicatorsintheBritishHouseholdPanelSurvey2008 153 CitizenshipSurvey2007-08basedonmid-yearpopulationestimates 154 ReportedinYoungFoundation(2009)SinkingandSwimmingunderstandingBritainrsquosunmetneeds 155 ibid 156 CommunitiesandLocalGovernment(2009)SurveyofEnglishHousing200708
StateofthenationreportpovertyworklessnessandwelfaredependencyintheUK 57
bull some74millionhomes(33)werenon-decentin2008(including48millionhomes withpotentiallyserioushazardsunderthe HousingHealthandSafetyRatingSystem) Overallsocialsectorhomeswereinabetter conditionthanprivatesectorhomes157
bull in200831millionlsquovulnerablehouseholdsrsquo werelivingintheprivatesectorofwhich 12million(39)werelivinginnon-decent homes158
bull 53000householdsaredependentontheir localauthorityforhousinghavingbeen acceptedashomelessandplacedintemporary accommodation159
bull itisdifficulttoestimaterough-sleepinglevels withaccuracybutaround3500people wererecordedashavingcontactwithrough-sleepingcharitiesinLondonin200809160and some400to800peoplecouldbesleeping roughinLondononanyonenight161and
bull around540000peopleinEnglandlive awayfromtheirhomesininstitutions predominantlyeitherinnursingandresidential carehomesinprisonorinlocalauthority careLivinginaninstitutiondoesnot necessarilyimplydisadvantage(particularly whereelderlypeoplerequireresidentialcare) butinmanyinstancesbeingremovedfrom thefamilyhomedoesconstituteaformof deprivationandthequalityofaccommodation inmanyinstitutionscanbepoor162
Intermsofqualityoflocalenvironmentin England
bull 7ofhouseholdsreportnoisetobea seriousproblemand9ofhouseholdsreport vandalismandhooliganismtobeaserious problem163and
bull 10ofhouseholdsreportcrimetobea seriousproblemintheirareaand4report neighbourstobeaseriousproblem164
Crimeisnotevenlydistributedacrossthe countryTheBritishCrimeSurvey165records ahigherriskofcrimeinthemostdeprivedand urbanareas
bull Londonhasthehighestratesofpolice recordedcrimeandtheEastofEnglandthe lowestand
bull 59ofrobberiesinEnglandandWaleswere recordedbyjustthreepoliceforcesthe MetropolitanGreaterManchesterandthe WestMidlands
Someofourpoorestcommunitiesaretypified byacombinationofpoorsocialandeconomic outcomesandpoorqualitylivingenvironment thatinteractandreinforceeachothereffectively trappingpeoplewhoareunabletomoveoutand seekopportunitieselsewhereTheresultcanbe concentrationsofdeprivationwhichcanpersist forgenerations
157 CommunitiesandLocalGovernment(2010)EnglishHousingSurveyHeadlineReport200809 158 CommunitiesandLocalGovernment(2010)EnglishHousingSurveyHeadlineReport200809 159 CommunitiesandLocalGovernmentStatutoryHomelessnessOct-Dec2009England 160 Broadway(2009)StreettoHomeAnnualReportforLondon 161 BroadwayquarterlyreporttotheLondonMayorrsquosRoughSleepingDeliveryBoardMay2010CHAINdatabase400 to800rangereferstonumberofpeopleseensleepingroughin200910thathavebeenseensleepingroughonmultiple occasionsfortwoormoreconsecutiveyearsTheseindividualsmaynotbeincludedinaone-offstreetcountformany reasonsegtemporarilyoutofareaorinprisonandthereforeCLGannualtotalstreetcountfigureislikelytoproducea lowerestimateofroughsleepinglevels 162 Forexample23ofcarehomesforolderpeoplewereratedasadequateorpoorbytheCareQualityCommission intheyeartoMarch2009CareQualityCommission(2009)Thequalityandcapacityofadultsocialcareservices 163 CommunitiesandLocalGovernment(2009)SurveyofEnglishHousing200708 164 CommunitiesandLocalGovernment(2009)SurveyofEnglishHousing200607 165 HomeOffice(2009)CrimeinEnglandandWales200809Volume1FindingsfromtheBritishCrimeSurveyand policerecordedcrime
58 State of the nation report poverty worklessness and welfare dependency in the UK
Concentrations of disadvantage in communitiesDeprived areas are identified using the Index of Multiple Deprivation which is a summary measure of area disadvantage based on indicators of employment income crime health education housing and environment This shows that disadvantage is consistently concentrated in a number of neighbourhoods many clustered in urban areas (Figure 56) In particular
bull 50 of all children living in families reliant entirely on benefits and 42 of people out of work for mental health reasons live in the 20 most deprived neighbourhoods
bull 27 of lone parents out of work are found in the 10 most deprived neighbourhoods and
bull there is a correlation between individuals with multiple disadvantages and deprived areas Around two out of five people who experience five or more disadvantages are concentrated in the 10 most deprived neighbourhoods166 The greater the number of disadvantages the more likely individuals are to be concentrated in the most deprived areas
Figure 56 English Index of Multiple Deprivation 2007
166 Based on selected disadvantage indicators using the Annual Population Survey and Index of Multiple Deprivation 2007 (LSOA level)
StateofthenationreportpovertyworklessnessandwelfaredependencyintheUK 59
Chapter 6 Multiple disadvantage
In 2010 multiple disadvantage remains a significant problem in the UK with 53 million people suffering and 37 million doing so persistently
Thischapterexploresthenatureandextentof multipledisadvantageintheUK167Itisoften theinteractionoftheproblemsexploredin previouschaptersthatcanleadtoentrenched deep-seateddisadvantagethatcancutpeopleoff fromopportunitiestoparticipateinthenormal activitiesofsocietyandleadtoalifetimeof dependencyandwastedpotentialForexample theexperienceofaseriousmentalhealth problemcanpreventsomeonefromgettinga jobwhileanex-offenderwithnoqualifications mightalsohaveproblemswithdrugsandalcohol Multipledisadvantagealsocoststhestateit isestimatedthatafamilywithfiveormore disadvantagescostspublicservicesbetween pound55000andpound115000peryearasaresultofits useofmultipleservices168
Thischapter
bull summarisesevidenceontheprevalenceof multipledisadvantageandtrendsovertime
bull examinesthepersistenceofmultiple disadvantageand
bull identifiesgroupsmostatriskofmultiple disadvantageincludingintergenerational disadvantage
Itillustratesthattherehasbeenlittleprogress inreducingthenumbersofpeoplewhosuffer themostmultipledisadvantageOver60of theindicatorsinoneofthemainannualreports ofpovertyanddisadvantageshoweitherno progressoratrendinthewrongdirectionin thepastfiveyears169whileover5millionpeople (11)sufferfrommultipledisadvantagesand37 milliondosopersistently170
167 Multipledisadvantagereferstoindividualsorfamilieswhoexperiencetwoormoredisadvantagessuchaslow incomepoorhealthandnoqualifications 168 HMTreasury(2007)AimingHighforChildrenSupportingFamilies 169 MacInnesKenwayampParekh(2009)Monitoringpovertyandsocialexclusion2009JosephRowntreeFoundationand NewPolicyInstitute 170 AnalysisbyStrategyUnitandSocialExclusionTaskForce
60 StateofthenationreportpovertyworklessnessandwelfaredependencyintheUK
Prevalence of multiple disadvantage and trends over time Althoughinsomeareastherehasbeena reductionindisadvantageoverthepast10ndash15 yearsinrecenttimesprogresshasslowedor stoppedandinotherareastrendshavemoved inthewrongdirectionTheOpportunity for All reportsuggeststhataround40ofindicators havenotmovedinapositivedirectioninrecent years171TheMonitoring Poverty and Social Exclusion 2009reportsuggestsevenlower levelsofprogresswithover60ofindicators
notmovinginapositivedirectioninthepast fiveyears(Figure61)172including(assetoutin earlierchapters)
bull peopleonverylowincomes
bull incomeinequality
bull childreninlow-incomeworkingfamilies
bull youngadultunemploymentand
bull 16ndash19-year-oldsnotineducation employmentortraining
Figure 61 Over 60 of indicators of disadvantage have shown either no progress or a deterioration in the past five years
No Change
30
Improved
33
Worsened
37
Source Derived from Monitoring poverty and social exclusion 2009 Joseph Rowntree Foundation and New Policy Institute
171 DepartmentforWorkandPensions(2007)OpportunityforAllIndicatorsupdate2007 172 MacInnesKenwayampParekh(2009)Monitoringpovertyandsocialexclusion2009JosephRowntreeFoundationand NewPolicyInstitute
StateofthenationreportpovertyworklessnessandwelfaredependencyintheUK 61
Newanalysisfromhouseholdsurveydata confirmstheprevalenceofmultipledisadvantage intheUK173
bull Onawidedefinitionofdisadvantage 53millionpeople(11ofalladults)are disadvantagedatanyonetimeinthree ormoreofsixareas(educationhealth employmentincomesocialsupporthousing andlocalenvironment)174
bull Onatighterdefinition12millionpeople (25ofalladults)aredisadvantagedatany onetimeinthreeofthesesixareas175
Persistence of multiple disadvantage Itisclearthatasizeableproportionofthose sufferingmultipledisadvantagedosoovertime Recentestimatesshowthat176
bull onawidedefinition37millionpeople(77 ofthepopulation)aredisadvantagedinthree ormoreofsixareas(educationhealth employmentincomesocialsupporthousing andlocalenvironment)forfiveormoreyears outof10
bull onatighterdefinitionflowsinandoutof severedeprivationarelimited800000(17) aredisadvantagedinthreeofthesesixareas forfiveormoreyearsoutof10onatighter definitionand
bull only14ofthemostmultiplydisadvantaged familiesarelikelytobedescribedaslsquonot disadvantagedrsquoayearlater177
Those at risk of multiple disadvantage Thosemostatriskofmultipledisadvantagein keylifestagesare
bull familieswithchildrenwithsomeorallof thefollowingcharacteristicsloneparents thoselivinginsocialhousingorrented accommodationthoselivinginlargefamilies (iethosewiththreeormorechildren)those whohaveayoungmotherthosewhohave ablackmotherandthosewholiveinurban andthemostdeprivedareasFamilieswith thesecharacteristicsaswellasthoseinwhich oneorbothpartnershasaphysicaldisability limitingillnessormentalhealthproblem arealsomostatriskofpersistentmultiple disadvantage178
bull youngpeopleaged16ndash24withsomeorallof thefollowingcharacteristicsfemalesthose livingindependentlywiththeirownchildren thoselivingwithaloneparentsocialand privaterentersandthoselivinginmore deprivedareas179
bull working-agepeoplewithoutdependent childrenwithsomeorallofthefollowing characteristicswomenolderworking-age peoplethosefrommanualoccupational groupshome-makersearlyretireessick anddisabledpeoplethosewhonever marriedandthoselivinginsingle-person households180and
173 AnalysisbyStrategyUnitandSocialExclusionTaskForceusingBHPS2007data 174 Thewidedefinitionofmultipledisadvantageusesthefollowingindicatorseitherliveinaworklesshouseholdorare unemployedareeitherinincomepovertyormaterialdisadvantageorfinancialstresslacksocialsupporteitherhave poorphysicalormentalhealtheitherliveinpoorhousingorapoorlivingenvironmenthavelowqualifications 175 Thetighterdefinitionofmultipledisadvantageusesthefollowingindicatorsliveinaworklesshouseholdarein incomepovertyandexperiencematerialdisadvantagelacksocialsupportaredisabledliveinpoorhousingandapoor livingenvironmenthavenoqualifications 176 AnalysisbyStrategyUnitandSocialExclusionTaskForceusingBHPS2007data 177 OroyemiDamioliBarnesampCrosier(2009)Understandingtherisksofsocialexclusionacrossthelifecourse FamilieswithChildrenSocialExclusionTaskForceCabinetOfficeAnalysisbyStrategyUnitandSocialExclusionTaskForce 178 Ibid 179 CusworthBradshawColesKeungampChzhen(2009)Understandingtherisksofsocialexclusionacrossthelife courseYouthandyoungadulthoodUniversityofYork 180 FahmyLevitasGordonampPatsios(2009)UnderstandingtherisksofsocialexclusionacrossthelifecourseWorking ageadultswithoutdependentchildrenUniversityofBristol
62 StateofthenationreportpovertyworklessnessandwelfaredependencyintheUK
Figure 62 Children from multiply disadvantaged families are much more likely to be multiply disadvantaged themselves than those from families with no disadvantages
30
25
20
15
10
5
0
None 1 2 3 to 5 6 or more
Number of parent disadvantages
o
f ch
ildre
n w
ith th
ree
or m
ore
disa
dvan
tage
s
Source Understanding the risks of social exclusion across the life course Families with Children Social Exclusion Task Force Cabinet Office 2009
bull olderpeopleaged60andoverwithsomeor allofthefollowingcharacteristicsthoseaged 80yearsandoverthosewholivealoneand thosewhohavepooraccesstoservices181
Therearealsoanumberofgroupswho aregenerallynotrepresentedinhousehold surveysbutwhoaresignificantlymorelikely toexperiencemultipledisadvantagesThese groupscanbeparticularlyvulnerableandinclude thefollowingsomeofwhommayleadchaotic lifestyles
bull thosewithseriousandenduringmentalhealth problems
bull thosewithlearningdisabilities
bull thosewithphysicaldisabilitiesorlimiting illnesses
bull thehomeless
bull thosewithdrugandalcoholproblems
bull offendersandex-offendersand
bull childrenincareandcareleavers
181 BeckerampBoreham(2009)UnderstandingtherisksofsocialexclusionacrossthelifecourseOlderageNational CentreforSocialResearch
StateofthenationreportpovertyworklessnessandwelfaredependencyintheUK 63
Intergenerational disadvantage Thoseatheightenedriskofmultipledisadvantage alsoincludechildrenwhogrowupinhouseholds whereoneorbothparentsexperience disadvantagethemselvesThisisoftenreferred toastheintergenerationaltransmissionof disadvantagewherebydisadvantageispassed fromonegenerationtothenextpotentially
leadingtoadamagingcycleofdisadvantage AsFigure62makesclearjustoveraquarter (27)ofchildrenfromfamiliesexperiencing sixormoreparent-relateddisadvantagesalso havethreeormoredisadvantagesthemselves comparedwithonly4fromfamilieswithno parent-relateddisadvantages182
182 OroyemiDamioliBarnesampCrosier(2009)Understandingtherisksofsocialexclusionacrossthelifecourse FamilieswithChildrenSocialExclusionTaskForceCabinetOffice
Cabinet Office 22 Whitehall London SW1A 2WH
Publication date May 2010
copy Crown copyright 2010
You may re-use this documentpublication (not including the Royal Arms and other departmental or agency logos) free of charge in any format or medium You must re-use it accurately and not in a misleading context The material must be acknowledged as Crown copyright and you must give the title of the source documentpublication Where we have identified any third party copyright material you will need to obtain permission from the copyright holders concerned
This documentpublication can also be viewed and commented on at our website wwwcabinetofficegovukpublicationsstate-of-nation-reportaspx
The material used in this publication is constituted from 50 post consumer waste and 50 virgin fibre
Ref 401172 0510
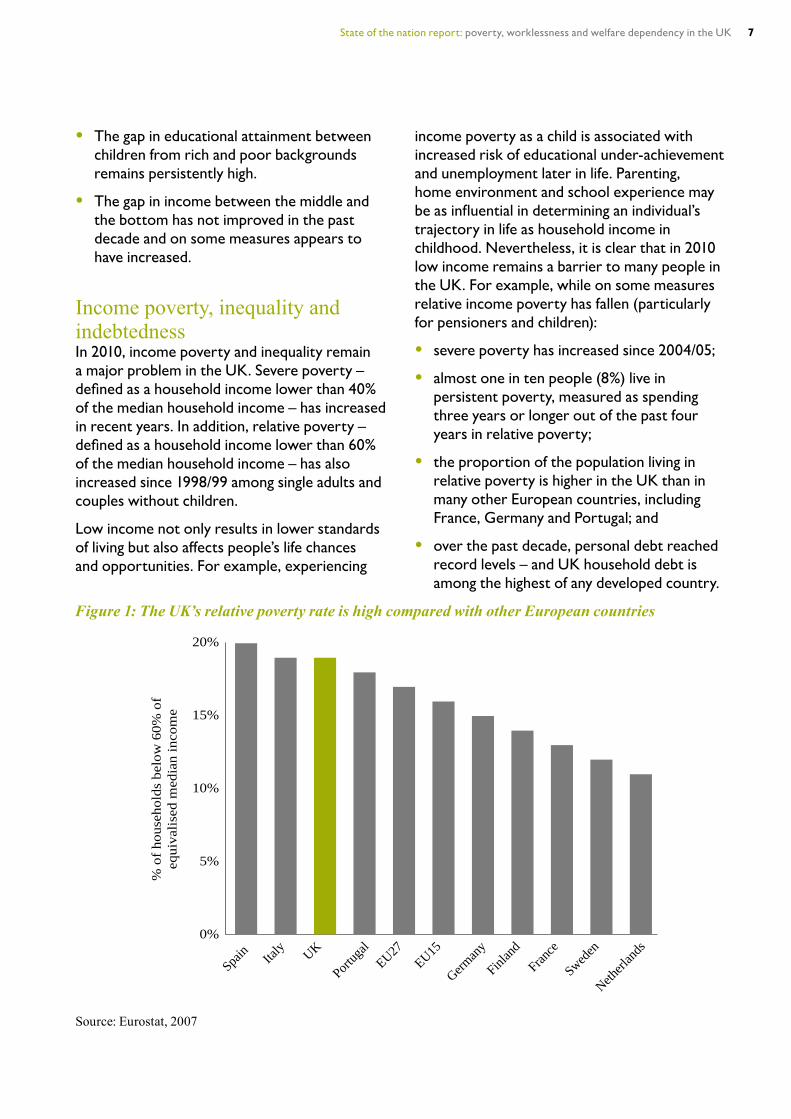
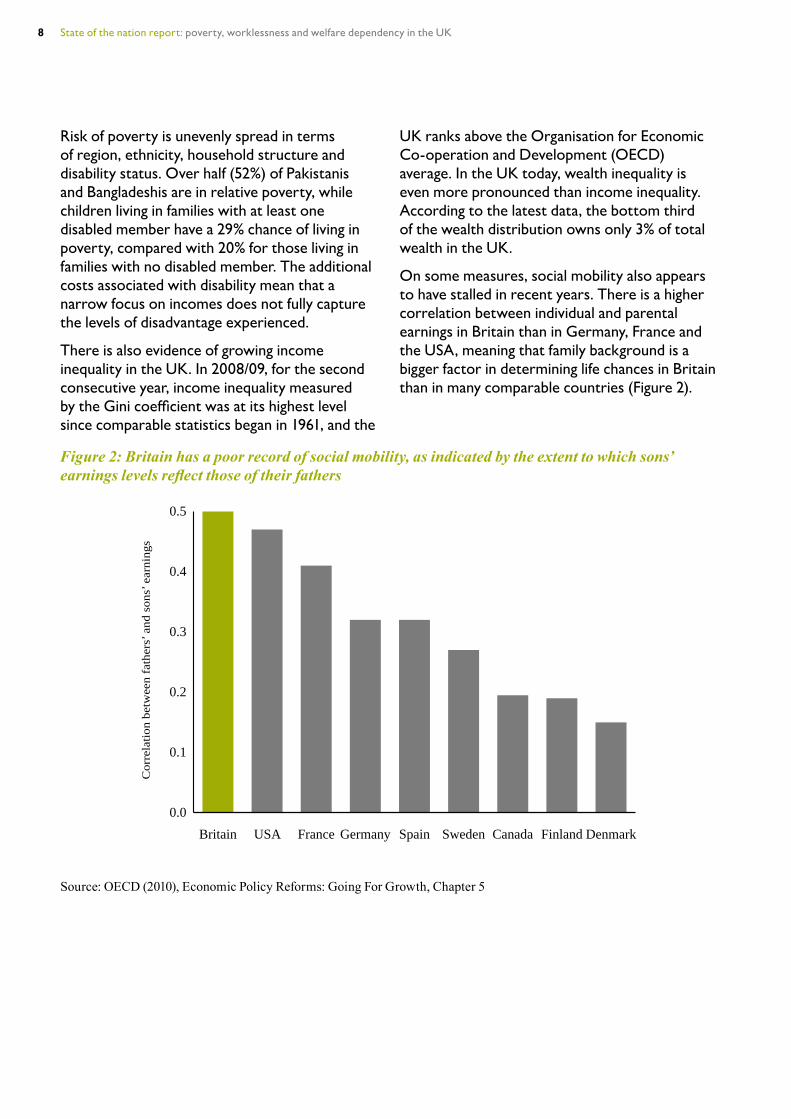
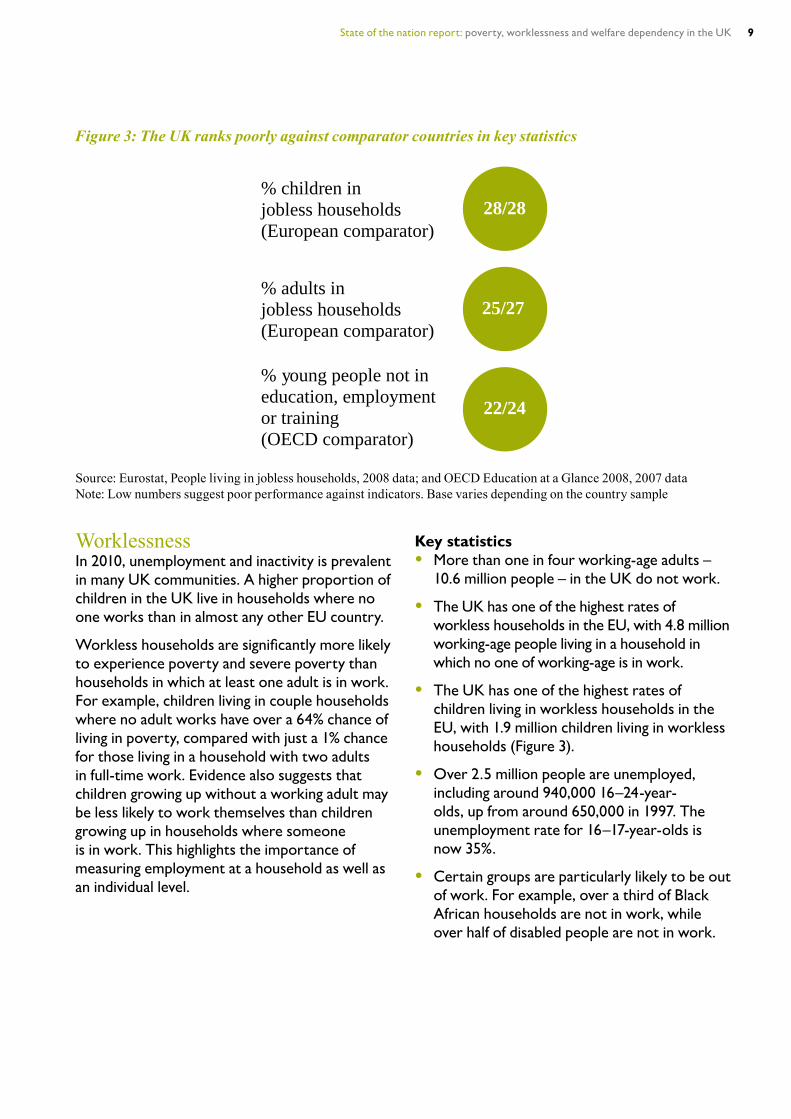
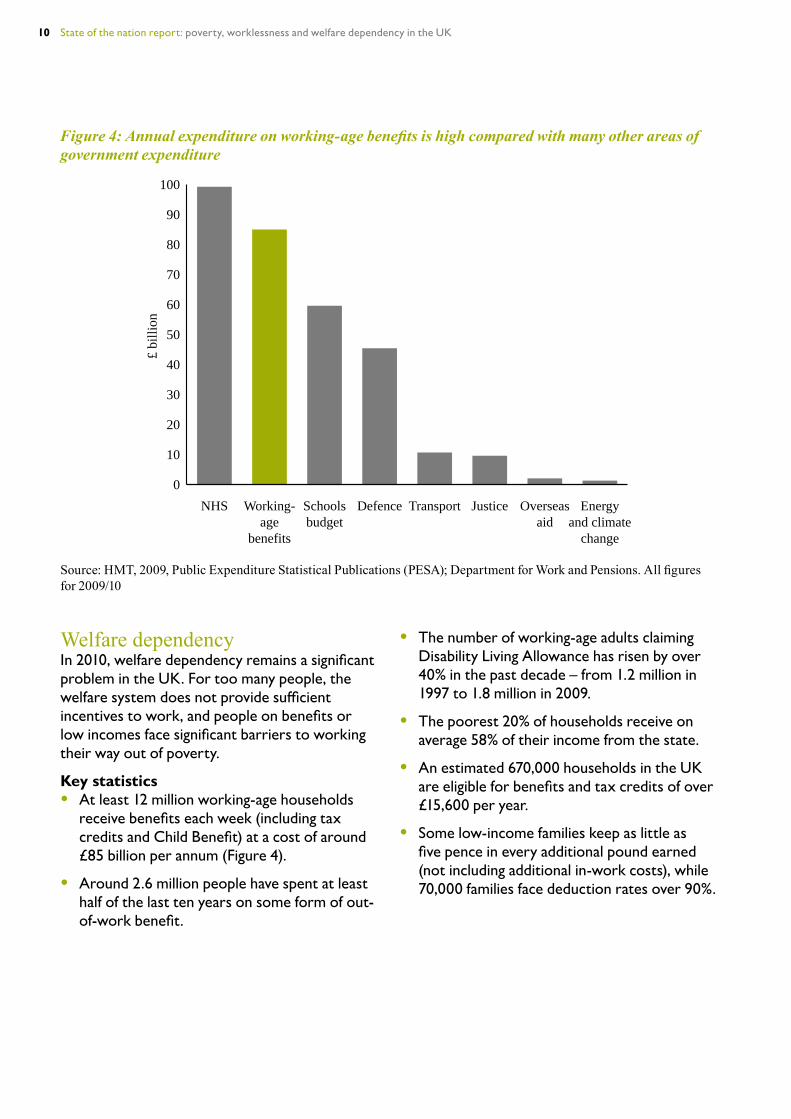
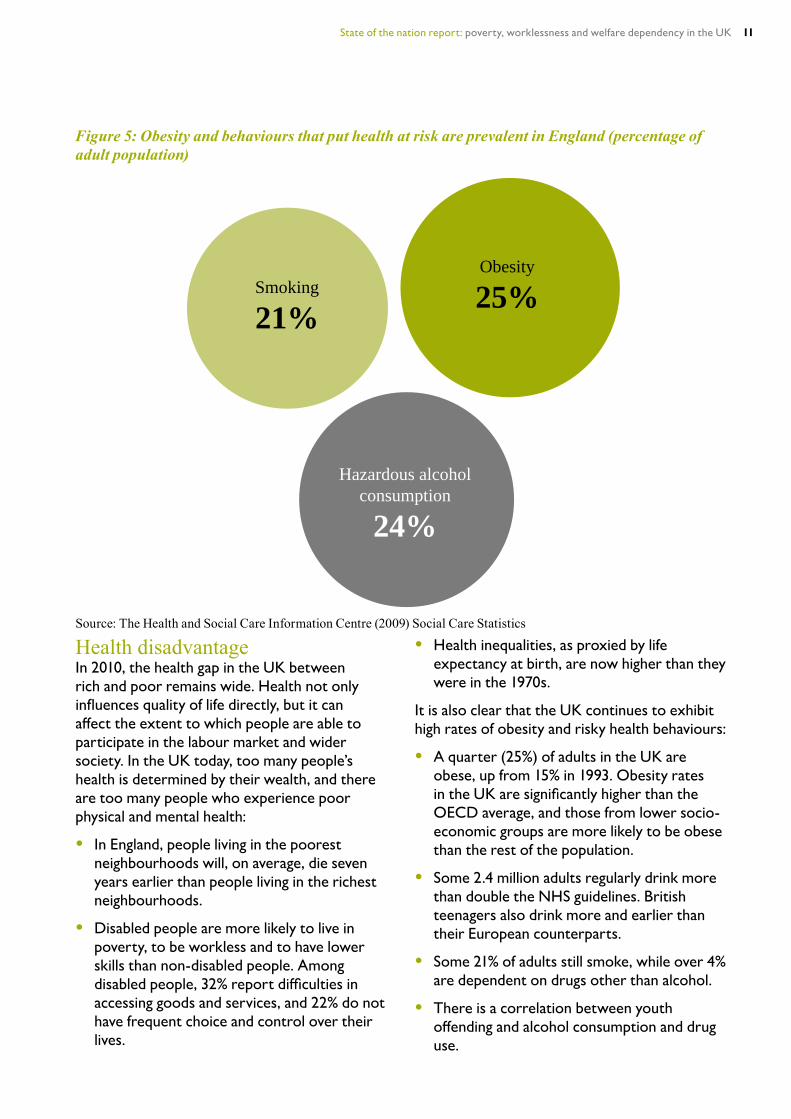
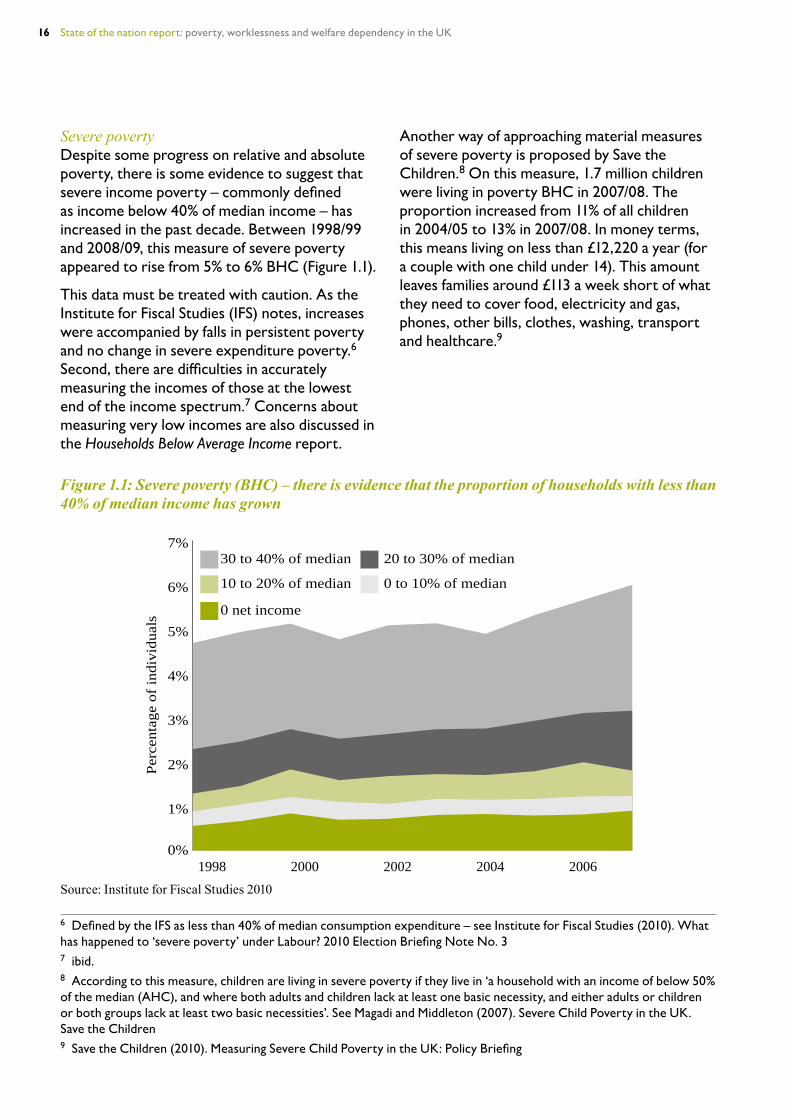
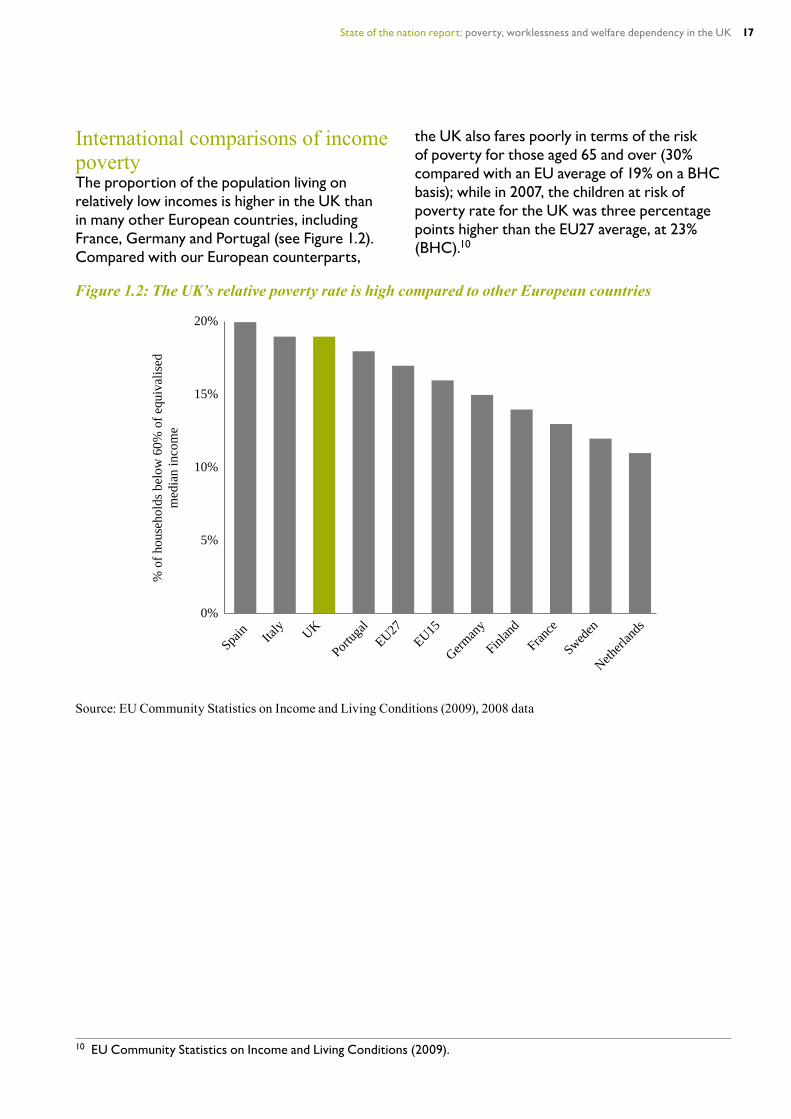
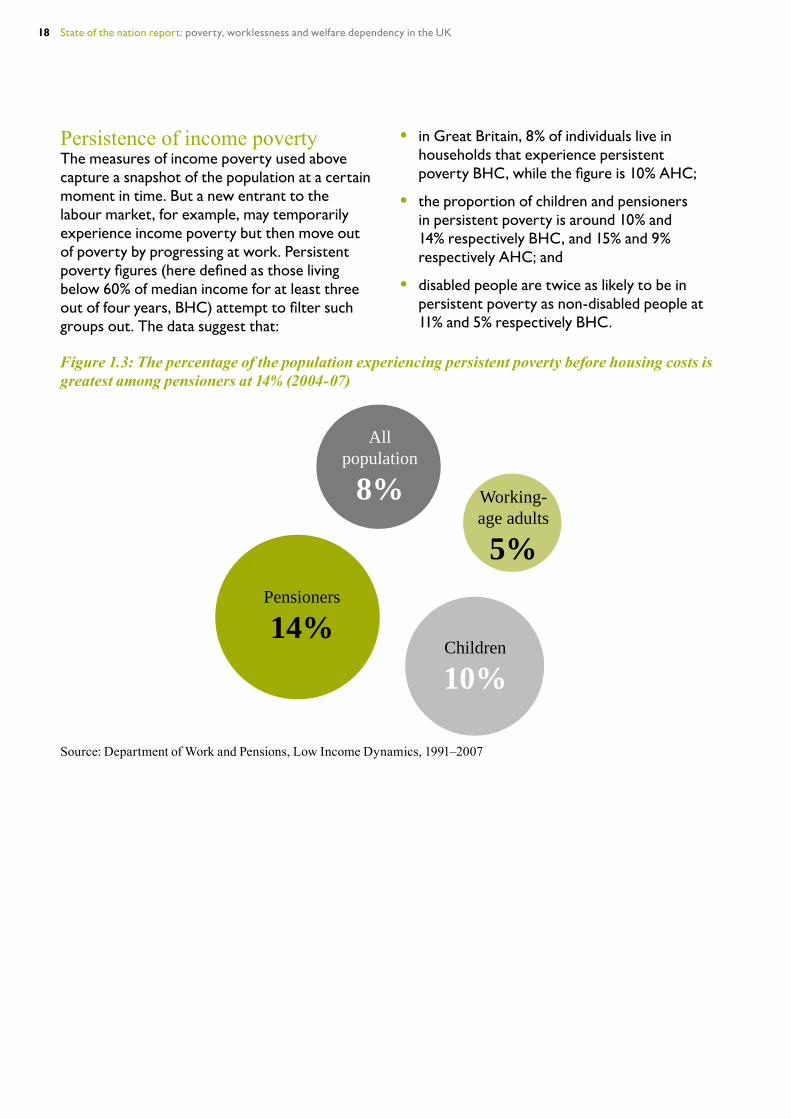
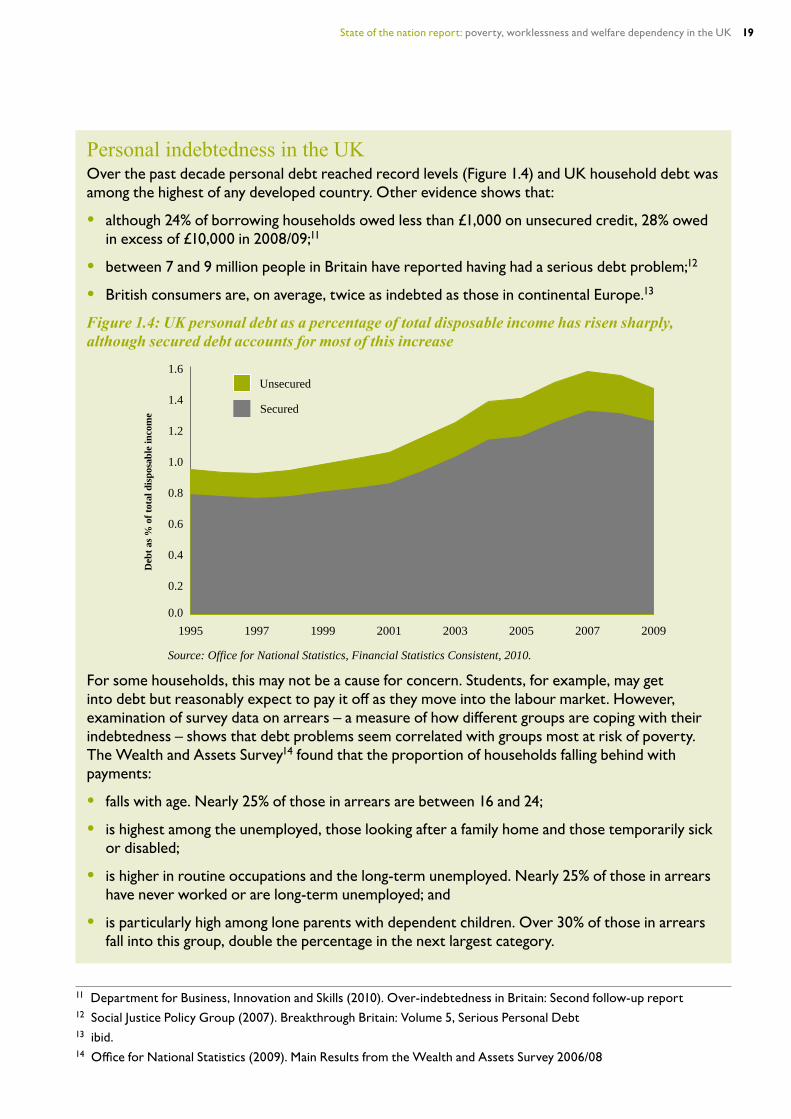
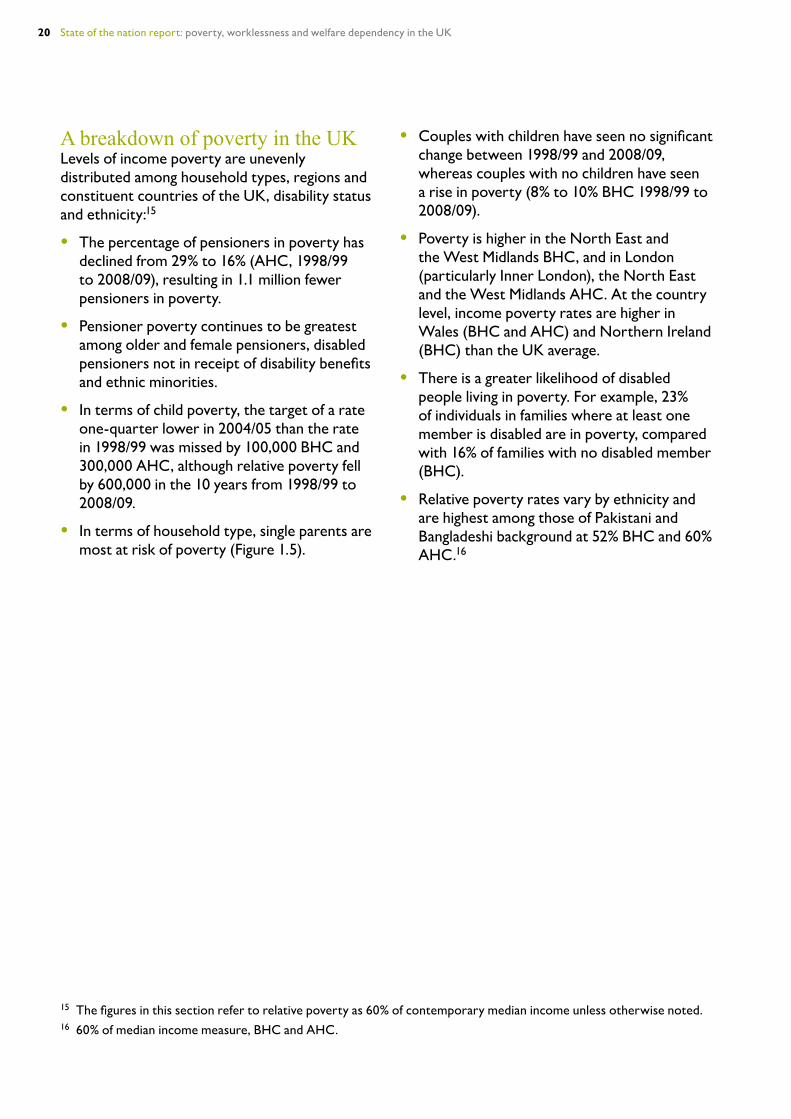
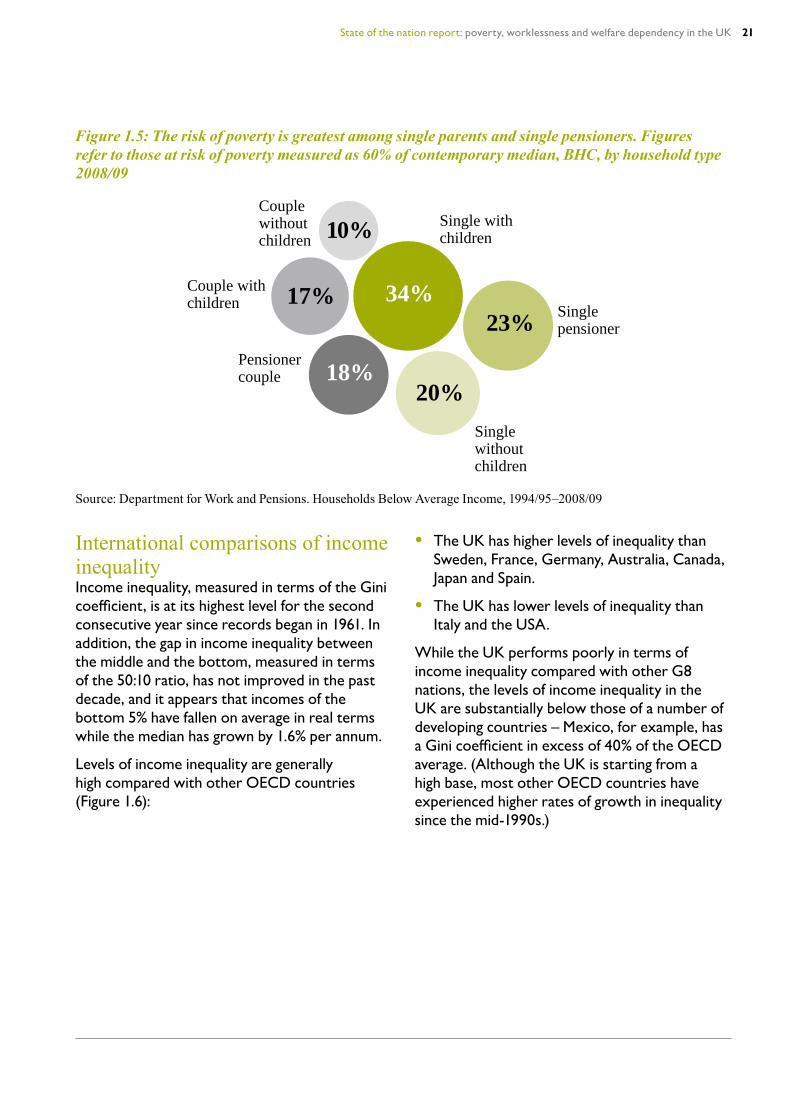
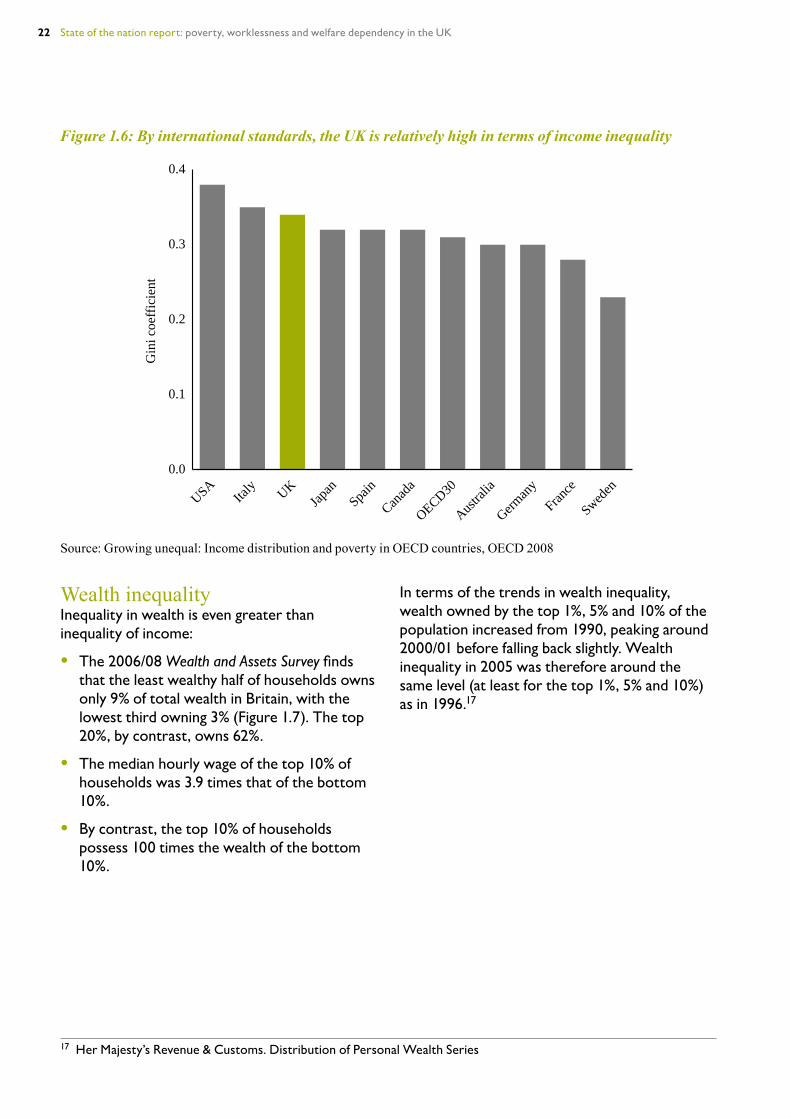
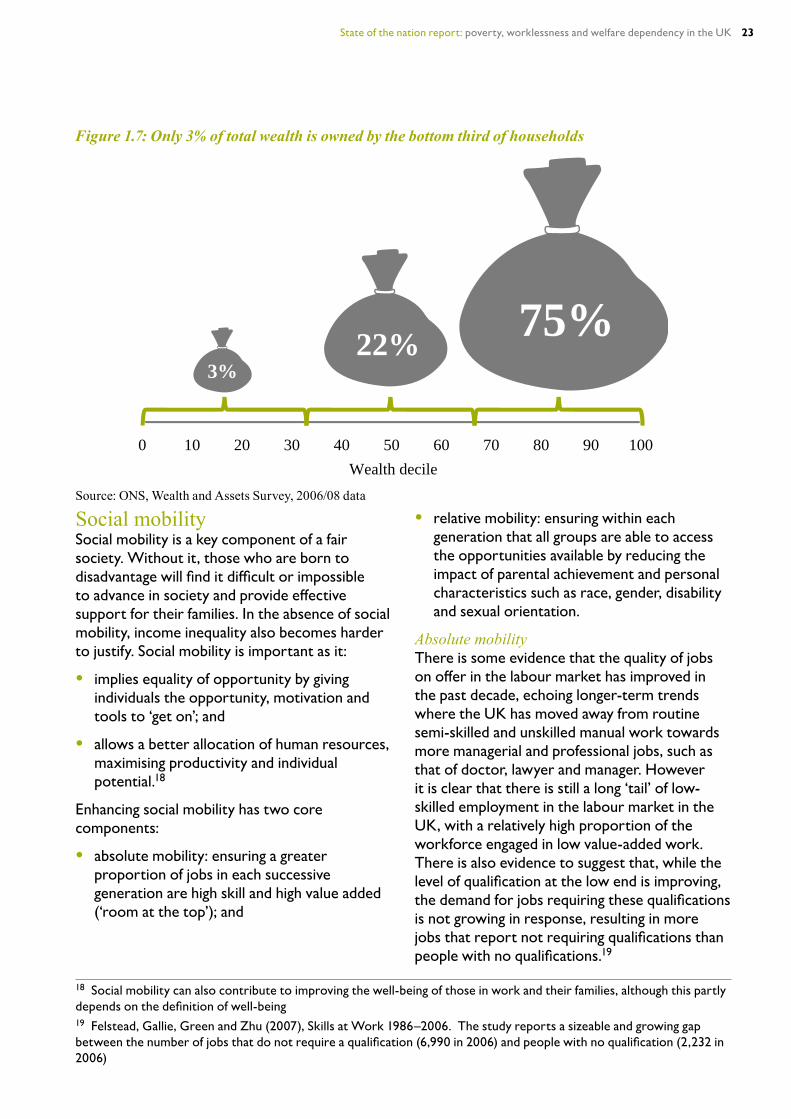
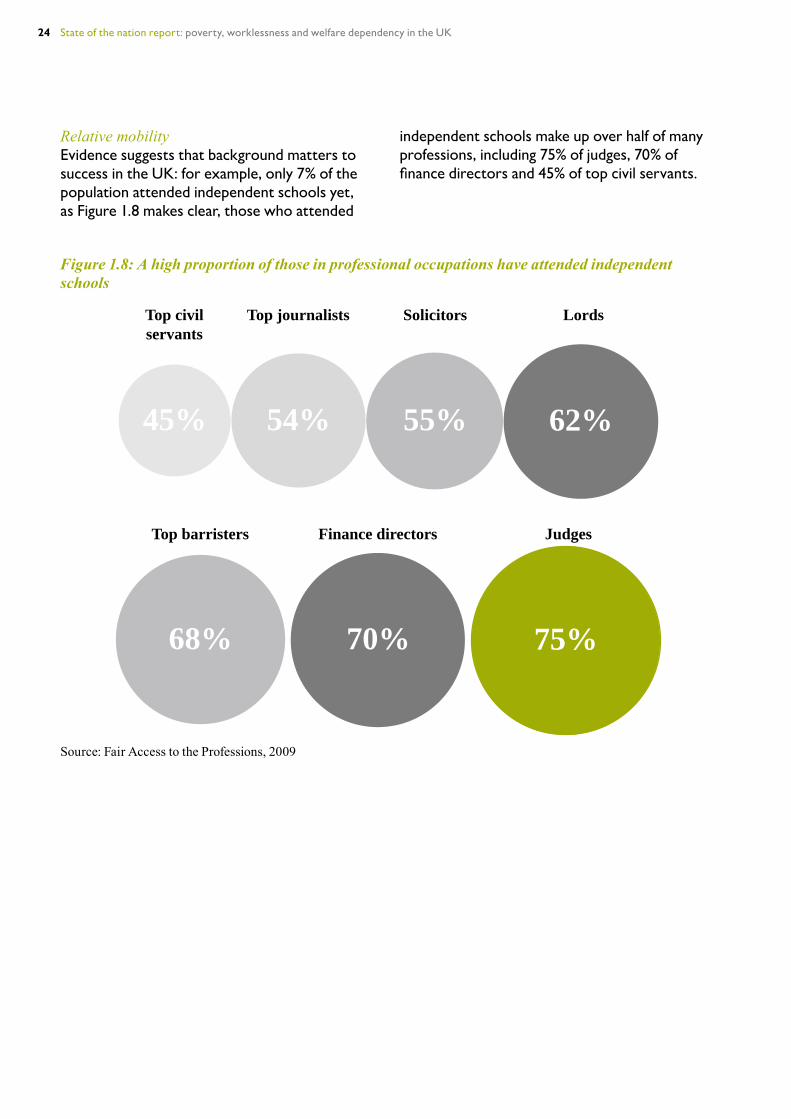
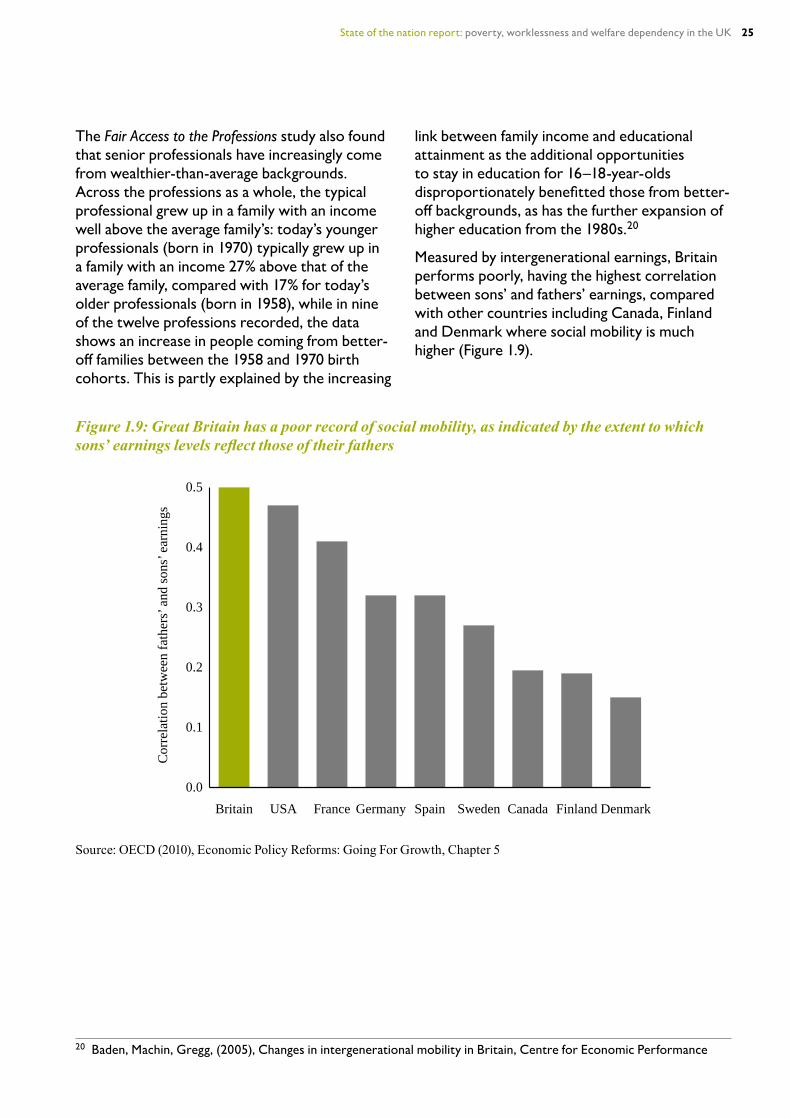
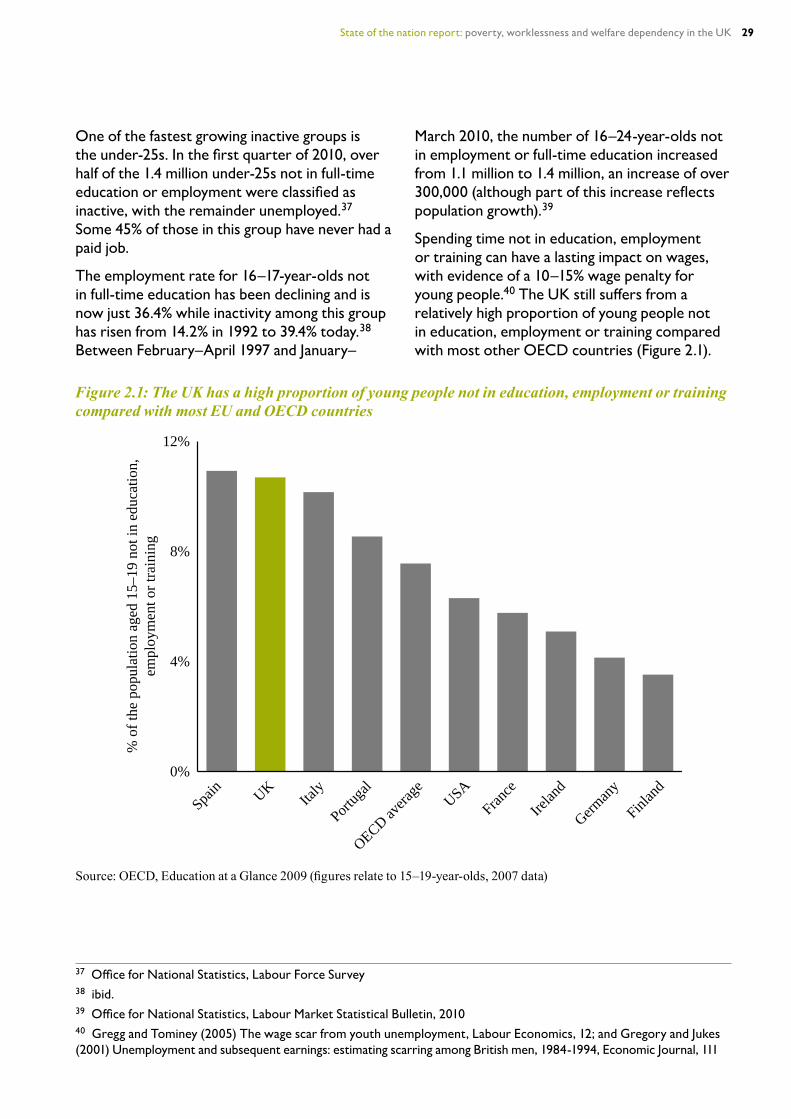
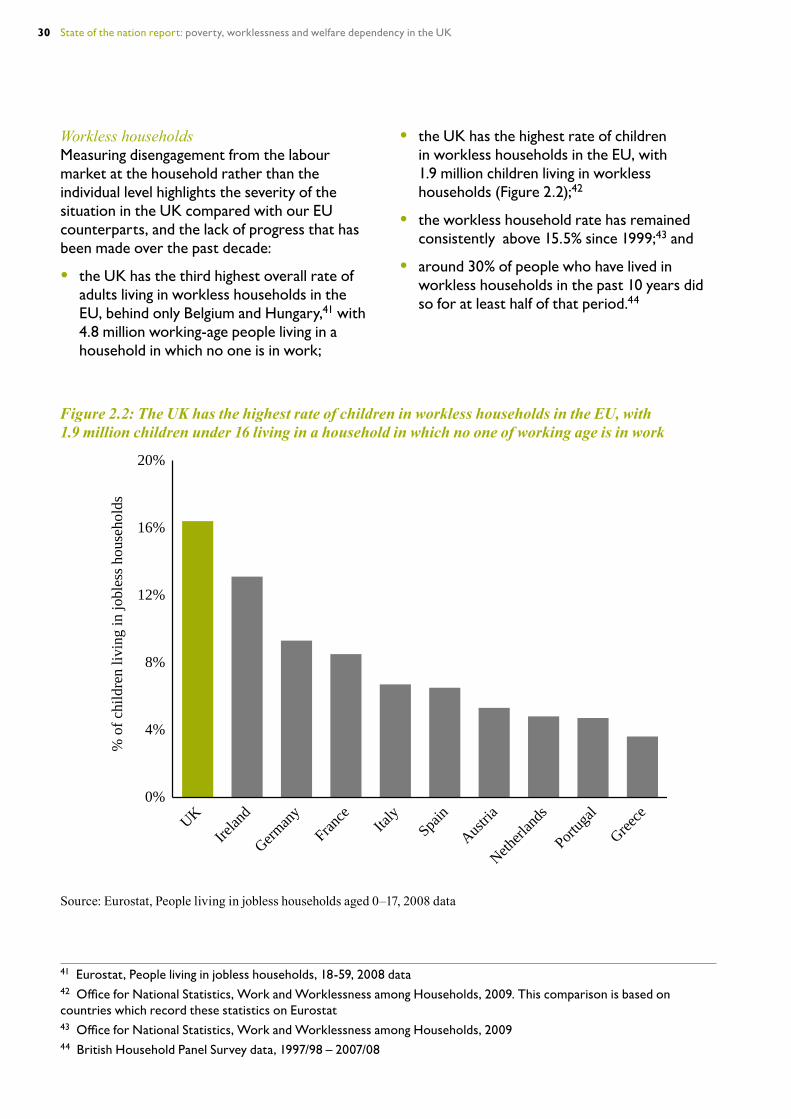
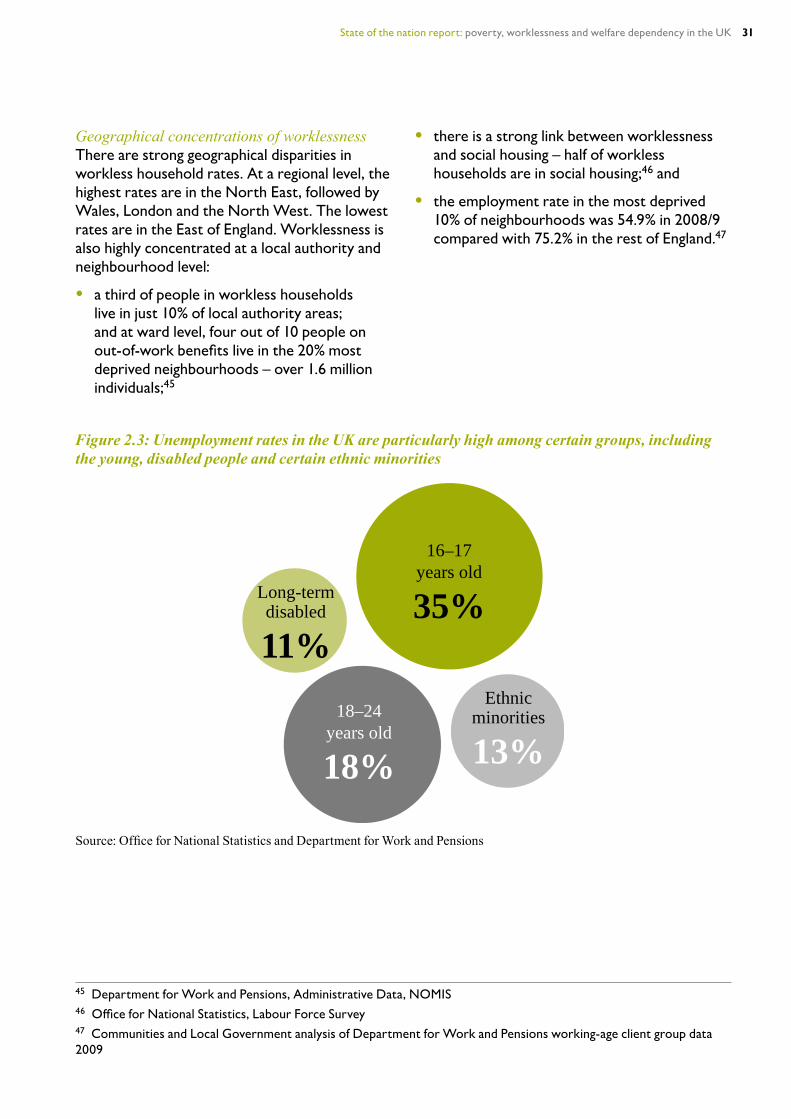
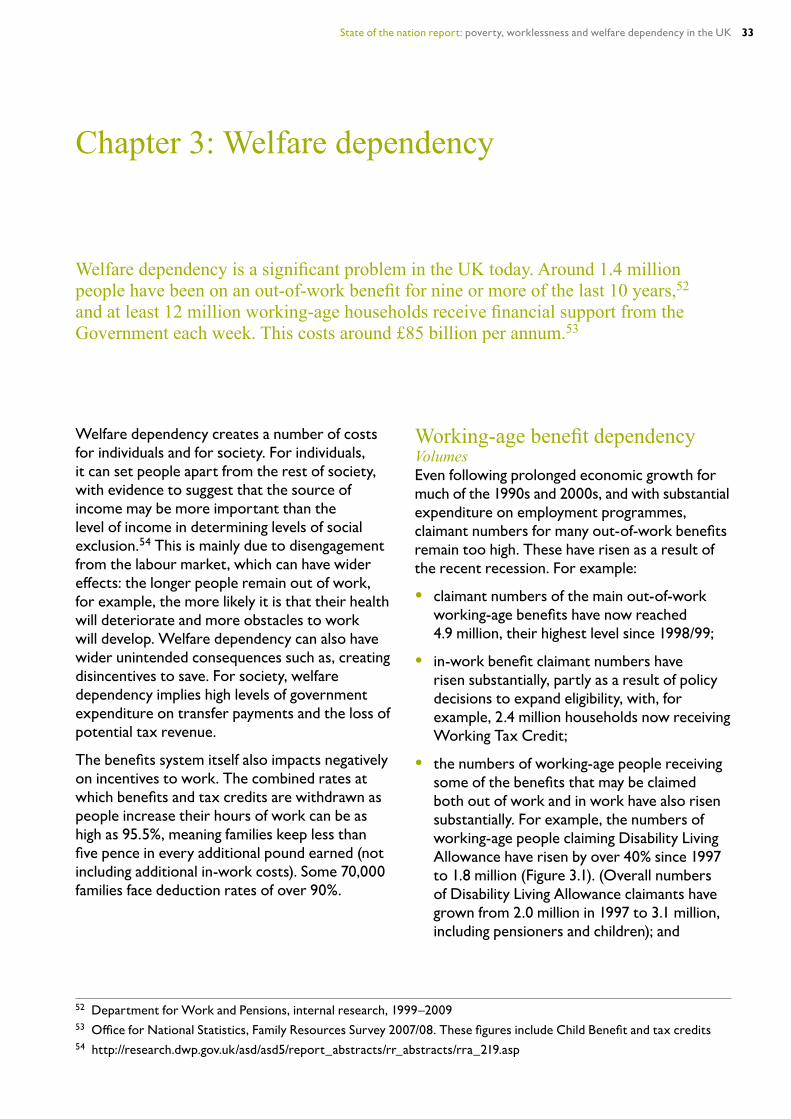
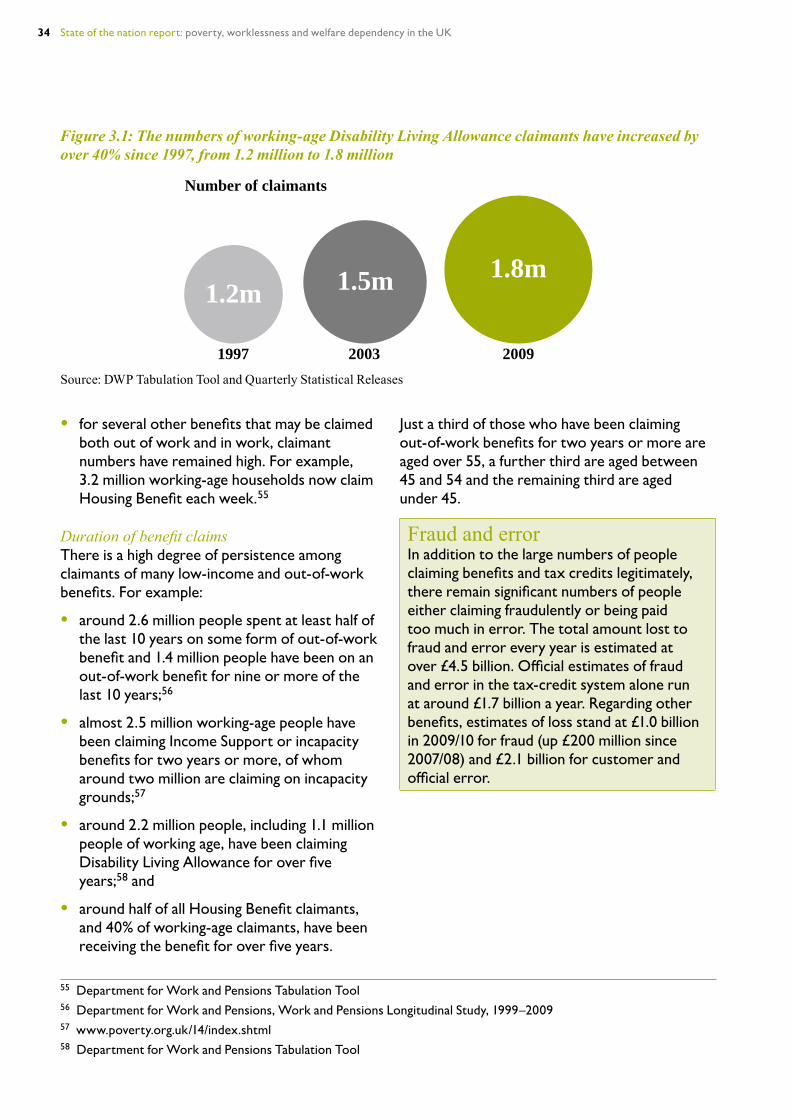
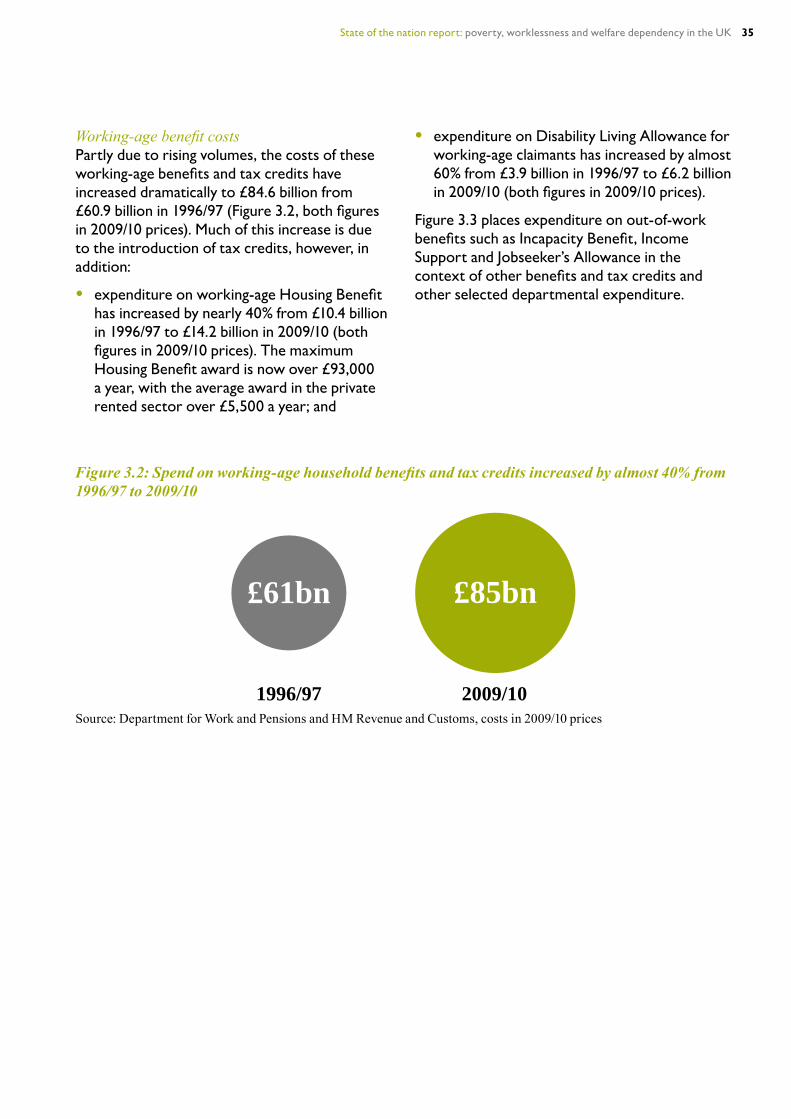
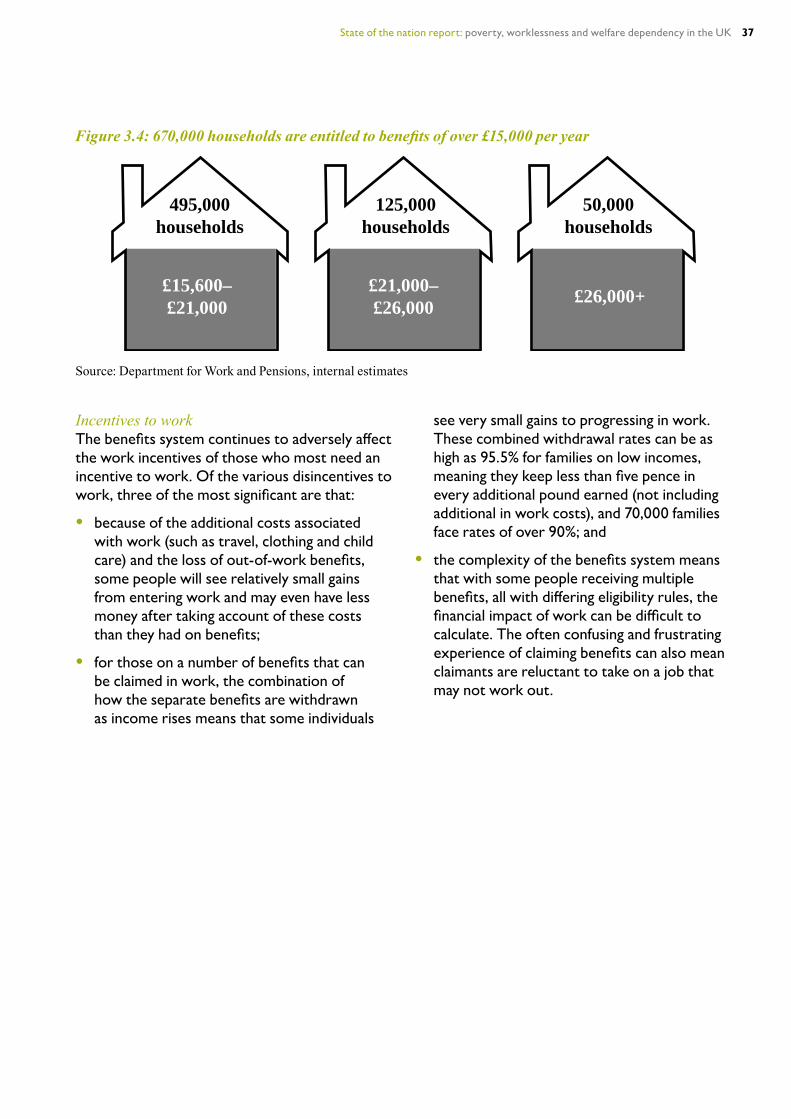
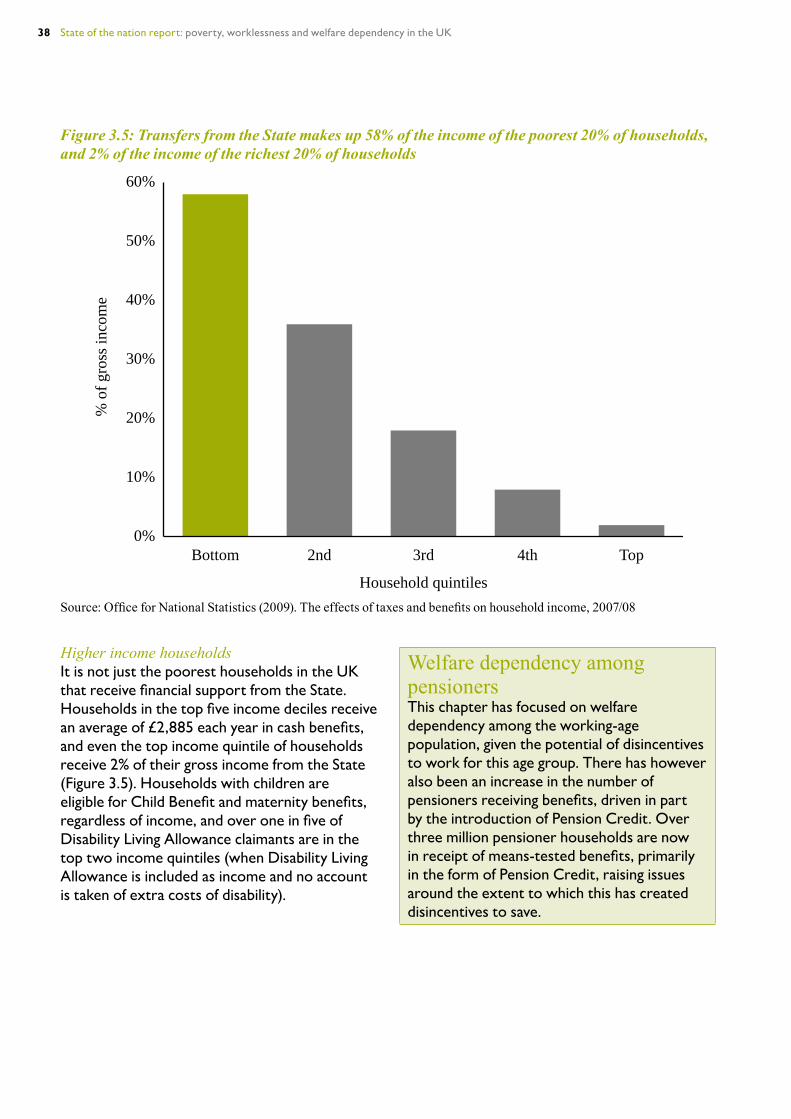
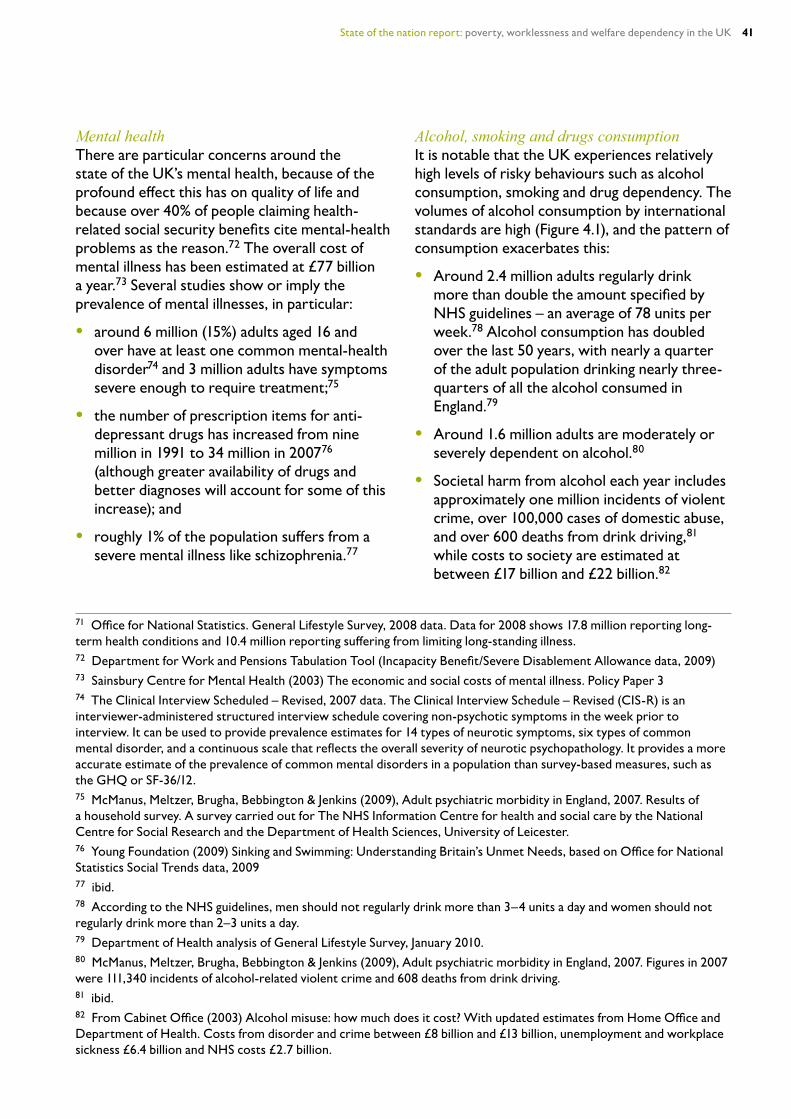
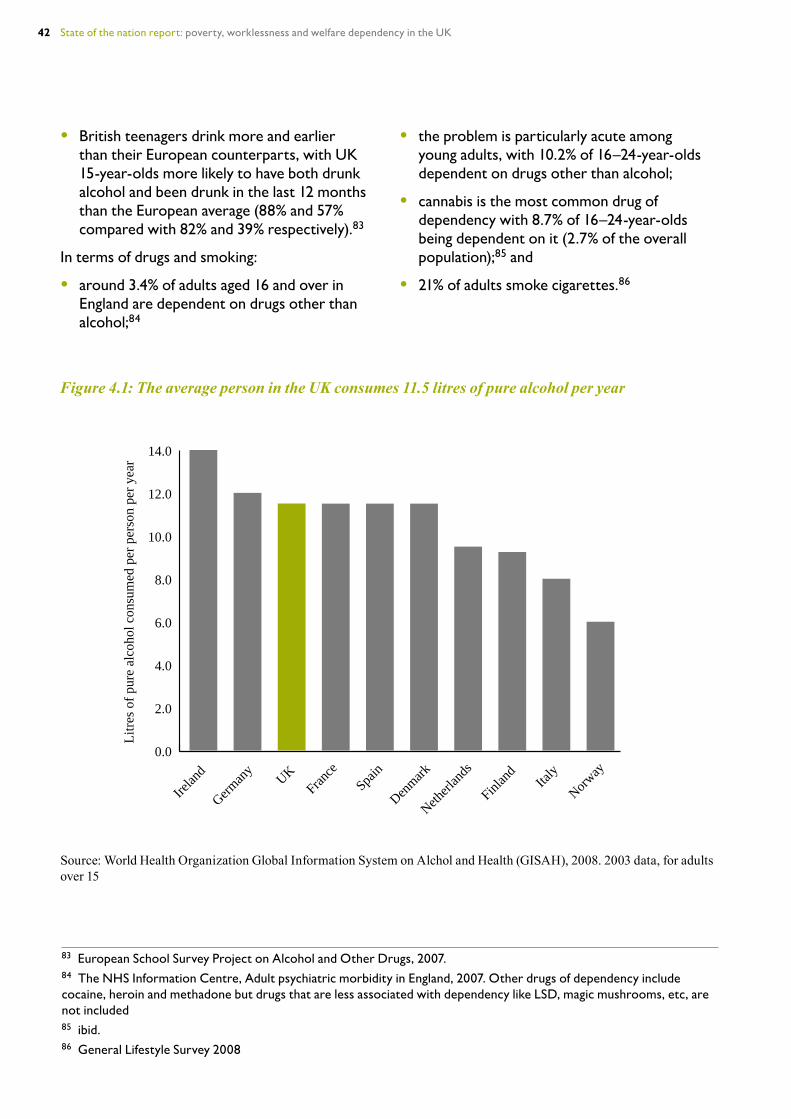
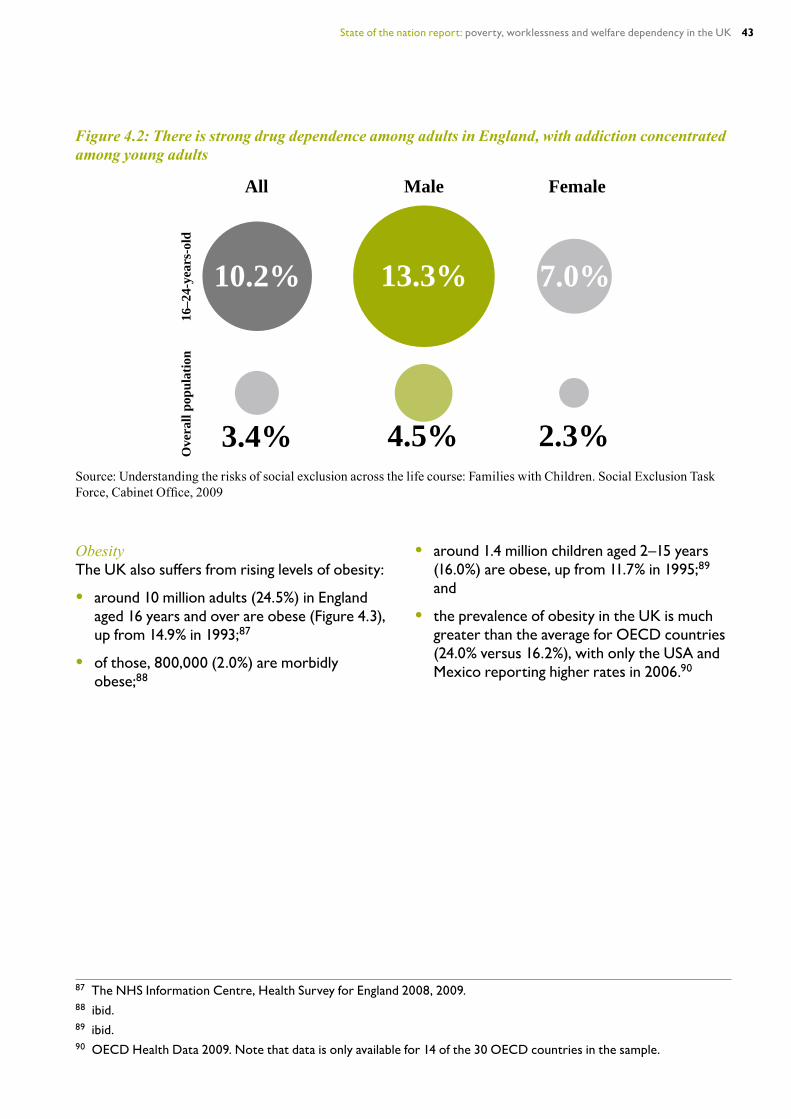
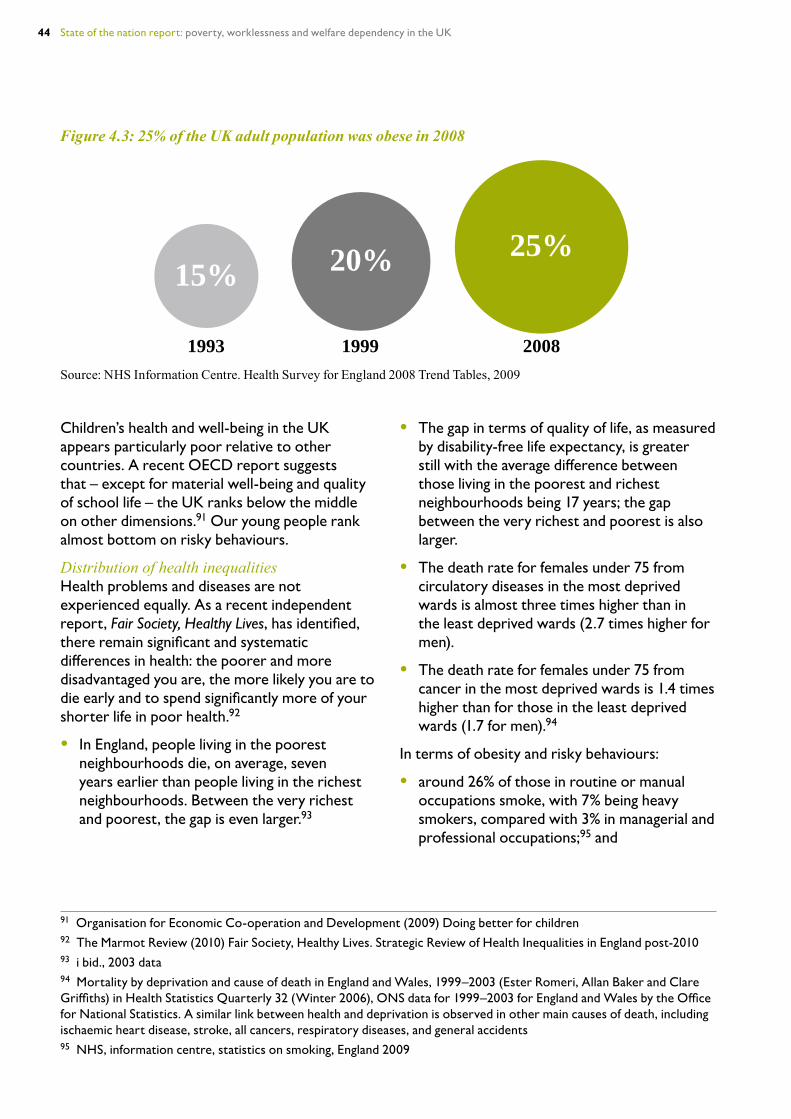
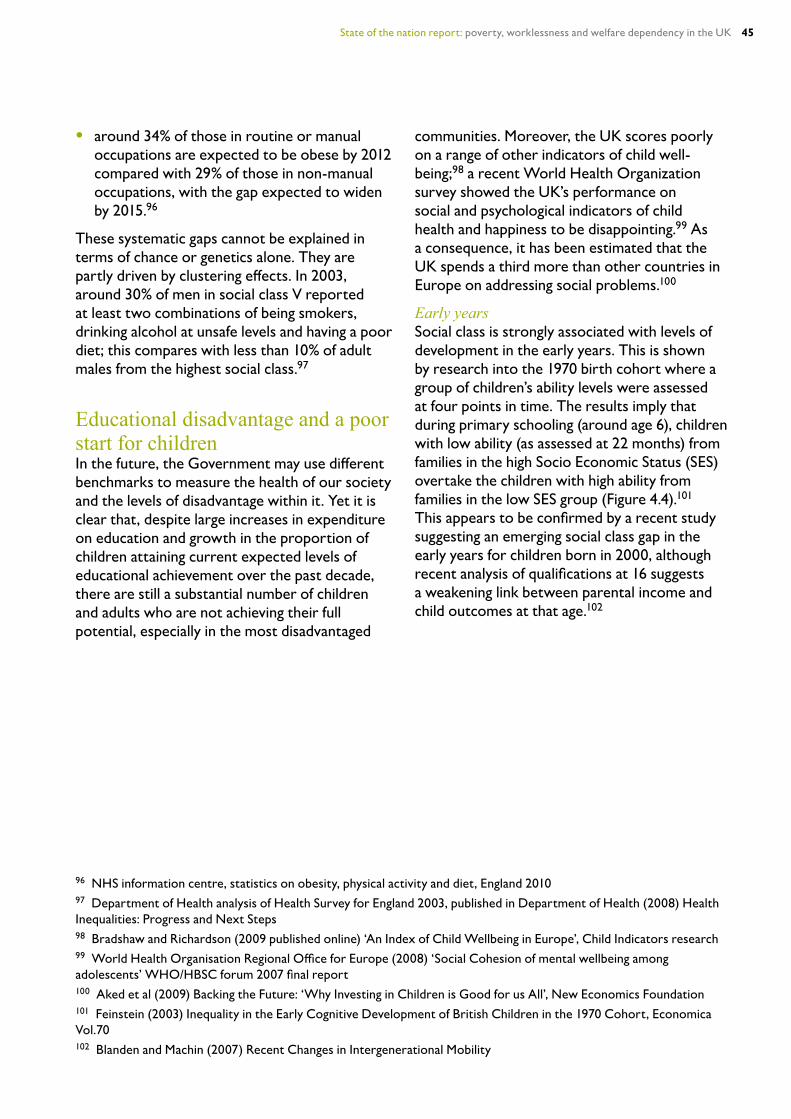
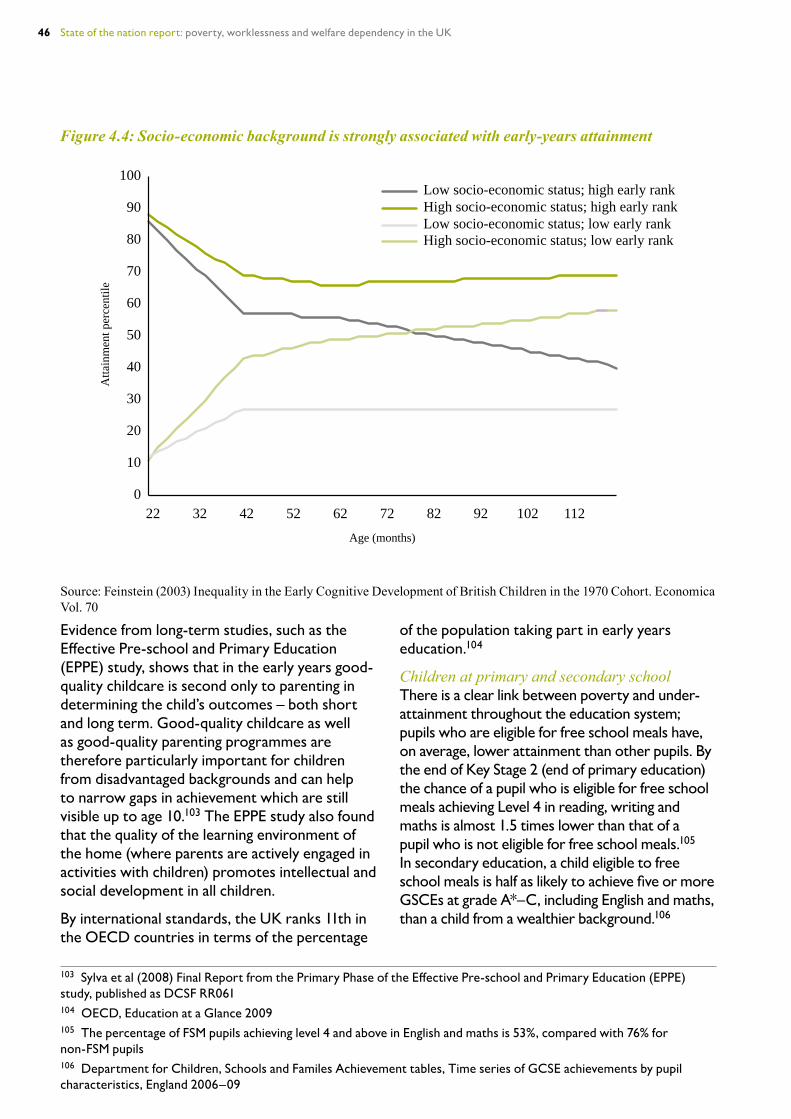
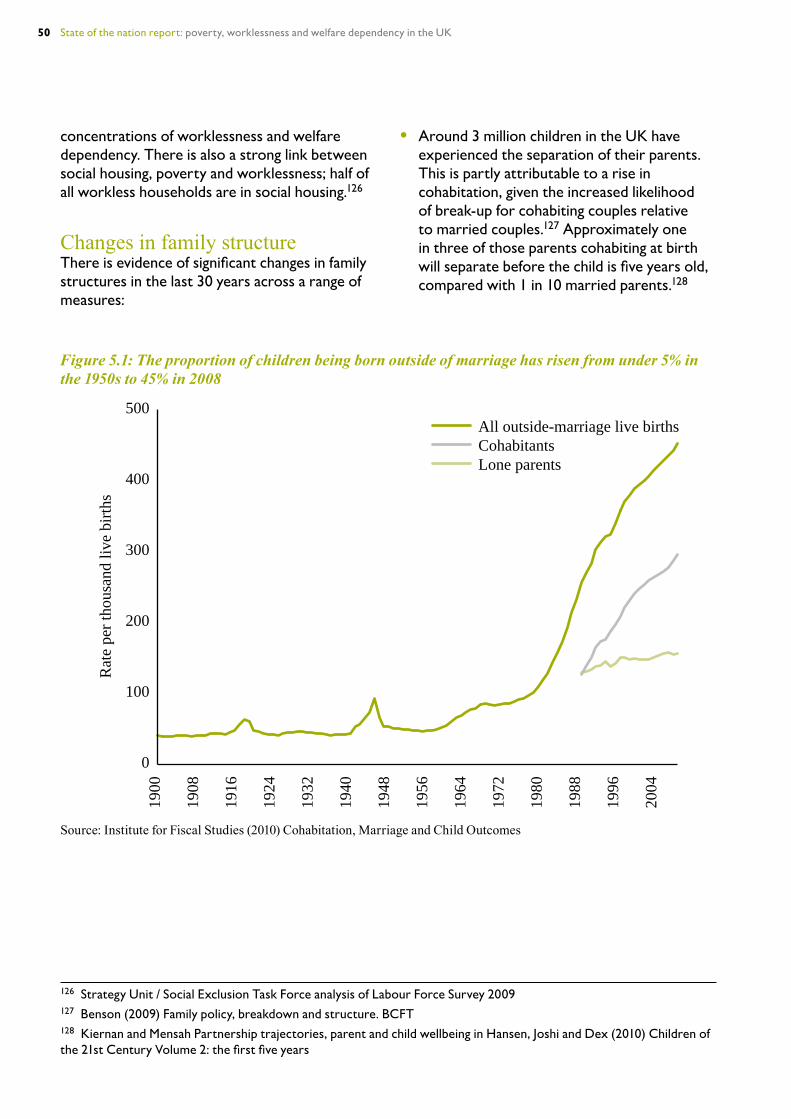
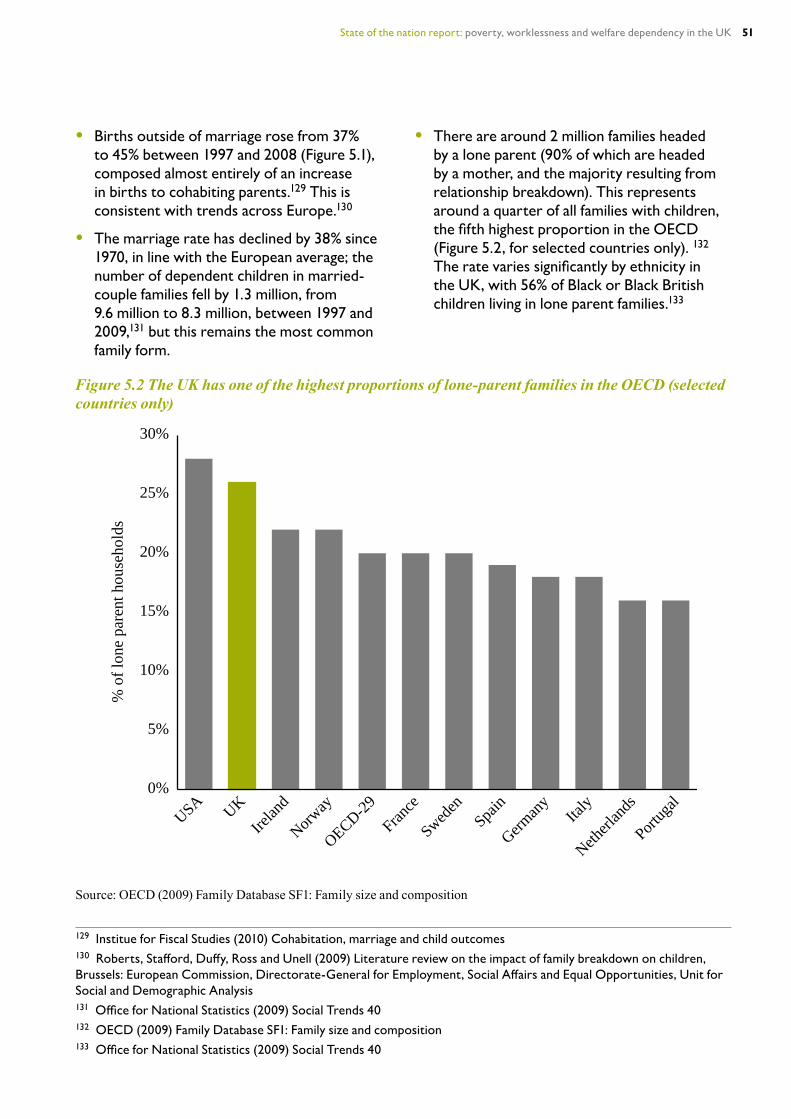
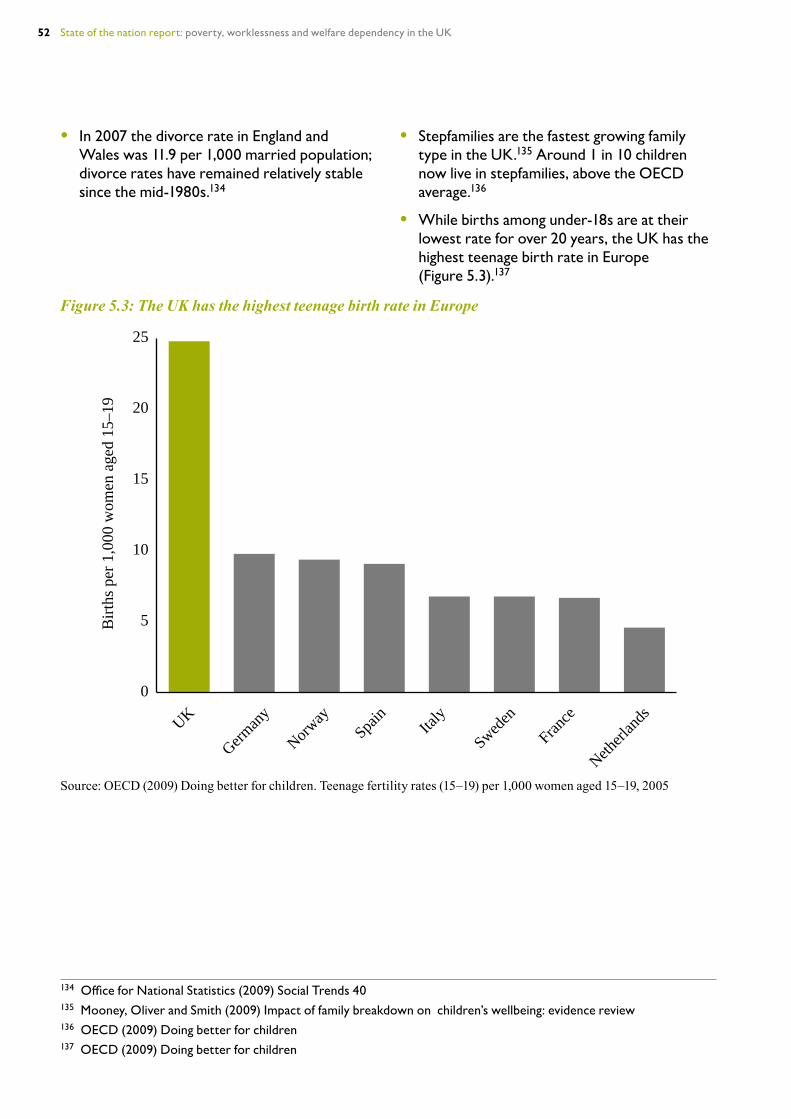
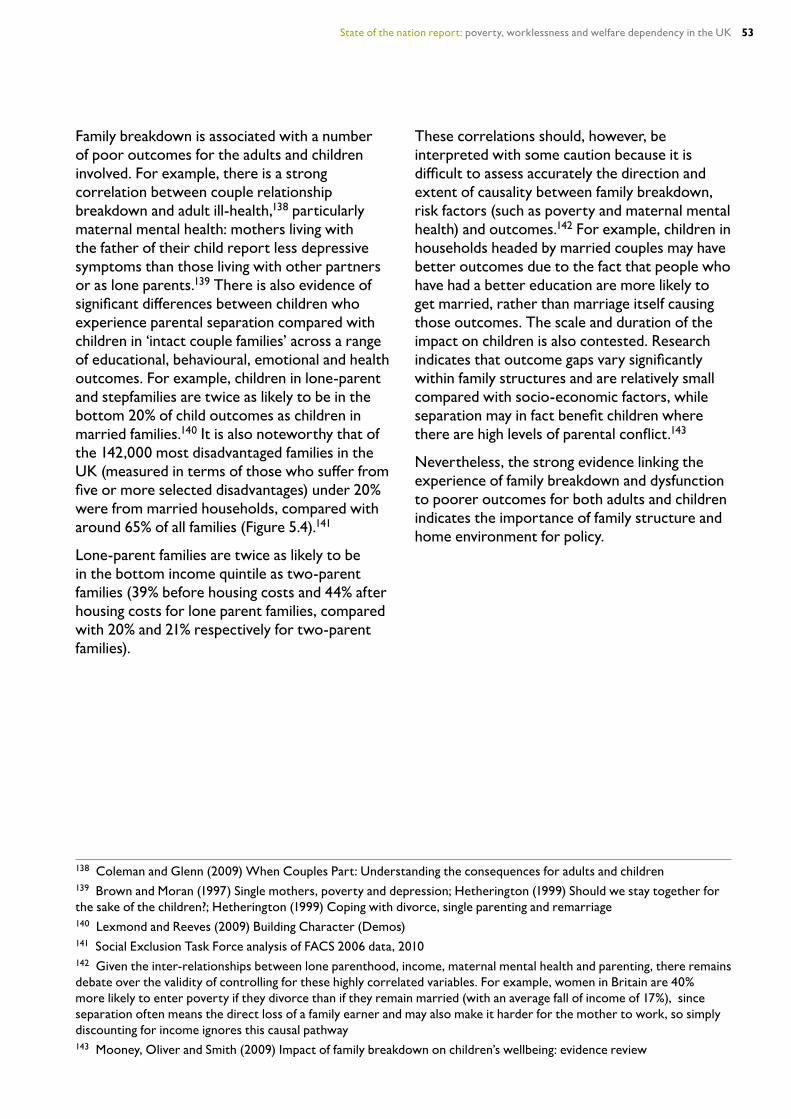
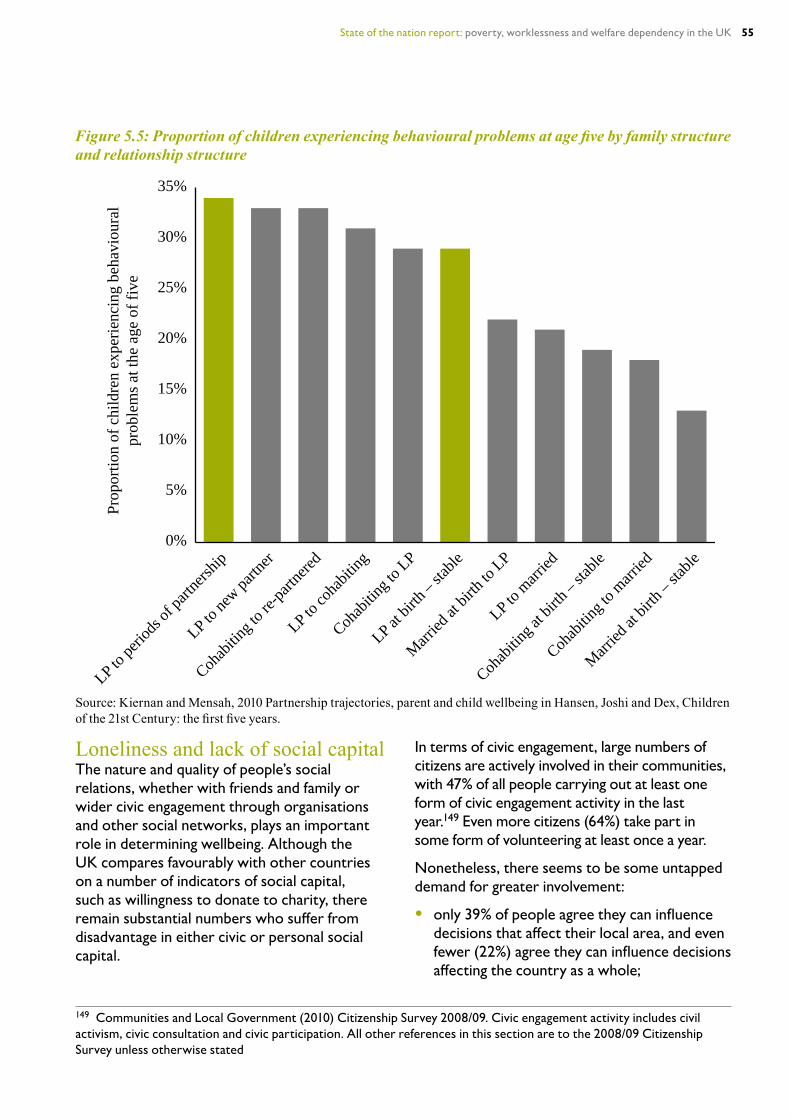
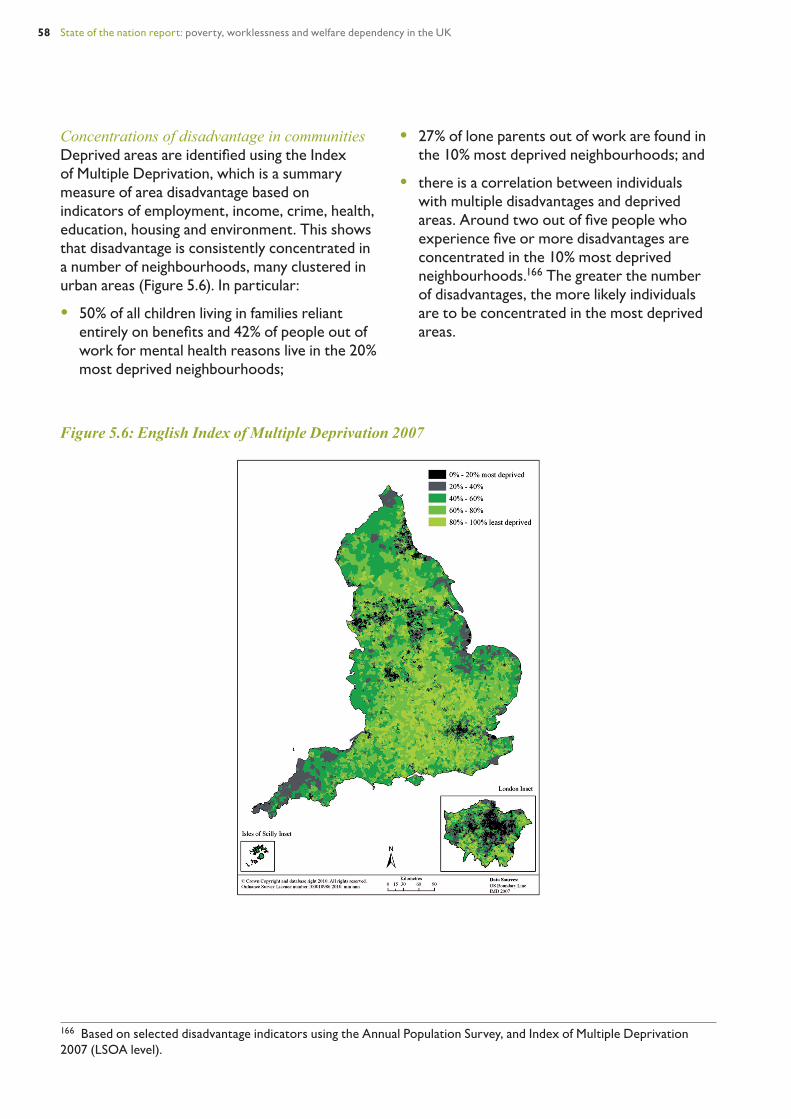
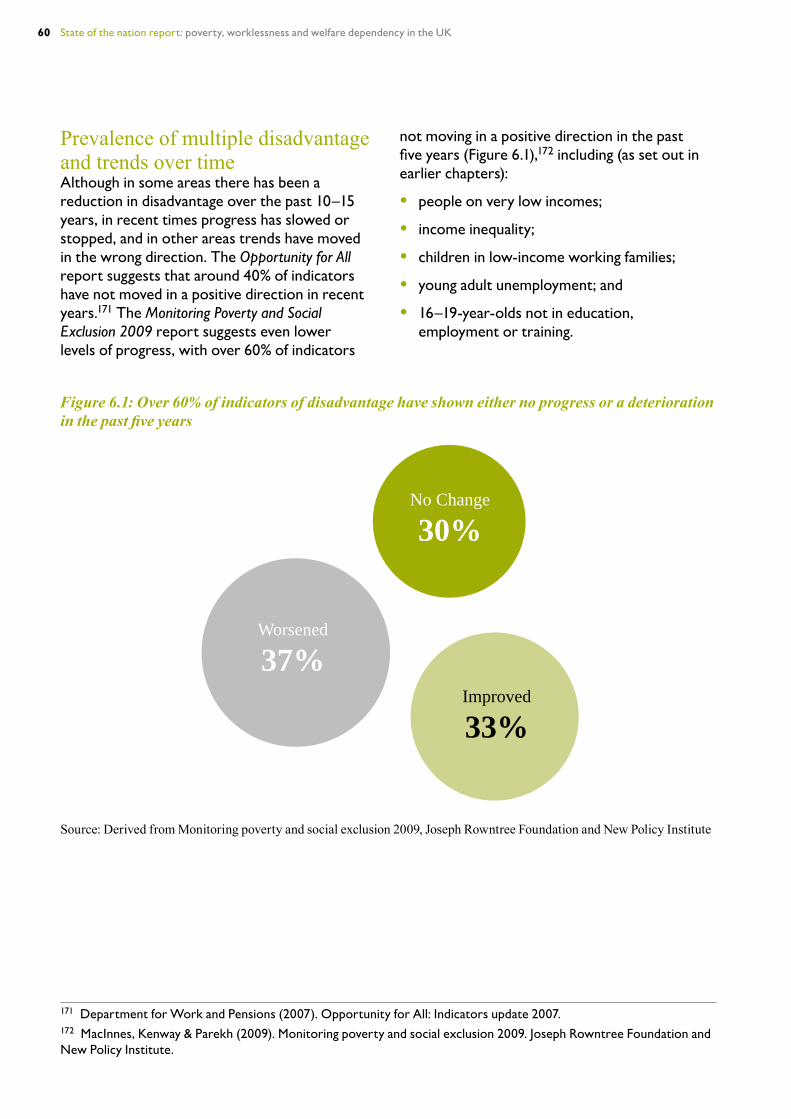
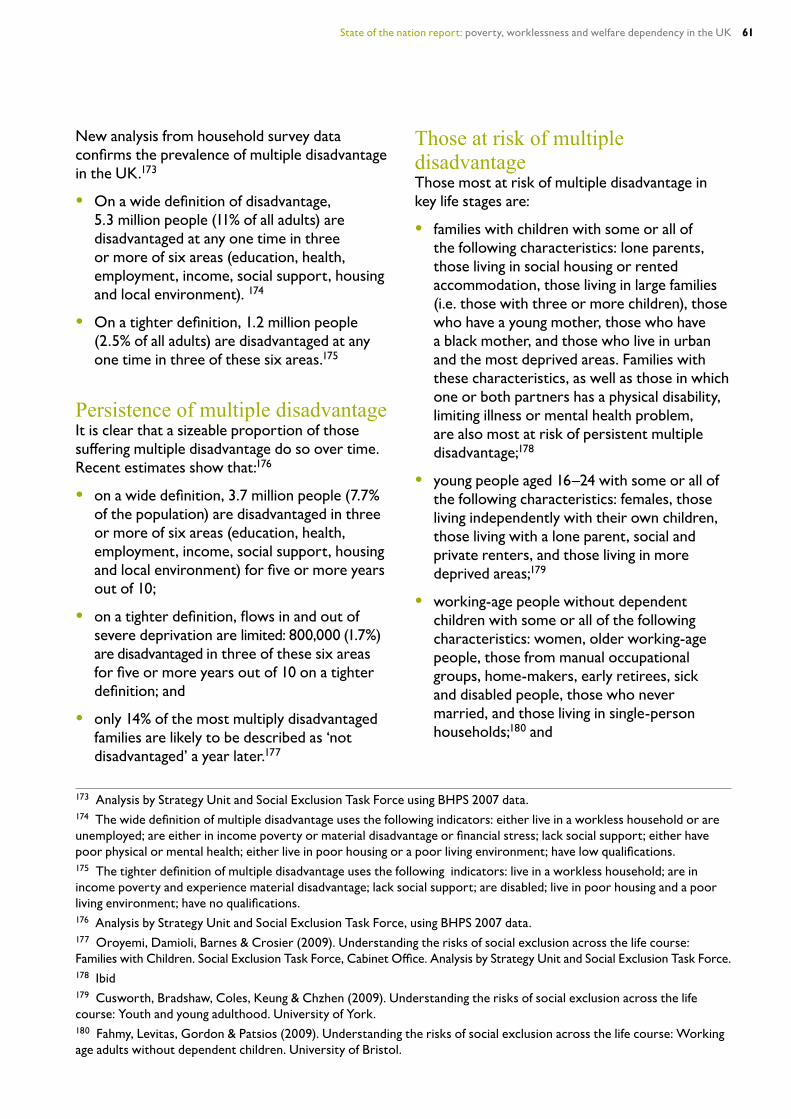